Article

Experimental Investigation of Adaptive Thermal Comfort in French Healthcare Buildings

1
Interdisciplinary Research on Society-Technology-Environment Interactions (lnSyTE), CREIDD, University of Technology of Troyes, 12 Rue Marie Curie, CS 42060, CEDEX, 10004 Troyes, France
2
EPF School of Engineering, 2 Rue Fernand Sastre, 10430 Rosières-Prés-Troyes, France
3
MATIM, Faculty of Exact and Natural Sciences, University of Reims Champagne Ardenne, CEDEX 2, 51687 Reims, France
*
Author to whom correspondence should be addressed.
Buildings 2021, 11(11), 551; https://doi.org/10.3390/buildings11110551
Submission received: 6 October 2021 / Revised: 10 November 2021 / Accepted: 11 November 2021 / Published: 17 November 2021
(This article belongs to the Section Architectural Design, Urban Science, and Real Estate)

Abstract

:
The thermal comfort requirements of disabled people in healthcare buildings are an important research topic that concerns a specific population with medical conditions impacted by the indoor environment. This paper experimentally investigated adaptive thermal comfort in buildings belonging to the Association of Parents of Disabled Children, located in the city of Troyes, France, during the winter season. Thermal comfort was evaluated using subjective measurements and objective physical parameters. The thermal sensations of respondents were determined by questionnaires adapted to their disability. Indoor environmental parameters such as relative humidity, mean radiant temperature, air temperature, and air velocity were measured using a thermal microclimate station during winter in February and March 2020. The main results indicated a strong correlation between operative temperature, predicted mean vote, and adaptive predicted mean vote, with the adaptive temperature estimated at around 21.65 °C. These findings highlighted the need to propose an adaptive thermal comfort strategy. Thus, a new adaptive model of the predicted mean vote was proposed and discussed, with a focus on the relationship between patient sensations and the thermal environment.

1. Introduction

Indoor thermal comfort has become an important topic for sustainable building research. Thermal comfort improves the performance of the building, by reducing the energy consumption and greenhouse gas emissions [1]. Sensing, controlling, and predicting thermal comfort is required to ensure healthy indoor conditions for occupants. Providing an appropriate indoor environment, especially in medico-social institutions, is crucial since patients spend 80–90% of the day indoors and are significantly impacted by variations in hygrothermal parameters. Furthermore, such buildings may experience different hygrothermal conditions depending on patient rooms and building design, not to mention the type of disease. Ensuring a comfortable environment can positively contribute to their treatment and care [2,3].
The American Society of Heating, Refrigerating, and Air-Conditioning Engineers (ASHRAE) defined thermal comfort as the state of mind in which satisfaction is expressed with the thermal environment [4]. Over the years, an extensive amount of research has been carried out on thermal comfort but mainly focused on healthy occupants. However, few studies have explored the thermal sensation of occupants in specific buildings such as medico-social institutions due to the lack of knowledge in this area [5,6]. Thermal comfort requirements in medico-social institutions can differ from other types of buildings. Nevertheless, the current ASHRAE standards 55-2017 [7] and ISO/TS 14415 [8] lack information on this topic. The standards outline methods to determine the thermal environmental conditions (temperature, humidity, air speed, and radiant effects) for healthy adults. Nevertheless, these standards are not intended to override any health or critical process requirements (see ASHRAE Standards: 55-2017, Section 2).
For people with limited adaptive opportunities who are recognized as vulnerable people, an acceptable environment to healthy individuals may be considered unacceptable to them [9]. Assessing thermal comfort in medico-social institutions is therefore challenging. The major challenge is to best meet the thermal comfort needs of different in-situ populations: i.e., medico-social staff and patients.
Among the thermal comfort indices, Fanger’s predicted mean vote (PMV) and predicted percentage of dissatisfied (PPD) are the most applicable [10]. The PMV-PPD model requires two personal factors—metabolic rate and clothing insulation—and four environmental factors—air temperature, radiant temperature, air velocity, and humidity [11]. When patients take medications that affect their thermoregulatory system [
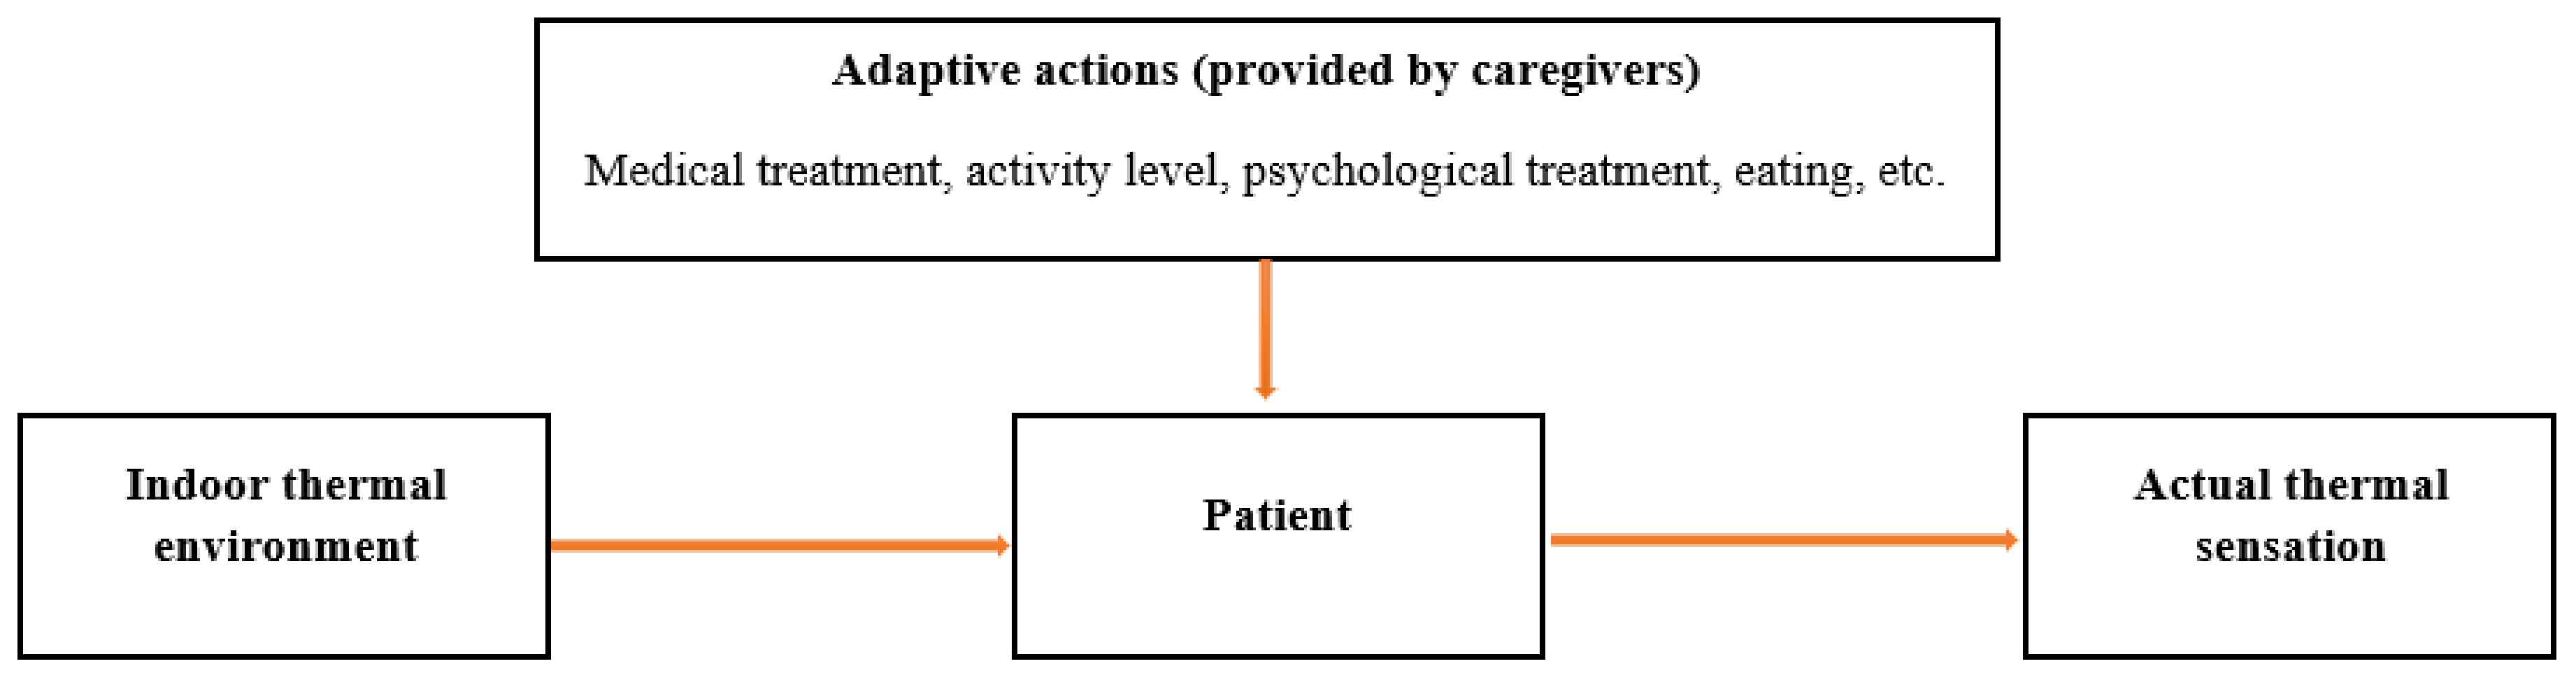
12], the predictability of comfort ratings may be less reliable. Therefore, thermal adaptation can play a key role in evaluating the thermal sensation of patients.
Recently, the adaptive approach to thermal comfort has interested researchers [13,14], because it takes into account many factors such as climate, culture, as well as psychological and behavioral adaptations, which play an important role in controlling thermal comfort. This approach could be defined as follows: “If a change occurs such as to produce discomfort, people react in ways which tend to restore their comfort” [15]. The cultural background is an important parameter in terms of AMV values (subjective approach) and in terms of PMV values (objective approach). The cultural variation and the availability of personal environmental control options, have an important influence on the PMV model accuracy [16]. Food habit and clothes style, for example, can affect internal thermal energy production and increase the clothing’s factor, respectively. On the other hand, several scientific have highlighted the importance of including the culture influence on thermal comfort, this topic would be important in architect field, by improving the design possibilities [17]. Pereira et al. [18] showed that detection of occupant behavior in buildings is an important parameter, which leading to better indoor environment and thermal comfort. Pereira et al. [19] showed that occupant behavior in buildings is decisive for their hygrothermal performance. Verheyen et al. [20] investigated the thermal comfort of patients in a Belgian healthcare facility by comparing objective parameters and subjective measures of thermal comfort for different patient groups. They concluded that PMV can adequately predict mean thermal sensation for the majority of patients. On the contrary, Sattayakorn et al. [21] indicated that the PMV-PPD model was unsuitable for evaluating the thermal comfort of occupants in healthcare facilities in tropical regions. This result was later confirmed by Yau et al. [22], who indicated that the PMV-PPD model may not be suitable for tropical hospitals as occupants may be more satisfied with a hot indoor environment. In the study of Hashiguchi et al. [23], a comparison of the thermal comfort of patients and medical staff concluded that most patients were comfortable, while the medical staff were uncomfortable. However, this study did not compare subjective responses and objective measures with PMV predictions, which is of crucial importance in this field.
Skoog et al. [24] showed little difference in the thermal sensations between staff and patients in Swedish hospitals. In another study by Hill et al. [25] on patients with physical disabilities, their most frequent request was to be warmer, whereas staff generally wanted to be cooler. In the same context, Khodakarami et al. [26] highlighted that hospital occupants have different thermal comfort requirements that are difficult to accommodate in the same space, and thus adaptive comfort is recommended for each group. Regarding the management of the indoor environment, Kim et al. [27] stated that indoor hygrothermal conditions must be carefully managed in healthcare facilities to improve staff satisfaction with their indoor environment. They concluded that the green features implemented by leadership in energy and environmental design (LEED) in healthcare facilities had a good effect on healthcare staff’s level of comfort. Pereira et al. [28] highlighted that energy efficient and smarter buildings must include the requirements of the occupants, also discussed the importance of occupant behaviour motivations for the design and implementation of smart systems in buildings. Walker et al. [29] discussed the importance of thermal comfort management in care homes, and the need to distinguish them from other seemingly similar buildings, because the thermal comfort requirements of patients can be associated with health risks.
To manage the indoor environment, Nomura et al. [30] noted that to bring about positive health outcomes for patients, there must be a minimum of six air changes per hour (ACH), although in spaces with heating, ventilation, and air conditioning (HVAC) systems, this rate may be reduced to 4 ACH. Hwang et al. [31] reported that patients are more comfortable in warmer and humid indoor environments in Taiwanese hospitals and are insensitive to indoor thermal changes. The study by Kameel et al. [32] in healthcare settings showed that hygrothermal parameters can activate or deactivate viruses and that low humidity levels can increase susceptibility to respiratory disease. Smith et al. [33] showed that patients usually preferred air temperatures between 21.5 °C and 22 °C and relative humidity between 30% and 70%. Bouzidi et al. [34] investigated adaptive thermal comfort during summer in French healthcare buildings, results shows that the adaptive temperature was 25.0 °C with upper and lower limits of 24.7 °C and 25.4 °C. Pereira et al. [35] reported that the design of the buildings can be improved by consideration of the effects that the spatial and human characteristics have on the indoor environment quality.
Despite the importance of these studies on thermal comfort, the well-being of occupants in specific situations such as medico-social institutions requires further exploration. First, in the case of healthcare buildings, the indoor temperature set-point is usually determined by healthcare staff, meaning that it is not correlated to patients’ thermal sensation. Second, the adaptive approach is essential to ensure thermal comfort in healthcare buildings, although no study conducted in a French climate has determined the adaptive temperatures for patients. Finally, a new thermal comfort index is necessary to correctly assess the thermal conditions of healthcare buildings.
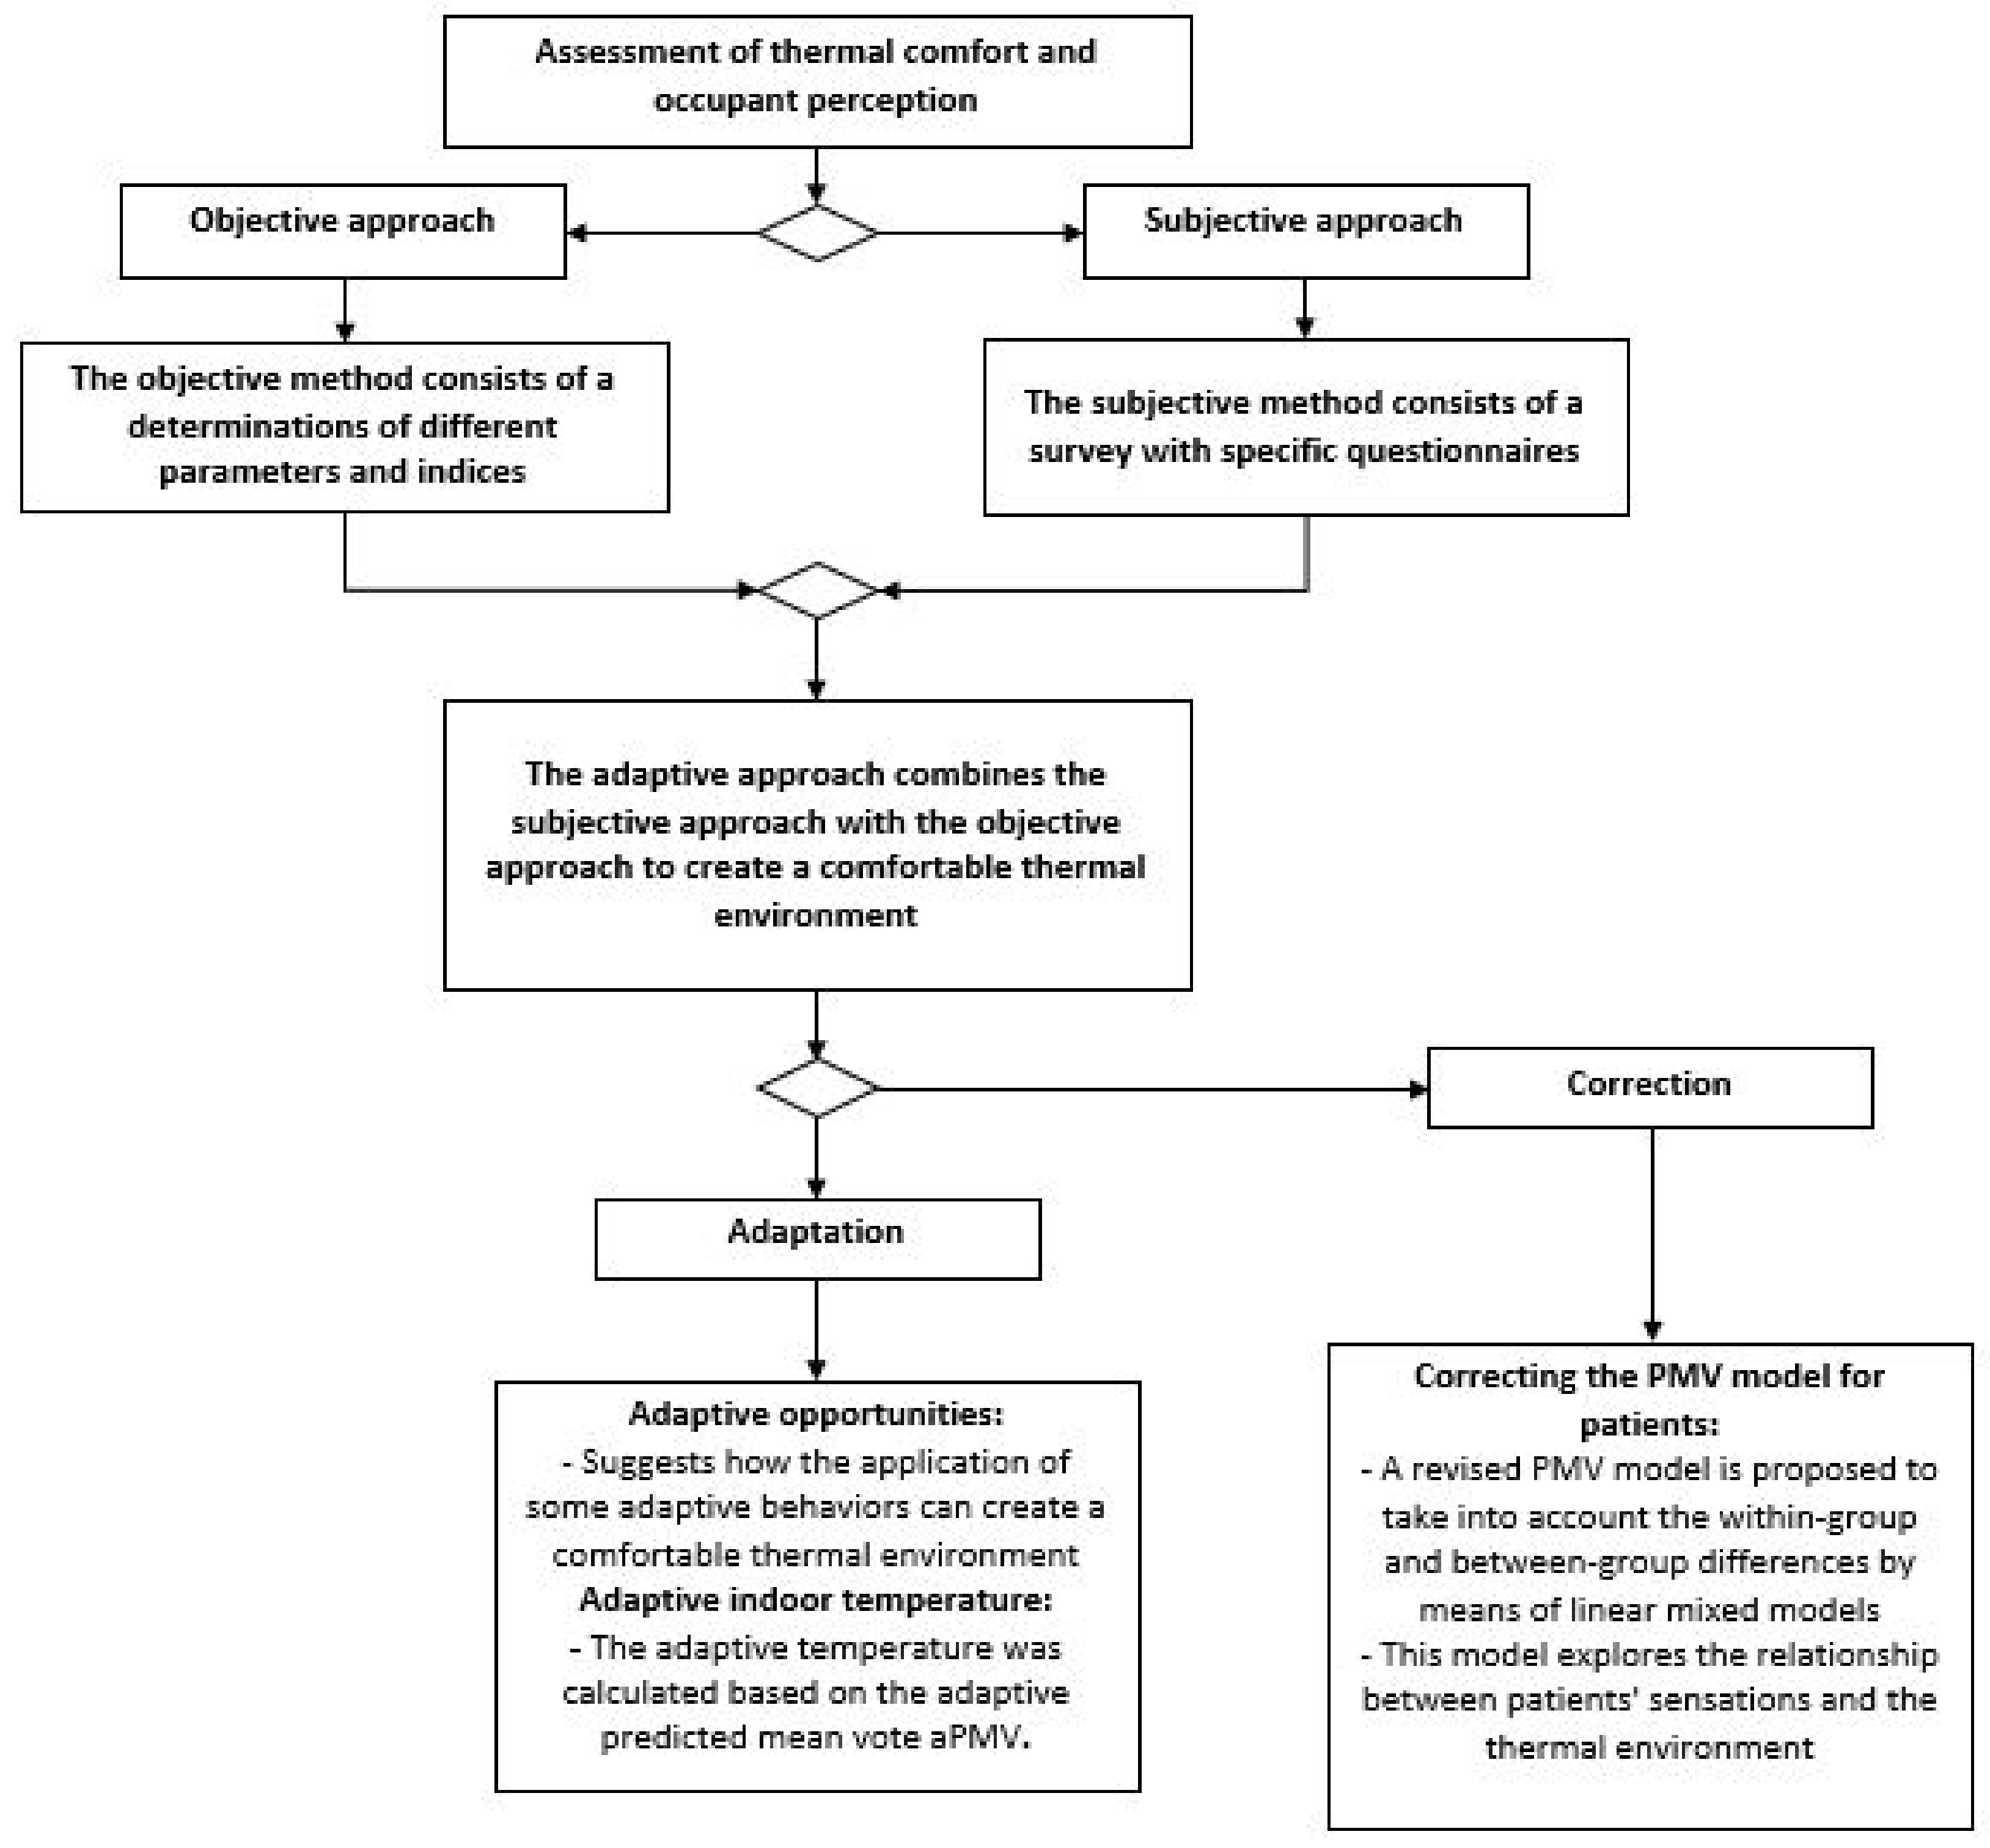
Hence, the main purpose of this field study is to determine the thermal sensation of occupants in order to adapt thermal approaches to vulnerable people in medico-social buildings. Thermal comfort can take on multiple meanings, being associated with vulnerability, the indoor environment, and the provision of effective care. Thus, adapting the thermal environment of occupants in medico-social institutions is crucial to maintain a good quality of service and support a population that is particularly vulnerable to illness.
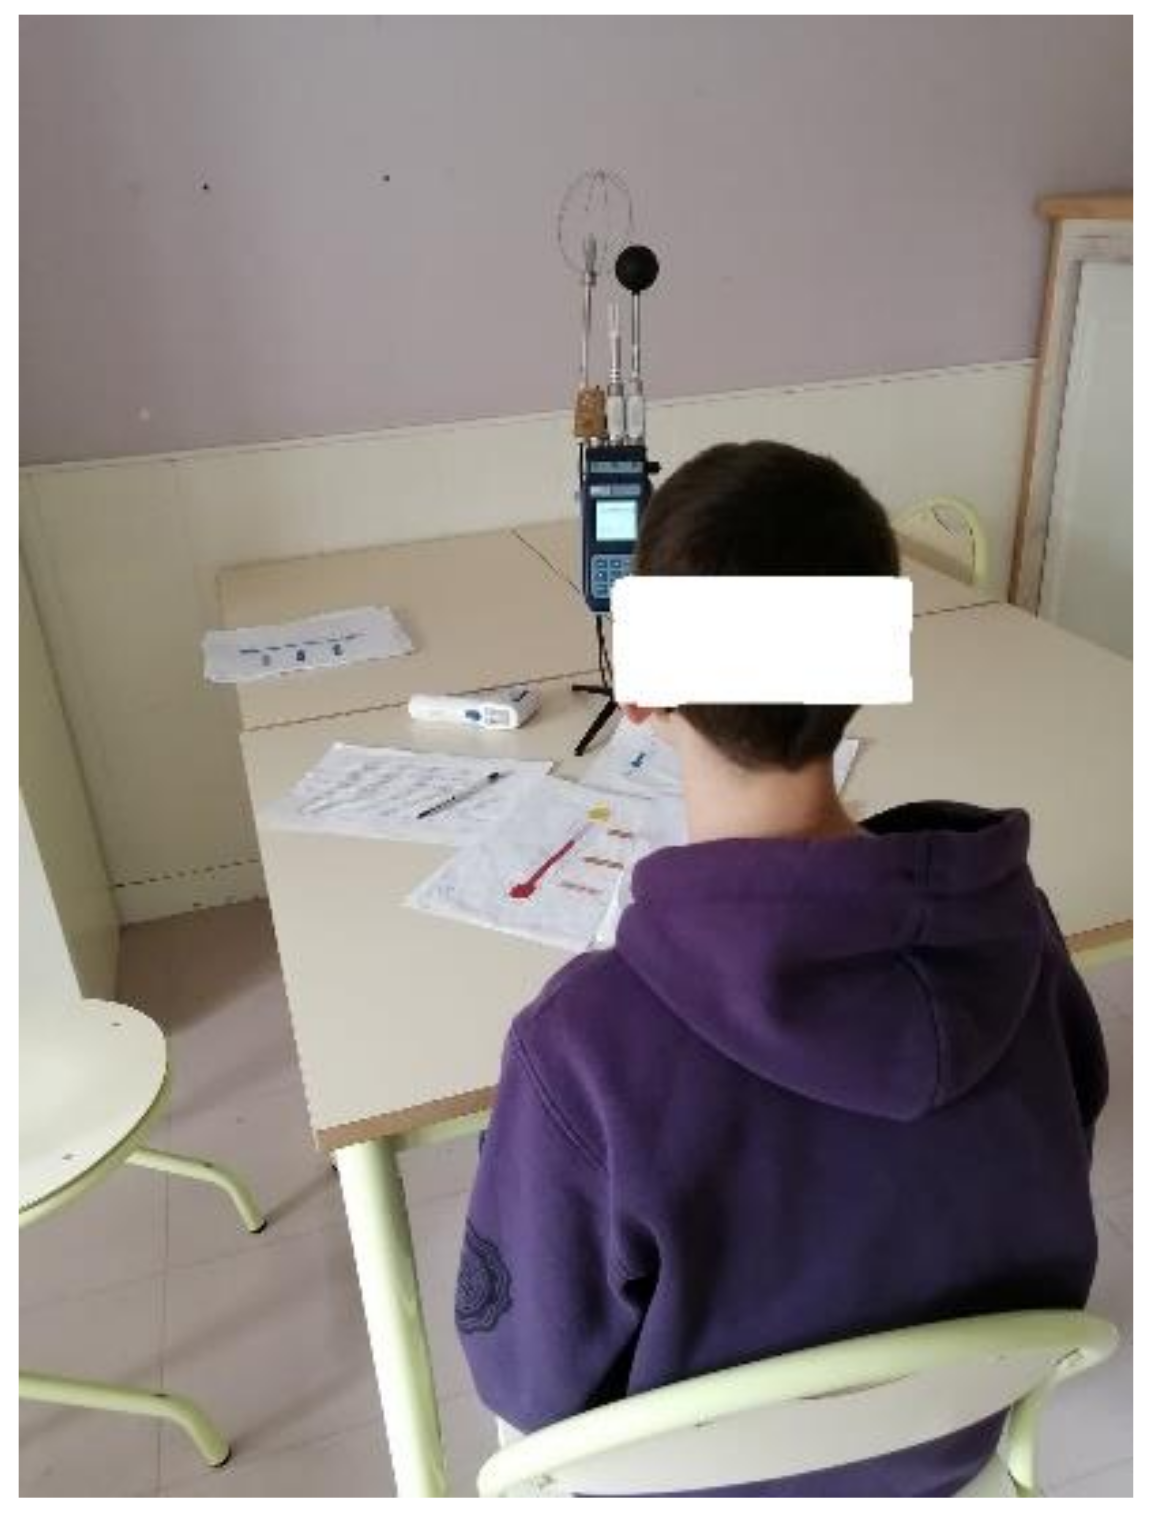
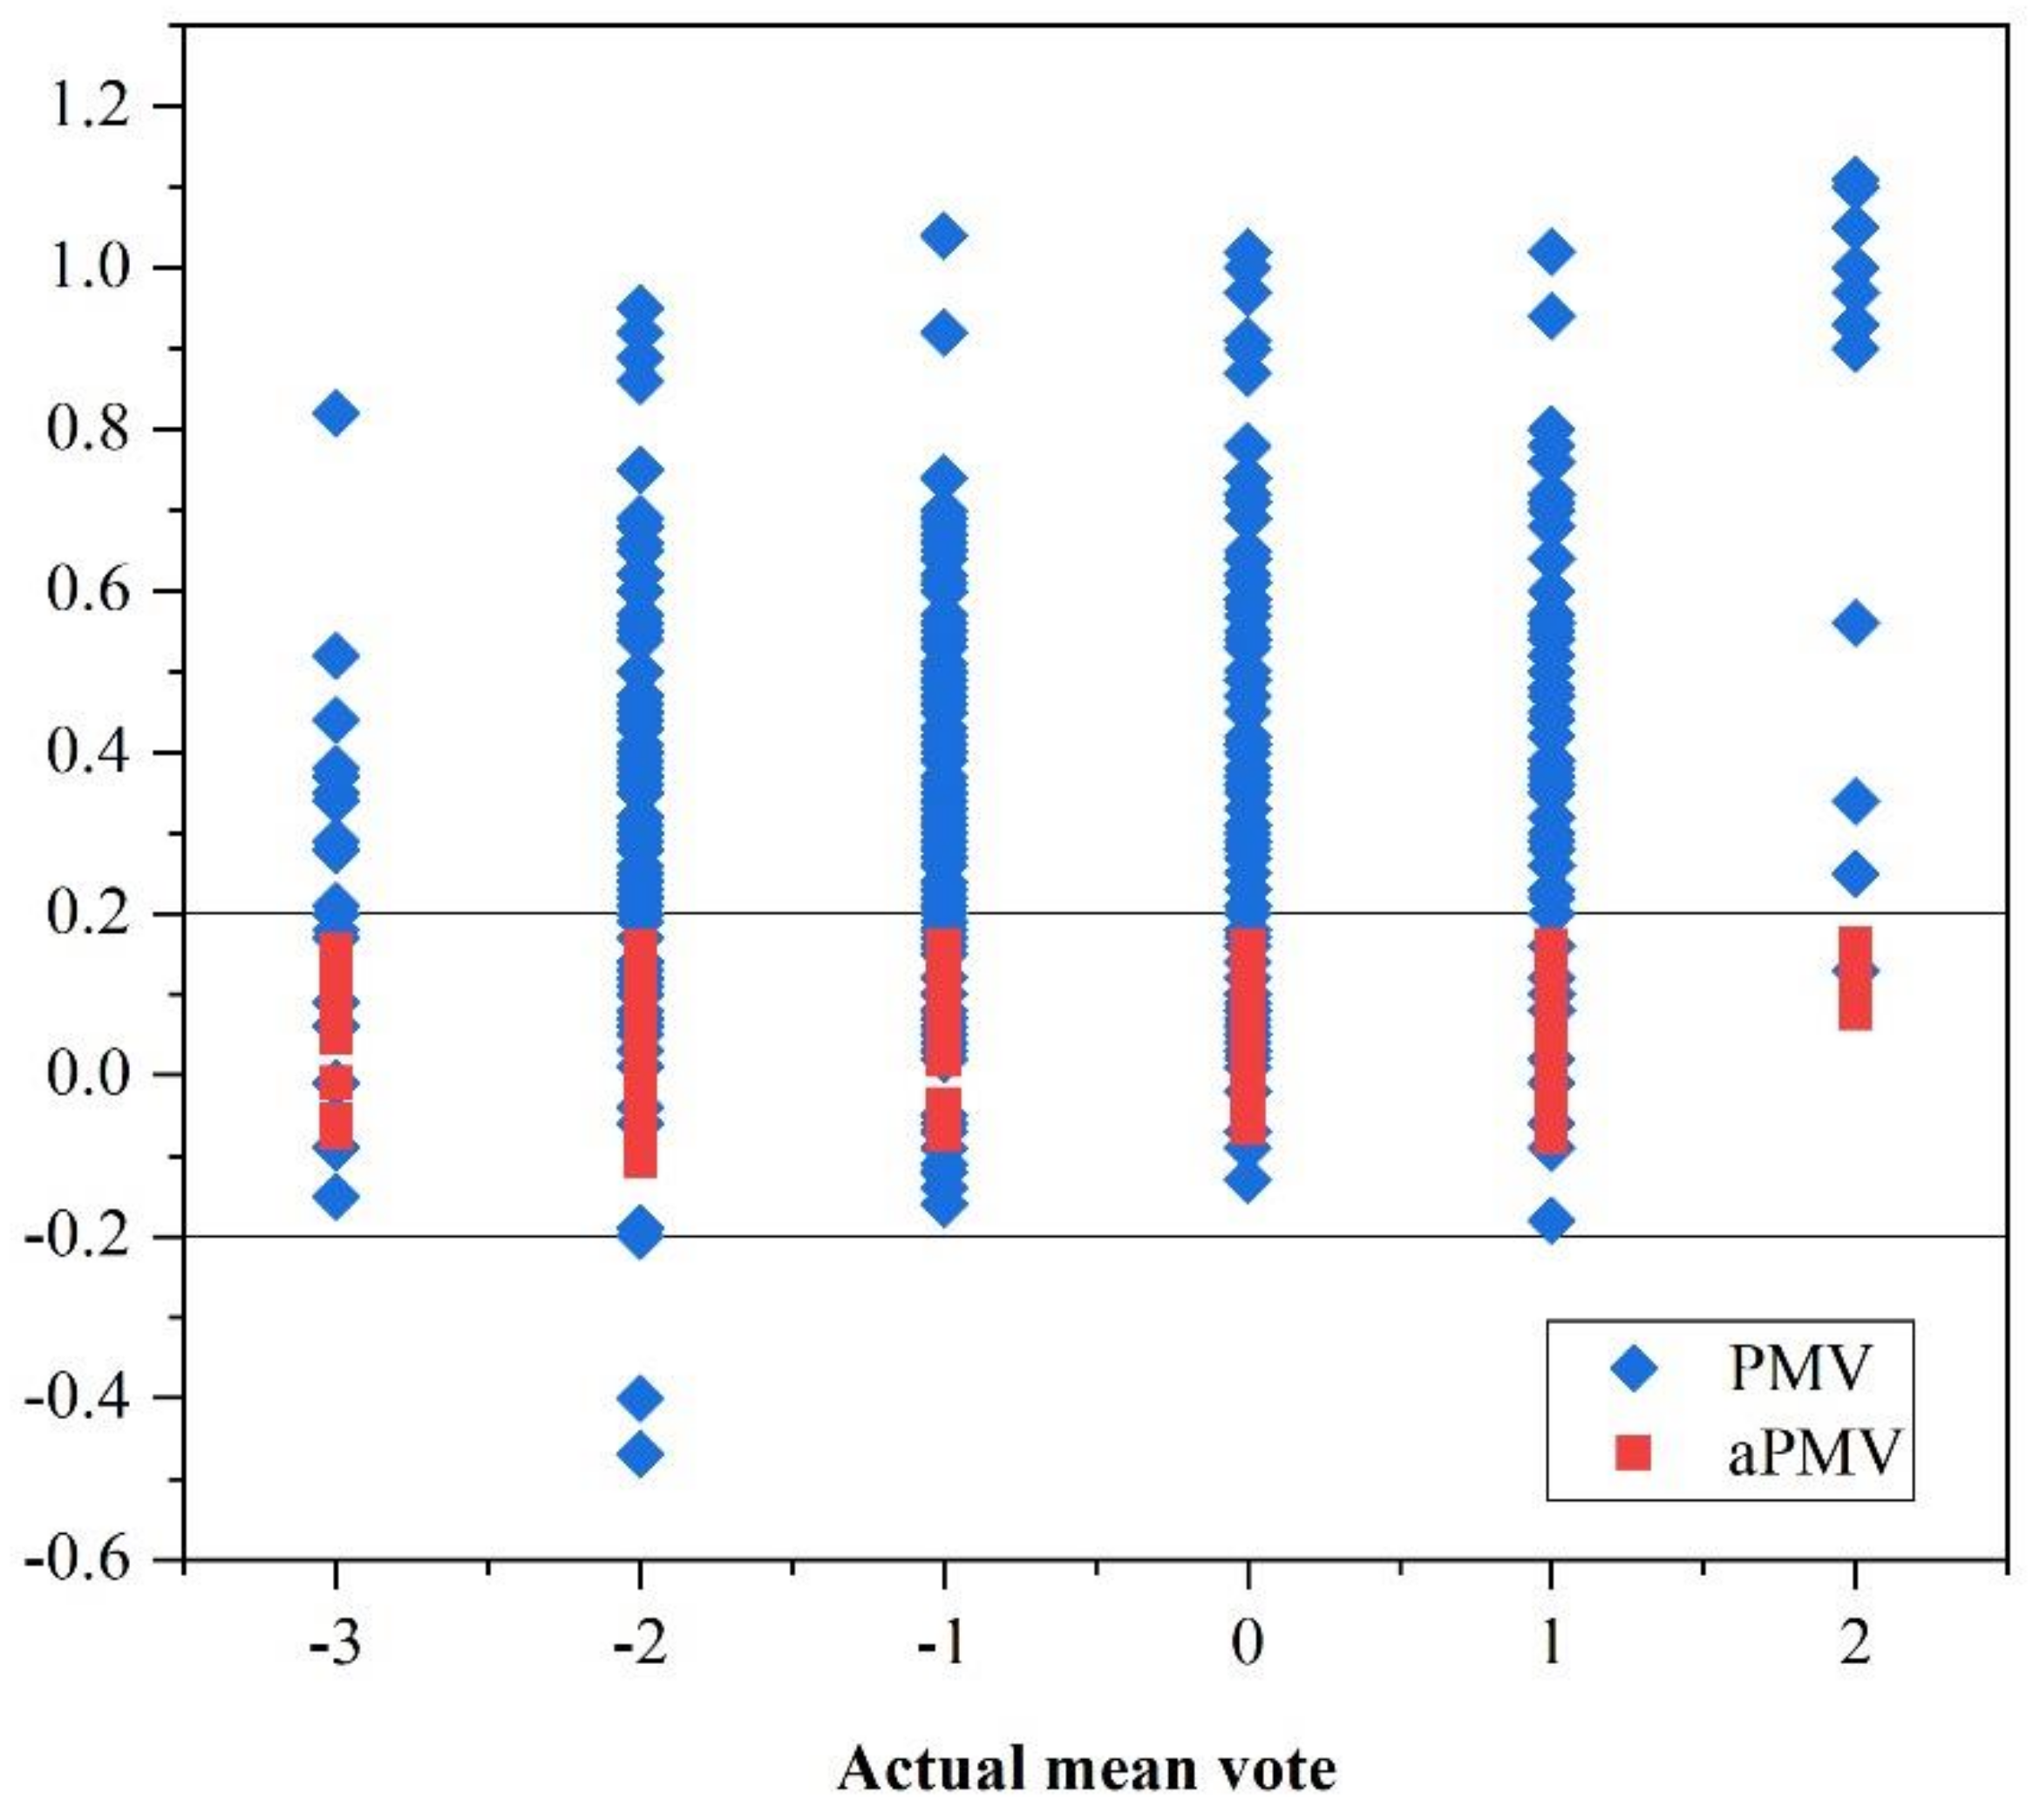
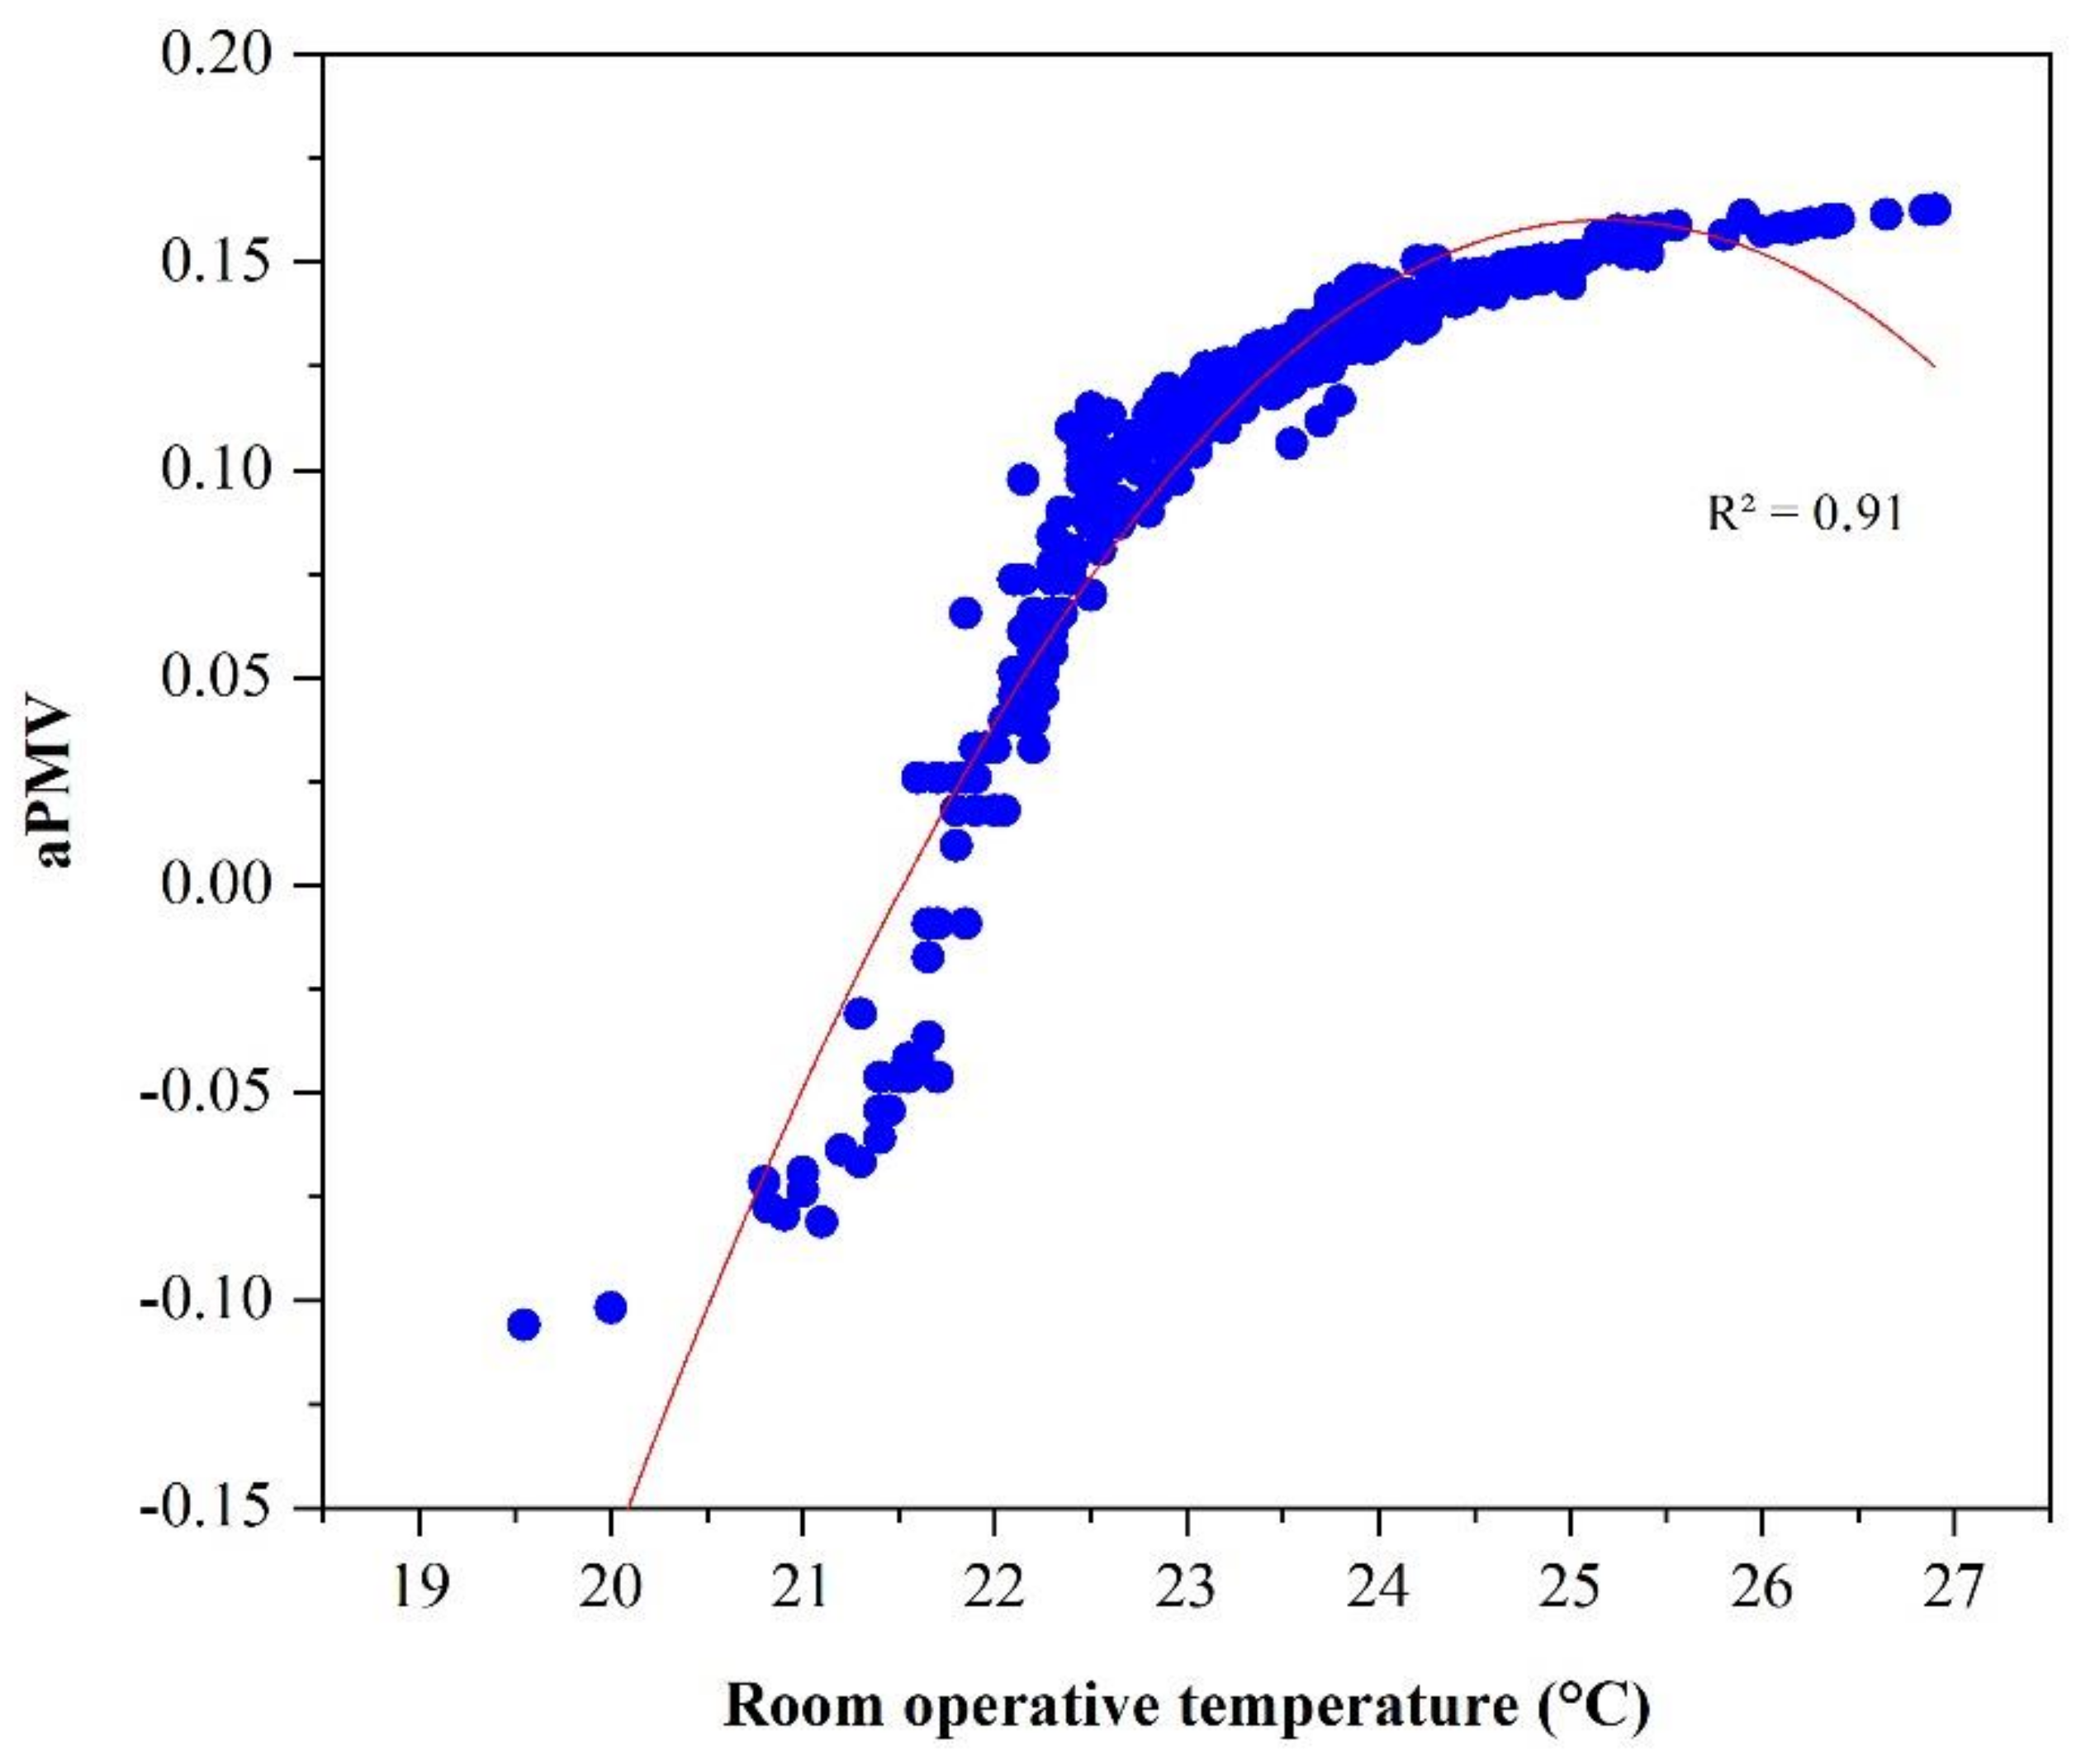
To achieve this goal, we correlate thermal sensation to the indoor environment. Indeed, the HVAC system can be set based on more appropriate metering in the future to reduce energy consumption while improving the indoor climate for patients. Therefore, this study investigates the effect of indoor thermal conditions on the satisfaction of occupants in healthcare facilities. This investigation consists of two parts. The first evaluates the indoor environmental parameters of the studied buildings in terms of air temperature, operative temperature, air velocity, and humidity, as well as the activity and clothing insulation of their occupants. The second part explores the perception of patients regarding their satisfaction with the indoor thermal environment in terms of the actual mean vote (AMV). The optimal temperature is calculated based on the adaptive thermal comfort approach to develop a new PMV model that provides a relationship between the indoor parameters and the thermal sensation of occupants.

2. Research Methodology

The survey is based on a mixed approach consisting of both objective and subjective evaluations. These complementary methods were simultaneously implemented in the same locations. Combining the indoor environment with physiological and psychological parameters (thermal perception) provides a clearer understanding of the thermal interactions between the buildings and their occupants, and a more complete understanding of how these elements can influence the overall satisfaction of occupants (Figure 1). Indeed, the objective part of the study deals with PMV and PPD indices to assess the indoor thermal environment, whereas the subjective investigations are based on a questionnaire and a ruler with pictorial representations to evaluate the actual thermal perception of occupants. We then combined these methods, first to adapt the indoor environment of patients and then to propose a better index to assess their thermal comfort.
In this paper, thermal comfort parameters were experimentally investigated during the winter season in the “Gai Soleil” medico-social institution in the city of Troyes, located in eastern France (latitude 48.32°, longitude 4.08°). These medico-social buildings accommodate people with mental disabilities. They were constructed in 1963 and are managed by the “A.P.E.I. of Aube.”. The building envelope is a non-insulating brick wall’s structure (except for the roofs are insulated with mineral wool insulation), the thermal conductivity of the brick is 1.6 W·m−1·K−1, and the density is 2300 kg·m−3. Generally, standard insulation methods are not applicable. The normal working hours for this institute are weekdays, from 8 am to 6 pm. The survey was conducted in six buildings or groups of buildings as highlighted by the red color in Figure 2b from 3 February to 13 March 2020. Table 1 shows the distribution of patients in the different buildings.

2.1. Subjective Method

A longitudinal thermal comfort survey (14 days over 2 months) was carried out at the “Gai Soleil” from 3 February to 13 March 2020 (Figure 3). Patients and healthcare staff completed the surveys in the shared spaces within each building, leading to a total of 423 valid questionnaires for patients (47 subjects) and 62 for staff (11 subjects).
The subjective approach consists of a survey with questions and a ruler with pictorial representations, which was designed in collaboration with a psychologist. As shown in Figure 4, the ruler is a subjective measuring tool based on the ISO seven-point thermal sensation scale, which has the shape of a large thermometer with a pictorial representation. This adaptation of the thermal comfort scales to disabled people resulted in a good response rate [36]. To make the questionnaire easier and quickly obtain the answers, patients were questioned in two phases. First, they simply indicated their thermal sensation (Hot, Neutral, Cold) and then depending on the response, they were asked to use the pictorial representations to specify this thermal sensation as cold, cool, or slightly cool, or hot, warm, or slightly warm. This field study was conducted simultaneously with patients and healthcare staff in the same indoor environment. The aim was to understand their thermal feelings and preferences under given thermal environments. The inclusion of staff allowed us to identify possible differences between the two groups under similar conditions. The procedure took about 5–8 min per participant. During the measurements, the interior doors were left open in most of the patient areas, whereas the windows were often closed. To identify which patients would be invited to participate in our thermal sensation surveys, we selected, in collaboration with the healthcare staff, patients who were able to understand the questions and articulate their answers, either orally or by gestures. The results thus obtained indicated that only 55.3% of patients were able to respond (Table 2).

2.2. Objective Method

In this study, the physical parameters were continuously measured according to the standard ISO 7726 for seated persons [37]. The indoor environmental parameters were measured using the microclimate station HD32.3 produced by DeltaOHM (Figure 5). The Datalogger records the physical parameters included in the PMV and PPD indices such as the relative humidity (RH(%)), mean radiant temperature, air temperature, and air velocity (V(m/s)). For low air velocity and small temperature variances, it is possible to evaluate the operative temperature as the average between the indoor air temperature and the mean radiant temperature.
The operative temperature defined as “the uniform temperature of an imaginary black enclosure in which an occupant would exchange the same amount of heat by radiation and convection as in the actual non uniform environment” [38].
Top, PMV, and PPD indices are thus defined as follows:
T op = T a + T rm 2
PMV = 0.303   · e 0.036 · M + 0.028 · M W 3.05   · 10 3 · 5733 6.99 · M W p a 0.42 · M W 58.15 1.7 · 10 5 · M · 5867 p a 0.0014 · M · 34 T a 3.96   · 10 8 · f cl · T cl + 273 4 T rm + 273 4 f cl · h c · T cl T a
PPD   = 1 0.95   · e 0.03353   ·   PMV   4 0.2179   ·   PMV   2
where M (W/m2), W (W/m2), and pa (Pa) are the metabolic rate, external work, and partial vapor pressure, respectively; f cl is the ratio of the clothed body surface to the naked body surface; h c   (W·m−2·K−1) is the convective heat transfer coefficient; T a (°C) is the air temperature; T cl (°C) is the clothing surface temperature; T rm (°C) is the mean radiant temperature; and T op (°C) is the operative temperature.
Table 3 depicts the measured physical parameters and their accuracy. The metabolic rate and clothing insulation were estimated based on ISO 7730 [39]. In this study, the metabolic rate was set at 1.2 met, corresponding to sedentary activities, while the mean clothing insulation value was calculated as 1.1 clo. Table 4 summarizes the physiological parameters of the respondents, and Table 5 summarizes the environmental parameters.

3. Results and Discussion

All variables were screened to ensure that there was sufficient variation to perform regression analysis to evaluate the thermal comfort conditions and obtain a patient-adapted PMV model. The results were processed, and correlations between thermal comfort indices, mean radiant temperatures, and operative temperatures were identified.

3.1. Longitudinal Thermal Comfort Survey

Figure 6 depicts the results regarding the thermal sensation of patients and healthcare staff. Concerning patients, 62.16% of their thermal sensation votes ranged from −1 to −3 (slightly cool, cool, cold), while 23.16% perceived the thermal sensation as neutral. In general, the negative values obtained from the survey indicate a cooler thermal sensation from the point of view of patients. However, 85.5% of the thermal sensation votes of healthcare staff ranged from 0 to 1 (neutral, slightly warm). This indicates that most staff remained satisfied with the indoor thermal environment. This difference is essentially due to the adaptation capacities of respondents. Staff satisfaction can be explained by their ability to adapt to the indoor environment by means of their clothing, drinking, eating, activity level, and opening or closing windows. On the other hand, the adaptive opportunities of patients may be restricted by their disability and health conditions, which also differ from one patient to another. Therefore, an adaptive indoor environment needs to be created for patients.

3.2. Relationship between PMV, PPD, and Operative Temperature

Most indoor comfort studies consider the relationship between PMV and operative temperature. This relationship was also successfully established in the present work and is presented in Equation (4) where the high coefficient R2 = 0.96 indicates the strong dependence of PMV on operative temperature (Figure 7). Our findings show that the PMV decreased at a low operative temperature (i.e., >22 °C) and increased at a high operative temperature (i.e., <22 °C).
Based on Equation (5) and as shown in Figure 8, when the indoor operative temperature is higher than 22.7 °C or lower than 20.8 °C, the PPD is outside the neutral thermal comfort zone (PPD < 6%: the range with the smallest percentage of environmental dissatisfaction) recommended for spaces occupied by fragile people with special needs [40]. To ensure a higher thermal comfort level, the optimal temperature is calculated based on the adaptive thermal comfort model.
PMV   = 0.22 · T op 4.82
PPD = 1.02 · T op 2 44.24 · T op + 485.34

3.3. Comparison between PMV and AMV

Figure 9 illustrates the comparison between PMV and AMV values based on the measurements for men and women versus the operative temperature ranging from 19.55 °C to 26.9 °C. Female and male patients had similar results in the thermal sensation vote. The mean absolute difference in AMV during the winter season is equal to 0.14. These results also reveal that the fitted regression line for subjects’ AMV is below the PMV linear curve (Figure 9). Therefore, both men and women experience the indoor environment as colder than the measurement results according to Fanger’s model (note the absence of a significant physiological variance between men and women at the 95% confidence level with p < 0.05; see Table 6). This discrepancy may be explained by the patients’ limited ability to adapt to the indoor environment (adaptive opportunities), which is not considered in Fanger’s PMV model. Furthermore, the relationship significance between PMV and AMV values is significantly low (R2 = 0.04; Figure 10), which accords with previous studies conducted in other types of buildings [41,42].

3.4. Adaptive Thermal Comfort and Patients

The adaptive approach combines the subjective and objective approaches to create a comfortable thermal environment. In the literature, most adaptive thermal comfort studies are carried out in educational buildings as opposed to medical buildings [43,44]. A thermal model known as the adaptive predicted mean vote (aPMV) model, which considers the aforementioned factors and draws on the “black box” theory, was introduced by Yao et al. [45]. This model is more suitable to describing the indoor thermal environment in the buildings considered in this study. Figure 11 shows the flowchart of the holistic principle underlying the adaptive model. The interaction between the thermal environment and the occupants is complex and depends on many factors (thermoregulatory mechanisms, medical treatment, activity level, clothing insulation, etc.).

3.5. Adaptive Opportunities

Regarding the use of certain adaptive actions to create a comfortable thermal environment, adaptive opportunities presented in the questionnaire focused on the patients’ daily habits. As shown in Figure 12, almost 49% of patients indicated that drinking a hot beverage could increase their thermal sensation, an activity probably related to the winter season of the study, when patients want to be warmer. Nevertheless, 28.37% reported doing nothing in terms of thermal adaptation; these results are in agreement with the neutral thermal sensations expressed by patients (Figure 6). Thus, an adaptive model in which the indoor environment can be adapted to all patients should be developed. The proportion of other adaptive responses used by patients to improve their thermal sensation ranged from 1.65% to 8.75%.

3.6. Adaptive Indoor Temperature

Due to the discrepancy between PMV and AMV, the optimal temperature needs to be calculated based on the adaptive thermal comfort. Using the black box theory (a system viewed in terms of inputs and outputs without knowledge of the internal procedure, in the black box theory, the adaptive predicted mean vote aPMV uses PMV index as the input; Figure 13), aPMV can be described as follows:
aPMV   =   T · E     aPMV · K · T
where:
PMV   =   T · E
So:
aPMV   = PMV     1 + K · PMV E
We set:
α   = K     E
Finally:
aPMV   = PMV   1 + α   ·   PMV
where T is the transfer function (thermoregulatory system), K the feedback system (psychological and behavioral impact coefficient), and E the physical stimuli.
Here the adaptive coefficient α , representing the patient’s capacity to adapt to the environment, considering parameters such as culture, climate, social, psychological, and behavioral adaptations, which have an impact on the thermal perception. The coefficient α is based on the findings of surveys of thermal comfort conducted in the field, it is therefore a coefficient linked to the type of population. It is, therefore, necessary to carry out several surveys studies to meet the different thermal comfort conditions required by different occupants in different places, e.g., in schools, hospitals..., α was calculated using the least square method to adjust the field data sets.   α can be described by the following equation [46]:
α   = 1 i y i   x i     i
where:
x = 1 AMV   y = 1 PMV
i: number of data.
In cooler conditions (PMV < 0), there are eight sets of data in which the value of the adaptive coefficient is calculated as follows:
α   = 1 8 y i   x i     8 = 7.31
So:
aPMV   = PMV     1 7.31 · PMV
In warmer conditions (PMV > 0), there are 14 sets of data in which the value of the adaptive coefficient is calculated as follows:
α   = 1 14 y i   x i     14 = 5.24
So:
aPMV   = PMV     1 + 5.24 · PMV
Figure 13. Thermal comfort adaptive model mechanism modified from [47].
Buildings 11 00551 g013
Figure 14 shows that the adaptive predicted mean vote (aPMV) varies from −0.10 to 0.16, which is within the neutral thermal comfort zone [−0.2, +0.2] recommended for spaces occupied by very sensitive and fragile people. aPMV significantly reduced the sensation of discomfort compared to the PMV model, which varies from −0.47 to 1.11. As we can see in Equations (14) and (16), the advantage of the adaptive model is that complex adaptation is represented as a single value.
Figure 15 shows the polynomial correlation equation between the calculated adaptive predicted vote and the operative temperature. The adaptive temperature was calculated so that PMV = aPMV (i.e., patient-adaptive environment). Since the objective is to ensure that patients feel warm, we choose the high temperature top = 21.7 °C based on Equation (17) (this result is limited to the temperature range in which it was carried out):
0.012 · T op 2 + 0.603 · T op 7.431 = 0

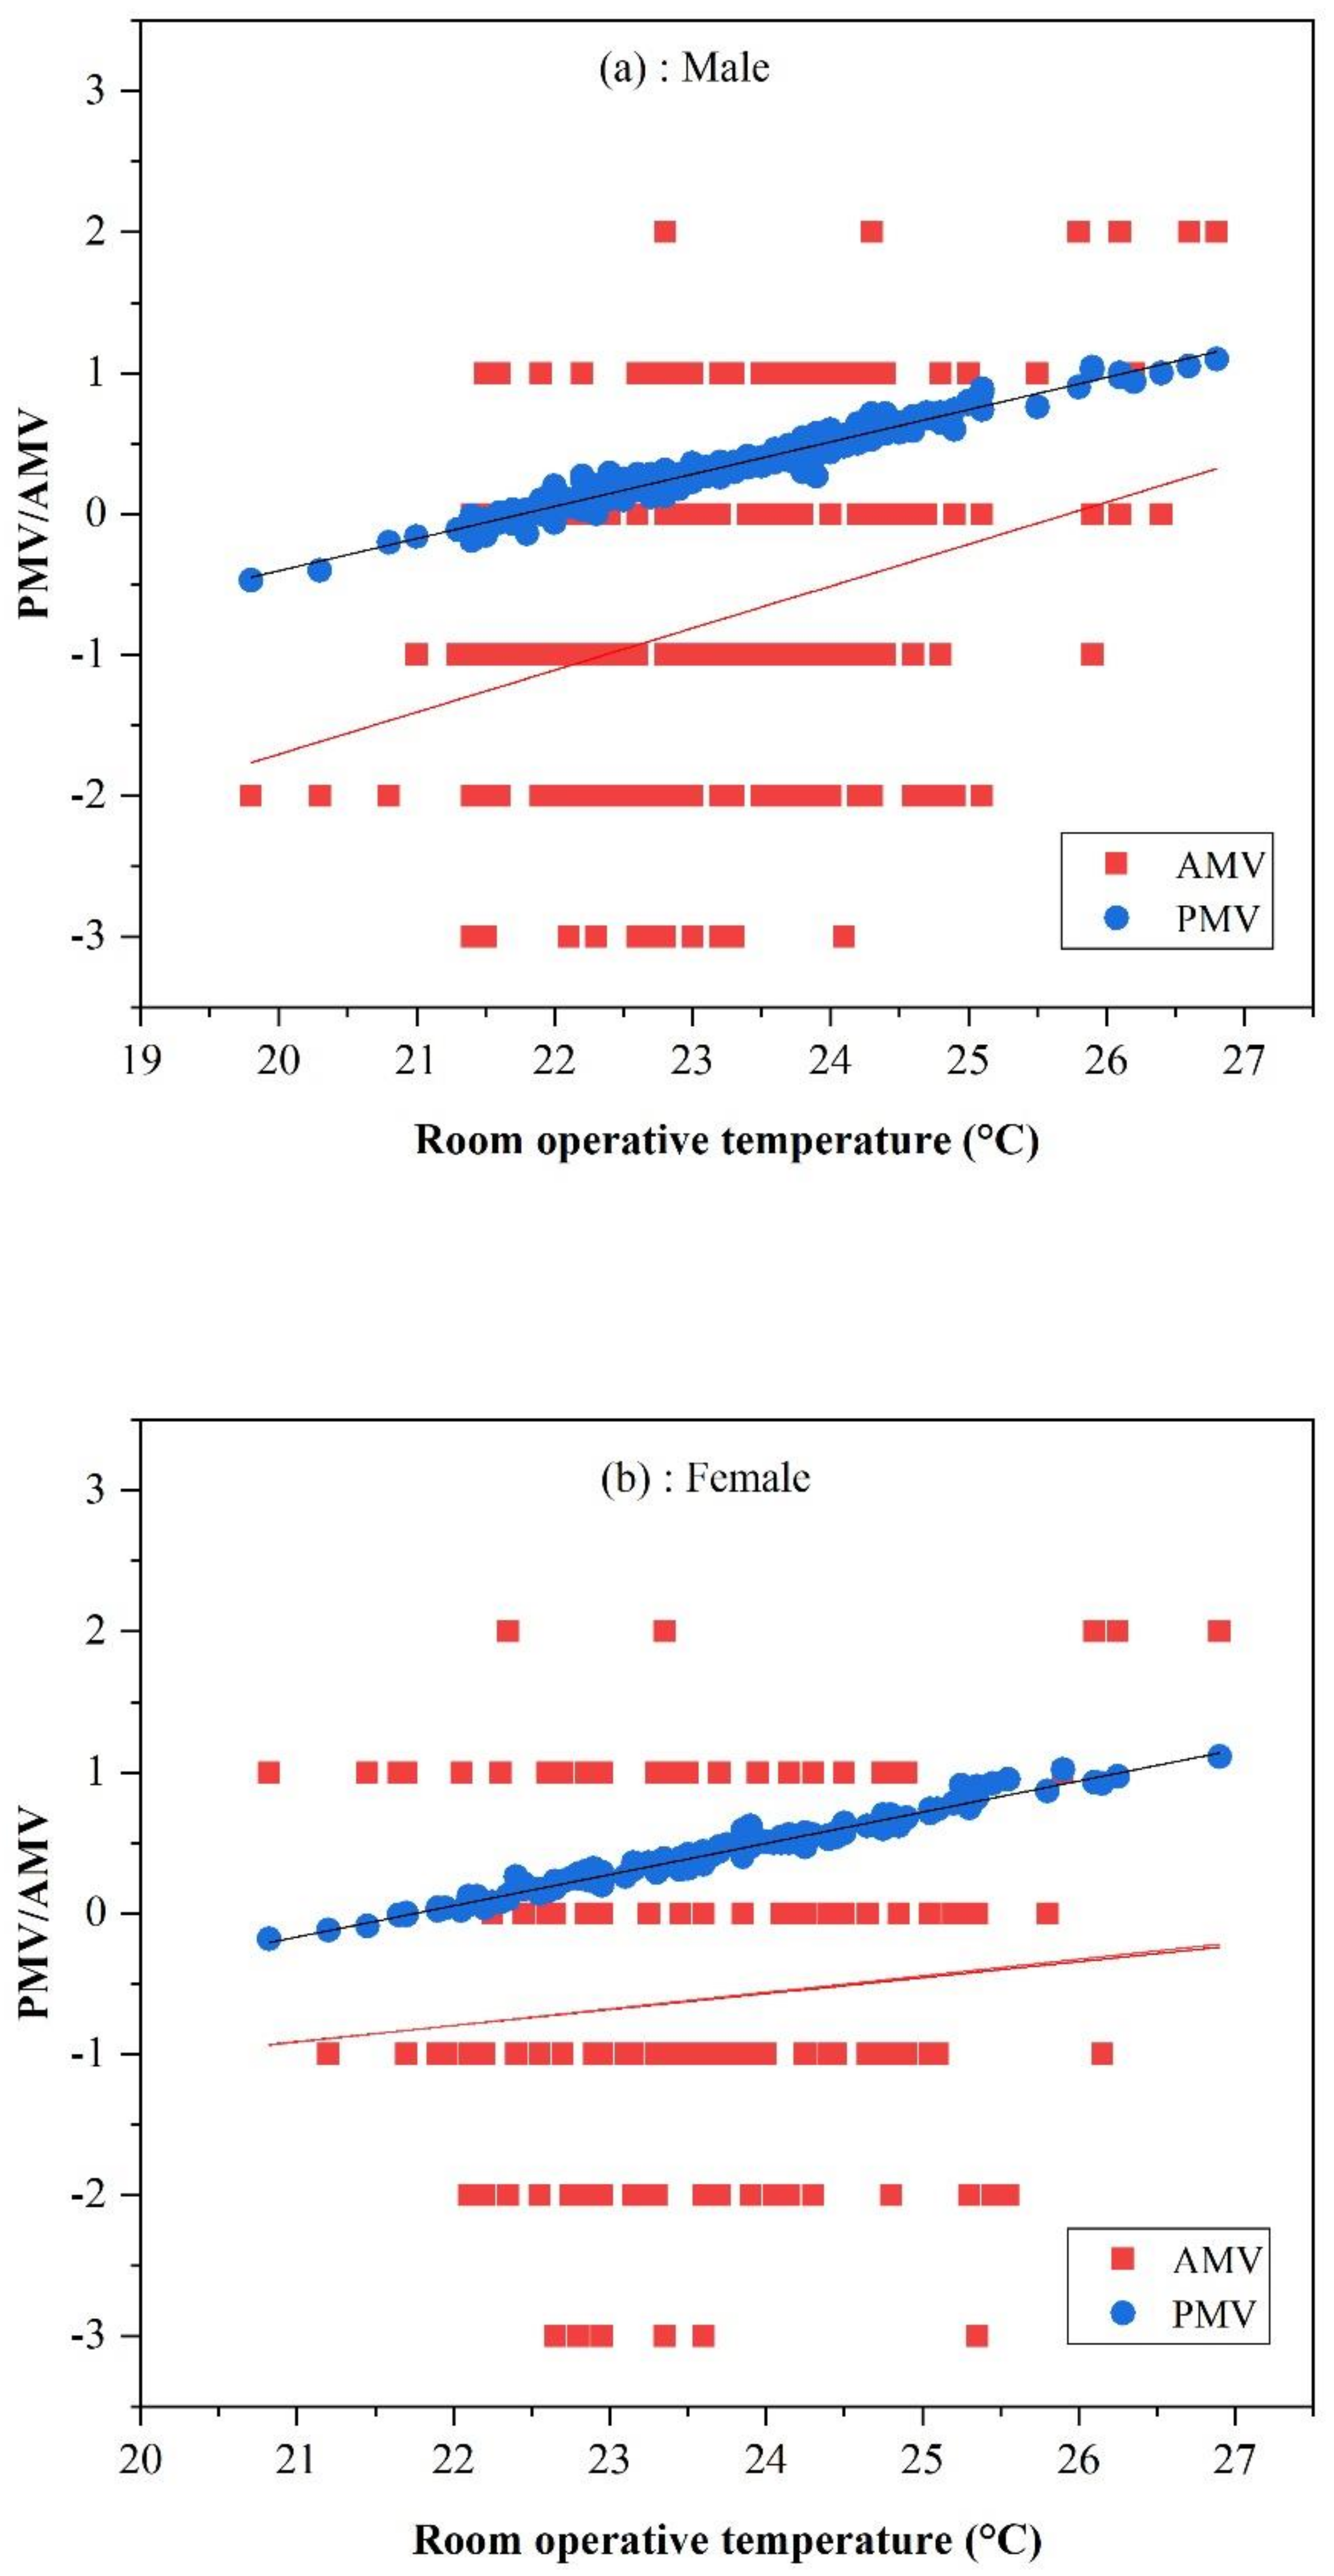
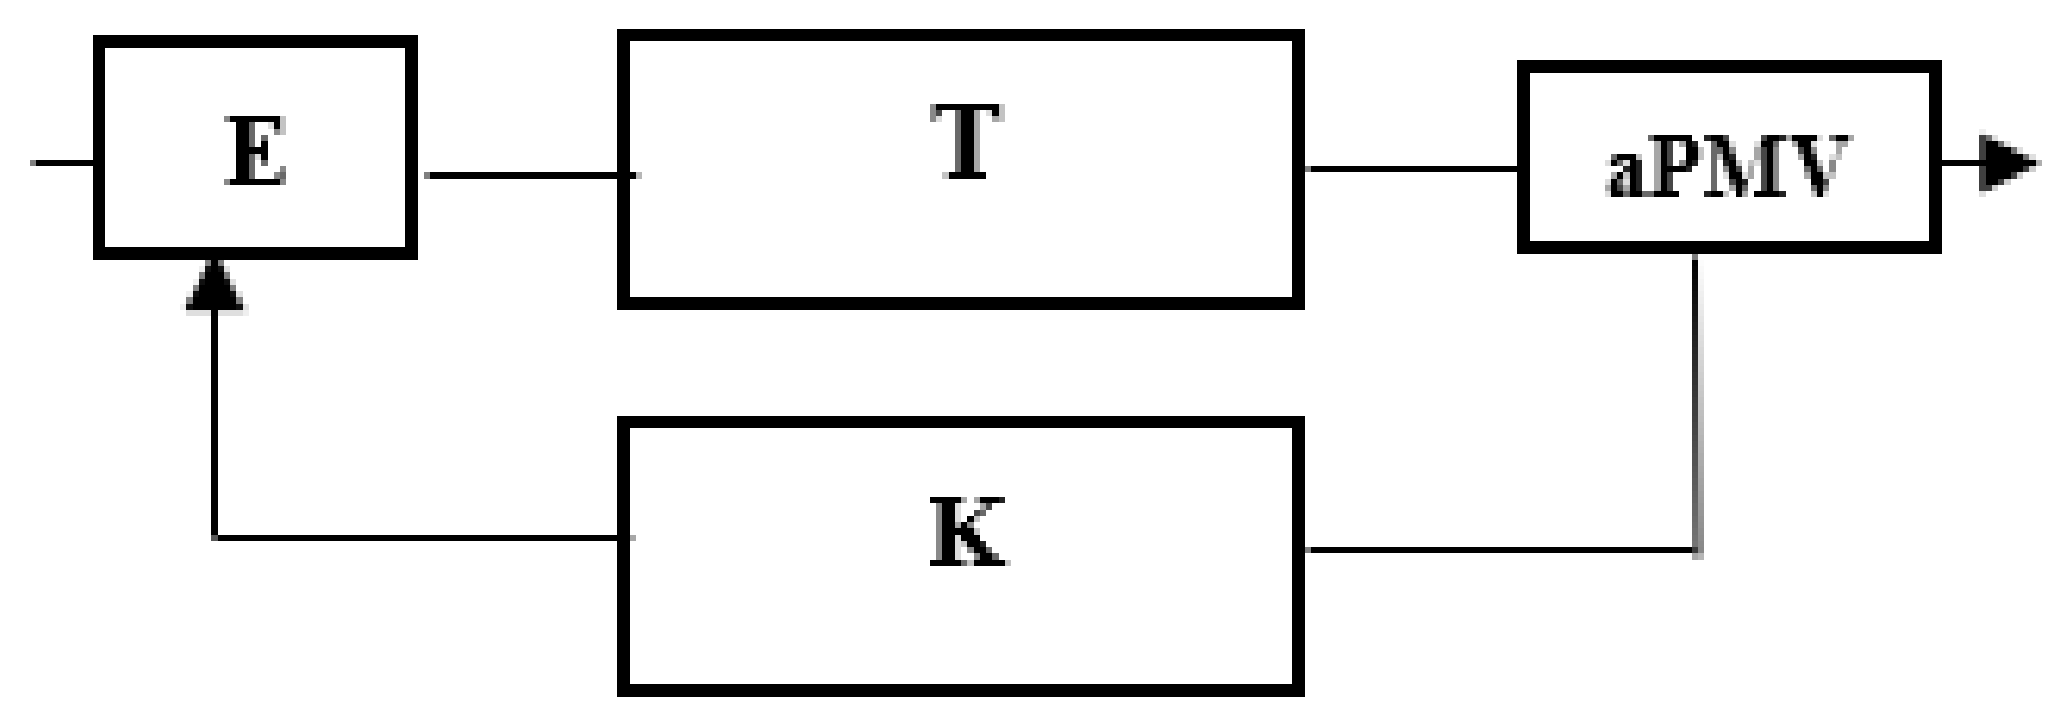
4. Correcting the PMV Model for the Patients

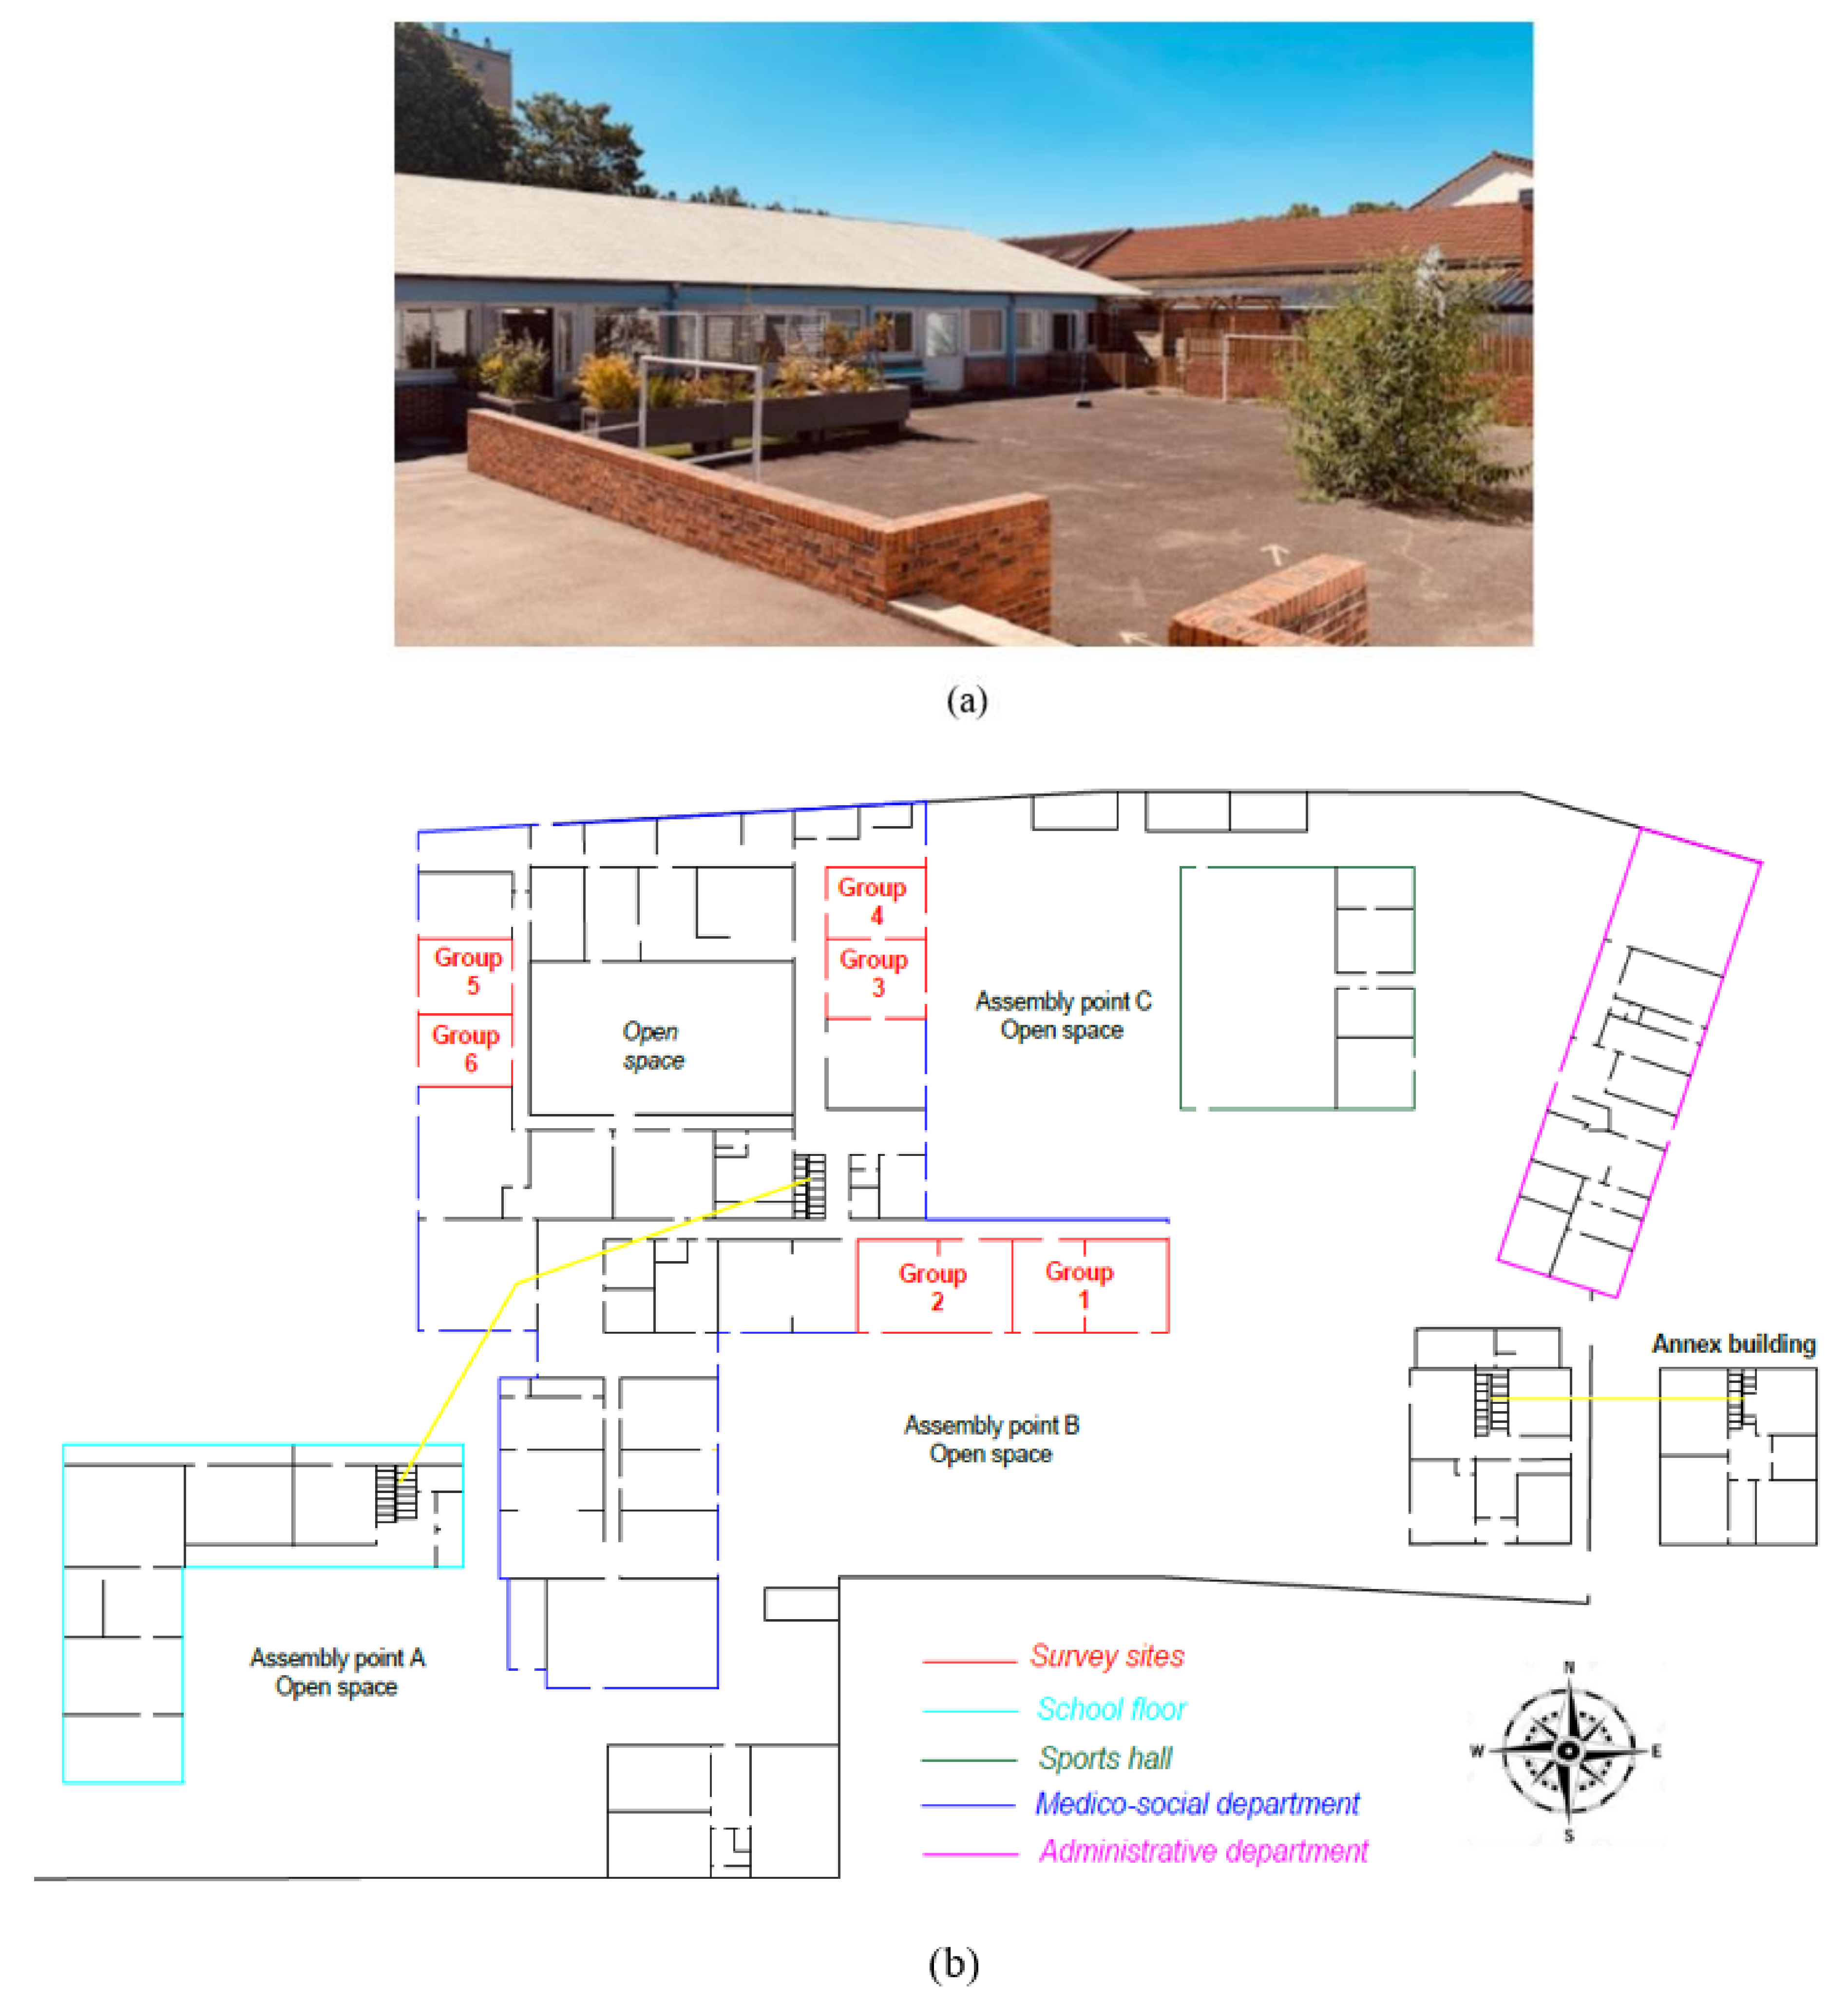
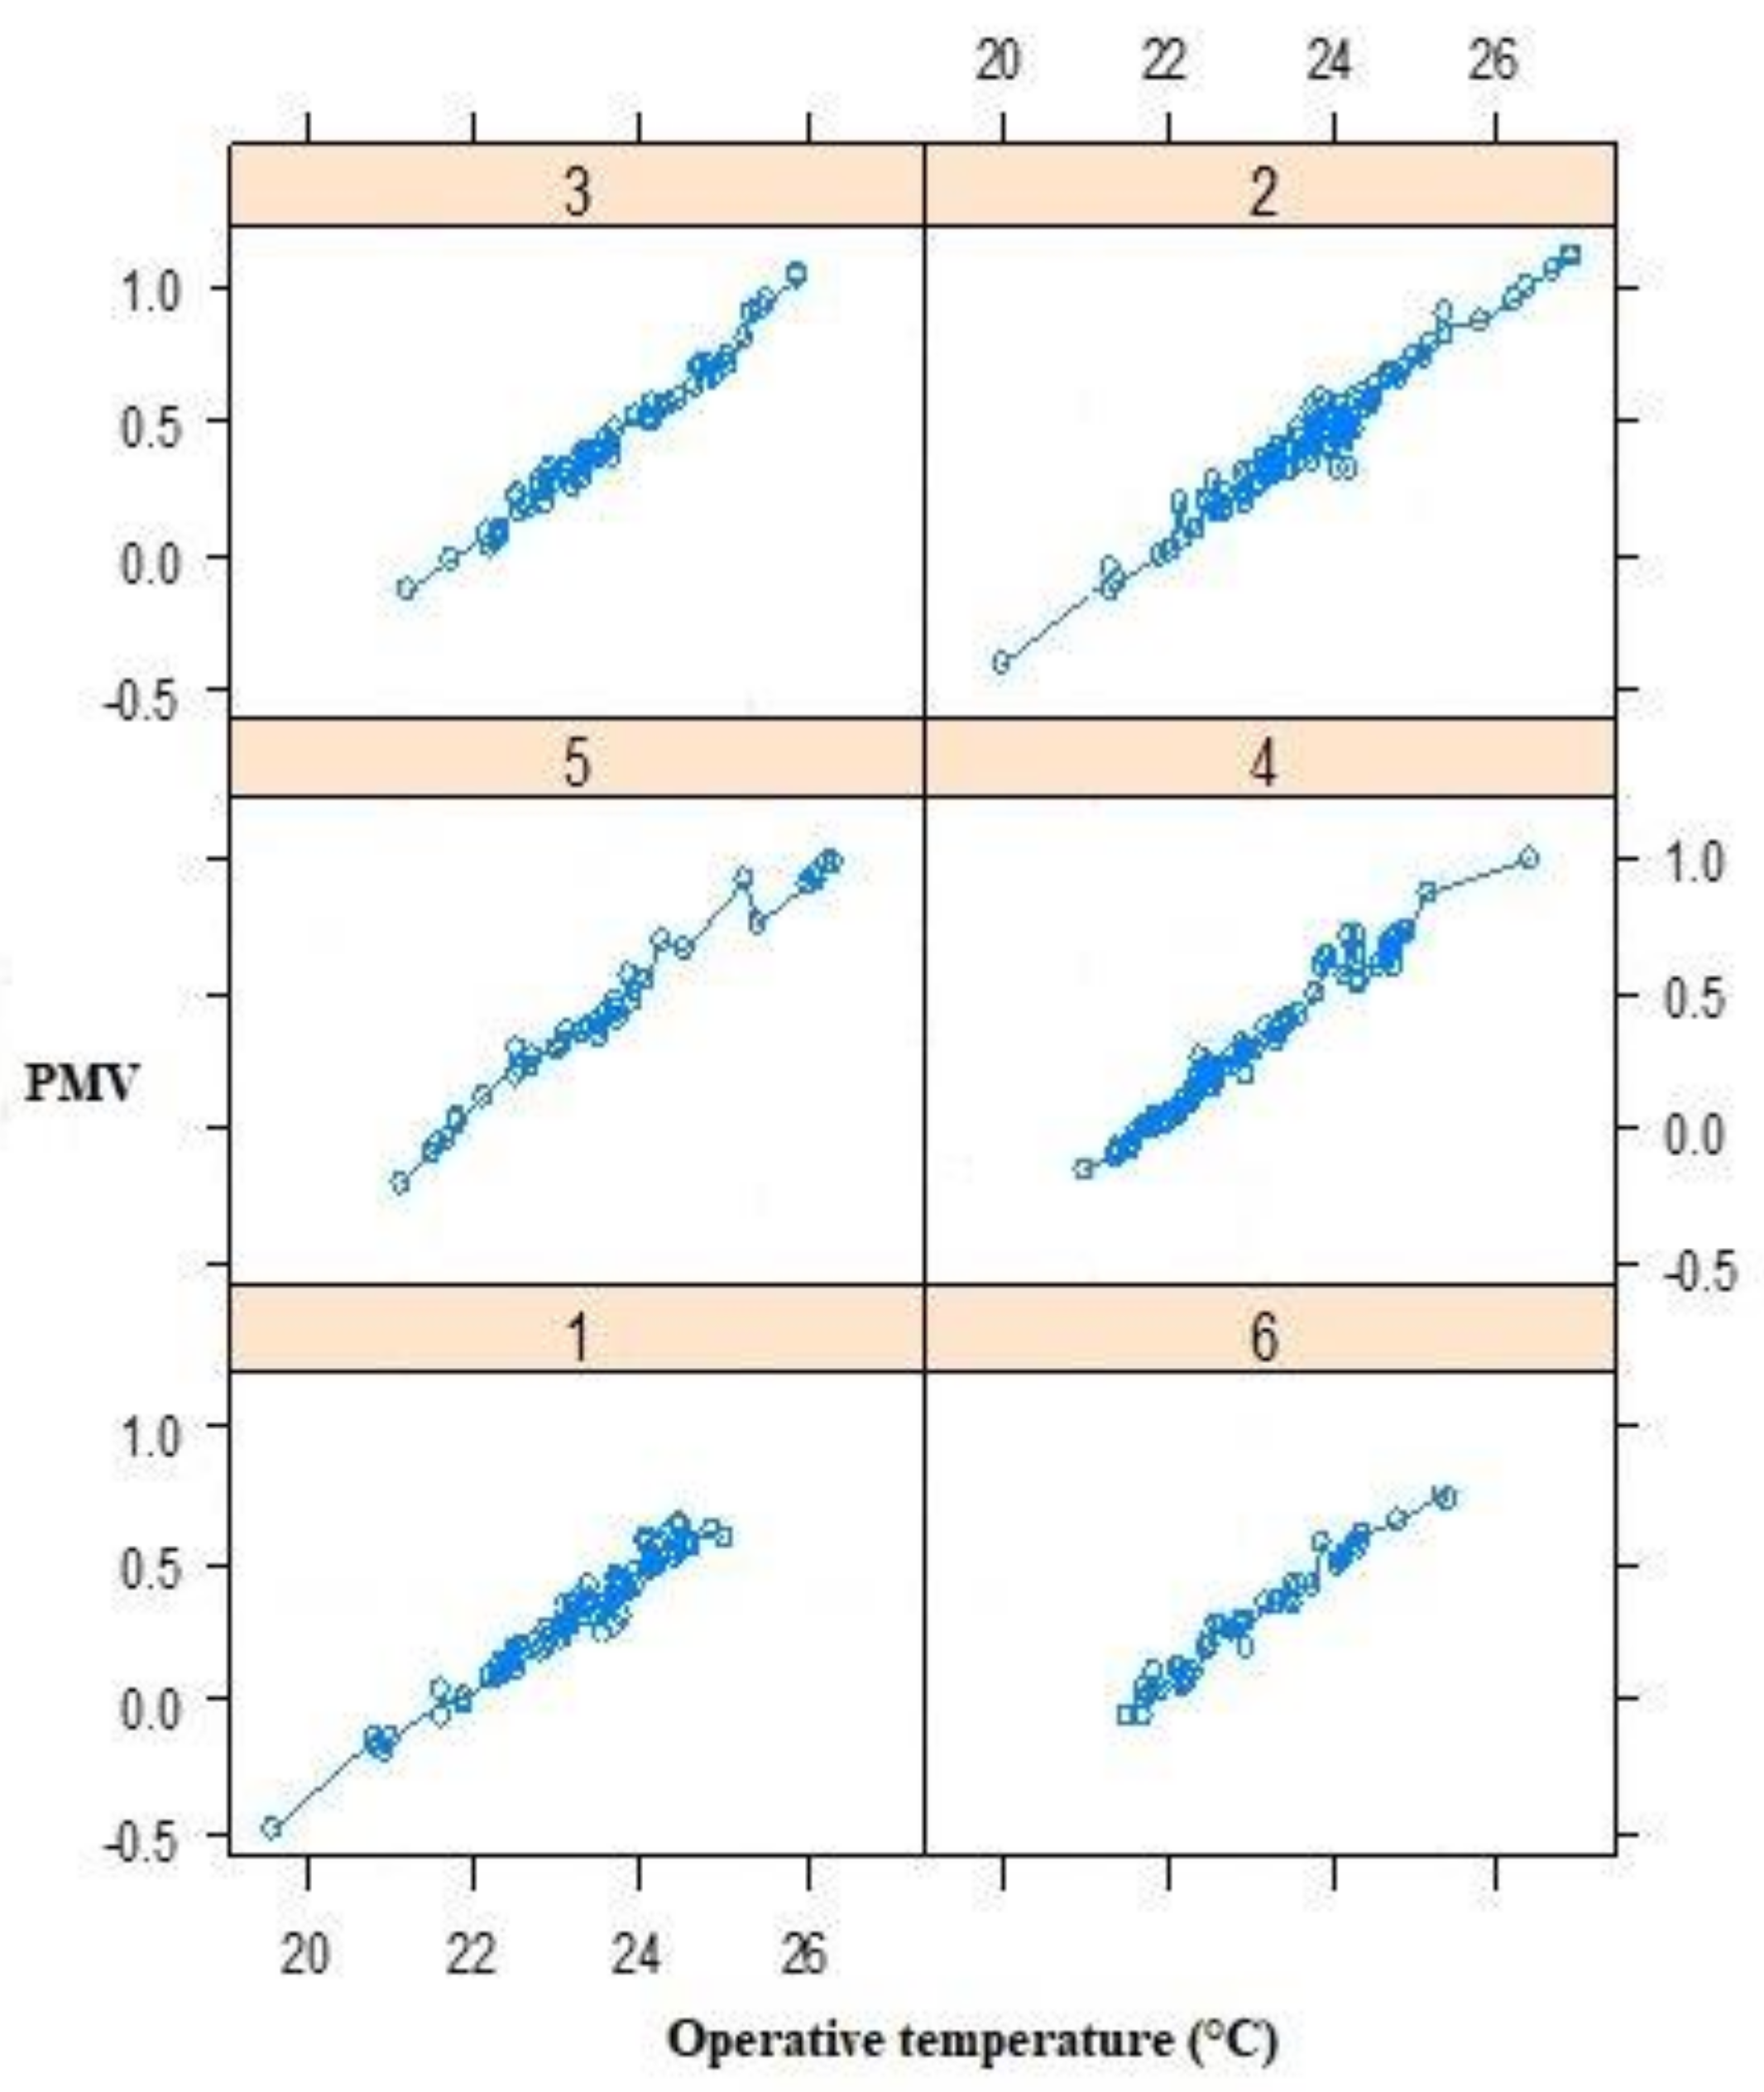
A new design of the PMV model takes into account within-group and between-group differences. For each response, we simultaneously measured the indoor environmental parameters. Therefore, a first-order correction to the PMV model for the patients was possible. Our data are longitudinal, while our data points might not be truly independent. We have six groups (Figure 2) as well as different observations per group, while our survey study may be insufficient if we try to fit models with too many parameters. Therefore, a linear mixed-effect model was chosen to incorporate all the data, even in the case of many covariates.
Linear mixed-effect models are statistical models containing both fixed and random effects. These models are useful in a wide variety of disciplines but rarely used in the thermal comfort field [38]. They are particularly useful in settings with repeated measurements. As many types of mixed-error models exist, we compared random intercept, random slope, intercept, and random slope models. Figure 16 shows that the intercept changes from one group to another, while the slope remains mostly stable. To select the best model, the Bayesian information criterion (BIC) was used, and the model with the lowest BIC was preferred. Finally, a random intercept model was selected. BIC is defined as [48]:
BIC =   k · ln n 2 · ln   L   ^  
where L   ^ is the maximized value of the likelihood function of the model, n the sample size, and k the number of parameters estimated by the model.
For i = (1 … n) and j = (1 … m), linear mixed models were described as follows:
Y ij =   β 0 i + β 1 i X ij + ε ij
β 0 i =   α 0 + μ 0 i   ,   β 1 i   =   α 1 + μ 1 i
Y ij =   α 0 + μ 0 i + α 1 X ij + μ 1 i X ij + ε ij
Y ij =   α 0 + α 1 X ij + ( μ 0 i + μ 1 i X ij + ε ij )  
where   α 0 + α 1 C ij   are the fixed effects, ( μ 0 i + μ 1 i C ij + ε ij ) the random effects, n the number of groups, m the number of repetitions per group, X the independent variable, μ 0 i the random intercept associated with each group, μ 1 i the random slope associated with each group, and ε ij the error term.
In this study, a random intercept model was selected:
Y ij =   α 0 + α 1 X ij + μ 0 i + ε ij
We looked for a model in which the random intercept was the same for all groups. Equation (23) thus becomes:
Y ˜ i =   α 0 + α 1 X i + μ 0
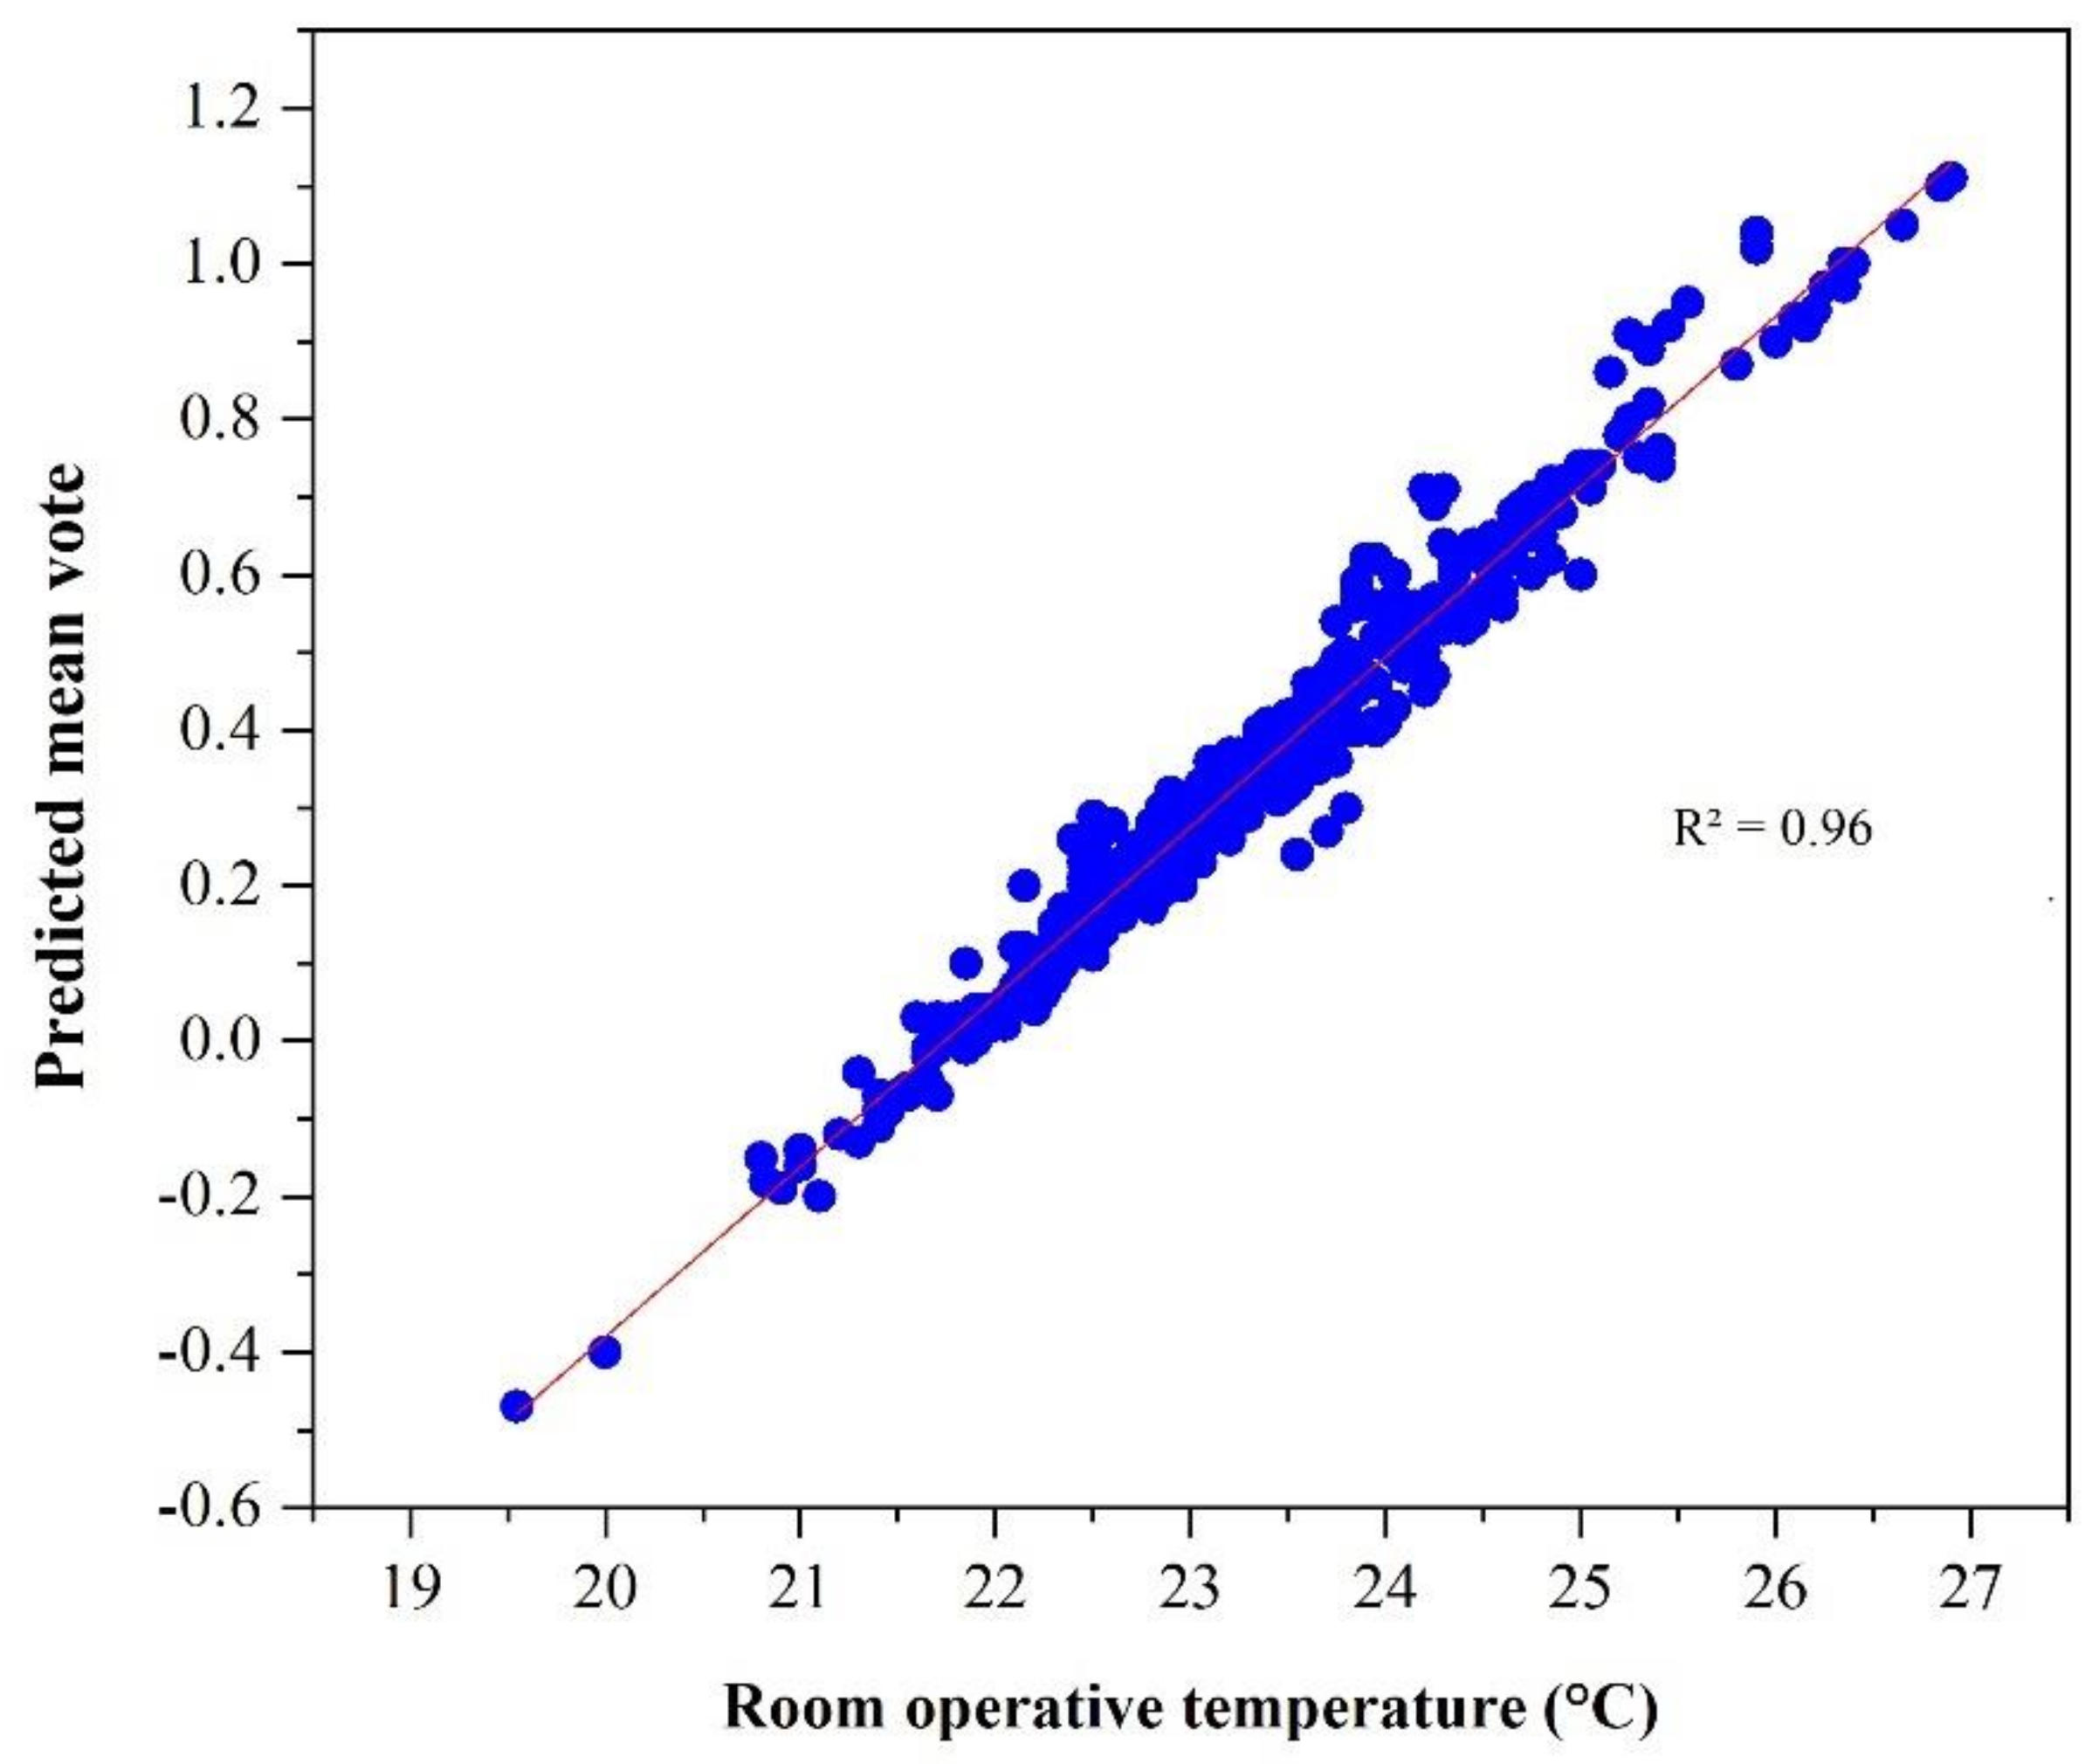
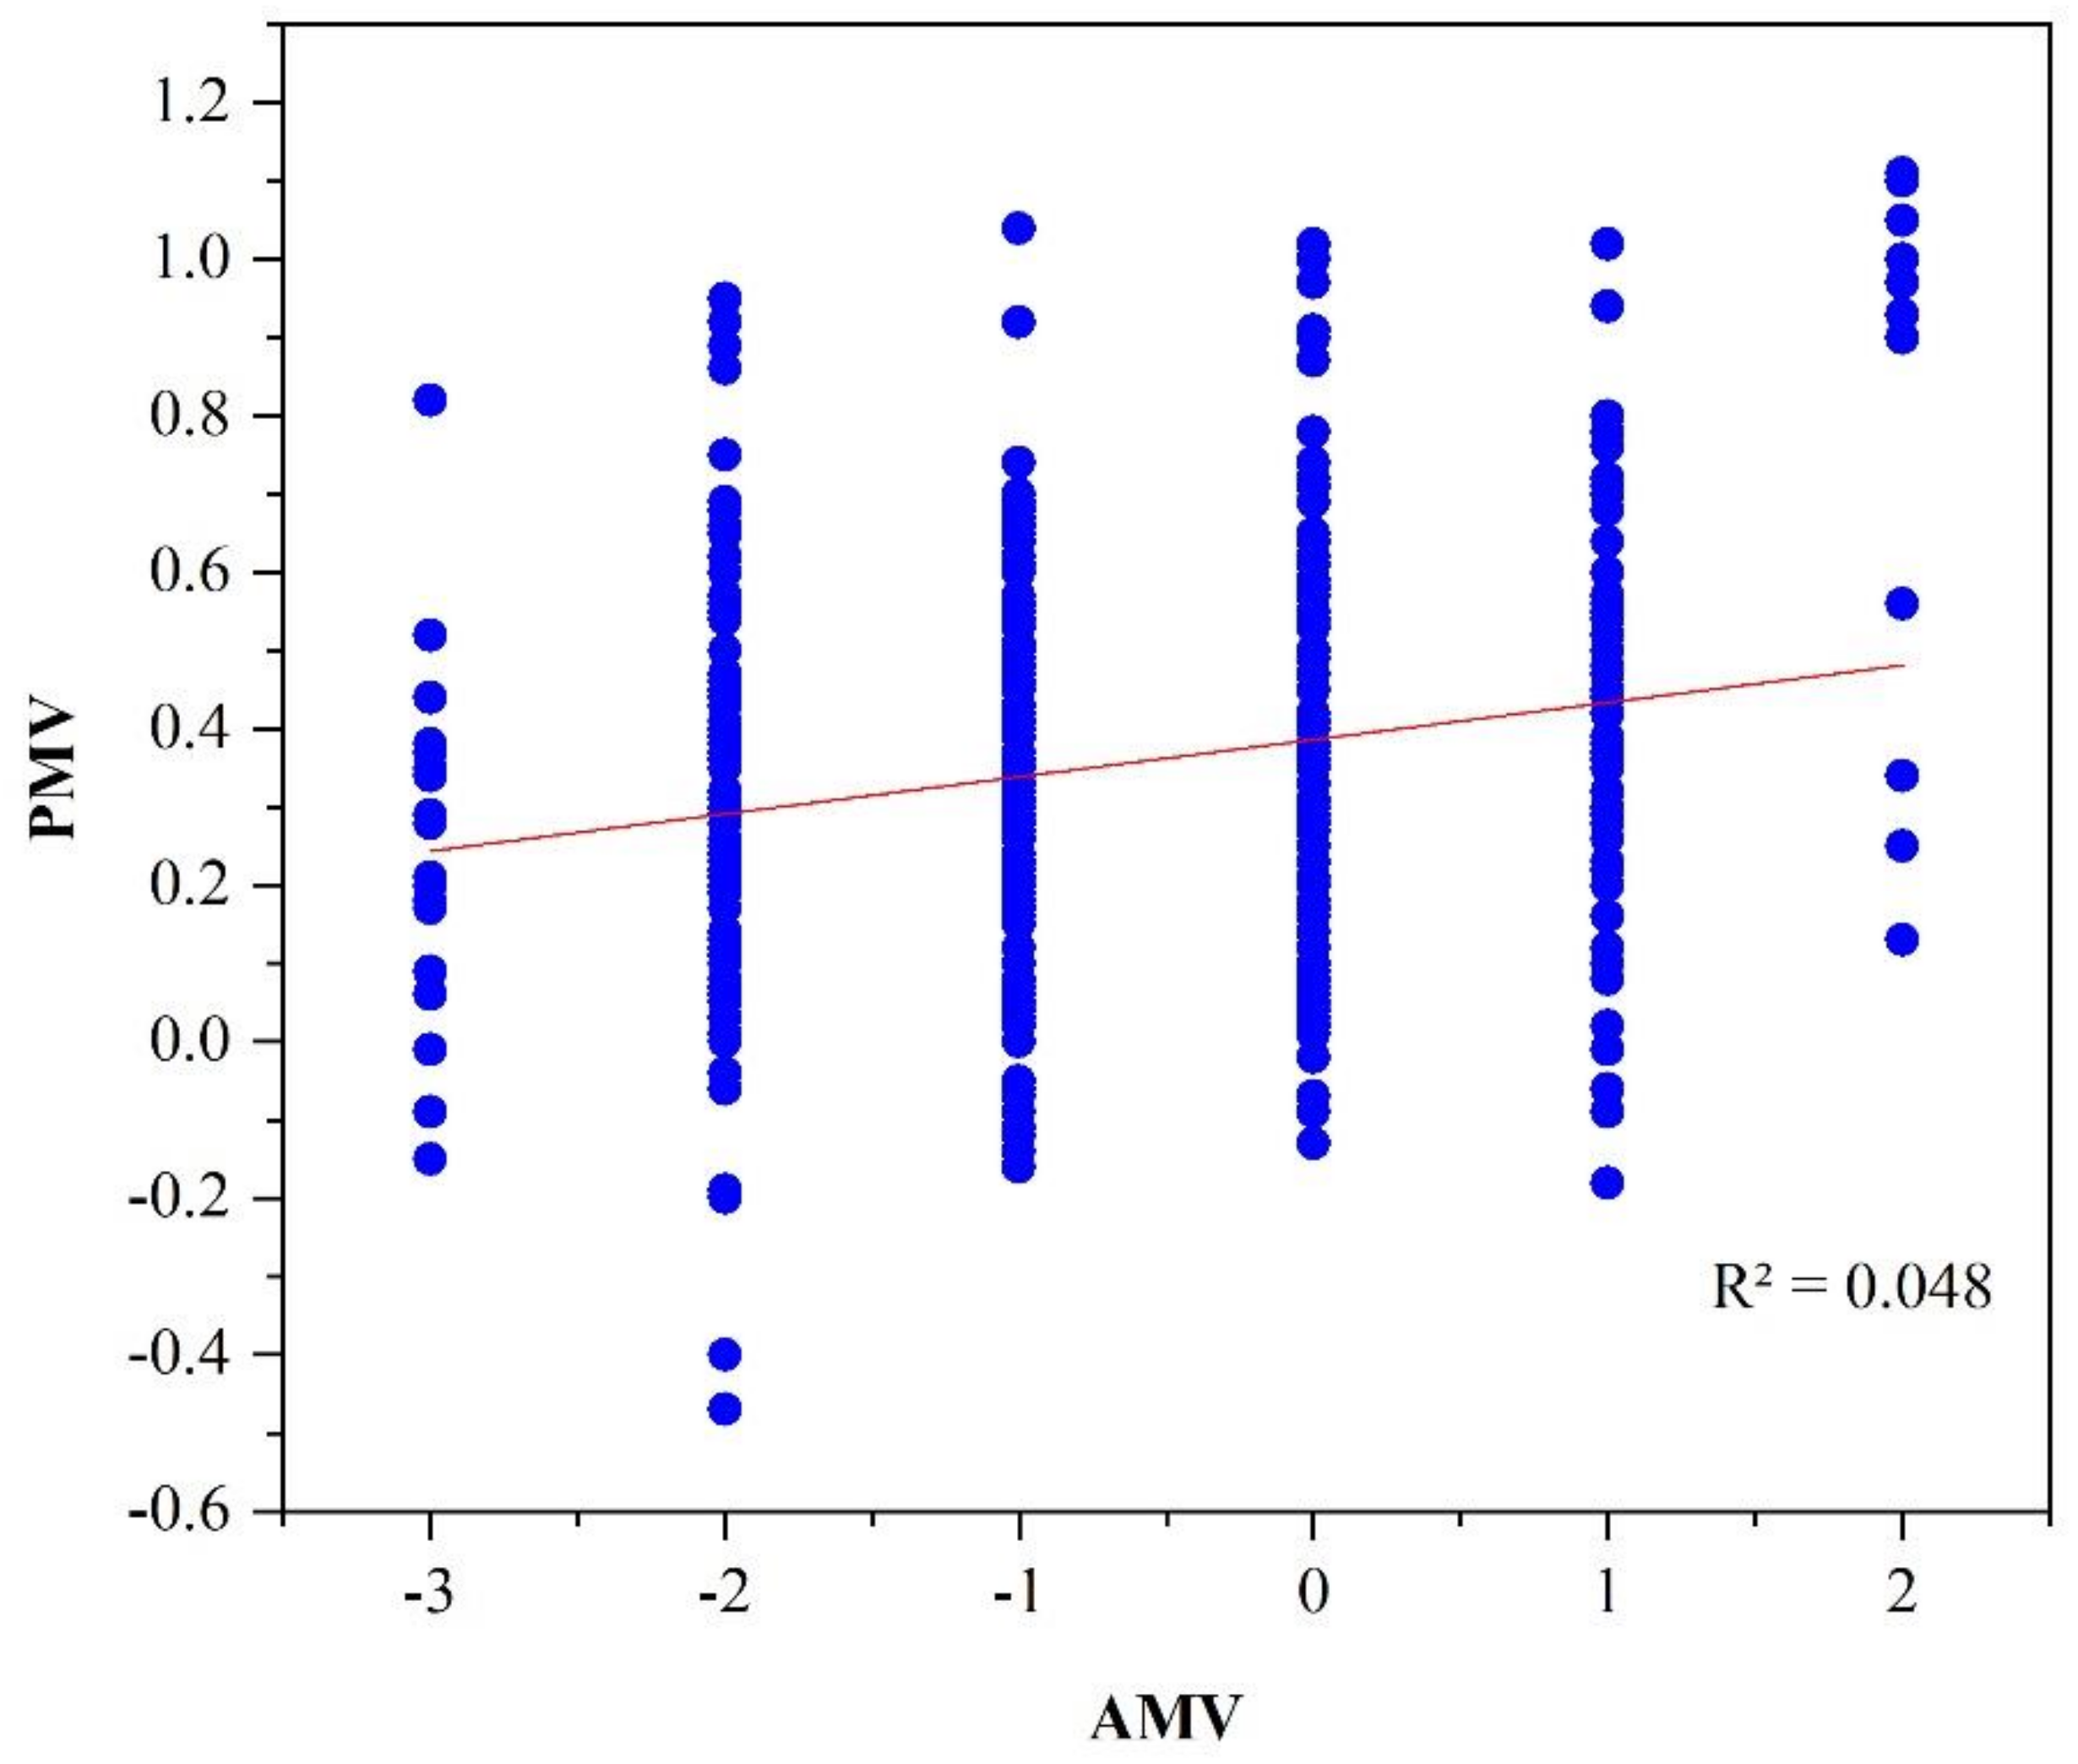
Using R programming language, we propose an AMV-corrected PMV model in which the independent variable is the operative temperature, and the output is the predicted mean vote for patients (PMVp). 
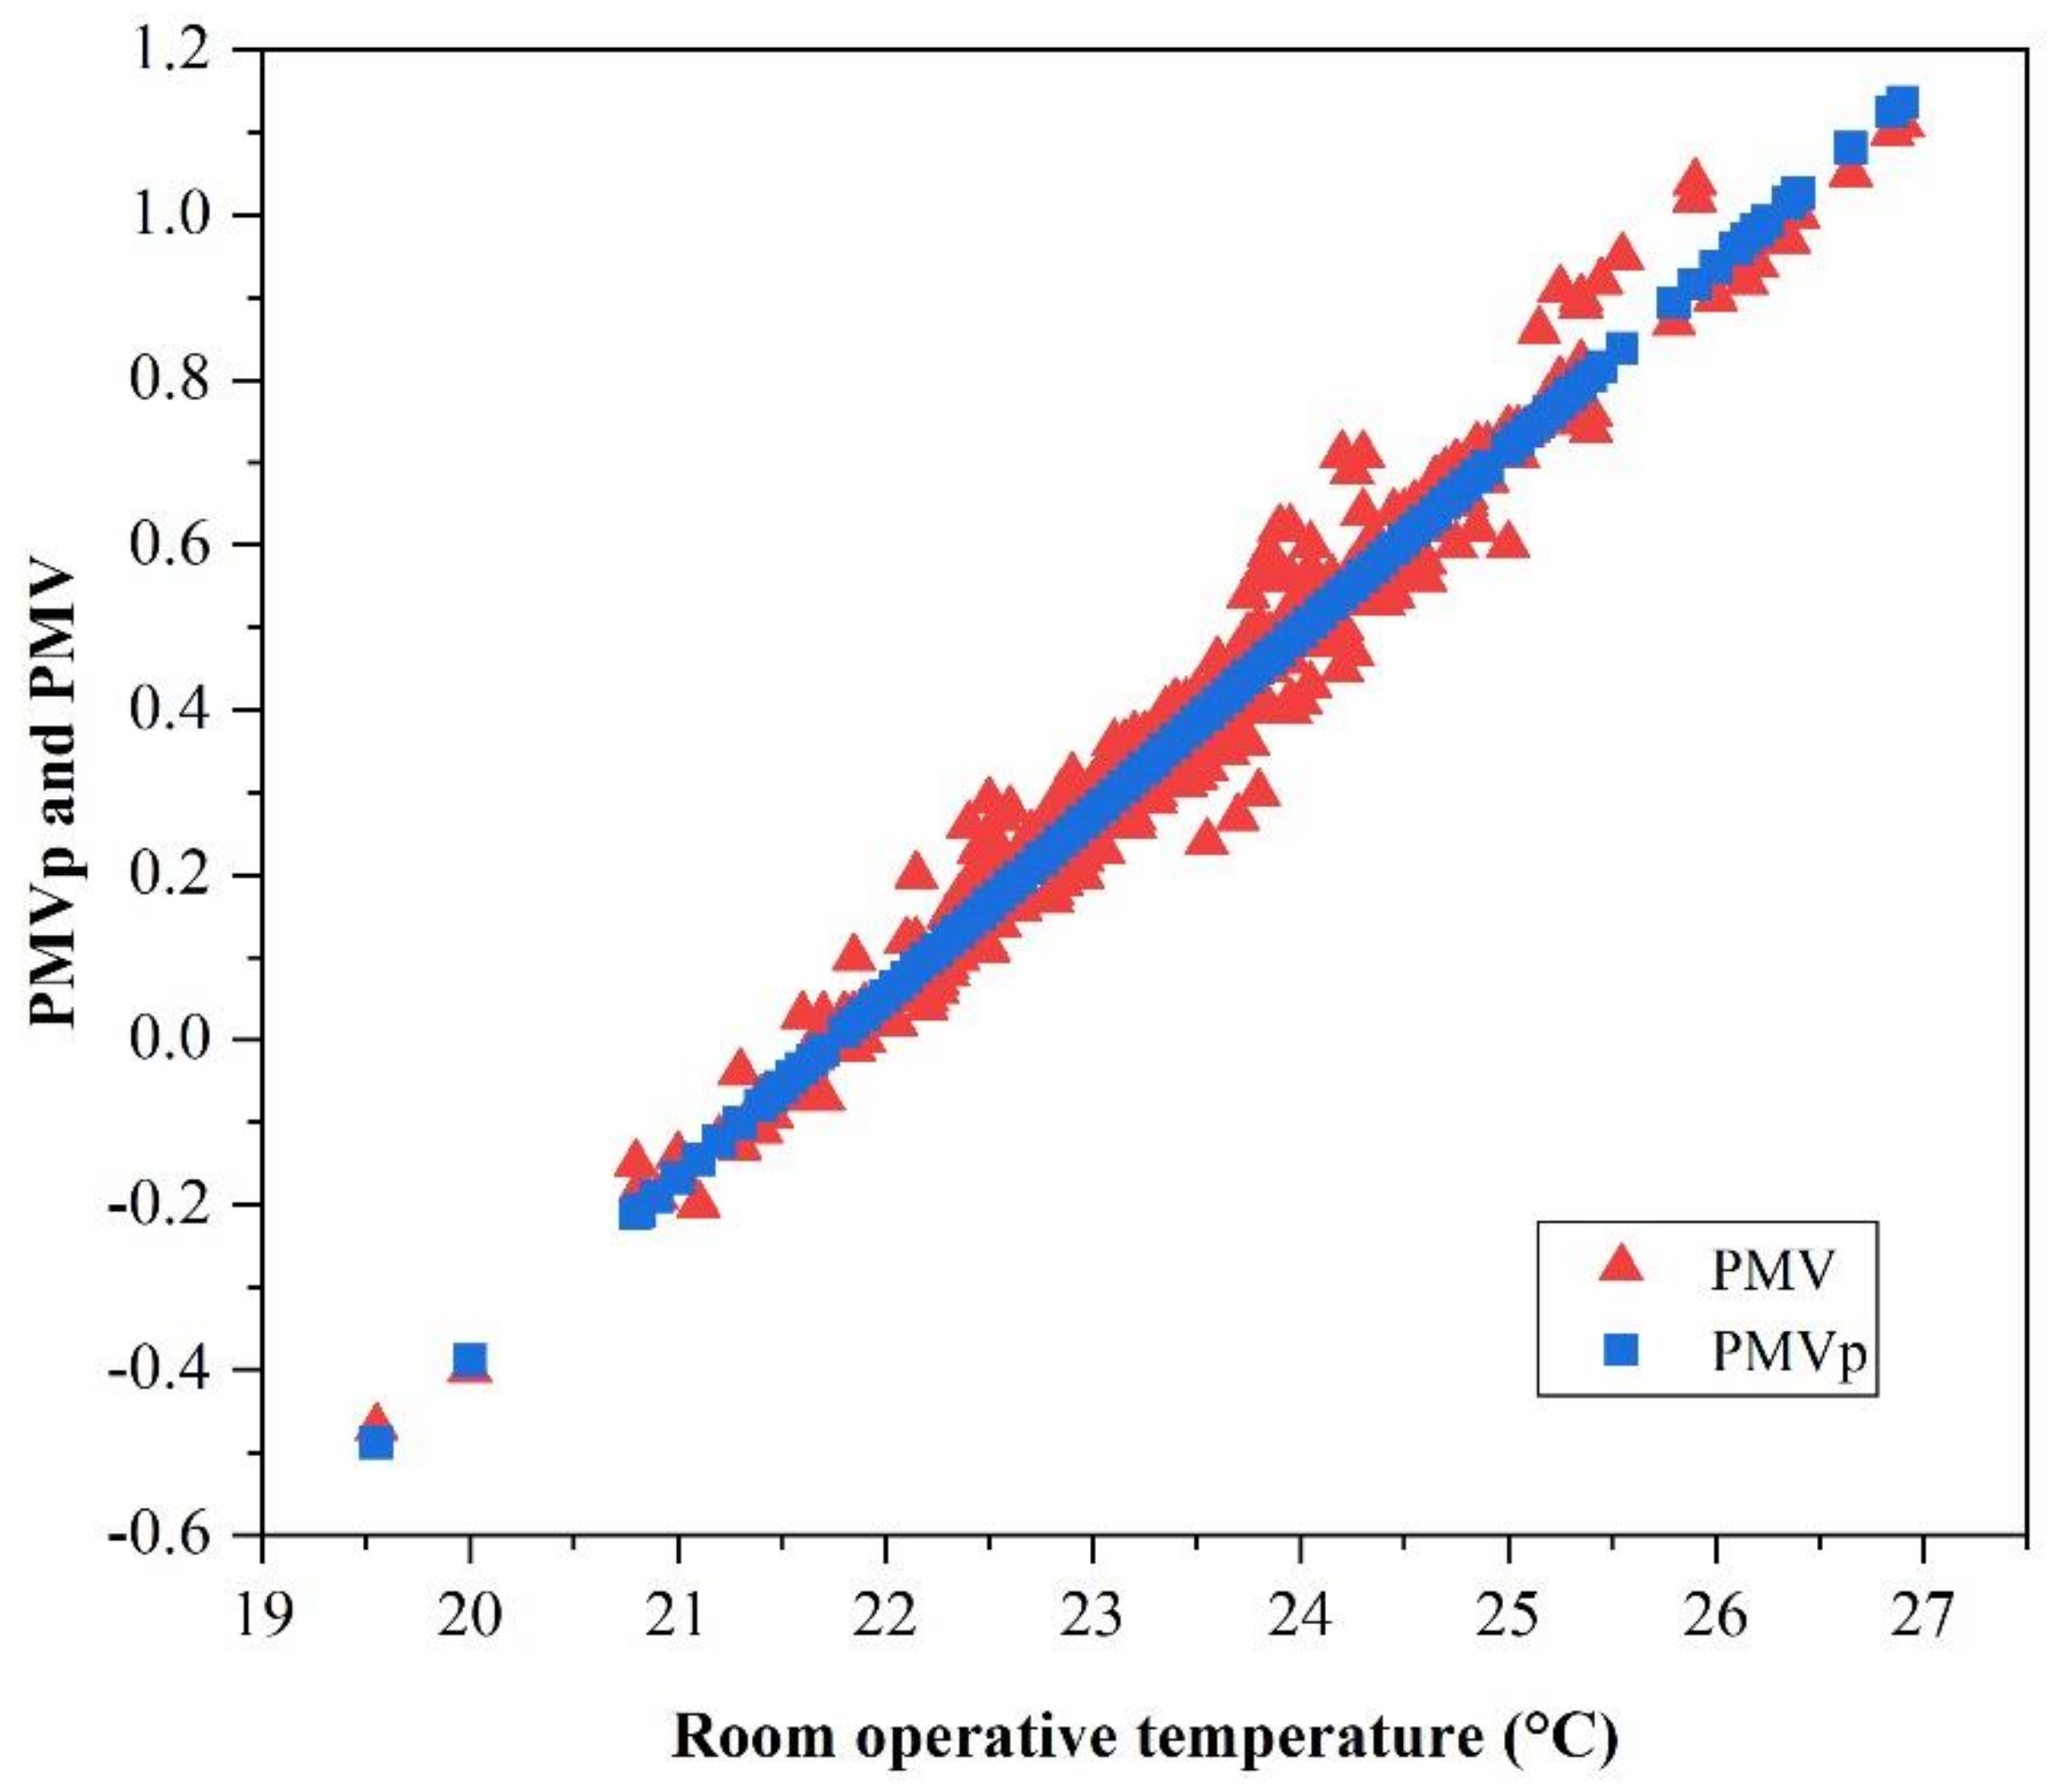
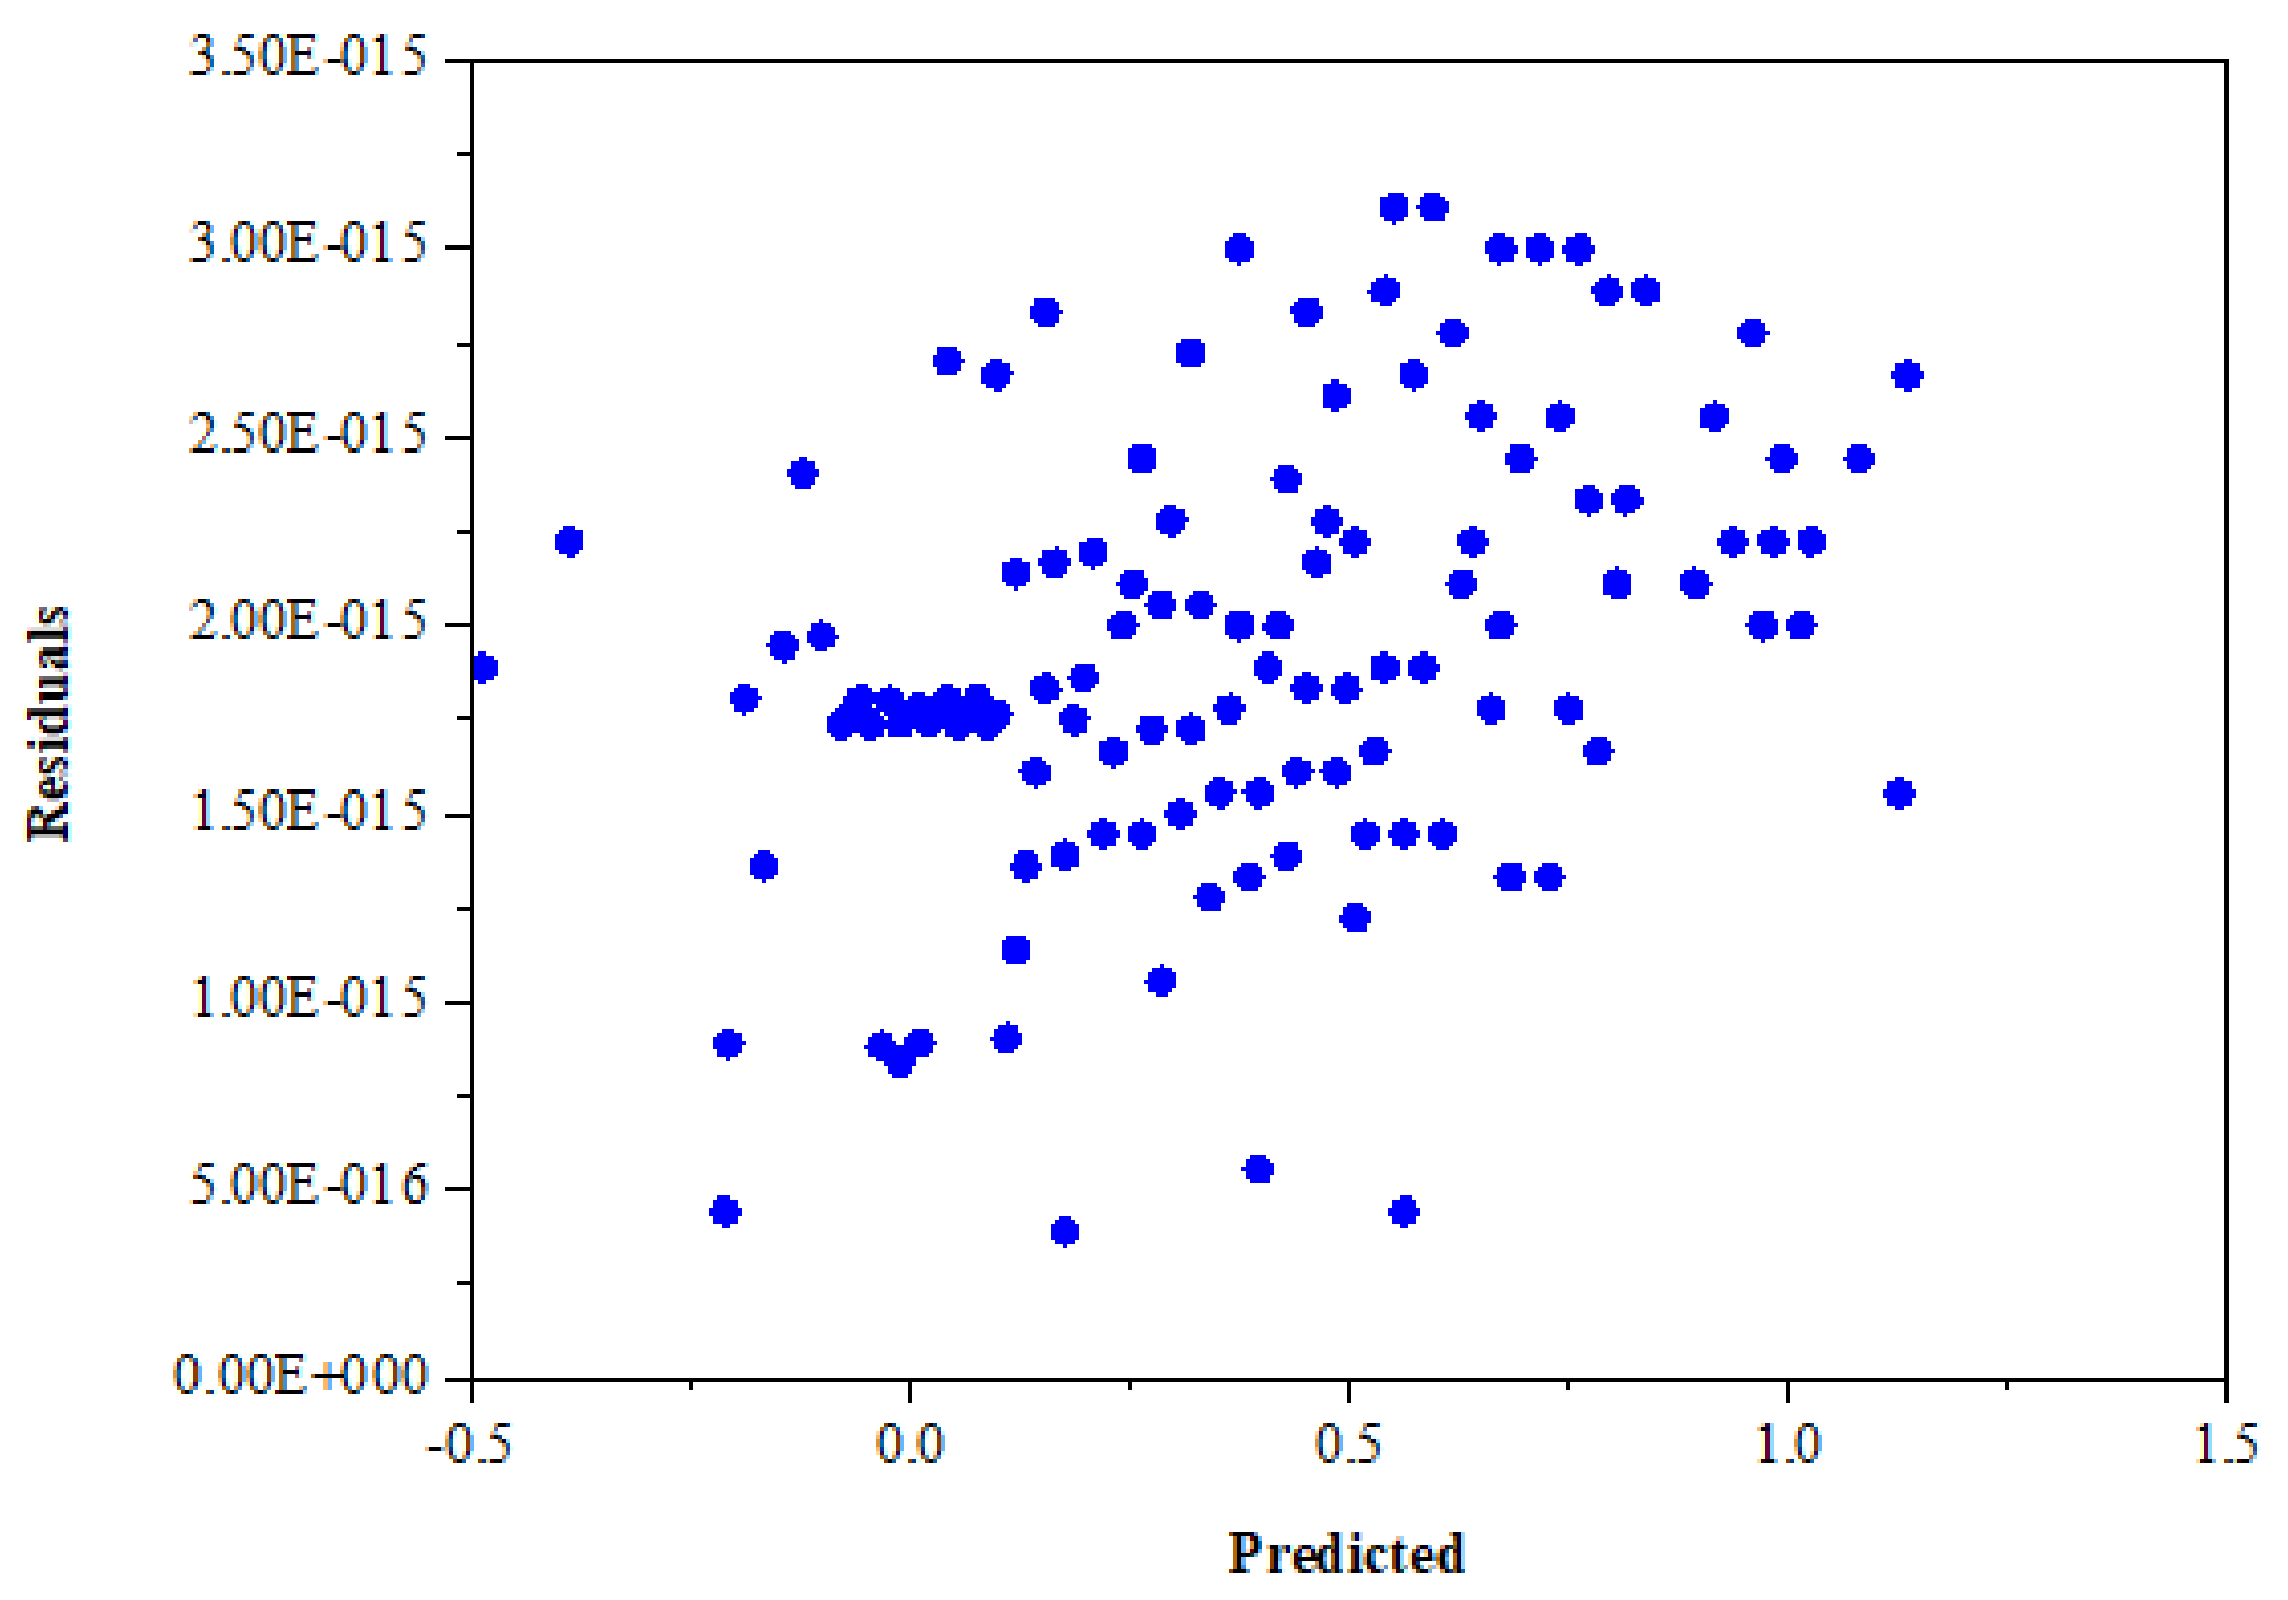
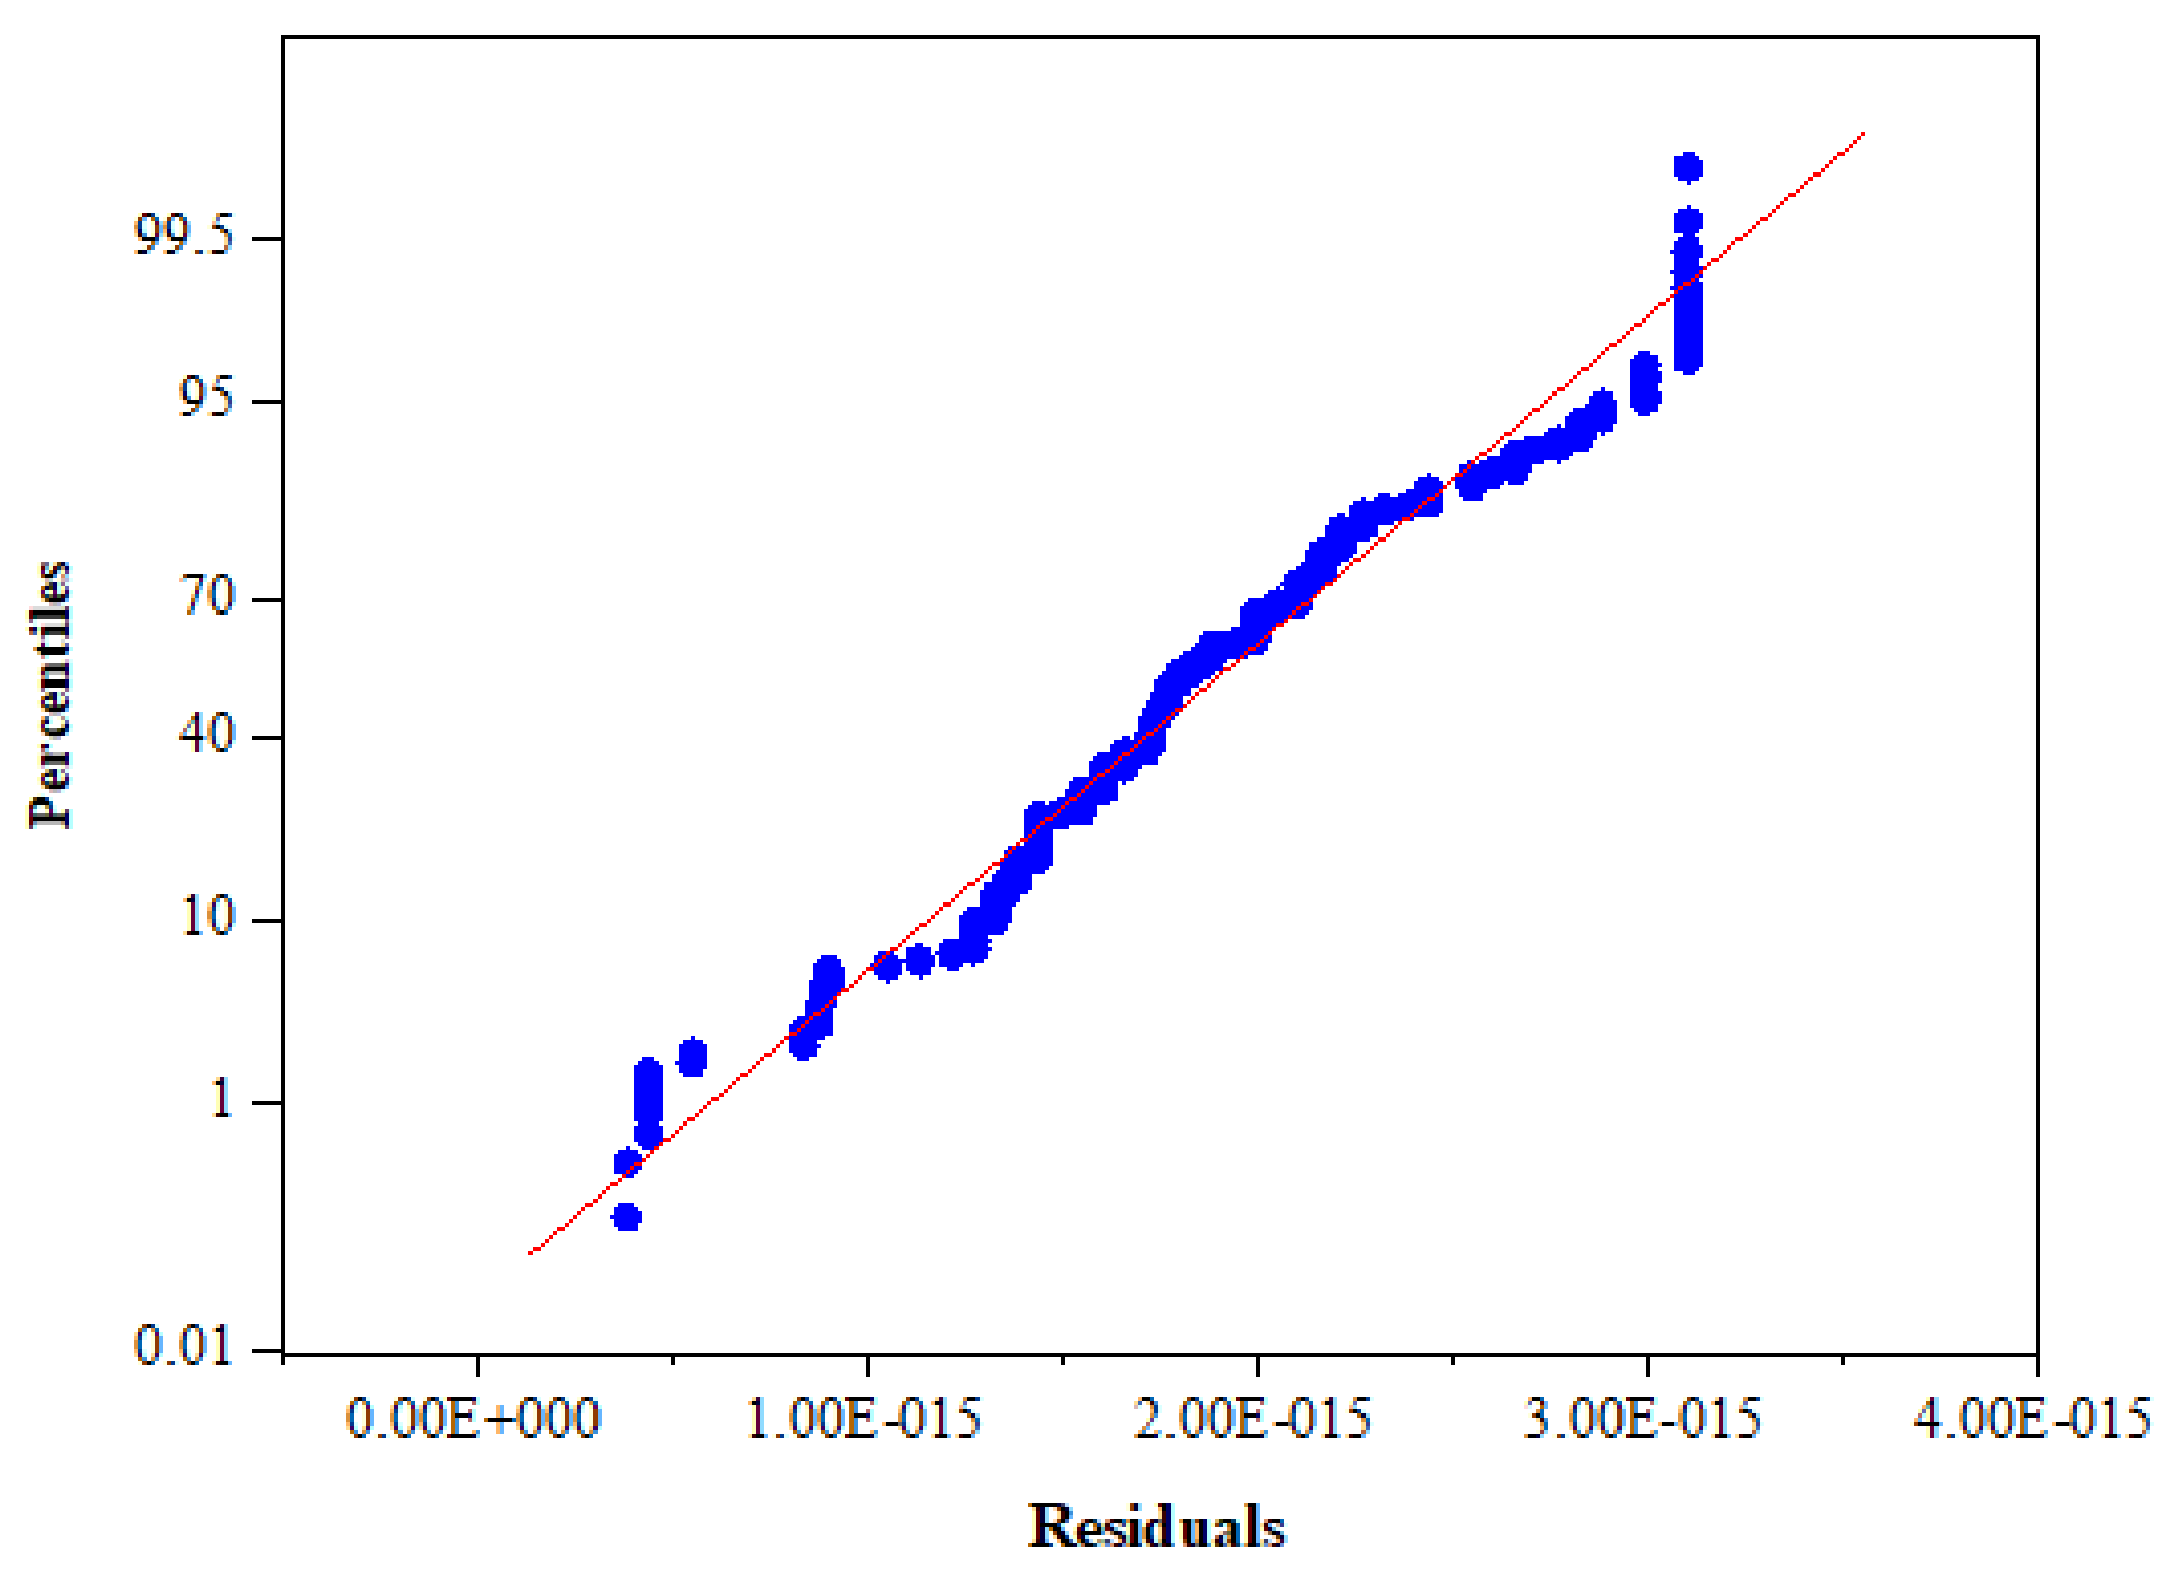
Figure 17 compares the evaluations of PMVp and PMV as a function of the operative temperature. The variation of PMV and PMVp in both cases is homoscedastic, so the linearity assumption is valid. The validity of the model can be verified using the coefficient of determination ( R PMVp 2 = 0.99), while the residual analysis is defined as the difference between the actual observation and the corresponding fitted value [49]. The residuals versus predicted values were randomly distributed around zero (Figure 18), with the normal probability plot of the residuals resembling a straight line (Figure 19); therefore, the validity of the model is confirmed.
PMV p = 4.80952 + 0.221020 · T op + μ 0 ~ N   0 , σ 0 2 = 0.0001881  
where σ is the standard deviation and μ 0 the random intercept over the entire data set.

5. Conclusions, Limitations, and Perspectives

The research on thermal comfort described in this paper was carried out in a medico-social institution in the French city of Troyes in the winter season. The main outcome is that great care should be taken when interpreting the results of thermal comfort studies for vulnerable populations, including people with disabilities. The most important conclusions are as follows:
i.
The comparison between patients and staff showed that thermal comfort is strongly correlated with subjective thermal perception, which is influenced by health conditions (including disease type and treatment). Regarding the thermal sensation of patients and healthcare staff. A total of 62.16% of patients thermal sensation votes ranged from −1 to −3 (slightly cool, cool, cold), while 23.16% perceived the thermal sensation as neutral. However, 85.5% of the thermal sensation votes of healthcare staff ranged from 0 to 1 (neutral, slightly warm). This difference is essentially due to the adaptation capacities of respondents.
ii.
The relationship between PMV and PPD indices and operative temperature was successfully established. However, in our case study, the PMV always overestimated the thermal sensation of patients.
iii.
Concerning adaptive opportunities, 49.00% of patients indicated that drinking a hot beverage could increase their thermal sensation. Nevertheless, 28.37% reported doing nothing in terms of thermal adaptation. The proportion of other adaptive responses used by patients to improve their thermal sensation ranged from 1.65% to 8.75%. These results probably related to the effect of the winter season of the study.
iv.
Due to the discrepancy between PMV and AMV, the optimal temperature needs to be calculated based on the adaptive thermal comfort. In the studied buildings, the adaptive temperature is calculated, using the black box theory and is around 21.65 °C.
v.
We proposed a new patient-predicted mean vote (PMVp) that explores the relationship between patients’ sensations and their thermal environment. This model takes into account within-group and between-group differences.
These results address the current concerns about assessing the thermal comfort of vulnerable individuals. In terms of study limitations, the reduced number of respondents limited the survey results, even though the percentage of participants remains acceptable for this vulnerable population (see the study of Del Ferraro et al., with only 30 subjects [50]). Given the lack of data on CO2 concentration, CO2 measurements analysis is also considered as a limitation of this study.
Our findings may be considered a first attempt at improving the current standards for vulnerable populations regarding their thermal comfort requirements. Further studies should be conducted to evaluate the thermal comfort conditions in healthcare buildings. In the future, we intend to link the thermo-physiological state of this vulnerable population to their adaptive thermal comfort.

Author Contributions

Conceptualization, Z.E.A., Y.B., A.M., G.P. and A.C.; methodology, Z.E.A., Y.B., A.M., G.P. and A.C; software and materials, Z.E.A., Y.B. and A.M.; investigation, Z.E.A., Y.B., A.M., A.C. and G.P.; writing—original draft preparation, Z.E.A.; writing—review and editing, Z.E.A., Y.B., A.M. and G.P.; supervision and funding acquisition, Y.B., A.M. and G.P. All authors have read and agreed to the published version of the manuscript.

Funding

This work was supported by European Regional Development Fund (ERDF) for the Doctoral research programme “Retcli” agreement number: CA0023755.

Institutional Review Board Statement

This study was conducted according to the guidelines of the Declaration of Helsinki and approved by the Ethics committee of APEI Troyes (February 2021).

Informed Consent Statement

Informed consent was obtained from all subjects involved in the study and in their absence by the authorized legal representative.

Data Availability Statement

The data presented in this study are available on request from the corresponding author.

Acknowledgments

This work was conducted in collaboration with the Association of Parents of Inadapted Children (APEI) and was supported by the Regional Council of Champagne-Ardenne (CRCA) and the European Fund for Economic and Regional Development (FEDER).

Conflicts of Interest

The authors declare that they have no known competing financial interests or personal relationships that could have appeared to influence the work reported in this paper.

Abbreviations

A.P.E.IAssociation of Parents of Inadapted Children
AMVActual Mean Vote
PMVPredicted Mean Vote
aPMVAdaptive Predicted Mean Vote
BICBayesian Information Criterion
PPDPercentage People Dissatisfied
HVACHeating, Ventilation, and Air Conditioning systems
DFDegrees of Freedom
SSSum of Squares
MSMean Squares

References

  1. Rocha, A.; Pinto, D.; Ramos, N.M.; Almeida, R.M.; Barreira, E.; Simões, M.L.; Martins, J.P.; Pereira, P.F.; Sanhudo, L. A case study to improve the winter thermal comfort of an existing bus station. J. Build. Eng. 2020, 29, 101123. [Google Scholar] [CrossRef]
  2. Azizpour, F.; Moghimi, S.; Lim, C.; Mat, S.; Zaharim, A.; Sopian, K. Thermal comfort assessment in large scale hospital: Case study in Malaysia. In Proceedings of the 4th WSEAS International Conference on Energy and Development-Environment-Biomedicine, Corfu Island, Greece, July 14–16 2011; Mastorakis, N., Mladenov, V., Bojkovic, Z., Topalis, F., Psarris, K., Eds.; World Scientific and Engineering Academy and Society (WSEAS): Stevens Point, WI, USA, 2011; pp. 171–174. [Google Scholar]
  3. Dijkstra, K.; Pieterse, M.E.; Pruyn, A.T. Physical environmental stimuli that turn healthcare facilities into healing environments through psychologically mediated effects: Systematic review. J. Adv. Nurs. 2006, 56, 166–181. [Google Scholar] [CrossRef] [PubMed]
  4. ANSI/ASHRAE. Thermal Environmental Conditions for Human Occupancy Standard 55-2013; ASHRAE: Peachtree Corners, GA, USA, 2013; ISSN 1041-2336. [Google Scholar]
  5. Khodakarami, J.; Nasrollahi, N. Thermal comfort in hospitals–A literature review. Renew. Sustain. Energy Rev. 2012, 16, 4071–4077. [Google Scholar] [CrossRef]
  6. Pereira, P.F.D.C.; Broday, E.E.; Xavier, A.A.D.P. Thermal Comfort Applied in Hospital Environments: A Literature Review. Appl. Sci. 2020, 10, 7030. [Google Scholar] [CrossRef]
  7. ANSI/ASHRAE. Standard 55: 2017, Thermal Environmental Conditions for Human Occupancy; ASHRAE: Atlanta, GA, USA, 2017. [Google Scholar]
  8. ISO/TS 14415. Ergonomics of the Thermal Environment-Application of International Standards to People with Physical Disabilities; International Organization for Standardization: Geneva, Switzerland, 2005. [Google Scholar]
  9. Parsons, K. Human Thermal Environments: The Effects of Hot, Moderate, and Cold Environments on Human Health, Comfort and Performance, 2nd ed.; CRC: Boca Raton, FL, USA, 2001. [Google Scholar]
  10. Fanger, P.O. Thermal Comfort: Analysis and Applications in Environmental Engineering; Danish Technical Press: Copenhagen, Denmark, 1970. [Google Scholar]
  11. Mora, R.; Meteyer, M. Using thermal comfort models in health care settings: A review. ASHRAE Trans. 2018, 124, 11–23. [Google Scholar]
  12. Westaway, K.; Frank, O.; Husband, A.; McClure, A.; Shute, R.; Edwards, S.; Curtis, J.; Rowett, D. Medicines can affect thermoregulation and accentuate the risk of dehydration and heat-related illness during hot weather. J. Clin. Pharm. Ther. 2015, 40, 363–367. [Google Scholar] [CrossRef]
  13. de Dear, R.; Akimoto, T.; Arens, E.A.; Brager, G.; Candido, C.; Cheong, D.; Li, B.; Nishihara, N.; Sekhar, S.C.; Tanabe, S.-I.; et al. Progress in thermal comfort research over the last twenty years. Indoor Air 2013, 23, 442–461. [Google Scholar] [CrossRef]
  14. Carlucci, S.; Bai, L.; de Dear, R.; Yang, L. Review of adaptive thermal comfort models in built environmental regulatory documents. Build. Environ. 2018, 137, 73–89. [Google Scholar] [CrossRef] [Green Version]
  15. Nicol, J.F. Adaptive comfort. Build. Res. Inf. 2011, 39, 105–107. [Google Scholar] [CrossRef]
  16. Cheung, T.; Schiavon, S.; Parkinson, T.; Li, P.; Brager, G. Analysis of the accuracy on PMV–PPD model using the ASHRAE Global Thermal Comfort Database II. Build. Environ. 2019, 153, 205–217. [Google Scholar] [CrossRef] [Green Version]
  17. Kenawy, I.; Elkadi, H. The impact of cultural and climatic background on thermal sensation votes. In Proceedings of the 29th international PLEA conference, Munich, Germany, 10–12 September 2013; pp. 1–6. [Google Scholar]
  18. Pereira, P.F.; Ramos, N.M. Detection of occupant actions in buildings through change point analysis of in-situ measurements. Energy Build. 2018, 173, 365–377. [Google Scholar] [CrossRef]
  19. Pereira, P.F.; Ramos, N.M.; Almeida, R.M.; Simões, M.L. Methodology for detection of occupant actions in residential buildings using indoor environment monitoring systems. Build. Environ. 2018, 146, 107–118. [Google Scholar] [CrossRef]
  20. Verheyen, J.; Theys, N.; Allonsius, L.; Descamps, F. Thermal comfort of patients: Objective and subjective measurements in patient rooms of a Belgian healthcare facility. Build. Environ. 2011, 46, 1195–1204. [Google Scholar] [CrossRef]
  21. Sattayakorn, S.; Ichinose, M.; Sasaki, R. Clarifying thermal comfort of healthcare occupants in tropical region: A case of indoor environment in Thai hospitals. Energy Build. 2017, 149, 45–57. [Google Scholar] [CrossRef]
  22. Yau, Y.H.; Chew, B.T. Thermal comfort study of hospital workers in Malaysia. Indoor Air 2009, 19, 500–510. [Google Scholar] [CrossRef]
  23. Hashiguchi, N.; Hirakawa, M.; Tochihara, Y.; Kaji, Y.; Karaki, C. Thermal Environment and Subjective Responses of Patients and Staff in a Hospital during Winter. J. Physiol. Anthr. Appl. Hum. Sci. 2005, 24, 111–115. [Google Scholar] [CrossRef] [Green Version]
  24. Skoog, J.; Fransson, N.; Jagemar, L. Thermal environment in Swedish hospitals: Summer and winter measurements. Energy Build. 2005, 37, 872–877. [Google Scholar] [CrossRef]
  25. Hill, L.D.; Webb, L.H.; Parsons, K.C. Carers’ Views of the Thermal Comfort Requirements of People with Physical Disabilities. Proc. Hum. Factors Ergon. Soc. Annu. Meet. 2000, 44, 716–719. [Google Scholar] [CrossRef]
  26. Khodakarami, J.; Knight, I. Measured thermal comfort conditions in Iranian hospitals for patients and staff. In Proceedings of the Clima 2007 WellBeing Indoors, Helsinki, Finland, 10–14 June 2007; Seppaenen, O., Saeteri, J., Eds.; FINVAC: Helsinki, Finland, 2007. [Google Scholar]
  27. Kim, S.-K.; Hwang, Y.; Lee, Y.S.; Corser, W. Occupant Comfort and Satisfaction in Green Healthcare Environments: A Survey Study Focusing on Healthcare Staff. J. Sustain. Dev. 2015, 8, 156. [Google Scholar] [CrossRef] [Green Version]
  28. Pereira, P.F.; Ramos, N.M.M. Occupant behaviour motivations in the residential context–An investigation of variation patterns and seasonality effect. Build. Environ. 2019, 148, 535–546. [Google Scholar] [CrossRef]
  29. Walker, G.; Brown, S.; Neven, L. Thermal comfort in care homes: Vulnerability, responsibility and ‘thermal care’. Build. Res. Inf. 2016, 44, 135–146. [Google Scholar] [CrossRef] [Green Version]
  30. Ninomura, P.; Bartley, J. New ventilation guidelines for health-care facilities. ASHRAE J. 2001, 43, 29+30+32–33. [Google Scholar]
  31. Hwang, R.-L.; Lin, T.-P.; Cheng, M.-J.; Chien, J.-H. Patient thermal comfort requirement for hospital environments in Taiwan. Build. Environ. 2007, 42, 2980–2987. [Google Scholar] [CrossRef]
  32. Kameel, R.; Khalil, E. Thermal comfort vs air quality in air-conditioned healthcare applications, In Proceedings of the 36th AIAA Thermophysics Conference, Orlando, FL, USA, 23–26 June 2003.
  33. Smith, R.M.; Rae, A. Thermal comfort of patients in hospital ward areas. J. Hyg. 1977, 78, 17–26. [Google Scholar] [CrossRef] [PubMed] [Green Version]
  34. Bouzidi, Y.; El Akili, Z.; Gademer, A.; Tazi, N.; Chahboun, A. How Can We Adapt Thermal Comfort for Disabled Patients? A Case Study of French Healthcare Buildings in Summer. Energies 2021, 14, 4530. [Google Scholar] [CrossRef]
  35. Pereira, P.F.; Ramos, N.M.; Ferreira, A. Room-scale analysis of spatial and human factors affecting indoor environmental quality in Porto residential flats. Build. Environ. 2020, 186, 107376. [Google Scholar] [CrossRef]
  36. Mishra, A.K.; Ramgopal, M. Field studies on human thermal comfort—An overview. Build. Environ. 2013, 64, 94–106. [Google Scholar] [CrossRef]
  37. EN 15251. Indoor Environmental Input Parameters for Design and Assessment of Energy Performance of Buildings Addressing Indoor Air Quality, Thermal Environment, Lighting and Acoustics; BSI: London, UK, 2006. [Google Scholar]
  38. de Dear, R.J. A global database of thermal comfort field experiments. ASHRAE Trans. 1998, 104, 1141. [Google Scholar]
  39. ISO 7726. Ergonomics of the Thermal Environment–Instruments for Measuring Physical Quantities; International Standardization Organization: Geneva, Switzerland, 1998. [Google Scholar]
  40. ISO 7730. Ergonomics of Thermal Environment-Analytical Determination and Interpretation of Thermal Comfort Using Calculation of PMV and PPD Indices and Local Thermal Comfort Criteria; International Organization for Standardization: Geneva, Switzerland, 2006. [Google Scholar]
  41. Atmaca, A.B.; Zorer Gedik, G. Determination of thermal comfort of religious buildings by measurement and survey methods: Examples of mosques in a temperate-humid climate. J. Build. Eng. 2020, 30, 101246. [Google Scholar] [CrossRef]
  42. Ioannou, A.; Itard, L. In-situ and real time measurements of thermal comfort and its determinants in thirty residential dwellings in the Netherlands. Energy Build. 2017, 139, 487–505. [Google Scholar] [CrossRef]
  43. Fabbri, K.; Gaspari, J.; Vandi, L. Indoor Thermal Comfort of Pregnant Women in Hospital: A Case Study Evidence. Sustainability 2019, 11, 6664. [Google Scholar] [CrossRef] [Green Version]
  44. Zomorodian, Z.S.; Tahsildoost, M.; Hafezi, M. Thermal comfort in educational buildings: A review article. Renew. Sustain. Energy Rev. 2016, 59, 895–906. [Google Scholar] [CrossRef]
  45. Yao, R.; Li, B.; Liu, J. A theoretical adaptive model of thermal comfort–Adaptive Predicted Mean Vote (aPMV). Build. Environ. 2009, 44, 2089–2096. [Google Scholar] [CrossRef]
  46. Kim, J.T.; Lim, J.H.; Cho, S.H.; Yun, G.Y. Development of the adaptive PMV model for improving prediction performances. Energy Build. 2015, 98, 100–105. [Google Scholar] [CrossRef]
  47. Hughes, C.; Natarajan, S.; Liu, C.; Chung, W.J.; Herrera, M. Winter thermal comfort and health in the elderly. Energy Policy 2019, 134, 110954. [Google Scholar] [CrossRef]
  48. Neath, A.A.; Cavanaugh, J.E. The Bayesian information criterion: Background, derivation, and applications. Wiley Interdiscip. Rev. Comput. Stat. 2012, 4, 199–203. [Google Scholar] [CrossRef]
  49. Montgomery, D.C. Introduction to Statistical Quality Control, 3rd ed.; John Wiley & Sons: New York, NY, USA, 1996. [Google Scholar]
  50. Liu, C.; Zhou, G.; Li, H. Analysis of Thermal Environment in a Hospital Operating Room. Procedia Eng. 2015, 121, 735–742. [Google Scholar] [CrossRef] [Green Version]
Figure 1. Proposed research methodology.
Buildings 11 00551 g001
Figure 2. Surveyed buildings: (a) outside view of the medico-social buildings and (b) plan of the buildings.
Buildings 11 00551 g002
Figure 3. Survey picture.
Buildings 11 00551 g003
Figure 4. Subjective measuring tool.
Buildings 11 00551 g004
Figure 5. Thermal microclimate station.
Buildings 11 00551 g005
Figure 6. Subjective thermal sensation of patients and healthcare staff.
Buildings 11 00551 g006
Figure 7. Predicted mean vote versus operative temperature.
Buildings 11 00551 g007
Figure 8. Predicted percentage of dissatisfaction versus operative temperature.
Buildings 11 00551 g008
Figure 9. Comparison between actual mean vote (AMV) and predicted mean vote (PMV) versus operative temperature for (a) male and (b) female patients.
Buildings 11 00551 g009
Figure 10. Predicted mean vote (PMV) versus actual mean vote (AMV).
Buildings 11 00551 g010
Figure 11. Flowchart of the holistic principle underlying the adaptive model.
Buildings 11 00551 g011
Figure 12. Proportion of patients’ adaptive responses.
Buildings 11 00551 g012
Figure 14. Comparison between adaptive predicted mean vote (aPMV) and predicted mean vote (PMV) versus actual mean vote (winter).
Buildings 11 00551 g014
Figure 15. Adaptive predicted mean vote (aPMV) versus operative temperature.
Buildings 11 00551 g015
Figure 16. Predicted mean vote (PMV) versus operative temperature in each building.
Buildings 11 00551 g016
Figure 17. Predicted mean vote for patients (PMVp) and predicted mean vote (PMV) as a function of operative temperature.
Buildings 11 00551 g017
Figure 18. Residuals versus fitted values in the predicted mean vote for patients (PMVp).
Buildings 11 00551 g018
Figure 19. Normal probability plot of residuals.
Buildings 11 00551 g019
Table 1. Distribution of patients and staff in the buildings.
Building GroupNumber of PatientsNumber of Staff
1 82
2102
372
451
5102
672
Total4711
Table 2. Summary of patients’ ability to answer the questions.
GenderNumber of PatientsAble to RespondPercentage (%)
Female281760.61
Male573052.63
Total854755.29
Table 3. Physical parameters and instrument accuracy.
ParameterThermal Microclimate Station
AccuracyValid Range
Air Velocity (m/s) ±   0.20–1
±   0.31–5
Relative Humidity (%) ±   1.50–90
±   2.090–100
Temperature (°C)Class 1/3 DIN−40 to +100
Globe Temperature (°C)Class 1/3 DIN−10 to +100
Table 4. Summary of the physiological parameters of patients.
Parameter MaleFemale
MaxMinMeanSDMaxMinMeanSD
Age (years)201014.033.0419814.762.74
Weight (kg)1102045.6617.88122195123.39
Height (m)1.81.221.530.151.821.11.480.16
BMR (kcal)2312.3872.21360.6292.520801004.41350.2238.6
BMI (kg/m2)38.97 13.4319.104.9735.9214.7522.376.53
Table 5. Summary of the environmental parameters.
Parameter T a   ( ° C ) T op   ( ° C ) T rm   ( ° C ) RH (%)V (m/s)
Min19.819.5519.325.40.00
Max26.926.926.961.50.11
Mean23.3123.3523.3838.470.03
SD1.131.171.246.490.01
Table 6. Analysis of variance for physiological parameters.
Source of VariationSSDFMSF-Valuep-Value F-Crit
Age
Between groups5.8041.005.8040.5860.4484.057
Within groups446.02545.009.912
Total451.83046.00
Weight
Between groups308.6521.00308.6520.7700.3854.057
Within groups18,034.66745.00400.770
Total18,343.31946.00
Height
Between groups0.0191.000.0190.7490.3914.057
Within groups1.15345.000.026
Total1.17246.00
BMR
Between groups1173.9451.001173.9450.0160.9014.057
Within groups3,392,461.97445.0075,388.04
Total 3,393,635.919 46.00
BMI
Between groups115.6441.00115.6443.720.064.057
Within groups1399.05745.0031.090
Total1514.70146.00
where: BMR: basal metabolic rate (kcal); BMI: body mass index (kg·m−2) and F-Crit: critical value.
Publisher’s Note: MDPI stays neutral with regard to jurisdictional claims in published maps and institutional affiliations.

