Article

Understanding Architectural Designers’ Continuous Use Intention Regarding BIM Technology: A China Case

1
School of Management Engineering, Qingdao University of Technology, Qingdao 266525, China
2
School of Design and the Built Environment, University of Canberra, Canberra 2601, Australia
3
Qingdao Tengyuan Design Institute Co., Ltd., Qingdao 266000, China
4
School of Civil and Hydraulic Engineering, Huazhong University of Science and Technology, Wuhan 430074, China
5
School of Economics and Management, Tongji University, Shanghai 200092, China
*
Author to whom correspondence should be addressed.
Buildings 2021, 11(10), 448; https://doi.org/10.3390/buildings11100448
Submission received: 23 August 2021 / Revised: 23 September 2021 / Accepted: 25 September 2021 / Published: 30 September 2021
(This article belongs to the Section Construction Management, and Computers & Digitization)

Abstract

:
Despite BIM technology influencing architectural design companies profoundly, there has still been an under-representation of architectural designers’ continuous use intention (CUI) regarding it. This paper aims to empirically examine what factors can potentially affect architectural designers’ CUI of BIM through the integration of a technology acceptance model (TAM) and an expectation confirmation theory (ECT). Sample data for empirical research were collected from architectural design companies in Qingdao, China. A total of 207 valid questionnaires were analyzed by using a structural equation modeling method. The findings show that the proposed theoretical model has good explanatory abilities for architectural designers’ CUI. Perceived ease of use and satisfaction significantly and directly affect CUI, whereas perceived usefulness and conformation have an indirect influence on CUI via satisfaction. This study contributes to a deepened understanding of architectural designers’ CUI regarding BIM. In order to further promote continuous use practices of BIM, valuable insights are provided for designers, companies, and software developers.

1. Introduction

The concept of building information modeling (BIM) can be traced back to the building description system proposed in the 1970s, which can be used to simulate buildings intelligently [1]. After the concepts of the building product model, the building information model, and building modeling [2], BIM started being used in construction industry projects from the mid-2000s [3]. As one of the most promising and emerging technologies [4], BIM technology has been widely used not only in the construction industry but also in the project life cycle. Among all the stages of the project life cycle, BIM is most often applied in the design phase [5] and is emerging as an effective tool for promoting design processes [6].
Although the benefits of BIM technology use in design processes have been identified [6], there are still diverse issues hindering its continuous use in the design phase. The architectural design company, a major stakeholder in the design phase, can not only benefit from using BIM technology, but also further promote its competitiveness by the continuous use of BIM technology. However, the company still faces many influencing factors concerning the continuous use of BIM, which in turn impacts its competitive advantages and performance [7]. In addition to the fit between BIM technology and the architectural designer’s competence [7], these factors also include resistance to change regarding the use of BIM [8] and lack of personal motivation to use BIM continuously [9]. The architectural designers in the companies are the main users of BIM [9,10], and their behavior of using BIM is determined by their intention according to the TAM [6,11]. Furthermore, for the construction industry and companies, the continuous use of BIM technology is more important than initial adoption [12]. However, studies on promoting the continuous use of BIM technology in the construction industry, especially from the architectural designer’s perspective, are still lacking.
Thus, the purposes of the paper are presented as follows. First, this study proposes a theoretical model that integrates the TAM and ECT, and verifies their appropriateness in investigating the CUI of BIM. Second, because BIM technology is applied frequently in the design stage, this research explores the CUI of BIM, and fills a gap from the perspective of architectural designers, who are the main users. Third, this research indicates the factors that influence the architectural designers’ CUI of BIM. The findings and implications obtained from the empirical study can further prompt the continuous use of BIM, and might offer helpful insights for other research fields.
The remainder of this work is organized into four sections. Section 2 conducts the literature review and proposes a theoretical model, followed by hypothesis development. Section 3 presents the research methodology. Section 4 discusses the findings on the basis of data analysis and survey results. Section 5 draws the conclusion, and summarizes the contributions and limitations of this research.

2. Literature Review

2.1. BIM Technology Use in Architectural Design Companies

As an innovative technology that emphasizes parametric expression and integrated management of relevant information of all stages and organizations in the whole life cycle of a construction project, BIM is defined as a modeling technology and associated set of processes to create, exchange, and analyze building models [13]. It can be acknowledged as a type of information technology by the majority of the architecture, engineering, and construction (AEC) industry [14]. It has not only brought changes to the AEC industry, but also influenced different firms in the industry [15]. The technology has been widely regarded as a promising method for solving fundamental problems of industrial production characteristics and improving the performance of the construction project [16]. The use of BIM technology in construction projects generates positive effects on the projects’ performance [17], such as accurate cost estimation [18], quality improvement, and construction cost reduction, which can all benefit from BIM technology application in building projects [19]. This technology not only has a profound influence on the traditional construction industry [20] but also has advantages over the whole building lifecycle, especially in the architectural design phase [7].
Architectural design companies have been profoundly influenced by adopting BIM. As an extension of computer-aided design [10], BIM can not only influence traditional design processes [6] and improve the design quality [21], but also change the design pattern and the way designers work and collaborate because of the information shared [22]; in turn, these changes result in competitive pressures among the companies [7] and the designers [23]. Although the use of BIM has improved design quality in terms of increased efficiency and accuracy, error reduction, better performance, and automatic document generation [24], the tendency to resist the changes of using BIM still exists [8]. Particularly, more experienced designers who are used to 2D drafting design often resist the use of BIM, and some designers perhaps underestimate the benefits of BIM and thus refuse to use it [25].
To improve the benefits of using BIM for architectural design companies, many researchers have investigated BIM use behavior and its influencing factors. For example, Gokuc and Arditib [7] investigated the influencing factors on adopting BIM in architectural design firms and reported that the fit between BIM and design tasks was more likely to affect the design firm’s performance than the fit between BIM and organizational competence. Son et al. [6] examined the factors that could drive architects’ adoption of BIM in design organizations, and found that factors such as top management support, subjective norms, and computer self-efficacy were critical in influencing their behavioral intention. In a survey conducted in Shenzhen City, China, Ding et al. [9] identified the key factors that influenced the architects’ BIM adoption in A-level architectural design firms, and demonstrated that motivation, BIM capability, and technical defects significantly affected the architects’ behavior intention to use BIM. Moreover, the designers with high motivation and BIM capability were more likely to use BIM. Although many studies aim to facilitate the usage of BIM and obtain the remarkable benefits of BIM, empirical evidence for the factors that drive architectural designers’ CUI of BIM is still lacking.

2.2. Theoretical Basis

As depicted in many theories related to individual behavior, such as the theory of rational behavior and TAM, a person’s behavioral intention is the major determinant of his or her usage behavior [26]. As such, Bhattacherjee [27] argued that the continued use of information technologies contributed to the final success of their adoption. Similar to other information technologies and systems, the successful promotion and application of BIM require the continuous usage of users. For architectural designers, the CUI of BIM is also a crucial premise of their continuous behavior.
Based on the TRA, the TAM has absorbed a series of theories related to behavior and expectation to study the user’s behavior of accepting information technology and systems [11]. The TAM consists of four constructs, including user behavior, behavioral intention (BI), perceived usefulness (PU), and perceived ease of use (PEU) [28]. In this model, a person’s BI is determined by his or her PU and PEU, and PEU is assumed to have a positive and direct effect on PU [28]. As a classical model for explaining the factors that influence the acceptance of computer systems, the TAM also stands out as an effective model for studying individual usage behavior [29]. It is widely used not only to explain the individual behavior of adopting and using information technologies or systems, but also to study their continuous use behavior [30,31,32]. Recently, studies have begun to apply the TAM to explain BIM use intention. Park et al. applied the TAM to investigate the factors that determined the on-site construction managers’ intention to use BIM technology [4]. Qin et al. [33] also employed the TAM to explore the factors which influenced the intention of using BIM in the construction industry by integrating the technology–organization–environment framework. Nevertheless, encouraging the continuous use of BIM technology by adopting the TAM needs further study.
The ECT proposed by Oliver was initially applied to study consumers’ repeated purchase of products [34]. This theory determines whether consumers are satisfied or not by comparing their initial expectations about products or services based on their perceived performance after using or consuming them. Thus, a person’s satisfaction becomes a determinate variable that influences the intention of his or her repurchasing behavior [35]. Bhattacherjee [27] further extended the ECT to the context of continuous use of information systems, and developed the expectation confirmation model of information system continuance (ECM-ISC), which consisted of four constructs, namely PU, confirmation (CF), satisfaction (ST), and information system’s continuance intention. Since the ECT and ECM-ISC were proposed, they have been widely applied in the studies of continuance intention to use information technologies or systems in different fields. However, the ECT has not been utilized in architectural designers’ continuous use intention of BIM technology.

2.3. Research Model and Hypotheses Development

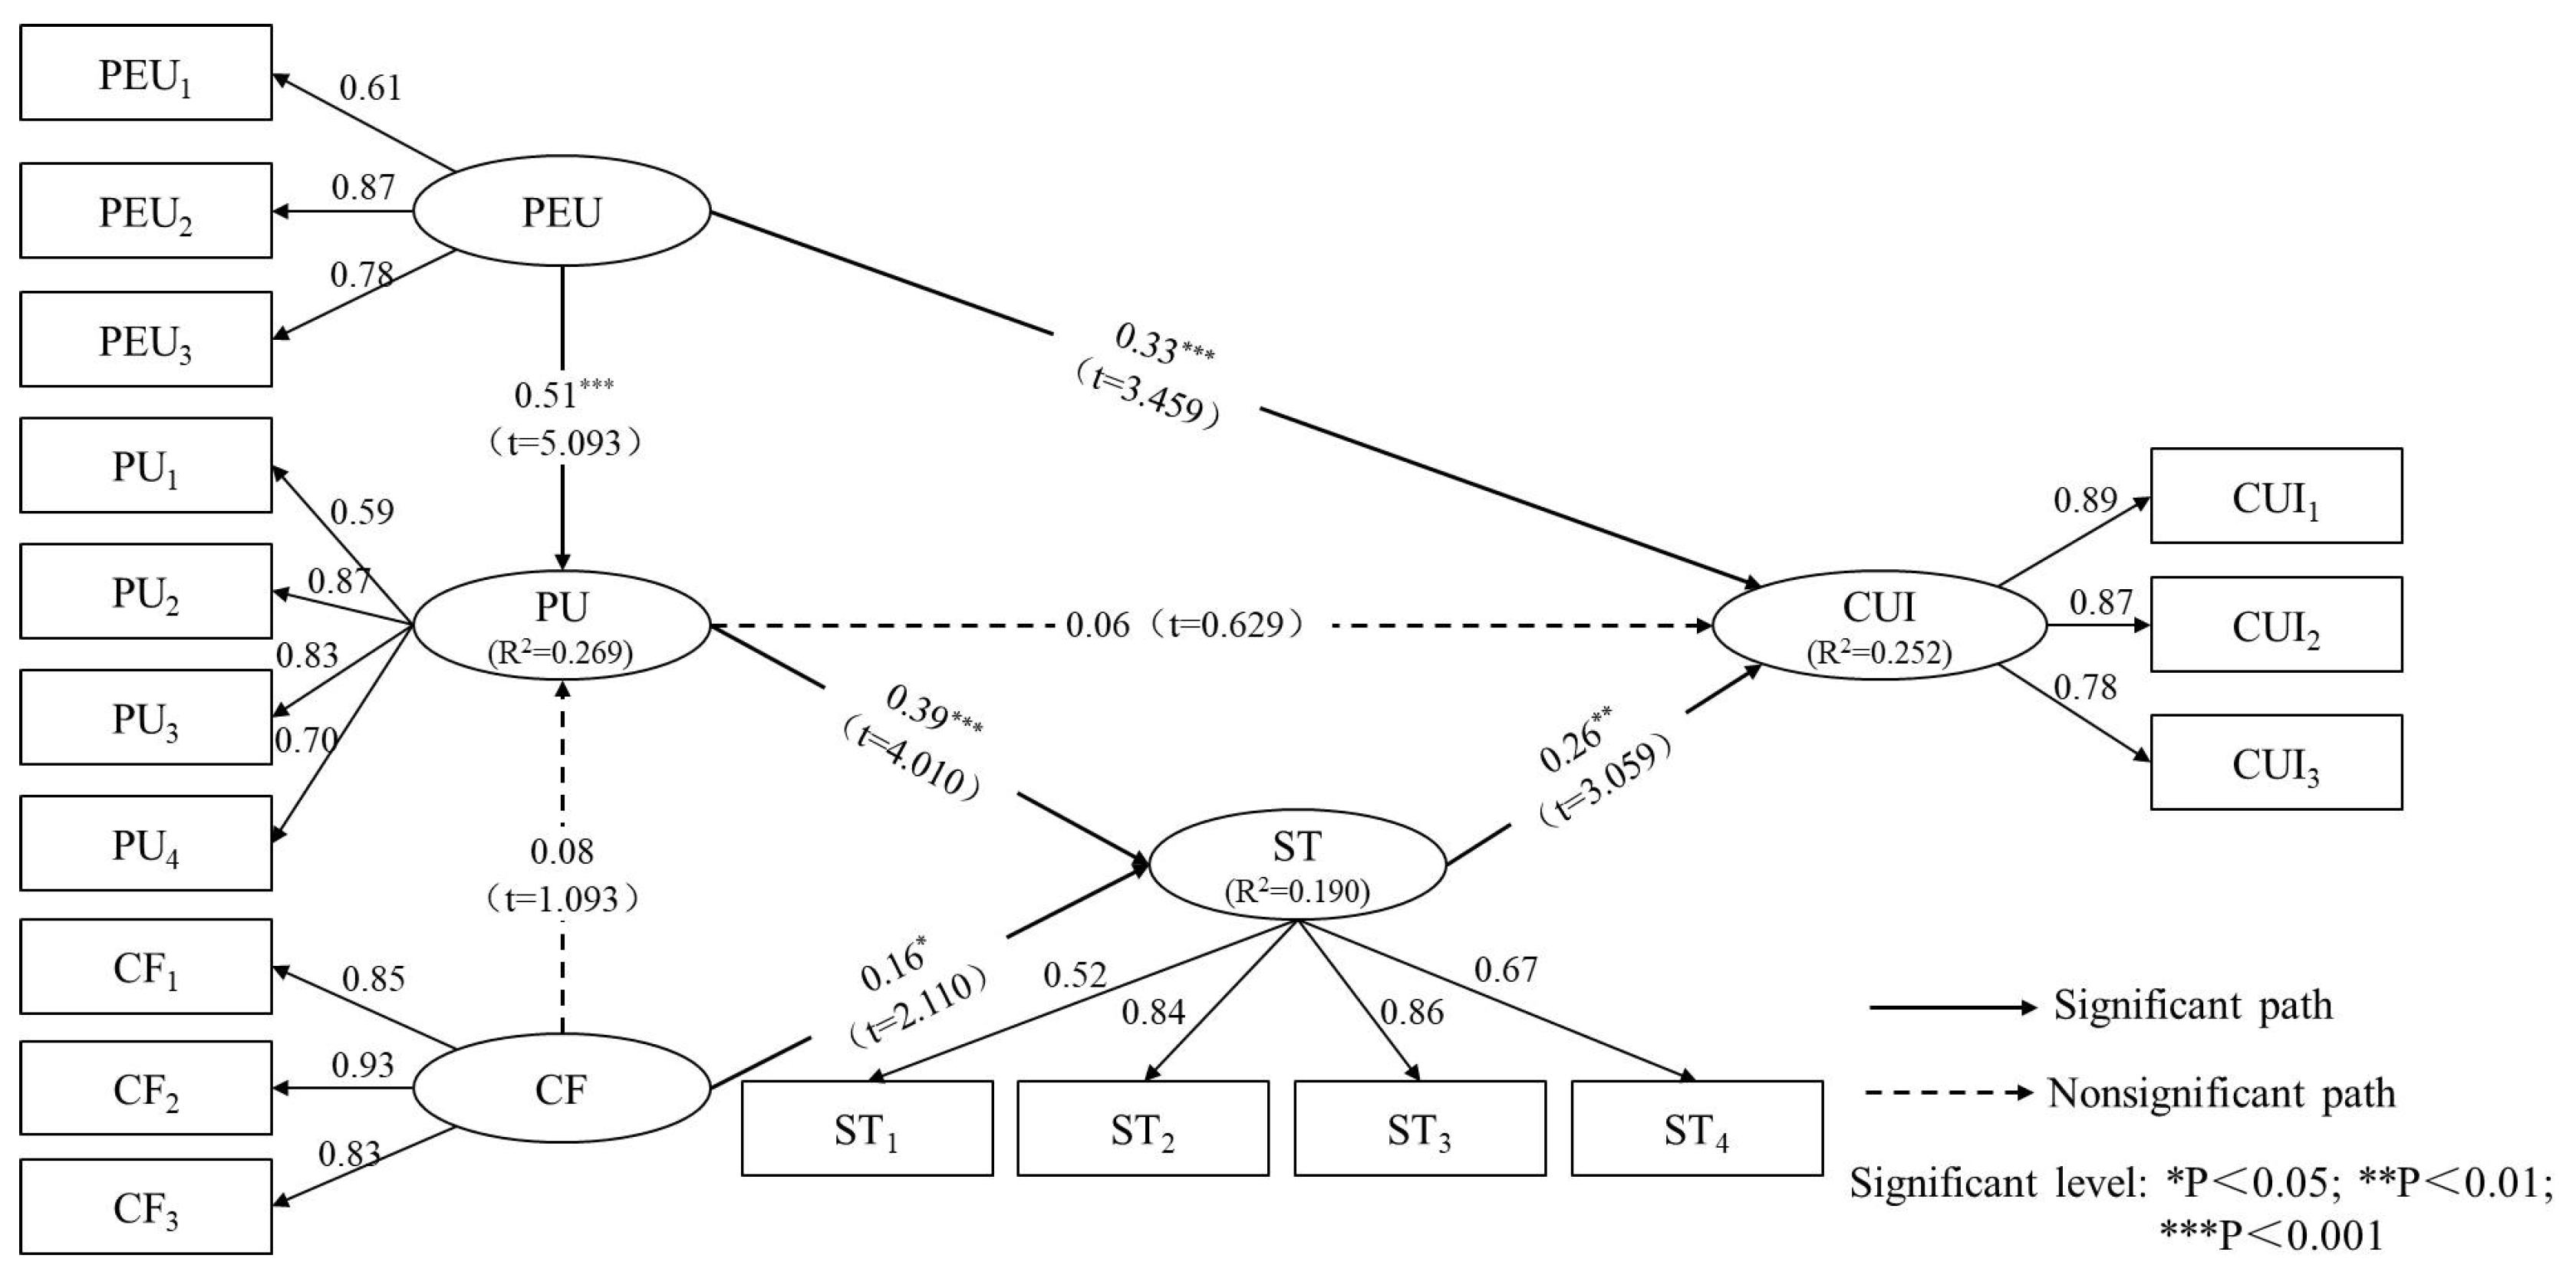
As a disruptively innovative technology applied in the AEC industry, BIM has a profound influence on architectural design companies. This research on architectural designers’ CUI is helpful to improve the benefits from the continuous use of BIM in the companies and further promote the sustainable development of the industry. Based on the TAM, ECM-ISC, and related BIM research, a conceptual model of the CUI of BIM is depicted in Figure 1. In the model, PEU and CF affect PU; PU and CF influence ST; and PEU, PU, and ST influence the architectural designer’s CUI of BIM.
According to the TAM [11], ECT [34], and ECM-ISC [27], the designer’s PEU relates to the degree to which a designer believes that the use of BIM can be effortless; CF refers to the designer’s perception of dissonance between the expectation of BIM and its actual application; and PU relates to the perception of benefits and performance improvement of using BIM. According to the TAM, PEU has a positive impact on PU [26]. The relationship between PEU and PU has also been proven in many previous continuous use studies, such as with users’ intention to continue using a fitness app [36], students’ continuance intention to use K-MOOCs [37], and end users’ continuance intention to use cloud ERP [38]. In the BIM acceptance model [39], the PEU of BIM also has a positive impact on PU. Based on 114 sample data, Lee et al. [39] verified that the higher BIM ease of use the users could perceive, the stronger a perception of usefulness they felt. Yuan et al. [40] conducted empirical research on owners’ BIM adoption behavior, and the result showed that the PEU had a significant and positive impact on the PU of BIM. Therefore, the more designers can perceive the ease of use of BIM, the higher the probability they can perceive its usefulness. We posit that:
Hypothesis 1 (H1). 
The designer’s PEU is positively associated with the PU of BIM.
In this paper, the CF is used as an antecedent variable to explain the architectural designer’s PU. The CF has a positive effect on PU, which has been proven in the ECT [34] and ECM-ISC [27]. In addition, many previous studies have confirmed that the CF has a positive effect on the PU, such as those on users’ continued usage behavior of information technology [41], students’ continuance intention to use electronic textbooks [42], and users’ continuous use of mobile banking [43]. Moreover, Ma et al. [14] confirmed that the CF had a significant positive impact on the PU of BIM. Thus, the more BIM expectations can be confirmed by the designers, the higher probability they can perceive its usefulness. We posit that:
Hypothesis 2 (H2). 
The designer’s CF is positively associated with the PU of BIM.
According to the ECT, PU has a positive effect on the ST of designers, which refers to the feelings about prior usage of BIM [34]. This conclusion has also been verified in many previous studies, such as those on users’ continuance intention to e-learning [44], users’ continuous usage of smartphone banking services [45], and customers’ continuous usage of online product recommendations [46]. As for BIM, the higher PU users can feel, the more likely it is to meet the users’ needs and bring a higher degree of ST. In addition, Ma et al. [14] also found that high PU increased the ST degree. Therefore, the stronger tendencies to PU of BIM the designers have, the higher degree of ST they can feel. On this basis, we posit that:
Hypothesis 3 (H3). 
The designer’s PU of BIM is positively associated with ST.
According to the ECT, the ST is determined by the user’s prior expectation and expectation confirmation, and the CF has a positive effect on the ST [34]. Previous studies have proven the relationship between the CF and ST in terms of continuous usage of information technologies and systems, such as group-buying websites [47], online library resources [48], and mobile applications [49]. Therefore, the more BIM expectations can be confirmed by the designers, the more satisfied they can feel. On this basis, we hypothesize that:
Hypothesis 4 (H4). 
The designer’s CF of BIM is positively associated with the ST.
A designer’s CUI refers to his or her intention to continue using BIM [27]. According to the TAM, the PEU has a positive effect on the CUI [11]. This conclusion has also been proven in previous studies, such as those on users’ continued usage intention of a web-enabled phone service [50], mobile Internet users’ continued usage behavior [30], and user’s continuous adoption of WeChat mobile payment [51]. In addition, Son et al. [6] found that PEU could have a positive impact on the intention of adopting BIM in design organizations. Thus, the more ease of using BIM the designers can perceive, the stronger intention to continue using it they will have. We hypothesize that:
Hypothesis 5 (H5). 
The designer’s PEU is positively associated with the CUI of BIM.
According to the ECM-ISC, the PU has a positive effect on the CUI of information systems [27]. The relationship between PU and CUI has been proven in previous studies, such as those on the continued usage of public e-services [52], continued intention of using electronic textbooks [53], and continuance intentions with online learning applications [54]. The more usefulness of BIM the users can perceive, the stronger intention they will have to continue using it. Lee et al. [39] also found that the stronger PU of BIM users felt, the more positive adoption intention they would have. This conclusion can also theoretically support the hypothesis that the PU is a positively influencing variable of the intention to continue using BIM. Thus, we hypothesize that:
Hypothesis 6 (H6). 
The designer’s PU of BIM is positively associated with the CUI.
According to the ECT, the ST, which also has a positive effect on the intention of continuous use [27], can be regarded as an additive combination of the user’s previous expectation and resulting disconfirmation [34]. Bhattacherjee [27] believed that the continuous use of information systems was similar to the repurchase behavior of customers, and the positive effect of ST on continuance intention was tested empirically by using data collected from online brokerage users. As a significant factor of continuous use, the ST’s positive influence on CUI has also been proven in many prior studies, such as the users’ continued intention of e-learning [55], continuance usage intention of ubiquitous media systems [56], and students’ intention to continue using the university communication model [57]. With regard to BIM, the higher ST users feel, the stronger CUI they will have. Wang and Song [58] believed that BIM users’ ST could be regarded as an important factor that led to its successful usage and positively affected the CUI after its initial adoption. Therefore, the more satisfied the designers are with BIM usage, the more likely they are to continue using it. Based on the aforementioned analysis, we hypothesize that:
Hypothesis 7 (H7). 
The designer’s ST of BIM is positively associated with the CUI.

3. Methodology

3.1. Survey Design

The survey design was conducted based on the conceptual model presented in Figure 1. All measurements were employed from prior studies and have been validated previously. Minor corrections have been made to confirm the items, which could be understood concerning continuous usage of BIM. In order to ensure the items were easily understood, the questionnaire was further modified according to the comments from four related experts in China. All of them have at least 10 years of experience in BIM. Two of them are from academia in the construction management field. The other two experts are from architectural design companies, wherein one is an architect and the other one is a BIM consultant. Before the formal data collection, a pretest of 40 designers was undertaken to evaluate and improve the understandability of the survey design. Furthermore, an exploratory factor analysis (EFA) with the principal component method was performed for the data collected from the pretest. The analysis results show that the loadings of all the items on their underlying constructs are all greater than 0.50 [59]. As such, the percentages of variation explained by PU, CUI, CF, ST, and PEU are 36.195%, 19.026%, 1.438%, 10.245%, and 6.966%, respectively. The cumulative percentage of variation is 83.870%.
Similar to the measurement of CUI and its influencing variables in prior studies [37,54,57], the measurement of CUI regarding BIM and the other four constructs were rated by a five-point Likert scale. Specifically, PEU, PU, CF, ST, and CUI are all assessed by the scale (1 = strongly disagree, 2 = somewhat disagree, 3 = neither, 4 = somewhat agree, 5 = strongly agree). Table 1 presents the items that measure the CUI concerning BIM and their references.

3.2. Data Collection

Shandong Province is the third largest economic province in China, with a gross domestic product of about 7312.90 billion yuan in 2020. The gross value of construction enterprises was 1494.73 billion yuan in 2020, the rate of which increased by 4.8% over the last year. There were 8081 construction enterprises with general contracting and professional contracting qualifications, the number of which increased by 782 over 2019. Since 2017, Shandong Province has carried out the pilot application of BIM technology in government-invested projects, such as indemnificatory housing, green buildings, schools, hospitals, and other public buildings, and given appropriate encouragement policies. In order to promote wide application in the areas of prefabricated buildings, green buildings, and smart buildings, Shandong Province has continuously focused on the improvement of research and development regarding BIM technology. In addition to strengthening policy guidance, Shandong Province has developed a standard system, and paid attention to enterprises as the main body and market-oriented circumstances. Besides, Shandong Province has also urged architectural design companies to improve their BIM technology application ability and submit design results based on BIM technology. In 2018, the Shandong Province government issued a notice on the “Special Plan for the New Generation of Information Technology Industry in Shandong Province (2018–2022)”, including BIM technology in the plan. In 2019, The Housing and Urban-Rural Development Department of Shandong Province issued the “Management Rules of Shandong Building Information Modeling (BIM) Technology Application Pilot and Demonstration Project”. As an economically developed coastal province, Shandong Province takes a leading position in the adoption and promotion of BIM technology in China.
As the largest city in Shandong Province and the third-largest city in North China, Qingdao achieved a total output value of the construction industry of 280.99 billion yuan in 2019, thereby accounting for 23.93% of the annual gross domestic product (1174.13 billion yuan). In addition to 272 architectural design companies in Qingdao, 18 projects were selected as the first batch of pilot demonstration projects of BIM application in Shandong Province in 2017, and 14 projects were qualified for acceptance in 2019. Given the relatively large number of architectural design companies and its leading position in BIM application, the questionnaire survey was conducted to collect data in Qingdao. To ensure the quality of the data, the target respondents were identified as designers who have worked at least five years in architectural design companies and been directly involved in BIM usage. Accordingly, Qingdao is representative in China when it comes to the application of BIM in architectural design companies.
The data collection was carried out from November 2019 to July 2020, and the questionnaires were distributed by using a combination of offline and online means. The snowball sampling method was applied during the questionnaire survey. A total of 150 printed questionnaires were delivered on the spot, and 130 were delivered by online survey platform and e-mail. A total of 235 questionnaires, including 133 paper questionnaires and 102 online ones, were obtained. After deleting the questionnaires with the same or incomplete answers, 207 valid questionnaires were finally obtained for further analysis. The profiles of the respondents are represented in Table 2.
Of these responses, 86 respondents (41.55%) were generally familiar with BIM technology, 102 respondents (49.28%) were quite familiar, and the rest (9.18%) were very familiar with the technology. Considering that the data was all collected by the questionnaire survey, this instance might cause a common method bias problem. Harman’s single-factor approach was conducted to test the degree of common method bias [64]. Consequently, the variance explained by the largest factor was only 31.05%, thereby indicating that the common method variance did not seriously affect the data analysis.

3.3. Methods

The test method for normality used in the reference [65] was used to assess whether the data were normally distributed or not. It was also available in many statistical software packages. The test results were calculated by using the statistical software SPSS 22.0, indicating that the sample data of this study showed a normal distribution.
The structural equation modeling (SEM) method was applied to analyze the data by a two-stage approach [66]. Before testing the research hypotheses, the confirmatory factor analysis (CFA) was firstly conducted to exam the reliability, convergent validity, and discriminant validity of the constructs. Then, the SEM method, as a viable multivariate tool [67], was used to evaluate each of the hypotheses in this study. In addition, the size of the valid sample in this paper was 207, which was beyond the recommendation of 200 samples [4].

4. Data Analyses and Results

4.1. Reliability and Validity Test

The Cronbach’s alpha coefficient was used to examine the reliability of each construct with SPSS 22.0. The results shown in Table 3 indicated that all of the constructs’ coefficients were greater than the threshold of 0.70 [6,68]. The coefficients for PEU, PU, CF, ST, and CUI were acceptable, which were 0.790, 0.834, 0.806, 0.887, and 0.902, respectively, indicating good reliability.
The validity of the measurement model was tested by the confirmatory factor analysis, which included convergent and discriminant validity coefficients. The first evidence of convergent validity was obtained by the values of composite reliability (CR) in Table 3, all of which were above the recommended threshold of 0.70 [3] and ranged from 0.80 to 0.90. Table 4 also shows that the average variance extracted (AVE) of each construct ranged from 0.54 to 0.76 and exceeded the threshold of 0.50 [69]. Further evidence was provided by the standardized factor loadings (SFL) of the items, which were highly significant (p < 0.001), showing convergent validity [70].
The results of the discriminant validity test are shown in Table 5. These results were assessed by comparing each construct’s square root of the AVE with the correlations between this construct and all other constructs. The bold numbers on the diagonal of the correlation matrix, ranging from 0.736 to 0.871, were the square root of the AVE, and the other values were the correlations between the constructs. The square roots of all the AVE were greater than the off-diagonal correlations, indicating sufficient discriminant validity [71]. Five fit indices and their thresholds were used to test the model fit, namely the chi-square test (χ2/degree of freedom) < 3.0 [70], the comparative fit index (CFI) ≥ 0.90 [70], the goodness of fit index (GFI) ≥ 0.90 [9], the Tucker Lewis index (TLI) ≥ 0.90 [70], and the root mean square error of approximation (RMSEA) < 0.10 [8]. The CFA results indicated that the indices of χ2/degree of freedom = 152.261/109 = 1.397, CFI = 0.975, GFI = 0.925, TLI = 0.969, and RMSEA = 0.044, which met a satisfactory model fit [72].

4.2. Hypothesis Testing

Before testing the research hypotheses, the SEM method was used to examine the fit between the conceptual model and the valid data. The fit of the model was also evaluated by using five indices, namely χ2/degree of freedom = 160.193/112 = 1.430, CFI = 0.973, GFI = 0.922, TFI = 0.967, and RMSEA = 0.046, all of which satisfied the recommended thresholds. Overall, the goodness-of-fit indices suggested a well-fitting model.
Then, the research hypotheses were tested with the software AMOS 22.0. Table 6 provides the test results, including the standardized coefficient (β-value), the critical ratio (t-value), and the p-values. Five of seven hypotheses were supported. The influence of PEU on PU was positive and significant (β = 0.513, t = 5.093, p < 0.001), thereby suggesting that H1 was supported. Furthermore, the path from PU to ST was also significant (β = 0.394, t = 4.010, p < 0.001), thereby supporting H3. In addition, the PEU-CUI path was likewise significant (β = 0.334, t = 3.459, p < 0.001). Hence, H5 was supported. The CF-ST path was significant (β = 0.159, t = 2.110) at p < 0.05, and the ST-CUI path was significant (β = 0.263, t = 3.059) at p < 0.01, indicating that both H4 and H7 were supported. However, the CF-PU path was not proven to be significant (β = 0.077, t = 1.093, p > 0.05), indicating that H2 was not supported. In addition, the PU-CUI path was not significant either (β = 0.058, t = 0.629, p > 0.05), thereby refuting H6.
The explanatory ability of the model was shown by the determinant coefficients R2. An R2 value above 0.20 is considered to have good explanatory power [73]. Figure 2 shows that R2 values of PU, ST, and CUI were 0.269, 0.190, and 0.252, respectively. Although the R2 value of ST was slightly lower than the recommended threshold, it was close enough to show good predictive ability. Therefore, the findings suggested that the variables explained 26.9% of PU, 19.0% of ST, and 25.2% of CUI’s variance.

4.3. Discussion

This article tested the influence of factors such as PEU, PU, and ST, on the CUI of BIM technology. A theoretical model predicting the architectural designers’ CUI of BIM was developed. As seen in Figure 2, five of seven hypotheses were supported. The results reported that the relationship between PEU and PU (H1) was significantly supported. This finding confirmed many previous studies that the PEU was positively associated with the PU of BIM [4,40]. It is also approved by Wang and Song [58], who found when users perceived BIM as easier to use than others (PEU), they would perceive it as more useful (PU). Accordingly, the more easily the designers perceive using BIM, the more likely they would be to perceive its usefulness. However, regarding H2, the influence of CF on PU was not statistically significant. This finding was different from some previous studies, such as Lee [44], who suggested that the user’s confirmation of exceptions was positively associated with their PU of e-learning. Furthermore, Ma et al. [14] confirmed that the CF of BIM users in Chinese construction organizations had a positive and significant influence on their PU of BIM post-adoption. In other words, the finding was determined that the PU was not significantly influenced by CF in the context of BIM continuous use. Such a non-significant effect of architectural designers’ CF on PU was possibly caused by a deeper and better understanding of BIM, and their more rational expectation confirmation. A closer look at the average value of the CF, which was relatively low (mean = 3.85), made the result understandable. In addition to the delivery and verification of construction drawings, another reason is probably connected with inadequate combination of current design process and BIM. The inadequate combination therefore influences architectural designers’ conformation after post-use of BIM, which in turn reduces the effect of CF on PU. Besides, architectural design with BIM technology requires a considerable amount of cost, which requires additional agreements in the contract and lacks incentives for the designers.
Moreover, the PU had a positive and significant effect on the architectural designers’ ST of BIM (H3). This finding was also proven by Wang and Song [58], reporting that the PU had a significant effect on BIM user’s ST. In other words, if the designers perceived BIM as useful, in terms of improving their work performance, increasing their work productivity, and enhancing their work effectiveness, then they would feel more satisfied. It was also revealed by Ma et al. [14] that the more usefulness the users could perceive, the higher satisfaction they would have of BIM. Compared with PU, the CF had a weaker but still significant influence on ST (H4). The finding was contrary to the previous study of Bhattacherjee [27], who believed that the CF was a stronger predictor of users’ ST than PU. In other words, the CF had a weaker influence on the designers’ ST in the context of BIM continuous use. However, the significant influence of CF on ST was also proven by Ma et al. [14], who suggested that the BIM users’ CF was positively associated with their ST. The CF was a new construct and a significant predictor of the ST in BIM continuous use research. Therefore, it was necessary to suggest that the CF of expectations in using BIM continuously would increase the designers’ ST.
The empirical results also proved that the PEU and ST were essential factors in promoting the CUI of BIM (H5 and H7). In addition, the ST was a weaker predictor of the CUI than PEOU. The PEU positively and significantly influenced the designers’ CUI of BIM (H5). The result suggested that the PEU was a major predictor of the designers’ CUI in the context of BIM. This finding likewise indicated that improved PEU could enhance the designers’ CUI of BIM. The positive influence of the PEU on the intention to continuously use BIM was in parallel with prior studies [6,40]. Park et al. [4] also indicated that the PEU was an essential antecedent of BIM use intention. Therefore, the finding suggested that if the designers perceived BIM as easy to use, they would probably have the CUI of BIM. Compared with PEU, the ST was less influential to the designers’ CUI of BIM. However, this research provided evidence for its positive and significant effect on CUI (H7). The result showed that the ST was a necessary determinant to explain the CUI of BIM after the designer’s initial adoption. In other words, if the designers are dissatisfied with BIM use, they may discontinue using it. The finding indicated that increased satisfaction could facilitate the designer’s CUI in the context of BIM. This finding was also in line with the previous study conducted by He et al. [74], who indicated that users’ satisfaction had a significant and positive influence on the CUI of BIM technology. Hence, it can be inferred that if the designers felt more satisfied with BIM, they would be more likely to continue using it.
The designer’s PU did not have a significant effect on the CUI of BIM (H6), contrary to the assumption of the TAM [11]. In other words, it was suggested that the PU was not a significant determinant of CUI in the context of BIM. The result was conceivable that, for the designers who might have already been familiar with the features and functions of BIM, the PU was not a necessary predictor for the CUI. This finding was not an expected one, and contrasted with the findings by He et al. [74], who claimed that the PEU had a crucial effect on the CUI of BIM in the China AEC industry. Chen and Zhang [12] also examined the significant and positive influence of PU on CUI toward BIM in China’s construction enterprises. In this study, the non-significant influence of PU on CUI might be related to the designer’s cognitive level of PU. With the gradual understanding and use of BIM, the cognitive levels of the designers were increasing, and the influence of the PU on CUI was gradually weakened. The continuous use of BIM technology by designers needs to be fully combined with their practical design processes and coordination, which can better solve practical problems, accomplish cooperative design, and increase intention to use BIM continuously. Compared with the cognitive belief, the practical combination of design tasks, processes, and BIM is more likely to promote CUI of BIM technology from the perspective of architectural designers. Therefore, these are probable reasons that CUI is not significantly influenced by PU in the context of BIM technology.

5. Conclusions

BIM use in the whole project life cycle, especially in the design stage, has a significant role in promoting the development of the AEC industry. As a major stakeholder in the design phase, the architectural design company can further promote its competitive advantages and sustainable development with the continuous use of BIM. In particular, the continuous use of BIM by the designers is expected to achieve sustainable development of the company. Although BIM has profound influences on architectural design companies, studies on the continuous use of BIM from the architectural designer’s perspective are still lacking. To move forward on this issue, this research attempted to explain the designers’ CUI of BIM, and then investigated the determinants influencing the CUI based on the combination of the TAM and ECT. An empirical study on understanding the designers’ CUI of BIM was conducted by using an SEM method. This research focused on BIM continuous use and provided evidence regarding what affected the designers’ CUI of BIM.

5.1. Theoretical Contributions

From the perspectives of the TAM and ECT, this study expanded and empirically validated their applicability in the context of BIM continuous use. As confirmed in the original TAM, the PEU positively influenced the CUI in the context of BIM. In addition, the results also revealed that both PU and CF had positive effects on the designers’ ST of BIM, and the designer’s ST was positively associated with the CUI of BIM, all of which were parallel with the original ECT. Through integrating the TAM with ECT, the research model was developed to understand what determinant factors could influence the designers’ CUI of BIM. In other words, the model provided insights regarding the reasons behind the designers’ intention to continuously use BIM. Additionally, the results contributed to further studies on persons’ CUI of other information technologies and systems.

5.2. Practical Implications

The empirical results of this research have some practical implications. First, from an individual perspective, the PEU and ST had positive and direct effects on the designers’ CUI of BIM. Accordingly, the PEU and ST were crucial if BIM was to be adopted and used continuously by the employees in architectural design companies. Therefore, special design process reengineering with BIM might need to be carried out to enhance the designers’ PEU by reducing their resistance to BIM, decreasing their dependence on traditional 2D design software, and paying more attention to their long-term career development. In order to improve their ST of BIM, the designers should improve their ability to use BIM and form continuous use habits through active and sustainable learning. Second, from an organizational perspective, the companies shall provide organizational supports. If they would like to enhance the designers’ PEU and ST, the companies should establish a matched culture and atmosphere, such as a collaborative design and information-sharing environment. Moreover, special training related to BIM by means of case analysis, on-site demonstration, and experience sharing combined with the companies’ business processes could enhance the designers’ knowledge, capacity, productivity, and satisfaction. Third, from a technological perspective, the results indicated that the PEU was a determinant factor influencing the PU and CUI in the context of BIM continuous use. In other words, enhancing PEU could be beneficial to increase the designers’ PU and CUI. As such, the more ease of use of BIM the designers can perceive, the more likely they can perceive its usefulness and feel satisfied with it. Finally, software development companies could be inspired by the research results to better consider software functions from the ease-of-use and convenience perspectives.

5.3. Implications for other Regions and Countries

Based on the empirical data of Qingdao City, Shandong Province, the research findings of this paper can provide a framework to deepen understanding of continuous use of BIM technology and increase the chances of successful promotion and continuous use of BIM for other provinces in China. The region has provided external policy circumstances and guiding requirements for the promotion and application of BIM. One of the main patterns is to publicize the policies, standards, and application situation. The active publicity of the significance and effect of BIM is beneficial to summarizing the successful experience of BIM application in time. Another pattern concerns supporting and stimulating policies that can give extra evaluation points for the architectural design companies that have applied BIM technology in the design stage. The third pattern relates to BIM training for architectural designers, which becomes an important part of their professional qualifications. Nevertheless, the continuous use of BIM technology cannot be conducted without the practical application of architectural designers. From the individual perspective of architectural designers, the results of this paper indicate that the CUI is positively affected by the PEU and ST. These findings also help other regions fully consider the influence of the PEU and ST in the application and continuous use of BIM. The patterns and findings with regional characteristics are not only of benefit to the continuous use of BIM in Shandong Province, but also provide helpful advice for other regions, or even the whole nation.
Moreover, this article is conducted in the context of China, which is an important emerging market and the largest developing country. Hence, the findings can provide useful recommendations applied to promote the adoption and continuous use of BIM technology for other emerging markets and developing countries. This paper is also helpful to conduct comparative studies regarding continuous use of BIM in developed and developing countries. Besides, this article provides a new perspective on the continuous use of BIM, and thereby enriches the relevant research in different cultures.

5.4. Limitations and Future Directions

Although this study made certain contributions by conducting an empirical study on the architectural designer’s intention to continue using BIM, it also had some limitations that need to be considered in future studies. First, given that the continuous use of BIM is a long-term behavior, the collection of cross-sectional sample data might not verify the relationship among variables well. Thus, conducting longitudinal analyses in future research is necessary. Second, the sample data applied in the study were all obtained within the specific context of the Qingdao construction industry, in which a certain number of architectural design companies exist. The generalization of the results to another city or country requires caution. These results may vary in different cultures or nationalities. Thus, future studies could collect more sample data in more diversified contexts to improve the universality of the research results. Third, the continuous use of BIM technology may be influenced by other factors (e.g., the acceptance of BIM capabilities in the design phase and the size of the company), which therefore should be considered in future studies.

Author Contributions

Conceptualization, Q.C.; methodology, Q.C. and X.H.; investigation, X.L.; writing—original draft preparation, Q.C. and L.Z.; writing—review and editing, Q.C., X.H. and L.Z.; supervision, G.W. All authors have read and agreed to the published version of the manuscript.

Funding

This research received no external funding.

Institutional Review Board Statement

Not applicable.

Informed Consent Statement

Not applicable.

Data Availability Statement

Data generated or analyzed during the research are available from the corresponding author by request.

Conflicts of Interest

The authors declare no conflict of interest.

Abbreviations

The following abbreviations were used in this research:
AVEaverage variance extracted;
BIMbuilding information modeling;
CFconfirmation;
CFIcomparative fit index;
CRcomposite reliability;
CUIcontinuous use intention;
CACronbach’s α;
ECTexpectation confirmation theory;
GFIgoodness of fit index;
PEUperceived ease of use;
PUperceived usefulness;
RMSEAroot mean square error of approximation;
SEMstructural equation modeling;
SFLstandardized factor loading;
STsatisfaction;
TAMtechnology acceptance model;
TFITucker–Lewis index.

References

  1. Eastman, C.M. The use of computers instead of drawings in building design. AIA J. 1975, 63, 46–50. [Google Scholar]
  2. Nederveen, G.; Tolman, F.P. Modelling multiple views on buildings. Autom. Constr. 1992, 1, 215–224. [Google Scholar] [CrossRef]
  3. Zhao, X. A scientometric review of global BIM research: Analysis and visualization. Autom. Constr. 2017, 80, 37–47. [Google Scholar] [CrossRef]
  4. Park, E.; Kwon, S.J.; Han, J. Antecedents of the adoption of building information modeling technology in Korea. Eng. Constr. Archit. Manag. 2019, 26, 1735–1749. [Google Scholar] [CrossRef]
  5. Eadie, R.; Browne, M.; Odeyinka, H.; McKeown, C.; McNiff, S. BIM implementation throughout the UK construction project lifecycle: An analysis. Autom. Constr. 2013, 36, 145–151. [Google Scholar] [CrossRef]
  6. Son, H.; Lee, S.; Kim, C. What drives the adoption of building information modeling in design organizations? An empirical investigation of the antecedents affecting architects’ behavioral intentions. Autom. Constr. 2015, 49, 92–99. [Google Scholar] [CrossRef]
  7. Gokuc, Y.T.; Arditi, D. Adoption of BIM in architectural design firms. Archit. Sci. Rev. 2017, 60, 483–492. [Google Scholar] [CrossRef]
  8. Souza, L.L.A.D.; Amorim, S.R.L.D.; Filho, A.D.M.L. Impact from the use of BIM in architectural design offices: Real estate market opportunities. Des. Manag. Tech. 2009, 1, 26–53. [Google Scholar]
  9. Ding, Z.; Zuo, J.; Wu, J.; Wang, J. Key factors for the BIM adoption by architects: A China study. Eng. Constr. Archit. Manag. 2015, 22, 732–748. [Google Scholar] [CrossRef]
  10. Gu, N.; London, K. Understanding and facilitating BIM adoption in the AEC industry. Autom. Constr. 2010, 19, 988–999. [Google Scholar] [CrossRef]
  11. Davis, F.D. Perceived usefulness, perceived ease of use, and user acceptance of information technology. MIS Q. 1989, 13, 319–340. [Google Scholar] [CrossRef] [Green Version]
  12. Chen, Y.; Zhang, J. Research on influencing factors in the continuous use of BIM. J. Eng. Manag. 2017, 31, 12–16. (In Chinese) [Google Scholar]
  13. Eastman, C.; Teicholz, P.; Sacks, R.; Liston, L. BIM Handbook: A Guide to Building Information Modeling for Owners, Managers, Designers, Engineers, and Contractors, 2nd ed.; John Wiley & Sons: Hoboken, NJ, USA, 2011; pp. 15–17. [Google Scholar]
  14. Ma, P.; Zhang, S.; Hua, Y.; Zhang, J. Behavioral perspective on BIM postadoption in construction organizations. J. Eng. Manag. 2020, 36, 04019036. [Google Scholar] [CrossRef]
  15. Elmualim, A.; Gilder, J. BIM: Innovation in design management, influence and challenges of implementation. Archit. Eng. Des. Manag. 2014, 10, 183–199. [Google Scholar] [CrossRef]
  16. Cao, D.; Li, H.; Wang, G. Impacts of building information modeling (BIM) implementation on design and construction performance: A resource dependence theory perspective. Front. Eng. Manag. 2014, 4, 20–34. [Google Scholar] [CrossRef] [Green Version]
  17. Olugboyega, O.; Edwards, D.J.; Windapo, A.O.; Omopariola, E.D.; Martek, I. Development of a conceptual model for evaluating the success of BIM-based construction projects. Smart Sustain. Built Environ. 2020. [Google Scholar] [CrossRef]
  18. Sheikhkhoshkar, M.; Mir, M.; Rahimian, F.; Kumar, B. Integrating Building Information Modelling (BIM) and System Dynamics Approaches to Decrease Cost Overrun in Mass Housing Projects. In Proceedings of the 36th CIB W78 2019 Conference: ICT in Design, Construction and Management in Architecture, Engineering, Construction and Operations (AECO), Newcastle-upon-Tyne, UK, 18–20 September 2019; pp. 498–507. [Google Scholar]
  19. Khanzadi, M.; Sheikhkhoshkar, M.; Banihashemi, S. BIM applications toward key performance indicators of construction projects in Iran. Int. J. Constr. Manag. 2020, 20, 305–320. [Google Scholar] [CrossRef]
  20. Sun, C.; Jiang, S.; Skibniewski, M.; Man, Q.; Shen, L. A literature review of the factors limiting the application of BIM in the construction industry. Technol. Econ. Dev. Econ. 2017, 23, 764–779. [Google Scholar] [CrossRef] [Green Version]
  21. Jasiński, A. Impact of BIM implementation on architectural practice. Archit. Eng. Des. Manag. 2020. [Google Scholar] [CrossRef]
  22. Liu, Y.; van Nederveen, S.; Hertogh, M. Understanding effects of BIM on collaborative design and construction: An empirical study in China. Int. J. Proj. Manag. 2017, 35, 686–698. [Google Scholar] [CrossRef]
  23. Ngowtanasuwan, G.; Hadikusumo, B.H.W. System dynamics modelling for BIM adoption in Thai architectural and engineering design industry. Constr. Innov. 2017, 17, 457–474. [Google Scholar] [CrossRef]
  24. Chen, L.; Luo, H. A BIM-based construction quality management model and its applications. Autom. Constr. 2014, 46, 64–73. [Google Scholar] [CrossRef]
  25. Arayici, Y.; Coates, P.; Koskela, L.; Kagioglou, M.; Usher, C.; O’Reilly, K. Technology adoption in the BIM implementation for lean architectural practice. Autom. Constr. 2011, 20, 189–195. [Google Scholar] [CrossRef]
  26. Davis, F.D.; Bagozzi, R.P.; Warshaw, P.R. User acceptance of computer technology: A comparison of two theoretical models. Manag. Sci. 1989, 35, 982–1003. [Google Scholar] [CrossRef] [Green Version]
  27. Bhattacherjee, A. Understanding information systems continuance: An expectation-confirmation model. MIS Q. 2001, 25, 351–370. [Google Scholar] [CrossRef]
  28. Venkatesh, V.; Bala, H. Technology acceptance model 3 and a research agenda on interventions. Decis. Sci. 2008, 39, 273–315. [Google Scholar] [CrossRef] [Green Version]
  29. Bae, S.Y.; Han, J.H. Considering cultural consonance in trustworthiness of online hotel reviews among generation Y for sustainable tourism: An extended TAM model. Sustainability 2020, 12, 2942. [Google Scholar] [CrossRef]
  30. Hong, S.; Thong, J.Y.L.; Tam, K.Y. Understanding continued information technology usage behavior: A comparison of three models in the context of mobile internet. Decis. Support. Syst. 2006, 42, 1819–1834. [Google Scholar] [CrossRef]
  31. Jin, C.H. Adoption of e-book among college students: The perspective of an integrated TAM. Comput. Hum. Behav. 2014, 41, 471–477. [Google Scholar] [CrossRef]
  32. Wu, B.; Chen, X. Continuance intention to use MOOCs: Integrating the technology acceptance model (TAM) and task technology fit (TTF) model. Comput. Hum. Behav. 2017, 67, 221–232. [Google Scholar] [CrossRef]
  33. Qin, X.; Shi, Y.; Lyu, K.; Mo, Y. Using a TAM-TOE model to explore factors of building information modeling (BIM) adoption in the construction industry. J. Civ. Eng. Manag. 2020, 26, 259–277. [Google Scholar] [CrossRef]
  34. Oliver, R.L. A cognitive model of the antecedents and consequences of satisfaction decisions. J. Mark. Res. 1980, 17, 460–469. [Google Scholar] [CrossRef]
  35. Oghuma, A.P.; Libaque-Saenz, C.F.; Wong, S.F.; Chang, Y. An expectation-confirmation model of continuance intention to use mobile instant messaging. Telemat. Inform. 2016, 33, 34–47. [Google Scholar] [CrossRef]
  36. Beldad, A.D.; Hegner, S.M. Expanding the technology acceptance model with the inclusion of trust, social influence, and health valuation to determine the predictors of German users’ willingness to continue using a fitness app: A structural equation modeling approach. Int. J. Hum.-Comput. Int. 2018, 34, 882–893. [Google Scholar] [CrossRef] [Green Version]
  37. Joo, Y.J.; So, H.J.; Kim, N.H. Examination of relationships among students’ self-determination, technology acceptance, satisfaction, and continuance intention to use K-MOOCS. Comput. Educ. 2018, 122, 260–272. [Google Scholar] [CrossRef]
  38. Cheng, Y.M. What drives cloud ERP continuance? An integrated view. J. Enterp. Inf. Manag. 2018, 31, 724–750. [Google Scholar] [CrossRef]
  39. Lee, S.; Yu, J.; Jeong, D. BIM acceptance model in construction organizations. J. Manag. Eng. 2013, 31, 04014048. [Google Scholar] [CrossRef]
  40. Yuan, H.; Yang, Y.; Xue, X. Promoting owners’ BIM adoption behaviors to achieve sustainable project management. Sustainability 2019, 11, 3905. [Google Scholar] [CrossRef] [Green Version]
  41. Thong, J.Y.L.; Hong, S.; Tam, K.Y. The effects of post-adoption beliefs on the expectation-confirmation model for information technology continuance. Int. J. Hum.-Comput. Stud. 2006, 64, 799–810. [Google Scholar] [CrossRef]
  42. Stone, R.W.; Baker-Eveleth, L. Students’ expectation, confirmation, and continuance intention to use electronic textbooks. Comput. Hum. Behav. 2013, 29, 984–990. [Google Scholar] [CrossRef]
  43. Albashrawi, M.; Motiwalla, L. Privacy and personalization in continued usage intention of mobile banking: An integrative perspective. Inform. Syst. Front. 2019, 21, 1031–1043. [Google Scholar] [CrossRef]
  44. Lee, M.C. Explaining and predicting users’ continuance intention toward e-learning: An extension of the expectation–confirmation model. Comput. Educ. 2010, 54, 506–516. [Google Scholar] [CrossRef]
  45. Susanto, A.; Chang, Y.; Ha, Y. Determinants of continuance intention to use the smartphone banking services: An extension to the expectation-confirmation model. Ind. Manag. Data Syst. 2016, 116, 508–525. [Google Scholar] [CrossRef]
  46. Ashraf, M.; Ahmad, J.; Hamyon, A.A.; Sheikh, M.R.; Sharif, W. Effects of post-adoption beliefs on customers’ online product recommendation continuous usage: An extended expectation-confirmation model. Cogent Bus. Manag. 2020, 7, 1735693. [Google Scholar] [CrossRef]
  47. Zhang, H.; Lu, Y.; Gupta, S.; Gao, P. Understanding group-buying websites continuance: An extension of expectation confirmation model. Internet Res. 2015, 25, 767–793. [Google Scholar] [CrossRef]
  48. Joo, S.; Choi, N. Understanding users’ continuance intention to use online library resources based on an extended expectation-confirmation model. Electron. Libr. 2016, 34, 554–571. [Google Scholar] [CrossRef]
  49. Tam, C.; Santos, D.; Oliveira, T. Exploring the influential factors of continuance intention to use mobile apps: Extending the expectation confirmation model. Inform. Syst. Front. 2020, 22, 243–257. [Google Scholar] [CrossRef]
  50. Boakye, K.G.; Prybutok, V.R.; Ryan, S.D. The intention of continued web-enabled phone service usage: A quality perspective. Oper. Manag. Res. 2012, 5, 14–24. [Google Scholar] [CrossRef]
  51. Mensah, I.K. Predictors of the continued adoption of WECHAT mobile payment. Int. J. E-Bus. Res. 2019, 15, 1–23. [Google Scholar] [CrossRef]
  52. Belanche, D.; Casalo, L.V.; Flavián, C.; Schepers, J. Trust transfer in the continued usage of public e-services. Inf. Manag. 2014, 51, 627–640. [Google Scholar] [CrossRef] [Green Version]
  53. Baker-Eveleth, L.; Stone, R.W. Usability, expectation, confirmation, and continuance intentions to use electronic textbooks. Behav. Inf. Technol. 2015, 34, 992–1004. [Google Scholar] [CrossRef]
  54. Ji, Z.; Yang, Z.; Liu, J.; Yu, C. Investigating users’ continued usage intentions of online learning applications. Information 2019, 10, 198. [Google Scholar] [CrossRef] [Green Version]
  55. Roca, J.C.; Chiu, C.; Martínez, F.J. Understanding e-learning continuance intention: An extension of the technology acceptance model. Int. J. Hum.-Comput. Stud. 2006, 64, 683–696. [Google Scholar] [CrossRef] [Green Version]
  56. Carillo, K.; Scornavacca, E.; Za, S. The role of media dependency in predicting continuance intention to use ubiquitous media systems. Inf. Manag. 2017, 54, 317–335. [Google Scholar] [CrossRef]
  57. Tawafak, R.M.; Romli, A.B.; Arshah, R.B. Continued intention to use UCOM: Four factors for integrating with a technology acceptance model to moderate the satisfaction of learning. IEEE Access 2018, 6, 66481–66498. [Google Scholar] [CrossRef]
  58. Wang, G.; Song, J. The relation of perceived benefits and organizational supports to user satisfaction with building information model (BIM). Comput. Hum. Behav. 2017, 68, 493–500. [Google Scholar] [CrossRef]
  59. Srivastav, G.; Gupta, A. Going private in public: A study on shift in behavioral trend using facebook. Comput. Hum. Behav. 2017, 73, 55–63. [Google Scholar] [CrossRef]
  60. Bhattacherjee, A.; Premkumar, G. Understanding changes in belief and attitude toward information technology usage: A theoretical model and longitudinal test. MIS Q. 2004, 28, 229–254. [Google Scholar] [CrossRef] [Green Version]
  61. Au, N.; Ngai, E.W.T.; Cheng, T.C.E. Extending the understanding of end user information systems satisfaction formation: An equitable needs fulfillment model approach. MIS Q. 2008, 32, 43–66. [Google Scholar] [CrossRef] [Green Version]
  62. Huang, Y.M. Examining students’ continued use of desktop services: Perspectives from expectation-confirmation and social influence. Comput. Hum. Behav. 2019, 96, 23–31. [Google Scholar] [CrossRef]
  63. Goldbach, T.; Benlian, A.; Buxmann, P. Differential effects of formal and self-control in mobile platform ecosystems: Multi-method findings on third-party developers’ continuance intentions and application quality. Inf. Manag. 2017, 55, 271–284. [Google Scholar] [CrossRef]
  64. Podsakoff, P.M.; Organ, D.W. Self-reports in organizational research: Problems and prospects. J. Manag. 1986, 12, 531–544. [Google Scholar] [CrossRef]
  65. Akram, M.S.; Malik, A.; Shareef, M.A.; Goraya, M.A.S. Exploring the interrelationships between technological predictors and behavioral mediators in online tax filing: The moderating role of perceived risk. Gov. Inf. Q. 2019, 36, 237–251. [Google Scholar] [CrossRef]
  66. Anderson, J.; Gerbing, D. Structural equation modeling in practice: A review and recommended two-step approach. Psychol. Bull. 1988, 103, 453–460. [Google Scholar] [CrossRef]
  67. Holbert, R.L.; Stephenson, M.T. Structural equation modeling in the communication sciences, 1995–2000. Hum. Commun. Res. 2002, 28, 531–551. [Google Scholar]
  68. Bagozzi, R.P.; Yi, Y. On the evaluation of structural equation models. J. Acad. Mark. Sci. 1988, 16, 74–94. [Google Scholar] [CrossRef]
  69. Fornell, C.; Larcker, D.F. Evaluating structural equation models with unobservable variables and measurement error. J. Mark. Res. 1981, 18, 39–50. [Google Scholar] [CrossRef]
  70. Medhi, P.K.; Jain, P.; Jain, T. Effects of information sources for new customers and suppliers on the immediate innovation output of firms. Eur. J. Innov. Manag. 2019, 22, 660–680. [Google Scholar] [CrossRef]
  71. Hong, Y.; Hammad, A.W.A.; Sepasgozar, S.; Akbarnezhad, A. BIM adoption model for small and medium construction organisations in Australia. Eng. Constr. Archit. Manag. 2019, 26, 154–183. [Google Scholar] [CrossRef]
  72. Lenka, U.; Gupta, M. An empirical investigation of innovation process in Indian pharmaceutical companies. Eur. J. Innov. Manag. 2019, 23, 500–523. [Google Scholar] [CrossRef]
  73. Si, H.; Shi, J.; Tang, D.; Wu, G.; Lan, J. Understanding intention and behavior toward sustainable usage of bike sharing by extending the theory of planned behavior. Resour. Conserv. Recycl. 2019, 152, 104513. [Google Scholar] [CrossRef]
  74. He, W.; Zhao, P.; Wei, Z. Research on the effect mechanism of organizational support on continuance usage of BIM technology for staffs of construction industry. Constr. Econ. 2015, 36, 106–110. (In Chinese) [Google Scholar]
Figure 1. Research model.
Buildings 11 00448 g001
Figure 2. Results of SEM analysis.
Buildings 11 00448 g002
Table 1. Constructs, items, and references.
Constructs and ItemsReferences
Perceived ease of use (PEU)[4,56,58]
PEU1Using BIM is easy for me.
PEU2Using BIM doesn’t require a lot of my effort.
PEU3I can easily use BIM to complete the work I want to do.
Perceived usefulness (PU)[4,28,32,58]
PU1Using BIM improves my work performance.
PU2Using BIM increases my work productivity.
PU3Using BIM enhances my work effectiveness.
Confirmation (CF)[14,30,56]
CF1I have a better experience with BIM than I expected.
CF2The service level provided by BIM is better than I expected.
CF3Overall, most of my expectations for BIM have been confirmed.
Satisfaction (ST)[58,60,61,62]
ST1I feel very satisfied with using BIM.
ST2I feel very pleased with using BIM.
ST3I am very delighted with using BIM.
ST4I feel very contented with using BIM.
Continuous use intention (CUI)[4,6,56,63]
CUI1I plan to continue using BIM rather than stop using it.
CUI2I intend to continue to use BIM rather than use other alternative 2D technologies.
CUI3If I can, I expect to continue using BIM in the future.
Table 2. Profiles of the respondents.
CharacteristicCategoryFrequencyPercentage (%)
GenderMale11354.11
Female9445.89
Age≤254622.22
26–354521.39
36–458641.50
46–55188.70
≥56125.80
EducationAssociate degree3215.46
Bachelor degree14168.12
Master’s and above3416.43
Familiarity with BIMGeneral8641.55
Quite10249.28
Very199.18
Table 3. Reliability test.
ConstructsCronbach’s AlphaNumber of the Items
Perceived ease of use0.7903
Perceived usefulness0.8344
Confirmation0.8063
Satisfaction0.8874
Continuous use intention0.9023
Table 4. Convergent validity test.
ConstructsItemsSFLCRAVE
Perceived ease of usePEU10.619 ***0.8040.583
PEU20.865 ***
PEU30.785 ***
Perceived usefulnessPU10.594 ***0.8400.573
PU20.874 ***
PU30.831 ***
PU40.696 ***
ConfirmationCF10.849 ***0.8020.541
CF20.929 ***
CF30.833 ***
SatisfactionST10.523 ***0.8890.728
ST20.842 ***
ST30.858 ***
ST40.669 ***
Continuous use intentionCUI10.896 ***0.9040.759
CUI20.873 ***
CUI30.786 ***
Note: *** p < 0.001.
Table 5. Correlation matrix and discriminant validity test.
ConstructsPEUPUCFSTCUI
PEU0.763
PU0.4130.756
CF0.0080.0800.871
ST0.3620.3640.1680.736
CUI0.3970.2900.1530.3820.851
Table 6. Results of the hypothesis tests.
HypothesesRelationshipCoefficients (β)t-Value (t)p-Value (p)Results
H1PEU→PU0.5135.0930.000Supported
H2CF→PU0.0771.0930.274Refuted
H3PU→ST0.3944.0100.000Supported
H4CF→ST0.1592.1100.035Supported
H5PEU→CUI0.3343.4590.001Supported
H6PU→CUI0.0580.6290.529Refuted
H7ST→CUI0.2633.0590.002Supported
Publisher’s Note: MDPI stays neutral with regard to jurisdictional claims in published maps and institutional affiliations.

