Abstract
Now more than ever, the construction sector is aiming to adopt more sustainable solutions. To achieve this purpose, more durable solutions must be adopted, making rational decisions at the design and maintenance stages regarding the conditions of environmental exposure and use. In this sense, knowledge regarding the service life of building components is crucial. This knowledge should not be a general concept, or a standard value, and adapting practices from one country to another is extremely challenging. In this sense, this study analyses the service life of natural stone claddings. We adopt a methodology initially proposed for Lisbon (Portugal), intending to evaluate its applicability to other geographical contexts, in order to perform a more reliable service life prediction of stone claddings located in Tehran (Iran). An estimated service life of 65 years was obtained for a sample of 162 stone claddings directly adhered to the substrate, located in Tehran, which were analysed by in situ inspections. The impact of different conditions (e.g., type of stone and environmental exposure conditions) on the service life of stone claddings in Tehran was quantified, which revealed that the exposure to environmental agents, such as wind, rain and pollutants, is the main cause of degradation of the natural stone claddings.
1. Introduction
The durability of buildings is one of the fundamental elements in assessing the quality of life of contemporary societies and is indispensable to their social and economic stability [1]. The durability of buildings can be jeopardised by increasing the degradation of their components, resulting from the natural ageing process of materials [2], leading to the loss of a building’s performance [3]. Due to this degradation process, the buildings tend to become obsolete and unable to meet the performance demands established during the design stage [4]. Therefore, the service life prediction of building elements is of utmost value for a more sustainable environment [5]. The knowledge about the durability of building elements allows a more rational management of resources, which can reduce the economic and environmental costs of buildings during their lifetime [6].
Building components are categorised in various studies [7,8,9,10] according to the time they take to reach the end of their service life, i.e., as durability layers. The façade is considered the “skin” of the building, acting as a protective layer against environmental degradation agents [2]. Therefore, the cladding is more prone to anomalies [11], which is why the building envelope failures can be held accountable for more than 50% of all building deficiencies [12]. The adoption of natural stone as a cladding solution is growing due to its durability and mechanical strength [13].
A review of the literature shows that a variety of approaches can be used in the description of models to replicate the degradation of façade claddings during their lifetime. Gaspar and de Brito [14] classified these under two categories, namely, (i) laboratory testing and (ii) fieldwork surveys, to evaluate the degradation condition of the elements in real exposure situations. In spite of using laboratory testing methods because of the quickness with which they yield results [15], some authors indicate that the simulation of the complete effect of environmental agents that simultaneously contribute to the degradation of the building elements is not possible in such an artificial environment, since the degradation effects are analysed in a much reduced way [16]. In addition, real life situations and the synergy between different degradation agents are difficult to model in a laboratory setting [17]. The studies conducted by Searls and Tomasen [18] and Henriksen [19] reveal that laboratory tests are more appropriate to model the effects of a given degradation agent [20].
To overcome this criticism, an evaluation of the influence of the combined actions of different agents on claddings’ service life by observing the existing condition was used. This research method, called ex post facto, which literally means ‘after the fact’ or ‘retrospectively’, refers to those studies that investigate possible cause-and-effect relationships by examining the elements under analysis in real situations and searching back in time for plausible causal factors [21]. This course of action to assess the durability of building components was conducted in several studies [22,23,24,25,26,27,28].
However, most of the research in the field of the degradation processes of exterior claddings in real conditions in retrospect have been carried out in a specific region with a specific climate type, and the identification of the influence of some properties on the evolution of the degradation can come to the light by comparing the same building components in different climate types. In this sense, Haagenrud [3] suggests that the relation between the degradation agents and their effects on the degradation process can be explained when the different geographical coordinates and climates are taken into consideration in the characterisation and mapping of the most significant degradation agents. Therefore, the impact of environmental agents and façade specifications determined by comparing the natural stone cladding behaviour in Tehran (Iran) and Lisbon (Portugal), performed within a PhD study [29] and unique in the literature, is described in this study.
Regardless of the innovations in cladding materials used in exterior walls, natural stone is still one of the most efficient and durable options [13]. Therefore, this cladding solution was selected as a case study in the present study. For decades, many methods to determine the adherence of stone plates to a building’s external walls have been developed, which can be classified under the headings of (i) a ‘direct fastening system’, which corresponds to the complete bond between the substrate and the stone elements, and (ii) an ‘indirect fastening system’, adopting mechanical anchorage methods [30,31]. Considering the fact that the indirect fastening system is a relatively new technology and that it is therefore difficult to find a significant number of case studies, natural stonewall claddings with a direct fastening to the substrate were chosen in the current study. The sample analysed comprises 203 stone claddings located in Lisbon (Portugal) and 162 stone claddings in Tehran (Iran), which were inspected in situ.
The aim of this study is essentially to propose an empirical method to establish a degradation path for stone claddings over time, through a simple tool to predict the service life of these claddings, considering characteristics that can be easily assessed by visual inspections in situ. This study intends to analyse and quantify the impact of different factors, such as the characteristics of the stone elements and environmental exposure conditions on the service life of natural stone claddings in Tehran. This knowledge is extremely useful for the adoption of more sustainable and rational solutions at the design stage, as well as for the definition and optimisation of maintenance strategies to promote the durability of these claddings.
2. Materials and Methods
2.1. Climatic and Environmental Exposure Conditions
In this study, according to Haagenrud [3], different geographical coordinates and climates are taken into consideration at various scales. The macro scale usually describes the overall meteorological conditions based on meteorological indicators (e.g., air temperature, precipitation, among others). Tehran is categorised as having a cold semi-arid climate (BSk) based on the Köppen–Geiger classification [32], which denotes that at least one month’s average temperature is below 0 °C. By contrast, the Lisbon area is situated in a hot summer Mediterranean climate (Csa), where the average temperature is above 0 °C even in the coldest months. With respect to the meso climate, the effects of the ground and of the built environment are considered. In this context, Tehran is spread from 35°34′ to 35°51′ north latitude and from longitude 51°06′ to 51°38′ east with an average elevation of 1190 m, comprising 22 regions. The current study focused on the sixth district, which is geometrically located in the centre of Tehran and was founded in the 1950s (Figure 1).
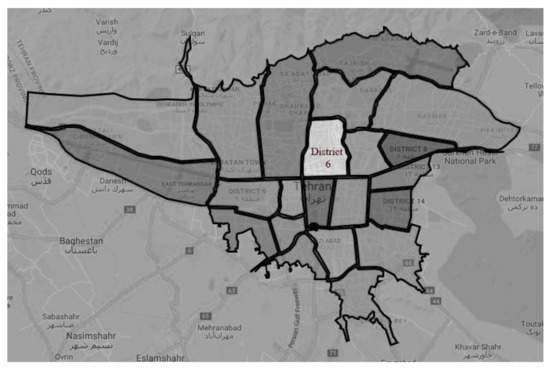
Figure 1.
Map of the 6th district, located in the centre of Tehran.
The other research area is in the Lisbon area at 42°38′ north latitude and 09°08′ west longitude, located in western Portugal on the estuary of the Tagus River along the Atlantic coast.
The impact of environmental conditions on cladding degradation varies according to the building’s exposure circumstances, which mainly depends on the local climate [33,34]. Accordingly, the local specifications, i.e., the local conditions in the building’s proximity, were collected at the data acquisition stage.
2.2. Data Acquisition and Limitations of the Method Proposed
As Silva et al. [2] mentioned, in order to appraise the service life of building elements considering their current condition, various methods can be used, including destructive and non-destructive tests carried out in situ. The former procedures, however accurate in regarding the information provided, usually demand costly equipment, in addition to requiring repair actions afterwards. By contrast, the latter techniques, notably visual inspections, are generally fast, less expensive and adequate to establish the degradation condition of the elements under analysis [35]. Moreover, in most real situations in the geographical contexts analysed, the maintenance actions are carried out based on subjective criteria that depend on the users’ perception of the state of degradation of the façades acquired through simple visual inspections.
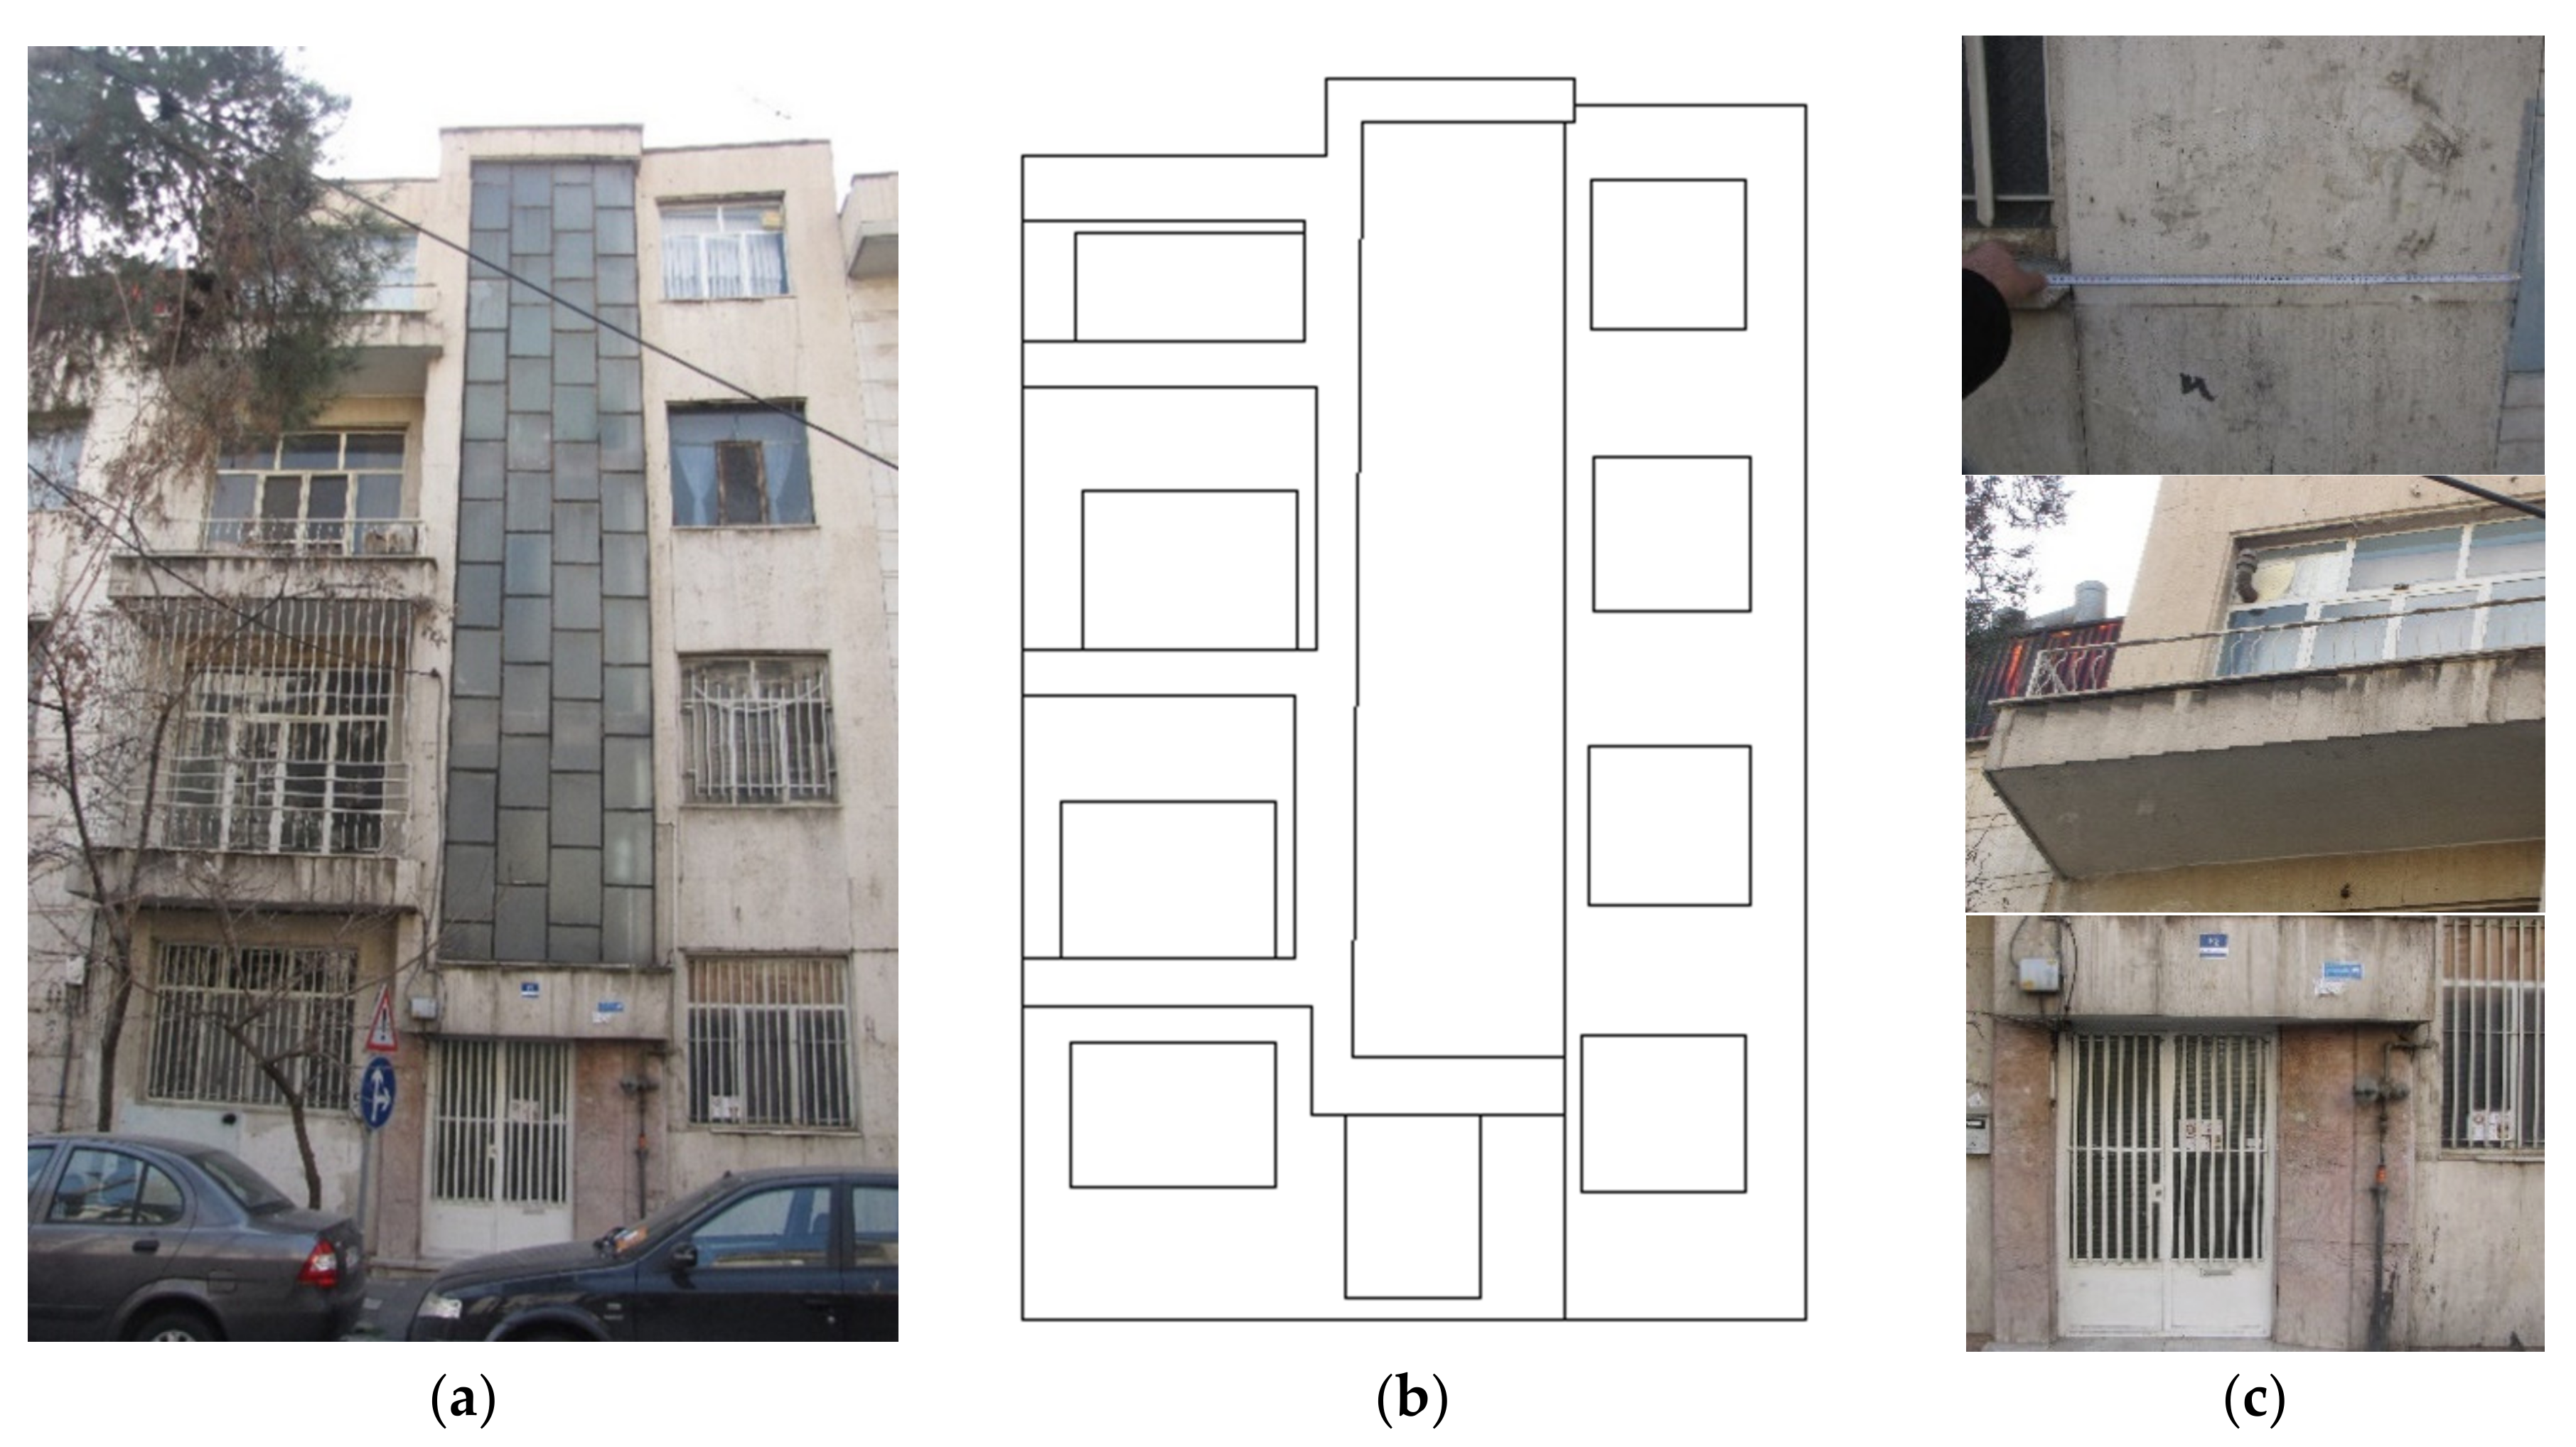
Consequently, in the current study, an in situ survey of buildings, through visual inspections, was used to collect data regarding the degradation condition of natural stone claddings. The fieldwork survey encompasses the following steps (Figure 2): (i) each case study is selected and characterised based on complementary information, such as the location of the case study, existing drawings and other relevant documents from the municipality; (ii) an inspection file is used to collect all the relevant information to characterise the case study (e.g., façade’s dimensions, exposure conditions and the description of the anomalies observed, as well as the area of the façade affected by these anomalies); (iii) during fieldwork, the case study is photographed, and, aided by diagrammatic sketches, the anomalies observed are identified and their extent is quantified using design and calculus software.

Figure 2.
Illustrative example of one case study analysed in Tehran: (a) photograph of the façade; (b) diagrammatic sketch to represent the anomalies observed; (c) direct measurements and identification of different anomalies in the natural stone cladding.
The method proposed, in which the fieldwork is based on visual inspections only, presents some limitations regarding the collection of relevant information to characterise some properties of the claddings, namely (i) the factors related to the characteristics of the materials applied in the execution stage, such as the bonding material applied or the material used to fill the joints, cannot be determined during the visual inspections; (ii) the execution conditions and the level of control over the construction processes (e.g., the quality of the workforce work, material storage environments, among others) are also difficult or even impossible to characterise. The use of inadequate materials or execution errors irreparably affect the durability of stone claddings, but there is a lack of information in municipalities about the execution processes, which do not allow consideration of these factors when using visual inspections only. However, in this study, the case studies that presented anomalies due to clear execution errors or choice of inappropriate materials were excluded from the analysis, as they do not characterise the physical degradation phenomenon of natural stone claddings.
Information about the maintenance and rehabilitation actions carried out on the façades analysed was collected in the municipalities and through contact with the owners. The type of actions carried out is not within the scope of this study, as the models consider the natural evolution of degradation of stone claddings without maintenance. In other words, the “age” is considered as the period since construction/last intervention/maintenance action until the inspection time.
Despite these limitations, the method used has numerous practical advantages. The main advantage relies on the time required to obtain relevant results regarding the influence of exposure conditions on the degradation of the claddings. The combined action of the degradation agents is not easily reproduced. In this sense, the field data on the degradation condition of buildings should be used when possible, since they provide relevant information on the real degradation of components when exposed to a particular set of degradation agents, which act simultaneously and synergistically, whose action it is not possible to simulate with precision in an artificial way.
3. Description of the Samples Analysed
Accordingly, with respect to the samples located in the Lisbon area, fieldwork data from previous research [22,24] were analysed in this study, related to the inspection of 203 stone claddings. The newest building was built in 2008, and the oldest building was built in 1891 (being subjected to a maintenance intervention in 1948). As for the case studies in Tehran, based on the research of Silva et al. [22] for the classification system of anomalies in stone claddings with direct fastening to the substrate, a visual inspection plan was developed. This fieldwork generated data from 52 buildings in the sixth district of the Tehran (Iran) area, whose claddings presented various anomalies, totalling 162 case studies. In the Tehran dataset, the oldest building is from 1969 and the newest one from 2010. The resulting data can generally be arranged into the headings of “materials’ characteristics” and “defects”. The former category comprises the type of stone, size and colour; the type of finishing; and the position of the cladding in the façade; in addition, complementary information (e.g., orientation, exposure to wind-driven rain, among other parameters) was collected in advance to put each case study into a better perspective (Table 1).

Table 1.
Description of the samples collected in Tehran and in Lisbon.
According to Silva et al. [2,22], four groups of anomalies are considered:
- (i).
- Aesthetic degradation, which has a visual impact on the cladding, not jeopardising its integrity; these anomalies can be observed in most stone claddings and tend to occur prematurely;
- (ii).
- Joint defects, which affect the proper functioning of the joints of the cladding and can promote the occurrence of new anomalies;
- (iii).
- Fastening to the substrate that jeopardises the claddings’ and the users’ safety;
- (iv).
- Loss of integrity due to the modification of the physicochemical properties of the stone (e.g., due to the exposure to pollutants), leading to irreversible changes in the physical and aesthetic properties of the claddings.
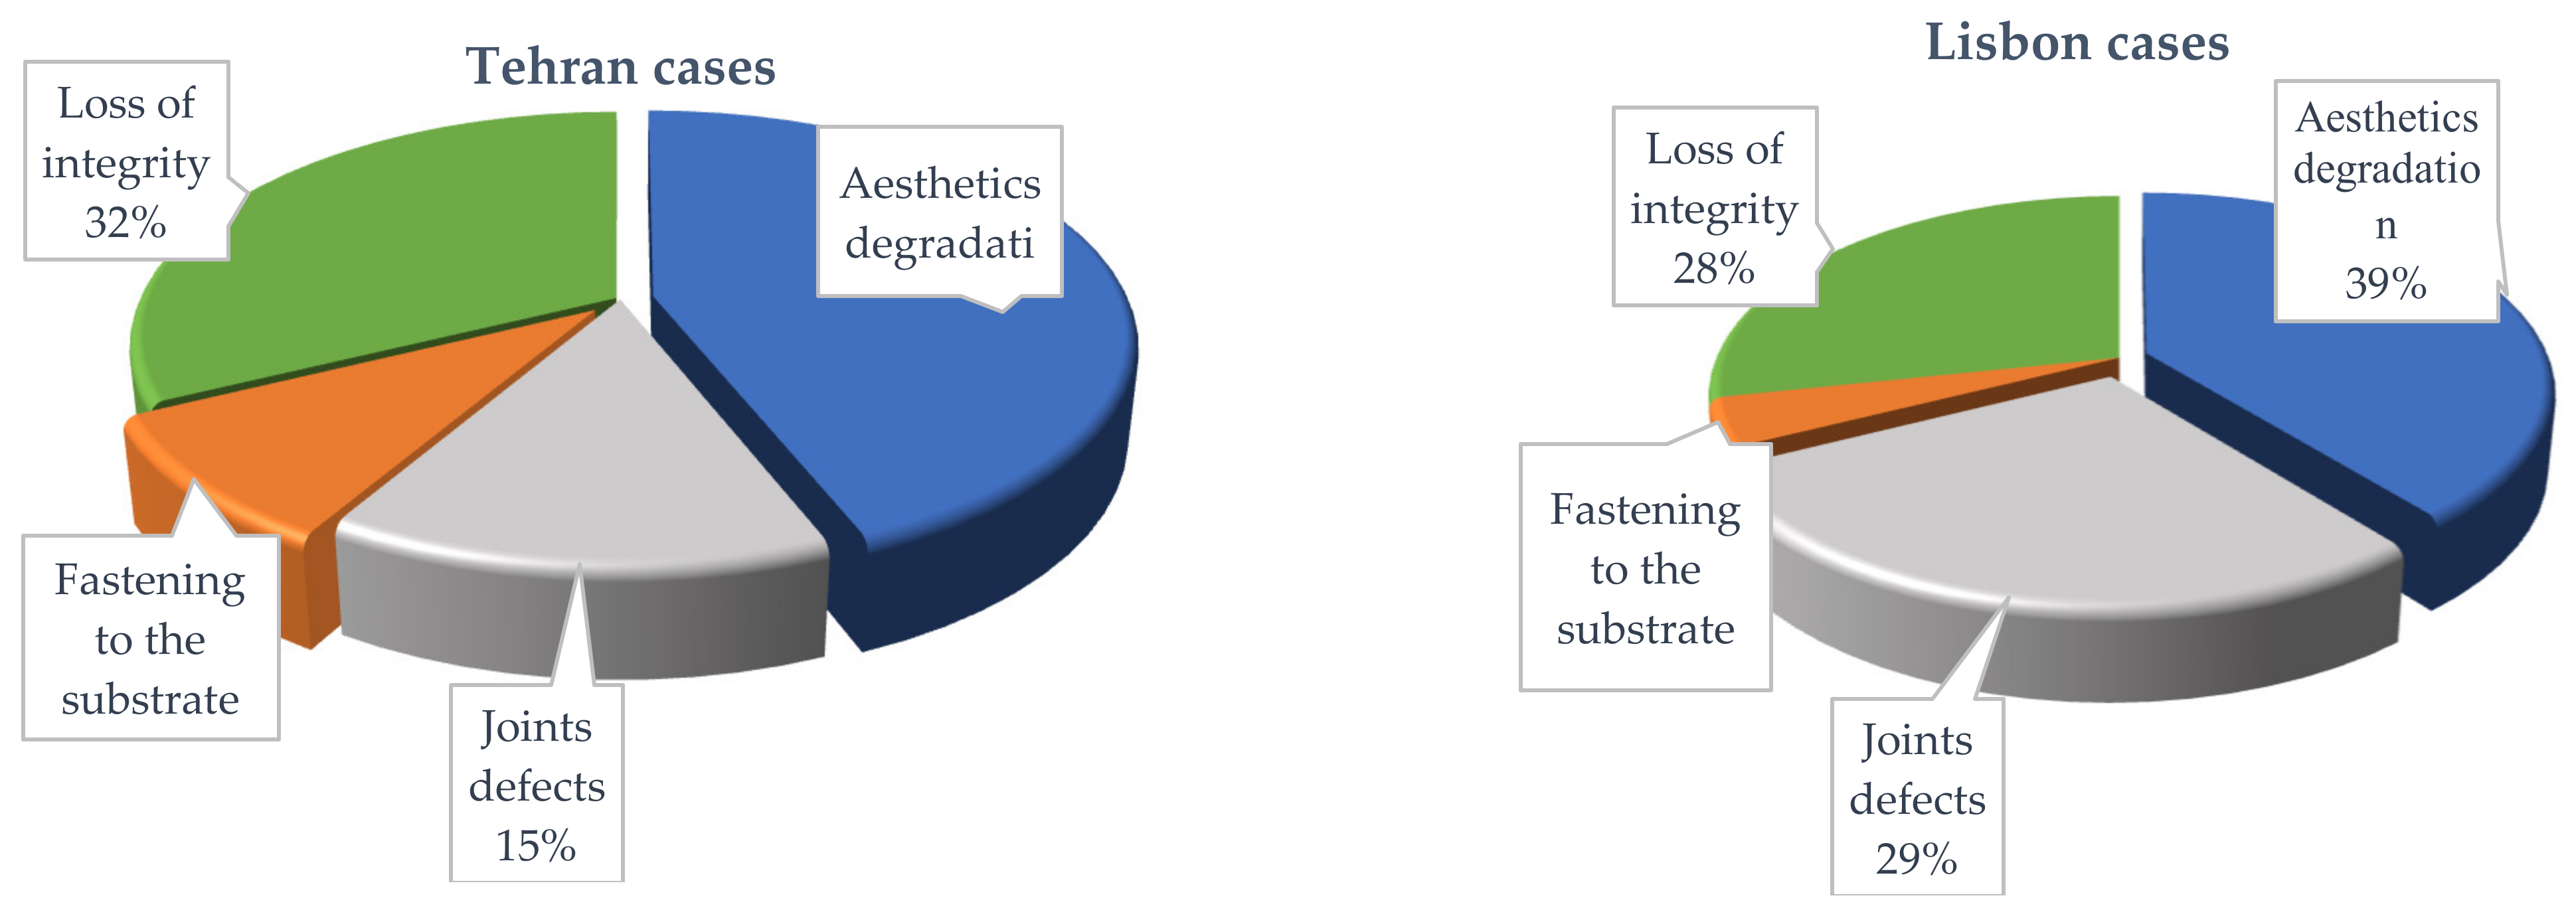
From the preliminary analyses of the data collected, as shown in Figure 3, the most and least frequent defects detected during the fieldwork in both research areas are aesthetic anomalies and those related to the fastening to the substrate, respectively. In the Tehran dataset, the aesthetic anomalies are followed by defects related to the loss of integrity (32%) and, finally, joint defects (15%). On the contrary, the analysis of the Lisbon cases shows joint defects in 29% of the inspected façades, while the defects associated with the loss of integrity occur in 28% of the case studies analysed.

Figure 3.
Statistical analyses of the defects observed in the case studies analysed.
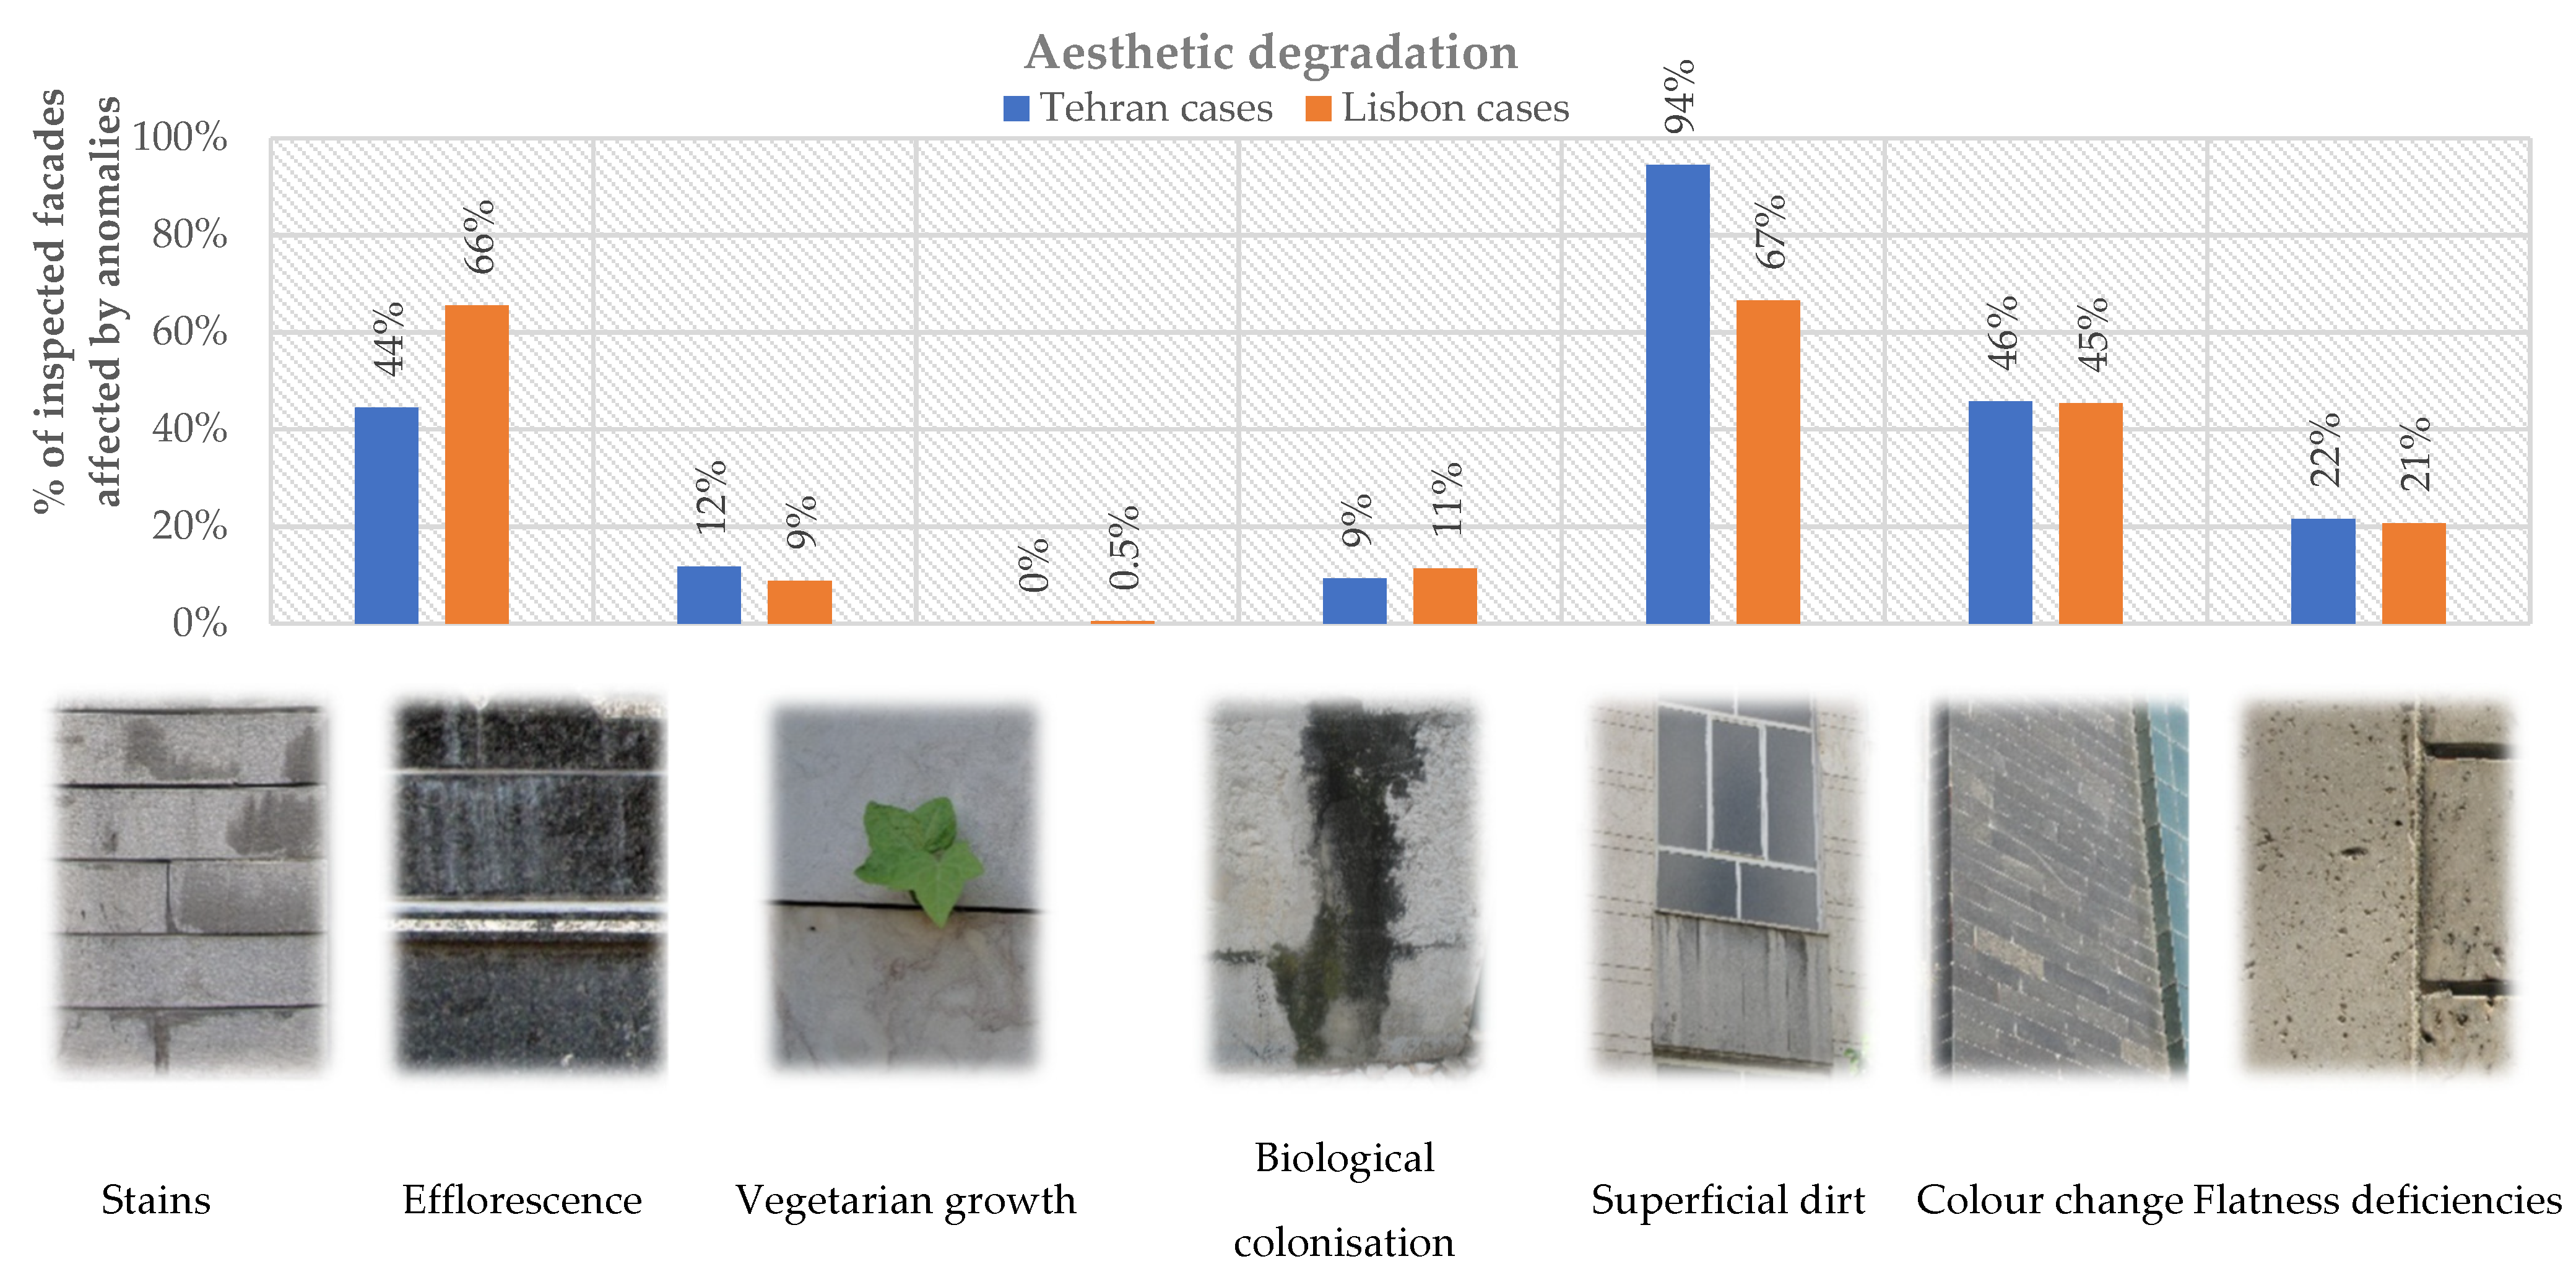
The frequency of the different defects in the aesthetic anomalies group observed in the cases under analysis can be compared in Figure 4. Among the aesthetic degradation defects in both research areas, superficial dirt, caused by the accumulation of pollution debris on the façade, is the most common one. In Tehran, this is followed by colour change and stains (occurring in 46% and 44% of the sample analysed, respectively), while an inverse tendency in these defects is observed in the inspected façades in Lisbon. The fourth ranked frequency of the aesthetic degradation defects observed in both fieldwork surveys relates to flatness deficiencies, which is followed by efflorescence and biological colonisation, respectively, in Tehran, whilst the Lisbon samples exhibit inverse behaviour. The incidence of vegetation growth only occurs in the Lisbon sample.

Figure 4.
Frequency of the defects in the aesthetic anomalies group observed in the samples under analysis.
Concerning the defects related to the joints, as shown in Figure 5, degradation of the materials used to fill the joints is more frequent than the loss of material (which corresponds to a more serious defect with severe consequences, such as penetration of water in the substrate). Concomitantly, given the higher age of the samples under analysis in Lisbon (less than 89 years) than in Tehran (less than 48 years), the first sample was naturally subjected for a longer period to the degradation mechanisms, thus leading to a higher incidence of joint defects.
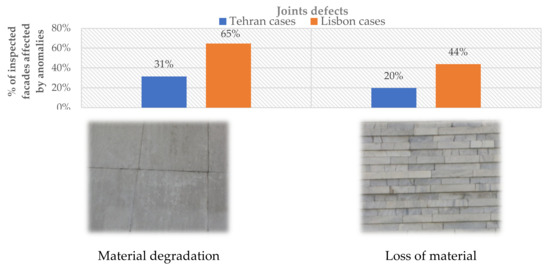
Figure 5.
Frequency of the joints’ defects in the samples under analysis.
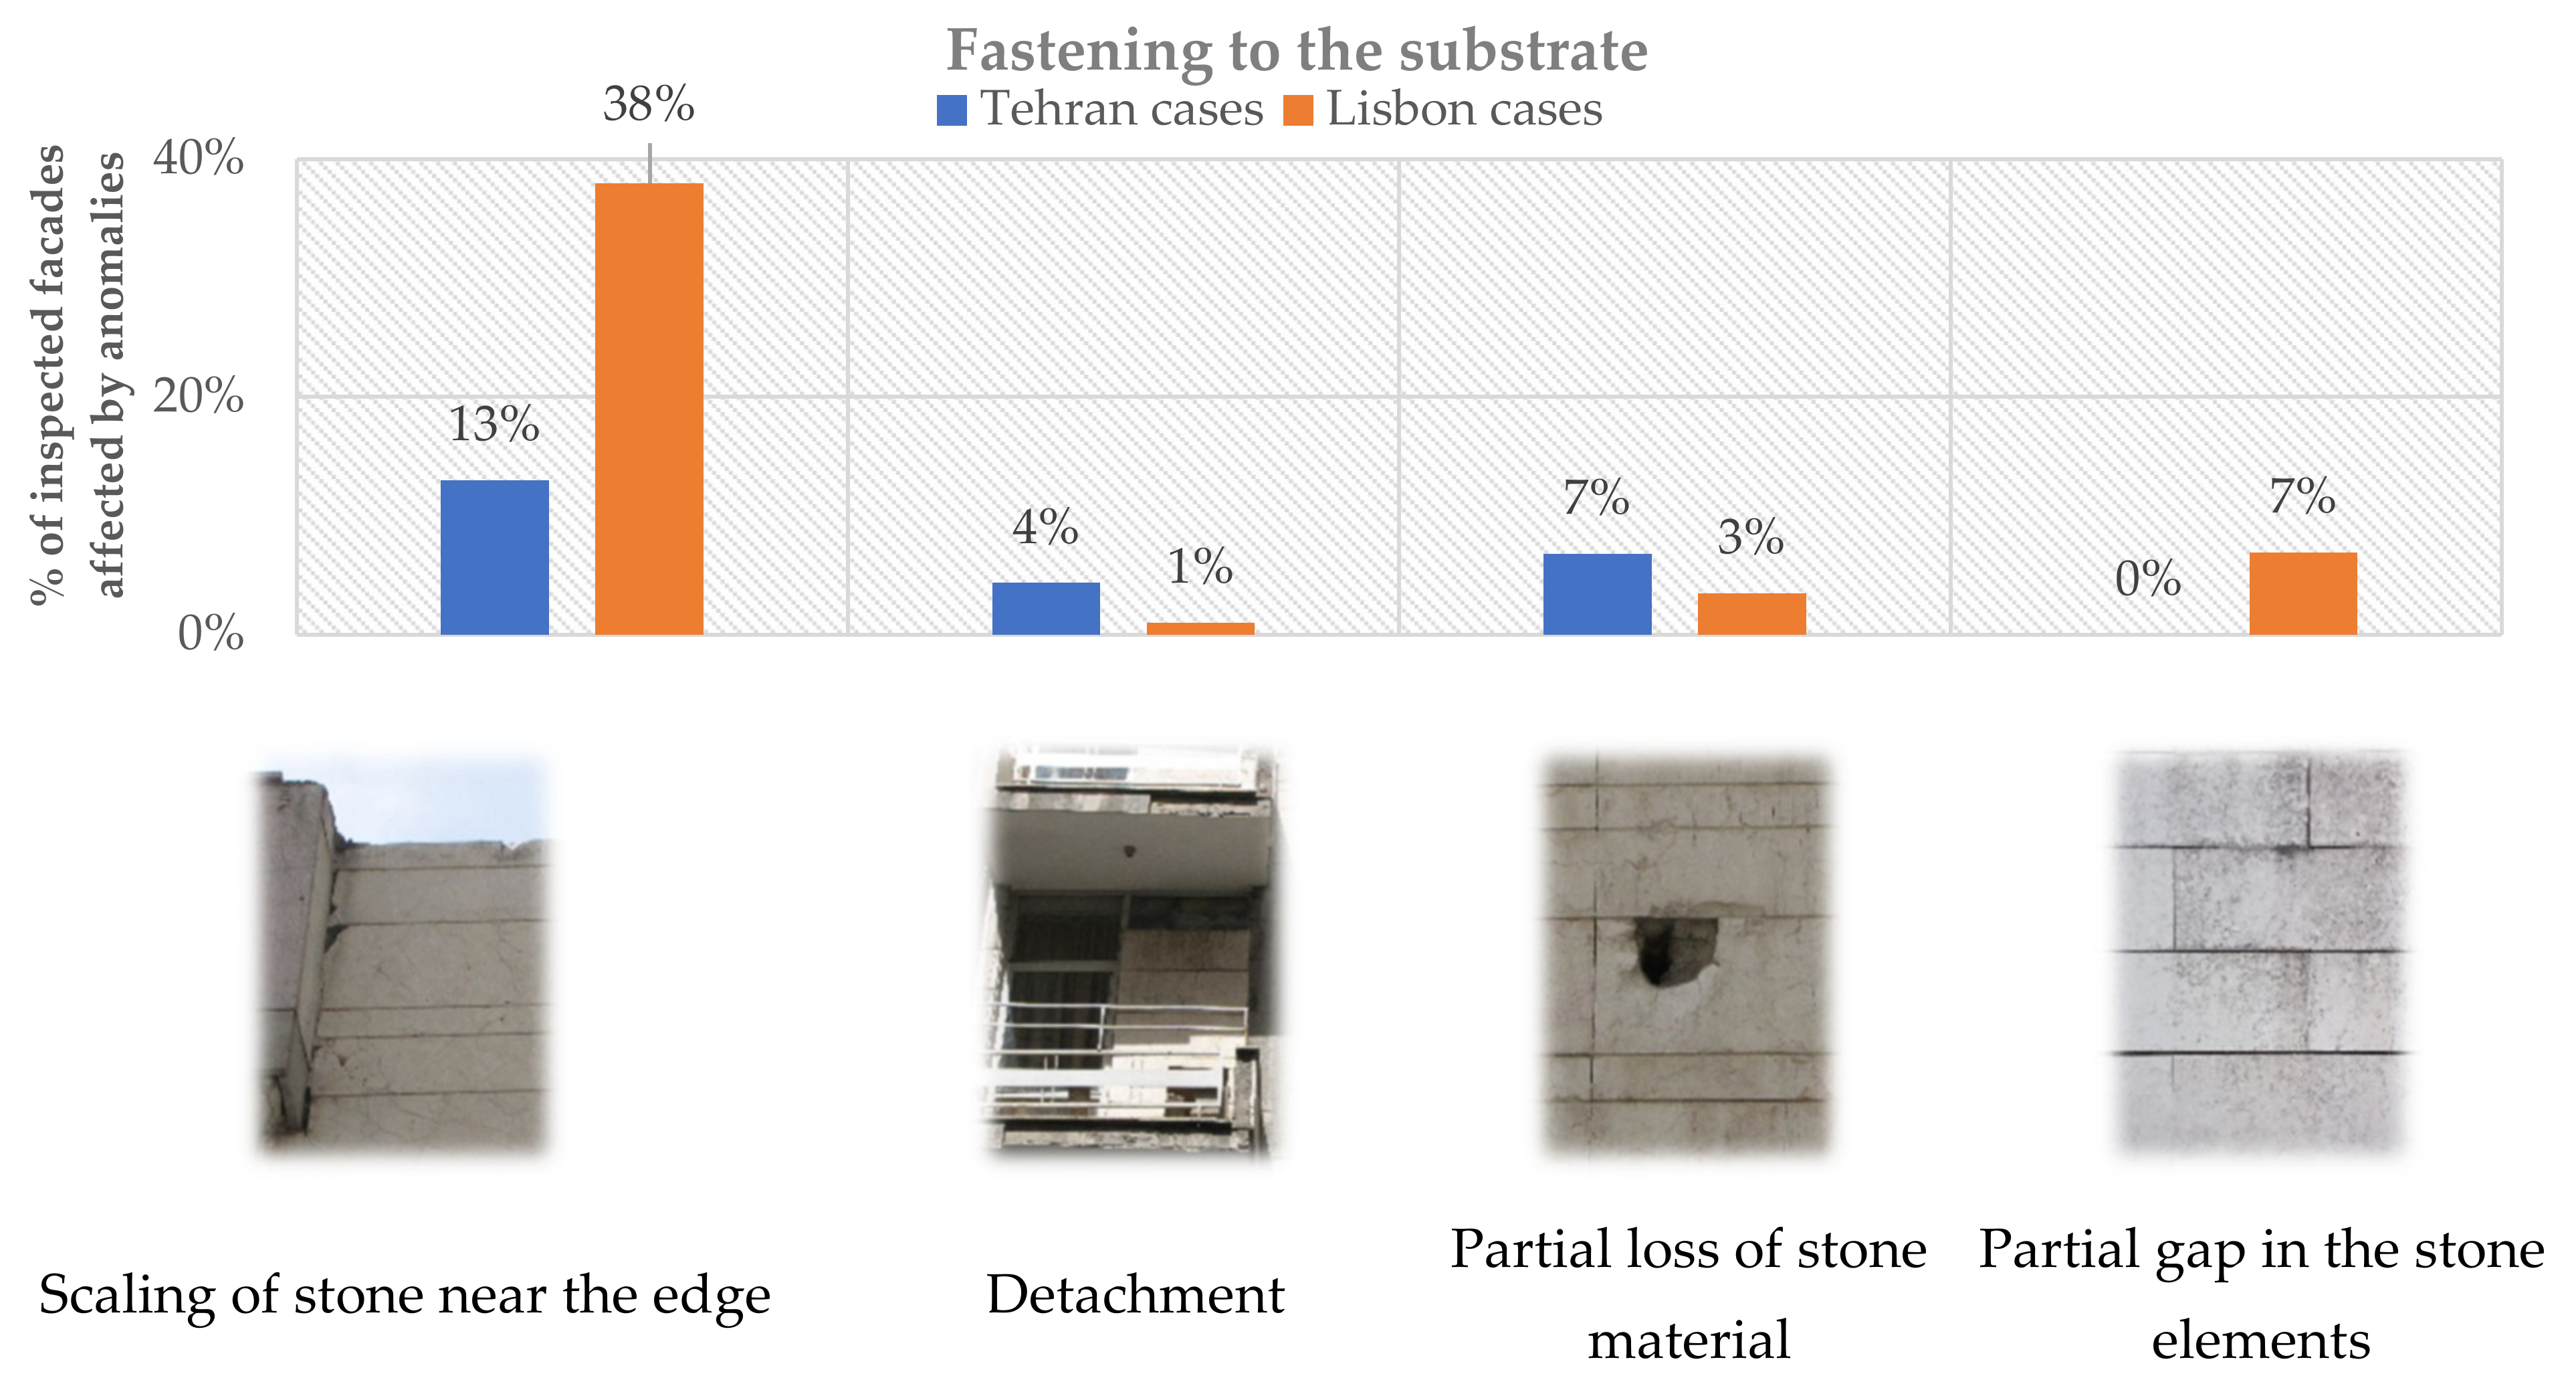
Concerning the defects related to the fastening to the substrate (Figure 6), the scaling of the stone near the edges is the major defect in the sample analysed. This is followed by a partial loss of stone material and detachment, respectively, while a partial gap in the stone elements does not occur in any inspected cases in Tehran. Conversely, the analysis of the Lisbon data reveals that the presence of partial gaps in the stone elements is the second most common defect, followed by a partial loss of stone material.

Figure 6.
Frequency of the fastening to substrate defects in the samples under analysis.
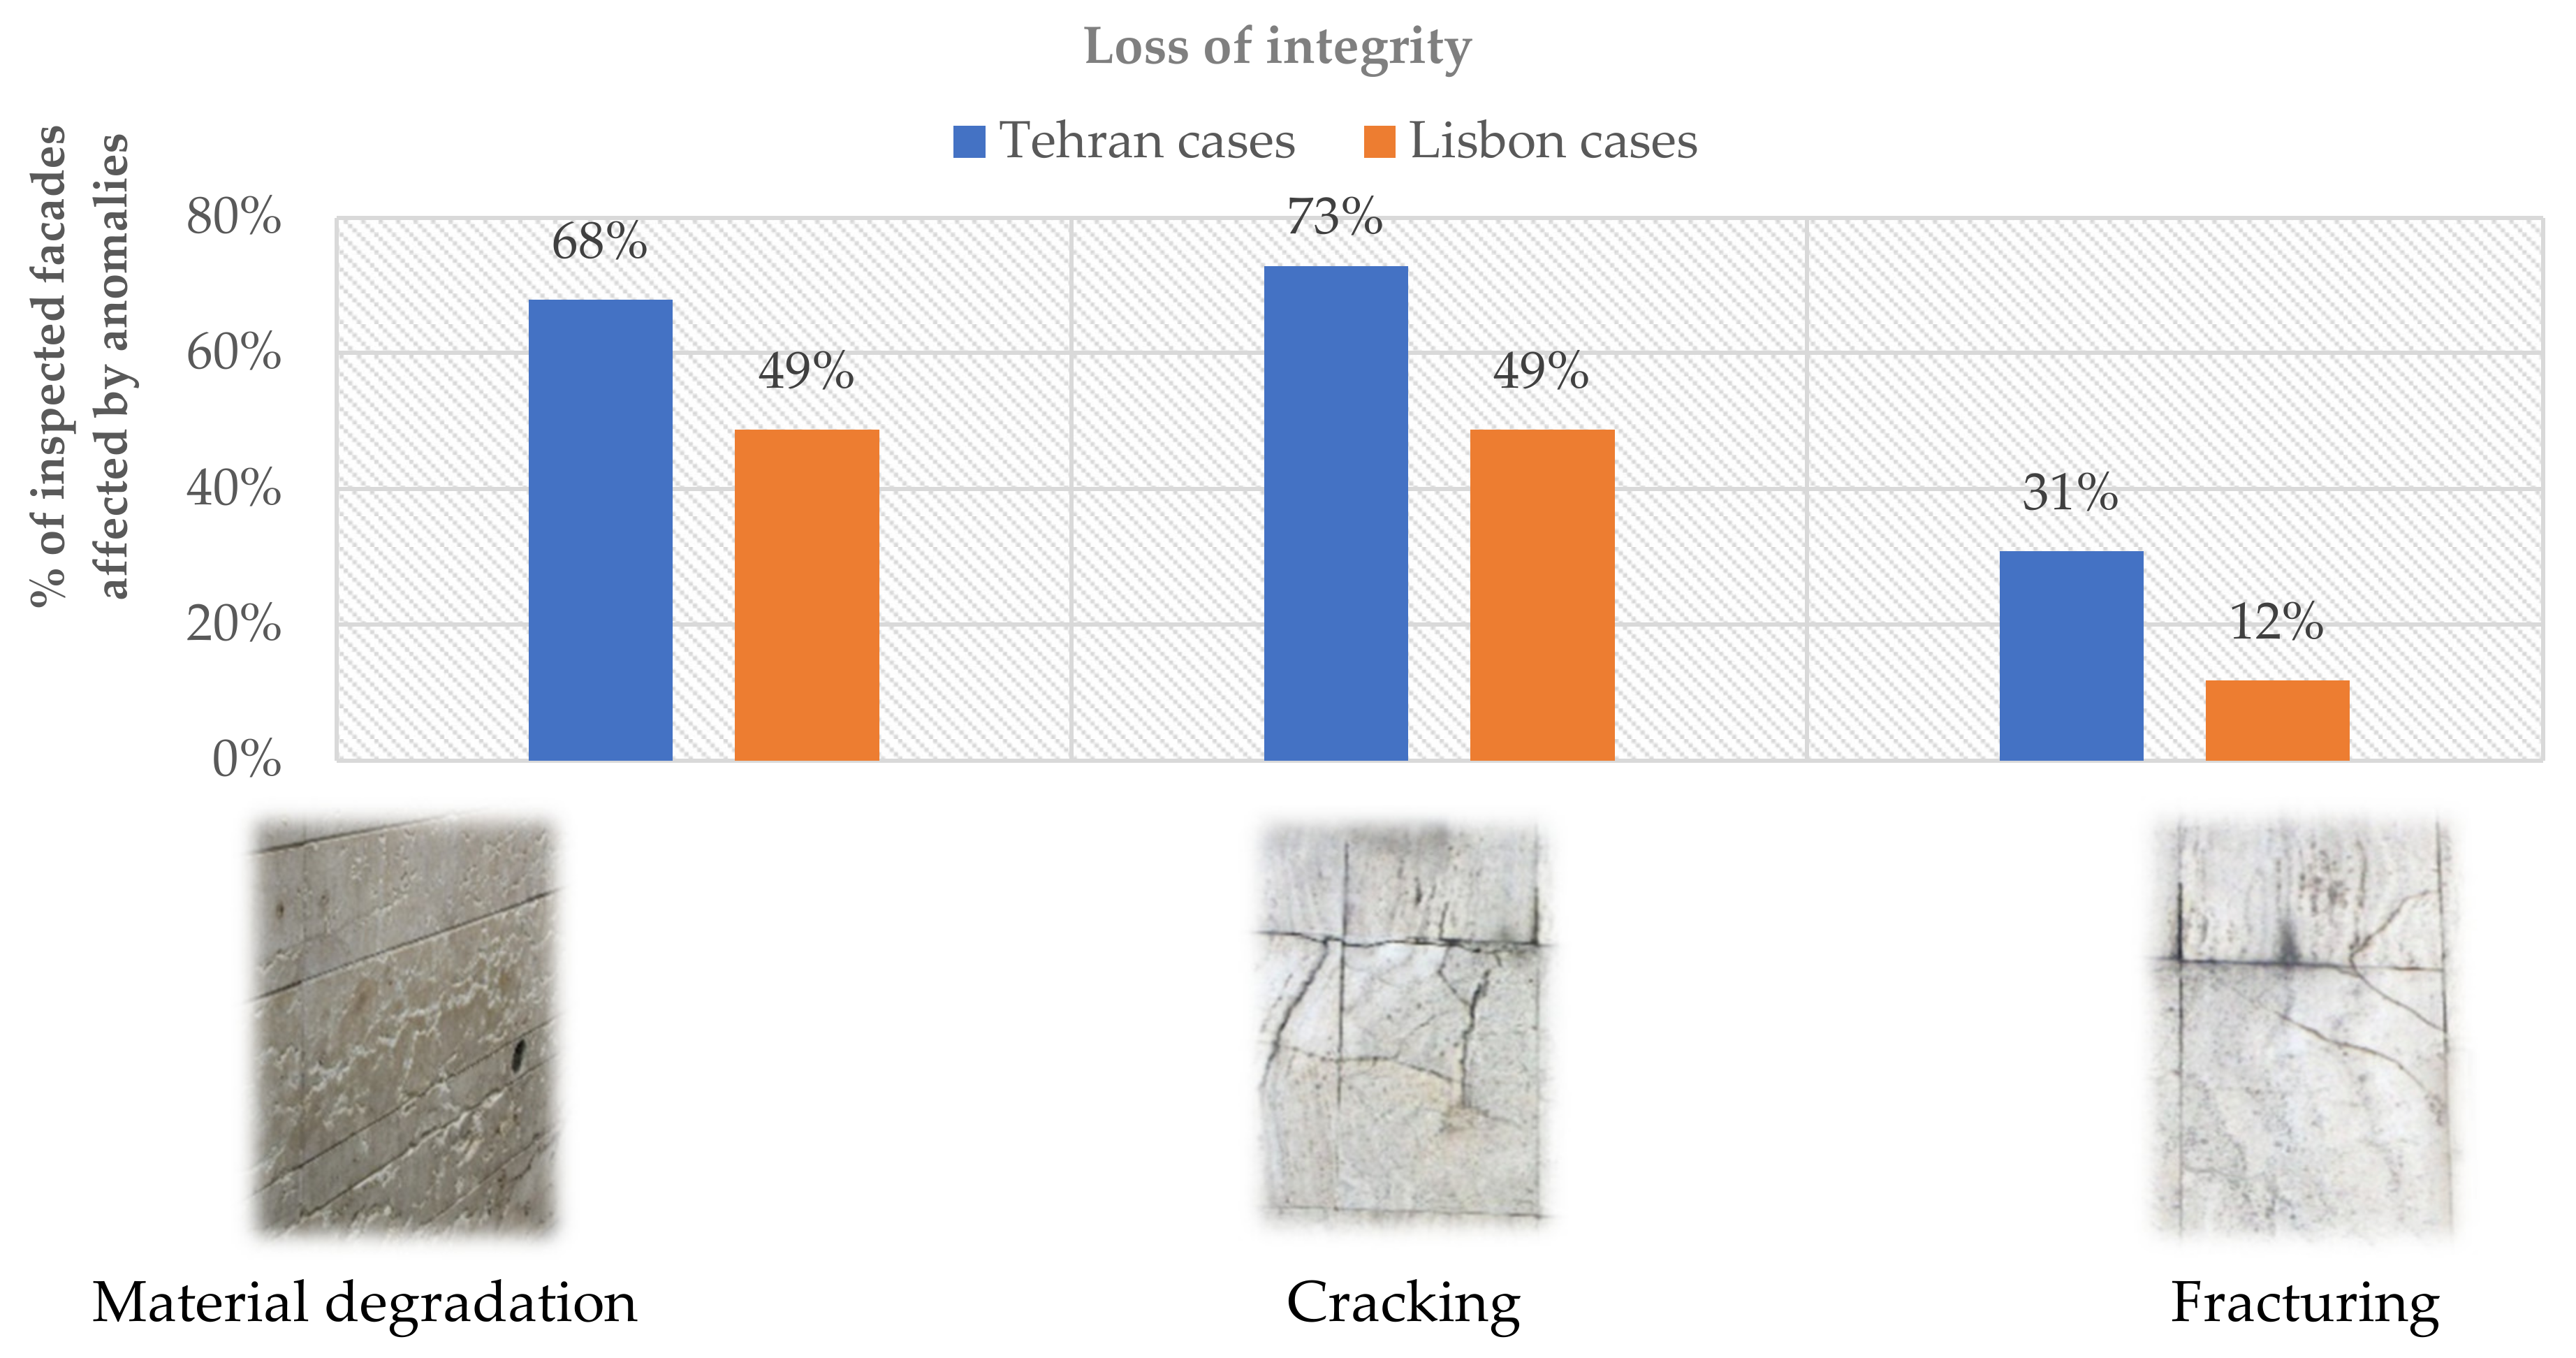
Notwithstanding the lower age of the studied samples in Tehran (with an average age of 26 years and a maximum age of 48 years) in comparison with those in Lisbon (with an average age of 38 years and a maximum age of 89 years), the defects related to the loss of integrity are more frequent in Tehran than in Lisbon, as presented in Figure 7. This result can be justified by the presence of high levels of pollutants in Tehran, which occasionally reach dangerous levels, jeopardising the health of its residents and their quality of life [36,37]. Higher air pollution increases the deterioration and weathering of stone materials [38], causing different types of anomalies related to the loss of integrity of stone plates (e.g., erosion). Moreover, the action of pollutants also promotes discoloration of the stone elements [39], as observed in 46% of the Tehran sample, and a higher deposition of sediments (Figure 4).

Figure 7.
Frequency of the different loss of integrity defects in the samples under analysis.
In this study, the defects inspected visually during the fieldwork survey are discreetly ranked based on the proposal defined by Silva et al. [2,22] regarding the degradation condition of natural stone claddings. In this classification system, which was used in several studies [24,25,27,40], the defects are ranked from 0 (no visible degradation) to 4 (generalised degradation), considering the area of the façade affected by each anomaly and its relative importance within the degradation scale adopted (Table 2).
Table 2.
Classification of the degradation condition of natural stone claddings (data sourced from Silva et al. [2]).
A preliminary analysis of the Tehran data shows that every cladding presents visible defects. Most of the anomalies observed are ranked level 1 (52% of the sample), followed by level 2 (45%) and, finally, by level 3 (3%); none of the inspected claddings belong to level 4. In the Lisbon data, the defects ranked in level 2 are the most common with a frequency of 55%, followed by those in levels 1 and 3, which occur in 27% and 16% of the case studies, respectively, and, finally, anomalies related to level 4 occurred in only 2% of the façades in question [2,22].
4. Service Life Prediction Model
According to the literature, several methods can be used to predict the service life of claddings over time, which can be categorised as analytical, statistical, empirical and experimental [41]. Regarding the probabilistic nature of degradation phenomena in addition to the capability of statistical models to establish probabilistic and statistical means to predict the performance and failure probability [42], the statistical model proposed by Gaspar and de Brito [14] was adopted in the current study. This model was effectively used for the quantification of the degradation condition of various types of claddings and in other geographical contexts, namely in South America [43,44], and this is the first application of this model in Asia. This approach relies on the calculation of a numerical index (severity of degradation), which is given by the ratio among the area of the façade affected by the different anomalies (weighted based on the degradation level and the severity of the anomalies observed), and a reference area corresponding to the maximum hypothetical extent of the degradation for the façade under analysis—Equation (1).
where Sw—normalised severity of degradation of the façade as a percentage; An—area of the cladding affected by a defect n, in m2; kn—defects’ “n” multiplying factor as a function of its condition (between 1 and 4); ka,n—weighting coefficient to encompass the relative consequences of each defect, which considers the cost of repair of defect n (ka,n Є R+) (in absence of more information, ka,n = 1); kmax—weighting factor equal to the worst condition level; and A—total area of the cladding, in m2.
In this study, the groups of defects are weighted according to their repair costs [22] (i.e., the ratio between the total cost of the intervention needed to repair the anomaly and the cost of replacing the cladding). A higher weighting coefficient is thus assigned to the more complex and costly anomalies as shown in Table 3. The values of the weighting coefficient (ka,n) are different for the two samples, since these values are adjusted to the costs applied in each geographical context.
Table 3.
Weighting coefficients corresponding to the relative importance of each group of defects.
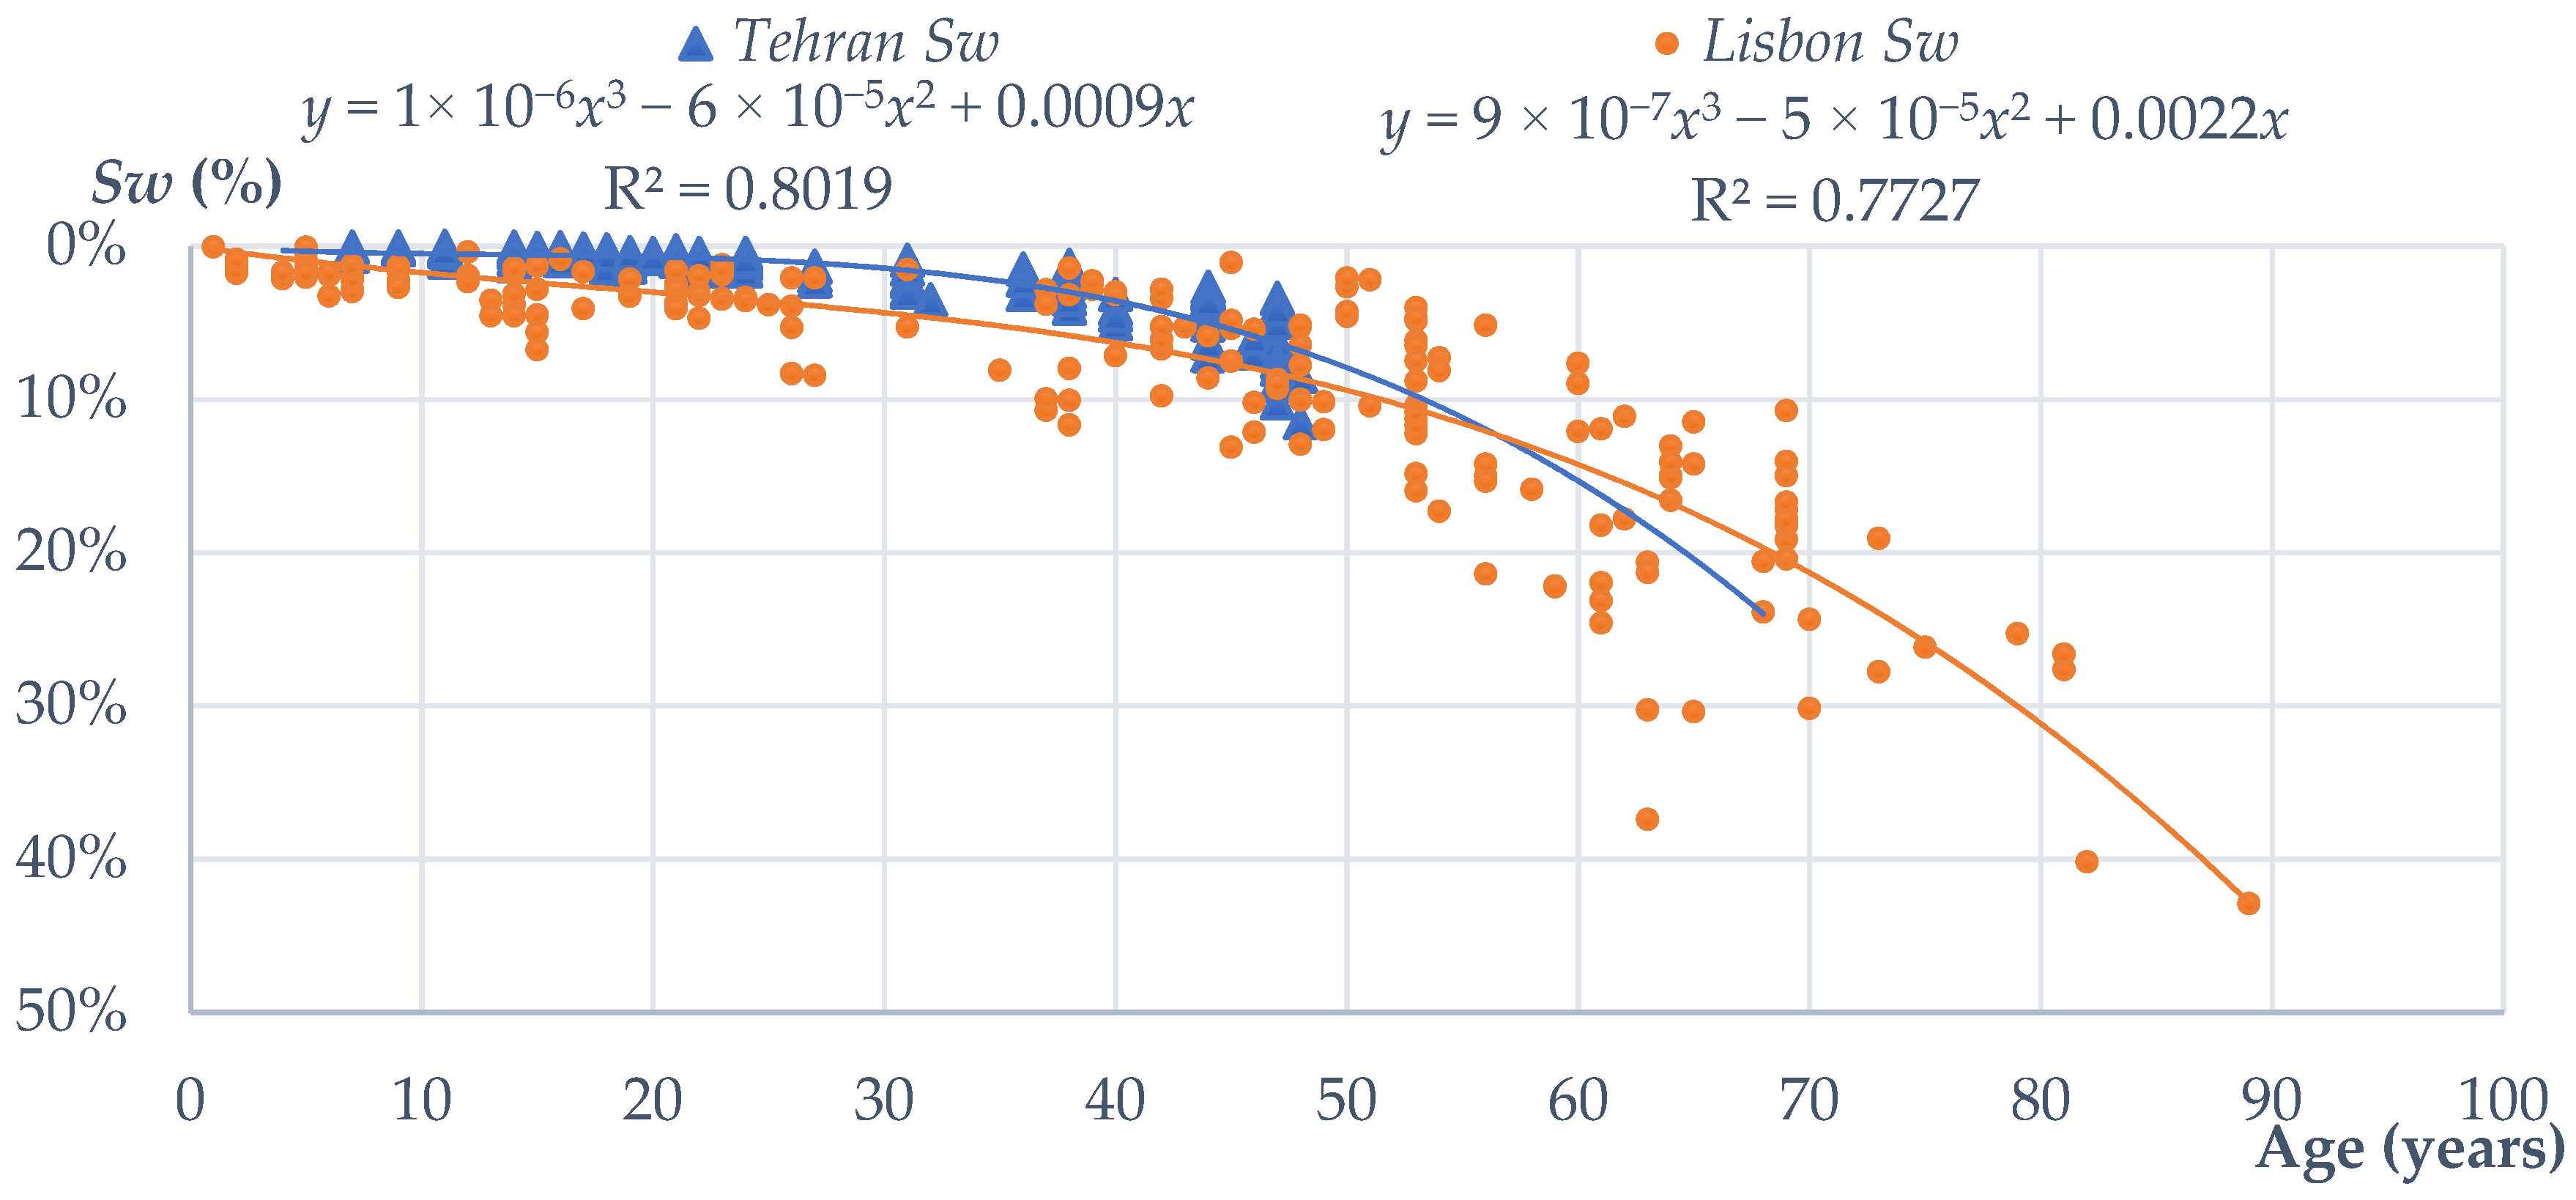
To evaluate the degradation of stone claddings over time, four typical deterioration patterns were proposed by Shohet et al. [20], defined based on specific degradation agents and mechanisms, comprising linear, convex-shaped, concave-shaped and S-shaped patterns. In this study, an S-shaped pattern was used, which allows taking into account different rates of the degradation of stone claddings; i.e., it is capable of describing the process of the cladding’s deterioration, which starts slowly and apparently stabilises over time but accelerates again near the end of the cladding’s service life. Accordingly, “S”-shaped degradation curves are obtained through a nonlinear regression, where a third-degree polynomial line is fitted to the case studies analysed in the fieldwork (Figure 8). The degradation curves of the Tehran and Lisbon data sets lead to a determination coefficient (R2) of 0.80 and 0.77, respectively. This reveals that a high percentage of the variance of the variable “severity” can be described by the proposed curves, i.e., there is a good correlation between the observed values and those predicted by the model.
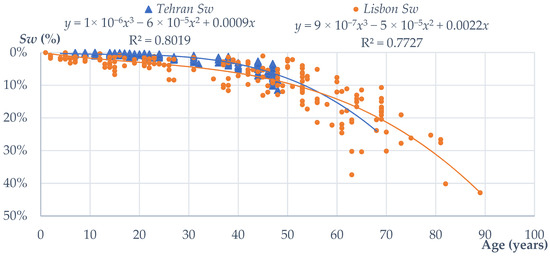
Figure 8.
Degradation curves of the Tehran and Lisbon samples.
To estimate the service life of the natural stone claddings, a threshold degradation level that establishes the end of its service life must be defined. The relevant literature on this subject suggests that establishing the conventional limit for the end of service life is not simple, depending on acceptance criteria, not certainly determined by “pure” scientific methods. Therefore, and according to previous research on natural stone claddings [2,22,27], a degradation severity level of 20% was chosen in this study to establish the end of service life. Accordingly, an estimated service life of 65 years was obtained, using the degradation curves in Figure 8, for the claddings located in Tehran, and an estimated service life of 68 years was calculated for the claddings in Lisbon.
5. Analysis of the Degradation Evolution According to Claddings’ Characteristics
Various studies [2,10] discuss the relevance of several contributory factors for the presence of defects in natural stone claddings, which are responsible for the claddings’ deterioration. In fact, the stone claddings show a distinct behaviour in terms of deterioration because of the great variability of their characteristics. In order to compare the degradation evolution in Tehran and Lisbon, the claddings’ features chosen in the research conducted by Silva et al. [2] for the Lisbon samples were also analysed in this work for the Tehran cases. They comprise the type of stone and related properties (colour, size and type of finishing), location of the cladding in the facade, the facade’s orientation and their exposure to environmental conditions (wind/rain action).
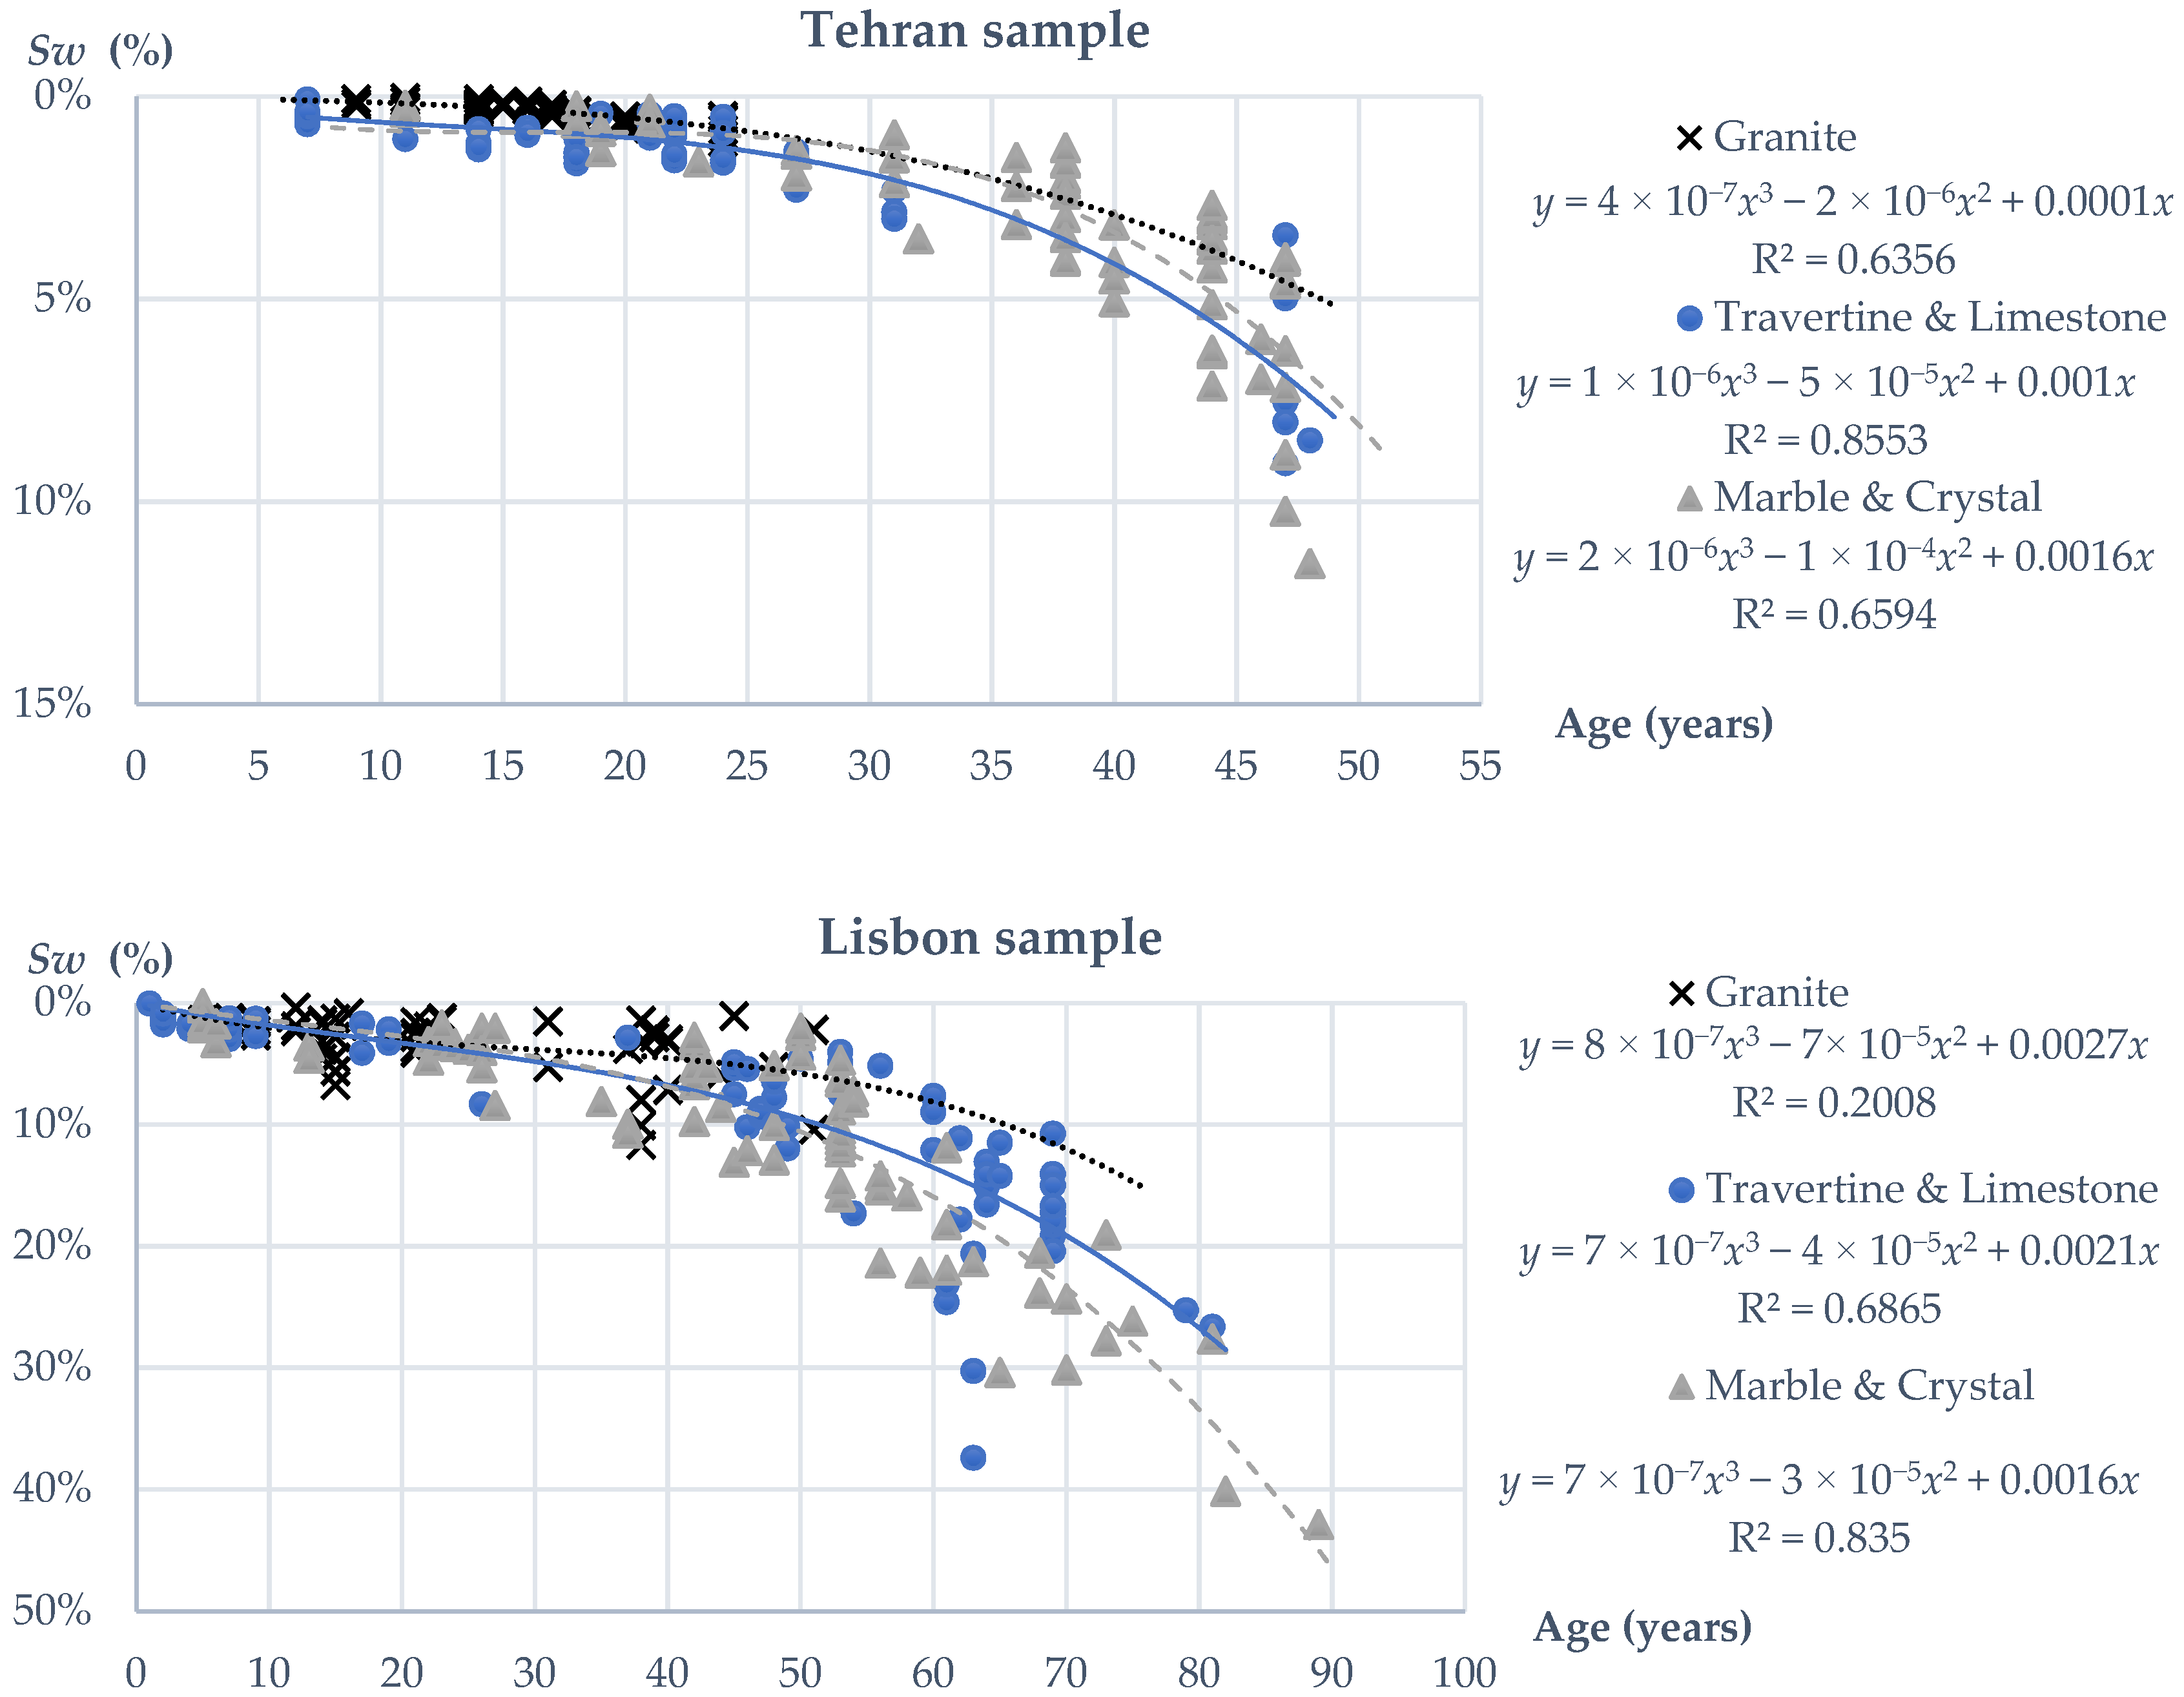
Natural stone is generally classified into three groups—igneous, sedimentary and metamorphic [30,31]—according to its mineral and chemical composition, the texture of the constituent particles and the genesis processes. Therefore, the samples under analysis here were grouped into three categories: (i) granite and similar stones, (ii) travertine and limestone and (iii) marble and crystal. Figure 9 provides the degradation evolution over time according to the type of stone plates used in the claddings.
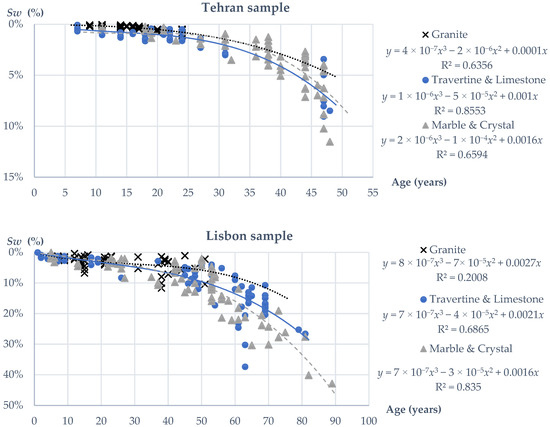
Figure 9.
Degradation curves of the Tehran and Lisbon samples, according to the type of stone.
In both research areas, granite stones present a longer estimated service life, even though the Lisbon data show a curve that is statistically unreliable due to a high scatter of results. In second and third place, the degradation curves reveal that travertine and limestone are more durable than marble and crystal in exterior wall claddings. An estimated service life of 64 and 63 years was obtained for limestone and marble, respectively, in Tehran, while 78 and 66 years were the estimated service lives obtained for limestone and marble, respectively, in Lisbon. These results are consistent with those of Schouenborg et al. [45], who found that granite is the most durable cladding stone, followed by limestone and then marble, by analysing the strength capacity of stone plates of 200 buildings.
Regarding the colour of the natural stone plates (Figure 10), both light and dark colours exhibit a good correlation between the field results and the degradation curves. Figure 9 shows that the degradation progress of stone claddings with light colours is faster than those with dark colour stones at the preliminary 50 years of the façade’s service life in both Tehran and Lisbon. On the contrary, after that time interval, there are no case studies in Tehran, and more data regarding claddings with dark colour stones must be collected in order to obtain unequivocal conclusions. The literature does not provide any indication regarding the relevance of colour for the deterioration of stone claddings [2]. In the Tehran sample, light colour stone claddings tend to present a higher incidence of defects than the dark colour ones, mainly because some defects, such as staining or soot deposition, are easily identified in light colour claddings [14], and, moreover, dark colours are usually associated with more durable stones, such as granites and other eruptive rocks [22].
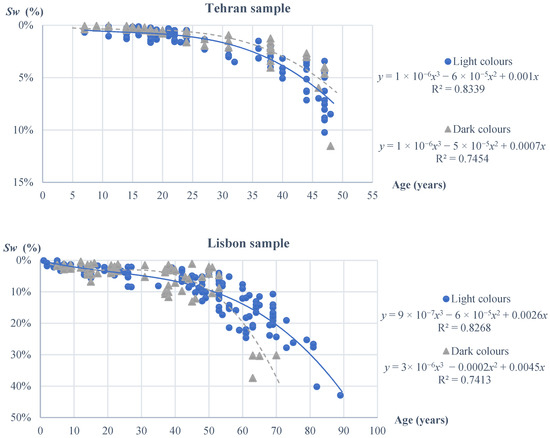
Figure 10.
Degradation curves of the Tehran and Lisbon samples, according to the colour of stone.
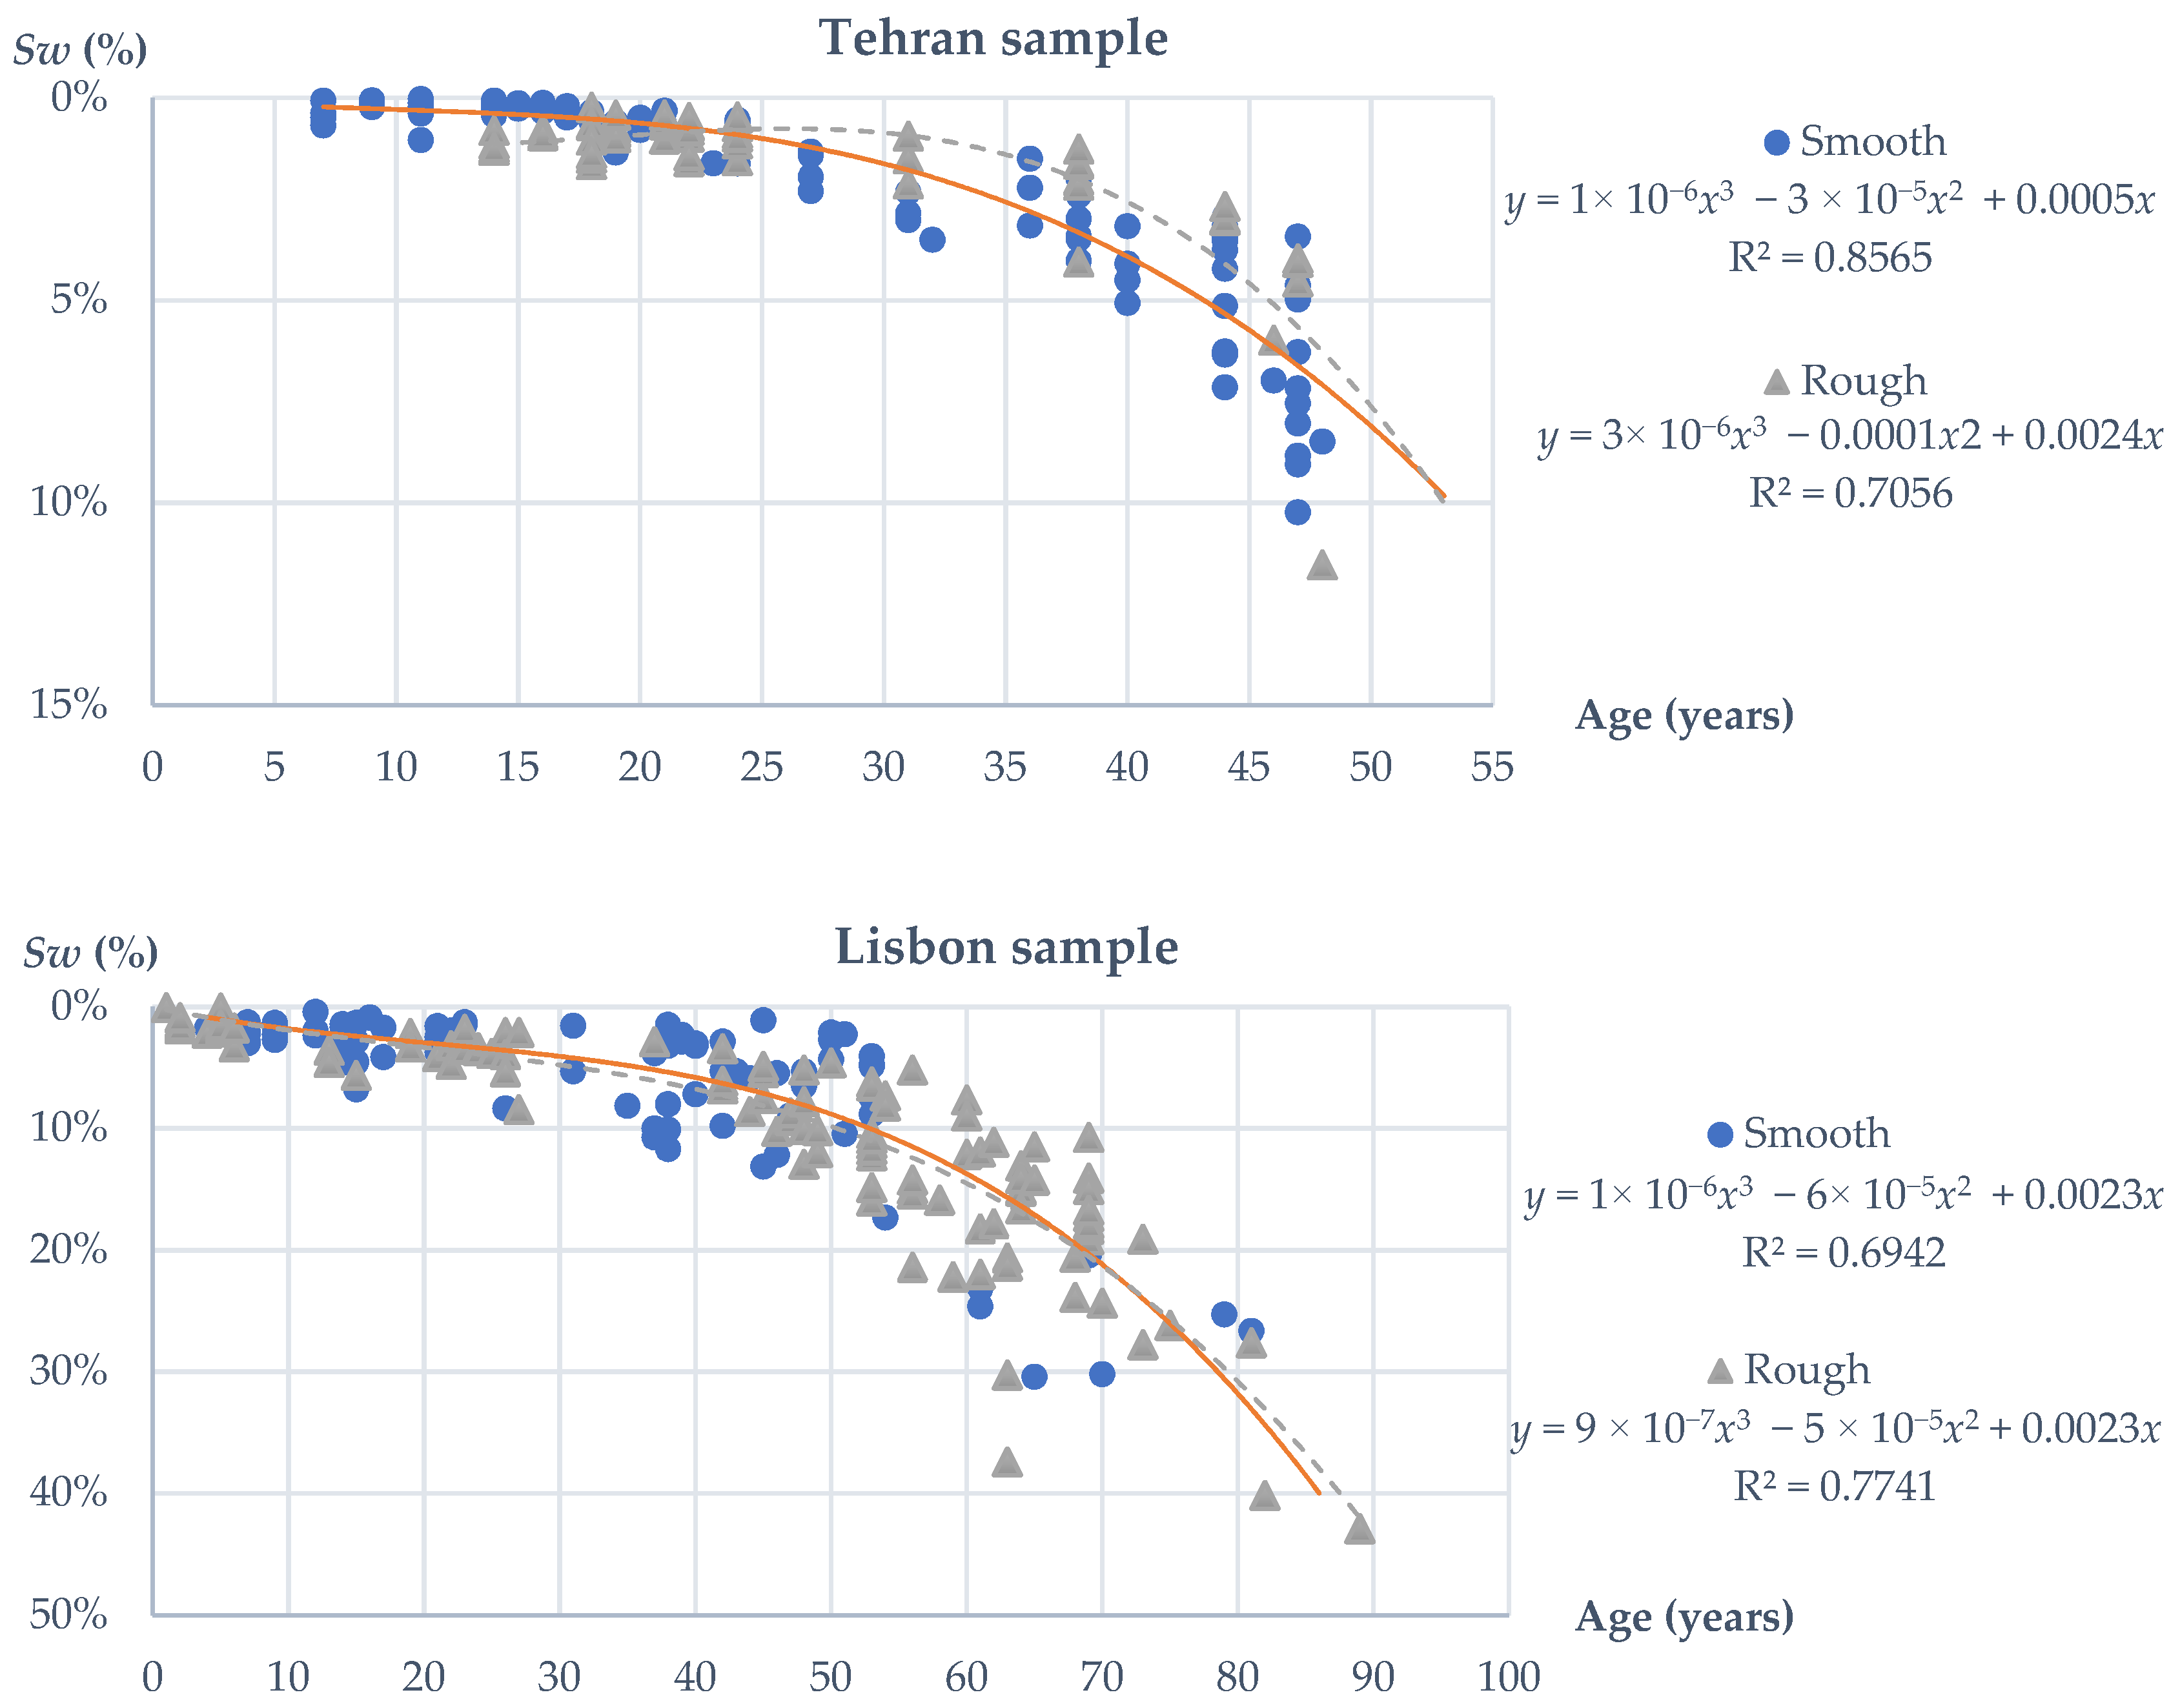
In terms of type of finishing (Figure 11), subtle variations in the surface finishing produce some differences in decay patterns and the degradation evolution of stone claddings. Various studies suggest that the polishing of stone surfaces would partially inhibit the weathering effect because of the reduction in the open porosity of the stone surface, which exerts an influence on salt decay by fog sea-salt deposition in coastal areas, such as Lisbon, or soot deposition in the polluted air of Tehran [46,47,48]. In other words, claddings with a rough finishing present higher degradation indexes mainly due to having a higher area of stone exposed to the climatic degradation agents [49]. The results from this study (Figure 11) are coherent with previous findings, and an estimated service life of 67 and 61 years was obtained for claddings with smooth and rough finishings, respectively, in Tehran, while an estimated service life of 69 and 67 years was calculated for Lisbon for the same categories.
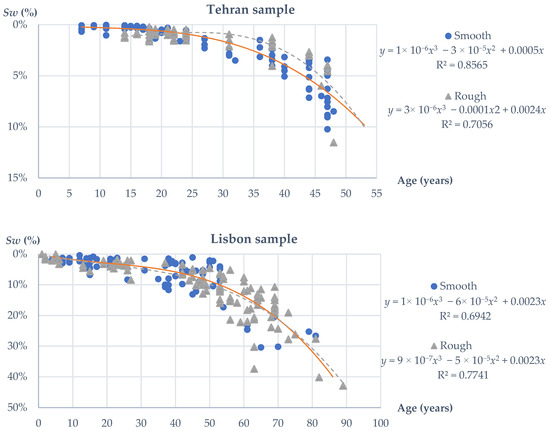
Figure 11.
Degradation curves of the Tehran and Lisbon samples, according to the type of finishing.
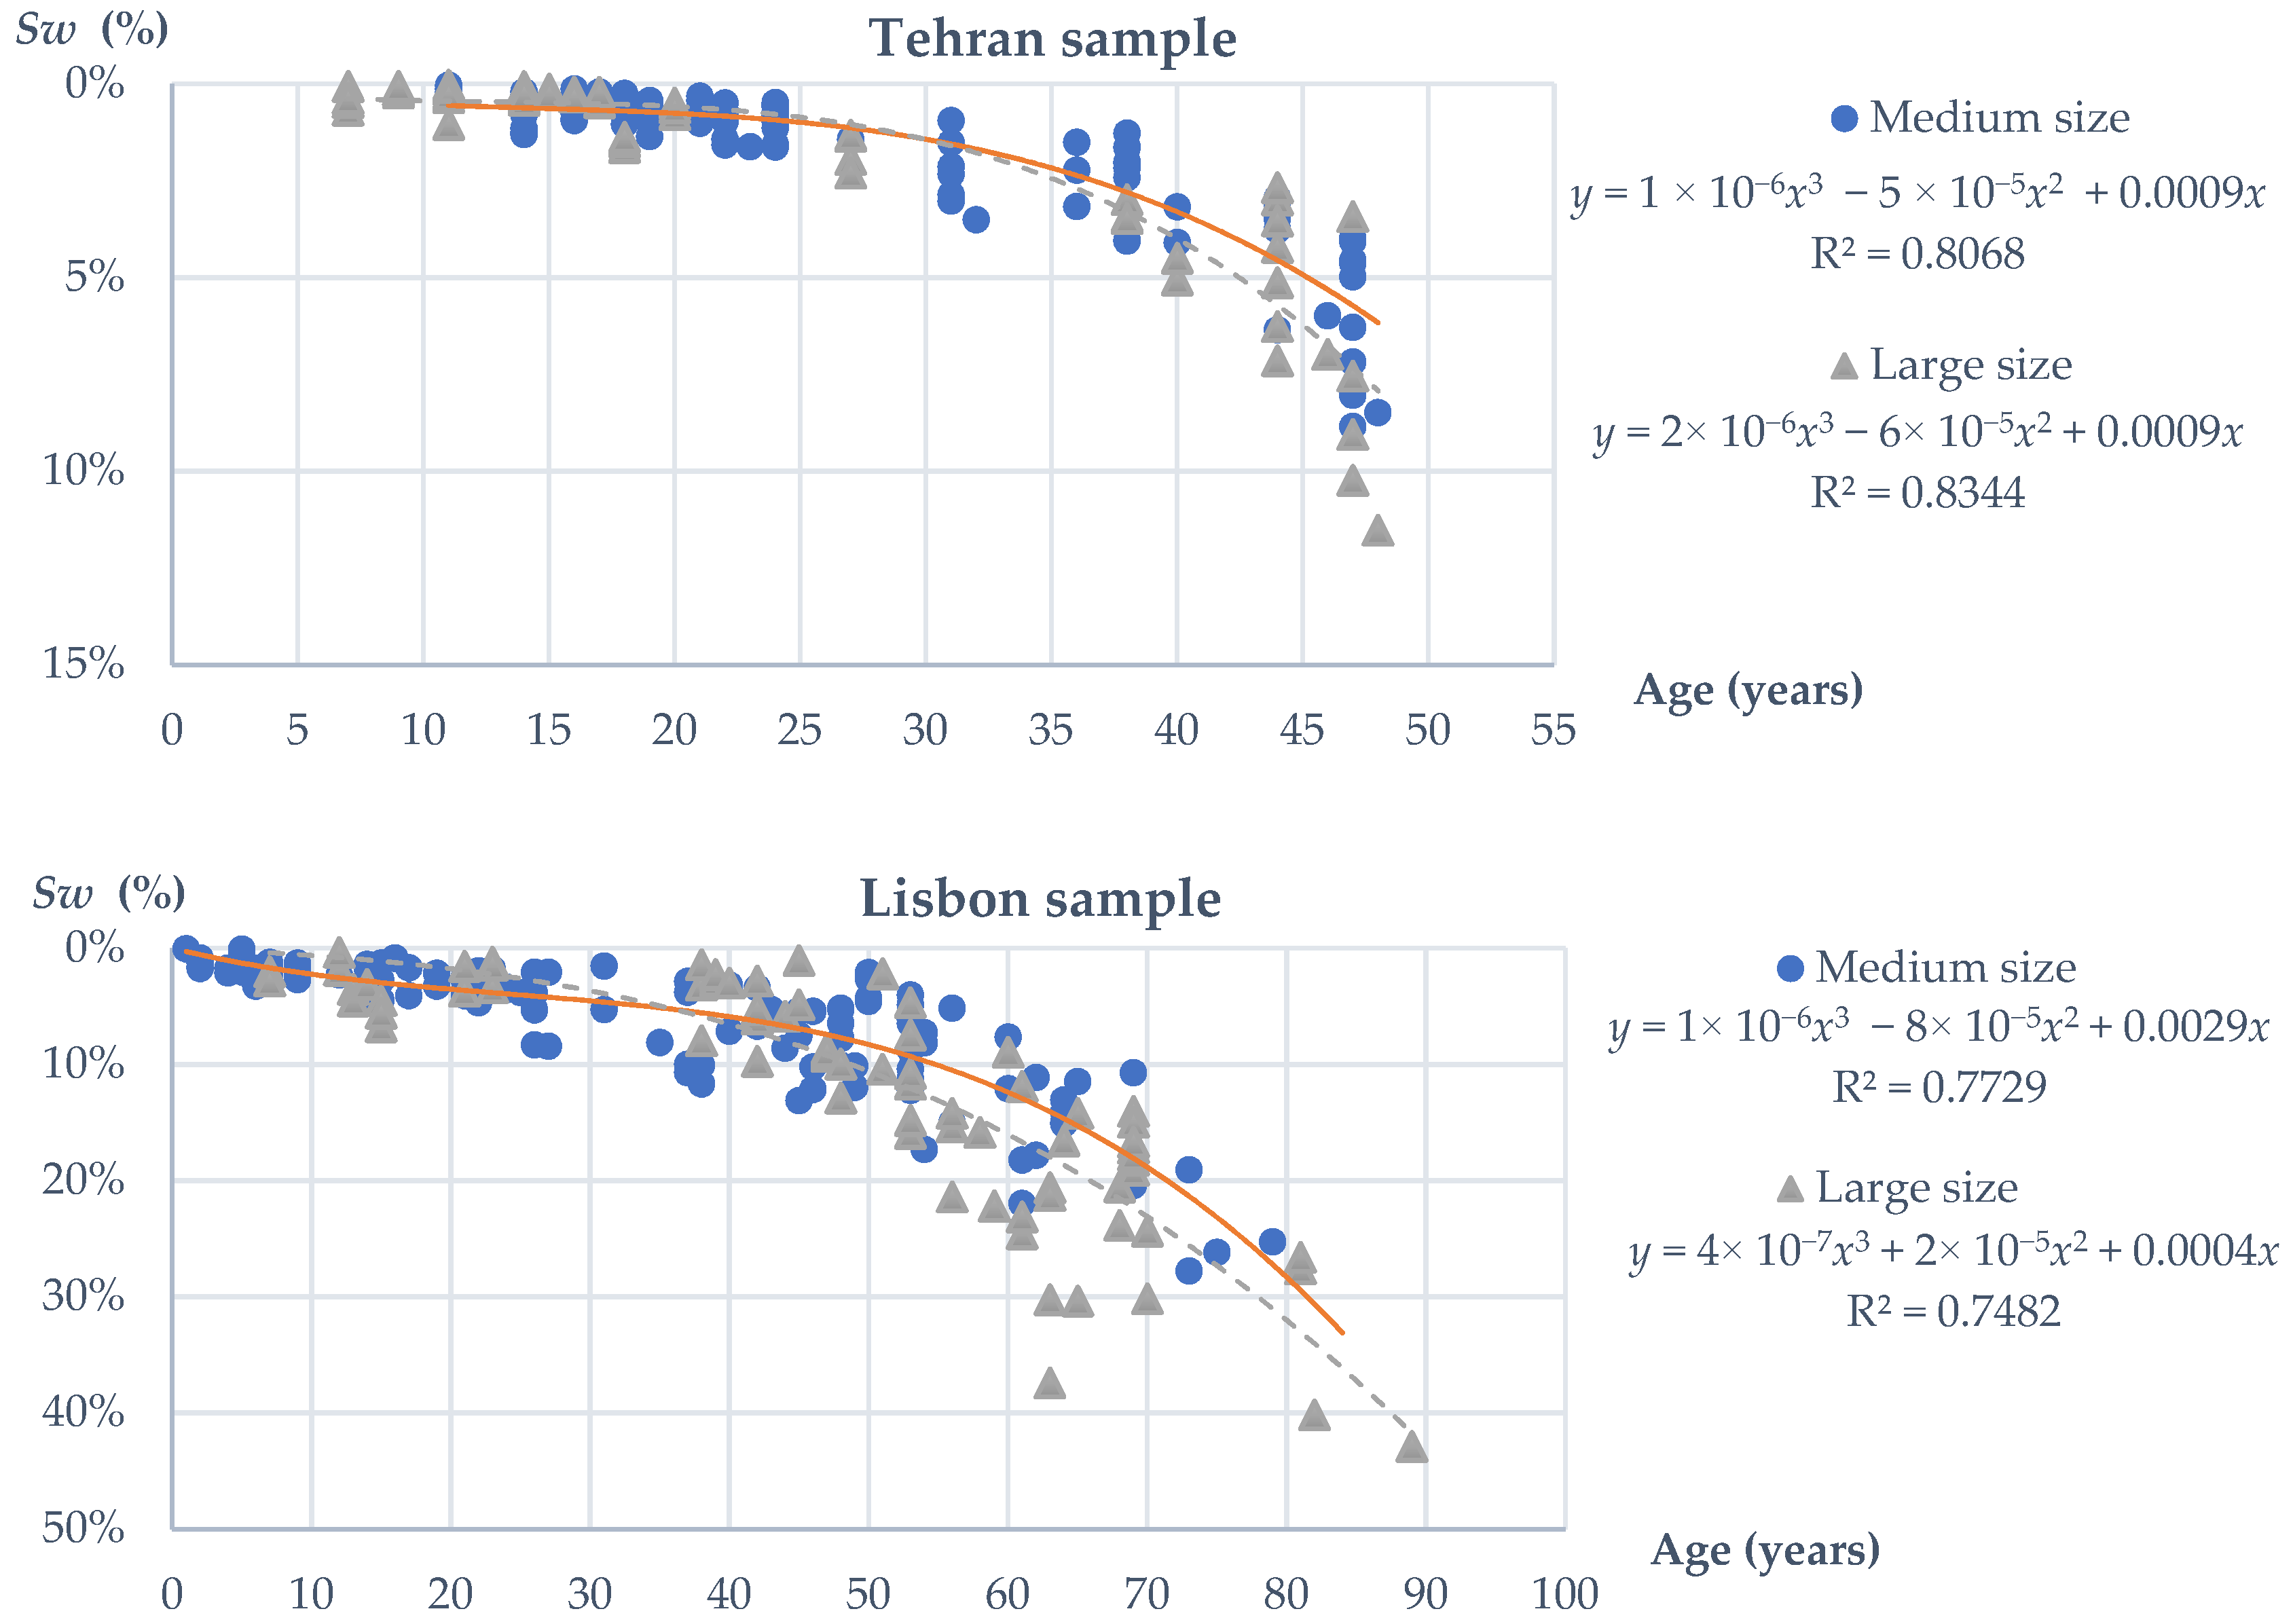
Regarding the evolution of the degradation condition of stone claddings according to the size of the stone elements (Figure 12), the results reveal that claddings with medium size plates (area < 0.4 m2) present longer estimated service lives than those with larger stone plates (area ≥ 0.4 m2). As mentioned by Silva et al. [2], this can probably be explained by the fact that the larger the size of the stone elements, the greater the cladding’s susceptibility to weather effects, in addition to the lower relative area of the joints in the larger plates and a resulting higher concentration of stresses, which can promote a higher incidence of defects. Based on the degradation curves (Figure 11), an estimated service life of 67 and 61 years was obtained for the Tehran claddings with medium and large stone plates, respectively, and 71 and 66 years for the Lisbon sample.
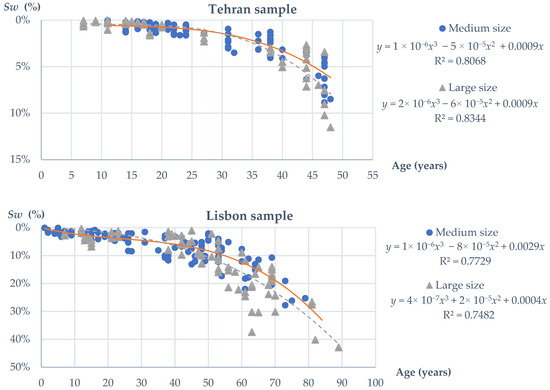
Figure 12.
Degradation curves of the Tehran and Lisbon samples, according to the size of the stone elements.
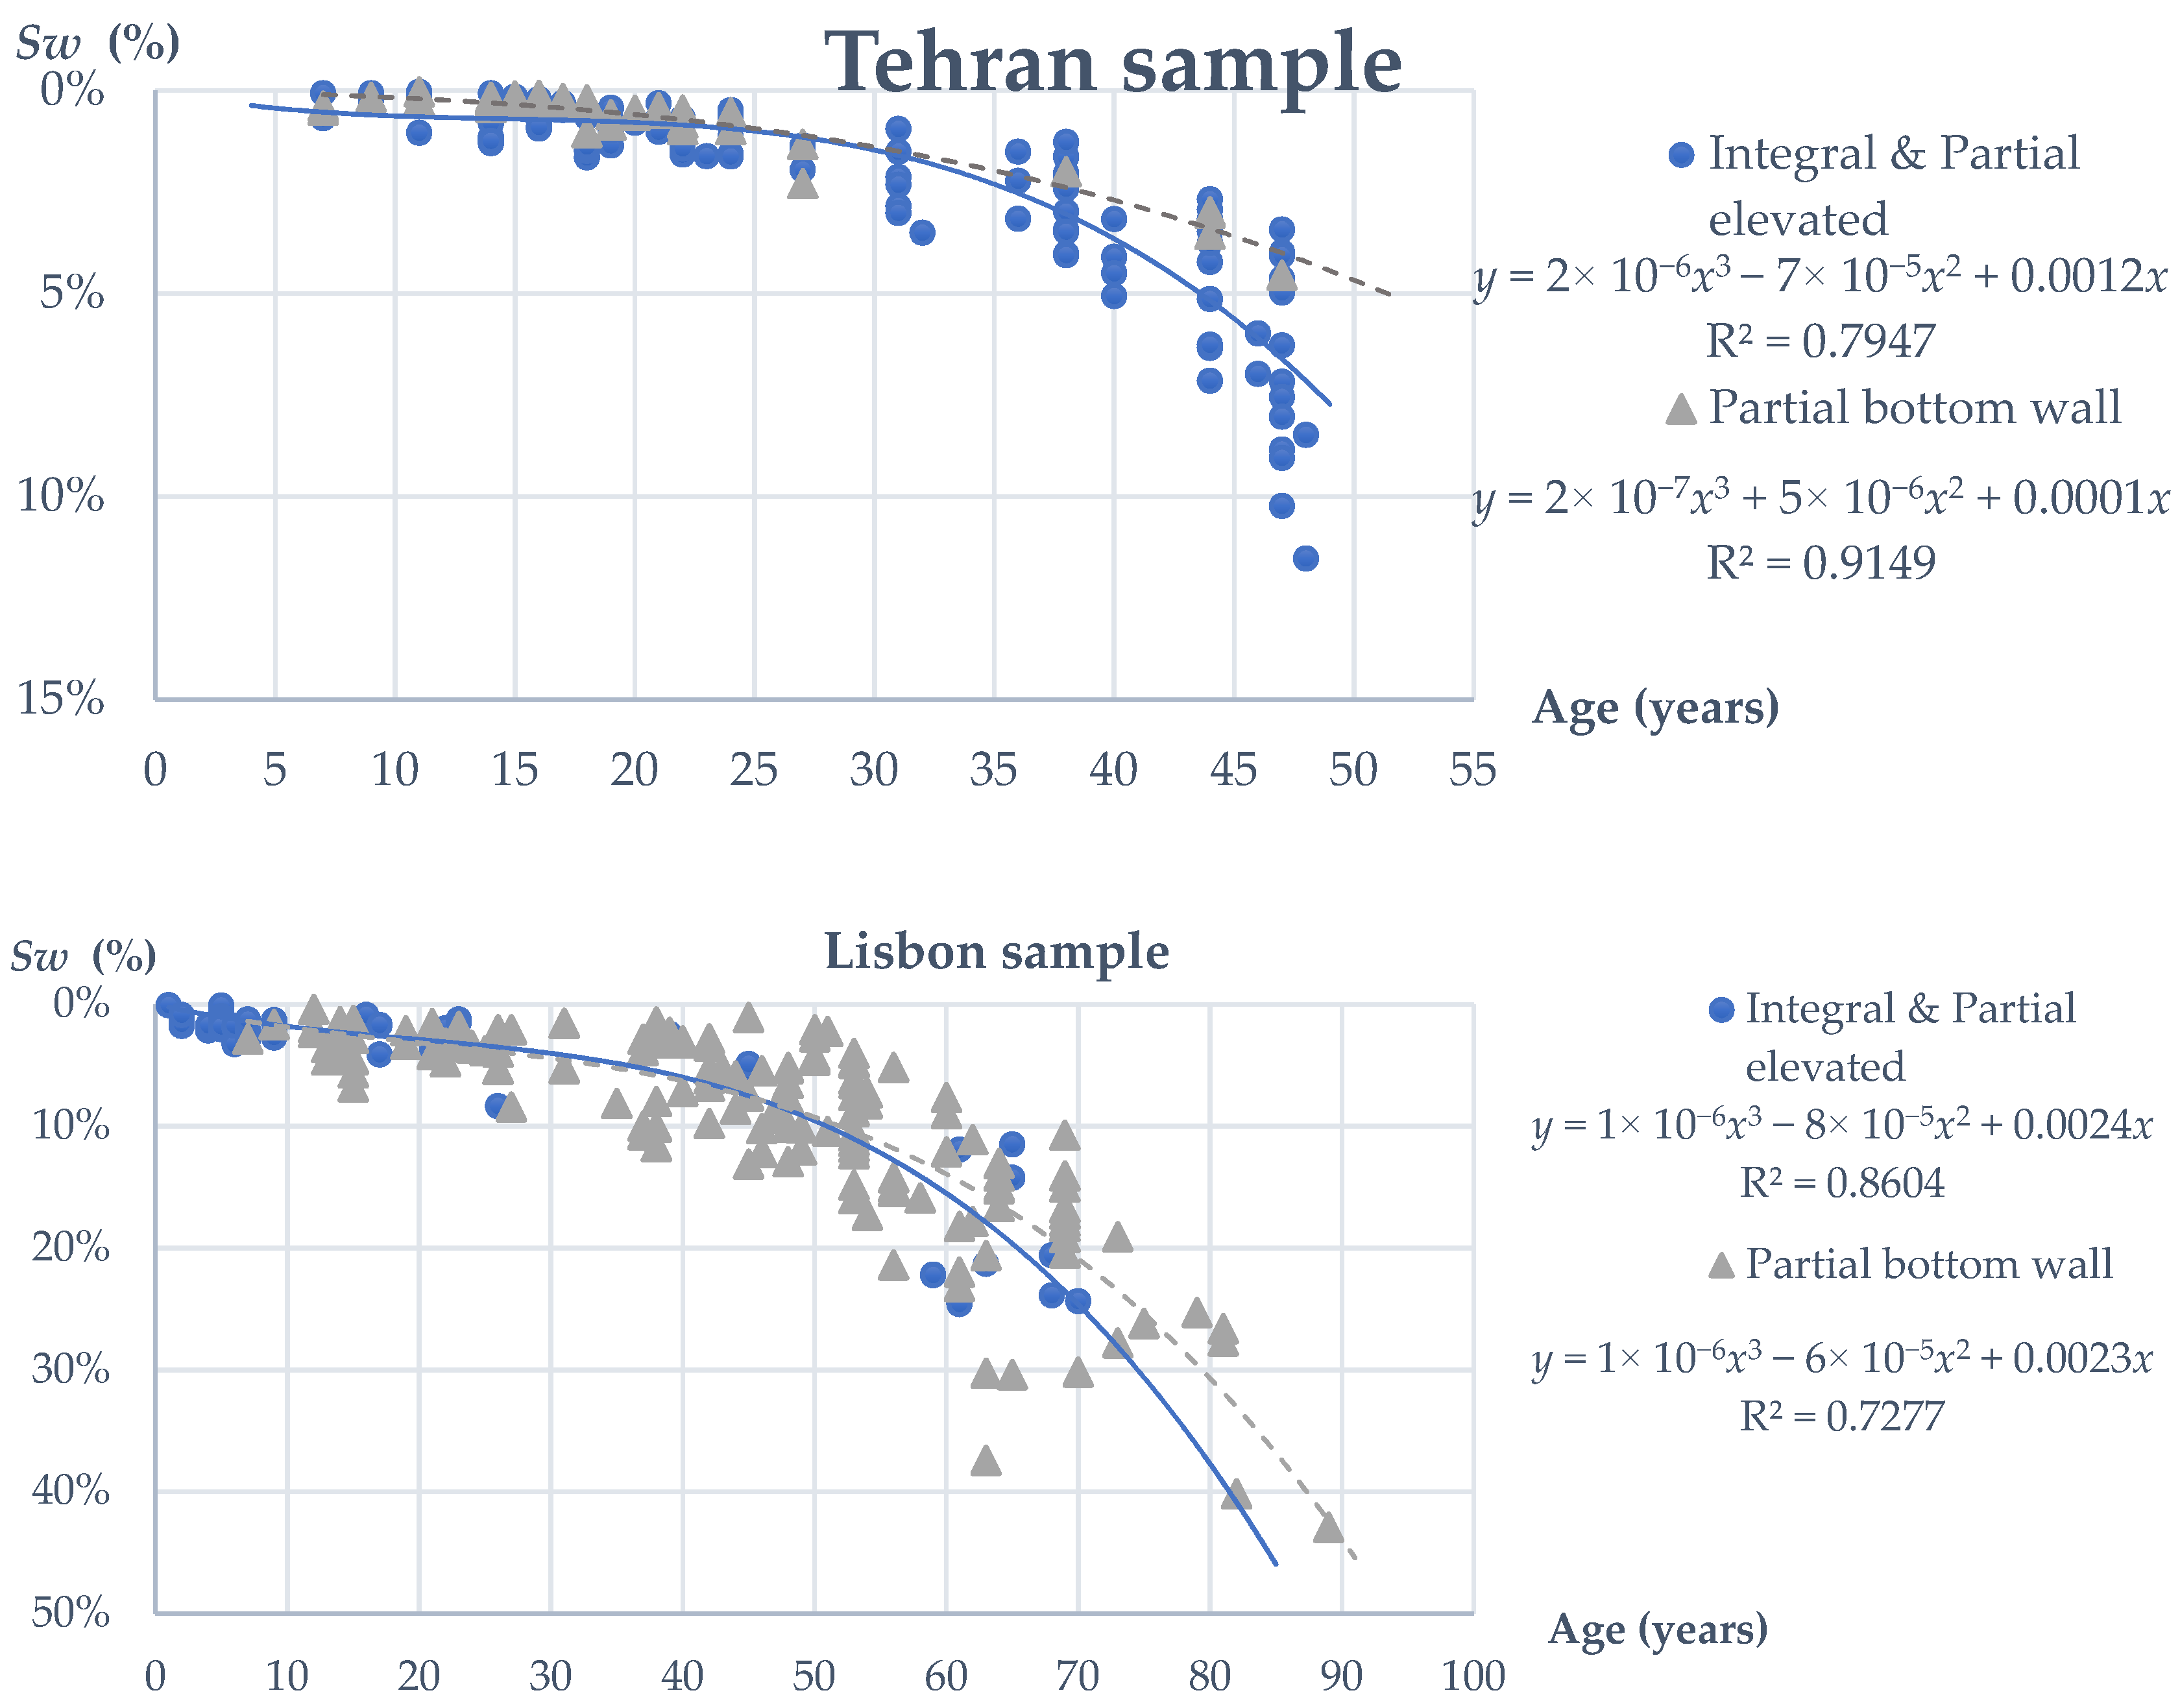
In terms of the location of the cladding (Figure 13), the samples under analysis were grouped depending on whether the stone cladding was located in the taller areas of the façade (integral or partial elevated cladding) or only in the lower floors of the building (partial bottom cladding).
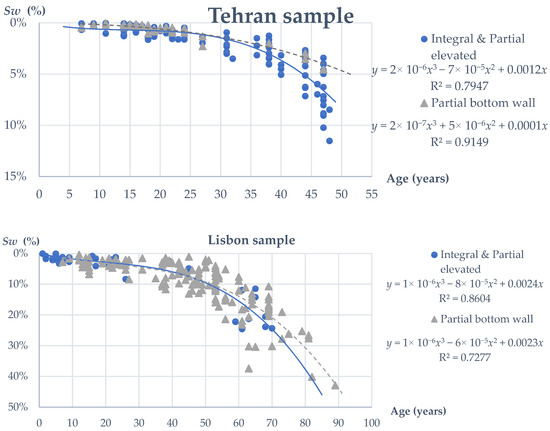
Figure 13.
Degradation curves of the Tehran and Lisbon samples, according to the location of the cladding.
Westberg et al. [50] suggested that the higher levels of façades are more exposed to the environmental agents, which can lead to a rapid deterioration of the stone claddings. Furthermore, bottom wall claddings are more accessible to carry out maintenance actions, so they are expected to have longer estimated service lives [2,22]. This study also leads to the same results, as shown in Figure 13, since an estimated service life of 63 years was obtained for partial or elevated claddings and 87 years for bottom wall claddings in the Tehran sample, while an estimated service life of 69 and 65 years was obtained for the bottom wall and elevated stone claddings in Lisbon, respectively.
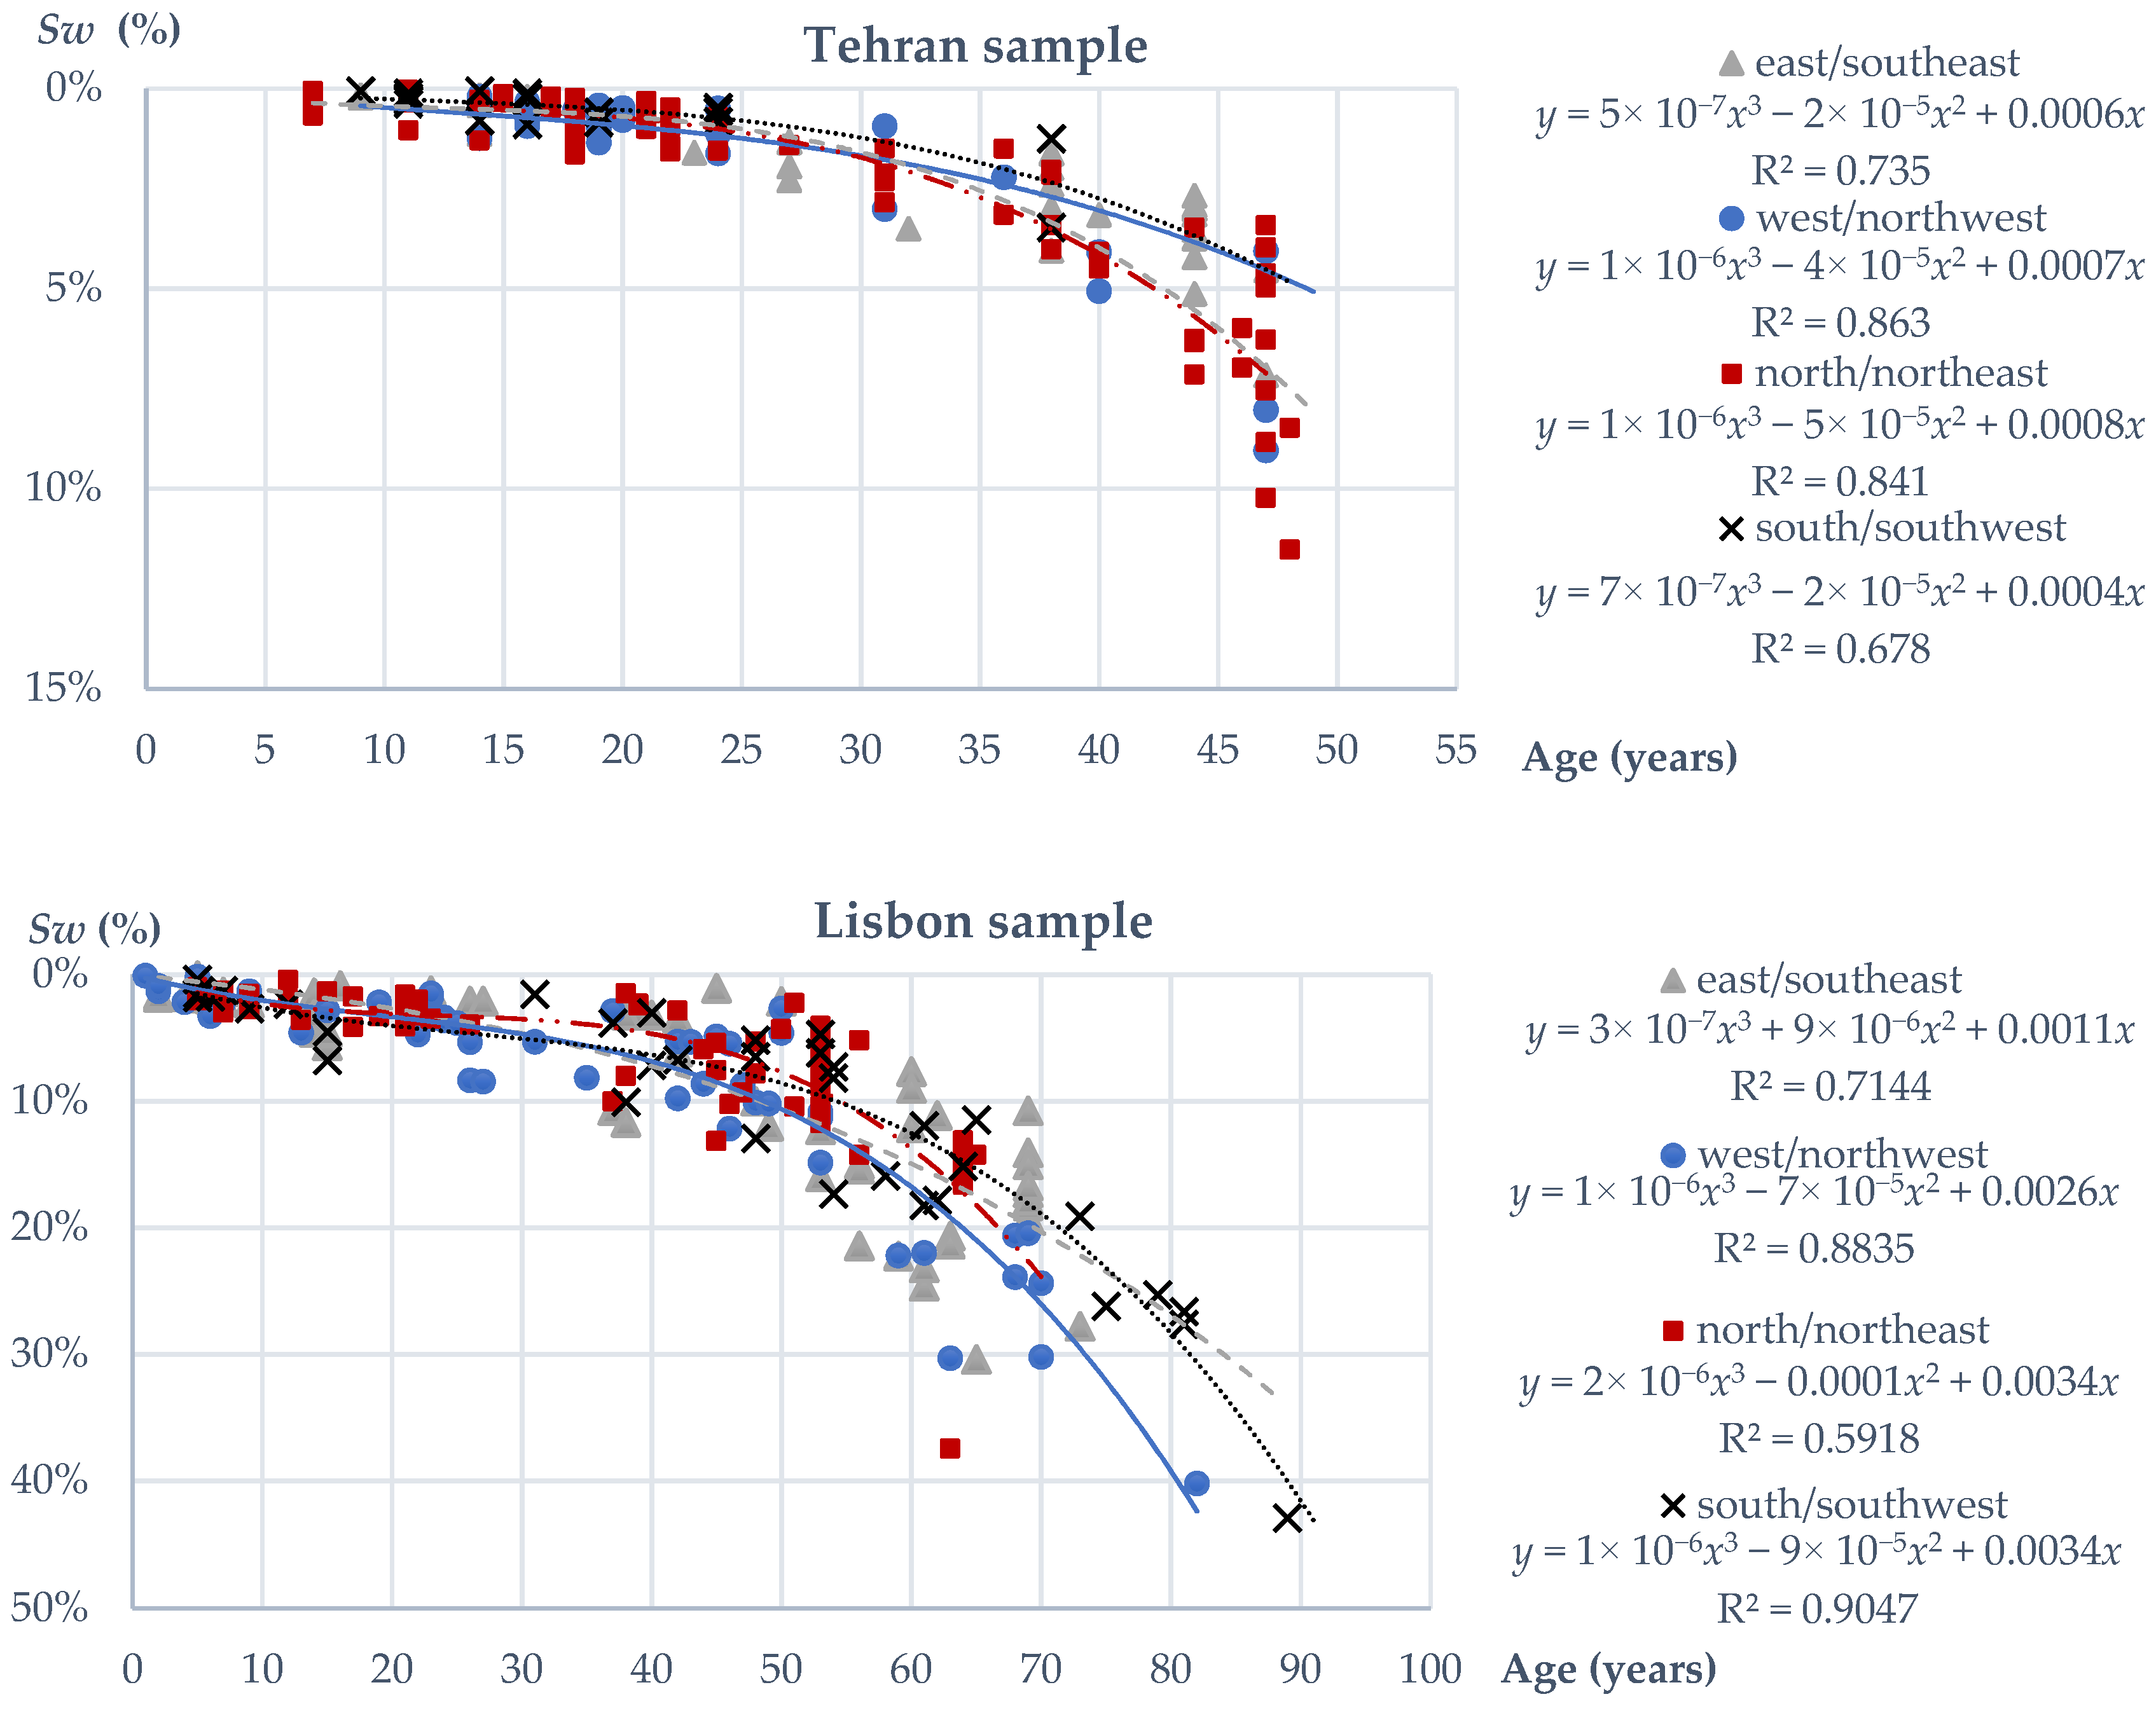
The literature review on the degradation of building façades reveals that moisture is one of the main factors for materials’ deterioration [51]. Wind and solar radiation are responsible factors for moisture settling on the façade and are variable in accordance with the geographical orientation [52]; hence, an analysis of the degradation curves according to the claddings’ orientation seems relevant for the analysis of the degradation over time of stone claddings, and they are illustrated in Figure 14.
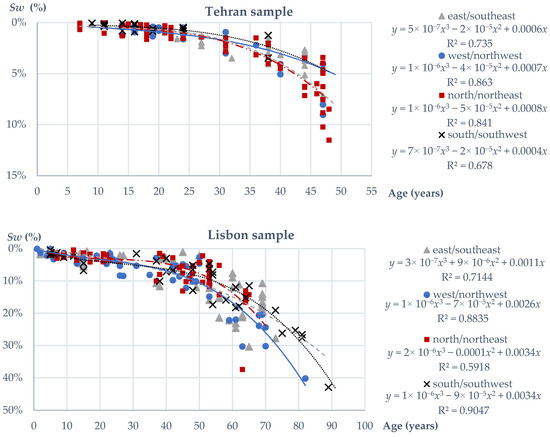
Figure 14.
Degradation curves of the Tehran and Lisbon samples, according to the façades’ orientation.
According to Gaspar and de Brito [14], regarding the rate of the erosion process according to the façades’ orientation, the authors concluded that north and west are the most critical orientations in Portugal. This has been confirmed by Emídio et al. [24], who suggested that the stone claddings facing east and south are more durable, while claddings facing west and north tend to present lower service lives. The outcomes of the current study for the Lisbon sample reveal that the most favourable cladding orientations are, in decreasing order, south, east, north and west, with estimated service lives of 71, 70, 67 and 64 years, respectively, which corroborate the findings of the previous works.
In accordance with the meteorological statistics [53], the prevailing winds in Tehran come from the west. Therefore, the probability of the incidence of wind-driven rain is high in that orientation, thus being more prone to suffer from anomalies due to the presence of moisture. Accordingly, in the sample analysed (Figure 14), stone claddings facing north/northeast and west/northwest show lower estimated service lives (63 and 64 years, respectively) in comparison with those facing south/southwest and east/southeast (with estimated service lives of 74 and 78 years, respectively).
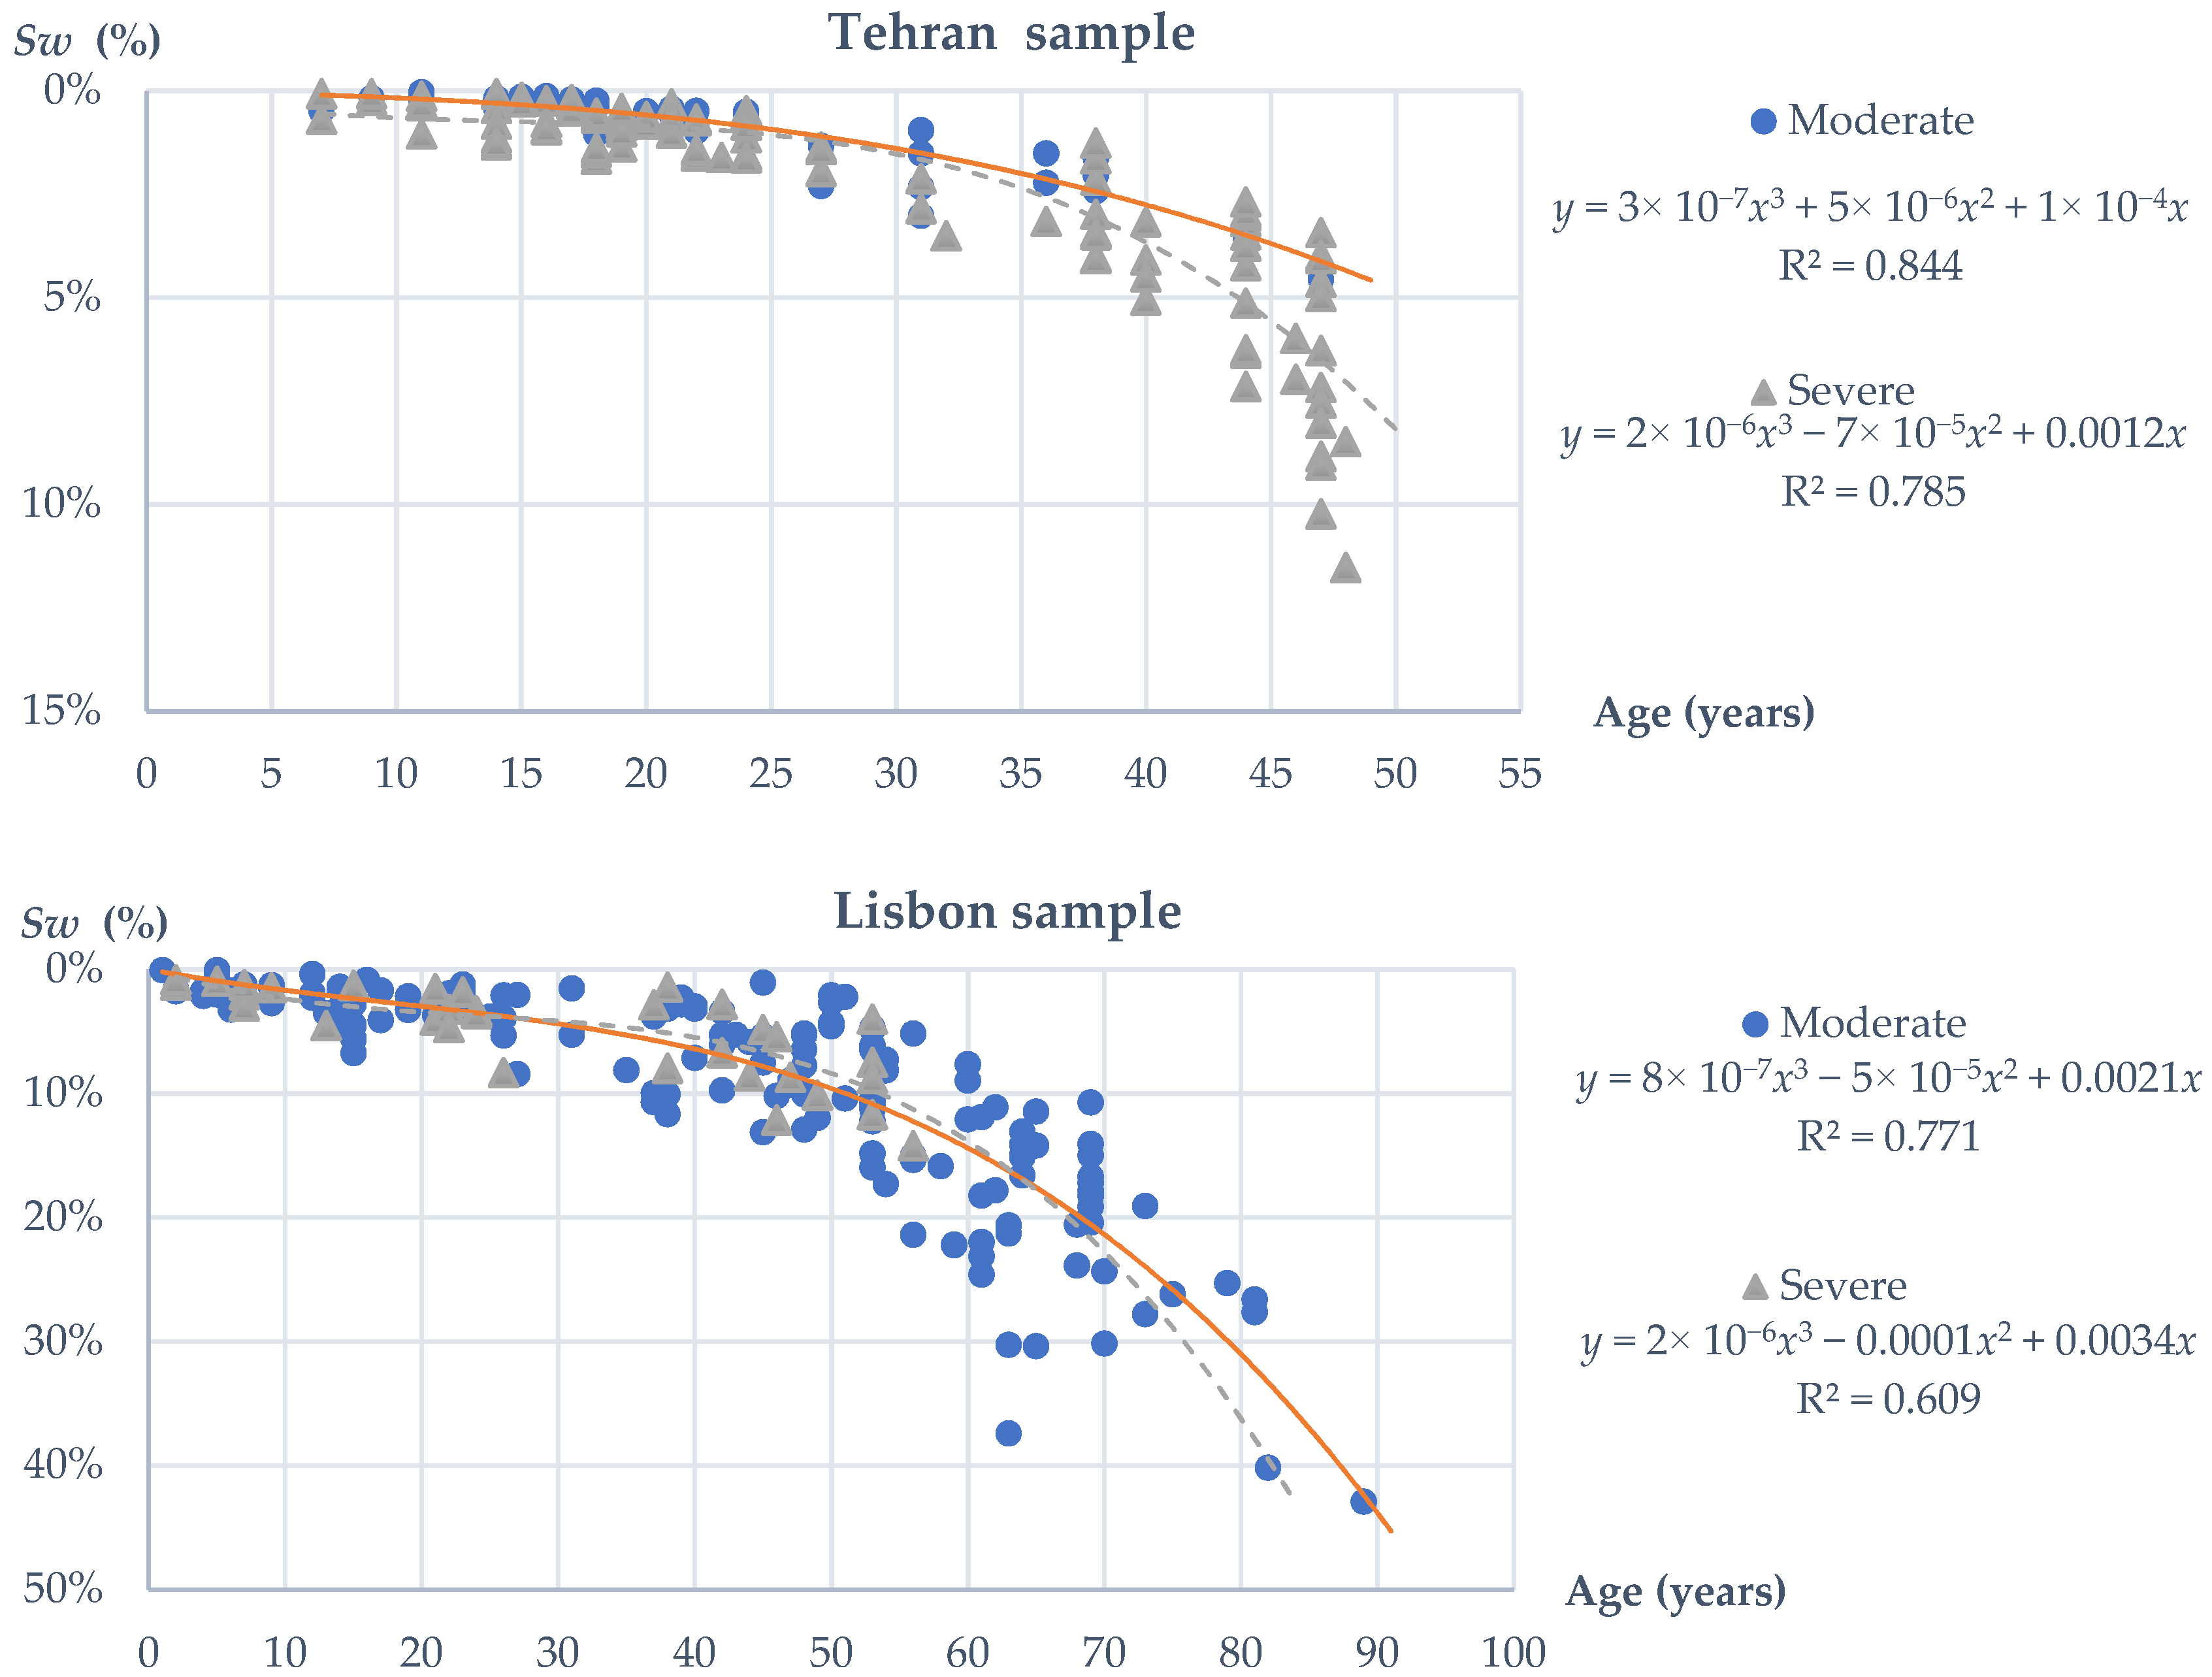
Concerning the exposure to the combined action of wind and rain (Figure 15), two categories are considered: (i) stone claddings exposed to a severe action of wind and rain, in façades that are not protected by surrounding buildings or vegetation, in elevated areas; and (ii) stone claddings with a normal or moderate exposure to this action. As mentioned before, in the analysis of the impact of the façades’ orientation on the deterioration of stone claddings, the action of driven rain promotes the deterioration of stone claddings, being one of the main causes of erosion and other loss of integrity deficiencies [51,54]. Therefore, stone claddings with a severe exposure to wind–rain action reach the end of their service life sooner (64 and 67 years for Tehran and Lisbon samples, respectively) than claddings with a moderate exposure (85 and 68 years for Tehran and Lisbon samples, respectively).
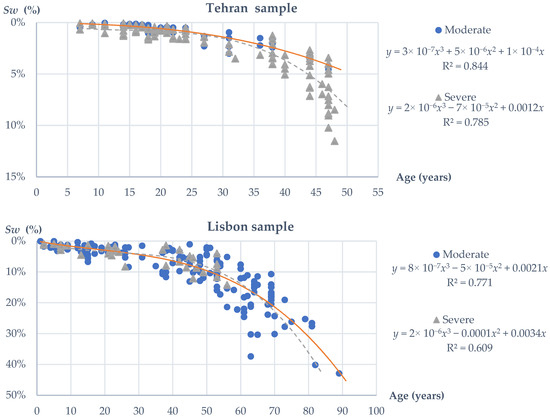
Figure 15.
Degradation curves of the Tehran and Lisbon samples, according to the exposure to wind and rain action.
6. Results and Discussion
Table 4 shows a summary of the results obtained for the two samples. In the previous section, as the degradation curves were presented, the results were discussed, and the conclusions of this study can be summarised as follows:
Table 4.
Summary of the results obtained for the estimated service life of natural stone claddings in Tehran and in Lisbon.
- -
- Tehran, the capital of Iran, is one of the most densely populated cities in the world, with a population around 12 million, and is located in an active seismic zone [55]; for that reason, the structures in Iran are designed for an optimal service life of around 30 years, after which some actions must be carried out to reduce the vulnerability of the buildings to the seismic action [56,57]. In this sense, the Tehran sample presents more recent buildings (with lower ages) than the Lisbon sample (in which the design service life is usually 50 years). According to the proposed model, the natural stone claddings reach the end of their service life after 65 years in Tehran and after 68 years in Lisbon. These values agree with the literature: (i) Silva et al. [2] adopted different statistical models for the service life prediction of stone claddings, and an estimated service life ranging between 68 and 90 years was obtained; (ii) Shohet and Paciuk [41], considering a lower level of users’ demand, attained an estimated service life of 64 years (with a range of 59 to 70 years);
- -
- The results obtained for both samples are coherent, and similar degradation patterns were identified in both samples; i.e., stone claddings in more unfavourable conditions reach the end of their service life sooner than claddings more protected from the deterioration agents. The only exception is for the façades’ orientation, although for both samples, the north and west orientations have lower service lives due to high exposure to damp and prevailing winds;
- -
- Pitzurra et al. [58] suggest that atmospheric agents and air pollution are the major causes for the degradation of external stone claddings, while other authors [55,59] suggest that the extent of degradation of the stone claddings is influenced by the type of stone used and its mineralogical composition, as well as by its physical and mechanical properties. The results in Table 4 reveal that the type of stone is the most influential parameter in the service life of natural stone claddings in Lisbon. On the other hand, exposure to prevailing winds and application of the cladding in bottom walls, which are more protected from the environmental agents, seem to be the most relevant factors for the deterioration of stone claddings in Tehran (these characteristics have the highest impact on the loss or gain of the estimated service life of stone claddings in Tehran);
- -
- The results seem to reveal that two different atmospheric agents have a significant impact on the deterioration of stone claddings in the two geographical contexts. In Lisbon, the exposure to damp seems to be a relevant factor, which is accountable by the north orientation; this sample is located in different areas of the city, some closer to the river and the ocean, others more protected, which allows the verification of the impact of this action on the service life of stone claddings. On the other hand, in the Tehran sample, all the claddings are in the same district, thus presenting the same exposure to this action. However, driven rain proved to be a very important degradation agent, mainly because there are also high levels of atmospheric pollution associated with this action. The presence of pollutants was shown to be unquestionably relevant in the Tehran sample, with a higher incidence of anomalies caused by this action, such as the loss of integrity defects (e.g., erosion of stone), discoloration of stone elements and deposition of debris and superficial dirt.
7. Concluding Remarks
This study analyses the service life and durability of stone claddings in two environmental contexts, namely in Lisbon, Portugal, and in Tehran, Iran. The methodology applied in this study was initially developed for rendered façades in Lisbon [14], with the aim of being a general framework for predicting the service life of building elements. In this sense, this empirical method was adapted and applied to other claddings, in particular to natural stone claddings [2,22]. In the previous approaches, the authors mentioned that this method could be applied to other elements and to other geographical contexts. In fact, even though there are significant differences between the two locations, the proposed methodology proves to be able to accurately predict the service life of stone claddings in Tehran according to their intrinsic properties, such as the type of stone, their design conditions and their exposure to environmental agents.
Similar degradation patterns were identified in both samples in accordance with the physical deterioration process of natural stone claddings over time. The results obtained revealed that the characteristics of stone claddings strongly influence their service life. The climatic or atmospheric agents present a significant impact on the deterioration of stone claddings. However, the most conditioning climatic agents for the deterioration of stone claddings seem to change in the two geographical contexts. In Lisbon, the exposure to damp seems to be the most conditioning factor, while in Tehran, the exposure to driven rain appears to be a very significant degradation agent, mainly because there are also high levels of atmospheric pollution associated with this action.
This study proposes an empirical tool to evaluate the service life of natural stone claddings, considering their on-site performance. The application of this method to two different locations proves the validity and applicability of the tool to different contexts. This study provides some knowledge about the degradation and service life of stone claddings, quantifying the variability of the estimated service life introduced by the different characteristics analysed. This information can be extremely useful both in design and maintenance stages for the adoption of more rational and durable solutions.
Author Contributions
Conceptualisation, S.H.M., A.S. and J.d.B.; methodology, S.H.M. and A.S.; formal analysis, S.H.M., A.S. and J.d.B.; investigation, S.H.M. and A.S.; data curation, S.H.M. and A.S.; writing—original draft preparation, S.H.M. and A.S.; writing—review and editing, J.d.B., A.E. and S.B.H. All authors have read and agreed to the published version of the manuscript.
Funding
This research was funded by the Portuguese Foundation for Science and Technology (FCT) through project BestMaintenance-LowerRisks (PTDC/ECI-CON/29286/2017).
Institutional Review Board Statement
Not applicable.
Informed Consent Statement
Not applicable.
Data Availability Statement
The data presented in this study are available on request from the corresponding author.
Acknowledgments
The authors gratefully acknowledge the support of the CERIS Research Centre (Instituto Superior Técnico-University of Lisbon).
Conflicts of Interest
The authors declare no conflict of interest.
References
- Wekesa, B.; Steyn, G.; Otieno, F. The response of common building construction technologies to the urban poor and their environment. Build. Environ. 2010, 45, 2327–2335. [Google Scholar] [CrossRef]
- Silva, A.; De Brito, J.; Gaspar, P.L. Service life and durability of assemblies. In Methodologies for Service Life Prediction of Buildings; Springer: Berlin/Heidelberg, Germany, 2016; pp. 13–66. [Google Scholar]
- Haagenrud, S. Factors causing degradation. In Guide and Bibliography to Service Life and Durability Research for Buildings and Components; CIB Working Commission W080/RILEM Technical Committee 140-TSL: Ottawa, ON, Canada, 2004; p. 108. [Google Scholar]
- Chai, C.; De Brito, J.; Gaspar, P.; Silva, A. Predicting the service life of exterior wall painting: Techno-economic analysis of alternative maintenance strategies. J. Constr. Eng. Manag. 2013, 140, 04013057. [Google Scholar] [CrossRef]
- Daniotti, B.; Spagnolo, S. Service life prediction tools for buildings’ design and management. In Proceedings of the 11th International Conference on Durability of Building Materials and Components (11th DBMC), Istanbul, Turkey, 11–14 May 2008. [Google Scholar]
- Pearce, D.W. The social and economic value of construction. In The Construction Industry’s Contribution to Sustainable Development, NCRISP; Davis Langdon Consultancy: London, UK, 2003. [Google Scholar]
- Brand, S. How Buildings Learn: What Happens after They’re Built? 1st ed.; Phoenix Illustrated: London, UK, 1997. [Google Scholar]
- Slaughter, E.S. Design strategies to increase building flexibility. Build. Res. Inf. 2001, 29, 208–217. [Google Scholar] [CrossRef]
- Gaspar, P.L. Service Life of Constructions: Development of a Methodology to Estimate the Durability of Construction Elements, Application to Renders in Current Buildings. Ph.D. Thesis, Instituto Superior Técnico, Technical University of Lisbon, Lisbon, Portugal, 2009. (In Portuguese). [Google Scholar]
- Neto, N.; De Brito, J. Inspection and defect diagnosis system for natural stone cladding. J. Mater. Civ. Eng. 2011, 23, 1433–1443. [Google Scholar] [CrossRef]
- Watt, D.S. Building Pathology: Principles and Practice, 2nd ed.; Blackwell Science Ltd., Blackwell Publishing Company: London, UK, 2007. [Google Scholar]
- Rivard, H.; Bédard, C.; Fazio, P.; Ha, K.H. Functional analysis of the preliminary building envelope design process. Build. Environ. 1995, 30, 391–401. [Google Scholar] [CrossRef]
- Yılmaz, N.G.; Goktan, R.M.; Kibici, Y. Relations between some quantitative petrographic characteristics and mechanical strength properties of granitic building stones. Int. J. Rock Mech. Min. Sci. 2011, 48, 506–513. [Google Scholar] [CrossRef]
- Gaspar, P.L.; De Brito, J. Quantifying environmental effects on cement-rendered facades: A comparison between different degradation indicators. Build. Environ. 2008, 43, 1818–1828. [Google Scholar] [CrossRef]
- Norvaišienė, R.; Miniotaitė, R.; Stankevičius, V. Climatic and air pollution effects on building facades. Mater. Sci. 2003, 9, 102–105. [Google Scholar]
- Frohnsdorff, G.; Martin, J. Towards prediction of building service life: The standards imperative. In Proceedings of the 7th Durability of Building Materials and Components (7th DBMC), Stockholm, Sweden, 19–23 May 1996. [Google Scholar]
- Kus, H.; Carlsson, T. Microstructural investigations of naturally and artificially weathered autoclaved aerated concrete. Cem. Concr. Res. 2003, 33, 1423–1432. [Google Scholar] [CrossRef]
- Searls, C.L.; Thomasen, S.E. Repair of the terra-cotta facade of Atlanta City Hall. In Proceedings of the 2nd International Conference on Structural Repair and Maintenance of Historical Buildings, Seville, Spain, 14–16 May 1991. [Google Scholar]
- Henriksen, J.F. Reactions of gases on calcareous stones under dry conditions in field and laboratory studies. Water Air Soil Pollut. 1995, 85, 2707–2712. [Google Scholar] [CrossRef]
- Shohet, I.; Rosenfeld, Y.; Puterman, M.; Gilboa, E. Deterioration patterns for maintenance management—A methodological approach. In Proceedings of the 8th International Conference on Durability of Building Materials and Components, Vancouver, BC, Canada, 30 May–3 June 1999. [Google Scholar]
- Cohen, L.; Manion, L.; Morrison, K. Ex post facto research. In Research Methods in Education, 6th ed.; Taylor & Francis Group: Oxfordshire, UK, 2007; pp. 267–271. [Google Scholar]
- Silva, A.; De Brito, J.; Gaspar, P.L. Service life prediction model applied to natural stone wall claddings (directly adhered to the substrate). Constr. Build. Mater. 2011, 25, 3674–3684. [Google Scholar] [CrossRef]
- Silva, A.; Dias, J.L.; Gaspar, P.L.; De Brito, J. Statistical models applied to service life prediction of rendered façades. Autom. Constr. 2013, 30, 151–160. [Google Scholar] [CrossRef]
- Emídio, F.; De Brito, J.; Gaspar, P.L.; Silva, A. Application of the factor method to the estimation of the service life of natural stone cladding. Constr. Build. Mater. 2014, 66, 484–493. [Google Scholar] [CrossRef]
- Ximenes, S.; de Brito, J.; Gaspar, P.L.; Silva, A. Modelling the degradation and service life of ETICS in external walls. Mater. Struct. 2015, 48, 2235–2249. [Google Scholar] [CrossRef]
- Silva, A.; Gaspar, P.L.; De Brito, J.; Neves, L.C. Probabilistic analysis of degradation of façade claddings using Markov chain models. Mater. Struct. 2016, 49, 2871–2892. [Google Scholar] [CrossRef]
- Mousavi, S.H.; Silva, A.; De Brito, J.; Ekhlassi, A.; Hosseini, S.B. Service life prediction of natural stone claddings with an indirect fastening system. J. Perform. Constr. Facil. 2017, 31, 04017014. [Google Scholar] [CrossRef]
- Mousavi, S.H.; Silva, A.; De Brito, J.; Ekhlassi, A.; Hosseini, S.B. Influence of design on the service life of indirectly fastened natural stone cladding. J. Perform. Constr. Facil. 2019, 33, 04019021. [Google Scholar] [CrossRef]
- Mousavi, S.H. The Appraisal Model of Architectural Design of Natural Stone Cladding in Order to Predict its Service Life. Ph.D. Thesis, Iran University of Science & Technology, Tehran, Iran, 2018. (In Persian). [Google Scholar]
- Camposinhos, R.S. Natural stone characterization. In Stone Cladding Engineering; Springer: Dordrecht, The Netherlands, 2014; pp. 9–33. [Google Scholar]
- Camposinhos, R.S. Wall and cladding systems. In Stone Cladding Engineering; Springer: Dordrecht, The Netherlands, 2014; pp. 37–54. [Google Scholar]
- Köppen-Geiger. World Map of the Köppen-Geiger Climate Classification. 2017. Available online: http://koeppen-geiger.vu-wien.ac.at/present.htm (accessed on 16 November 2020).
- Shohet, I.M.; Laufer, A. Exterior cladding methods: A technoeconomic analysis. J. Constr. Eng. Manag. 1996, 122, 242–247. [Google Scholar] [CrossRef]
- Bauer, E.; De Freitas, V.P.; Mustelier, N.; Barreira, E.; De Freitas, S.S. Infrared thermography—Evaluation of the results reproducibility. Struct. Surv. 2015, 33, 20–35. [Google Scholar] [CrossRef]
- Meola, C.; Di Maio, R.; Roberti, N.; Carlomagno, G.M. Application of infrared thermography and geophysical methods for defect detection in architectural structures. Eng. Fail. Anal. 2005, 12, 875–892. [Google Scholar] [CrossRef]
- Atash, F. The deterioration of urban environments in developing countries: Mitigating the air pollution crisis in Tehran, Iran. Cities 2007, 24, 399–409. [Google Scholar] [CrossRef]
- Bayat, R.; Ashrafi, K.; Motlagh, M.S.; Hassanvand, M.S.; Daroudi, R.; Fink, G.; Künzli, N. Health impact and related cost of ambient air pollution in Tehran. Environ. Res. 2019, 176, 108547. [Google Scholar] [CrossRef]
- Lamhasni, T.; El-Marjaoui, H.; El Bakkali, A.; Lyazidi, S.A.; Haddad, M.; Ben-Ncer, A.; Benyaich, F.; Bonazza, A.; Tahri, M. Air pollution impact on architectural heritage of Morocco: Combination of synchronous fluorescence and ATR-FTIR spectroscopies for the analyses of black crusts deposits. Chemosphere 2019, 225, 517–523. [Google Scholar] [CrossRef]
- Ortega-Morales, O.; Montero-Muñoz, J.L.; Neto, J.A.B.; Beech, I.B.; Sunner, J.; Gaylarde, C. Deterioration and microbial colonization of cultural heritage stone buildings in polluted and unpolluted tropical and subtropical climates: A meta-analysis. Int. Biodeterior. Biodegrad. 2019, 143, 104734. [Google Scholar] [CrossRef]
- Vieira, S.M.; Silva, A.; Sousa, J.M.C.; De Brito, J.; Gaspar, P.L. Modelling the service life of rendered facades using fuzzy systems. Autom. Constr. 2015, 51, 1–7. [Google Scholar] [CrossRef]
- Shohet, I.M.; Paciuk, M. Service life prediction of exterior cladding components under standard conditions. Constr. Manag. Econ. 2004, 22, 1081–1090. [Google Scholar] [CrossRef]
- Lounis, Z.; Vanier, D.; Lacasse, M.; Kyle, B. Decision-support system for service life asset management: The BELCAM project. In Proceedings of the 8th International Conference on Durability of Building Materials and Components, Vancouver, BC, Canada, 30 May–3 June 1999. [Google Scholar]
- Prieto, A.; Silva, A. Service life prediction and environmental exposure conditions of timber claddings in South Chile. Build. Res. Inf. 2019, 48, 191–206. [Google Scholar] [CrossRef]
- Souza, J.; Silva, A.; De Brito, J.; Bauer, E. Analysis of the influencing factors of external wall ceramic claddings’ service life using regression techniques. Eng. Fail. Anal. 2018, 83, 141–155. [Google Scholar] [CrossRef]
- Schouenborg, B.; Grelk, B.; Malaga, K. Testing and assessment of marble and limestone (TEAM)—Important results from a large European research project on cladding panels. J. ASTM Int. 2007, 4, 1–14. [Google Scholar] [CrossRef]
- Chew, M.; Tan, P. Facade staining arising from design features. Constr. Build. Mater. 2003, 17, 181–187. [Google Scholar] [CrossRef]
- Benavente, D.; Garcı, M.; Garcí, J.; Sánchez-Moral, S.; Ordóñez, S. Role of pore structure in salt crystallisation in unsaturated porous stone. J. Cryst. Growth 2004, 260, 532–544. [Google Scholar] [CrossRef]
- Urosevic, M.; Sebastián, E.; Cardell, C. An experimental study on the influence of surface finishing on the weathering of a building low-porous limestone in coastal environments. Eng. Geol. 2013, 154, 131–141. [Google Scholar] [CrossRef]
- Siedel, H.; Siegesmund, S.; Sterflinger, K. Characterisation of stone deterioration on buildings. In Stone in Architecture; Springer: Berlin/Heidelberg, Germany, 2011; pp. 347–410. [Google Scholar]
- Westberg, K.; Norén, J.; Kus, H. On using available environmental data in service life estimations. Build. Res. Inf. 2001, 29, 428–439. [Google Scholar] [CrossRef]
- Pereira, C.; De Brito, J.; Silvestre, J.D. Contribution of humidity to the degradation of façade claddings in current buildings. Eng. Fail. Anal. 2018, 90, 103–115. [Google Scholar] [CrossRef]
- Nascimento, M.; Bauer, E.; De Souza, J.; Zanoni, V. Wind-driven rain incidence parameters obtained by hygrothermal simulation. J. Build. Pathol. Rehabil. 2016, 1, 5. [Google Scholar] [CrossRef] [Green Version]
- Windfinder. Wind & Weather Statistics: Tehran. 2017. Available online: https://www.windfinder.com/windstatistics/tehran_mehrabad-airport (accessed on 16 November 2020).
- Camuffo, D. Physical weathering of stones. Sci. Total. Environ. 1995, 167, 1–14. [Google Scholar] [CrossRef]
- Panahi, M.; Rezaie, F.; Meshkani, S.A. Seismic vulnerability assessment of school buildings in Tehran city based on AHP and GIS. Nat. Hazards Earth Syst. Sci. 2014, 14, 969–979. [Google Scholar] [CrossRef] [Green Version]
- Zekai, S. Supervised fuzzy logic modelling for building earthquake hazard assessment. Expert Syst. Appl. 2011, 38, 14564–14573. [Google Scholar]
- Sharifzadegan, M.H.; Fathi, H. Application of seismic risk assessment models in urban planning and design. Soffeh 2008, 17, 109–124. [Google Scholar]
- Pitzurra, L.; Moroni, B.; Nocentini, A.; Sbaraglia, G.; Poli, G.; Bistoni, F. Microbial growth and air pollution in carbonate rock weathering. Int. Biodeterior. Biodegrad. 2003, 52, 63–68. [Google Scholar] [CrossRef]
- Prikryl, R.; Lokajicek, T.; Svobodova, J.; Weishauptova, Z. Experimental weathering of marlstone from Přední Kopanina (Czech Republic)—Historical building stone of Prague. Build. Environ. 2003, 38, 11. [Google Scholar] [CrossRef]


Publisher’s Note: MDPI stays neutral with regard to jurisdictional claims in published maps and institutional affiliations. |
© 2021 by the authors. Licensee MDPI, Basel, Switzerland. This article is an open access article distributed under the terms and conditions of the Creative Commons Attribution (CC BY) license (https://creativecommons.org/licenses/by/4.0/).