
Analysis of Photopic and Melanopic Lighting in Teaching Environments

 ,
,  and
and
Abstract
:1. Introduction
2. Materials and Methods
2.1. Characteristics of the Teaching Classrooms and Measured Modes
2.2. Simulated Measurements
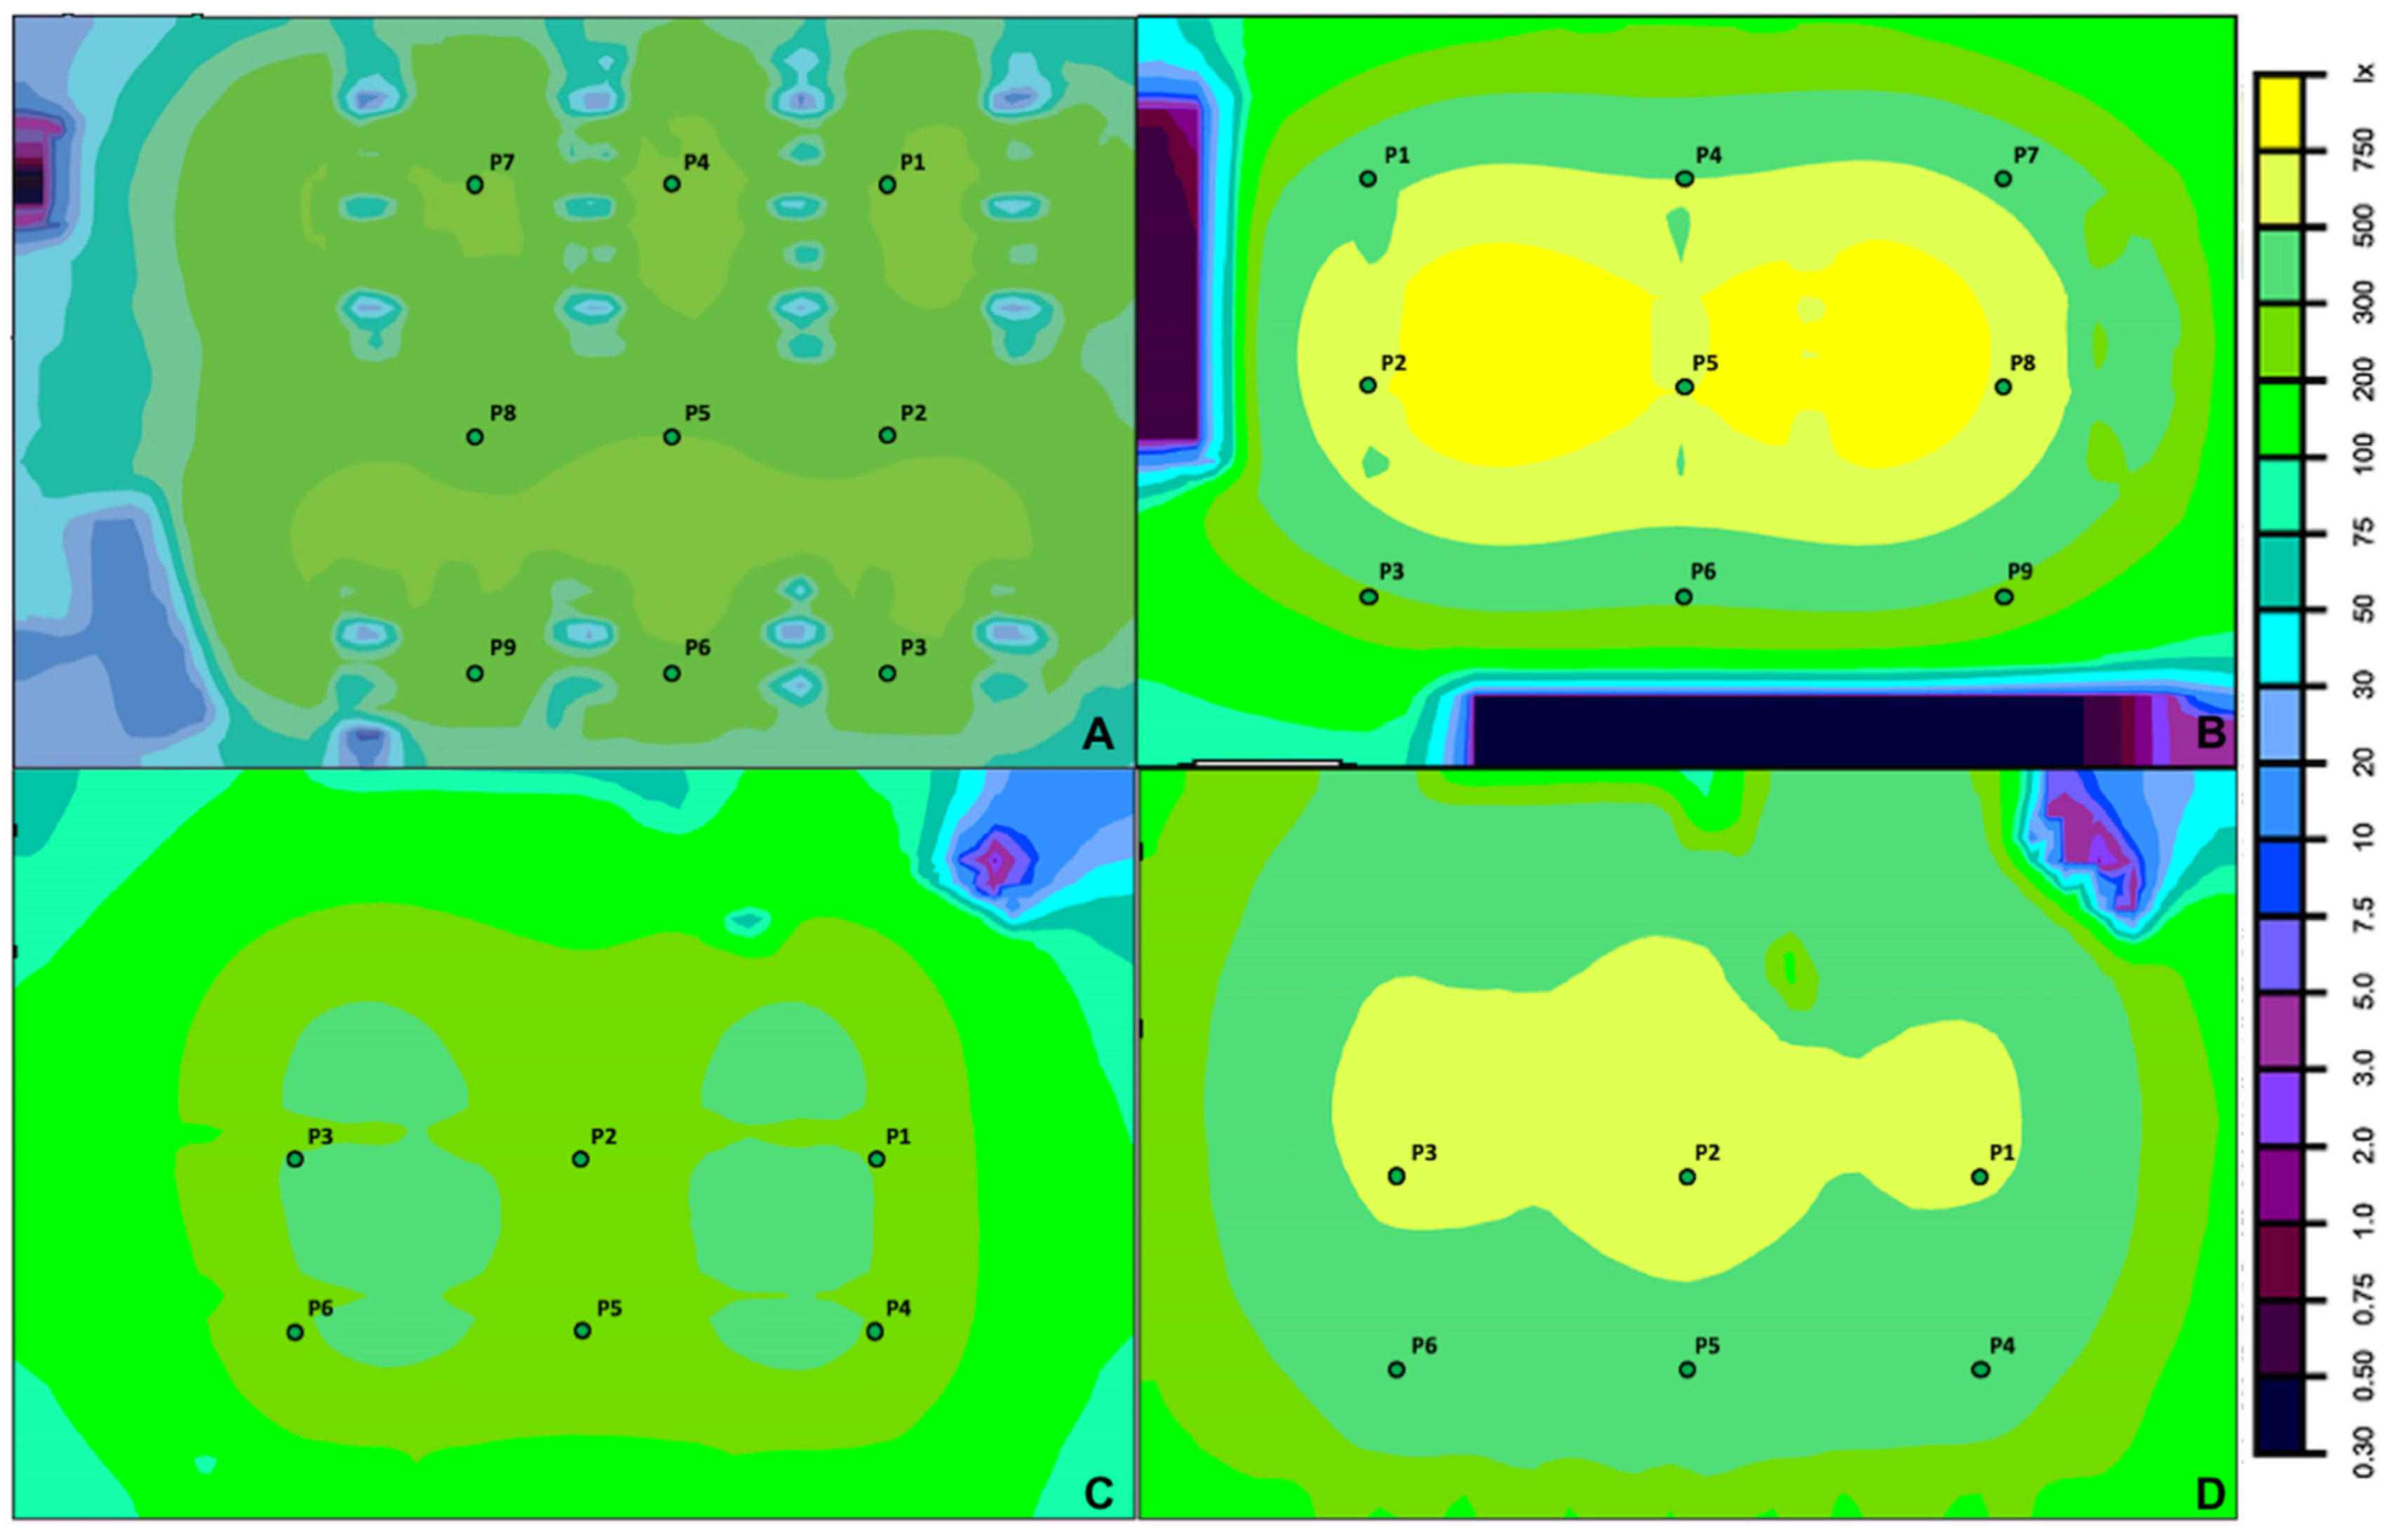
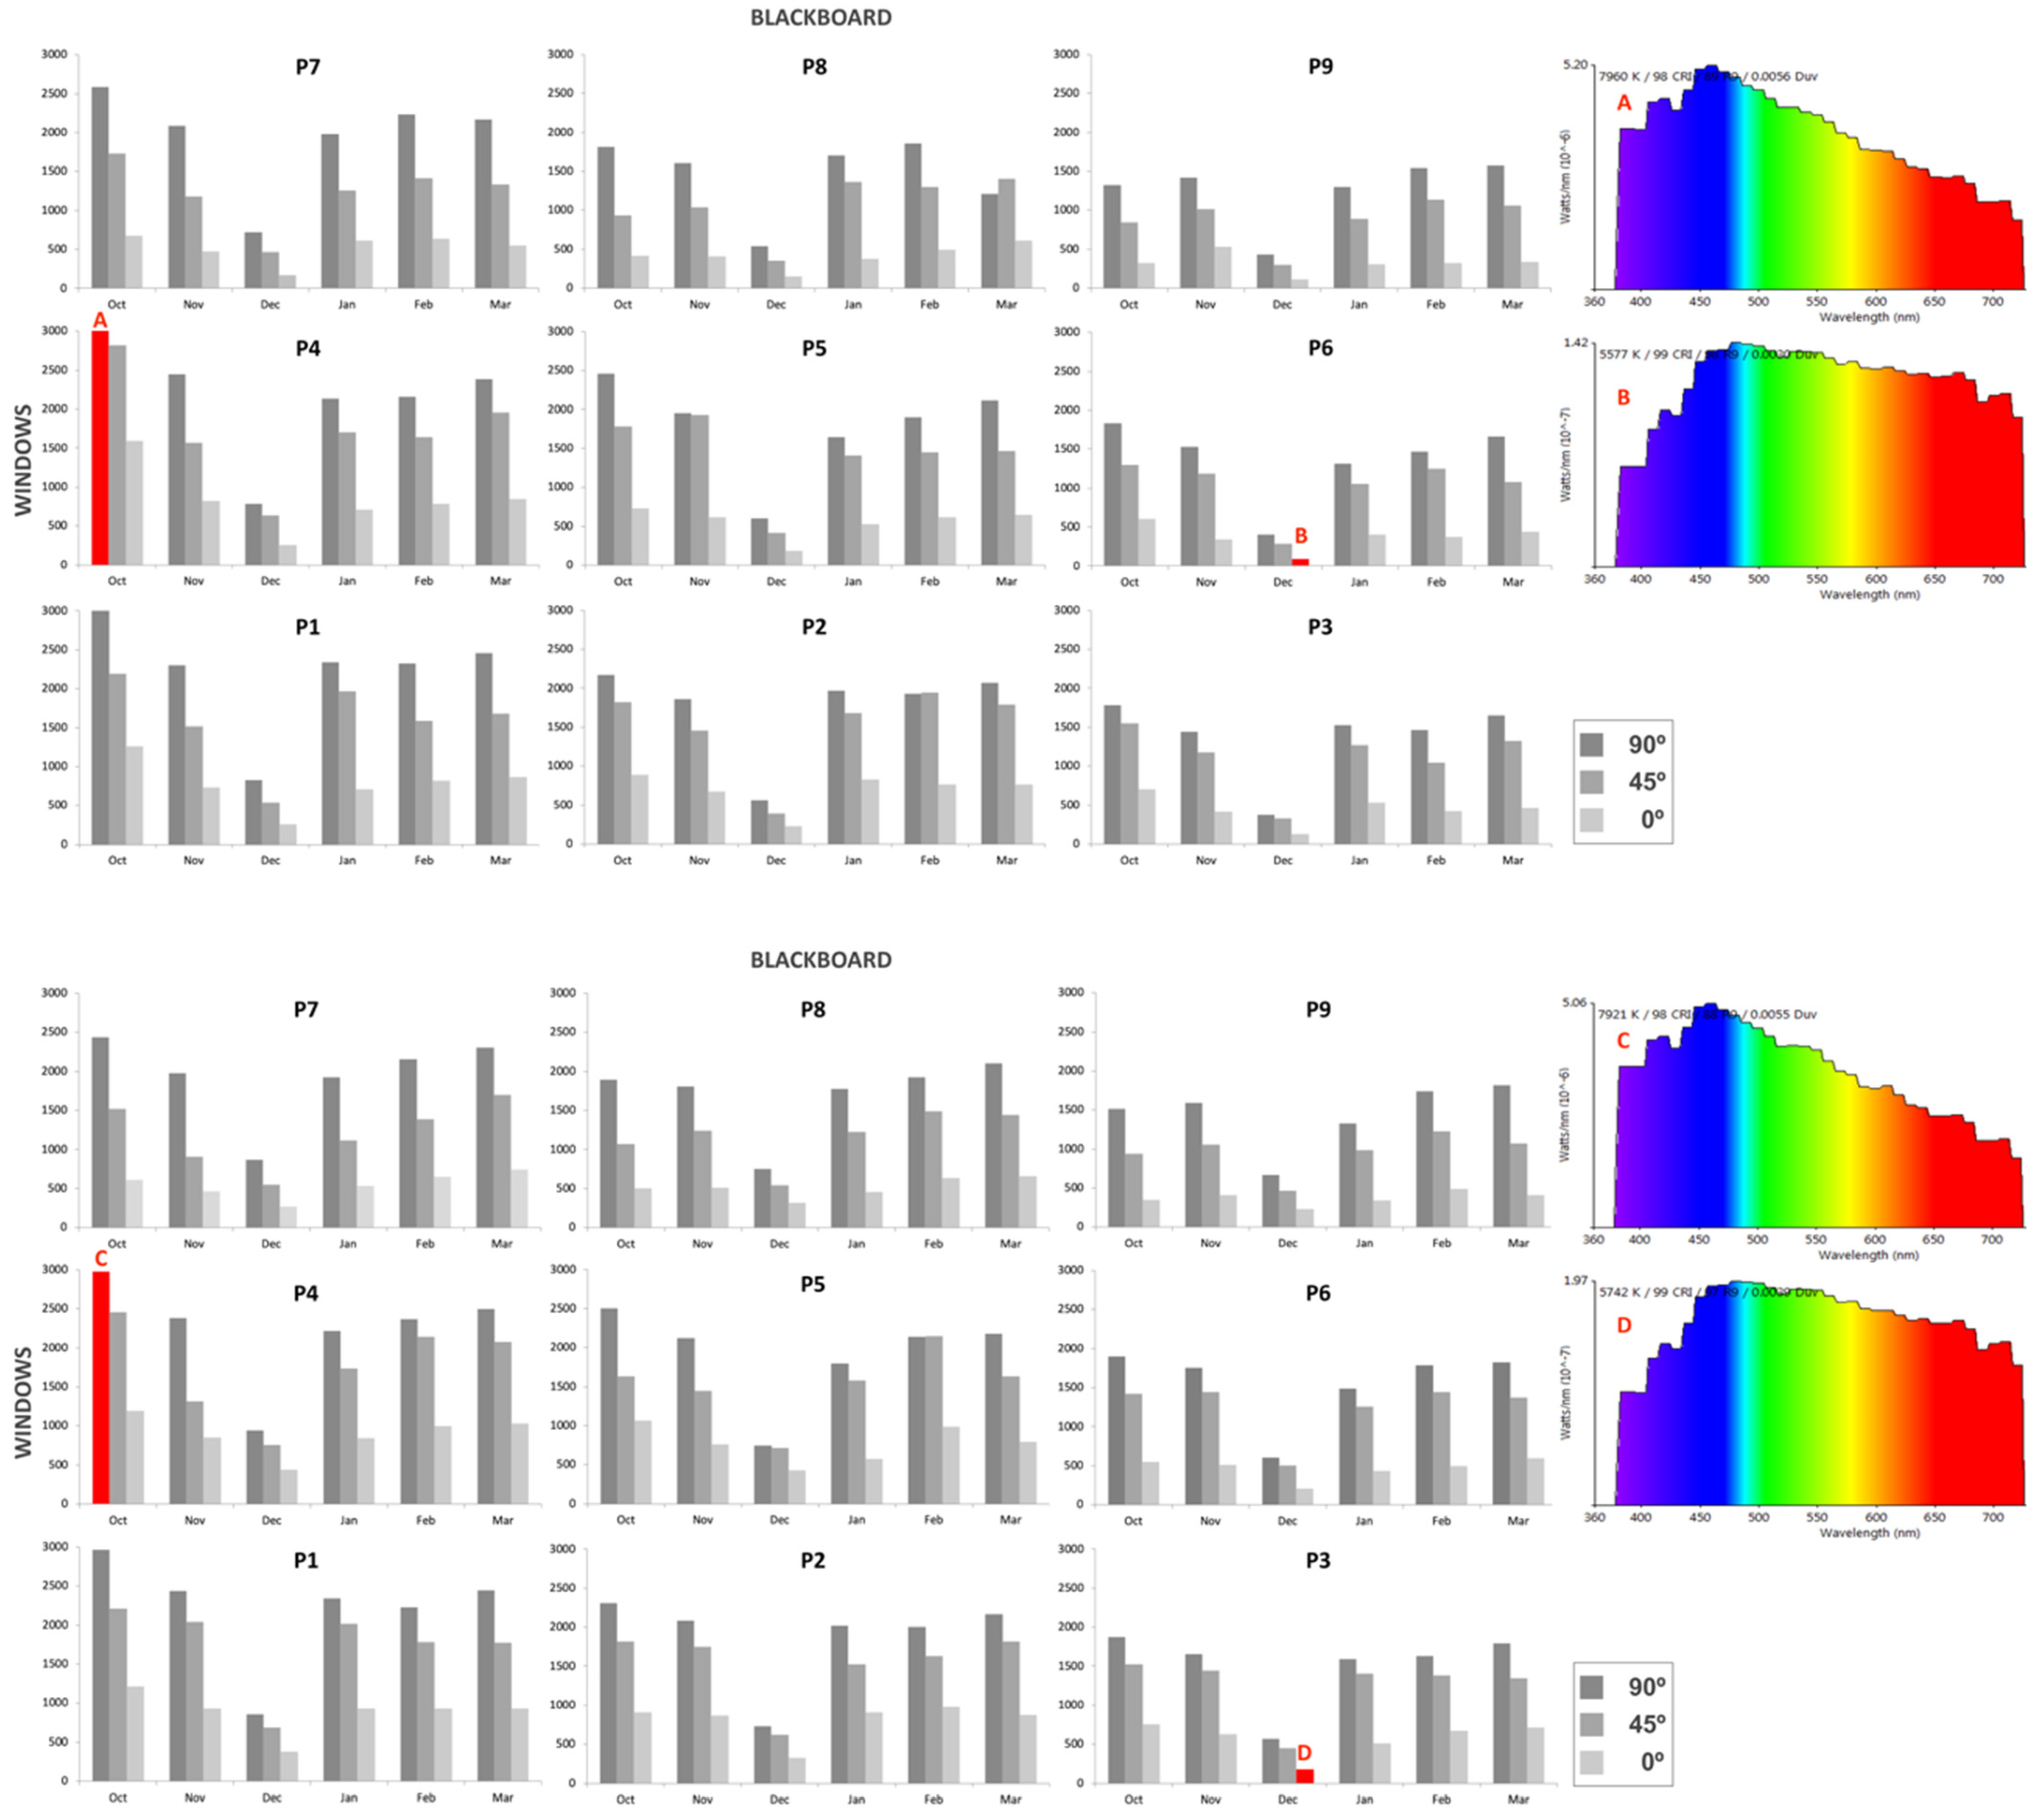
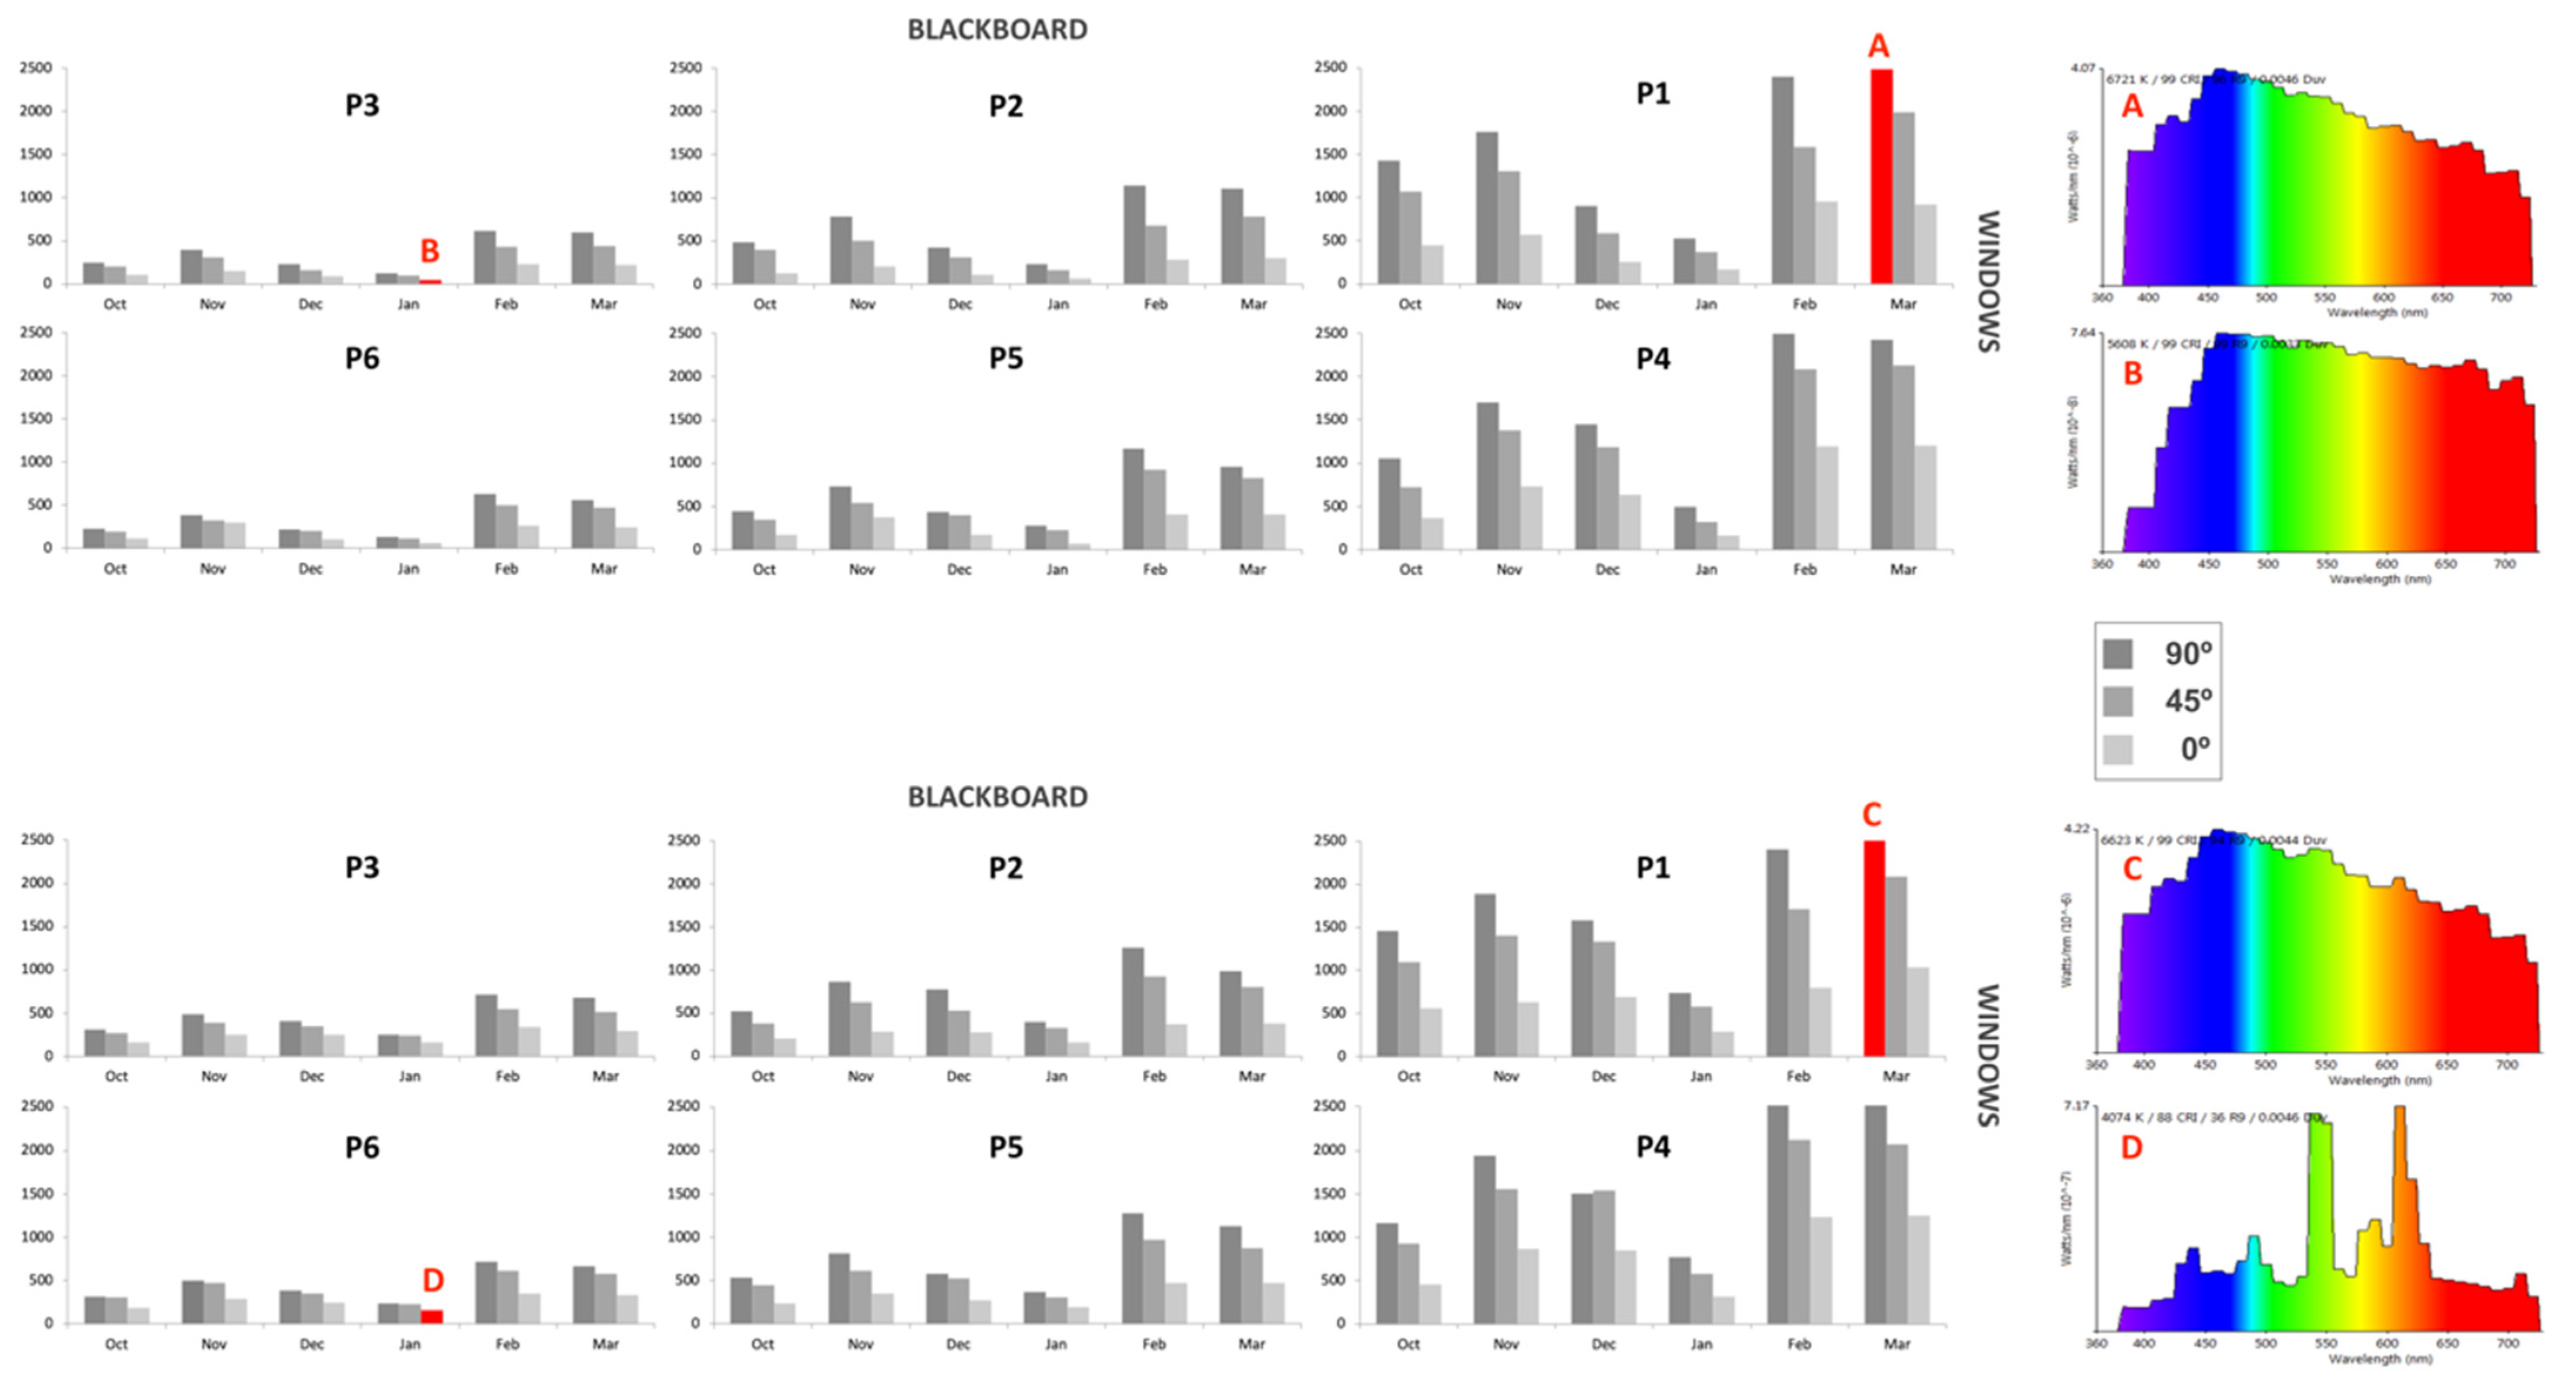
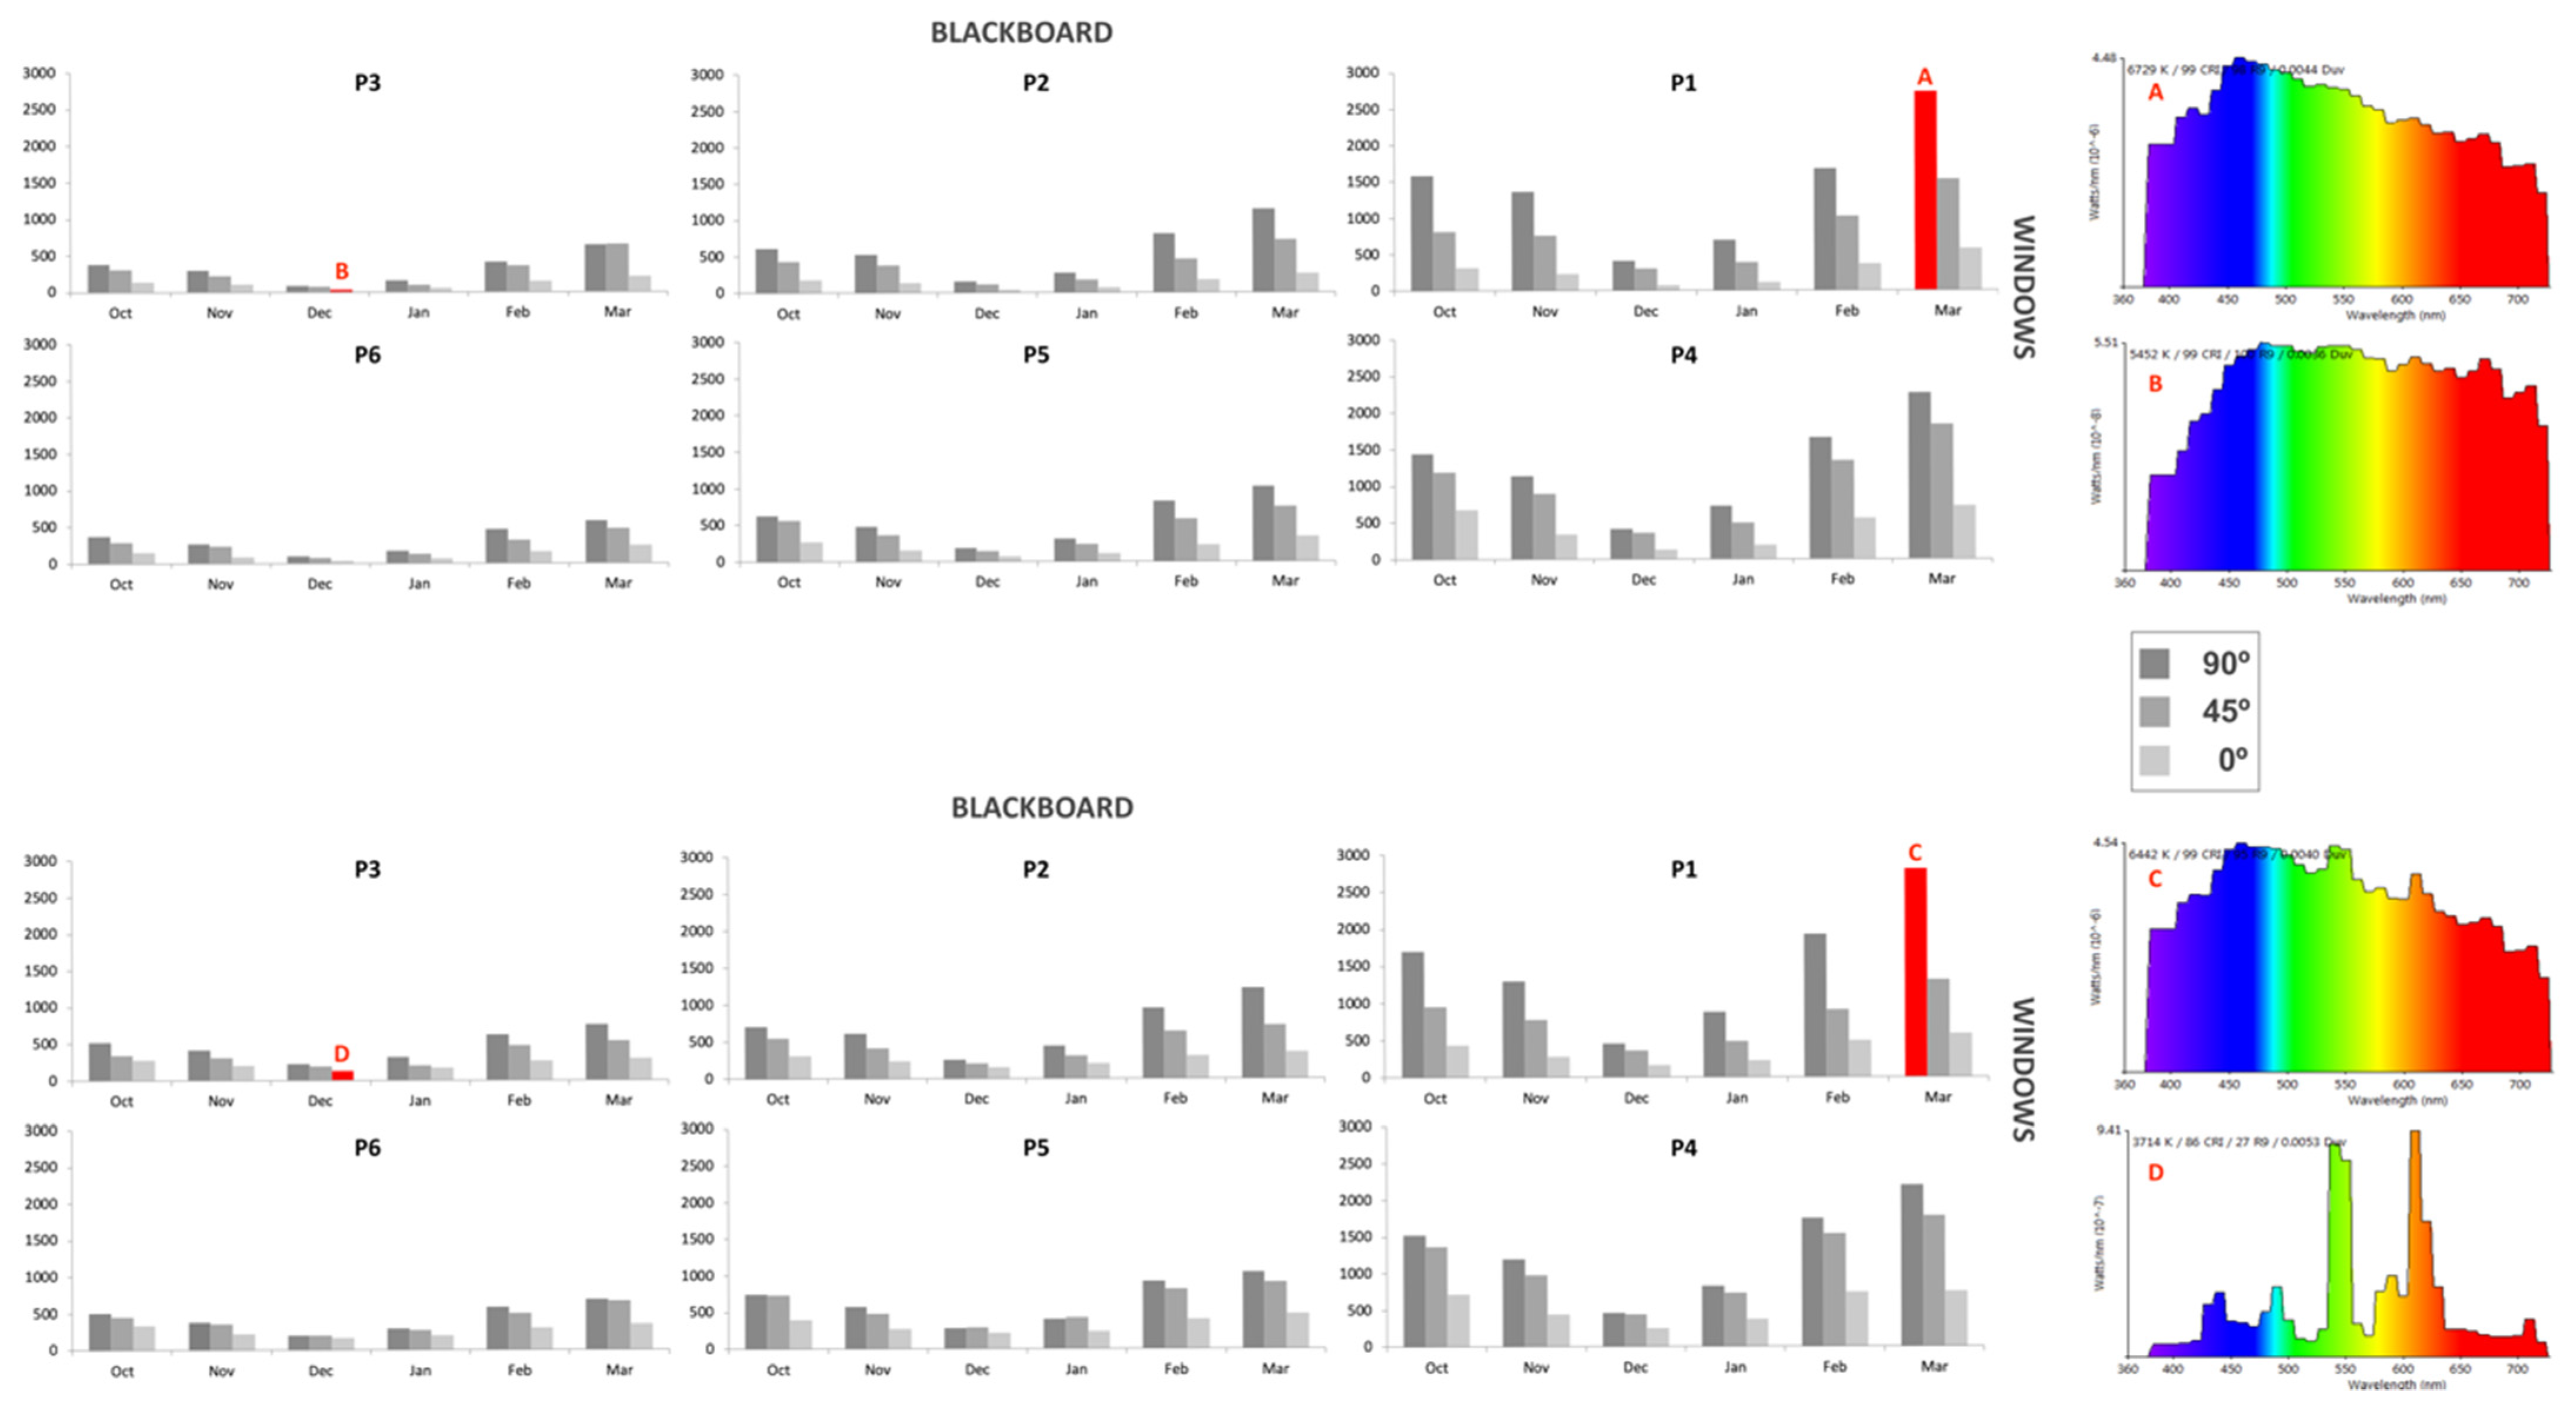
3. Results and Discussion
3.1. Photopic Indoor Lighting
3.2. Melanopic Lighting from Artificial Lighting and Daylight
3.3. Optimization of Artificial Lighting
4. Conclusions
Author Contributions
Funding
Institutional Review Board Statement
Informed Consent Statement
Data Availability Statement
Conflicts of Interest
References
- Leslie, R.P.; Radetsky, L.C.; Smith, A.M. Conceptual design metrics for daylighting. Light. Res. Technol. 2012, 44, 277–290. [Google Scholar] [CrossRef] [Green Version]
- Vetter, C.; Pattison, P.M.; Houser, K.; Herf, M.; Phillips, A.J.K.; Wright, K.P.; Skene, D.J.; Brainard, G.C.; Boivin, D.B.; Glickman, G. A Review of Human Physiological Responses to Light: Implications for the Development of Integrative Lighting Solutions. LEUKOS J. Illum. Eng. Soc. N. Am. 2021, 00, 1–28. [Google Scholar] [CrossRef]
- Acosta, I.; Campano, M.Á.; Leslie, R.; Radetsky, L. Daylighting design for healthy environments: Analysis of educational spaces for optimal circadian stimulus. Sol. Energy 2019, 193, 584–596. [Google Scholar] [CrossRef]
- Korsavi, S.S.; Zomorodian, Z.S.; Tahsildoost, M. Visual comfort assessment of daylit and sunlit areas: A longitudinal field survey in classrooms in Kashan, Iran. Energy Build. 2016, 128, 305–318. [Google Scholar] [CrossRef]
- Figueiro, M.G.; Brons, J.A.; Plitnick, B.; Donlan, B.; Leslie, R.P.; Rea, M.S. Measuring circadian light and its impact on adolescents. Light. Res. Technol. 2011, 43, 201–215. [Google Scholar] [CrossRef] [Green Version]
- Leccese, F.; Rocca, M.; Salvadori, G.; Belloni, E.; Buratti, C. Towards a holistic approach to indoor environmental quality assessment: Weighting schemes to combine effects of multiple environmental factors. Energy Build. 2021, 245, 111056. [Google Scholar] [CrossRef]
- Bellia, L.; Fragliasso, F. Good places to live and sleep well: A literature review about the role of architecture in determining non-visual effects of light. Int. J. Environ. Res. Public Health 2021, 18, 1002. [Google Scholar] [CrossRef]
- Ezpeleta, S.; Orduna-Hospital, E.; Aporta, J.; Luesma, M.J.; Pinilla, I.; Sánchez-Cano, A. Evaluation of Visual and Nonvisual Levels of Daylight from Spectral Power Distributions Considering Orientation and Seasonality. Appl. Sci. 2021, 11, 5996. [Google Scholar] [CrossRef]
- Vathanam, G.S.O.; Kalyanasundaram, K.; Elavarasan, R.M.; Hussain, S.; Subramaniam, U.; Pugazhendhi, R.; Ramesh, M.; Gopalakrishnan, R.M. A review on effective use of daylight harvesting using intelligent lighting control systems for sustainable office buildings in India. Sustainability 2021, 13, 4973. [Google Scholar] [CrossRef]
- Acosta, I.; Leslie, R.P.; Figueiro, M.G. Analysis of circadian stimulus allowed by daylighting in hospital rooms. Light. Res. Technol. 2017, 49, 49–61. [Google Scholar] [CrossRef]
- Houser, K.W.; Esposito, T. Human-Centric Lighting: Foundational Considerations and a Five-Step Design Process. Front. Neurol. 2021, 12, 25. [Google Scholar] [CrossRef] [PubMed]
- Lewy, A.J.; Wehr, T.A.; Goodwin, F.K.; Newsome, D.A.; Markey, S.P. Light suppresses melatonin secretion in humans. Science 1980, 210, 1267–1269. [Google Scholar] [CrossRef] [PubMed]
- Benarroch, E.E. The melanopsin system: Phototransduction, projections, functions, and clinical implications. Neurology 2011, 76, 1422–1427. [Google Scholar] [CrossRef] [PubMed]
- LeGates, T.A.; Fernandez, D.C.; Hattar, S. Light as a central modulator of circadian rhythms, sleep and affect. Nat. Rev. Neurosci. 2014, 15, 443–454. [Google Scholar] [CrossRef] [PubMed]
- Gaggioni, G.; Maquet, P.; Schmidt, C.; Dijk, D.-J.; Vandewalle, G. Neuroimaging, cognition, light and circadian rhythms. Front. Syst. Neurosci. 2014, 8, 126. [Google Scholar] [CrossRef] [PubMed] [Green Version]
- Daneault, V.; Dumont, M.; Masse, E.; Vandewalle, G.; Carrier, J. Light-sensitive brain pathways and aging. J. Physiol. Anthropol. 2016, 35, 1–12. [Google Scholar] [CrossRef] [Green Version]
- Lucas, R.J.; Peirson, S.N.; Berson, D.M.; Brown, T.M.; Cooper, H.M.; Czeisler, C.A.; Figueiro, M.G.; Gamlin, P.D.; Lockley, S.W.; O’Hagan, J.B.; et al. Measuring and using light in the melanopsin age. Trends Neurosci. 2014, 37, 1–9. [Google Scholar] [CrossRef]
- Brainard, G.C.; Hanifin, J.P. Photoreception for Human Circadian and Neurobehavioral Regulation. In Handbook of Advanced Lighting Technology; Karlicek, R., Sun, C.-C., Zissis, G., Ma, R., Eds.; Springer International Publishing: Cham, Switzerland, 2017; pp. 829–846. [Google Scholar]
- Thapan, K.; Arendt, J.; Skene, D.J. An action spectrum for melatonin suppression: Evidence for a novel non-rod, non-cone photoreceptor system in humans. J. Physiol. 2001, 535, 261–267. [Google Scholar] [CrossRef]
- Figueiro, M.G.; Steverson, B.; Heerwagen, J.; Kampschroer, K.; Hunter, C.M.; Gonzales, K.; Plitnick, B.; Rea, M.S. The impact of daytime light exposures on sleep and mood in office workers. Sleep Health 2017, 3, 204–215. [Google Scholar] [CrossRef]
- de Vries, A.; Souman, J.L.; de Ruyter, B.; Heynderickx, I.; de Kort, Y.A.W. Lighting up the office: The effect of wall luminance on room appraisal, office workers’ performance, and subjective alertness. Build. Environ. 2018, 142, 534–543. [Google Scholar] [CrossRef]
- Aries, M.B.C.; Aarts, M.P.J.; van Hoof, J. Daylight and health: A review of the evidence and consequences for the built environment. Light. Res. Technol. 2015, 47, 6–27. [Google Scholar] [CrossRef]
- Barbur, J.L.; Stockman, A. Photopic, mesopic and scotopic vision and changes in visual performance. Encycl. Eye 2010, 3, 323–331. [Google Scholar]
- Purves, D.; Augustine, G.J.; Fitzpatrick, D.; Hall, W.C.; LaMantia, A.-S.; McNamara, J.O.; Williams, S.M. Neuroscience, 3rd ed.; Sinauer Associates: Sunderland, MA, USA, 2004; ISBN 0-87893-725-0. (Hardcover). [Google Scholar]
- Wyszecki, G.; Stiles, W.S. Color Science; Wiley: Hoboken, NJ, USA, 1982; Volume 8. [Google Scholar]
- Rea, M.S.; Figueiro, M.G.; Bullough, J.D.; Bierman, A. A model of phototransduction by the human circadian system. Brain Res. Rev. 2005, 50, 213–228. [Google Scholar] [CrossRef]
- Berson, D.M.; Dunn, F.A.; Takao, M. Phototransduction by retinal ganglion cells that set the circadian clock. Science 2002, 295, 1070–1073. [Google Scholar] [CrossRef] [Green Version]
- Rea, M.S.; Figueiro, M.G.; Bierman, A.; Hamner, R. Modelling the spectral sensitivity of the human circadian system. Light. Res. Technol. 2012, 44, 386–396. [Google Scholar] [CrossRef]
- Rea, M.; Nagare, R.; Figueiro, M.G. Modeling circadian phototransduction: Quantitative predictions of psychophysical data. Front. Neurosci. 2021, 15, 44. [Google Scholar] [CrossRef] [PubMed]
- CIE. CIE Position Statement on Non-Visual Effects of Light Recommending Proper Light at the Proper Time. CIE Cent. Bur. 2019, 2013, 1–4. [Google Scholar]
- International WELL Building Institute (IWBI) WELL Building Standard. LIGHT WELL v2. Q2. 2021. Available online: https://standard.wellcertified.com/well (accessed on 5 June 2021).
- Sánchez-cano, A.; Aporta, J. Optimization of lighting projects including photopic and circadian criteria: A simplified action protocol. Appl. Sci. 2020, 10, 8068. [Google Scholar] [CrossRef]
- Zamarreño-Suárez, M.; Alcala-Gonzalez, D.; Alfonso-Corcuera, D.; Pindado, S. Measuring the lighting quality in academic institutions: The UPM faculty of aerospace engineering (Spain). Appl. Sci. 2020, 10, 8345. [Google Scholar] [CrossRef]
- Leccese, F.; Salvadori, G.; Rocca, M.; Buratti, C.; Belloni, E. A method to assess lighting quality in educational rooms using analytic hierarchy process. Build. Environ. 2020, 168, 106501. [Google Scholar] [CrossRef]
- López-Chao, V.; Lorenzo, A.A.; Martin-Gutiérrez, J. Architectural Indoor Analysis: A Holistic Approach to Understand the Relation of Higher Education Classrooms and Academic Performance. Sustainability 2019, 11, 6558. [Google Scholar] [CrossRef] [Green Version]
- Yang, D.; Mak, C.M. Relationships between indoor environmental quality and environmental factors in university classrooms. Build. Environ. 2020, 186, 107331. [Google Scholar] [CrossRef]
- Vetter, C.; Phillips, A.J.K.; Silva, A.; Lockley, S.W.; Glickman, G. Light Me up? Why, When, and How Much Light We Need. J. Biol. Rhythms 2019, 34, 573–575. [Google Scholar] [CrossRef] [PubMed] [Green Version]
- UNE EN. 12464-1:2012 Light and Lighting—Lighting of Work Places—Part 1: Indoor Work Places—European Standards. Available online: https://www.en-standard.eu/une-en-12464-1-2012-light-and-lighting-lighting-of-work-places-part-1-indoor-work-places/ (accessed on 10 June 2021).
- Brown, T.; Brainard, G.; Cajochen, C.; Czeisler, C.; Hanifin, J.; Lockley, S.; Lucas, R.; Munch, M.; O’Hagan, J.; Peirson, S.; et al. Recommendations for Healthy Daytime, Evening, and Night-Time Indoor Light Exposure. Preprints 2020. [Google Scholar] [CrossRef]
- Stefani, O.; Cajochen, C. Should We Re-think Regulations and Standards for Lighting at Workplaces? A Practice Review on Existing Lighting Recommendations. Front. Psychiatry 2021, 12, 652161. [Google Scholar] [CrossRef]
- Sahin, L.; Figueiro, M.G. Alerting effects of short-wavelength (blue) and long-wavelength (red) lights in the afternoon. Physiol. Behav. 2013, 116–117, 1–7. [Google Scholar] [CrossRef]
- Boubekri, M.; Lee, J.; MacNaughton, P.; Woo, M.; Schuyler, L.; Tinianov, B.; Satish, U. The Impact of Optimized Daylight and Views on the Sleep Duration and Cognitive Performance of Office Workers. Int. J. Environ. Res. Public Health 2020, 17, 3219. [Google Scholar] [CrossRef]
- Boubekri, M.; Cheung, I.N.; Reid, K.J.; Wang, C.-H.; Zee, P.C. Impact of windows and daylight exposure on overall health and sleep quality of office workers: A case-control pilot study. J. Clin. Sleep Med. JCSM Publ. Am. Acad. Sleep Med. 2014, 10, 603–611. [Google Scholar] [CrossRef]
- Safranek, S.; Collier, J.M.; Wilkerson, A.; Davis, R.G. Energy impact of human health and wellness lighting recommendations for office and classroom applications. Energy Build. 2020, 226, 110365. [Google Scholar] [CrossRef]
- Ahmed, M.O.; Madkor, A.K.; Makeen, P.; Betelmal, S.E.I.; Hassan, M.M.; Abdelsamee, M.M.; Ayman, A.; El-Adly, M.H.; Nessim, A.; Abdullatif, S.O. Optimizing the artificial lighting in a smart and green glass building-integrated semi-transparent photovoltaics: A multifaceted case study in Egypt. WSEAS Trans. Environ. Dev. 2021, 17, 118–127. [Google Scholar] [CrossRef]
- Mott, M.S.; Robinson, D.H.; Walden, A.; Burnette, J.; Rutherford, A.S. Illuminating the Effects of Dynamic Lighting on Student Learning. SAGE Open 2012, 2, 2158244012445585. [Google Scholar] [CrossRef]
- Sleegers, P.J.C.; Moolenaar, N.M.; Galetzka, M.; Pruyn, A.; Sarroukh, B.E.; van der Zande, B. Lighting affects students’ concentration positively: Findings from three Dutch studies. Light. Res. Technol. 2013, 45, 159–175. [Google Scholar] [CrossRef] [Green Version]
- Keis, O.; Helbig, H.; Streb, J.; Hille, K. Influence of blue-enriched classroom lighting on students’ cognitive performance. Trends Neurosci. Educ. 2014, 3, 86–92. [Google Scholar] [CrossRef]
- Barkmann, C.; Wessolowski, N.; Schulte-Markwort, M. Applicability and efficacy of variable light in schools. Physiol. Behav. 2012, 105, 621–627. [Google Scholar] [CrossRef]
- Yang, H.; Guo, B.; Shi, Y.; Jia, C.; Li, X.; Liu, F. Interior daylight environment of an elderly nursing home in Beijing. Build. Environ. 2021, 200, 107915. [Google Scholar] [CrossRef]
- Mills, P.R.; Tomkins, S.C.; Schlangen, L.J.M. The effect of high correlated colour temperature office lighting on employee wellbeing and work performance. J. Circadian Rhythms 2007, 5, 1–9. [Google Scholar] [CrossRef] [Green Version]
- Viola, A.U.; James, L.M.; Schlangen, L.J.M.; Dijk, D.-J. Blue-enriched white light in the workplace improves self-reported alertness, performance and sleep quality. Scand. J. Work. Environ. Health 2008, 34, 297–306. [Google Scholar] [CrossRef] [Green Version]
- Xiao, H.; Cai, H.; Li, X. Non-visual effects of indoor light environment on humans: A review. Physiol. Behav. 2021, 228, 113195. [Google Scholar] [CrossRef] [PubMed]
- CHPS—Collaborative for High Performance Schools. Core Criteria 3.0. Available online: https://chps.net/chps-criteria (accessed on 17 July 2021).


| Classroom# Number of Luminaires/Tubes | Spatial Power Distribution | Classroom# Number of Luminaires/Tubes | Spatial Power Distribution |
|---|---|---|---|
| #1 6/2 | 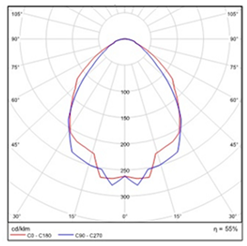 | #2 2/4 |  |
| #3 4/2 |  | #4 3/3 | 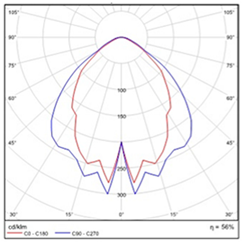 |
| Classroom # | Walls | Floor | Ceiling |
|---|---|---|---|
| 1 | Lower half 12–0/upper half 70–0 | 75–1% | 90–0 |
| 2 | 85–0 | 35–10% | 85–0 |
| 3 | 82–0 | 22–4% | 75–0 |
| 4 | 90–0 | 22–4% | 90–0 |
| Indoor Type | Emin (lux) | UGRL | Uo = Emin/Eave | CRI |
|---|---|---|---|---|
| Classroom for diurnal/nocturnal classes | 300/500 | 19 | 0.6 | 80 |
| Computer rooms | 300 | 19 | 0.6 | 80 |
| Meeting rooms | 200 | 22 | 0.4 | 80 |
| Library with shelves/reading rooms | 200/500 | 19 | 0.6 | 80 |
| Classroom 1 | Classroom 2 | Classroom 3 | Classroom 4 | |||||||||
|---|---|---|---|---|---|---|---|---|---|---|---|---|
| 0° | 45° | 90° | 0° | 45° | 90° | 0° | 45° | 90° | 0° | 45° | 90° | |
| P1 | 84.7 | 86.8 | 100 | 307 | 102 | 54.5 | 147 | 70.2 | 42.3 | 201 | 108 | 62.8 |
| P2 | 89.4 | 94.5 | 120 | 524 | 491 | 242 | 123 | 123 | 145 | 255 | 230 | 168 |
| P3 | 62.8 | 39.9 | 26.3 | 158 | 273 | 242 | 165 | 177 | 156 | 237 | 231 | 179 |
| P4 | 102 | 119 | 115 | 244 | 117 | 78.8 | 125 | 74.8 | 47.8 | 283 | 167 | 67.7 |
| P5 | 88.6 | 131 | 138 | 384 | 340 | 251 | 124 | 131 | 135 | 335 | 264 | 138 |
| P6 | 56.1 | 35.9 | 28 | 138 | 220 | 281 | 160 | 208 | 168 | 325 | 276 | 154 |
| P7 | 122 | 114 | 86.1 | 90.5 | 78.0 | 73.8 | ||||||
| P8 | 94.3 | 100 | 103 | 98.5 | 140 | 314 | ||||||
| P9 | 68.6 | 30.7 | 23.9 | 58.2 | 168 | 292 | ||||||
| Classroom 1 | Classroom 2 | Classroom 3 | Classroom 4 | |||||
|---|---|---|---|---|---|---|---|---|
| EML | EDI | EML | EDI | EML | EDI | EML | EDI | |
| P1 | 73.69 | 66.74 | 71.60 | 64.85 | 90.88 | 82.31 | 126.25 | 114.35 |
| P2 | 73.07 | 66.18 | 88.01 | 79.71 | 84.66 | 76.68 | 135.13 | 122.39 |
| P3 | 53.66 | 48.60 | 57.78 | 52.33 | 101.25 | 91.70 | 143.13 | 129.63 |
| P4 | 65.91 | 59.69 | 217.56 | 197.05 | 92.18 | 83.49 | 154.81 | 140.21 |
| P5 | 68.63 | 62.15 | 213.78 | 193.62 | 83.02 | 75.19 | 165.41 | 149.82 |
| P6 | 46.99 | 42.56 | 120.42 | 109.07 | 100.00 | 90.57 | 164.86 | 149.32 |
| P7 | 68.30 | 61.86 | 81.27 | 73.61 | ||||
| P8 | 59.10 | 53.53 | 95.75 | 86.72 | ||||
| P9 | 49.51 | 44.84 | 73.43 | 66.51 | ||||
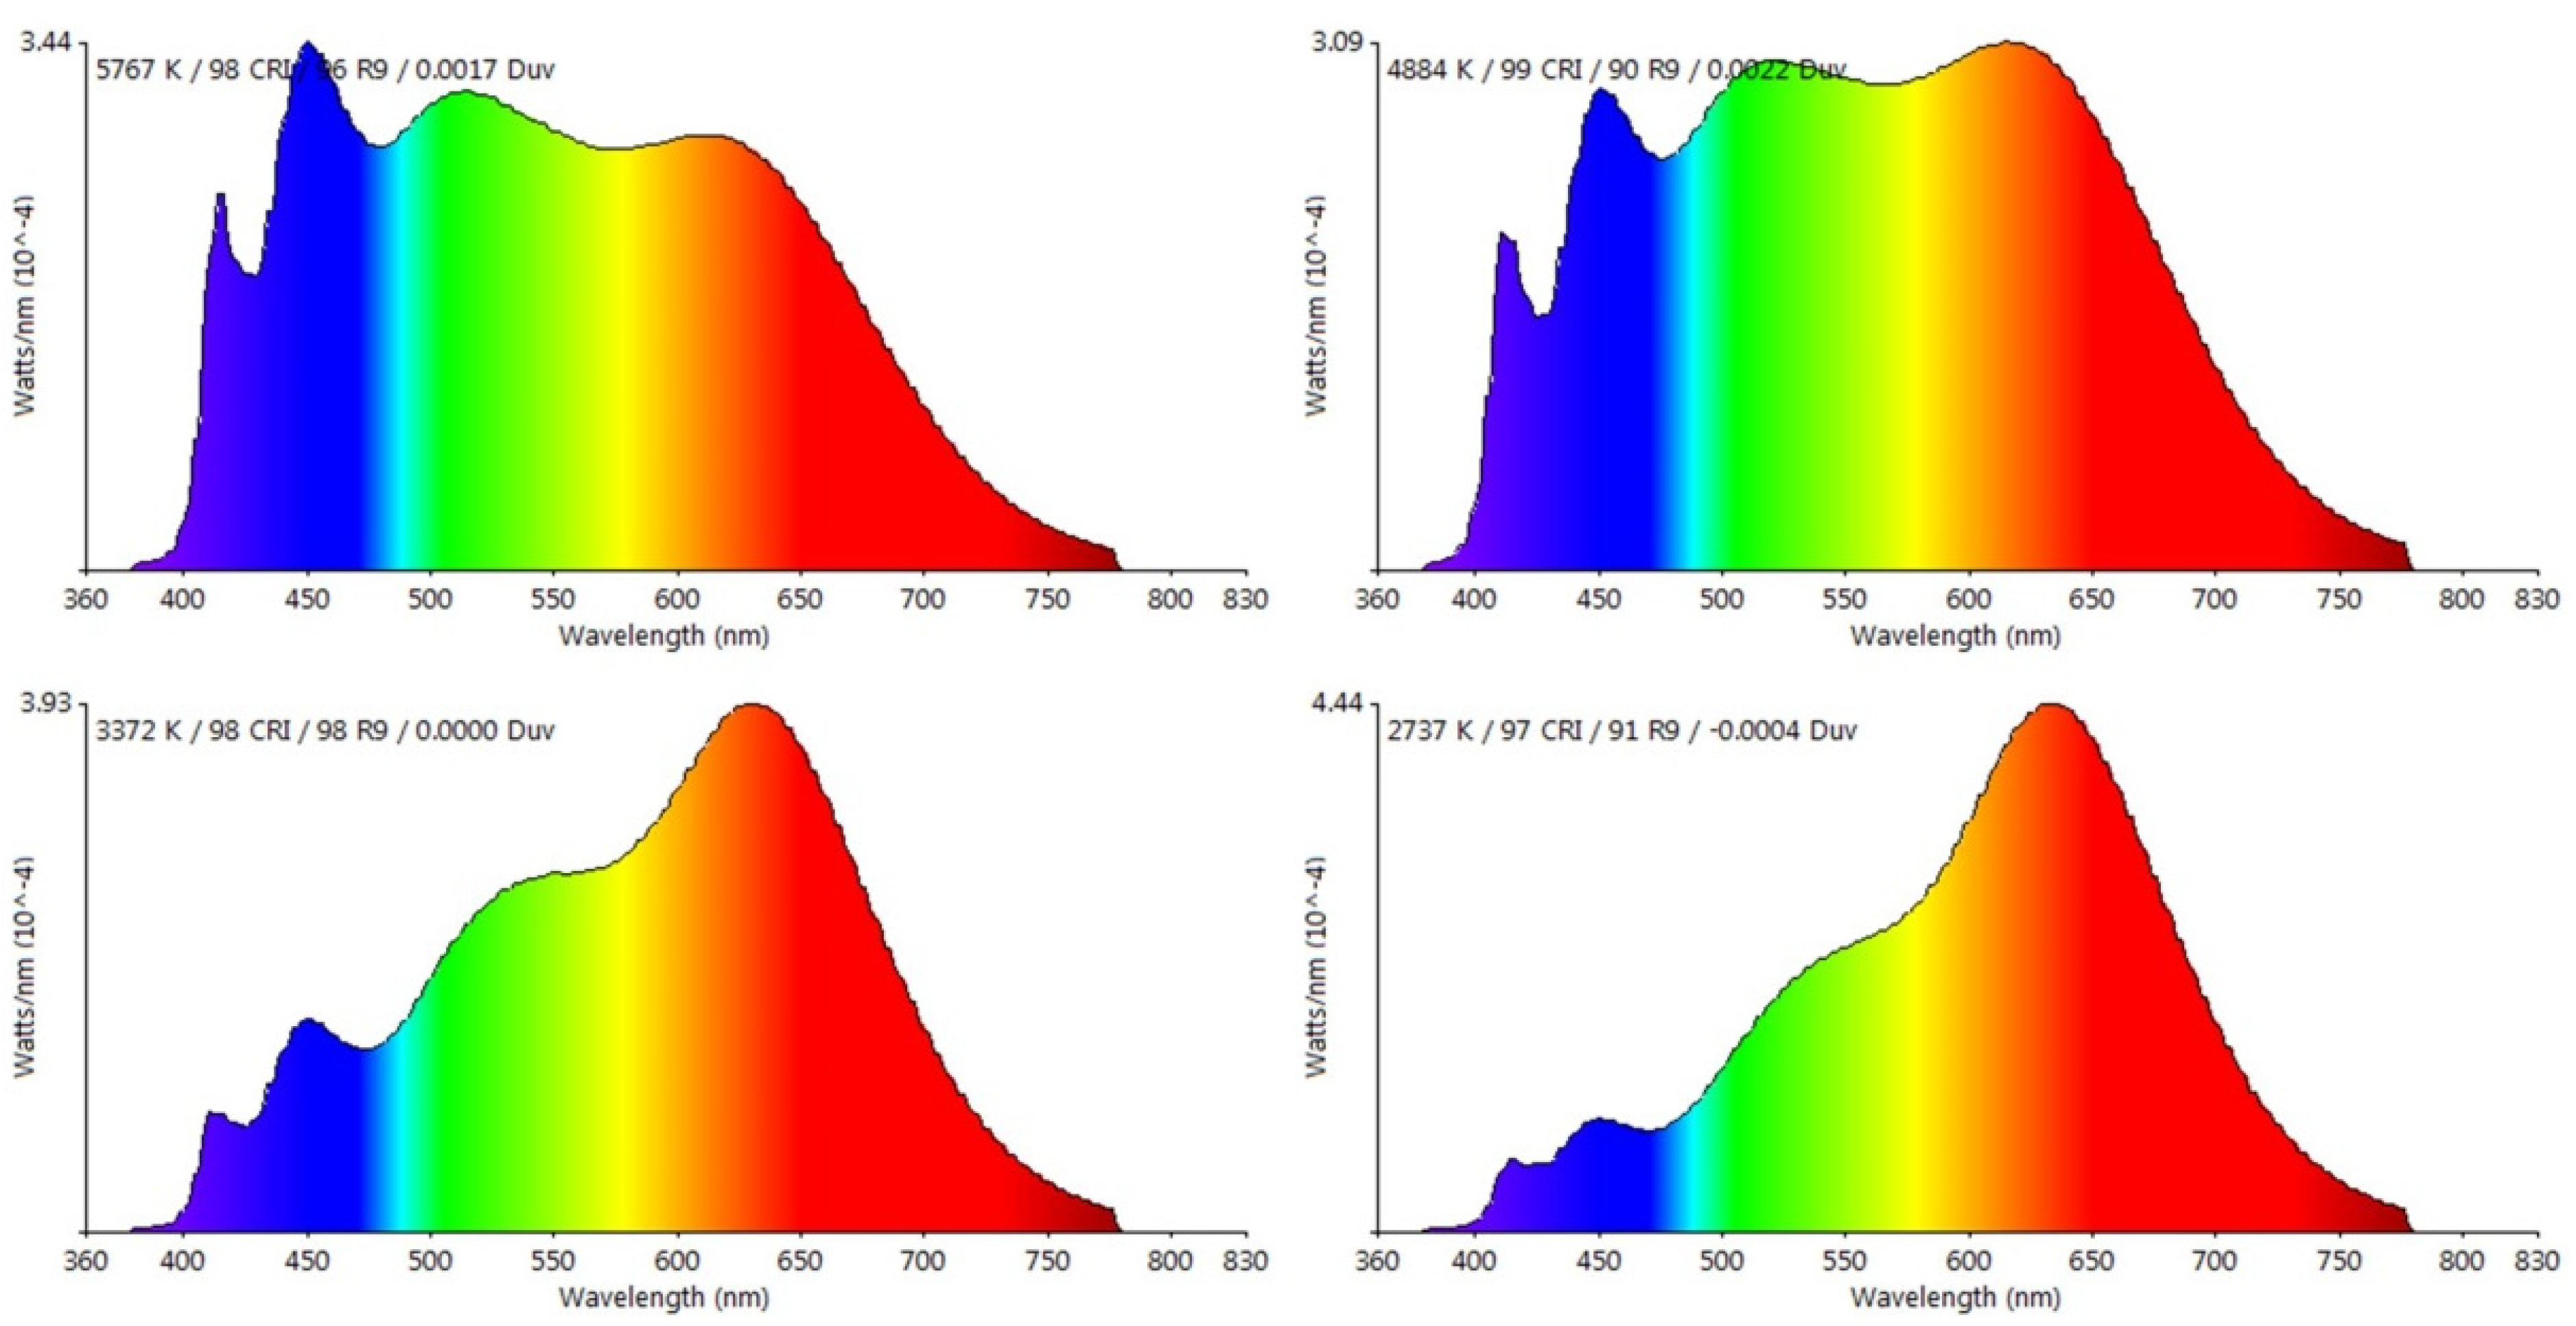
| 5771K/98CRI | 4884K/99CRI | 3373K/98CRI | 2737K/97CRI | |
|---|---|---|---|---|
| MAF | 0.846 | 0.752 | 0.535 | 0.416 |
| EDI | Ephotopic | |||
| 250 | 268 | 302 | 424 | 545 |
| 150 | 161 | 181 | 254 | 327 |
Publisher’s Note: MDPI stays neutral with regard to jurisdictional claims in published maps and institutional affiliations. |
© 2021 by the authors. Licensee MDPI, Basel, Switzerland. This article is an open access article distributed under the terms and conditions of the Creative Commons Attribution (CC BY) license (https://creativecommons.org/licenses/by/4.0/).
Share and Cite
Ezpeleta, S.; Orduna-Hospital, E.; Solana, T.; Aporta, J.; Pinilla, I.; Sánchez-Cano, A. Analysis of Photopic and Melanopic Lighting in Teaching Environments. Buildings 2021, 11, 439. https://doi.org/10.3390/buildings11100439
Ezpeleta S, Orduna-Hospital E, Solana T, Aporta J, Pinilla I, Sánchez-Cano A. Analysis of Photopic and Melanopic Lighting in Teaching Environments. Buildings. 2021; 11(10):439. https://doi.org/10.3390/buildings11100439
Chicago/Turabian StyleEzpeleta, Silvia, Elvira Orduna-Hospital, Teresa Solana, Justiniano Aporta, Isabel Pinilla, and Ana Sánchez-Cano. 2021. "Analysis of Photopic and Melanopic Lighting in Teaching Environments" Buildings 11, no. 10: 439. https://doi.org/10.3390/buildings11100439
APA StyleEzpeleta, S., Orduna-Hospital, E., Solana, T., Aporta, J., Pinilla, I., & Sánchez-Cano, A. (2021). Analysis of Photopic and Melanopic Lighting in Teaching Environments. Buildings, 11(10), 439. https://doi.org/10.3390/buildings11100439