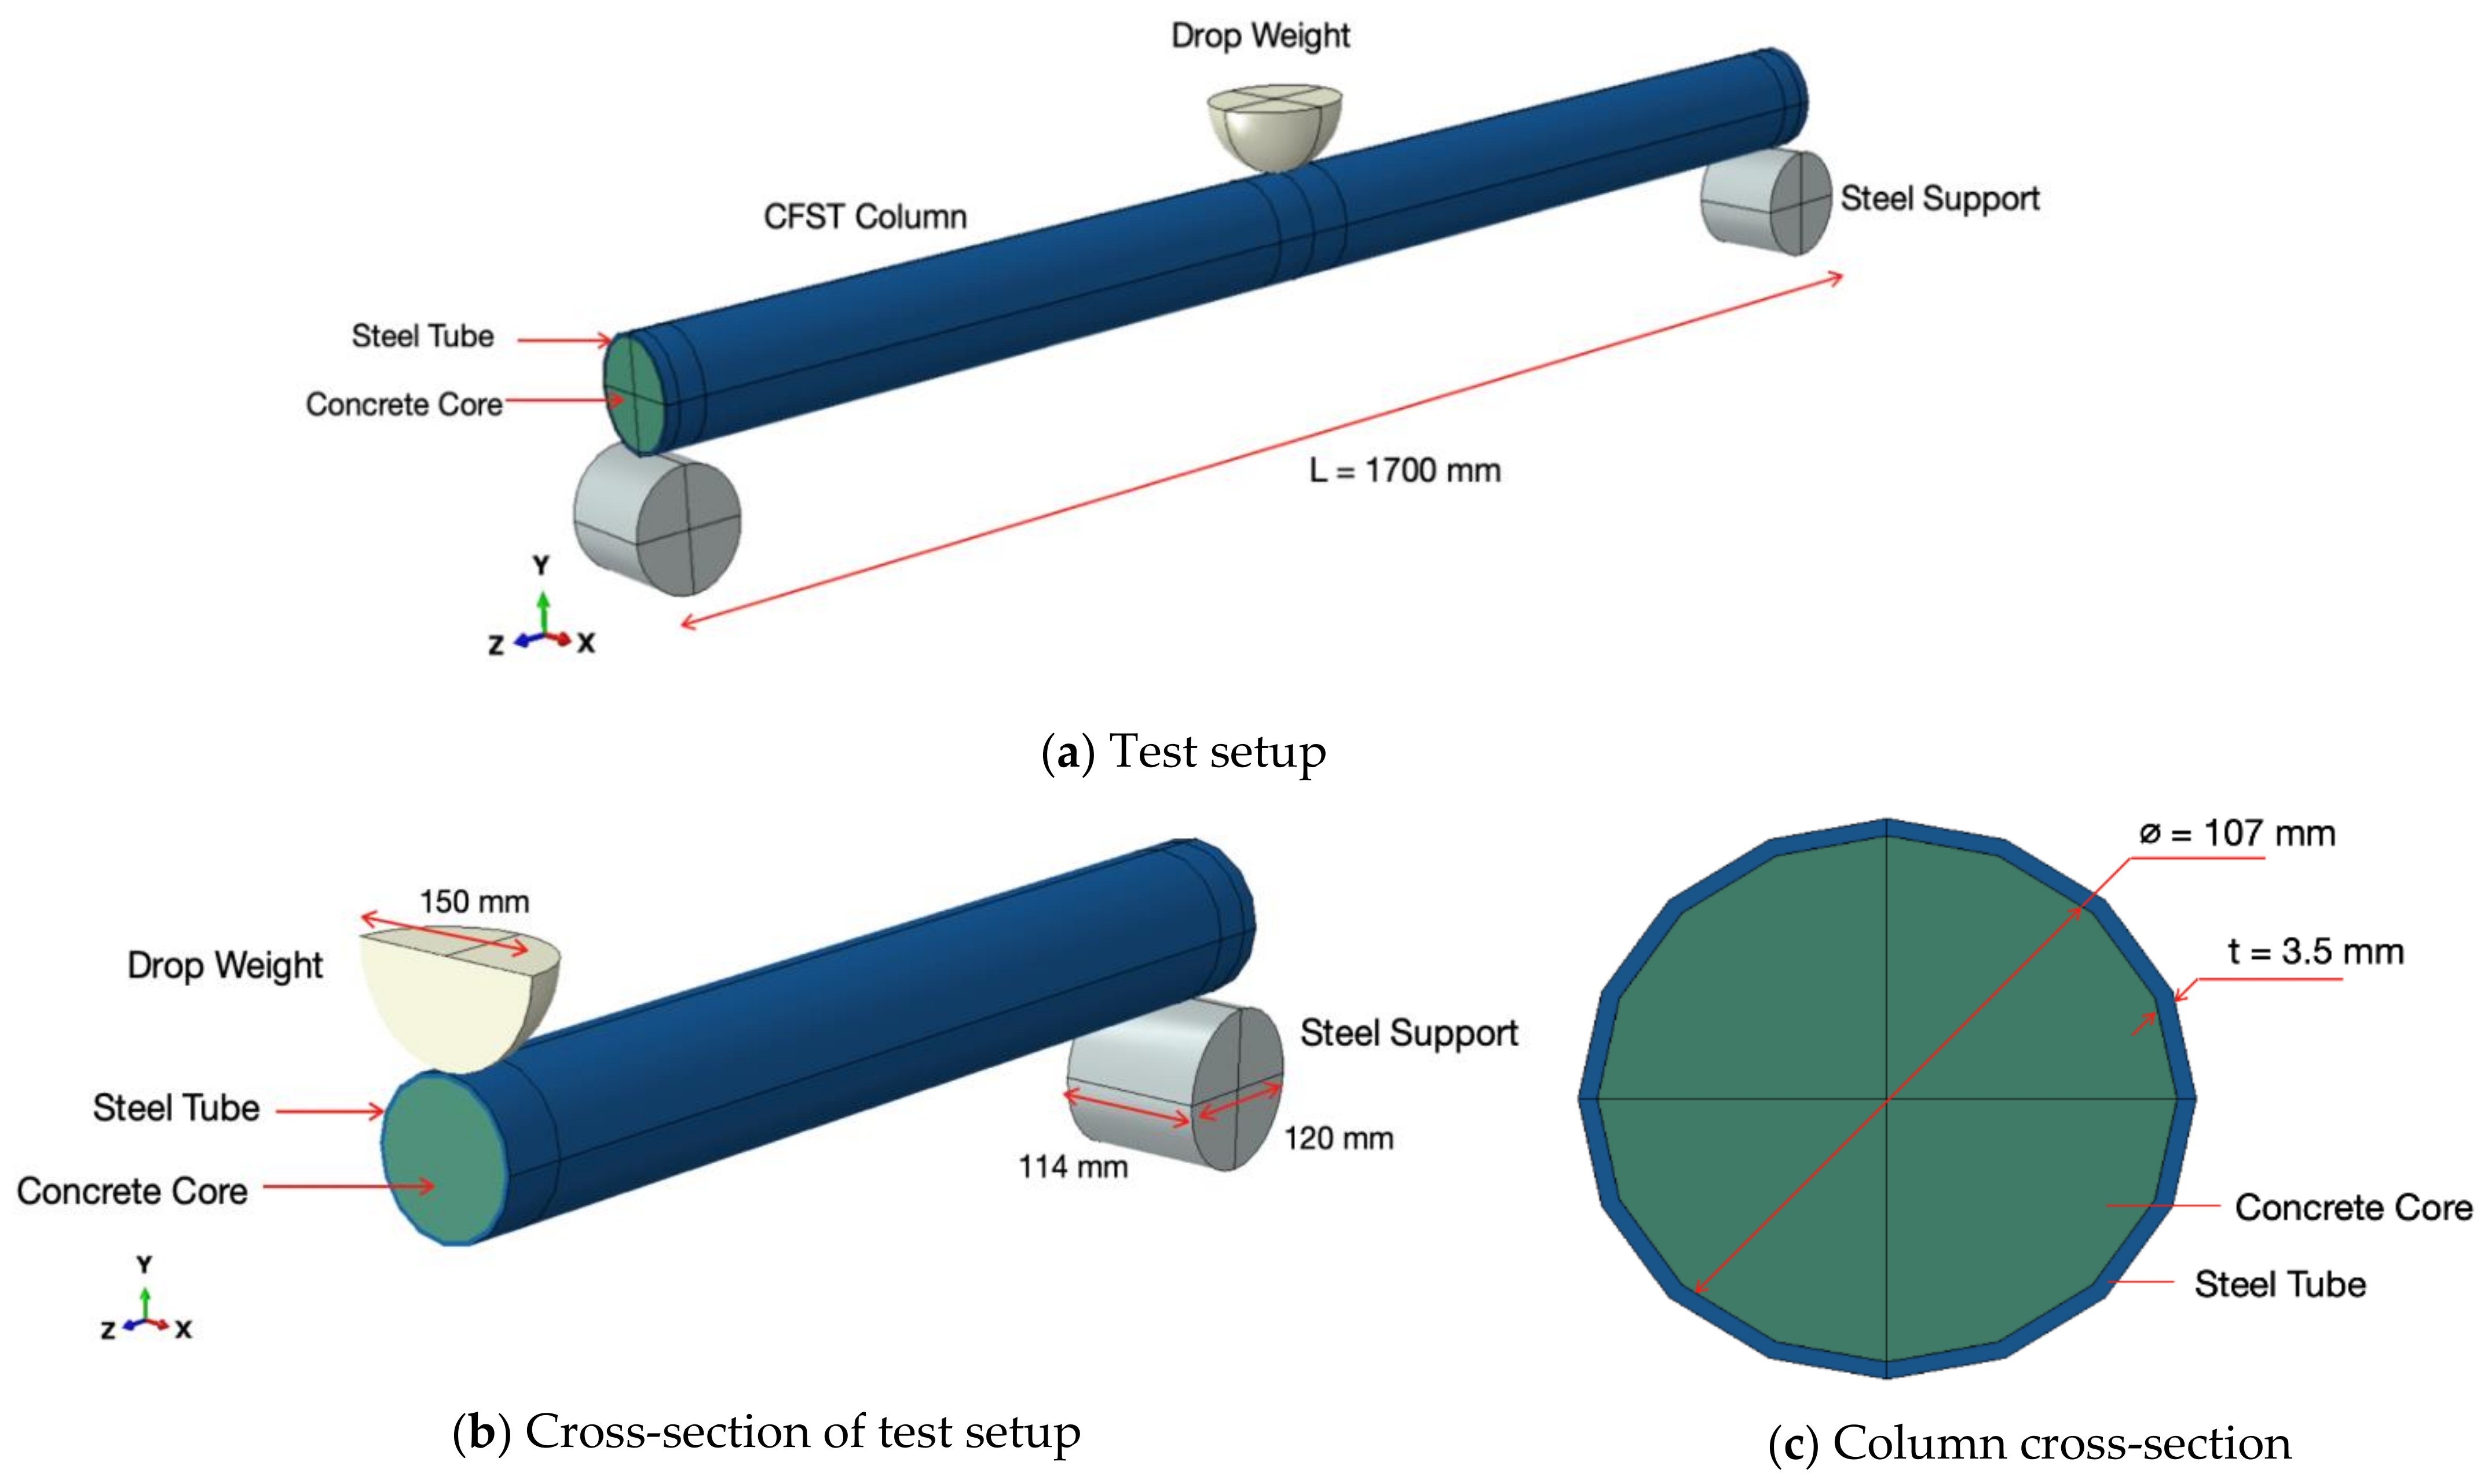
Figure 1.
Bare concrete-filled steel tube (CFST) column.
Figure 1.
Bare concrete-filled steel tube (CFST) column.
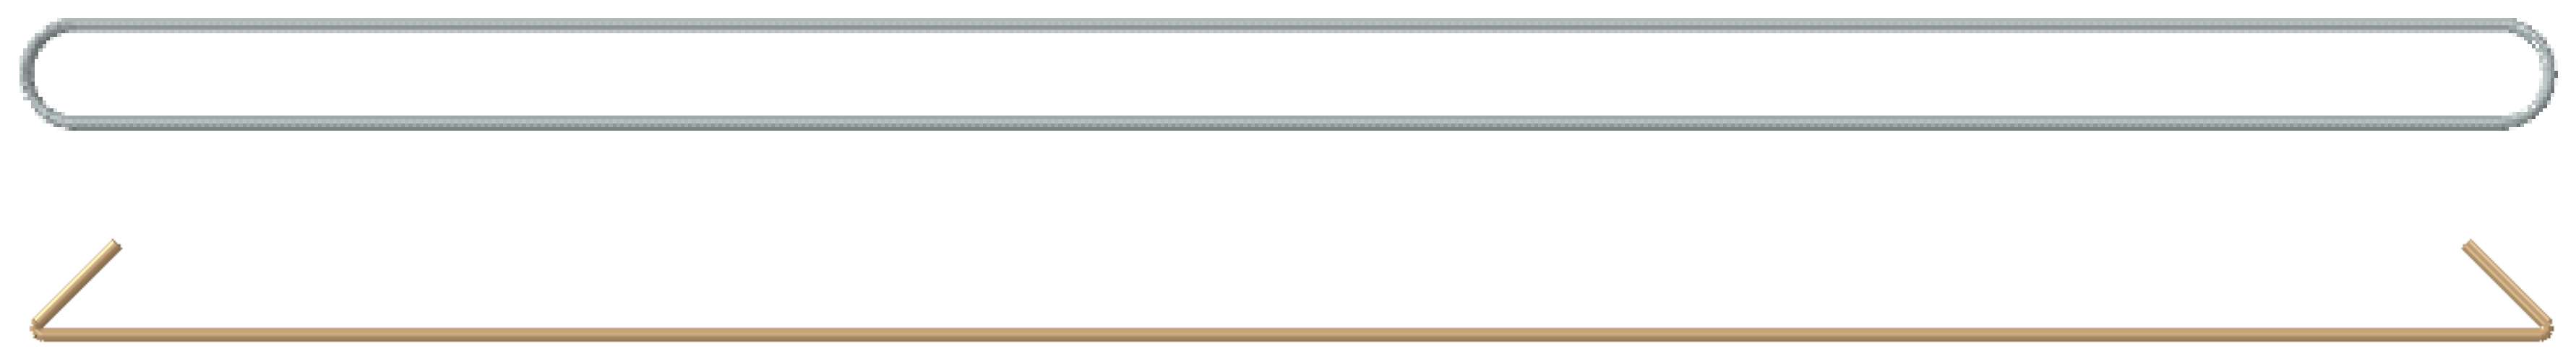
Figure 2.
Reinforcement in (top) x- and (bottom) y-directions.
Figure 2.
Reinforcement in (top) x- and (bottom) y-directions.
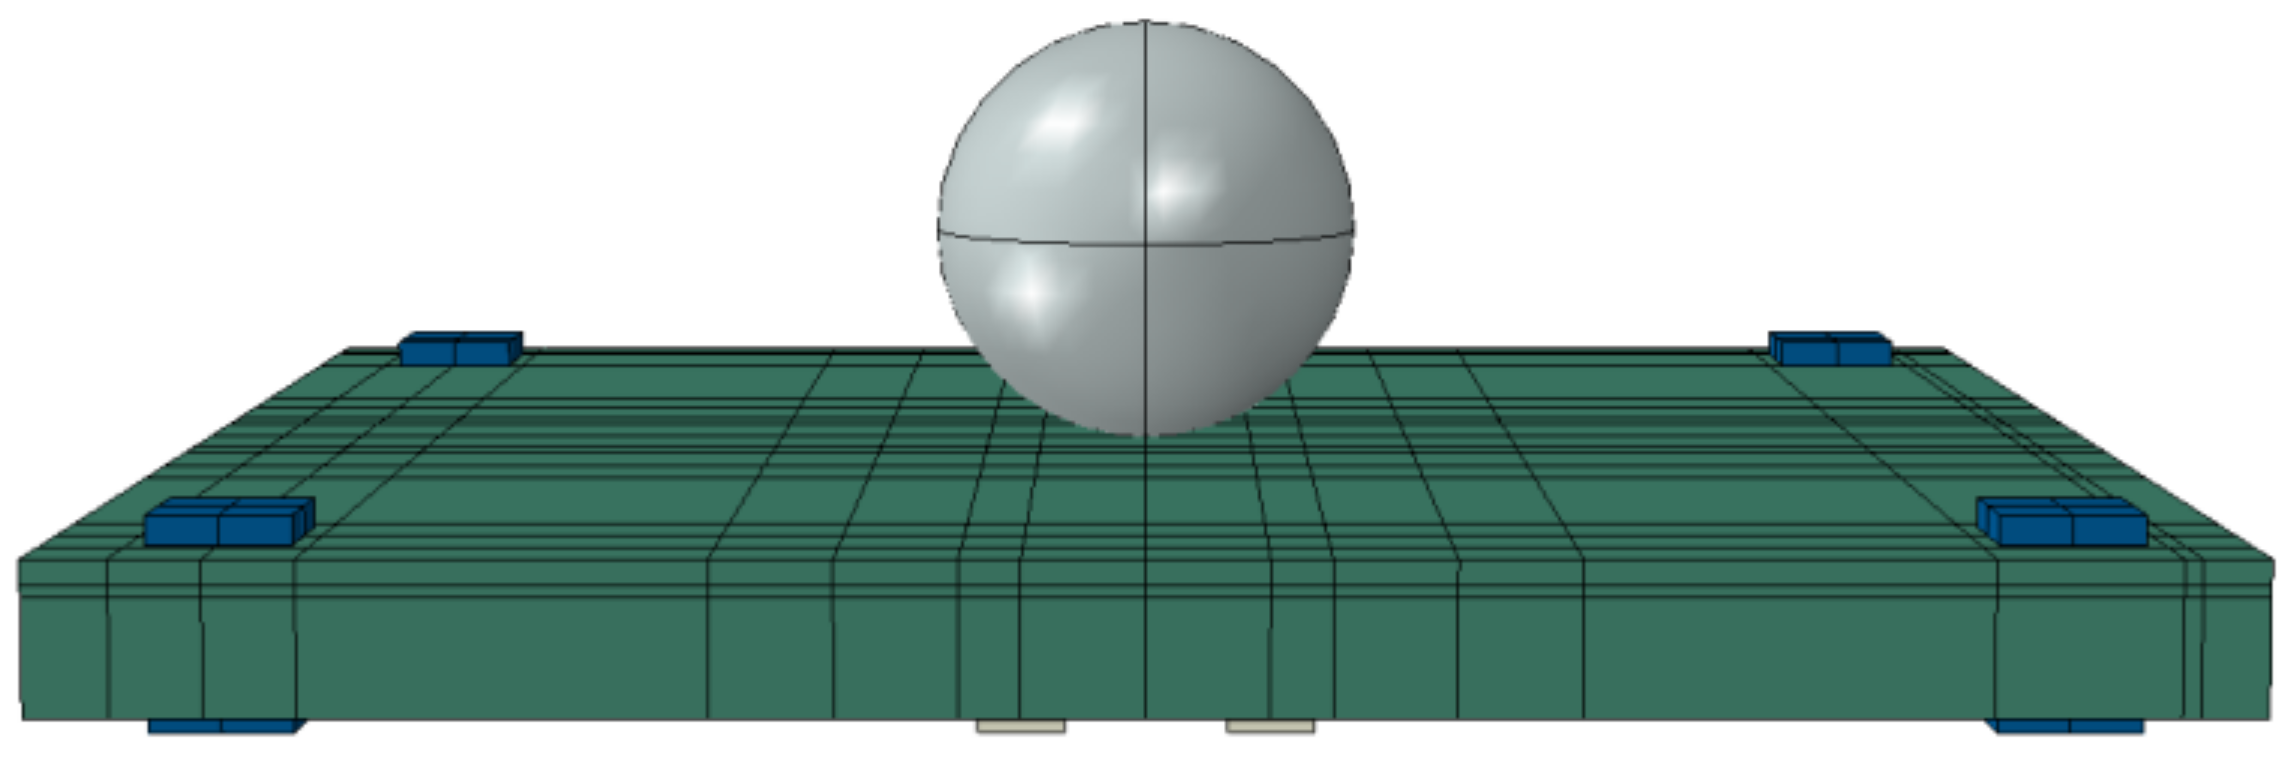
Figure 3.
Assembly of parts.
Figure 3.
Assembly of parts.
Figure 4.
Force–displacement graph for initial trials using the same steel and concrete mesh sizes. Mesh Type A, B, C, D and E refer to the
Table 6.
Figure 4.
Force–displacement graph for initial trials using the same steel and concrete mesh sizes. Mesh Type A, B, C, D and E refer to the
Table 6.
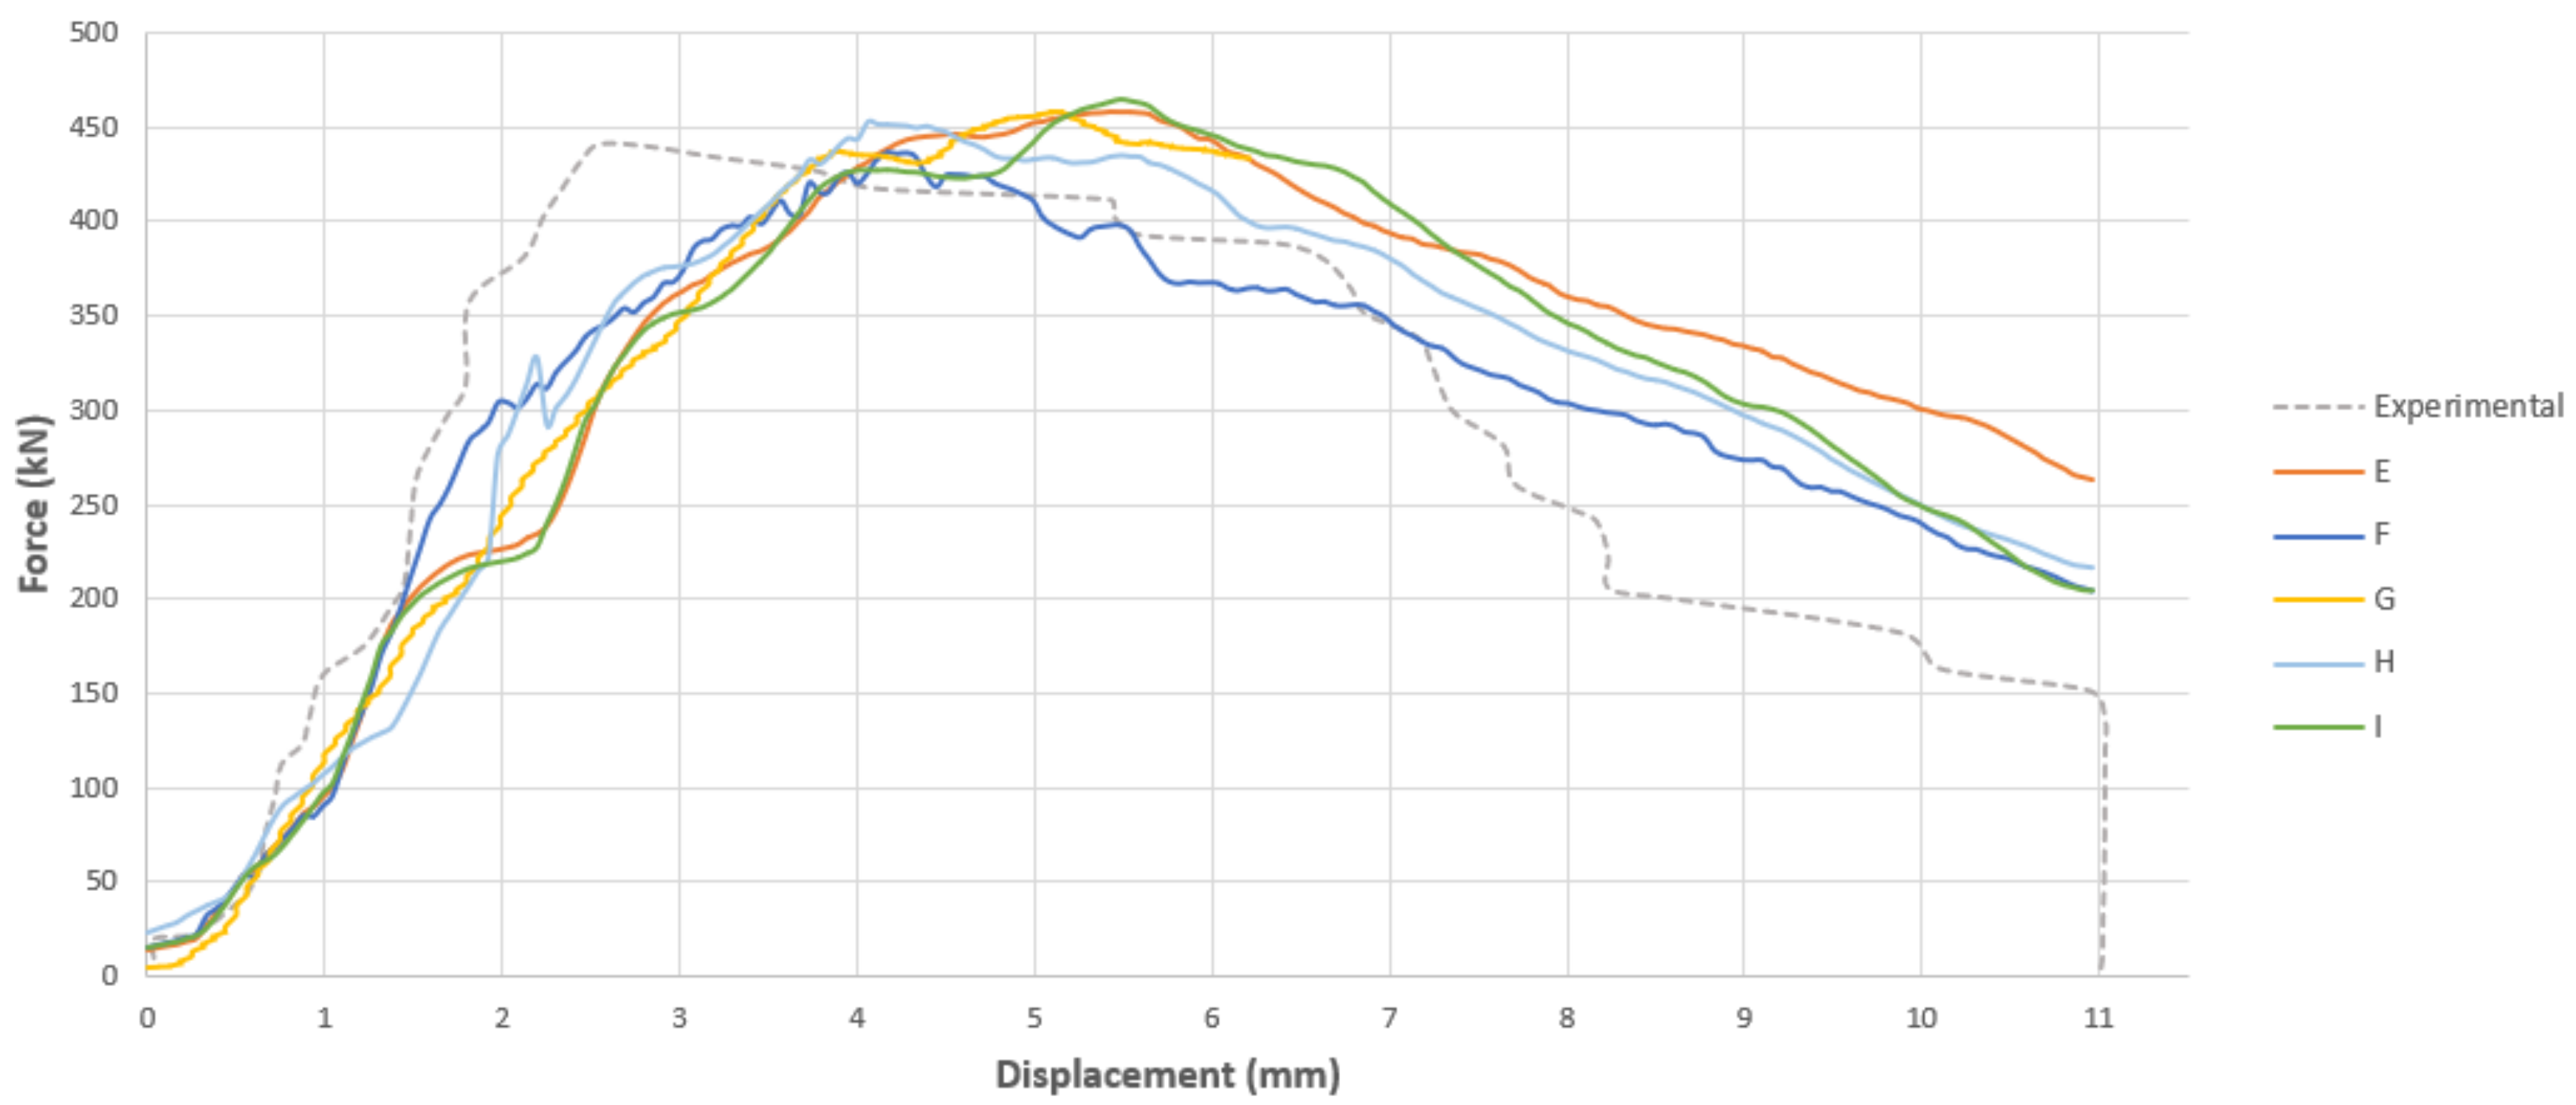
Figure 5.
Force–displacement graph for trials using different element sizes for steel tube and concrete core. Mesh Type E, F, G, H and I refer to the
Table 7.
Figure 5.
Force–displacement graph for trials using different element sizes for steel tube and concrete core. Mesh Type E, F, G, H and I refer to the
Table 7.
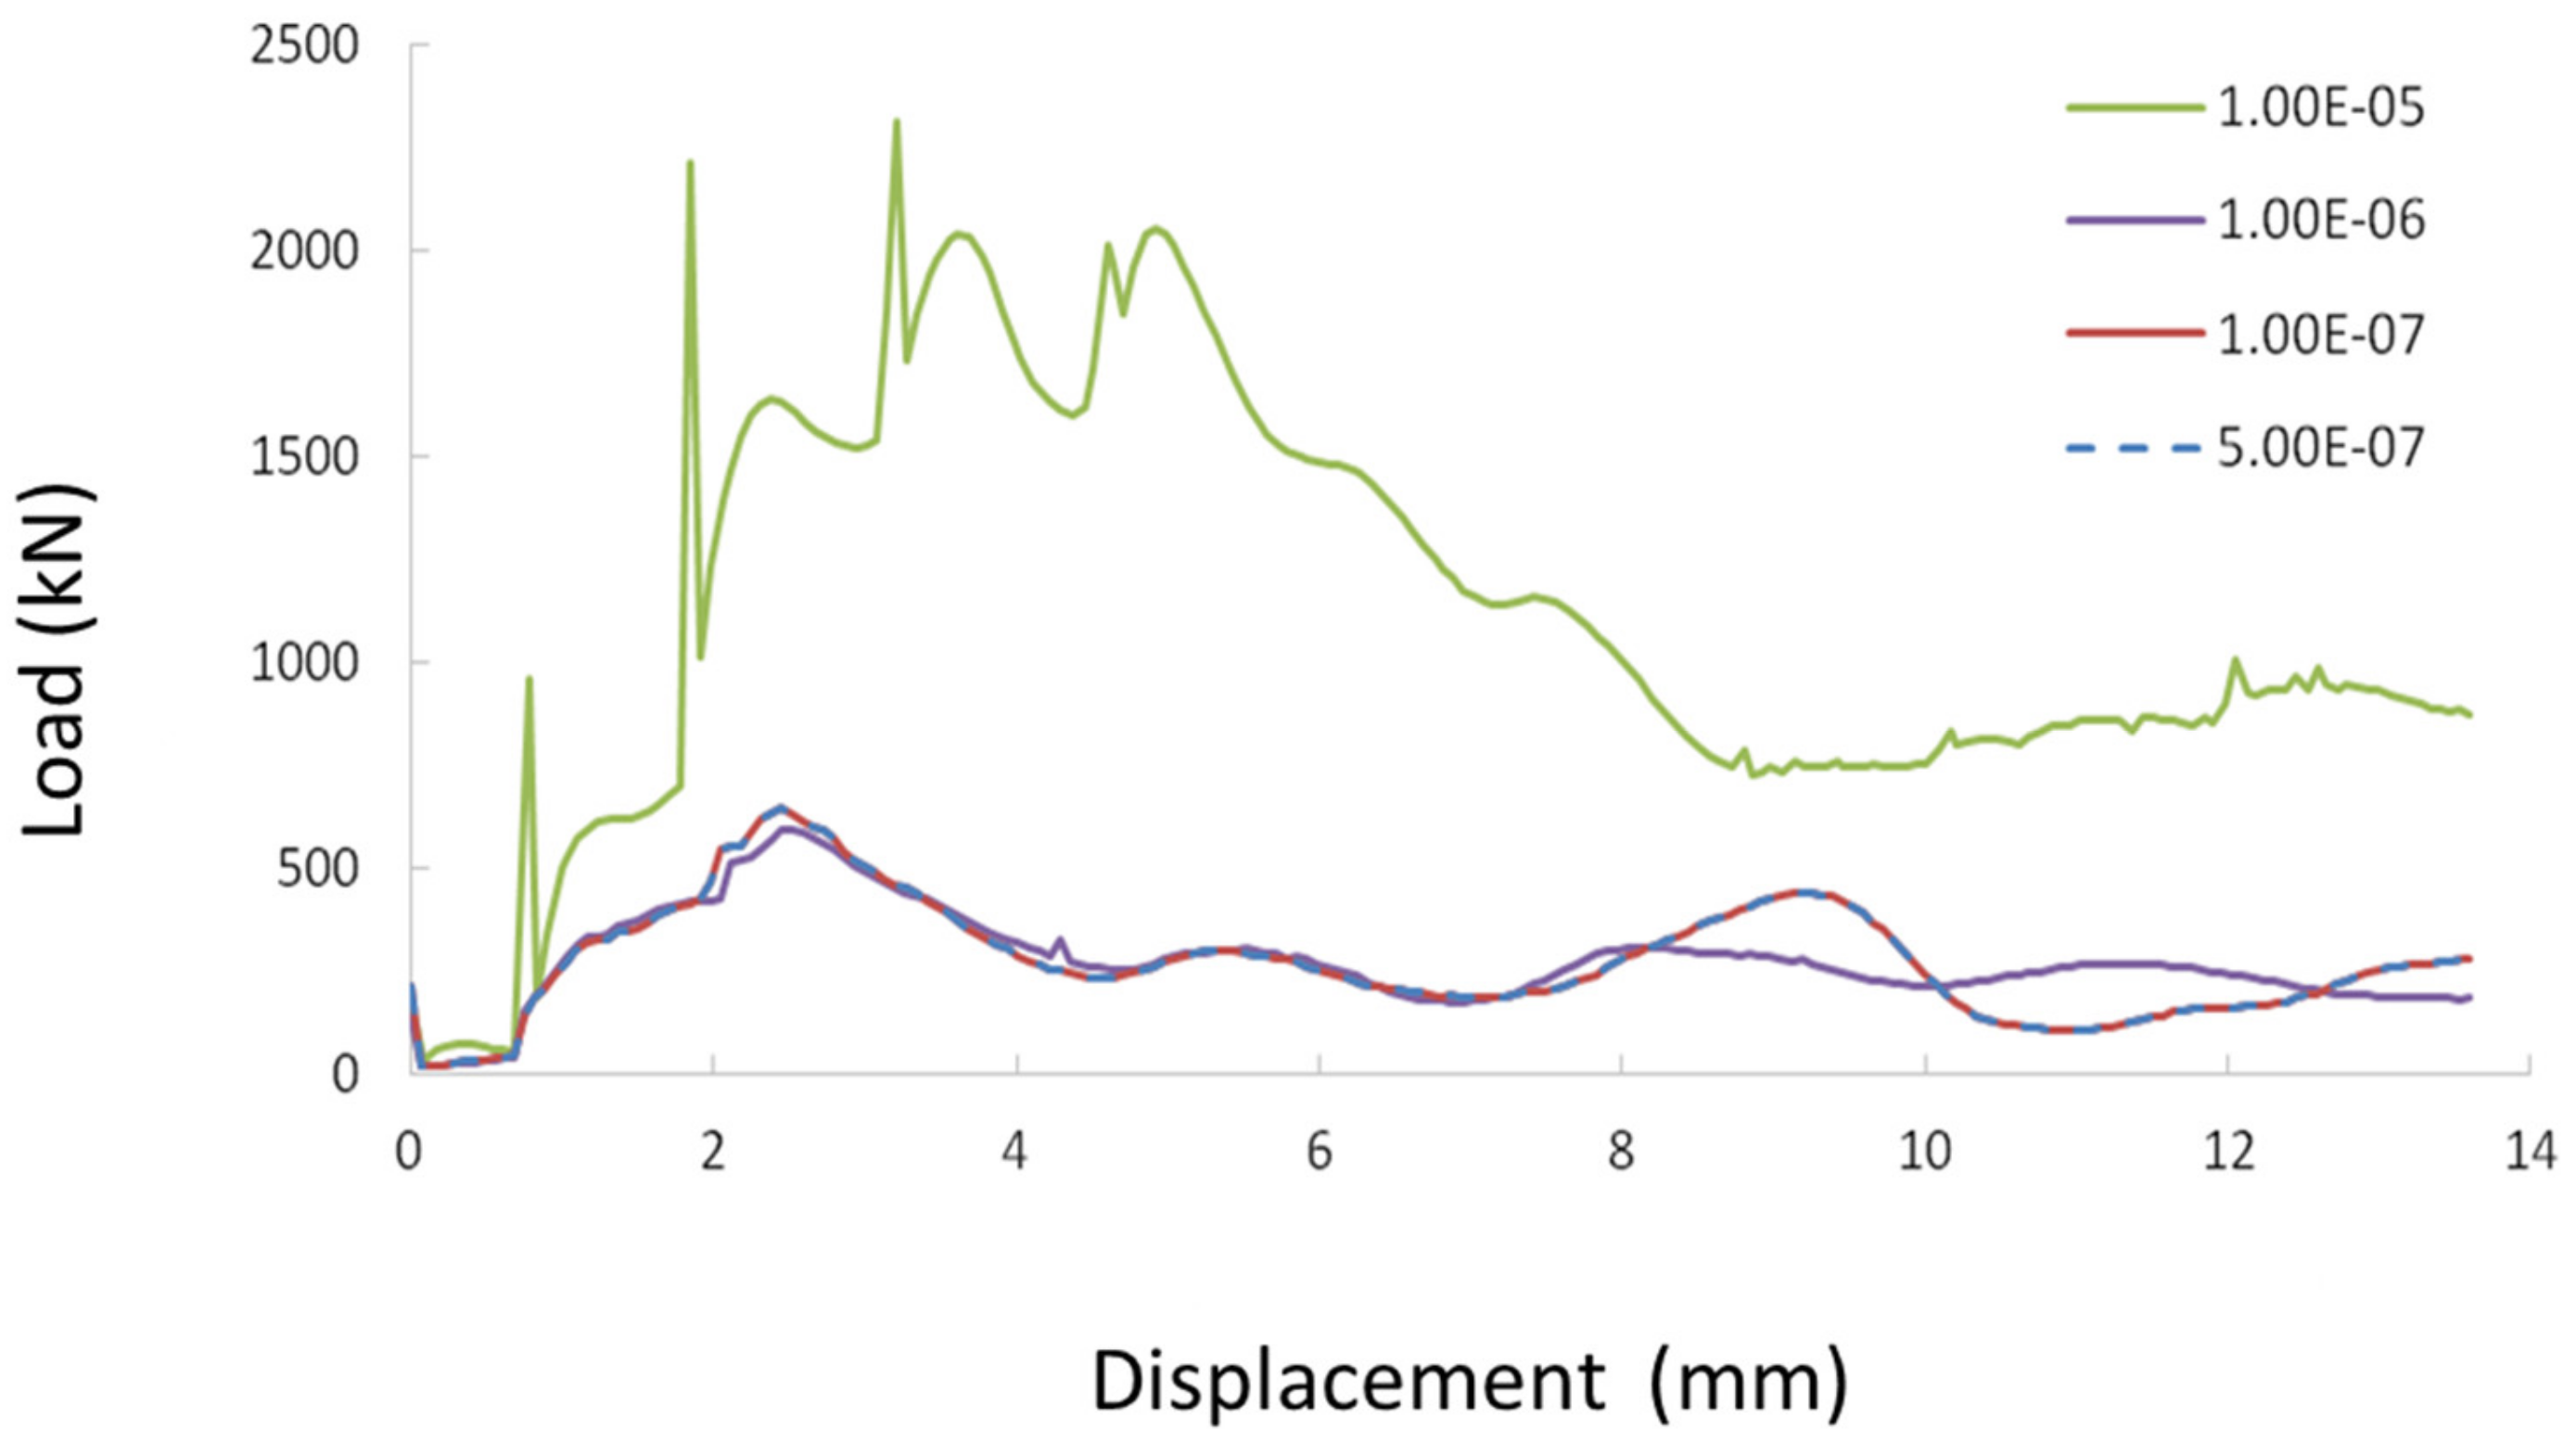
Figure 6.
Forceversus displacement Figure in both slab and steel reinforcement mesh.
Figure 6.
Forceversus displacement Figure in both slab and steel reinforcement mesh.
Figure 7.
Force–displacement graphs—slab local seeding.
Figure 7.
Force–displacement graphs—slab local seeding.
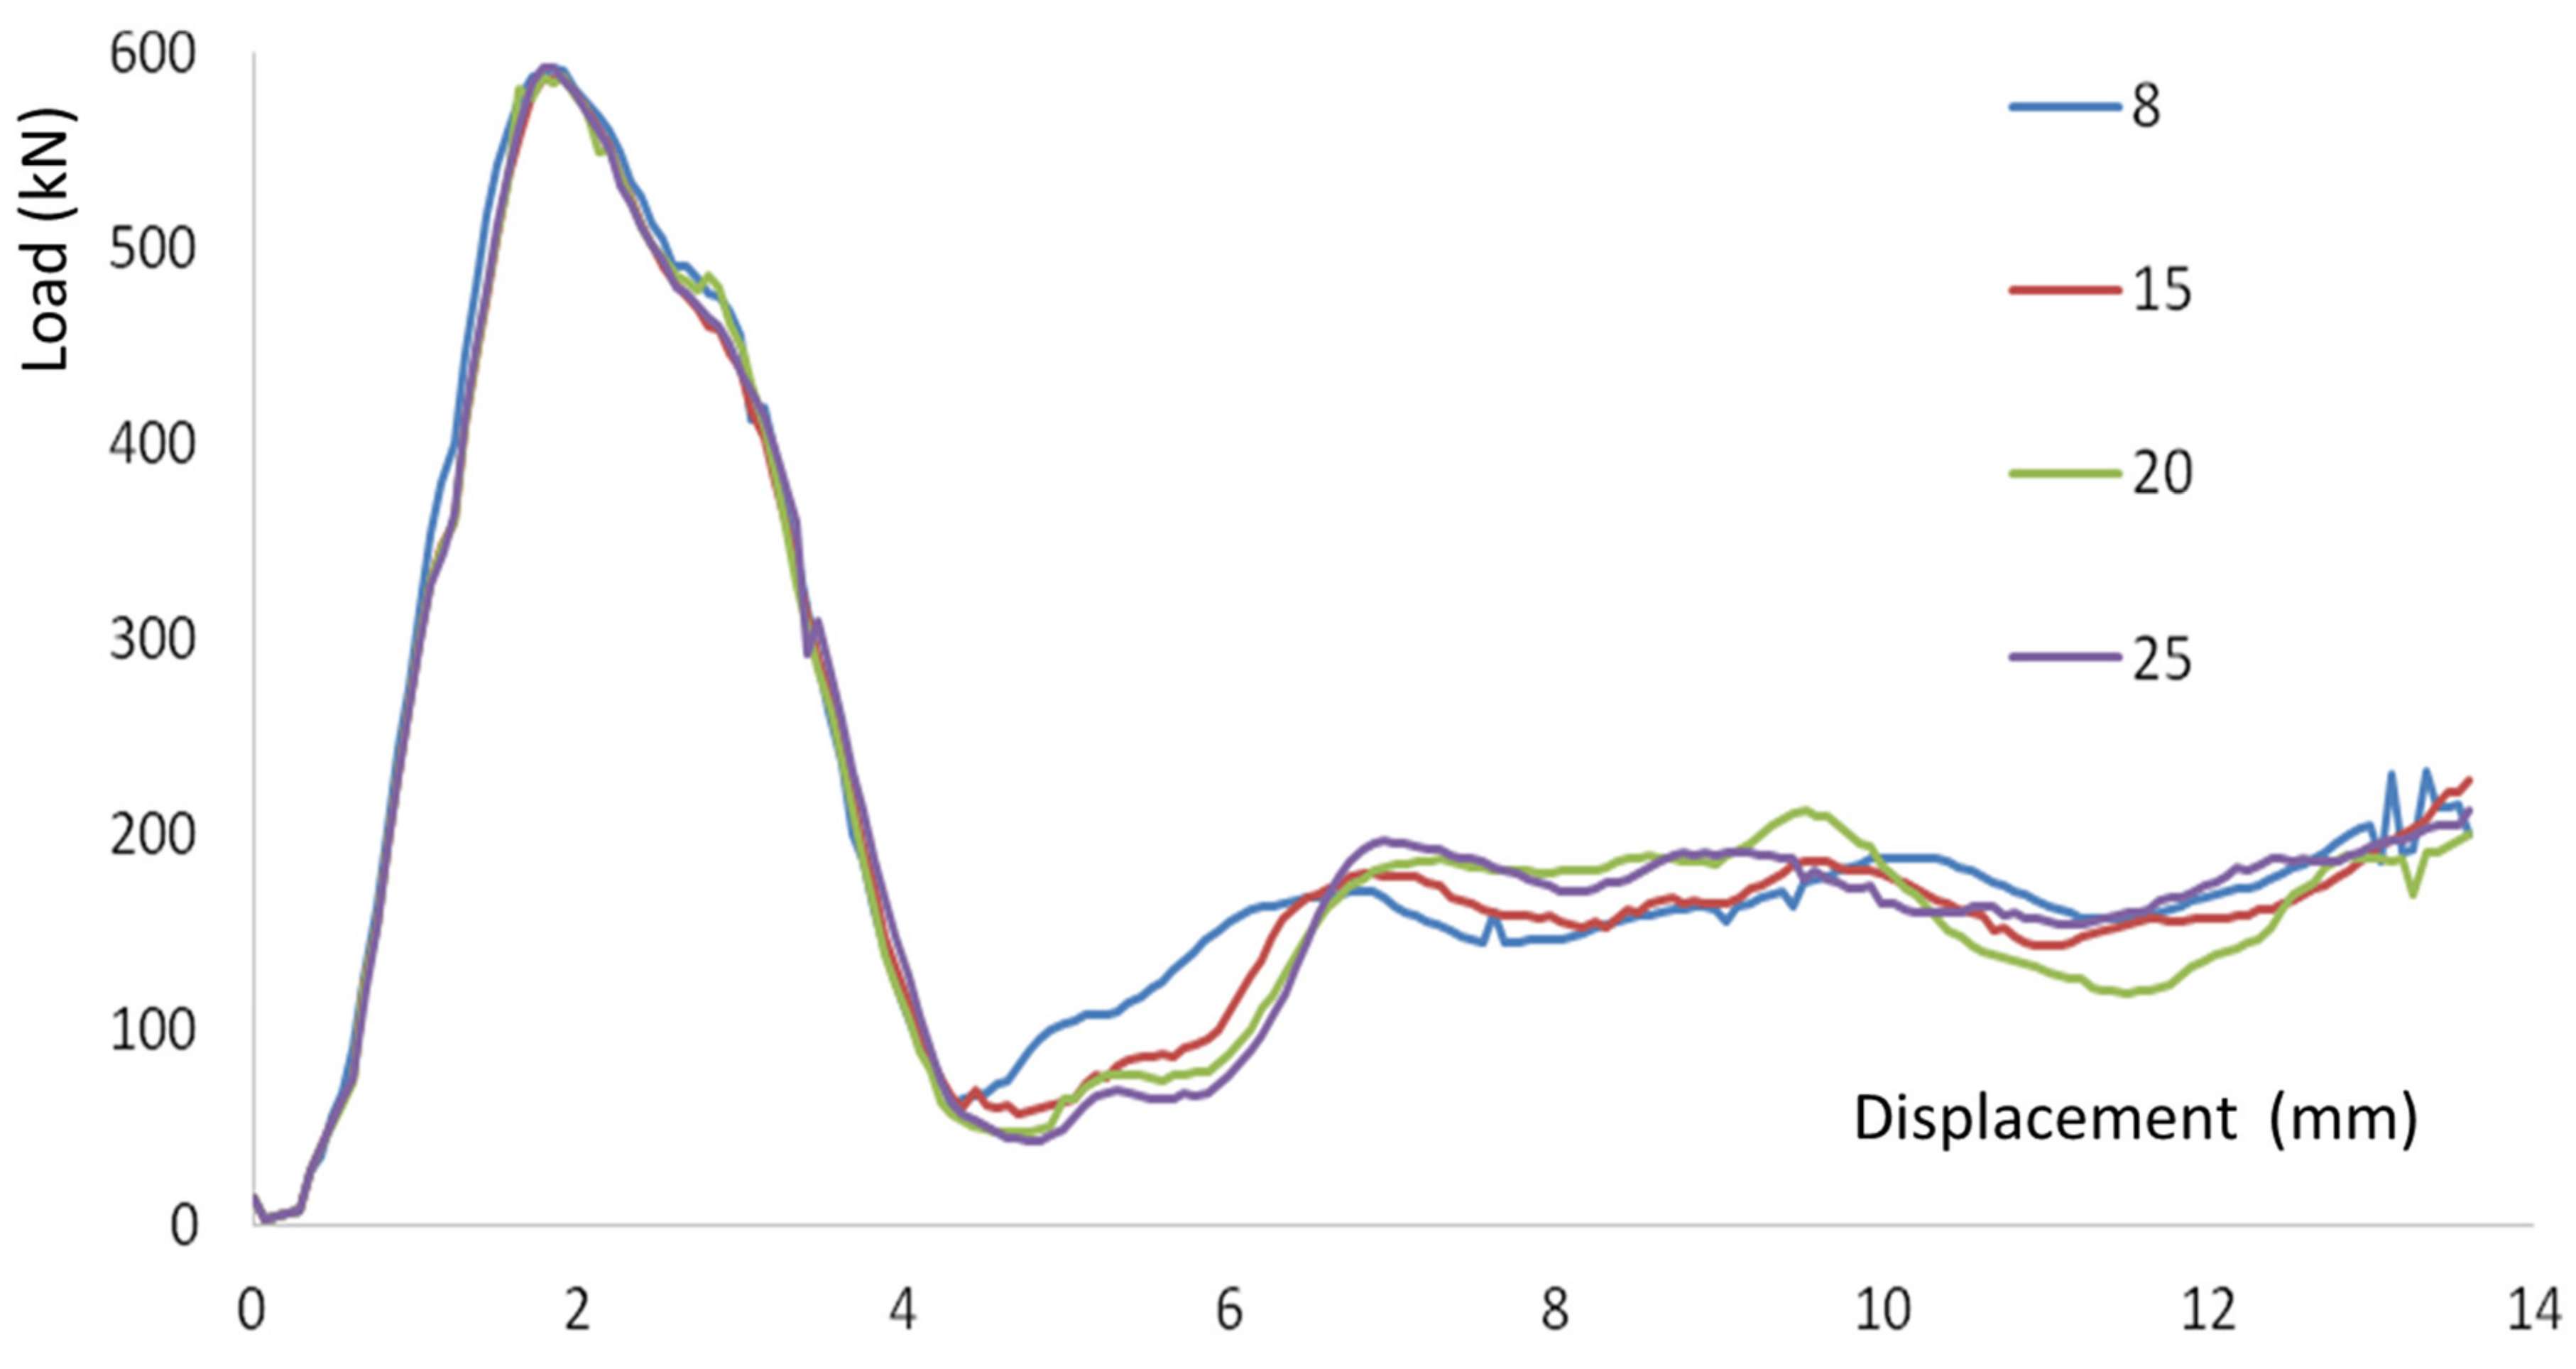
Figure 8.
Mass Scaling Force–displacement Graphs.
Figure 8.
Mass Scaling Force–displacement Graphs.
Figure 9.
Experimental and numerical force–displacement curve for the Chen et al. studies [
5].
Figure 9.
Experimental and numerical force–displacement curve for the Chen et al. studies [
5].
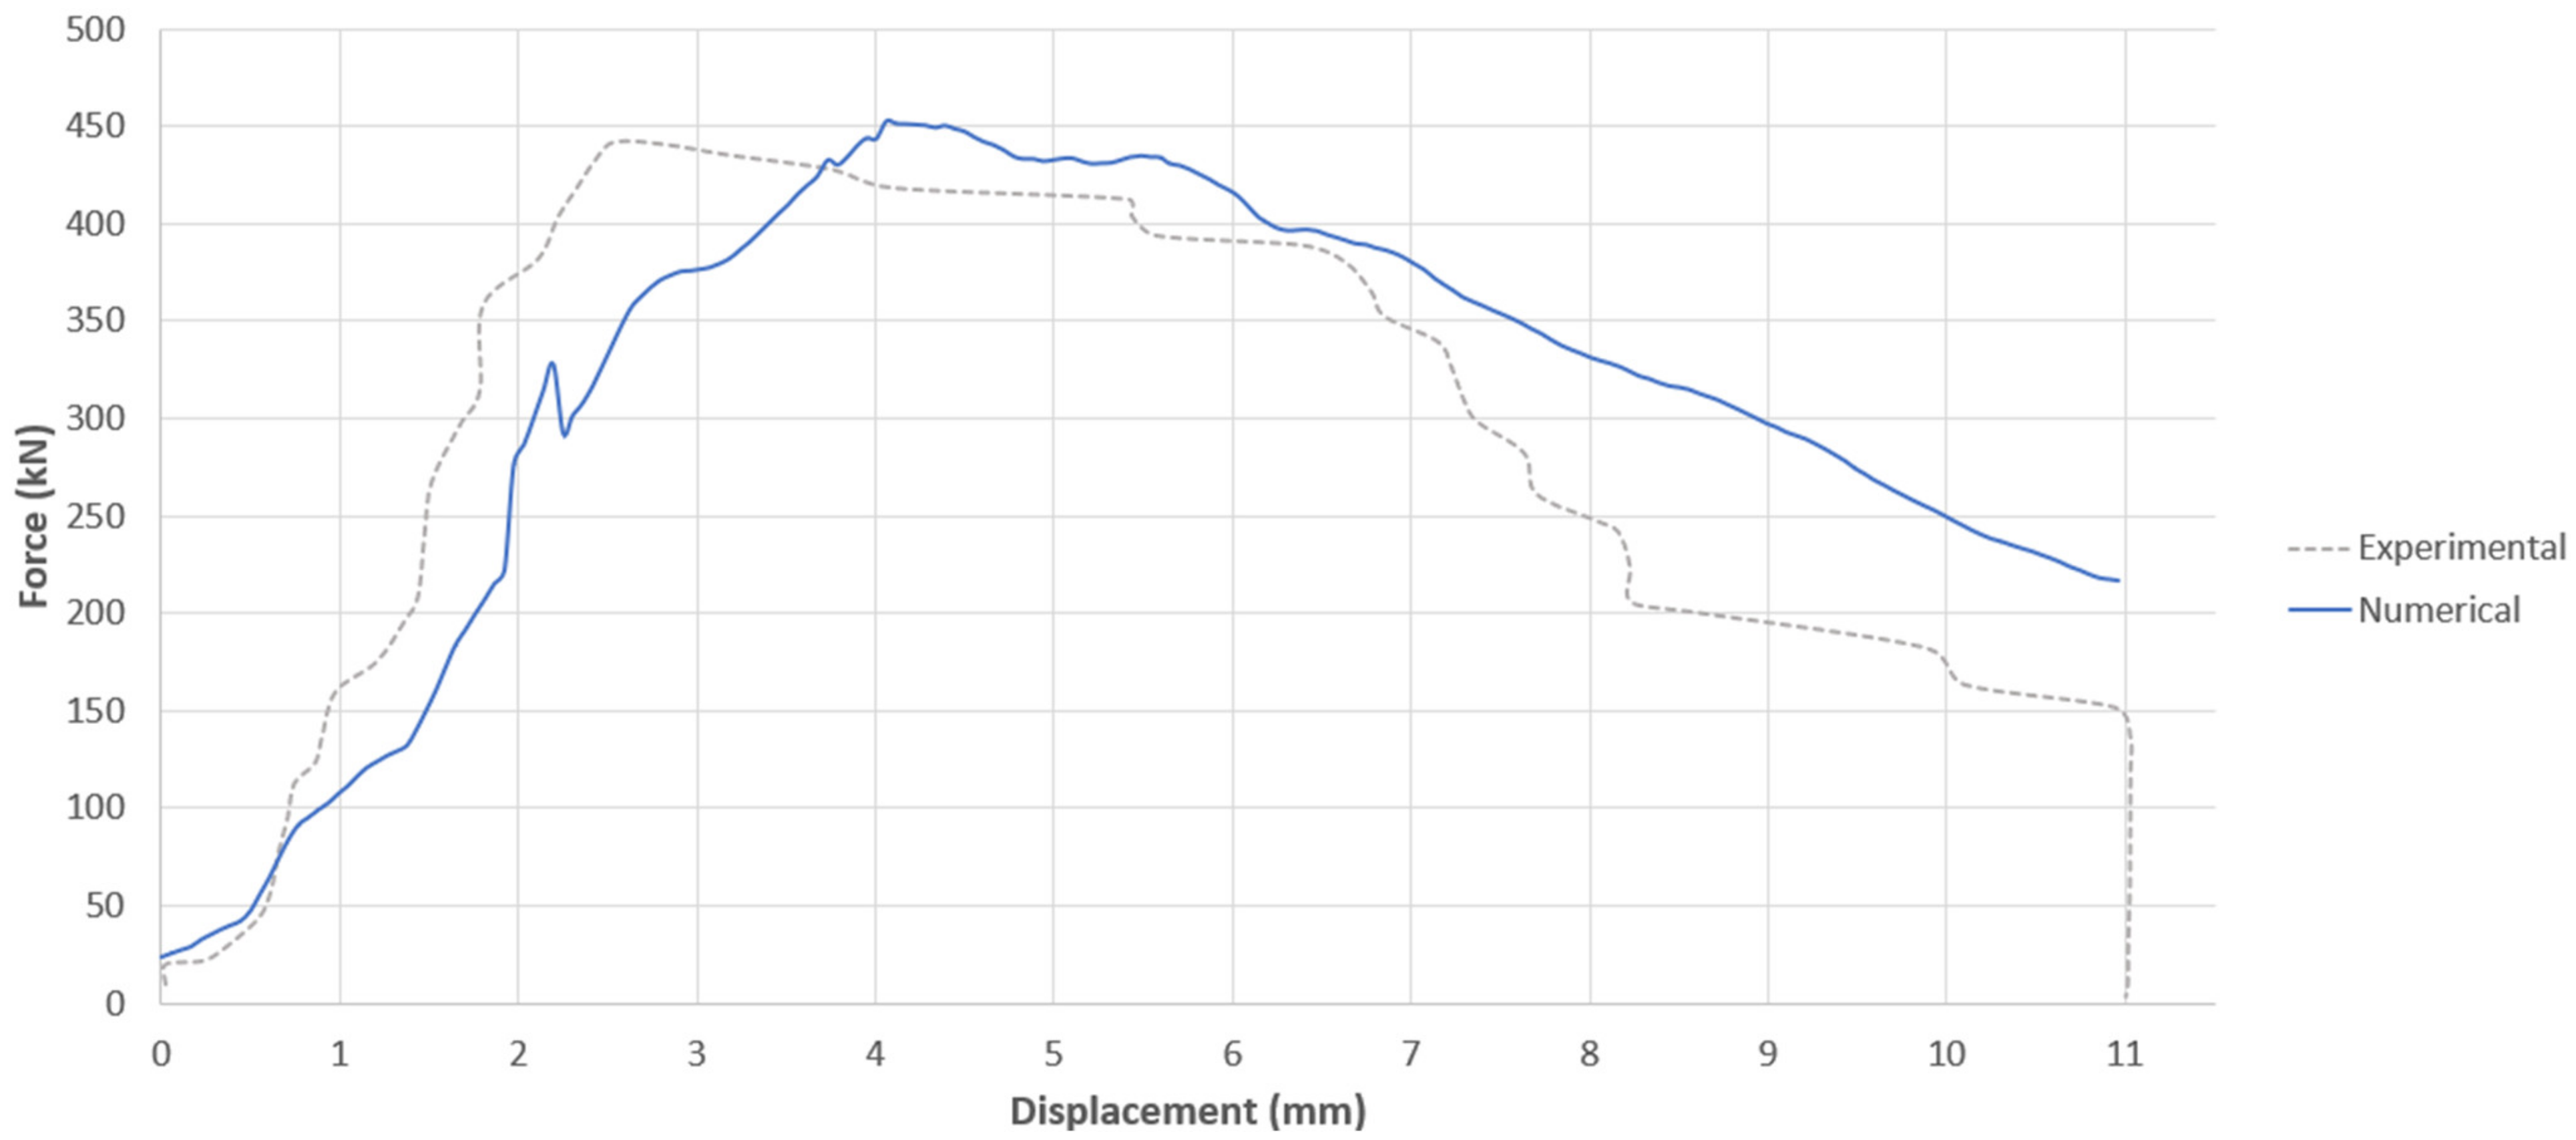
Figure 10.
Experimental and numerical force–displacement curve for the Hrynyk and Vecchio studies [
21].
Figure 10.
Experimental and numerical force–displacement curve for the Hrynyk and Vecchio studies [
21].
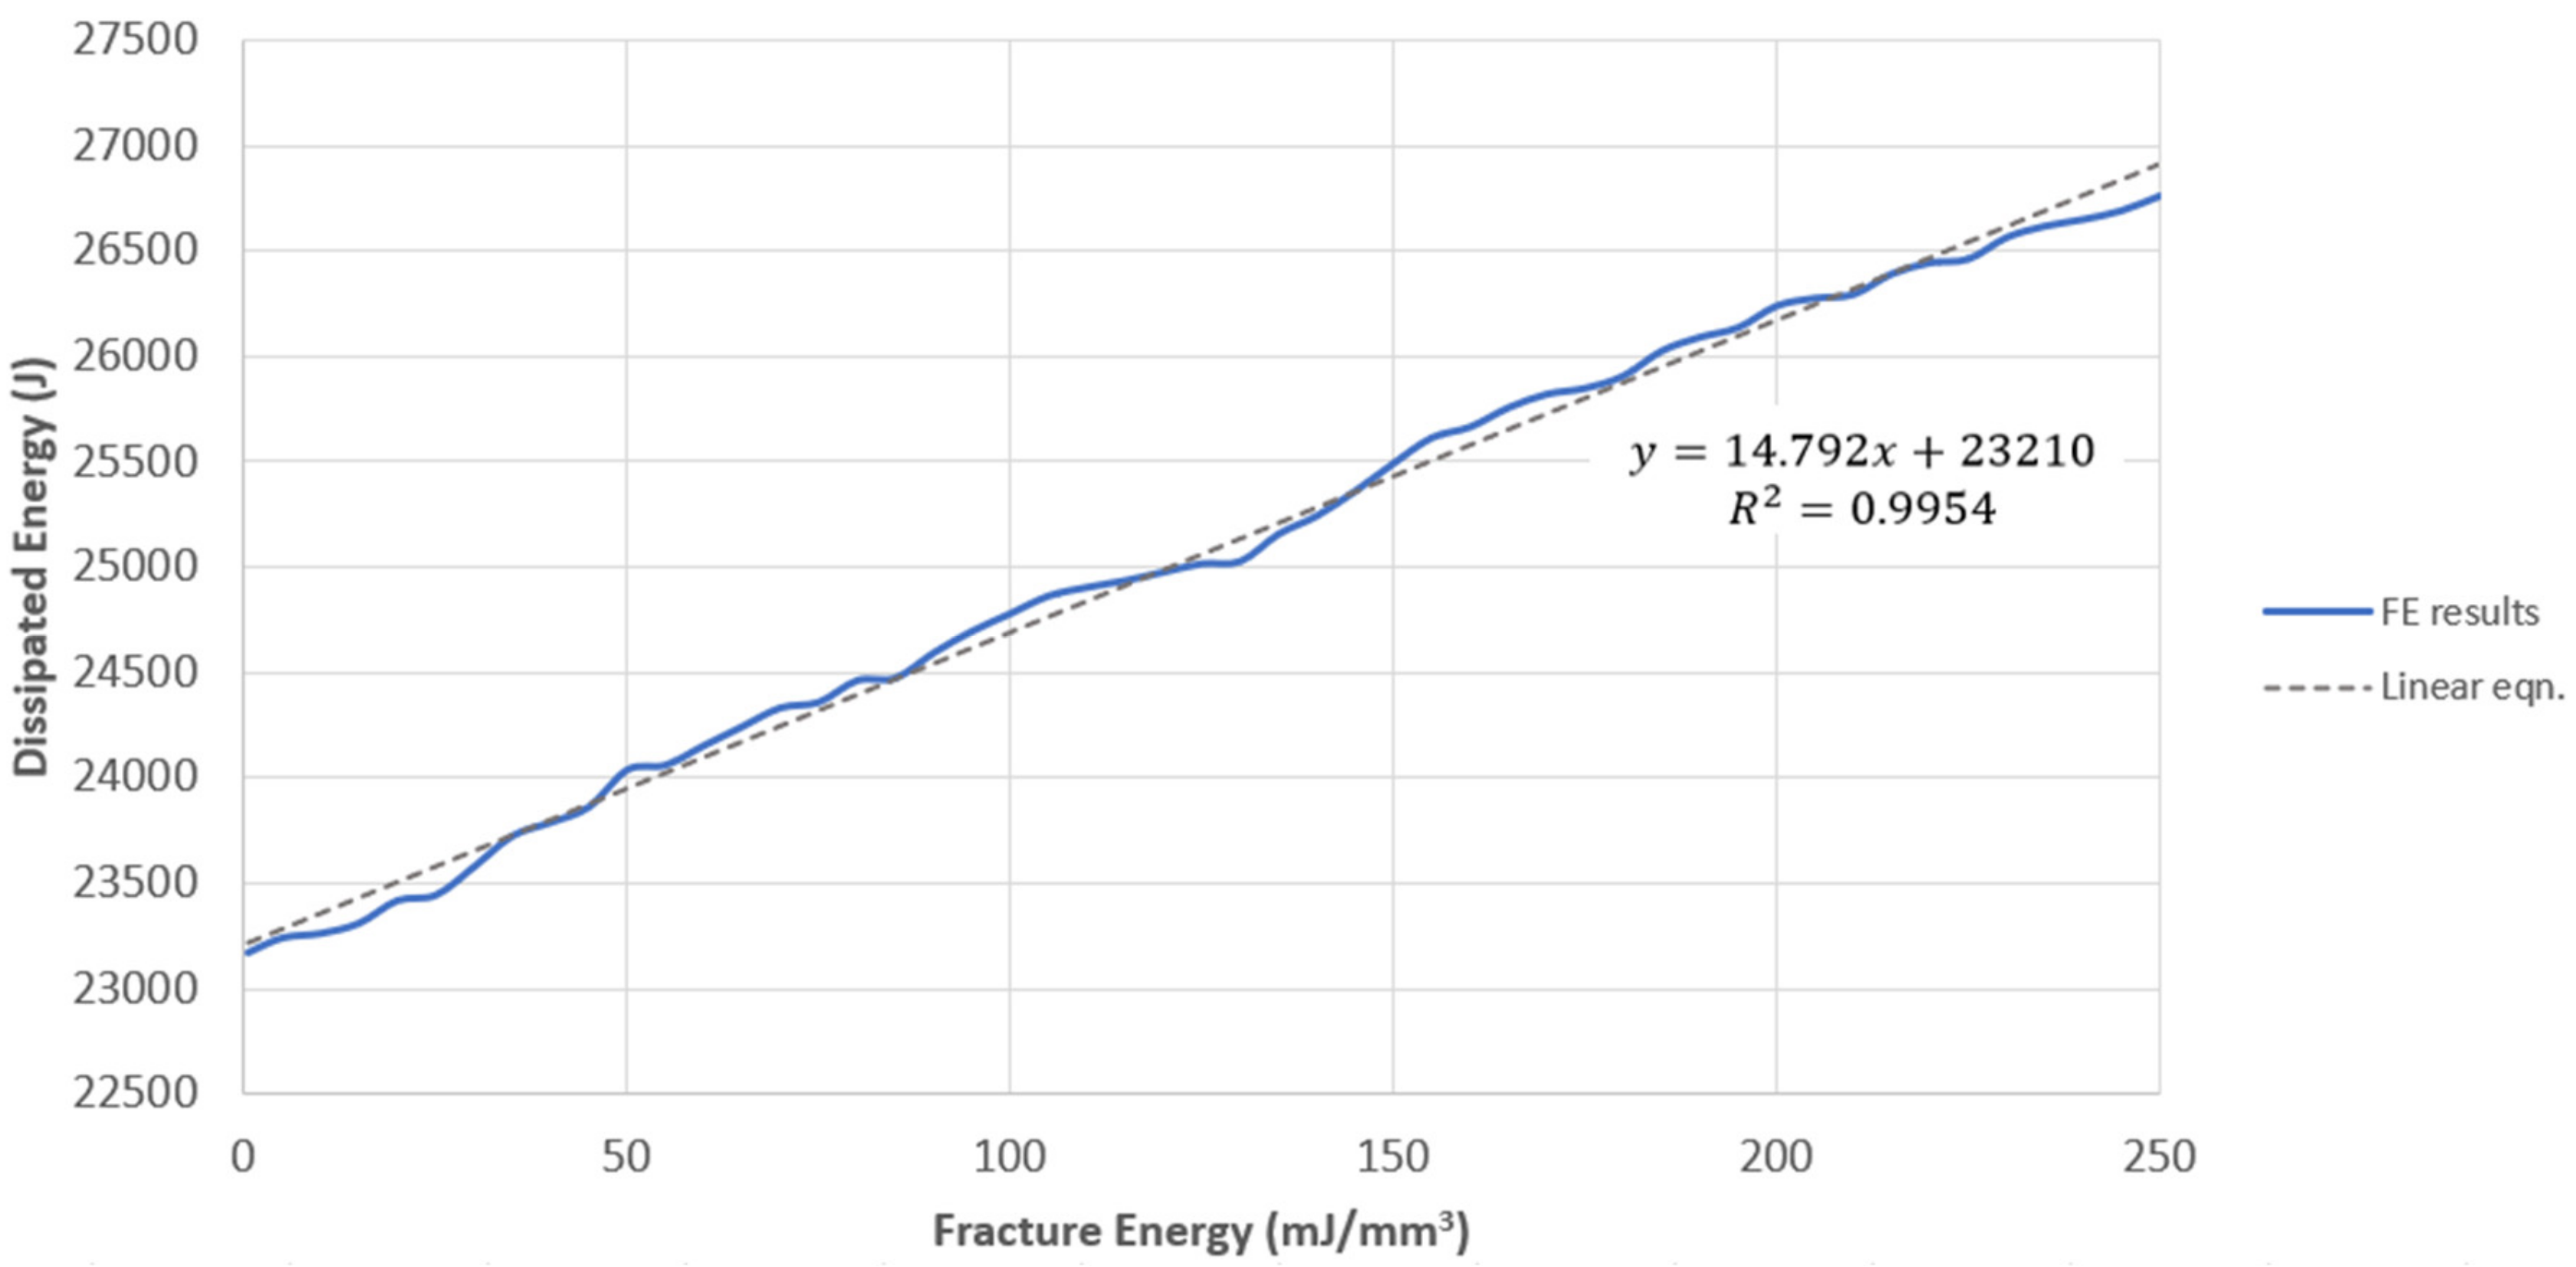
Figure 11.
Dissipated Energy vs. Fracture Energy graph.
Figure 11.
Dissipated Energy vs. Fracture Energy graph.
Figure 12.
SDEG (failure criterion) for different FRP fracture energy.
Figure 12.
SDEG (failure criterion) for different FRP fracture energy.
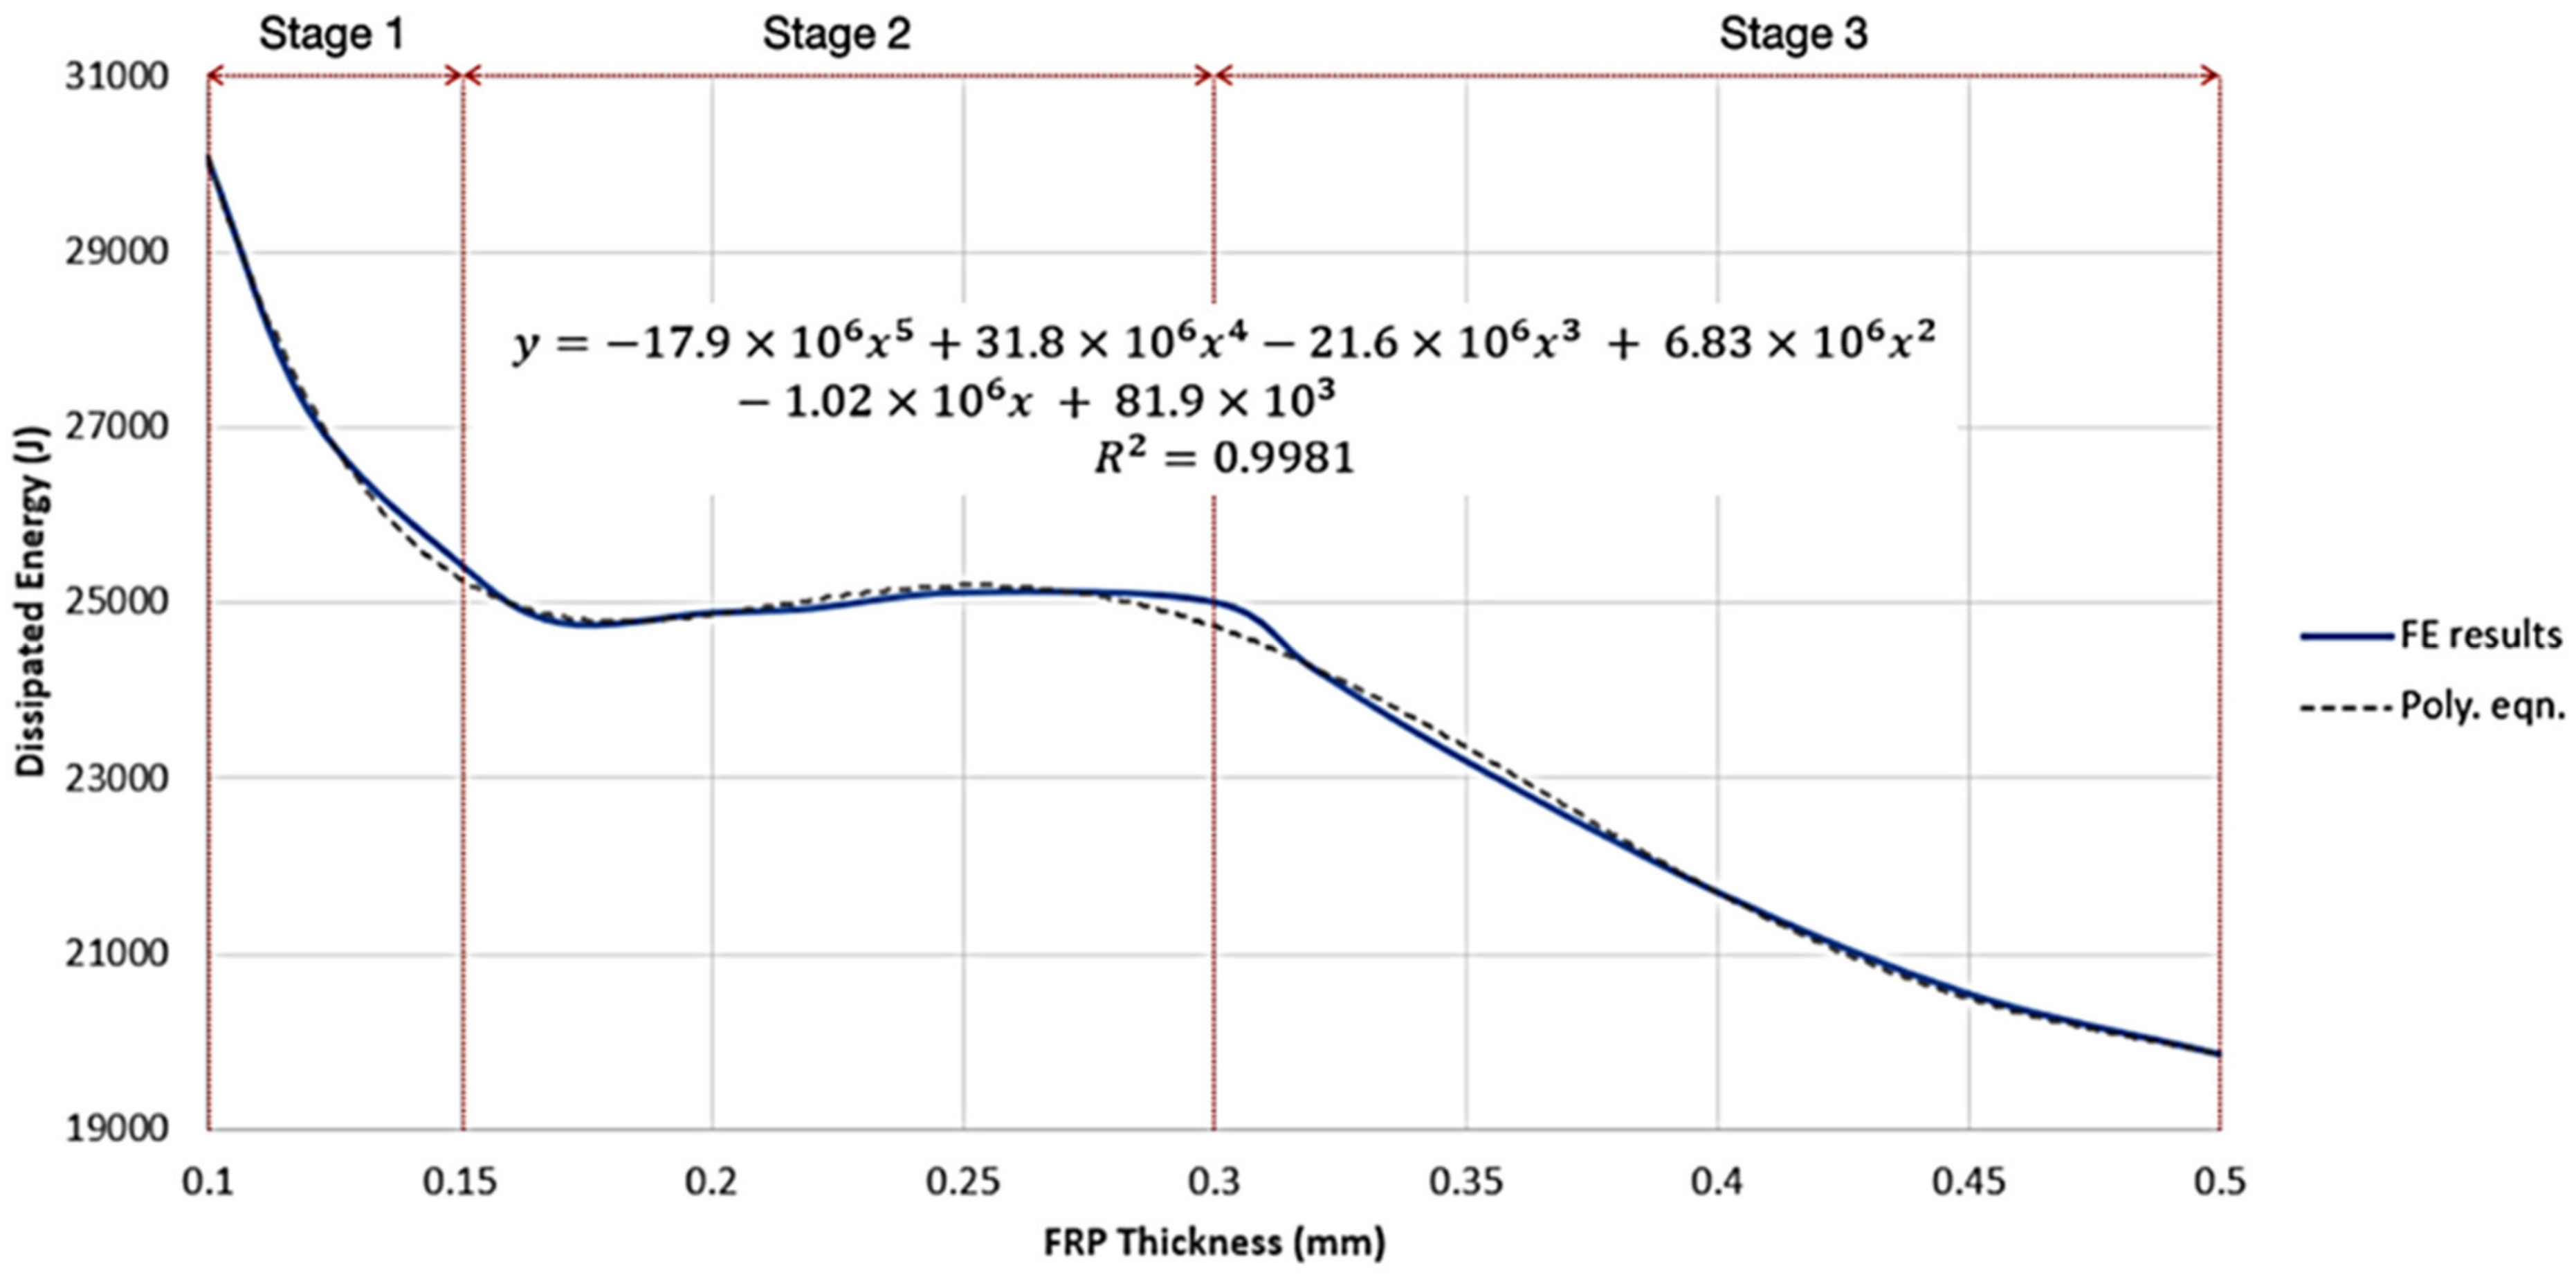
Figure 13.
Dissipated Energy vs. FRP Thickness graph.
Figure 13.
Dissipated Energy vs. FRP Thickness graph.
Figure 14.
Force–displacement graph showing general behaviour of increasing FRP thickness.
Figure 14.
Force–displacement graph showing general behaviour of increasing FRP thickness.
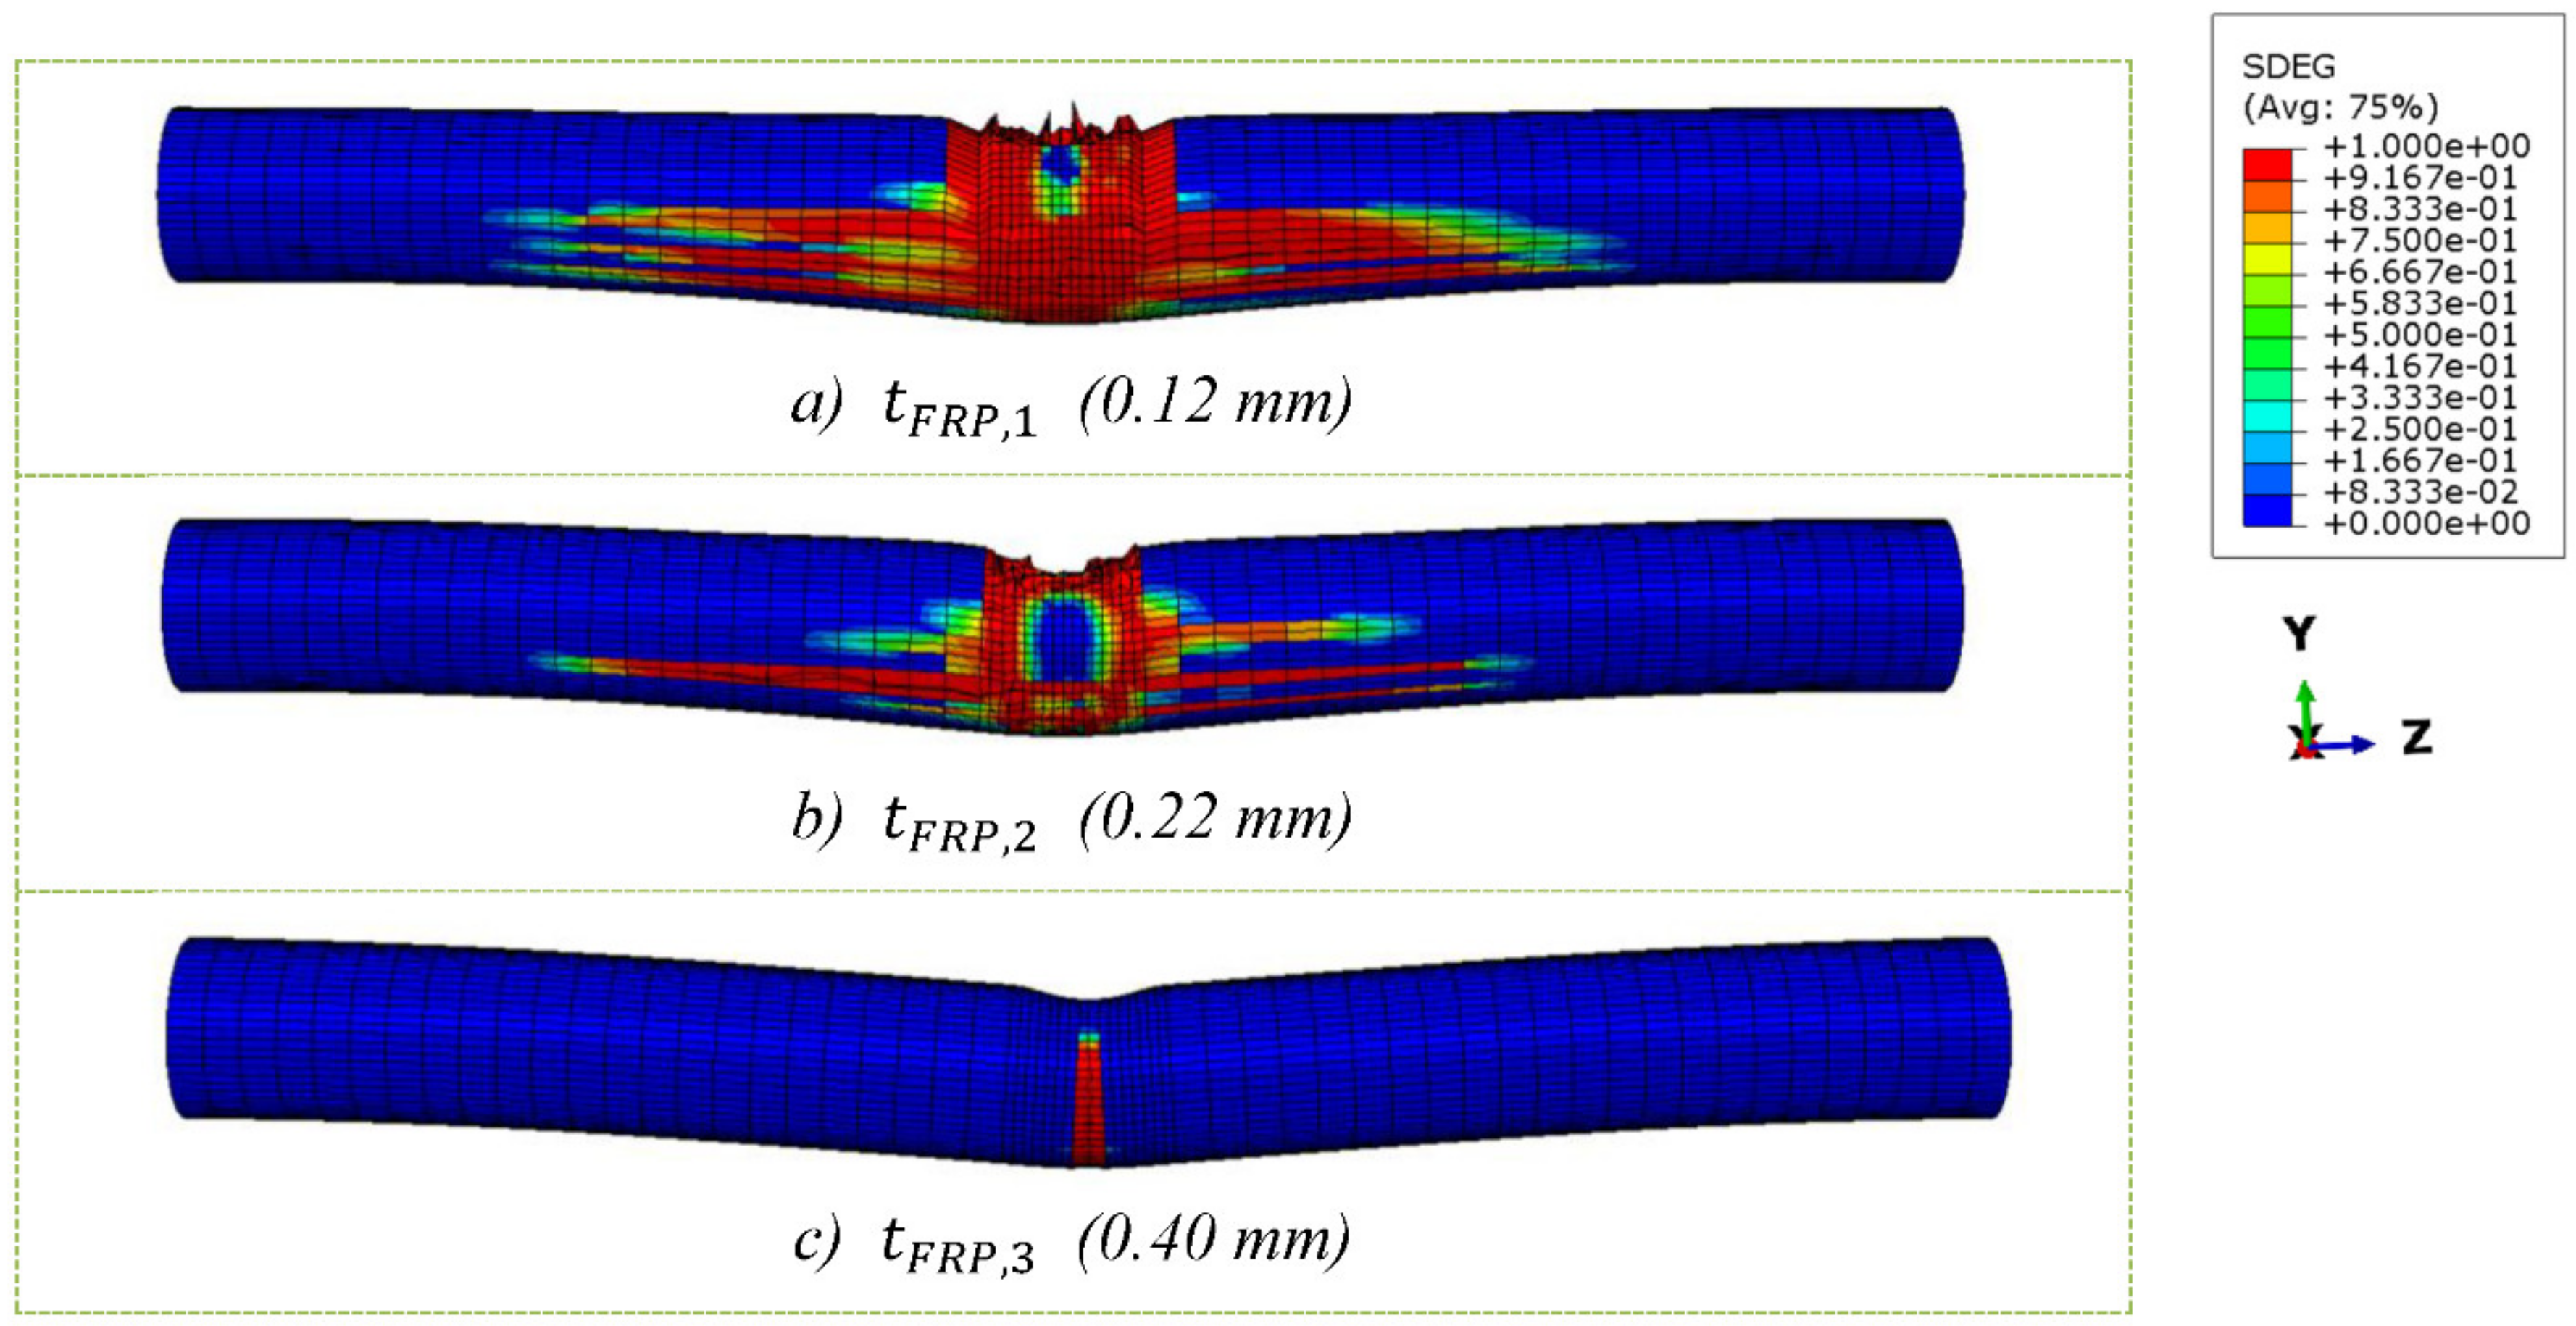
Figure 15.
Failure behaviour with increasing different FRP thickness.
Figure 15.
Failure behaviour with increasing different FRP thickness.
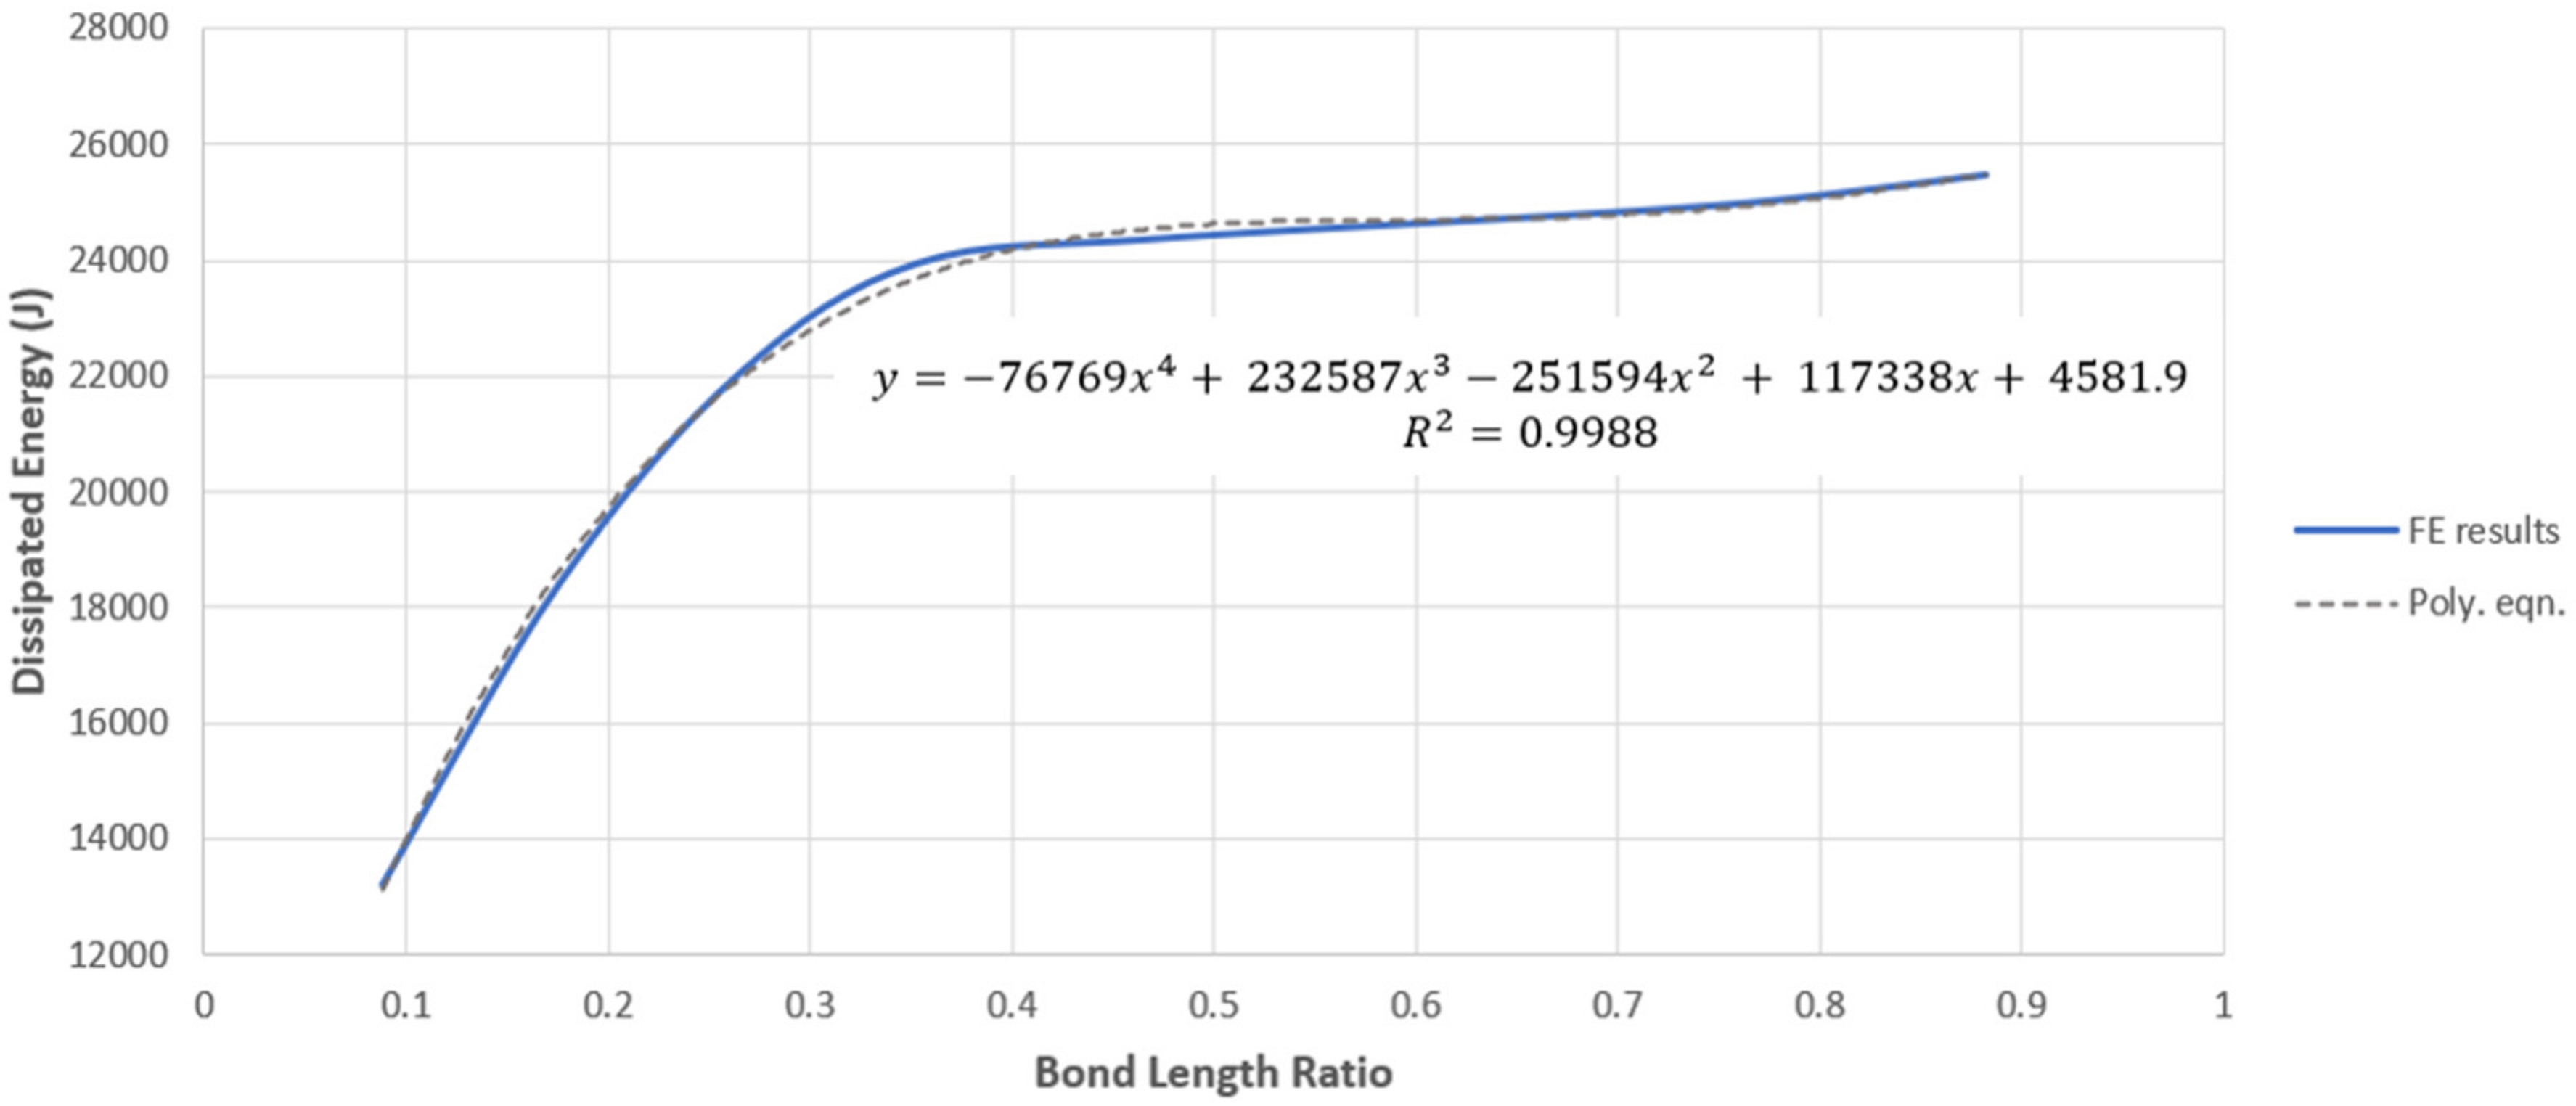
Figure 16.
Dissipated Energy vs. Bond Length Ratio graph.
Figure 16.
Dissipated Energy vs. Bond Length Ratio graph.
Figure 17.
FRP damage for different bond length ratios.
Figure 17.
FRP damage for different bond length ratios.
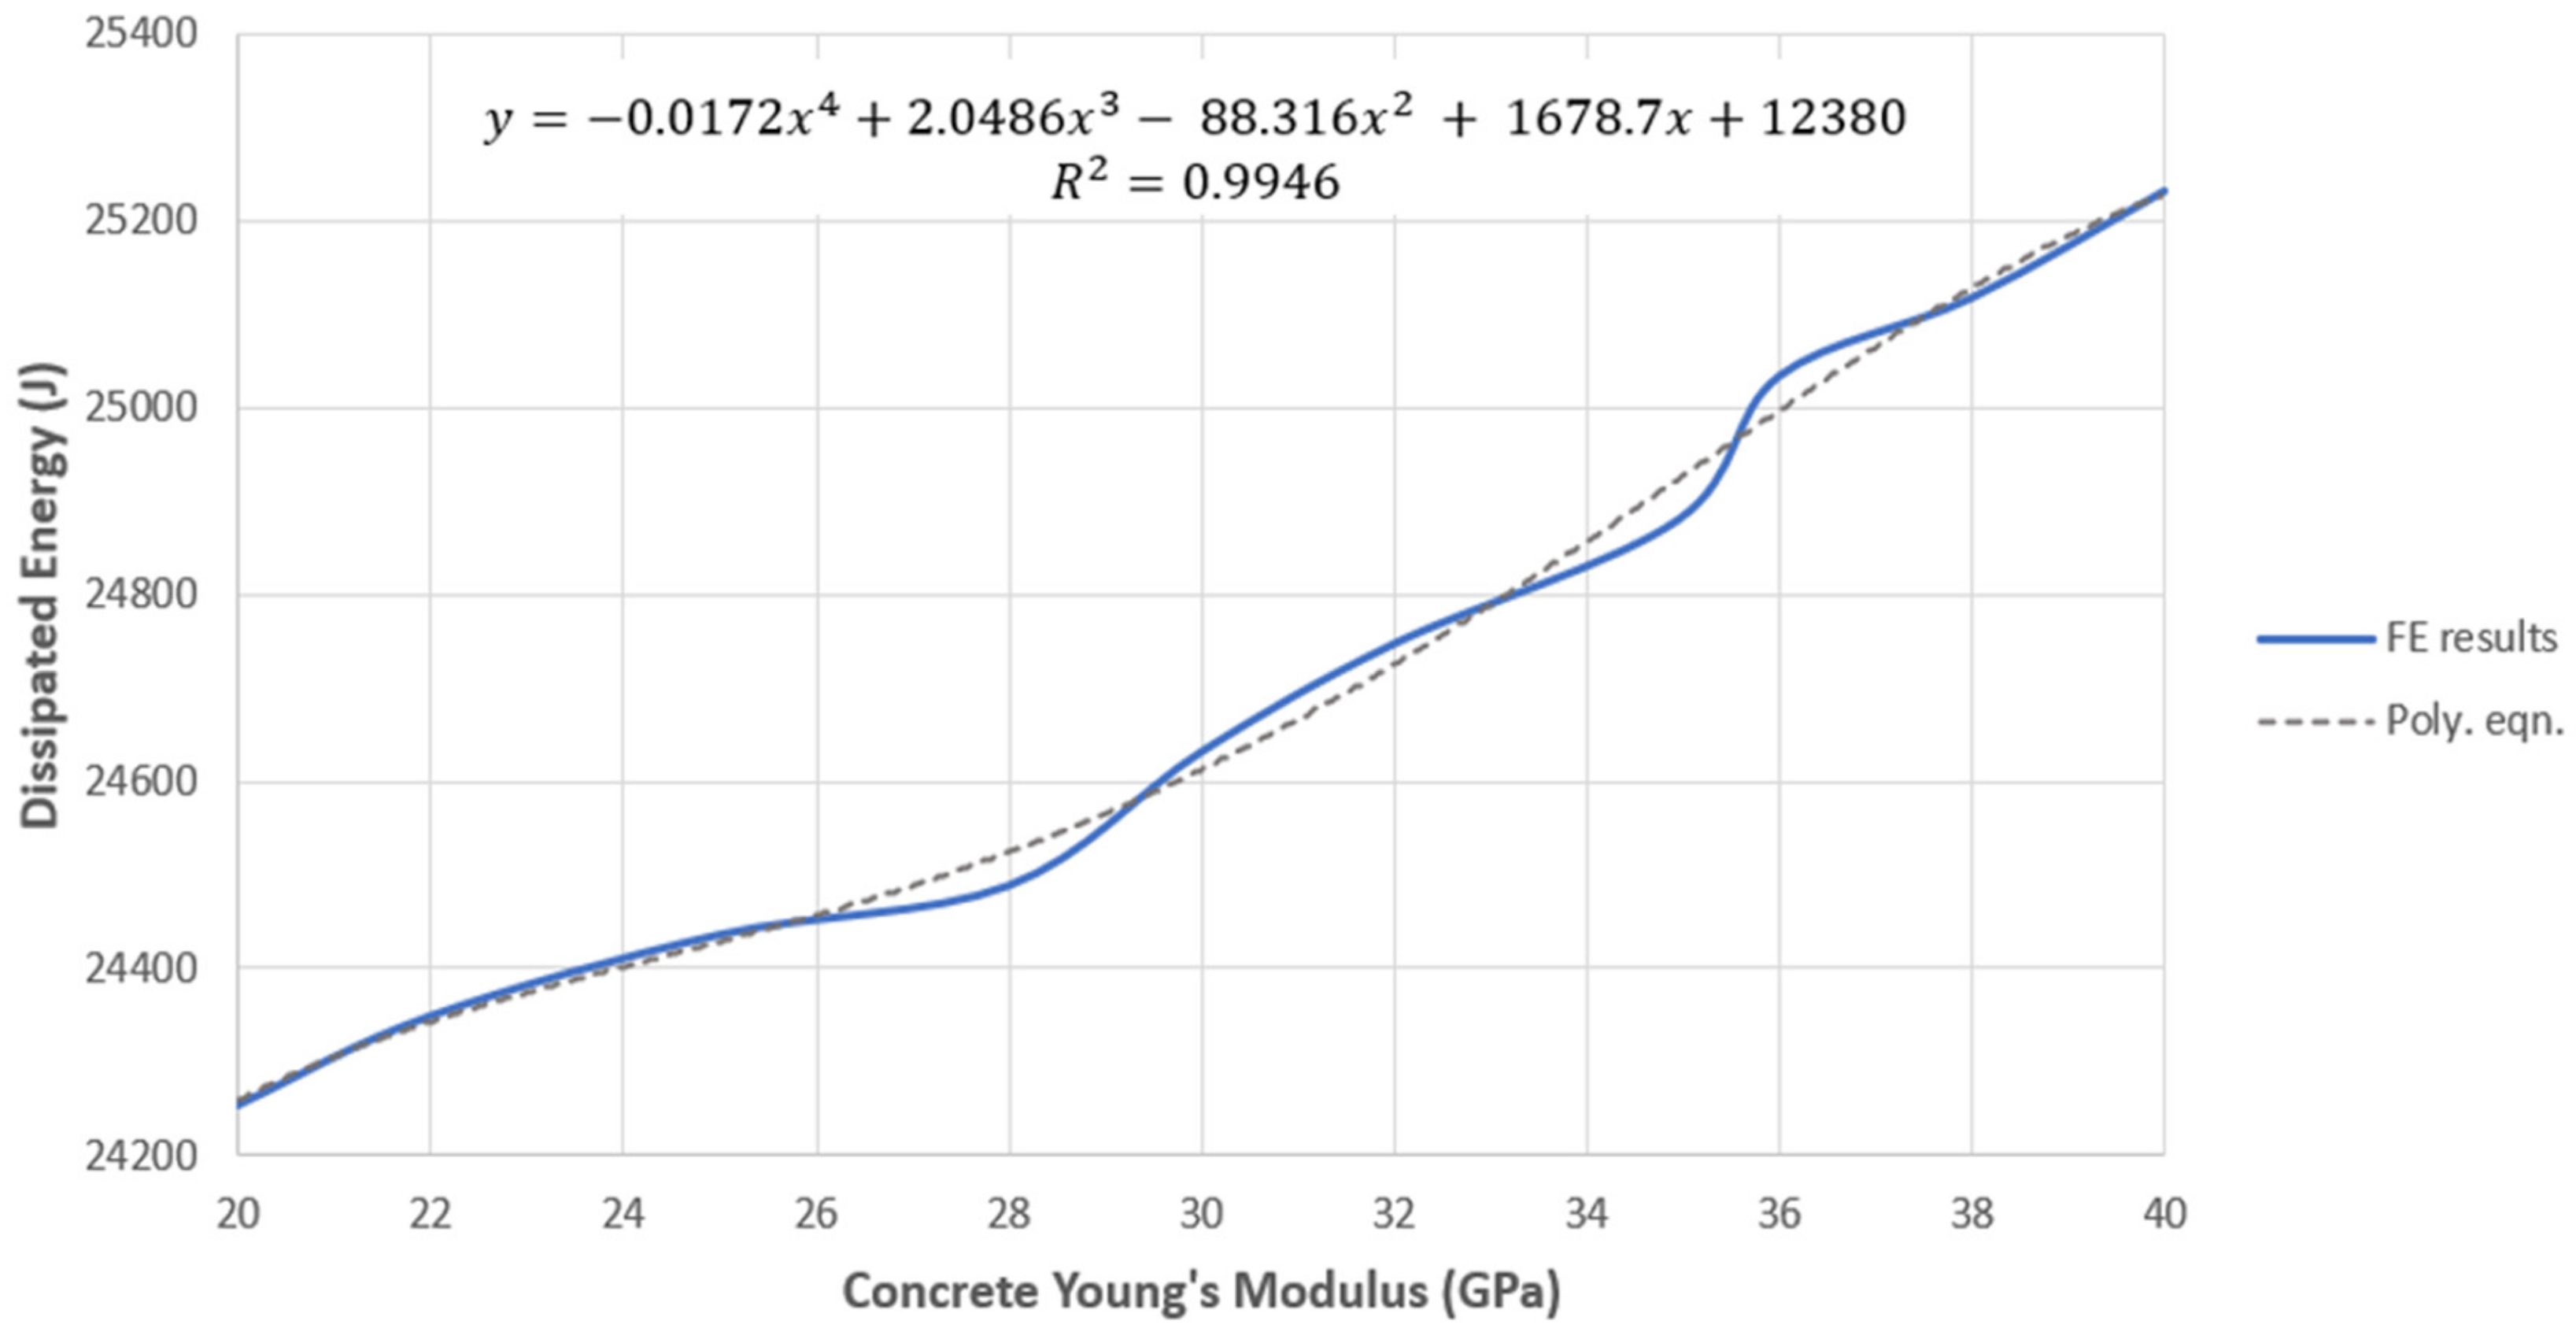
Figure 18.
Dissipated Energy vs. Young’s Modulus of Concrete graph.
Figure 18.
Dissipated Energy vs. Young’s Modulus of Concrete graph.
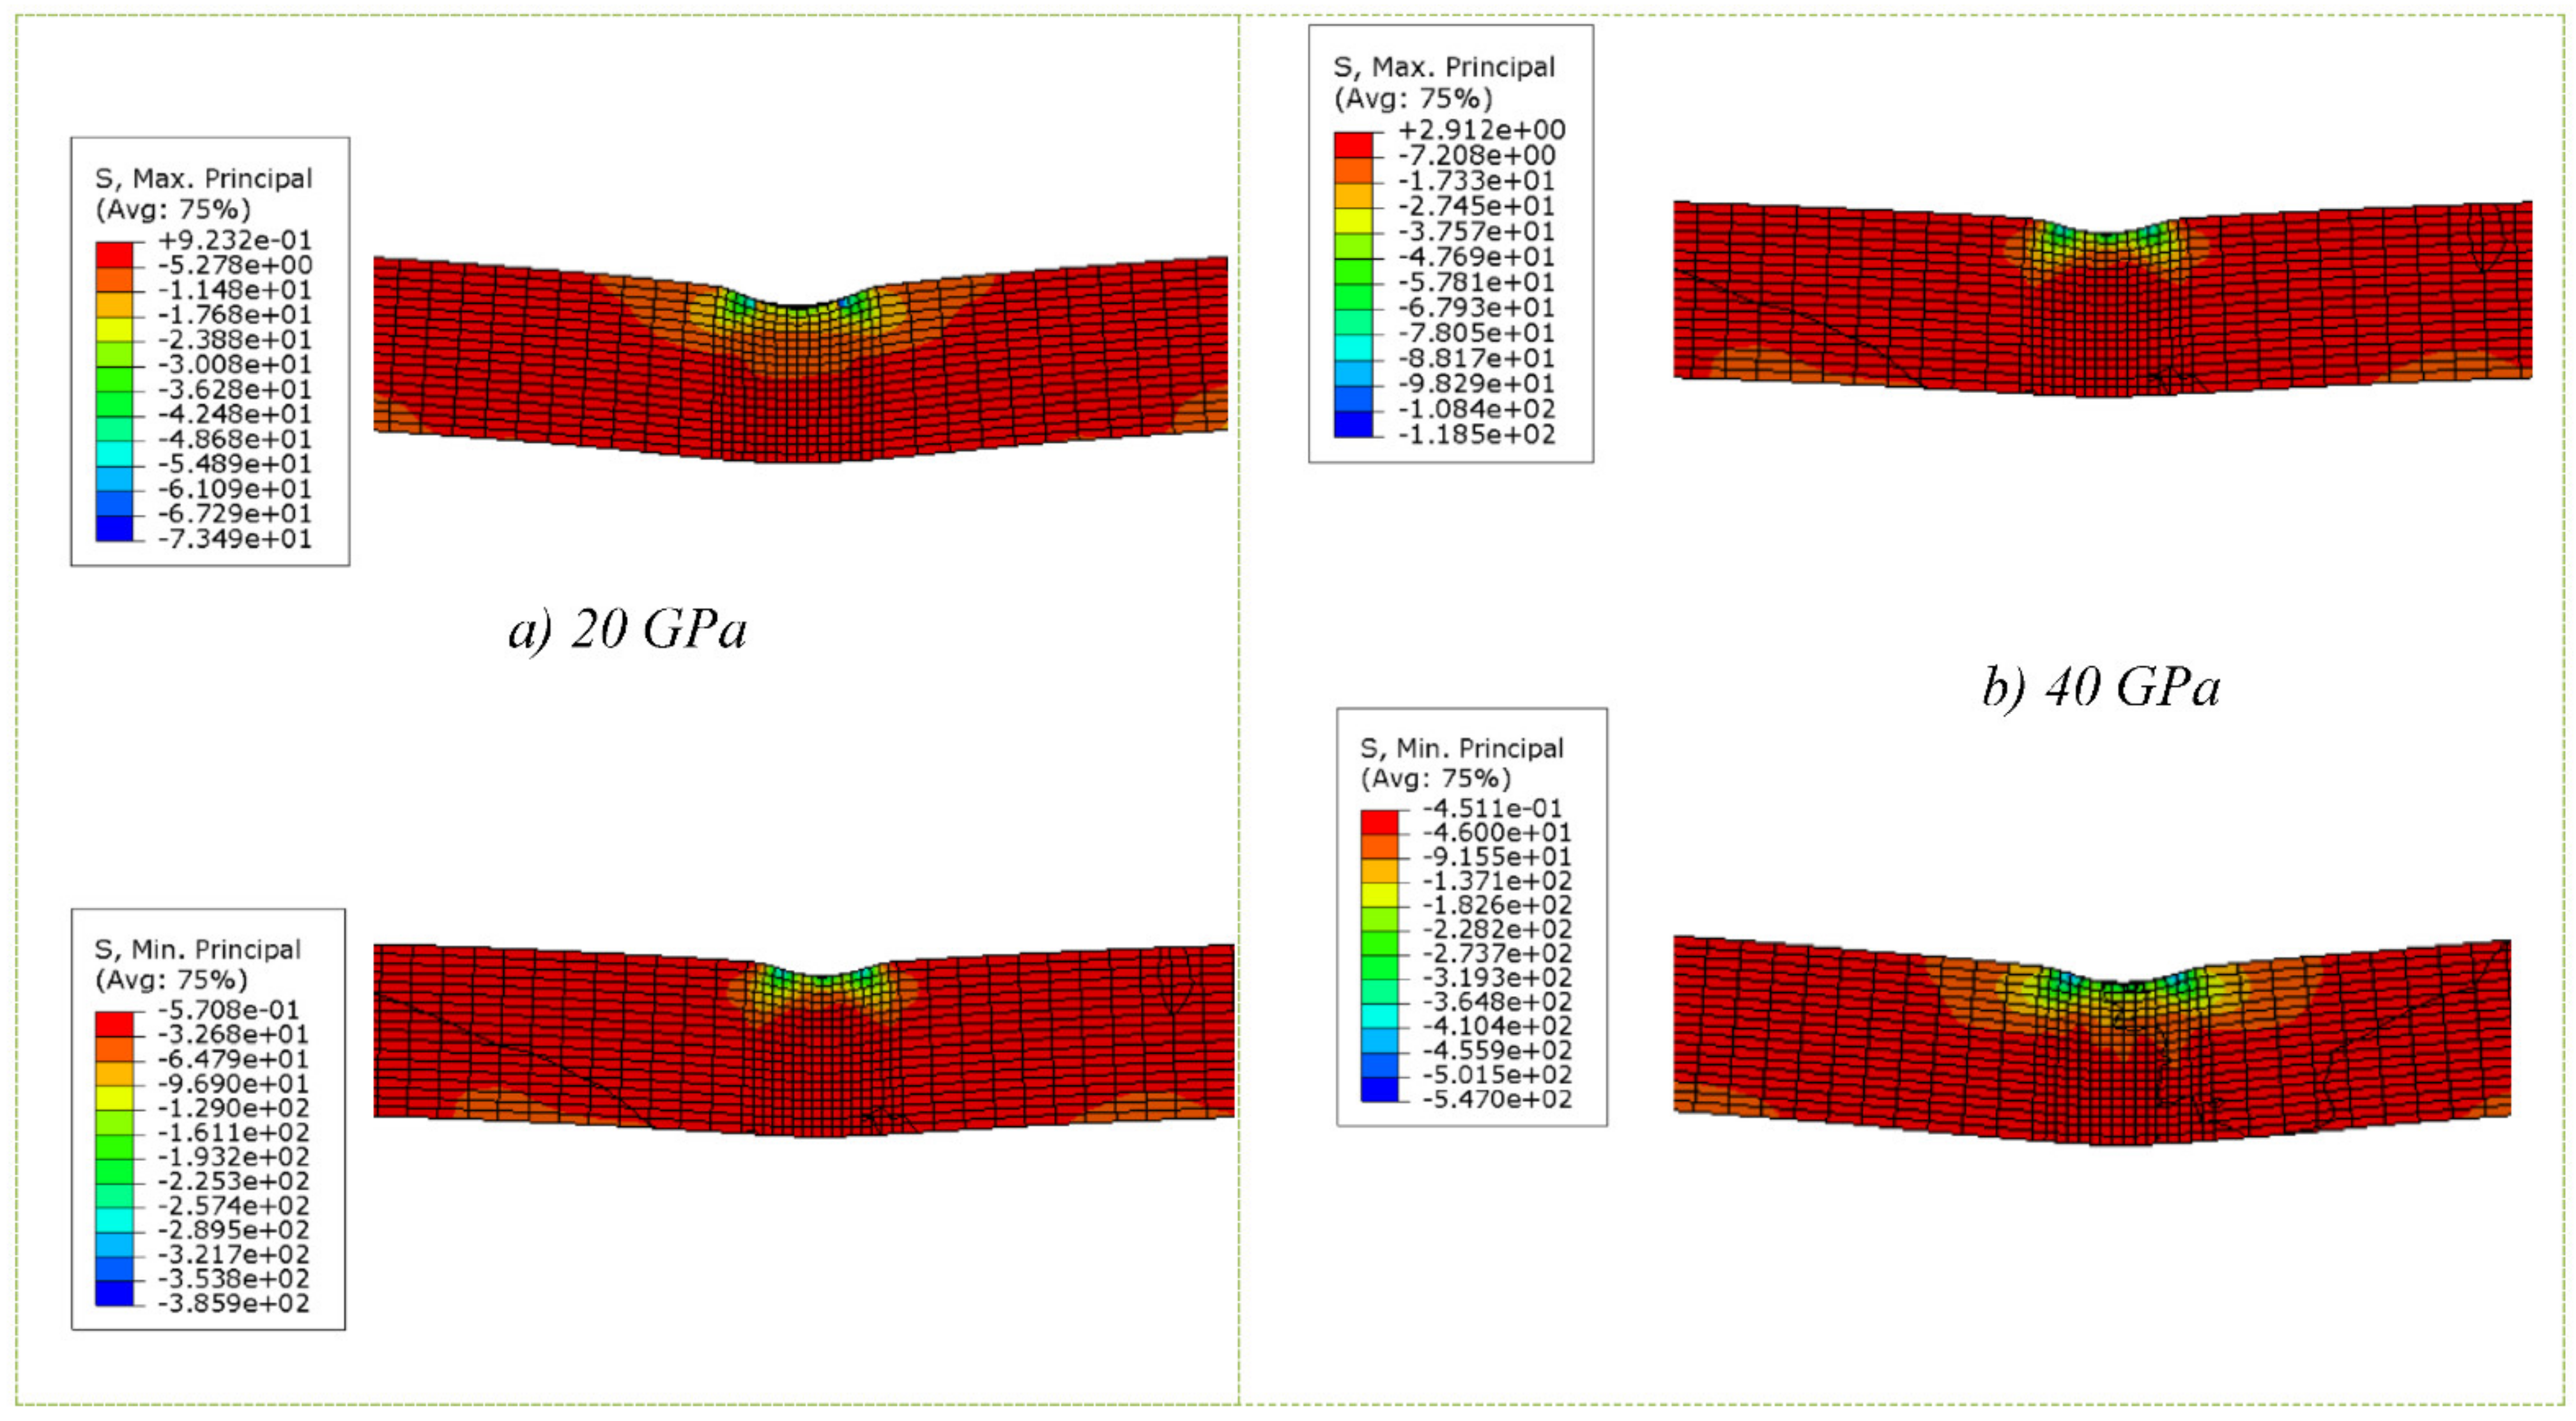
Figure 19.
Maximum and minimum principal stress in concrete for different Young’s Moduli (MPa).
Figure 19.
Maximum and minimum principal stress in concrete for different Young’s Moduli (MPa).
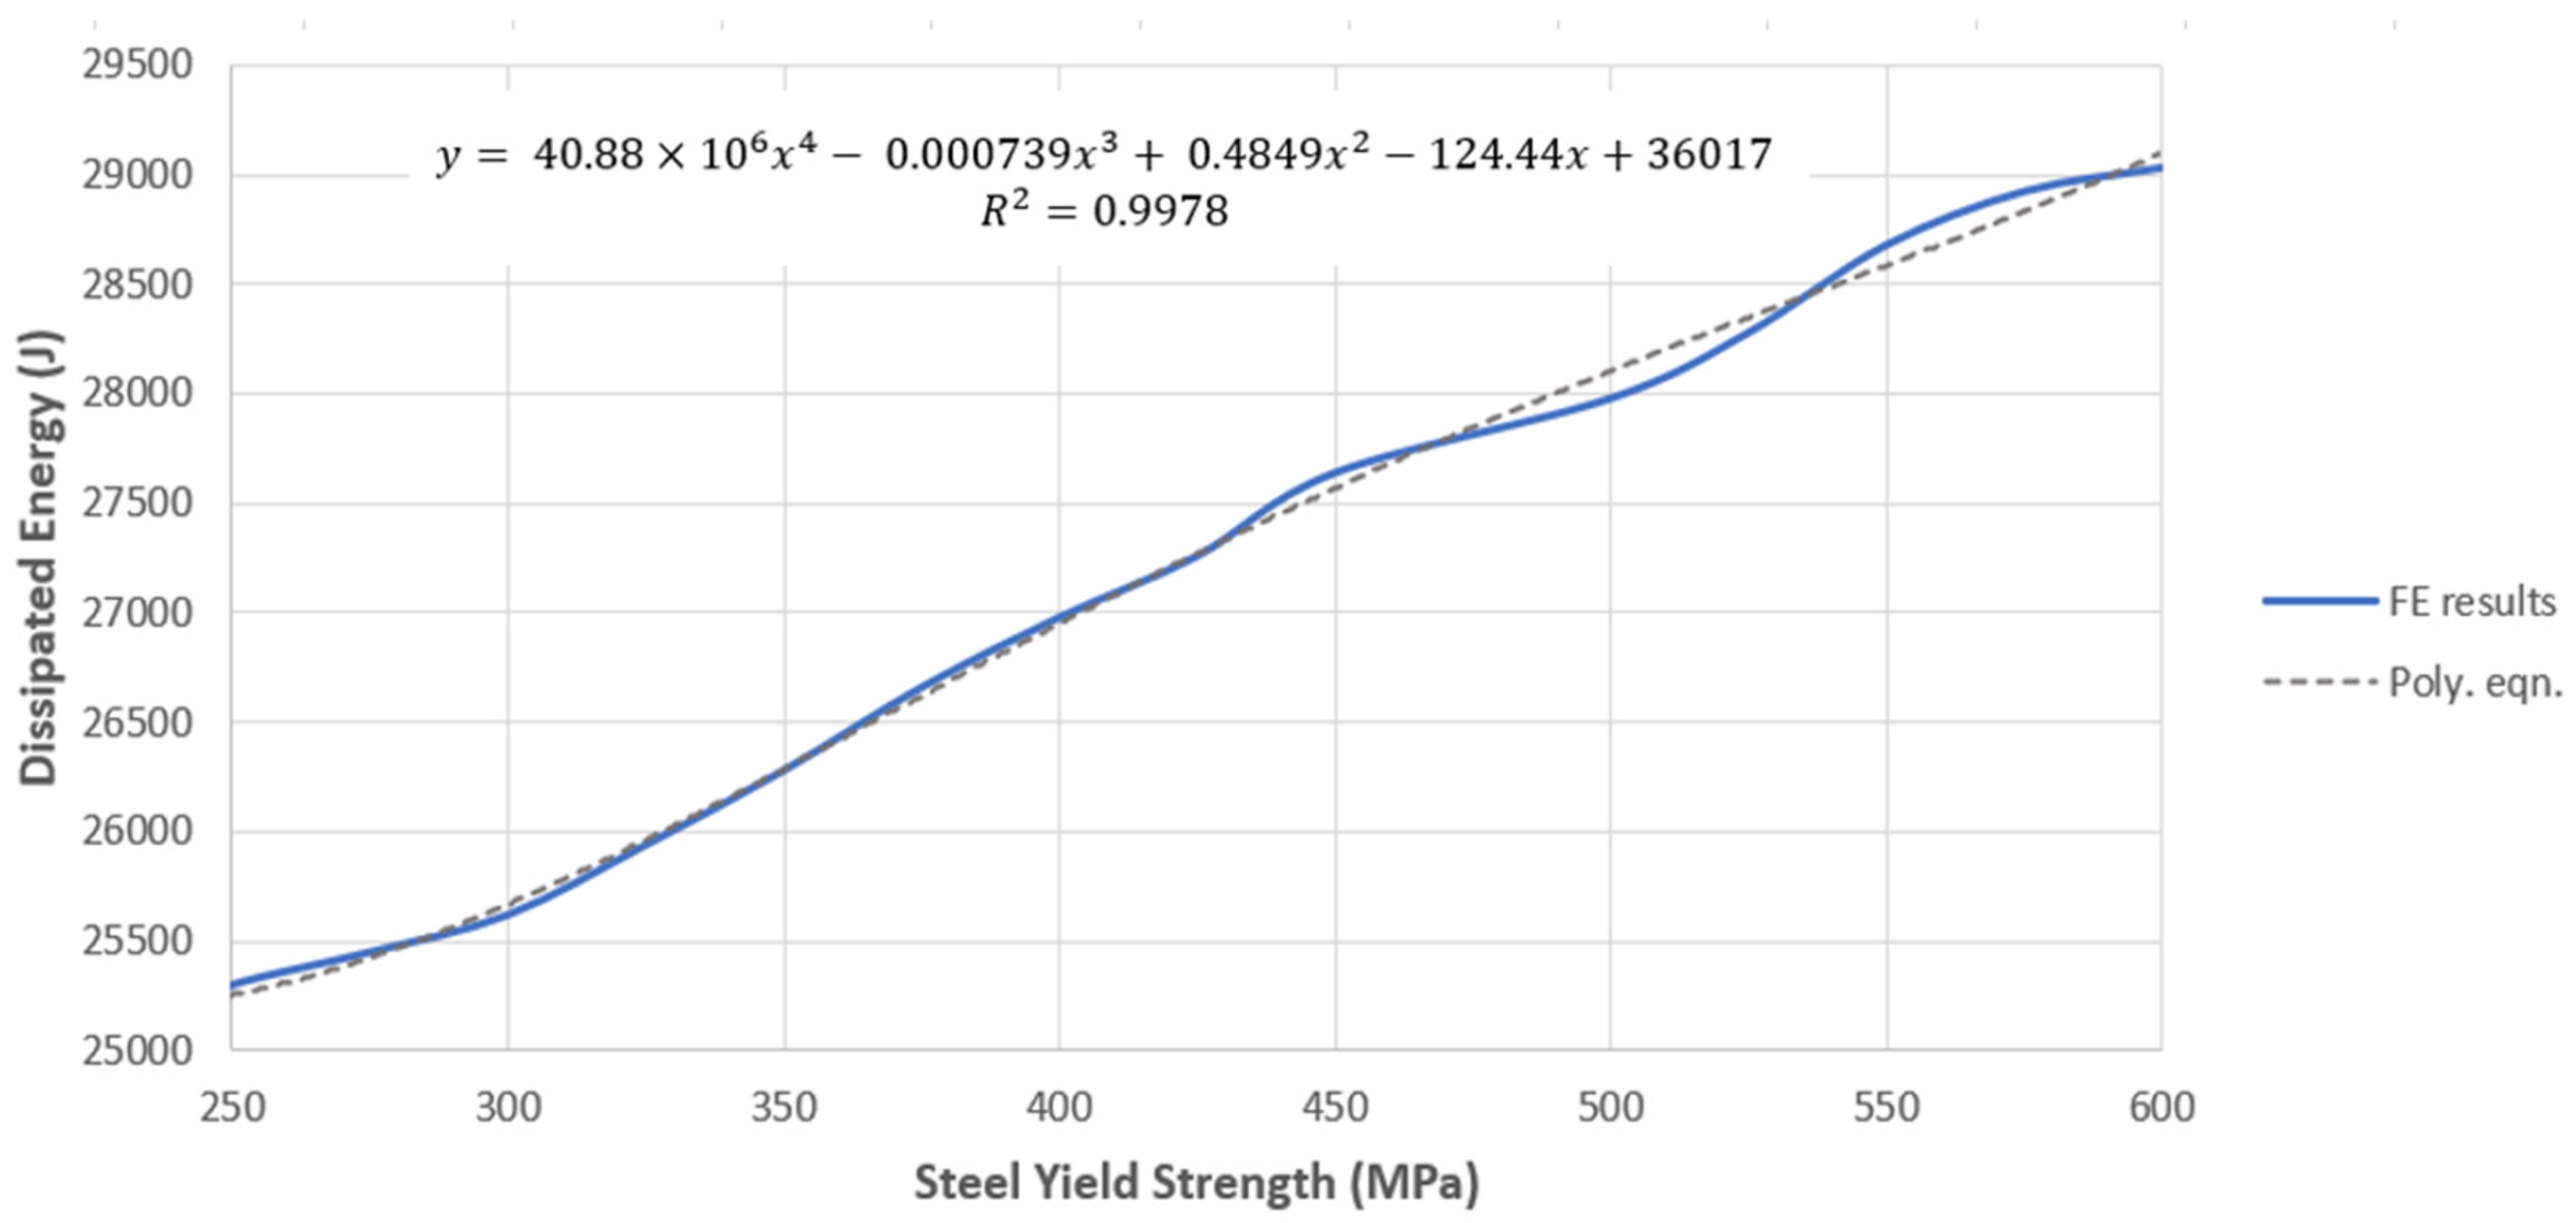
Figure 20.
Dissipated Energy vs. Steel Yield Strength.
Figure 20.
Dissipated Energy vs. Steel Yield Strength.
Figure 21.
Plastic deformation in steel tube for different steel yield strengths.
Figure 21.
Plastic deformation in steel tube for different steel yield strengths.
Figure 22.
Force–displacement graphs—Fracture energy.
Figure 22.
Force–displacement graphs—Fracture energy.
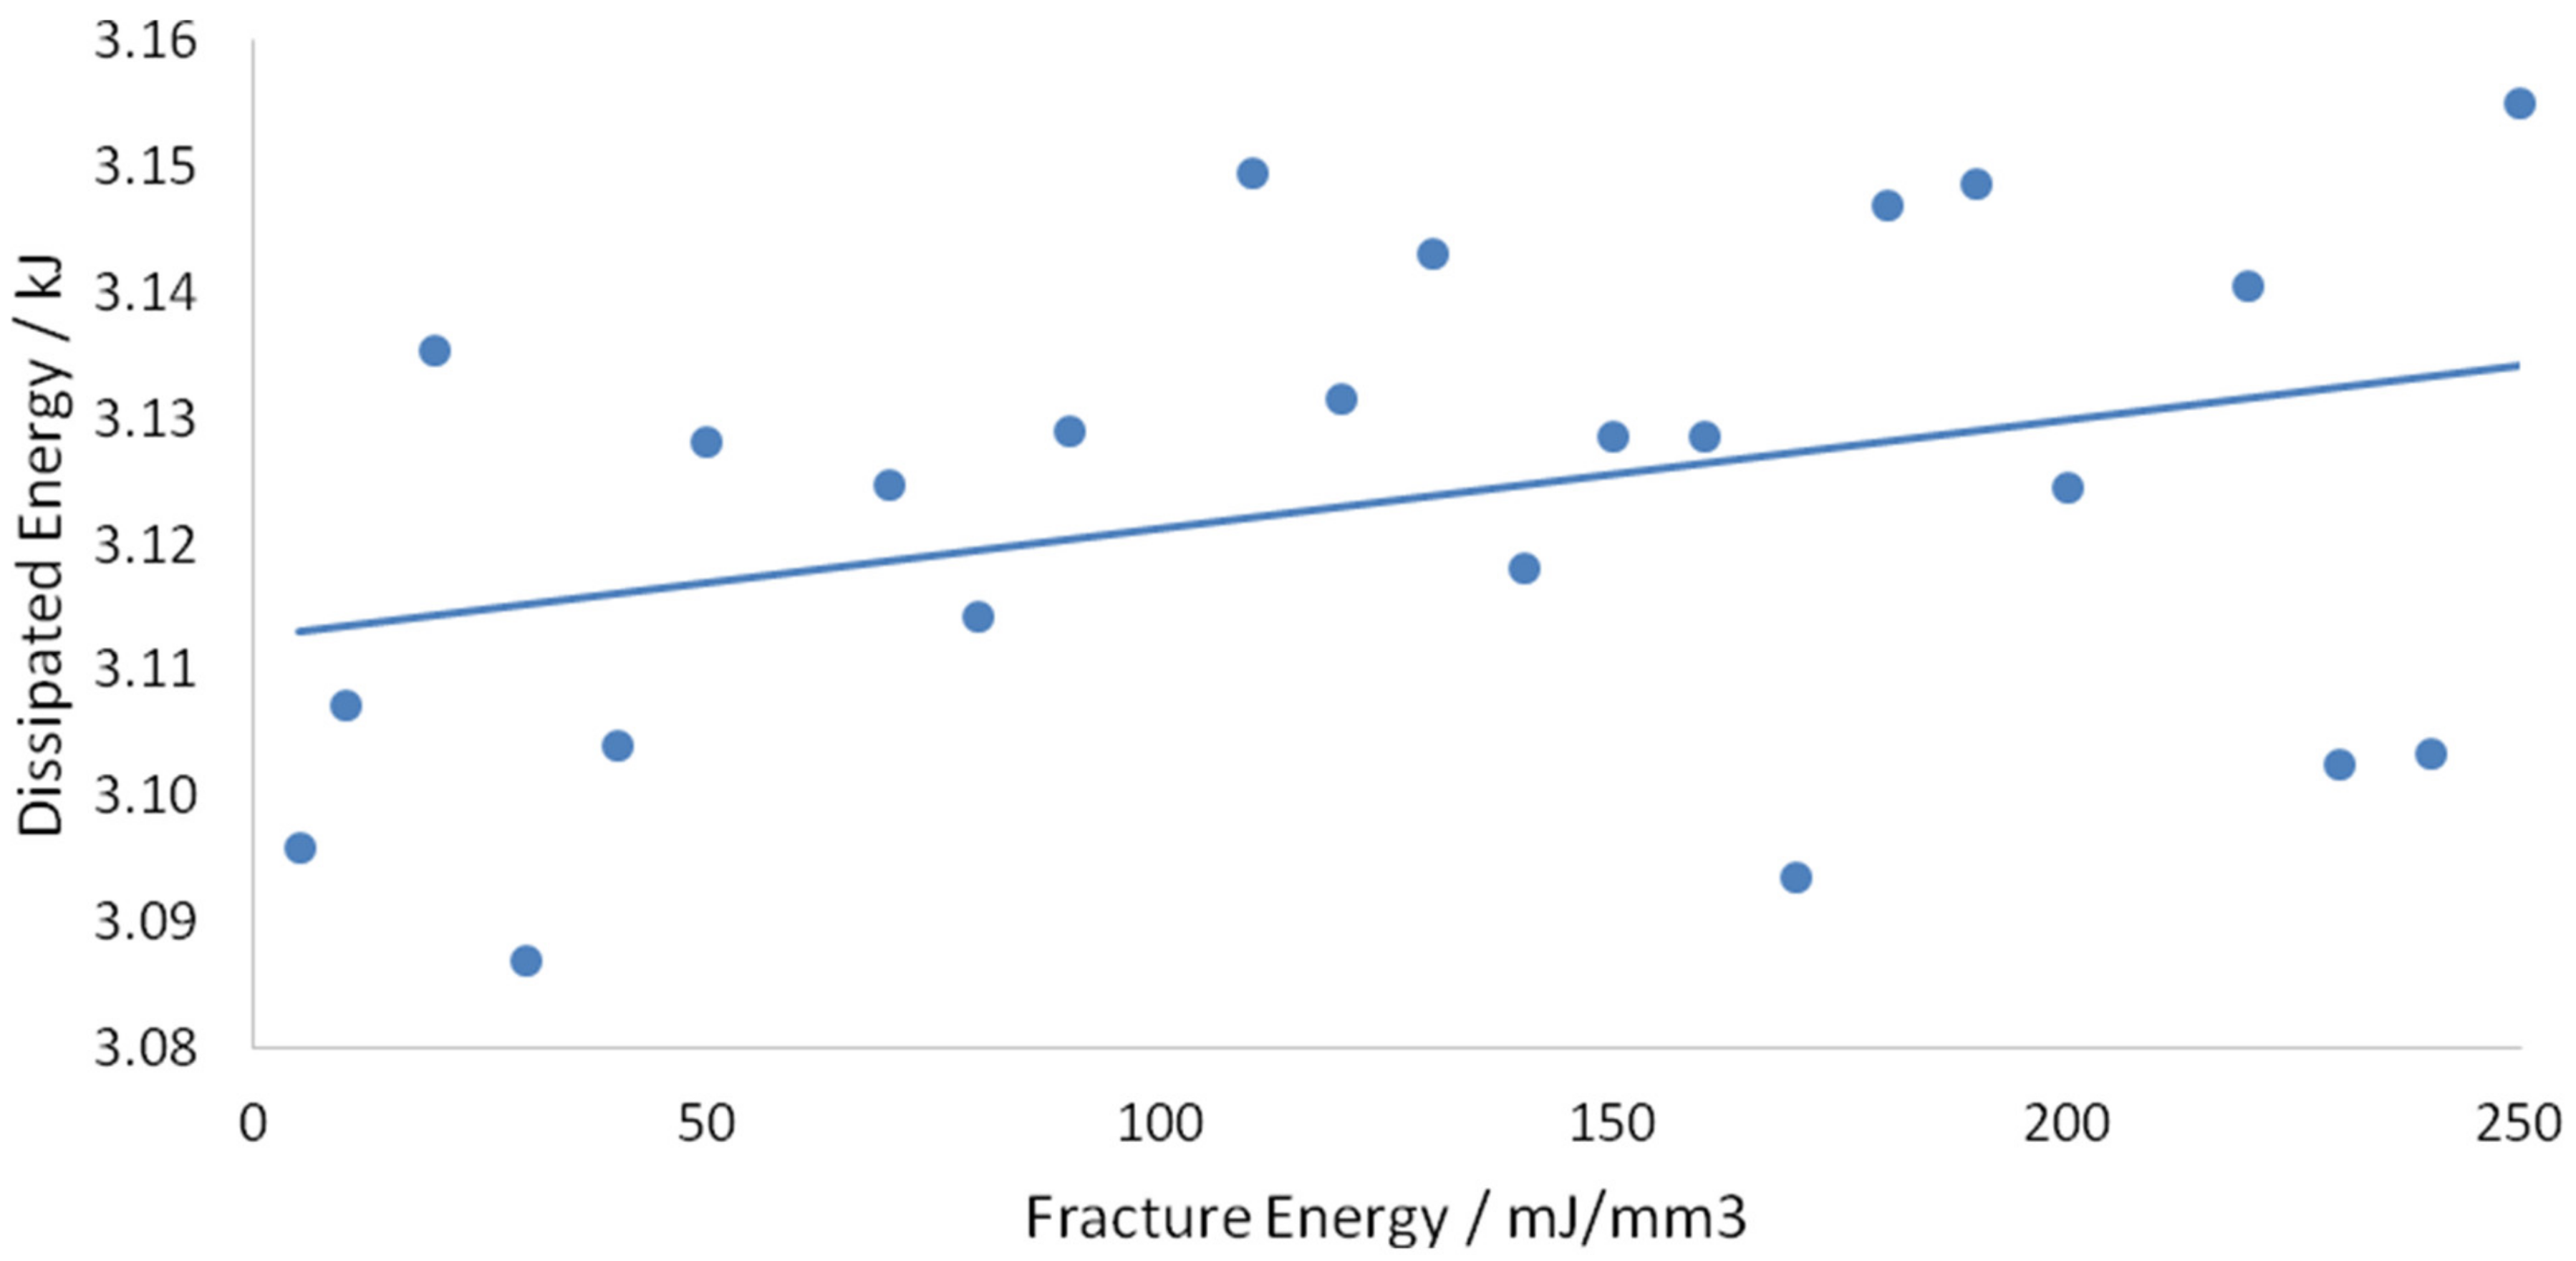
Figure 23.
Graph of dissipated energy vs. fracture energy.
Figure 23.
Graph of dissipated energy vs. fracture energy.
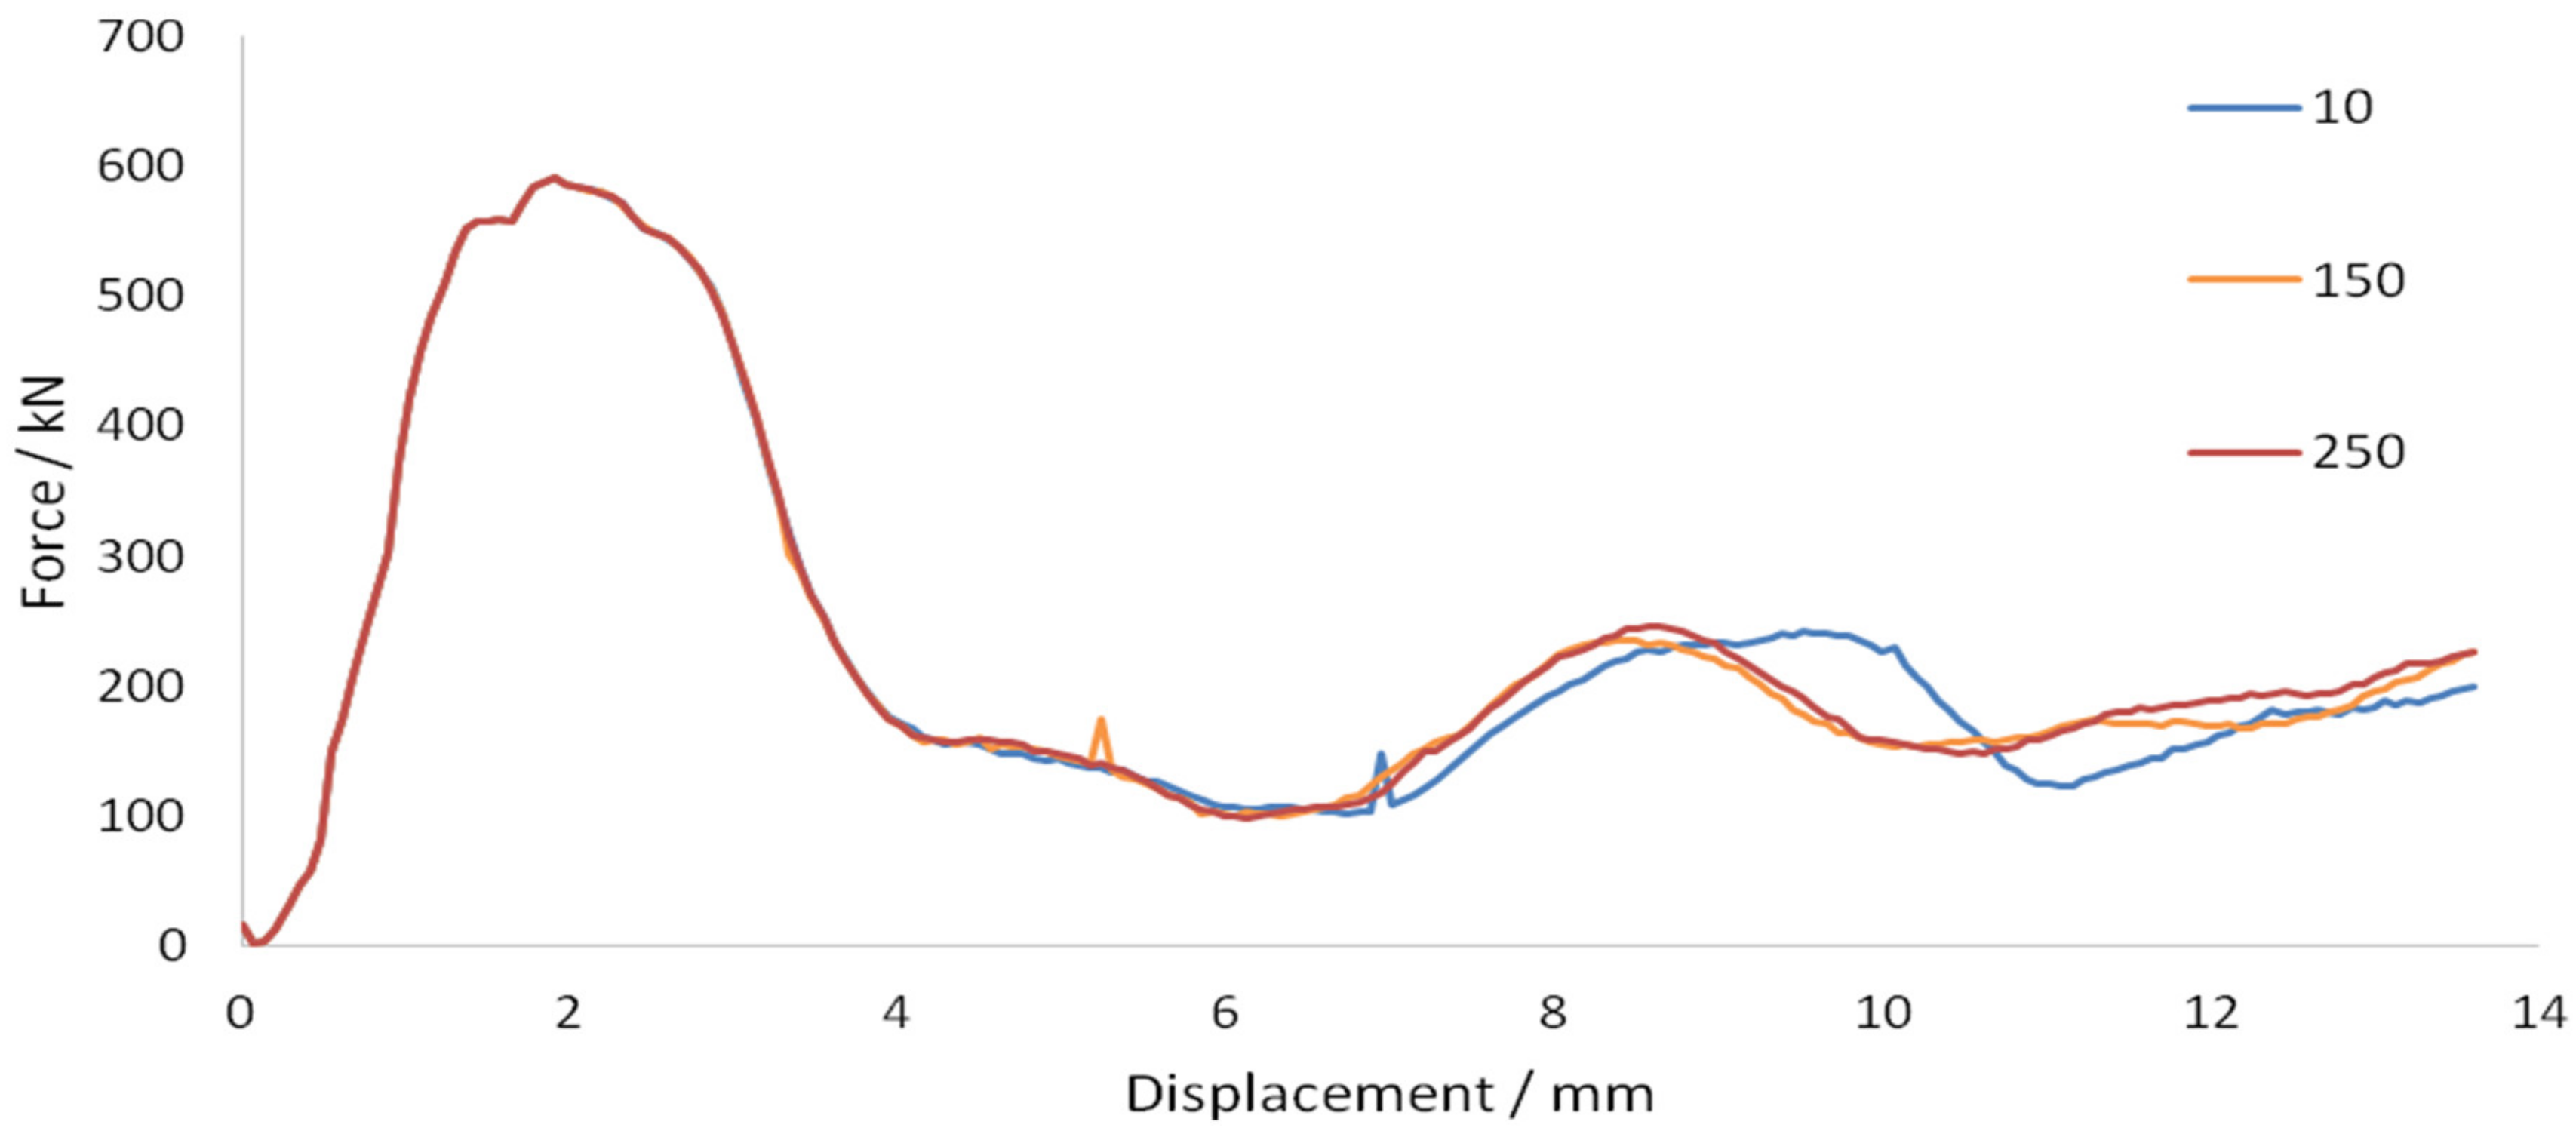
Figure 24.
Crack patterns at (a) 10 and (b) 250 fracture energies.
Figure 24.
Crack patterns at (a) 10 and (b) 250 fracture energies.
Figure 25.
Force–displacement graphs—CFRP strip thickness.
Figure 25.
Force–displacement graphs—CFRP strip thickness.
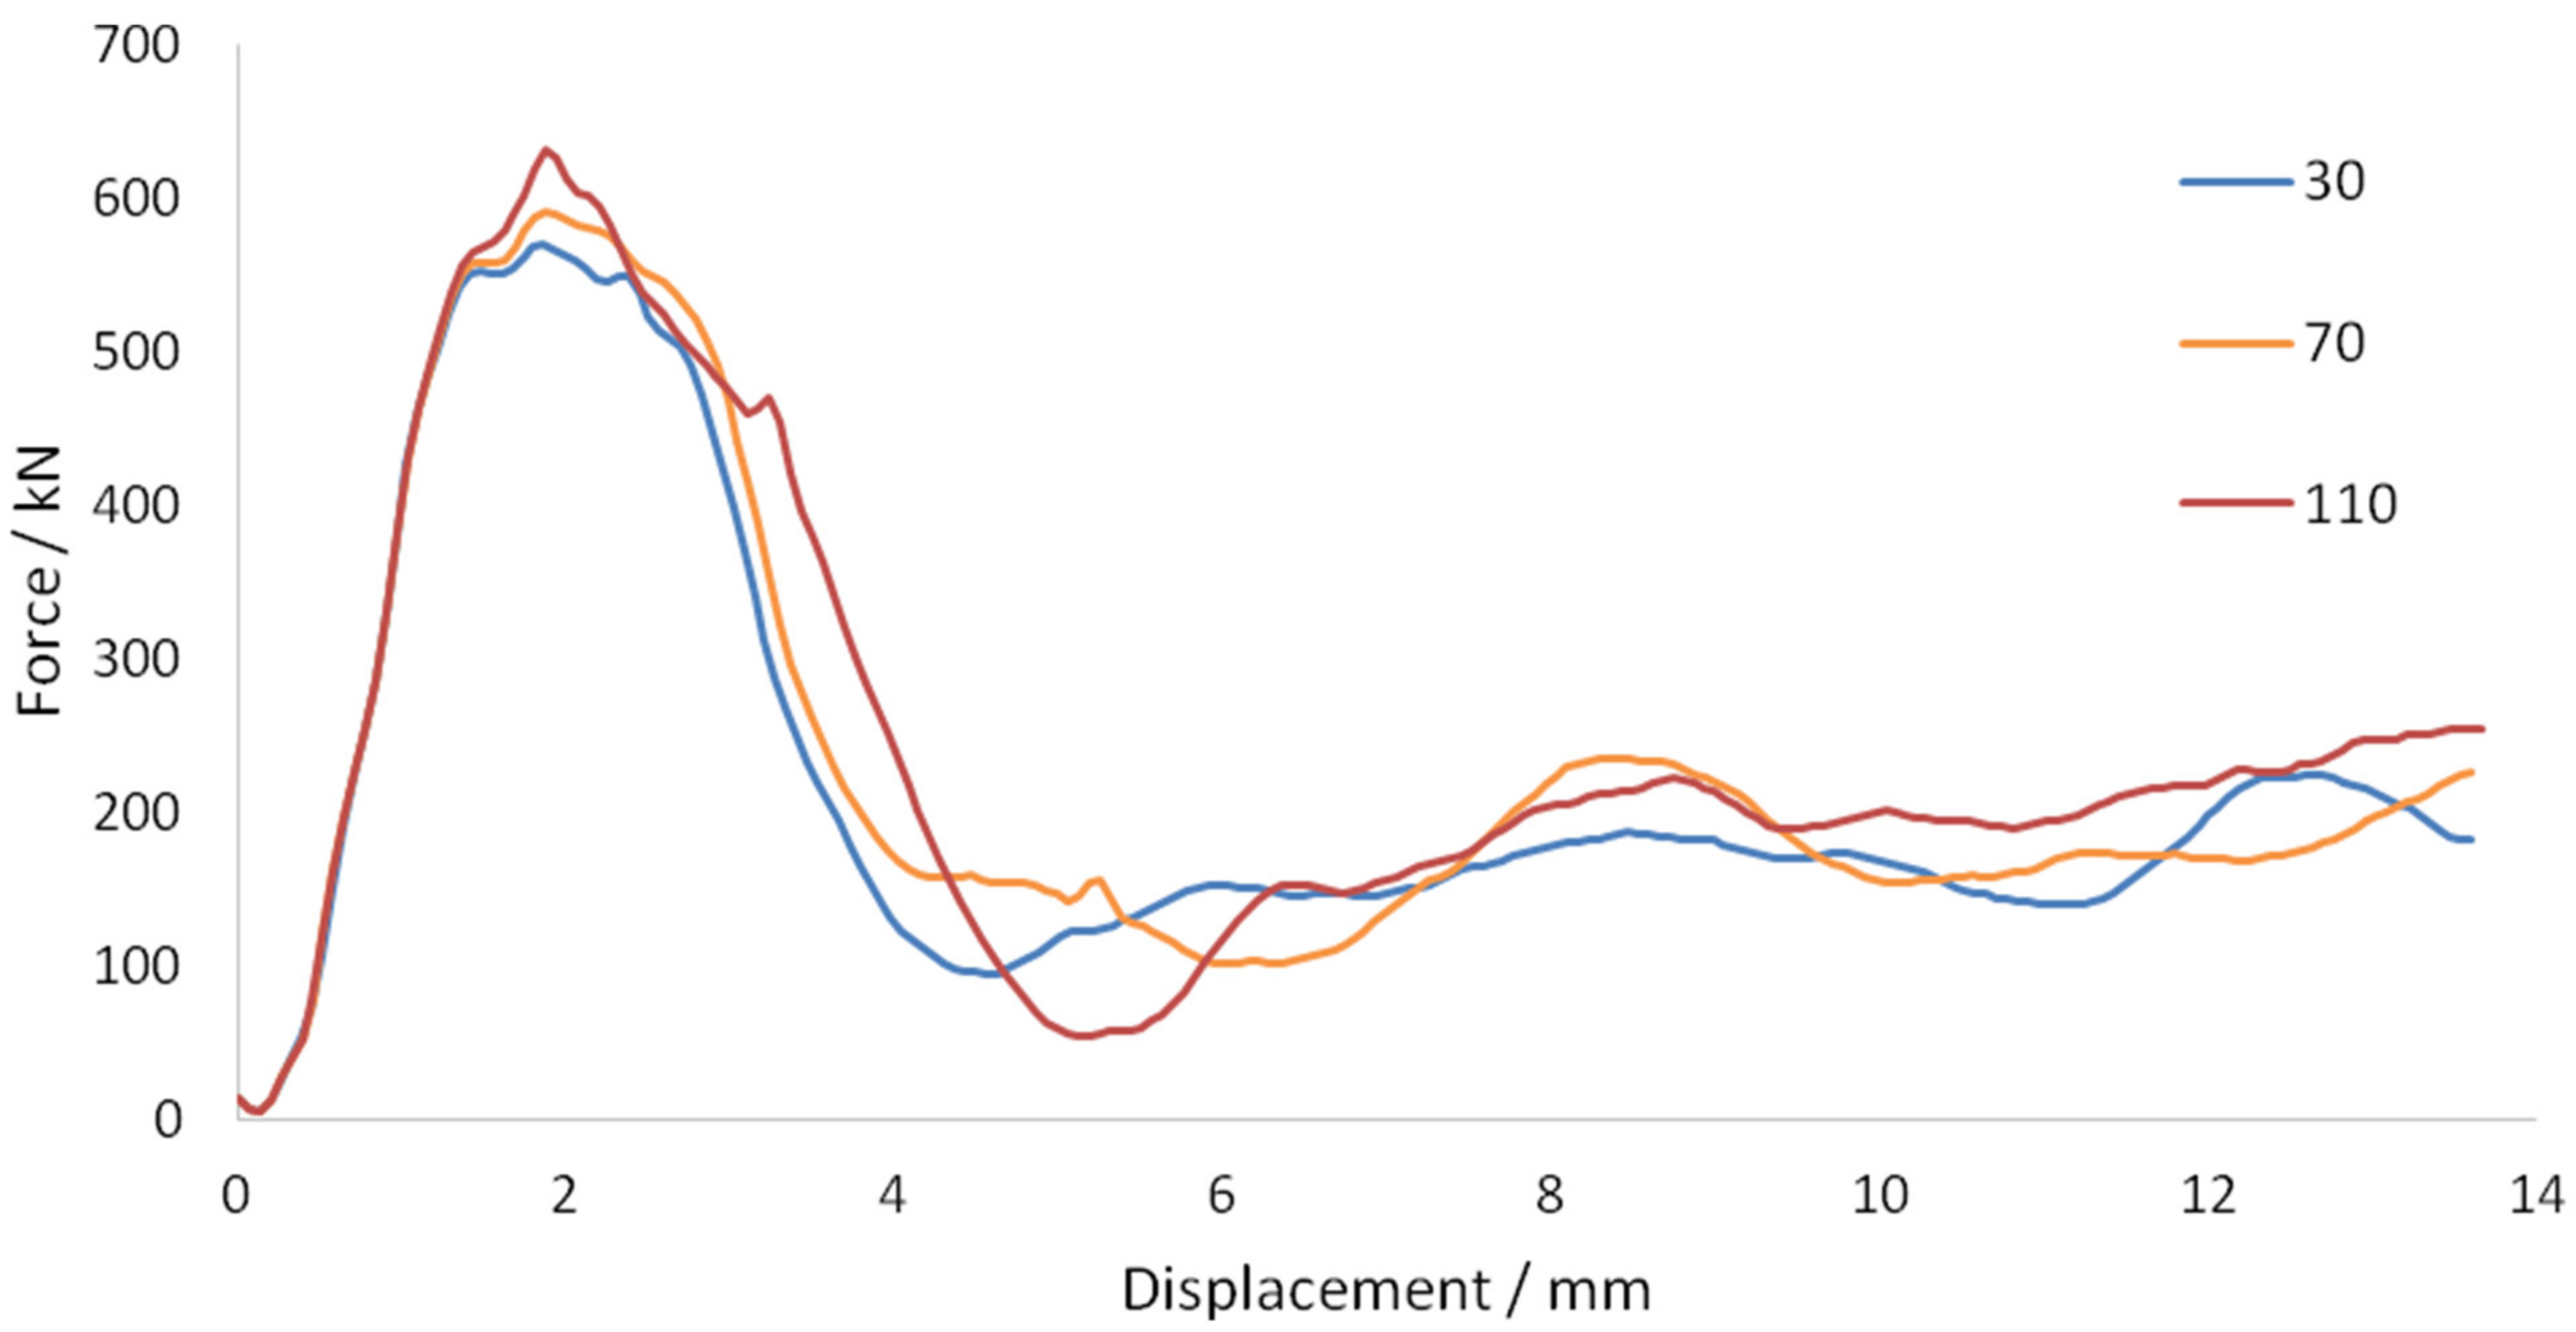
Figure 26.
Force–displacement graphs—CFRP strip width.
Figure 26.
Force–displacement graphs—CFRP strip width.
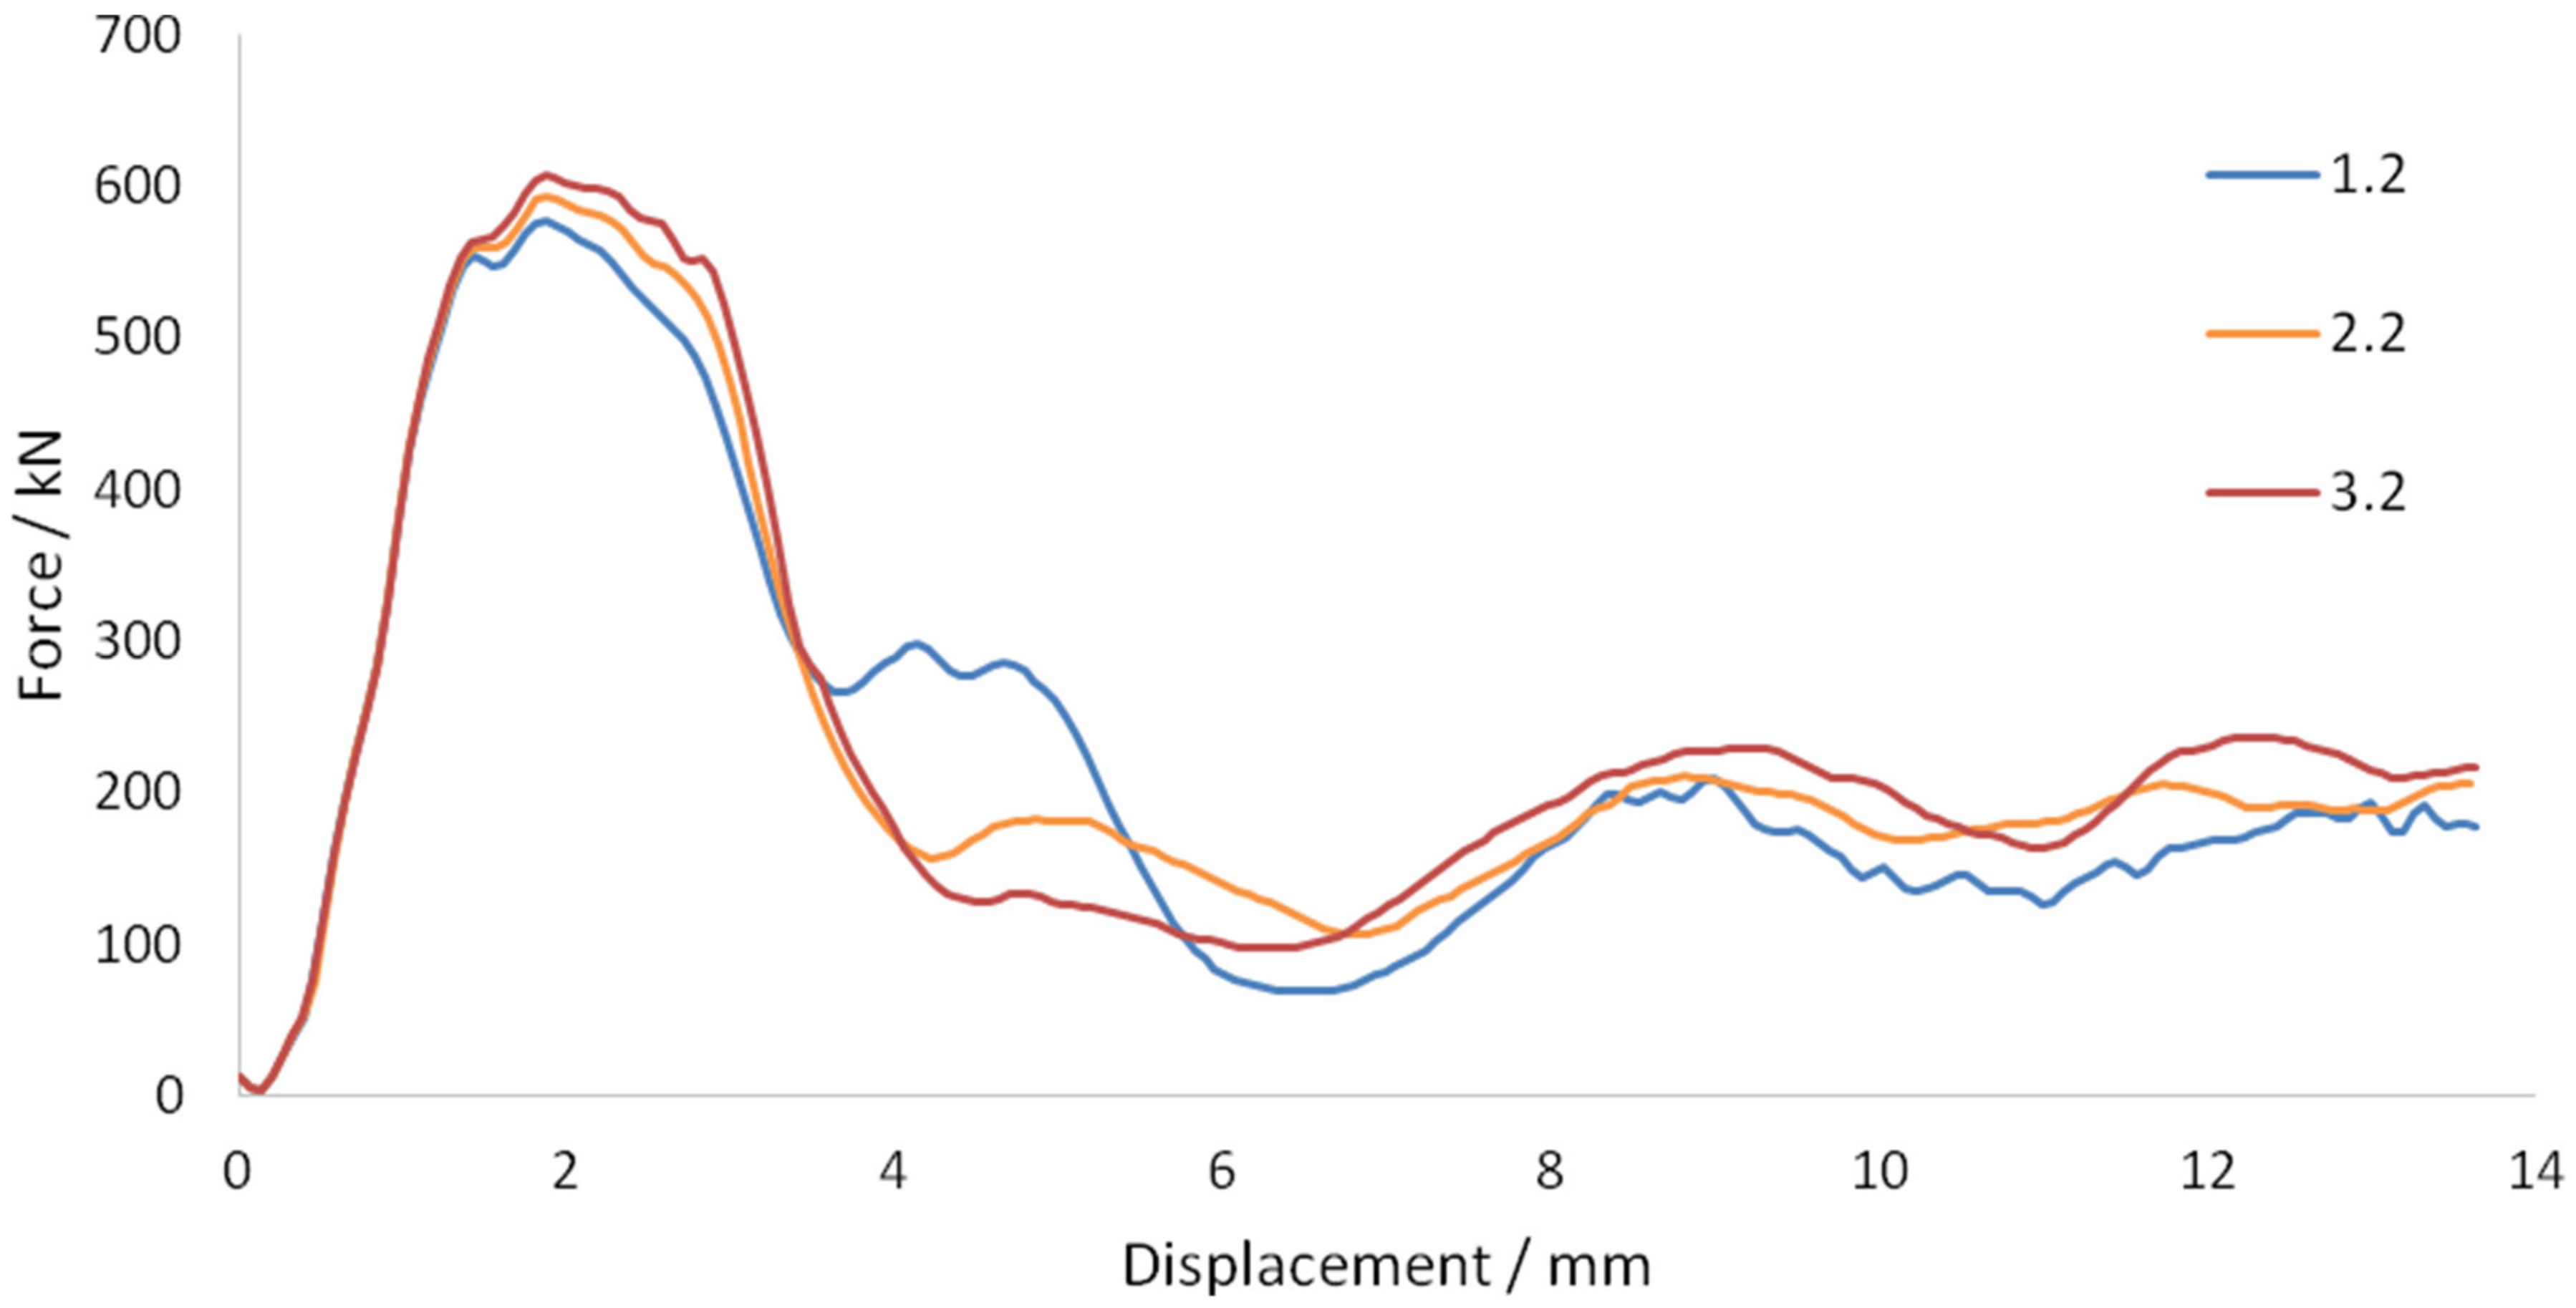
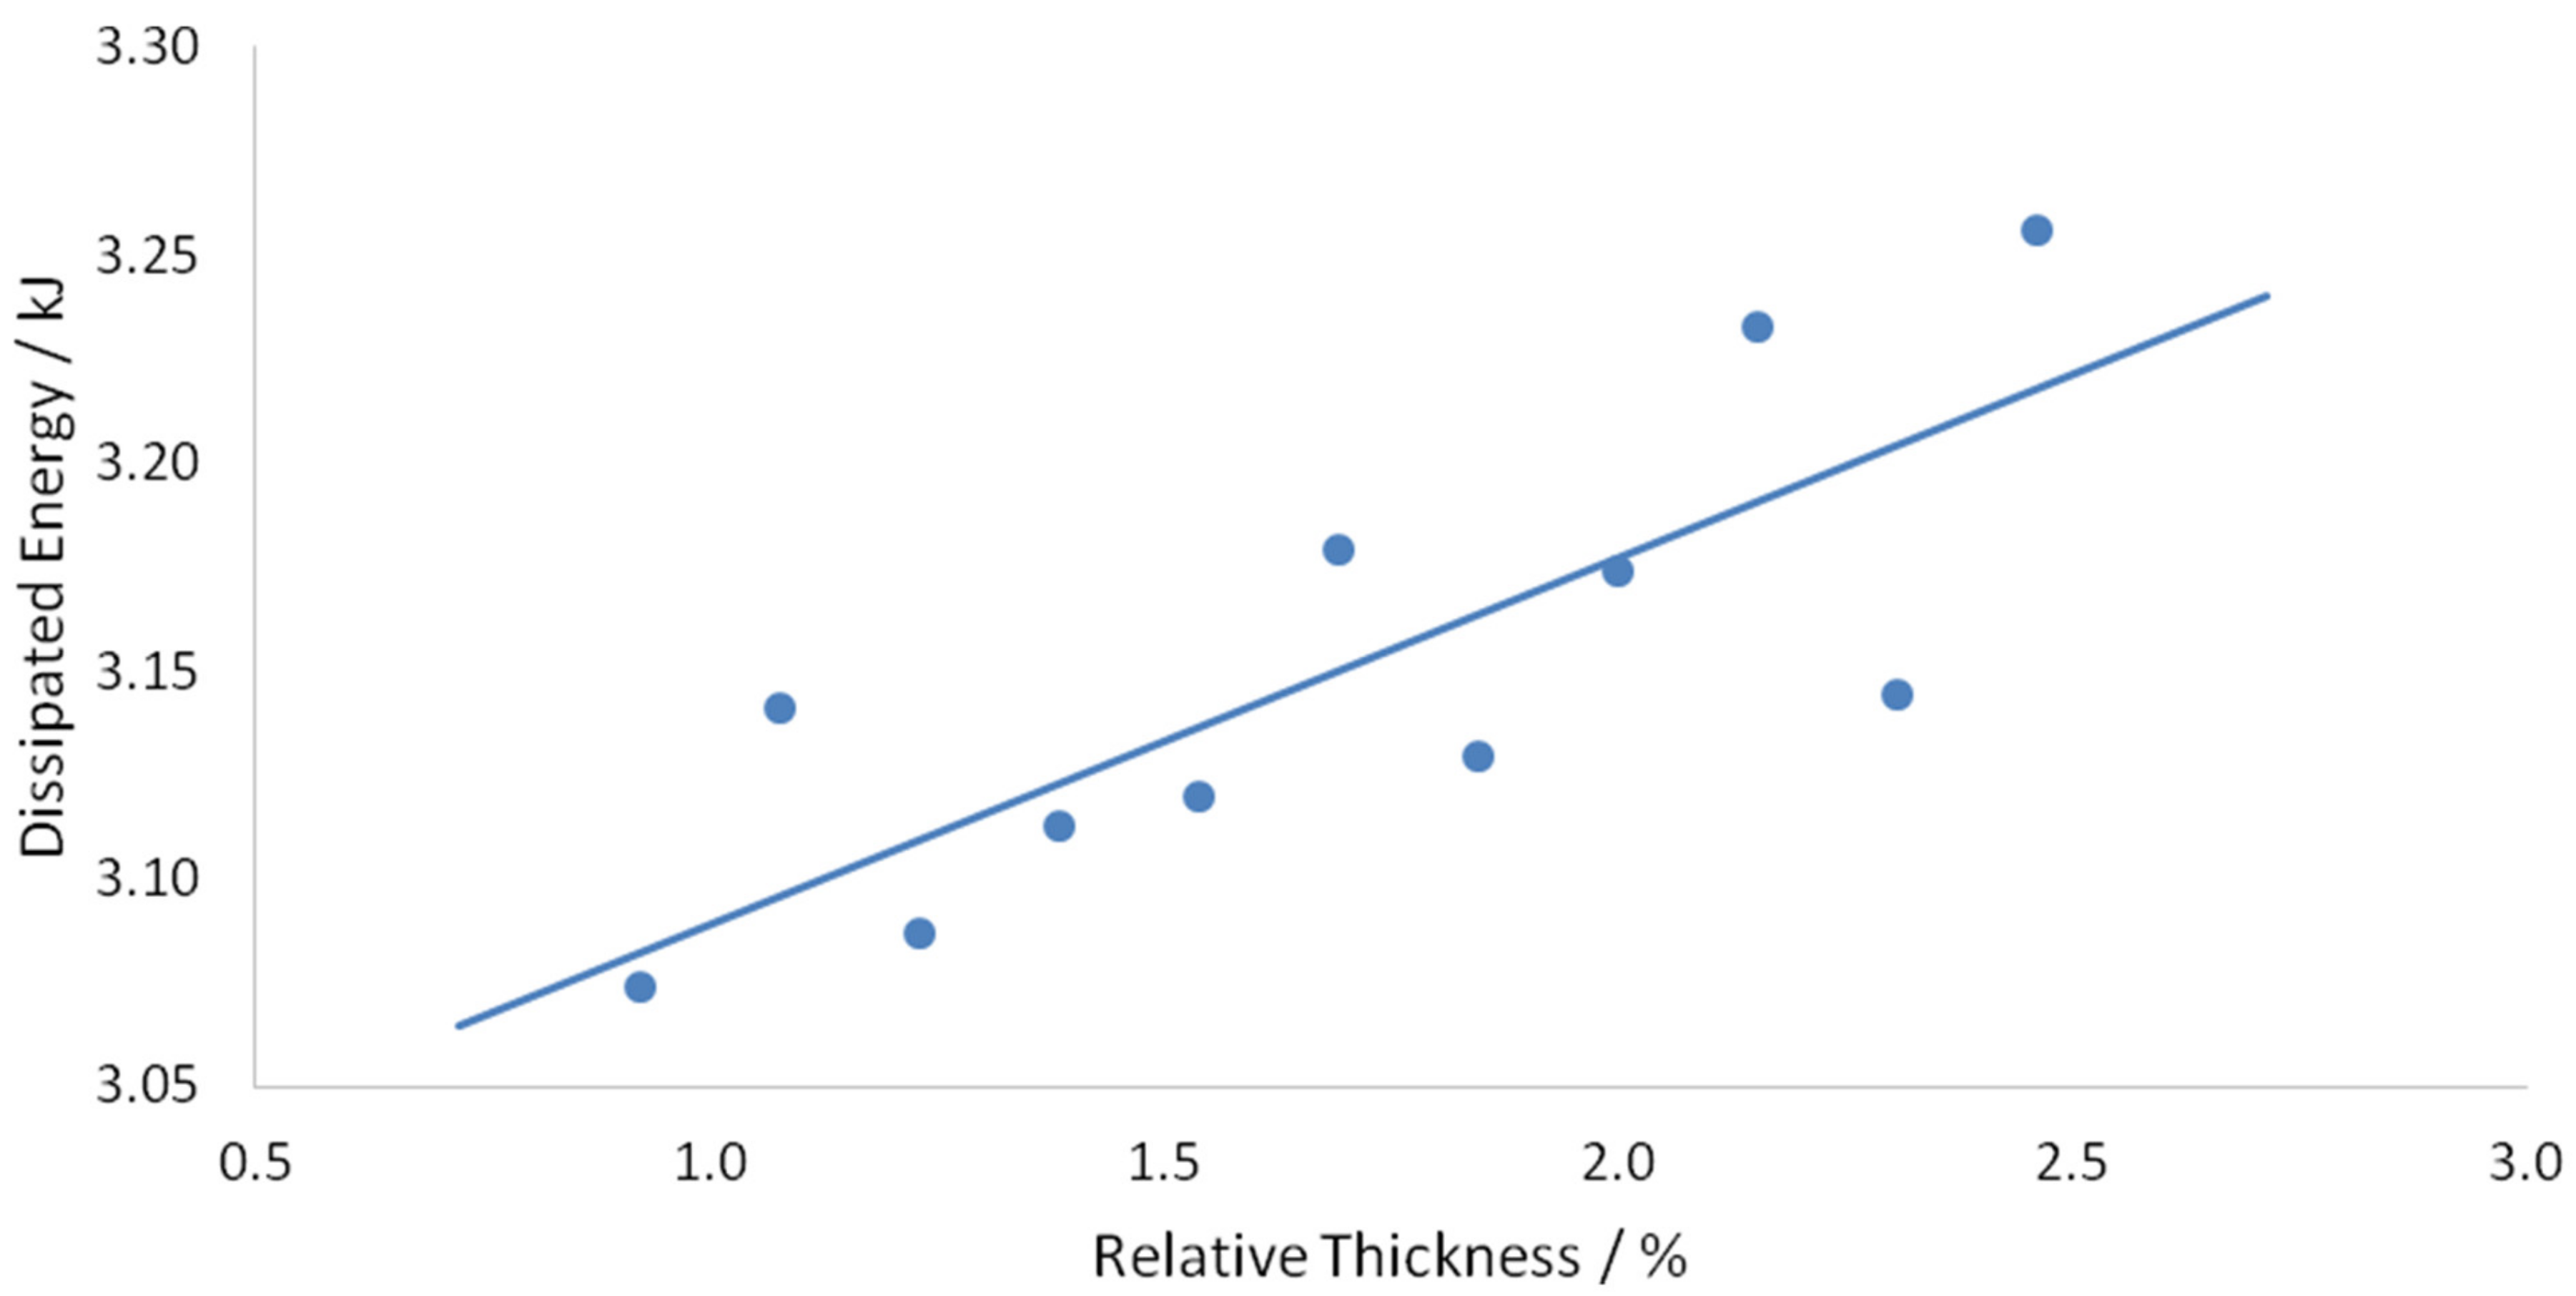
Figure 27.
Dissipated energy vs. relative thickness graph.
Figure 27.
Dissipated energy vs. relative thickness graph.
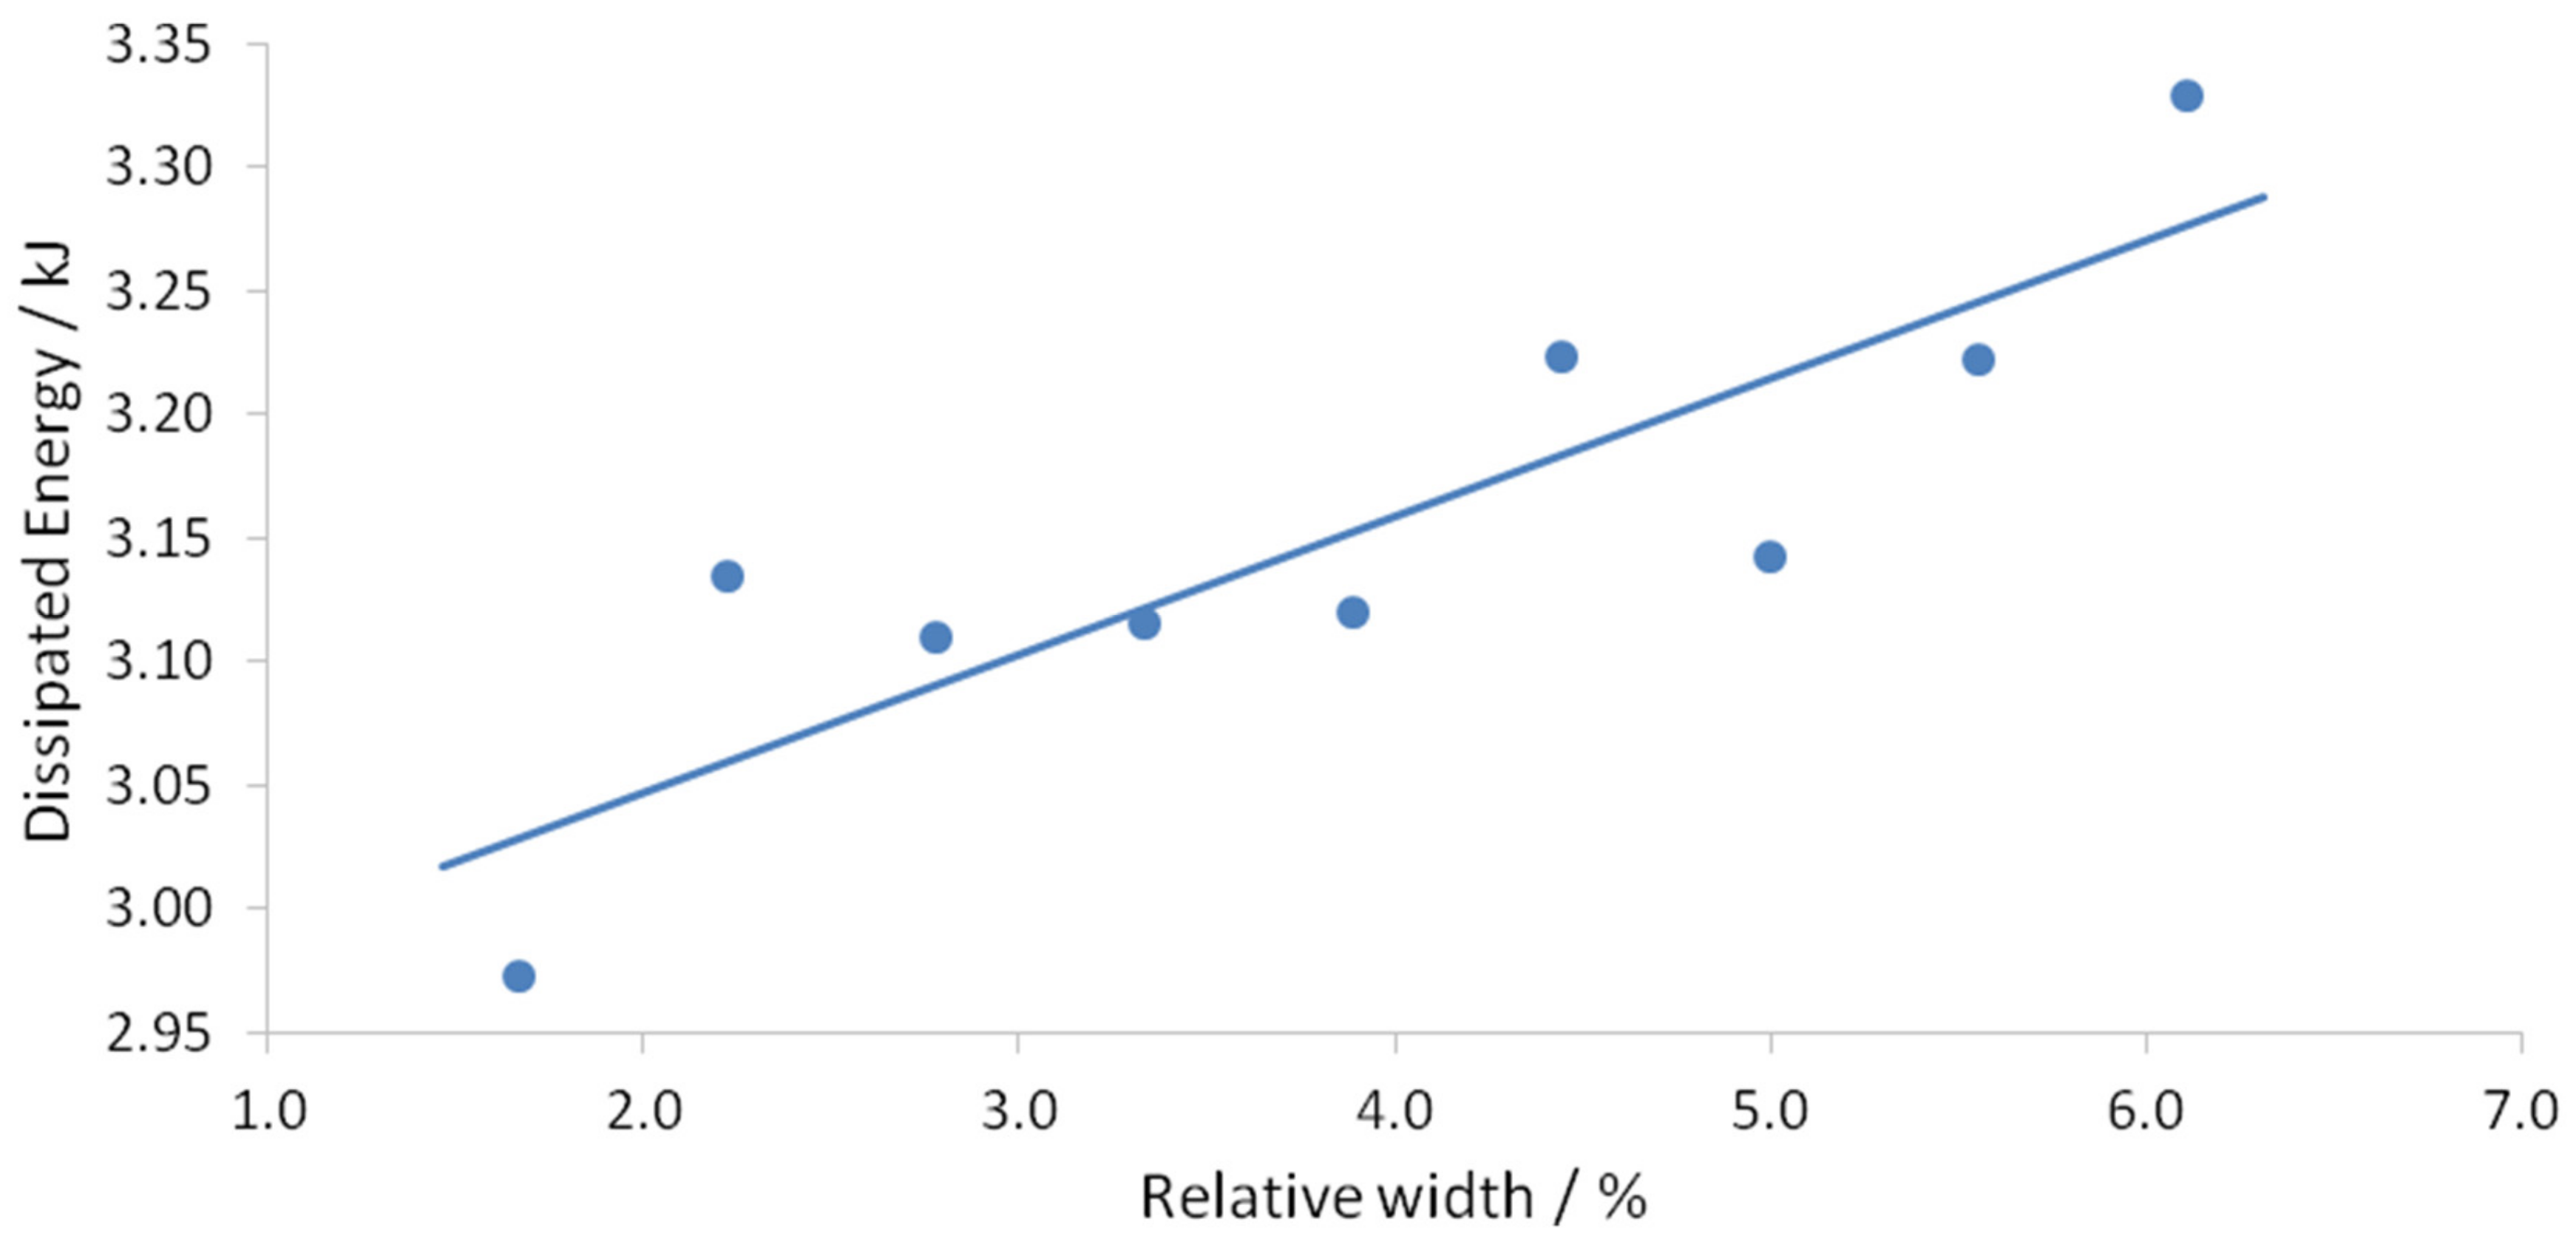
Figure 28.
Dissipated energy vs. relative width graph.
Figure 28.
Dissipated energy vs. relative width graph.
Figure 29.
Dissipated energy against CFRP volume.
Figure 29.
Dissipated energy against CFRP volume.
Figure 30.
Maximum principal stress contour—1.2 mm thickness.
Figure 30.
Maximum principal stress contour—1.2 mm thickness.
Figure 31.
Maximum principal stress contour—3.2 mm thickness.
Figure 31.
Maximum principal stress contour—3.2 mm thickness.
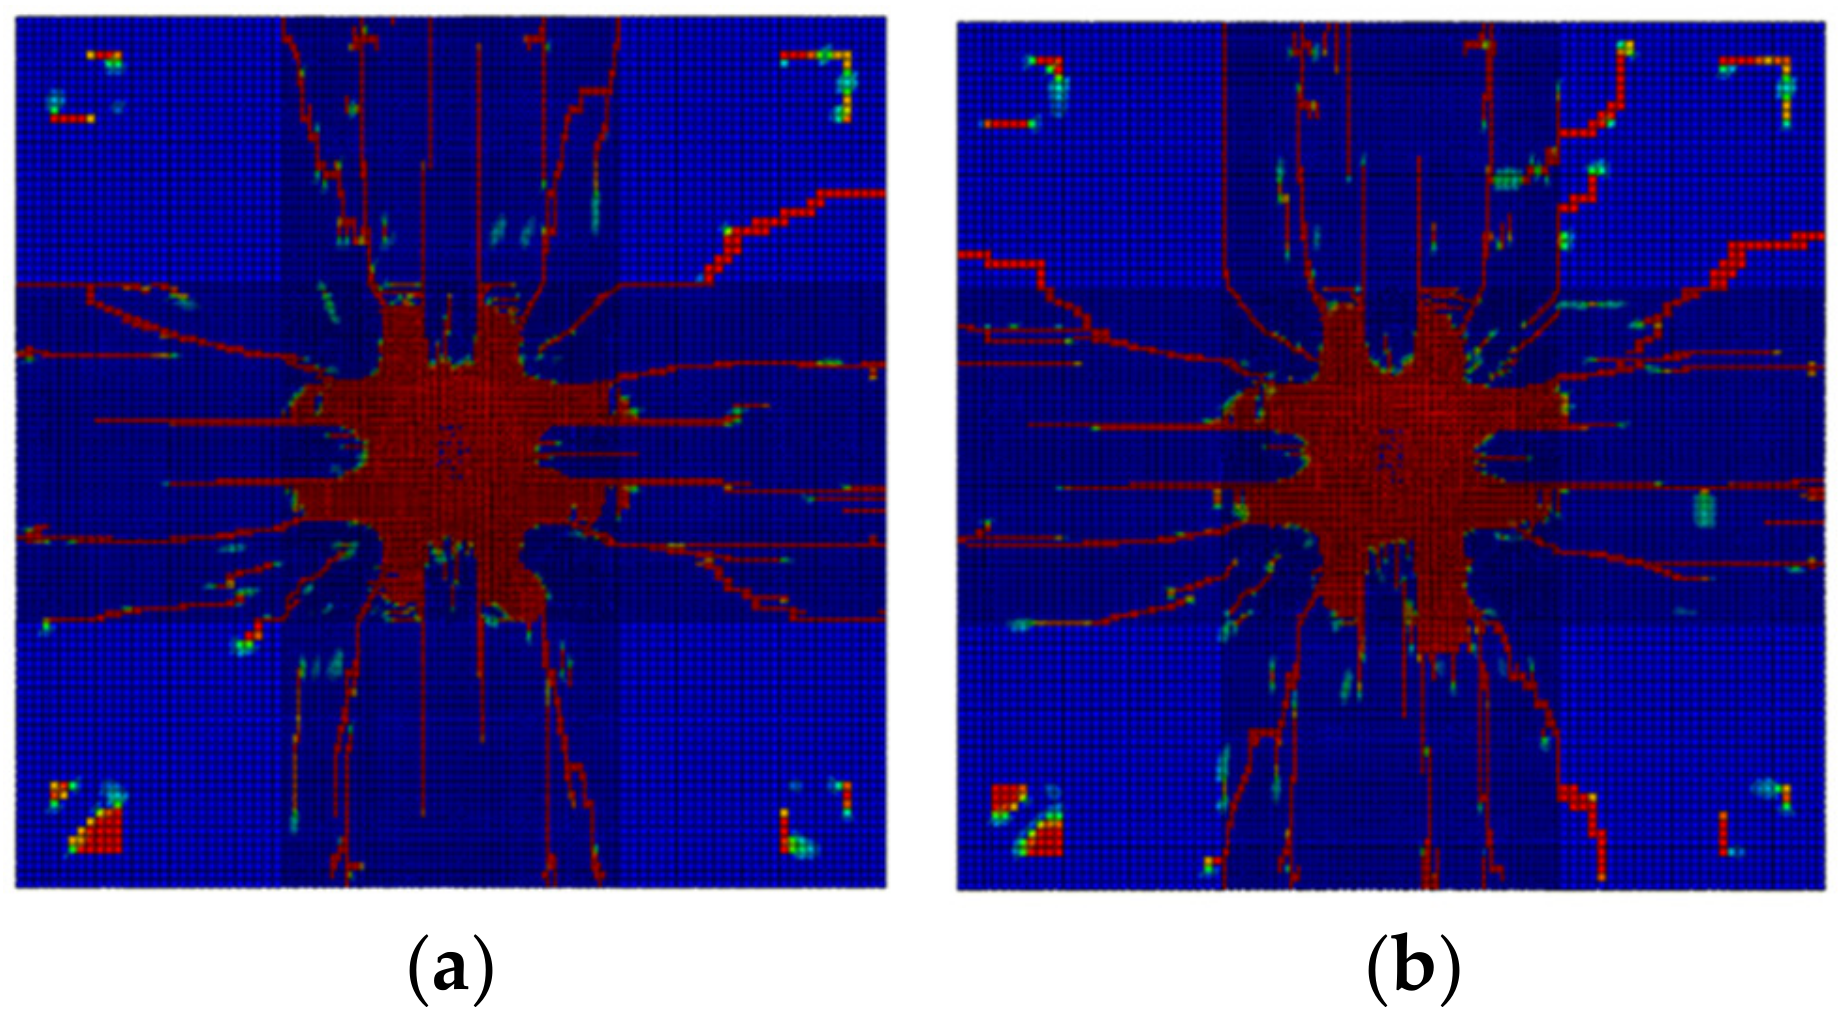
Figure 32.
Maximum principal stress contour—30 mm width.
Figure 32.
Maximum principal stress contour—30 mm width.
Figure 33.
Maximum principal stress contour—110 mm width.
Figure 33.
Maximum principal stress contour—110 mm width.
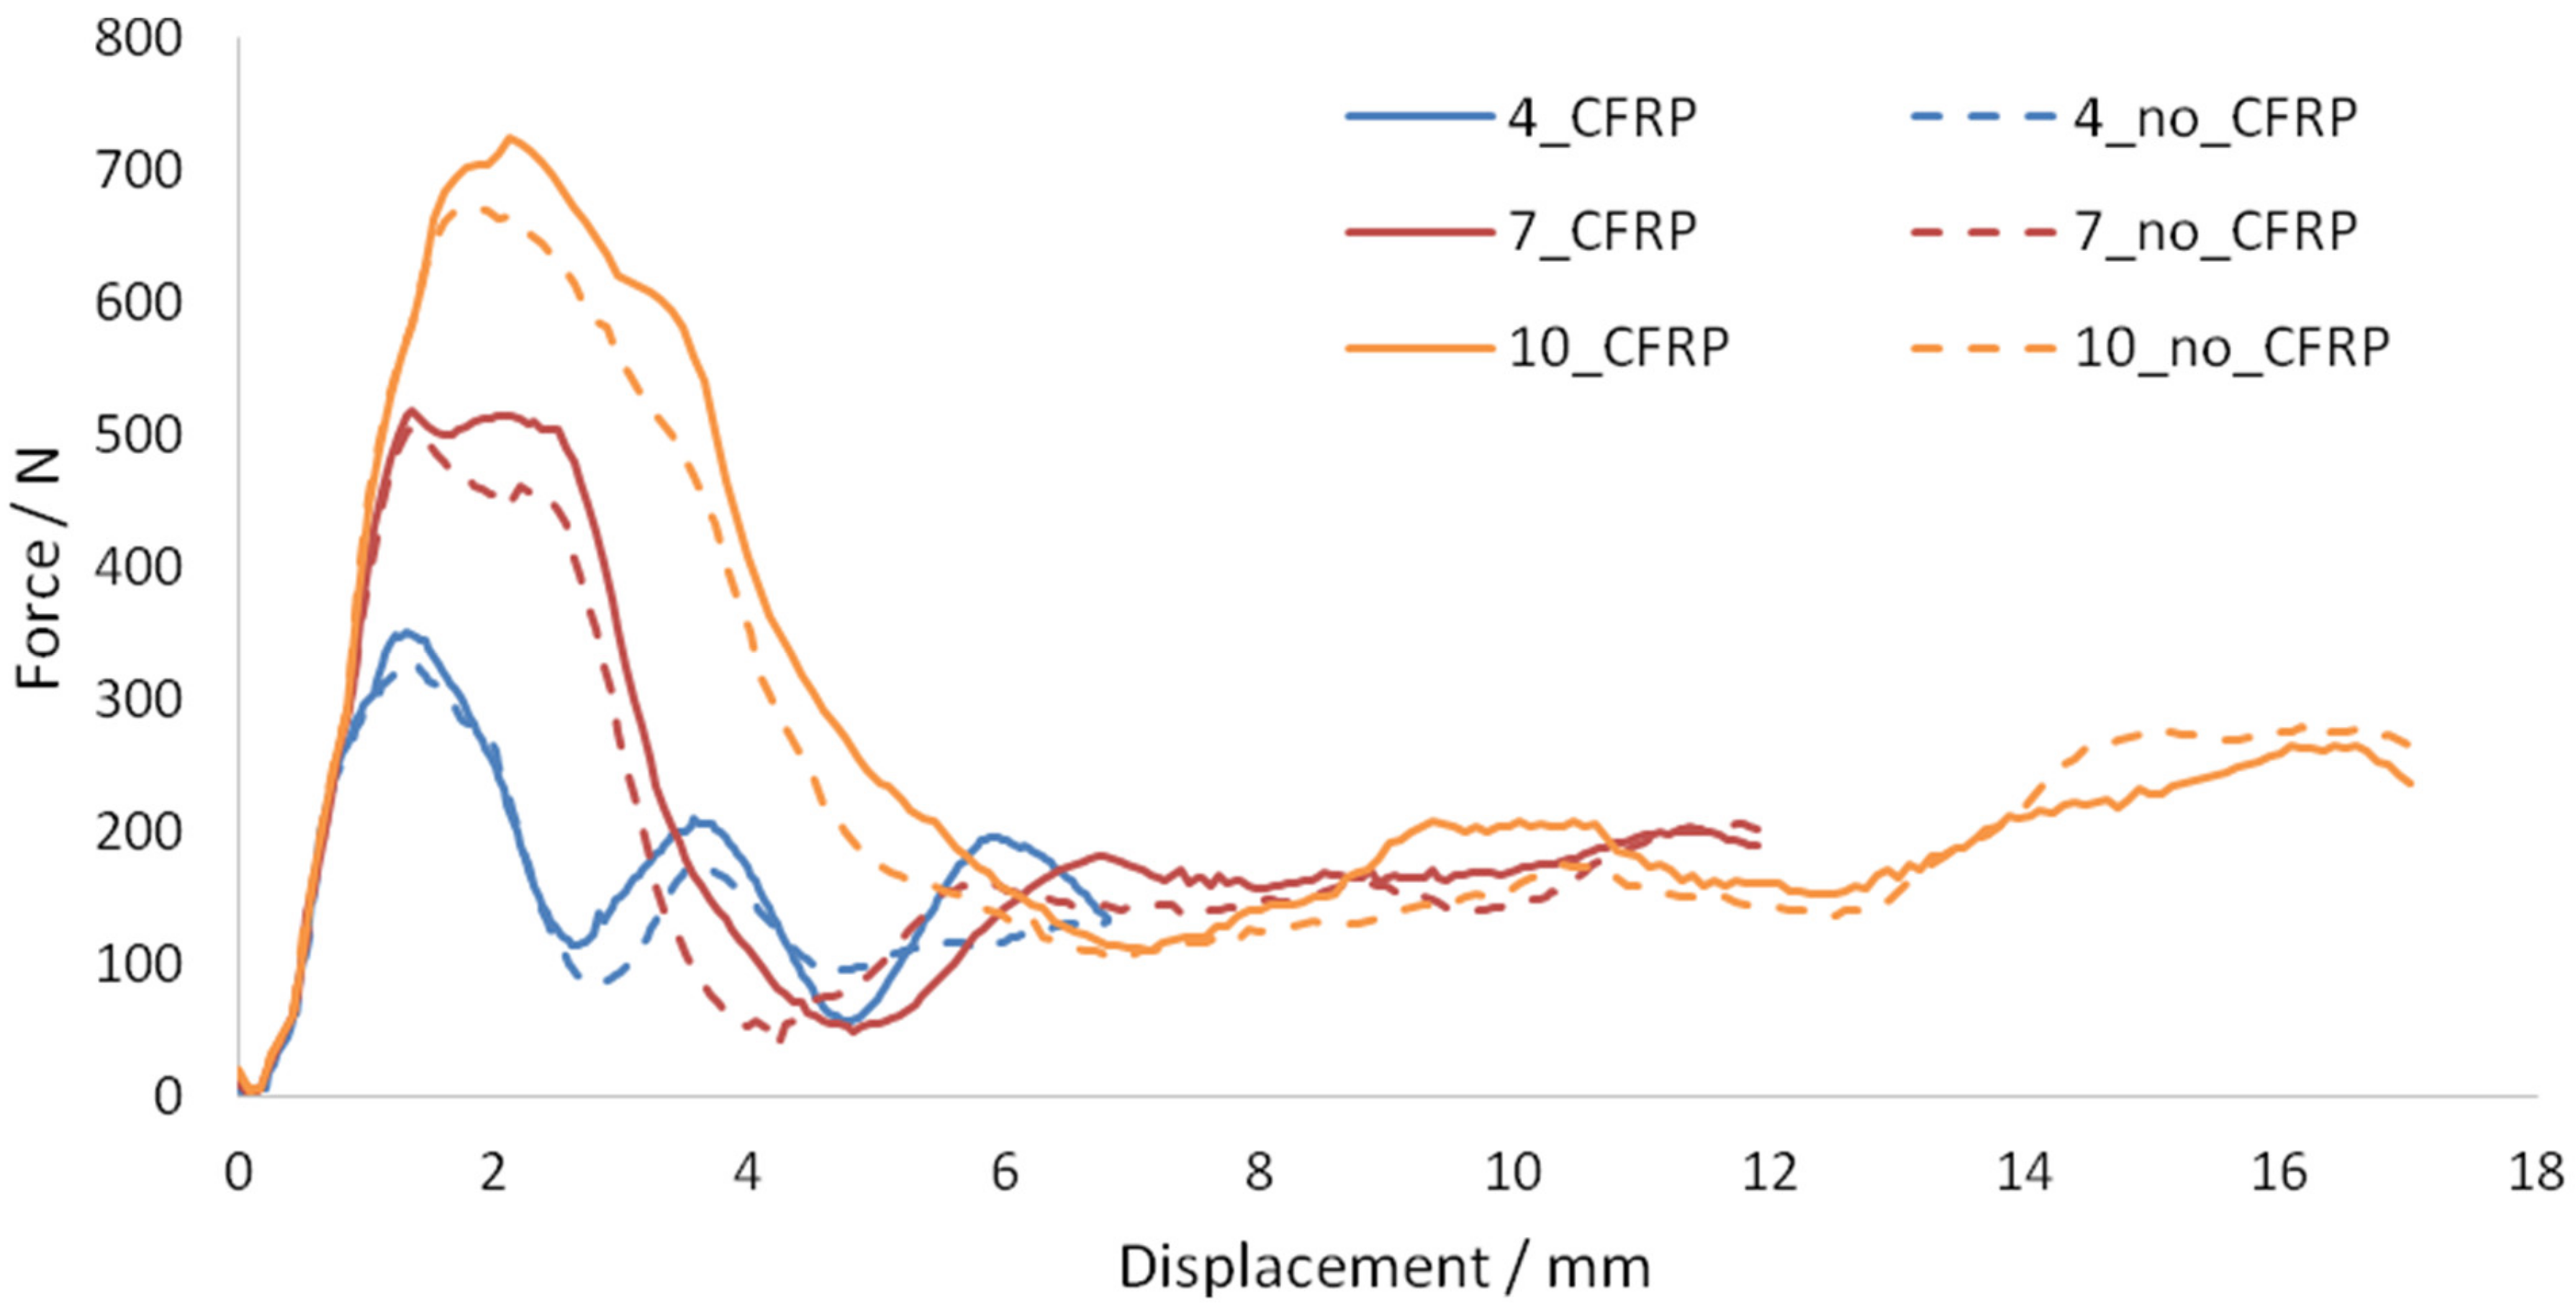
Figure 34.
Force–displacement graphs—Impact velocity.
Figure 34.
Force–displacement graphs—Impact velocity.
Figure 35.
Dissipated energy against impact velocity.
Figure 35.
Dissipated energy against impact velocity.
Figure 36.
Maximum principal stress contour—12 m/s impact velocity, with CFRP.
Figure 36.
Maximum principal stress contour—12 m/s impact velocity, with CFRP.
Figure 37.
Maximum principal stress contour—12 m/s impact velocity, without CFRP.
Figure 37.
Maximum principal stress contour—12 m/s impact velocity, without CFRP.
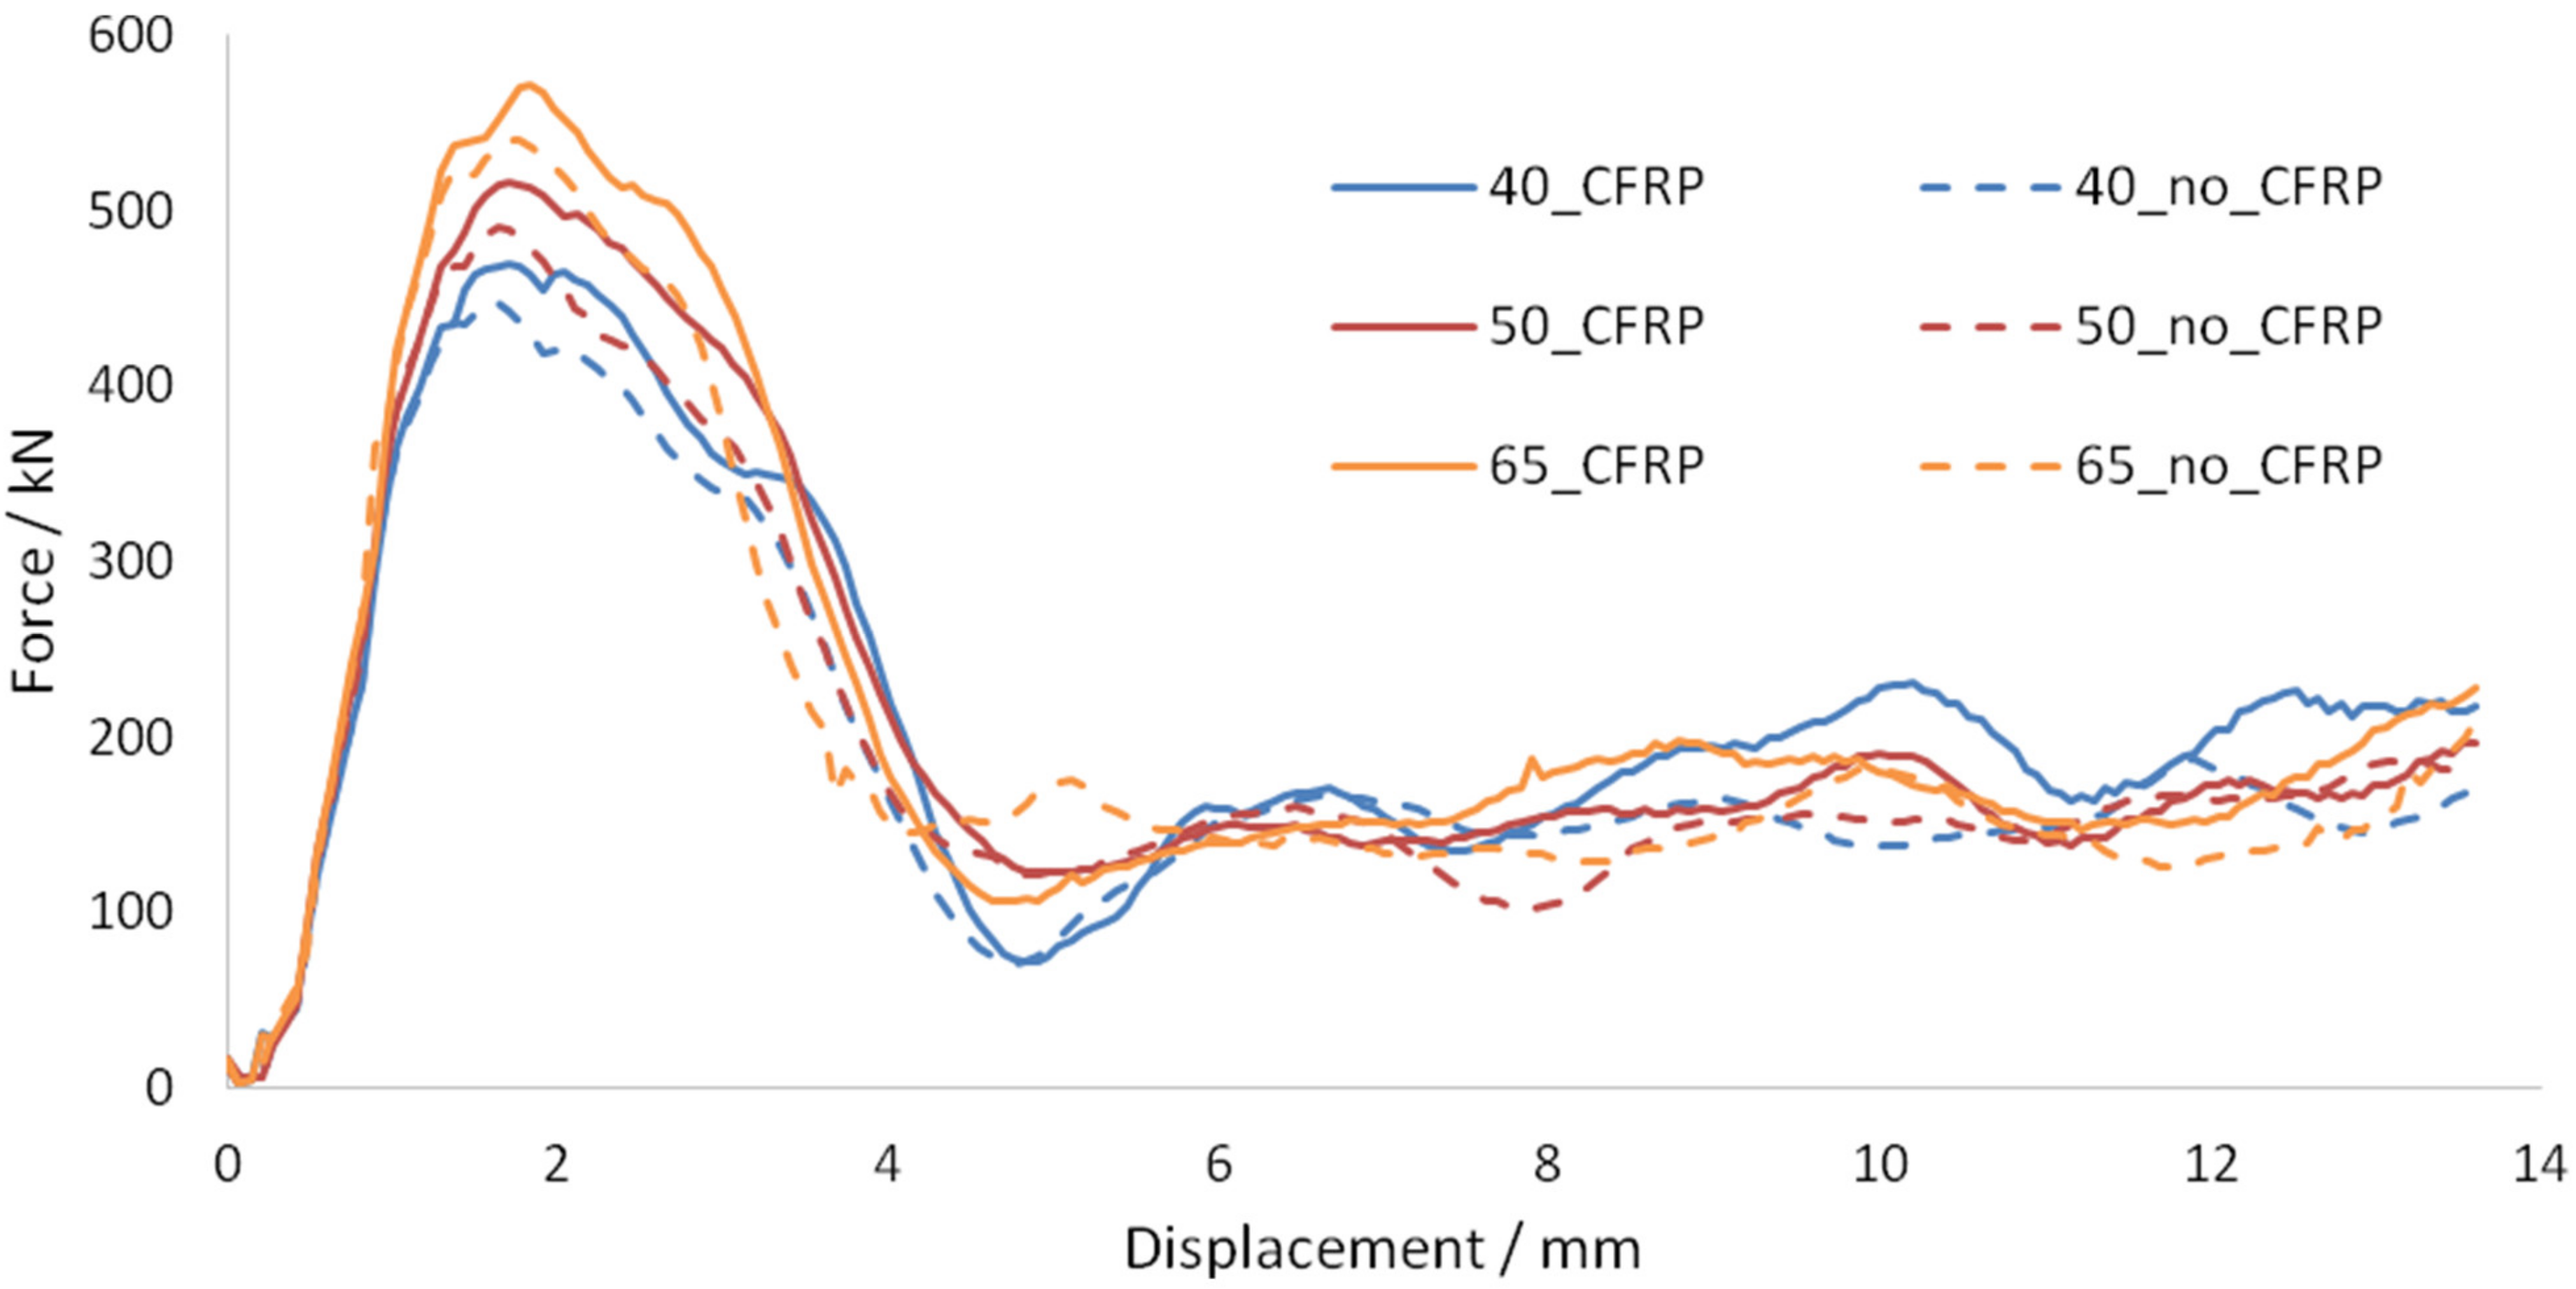
Figure 38.
Force–displacement graphs—Concrete compressive strength.
Figure 38.
Force–displacement graphs—Concrete compressive strength.
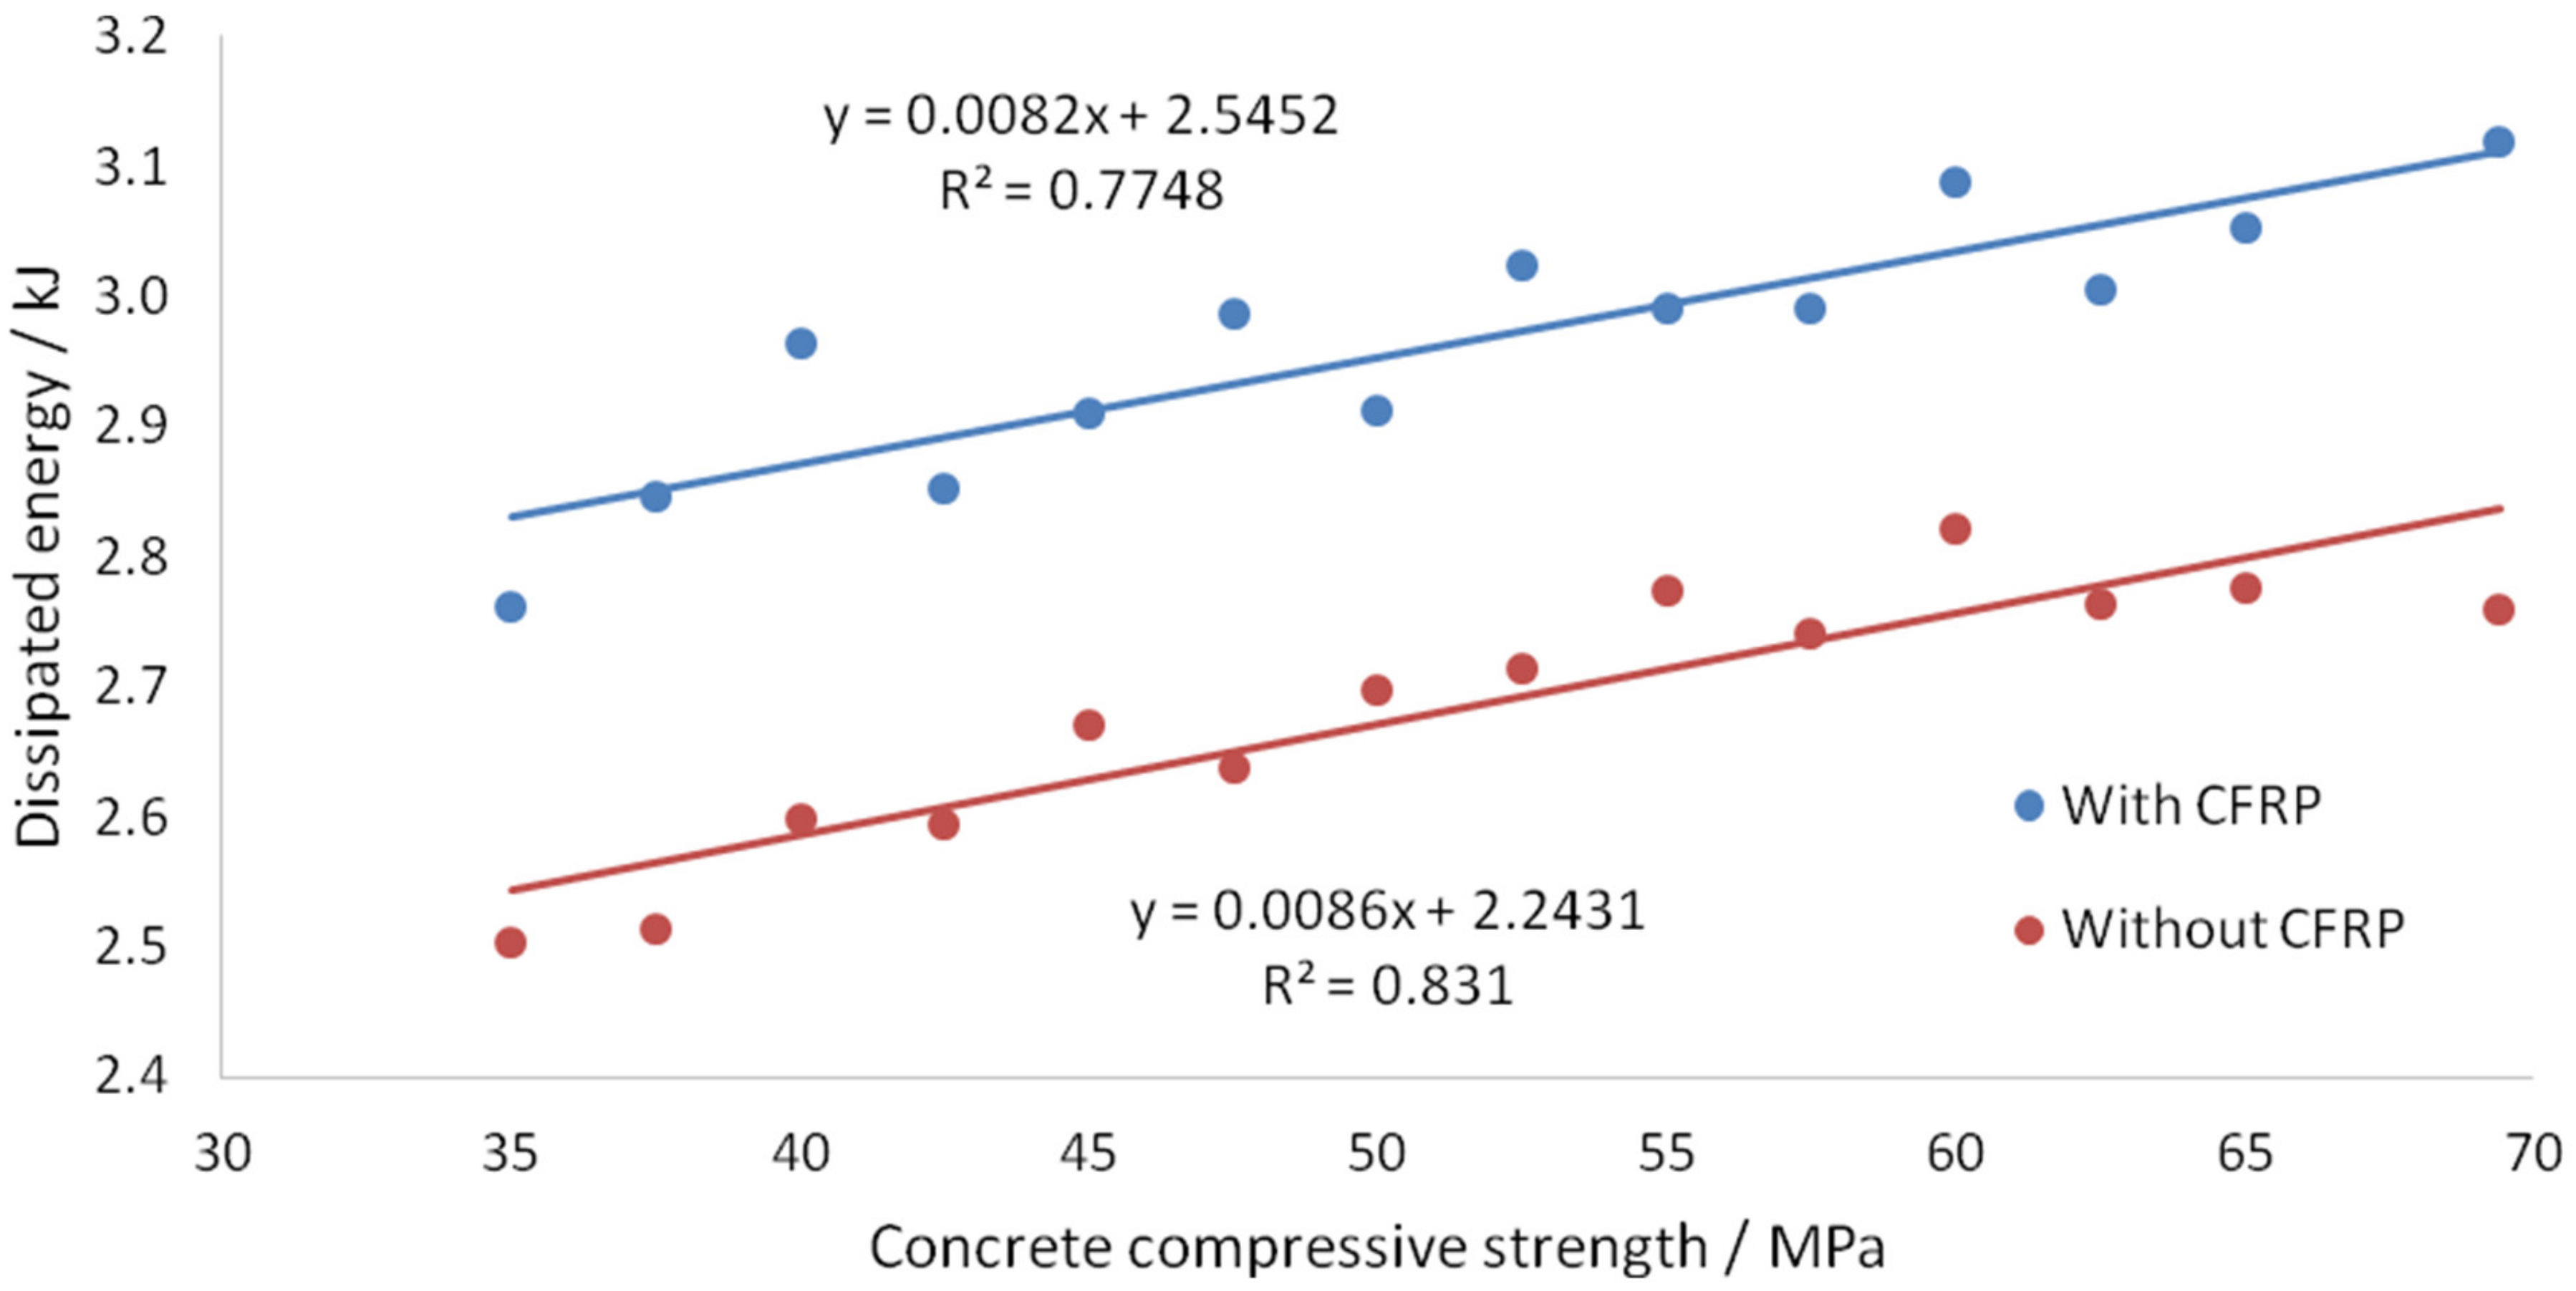
Figure 39.
Dissipated energy against concrete compressive strength.
Figure 39.
Dissipated energy against concrete compressive strength.
Figure 40.
Maximum principal stress contour—Concrete compressive strength 40 MPa, without CFRP.
Figure 40.
Maximum principal stress contour—Concrete compressive strength 40 MPa, without CFRP.
Figure 41.
Maximum principal stress contour—Concrete compressive strength 40 MPa, with CFRP.
Figure 41.
Maximum principal stress contour—Concrete compressive strength 40 MPa, with CFRP.
Figure 42.
Maximum principal stress contour—Concrete compressive strength 65 MPa, without CFRP.
Figure 42.
Maximum principal stress contour—Concrete compressive strength 65 MPa, without CFRP.
Figure 43.
Maximum principal stress contour—Concrete compressive strength 65 MPa, with CFRP.
Figure 43.
Maximum principal stress contour—Concrete compressive strength 65 MPa, with CFRP.
Table 1.
Elastic lamina properties of CFRP used for slab
Table 1.
Elastic lamina properties of CFRP used for slab
| | | | | |
|---|
| 171,000 | 9000 | 0.342 | 4800 | 4800 | 4500 |
Table 2.
Hashin Damage Properties [
38].
Table 2.
Hashin Damage Properties [
38].
| XT | XC | YT | YC | SL | ST |
|---|
| 2050 | 1500 | 74 | 190 | 81 | 81 |
Table 3.
Material properties of the column.
Table 3.
Material properties of the column.
| Component | Parameter | Value |
|---|
| Steel tube | | 7800 |
| 210 |
| 245 |
| 0.3 |
| Concrete core | | 2400 |
| 32.5 |
| 38.7 |
| FRP | | 1600 |
| 200 |
| 0.3 |
| Steel general | | 7800 |
| 200 |
| 500 |
| 0.3 |
Table 4.
Material properties of the slab.
Table 4.
Material properties of the slab.
| Component | Parameter | Value |
|---|
| Steel | | 7850 |
| 193 |
| 489 |
| 597 |
| 0.3 |
| Concrete | | 2441 |
| 36.8 |
| 69.4 |
| Steel general | | 7800 |
| 200 |
| 500 |
| 0.3 |
Table 5.
Experimental maximum force and displacement values for column [
43], and slab [
21].
Table 5.
Experimental maximum force and displacement values for column [
43], and slab [
21].
| | |
|---|
| Column | 456.2 | 11 |
| Slab | 556.0 | 13 |
Table 6.
Mesh sizes for initial trials using the same steel and concrete mesh sizes.
Table 6.
Mesh sizes for initial trials using the same steel and concrete mesh sizes.
| | Case | A | B | C | D | E |
|---|
| Steel | Global | 20 | 20 | 25 | 20 | 20 |
| Local | 9 | 6 | 6 | 4 | 6 |
| Concrete | Global | 20 | 20 | 25 | 20 | 20 |
| Local | 9 | 6 | 6 | 4 | 6 |
| Weight | 11 | 11 | 11 | 10 | 10 |
| Support | 11 | 11 | 11 | 10 | 10 |
Table 7.
Mesh sizes for trials using different element sizes for steel tube and concrete core.
Table 7.
Mesh sizes for trials using different element sizes for steel tube and concrete core.
| Material | Case | F | G | H | I |
|---|
| Steel | Global | 20 | 20 | 25 | 25 |
| Local | 6 | 6 | 9 | 9 |
| Concrete | Global | 25 | 20 | 20 | 20 |
| Local | 9 | 9 | 6 | 4 |
| Weight | 10 | 10 | 10 | 10 |
| Support | 10 | 10 | 10 | 10 |
Table 8.
Comparison of experimental and numerical maximum force and displacement values.
Table 8.
Comparison of experimental and numerical maximum force and displacement values.
| Trial No. | Mass Scaling (×10−6) | F (kN) |
|---|
| 1 | 3.0 | 608.88 |
| 2 | 2.4 | 496.67 |
| 3 | 2.3 | 491.33 |
| 5 | 2.1 | 474.81 |
| 6 | 2.0 | 449.66 |
Table 9.
Mass scaling trials for Case A.
Table 9.
Mass scaling trials for Case A.
| Trial No. | Mass Scaling (×10−6) | F (kN) |
|---|
| 1 | 3.0 | 608.88 |
| 2 | 2.4 | 496.67 |
| 3 | 2.3 | 491.33 |
| 5 | 2.1 | 474.81 |
| 6 | 2.0 | 449.66 |
Table 10.
Final mesh configuration of FRP-strengthened CFST column.
Table 10.
Final mesh configuration of FRP-strengthened CFST column.
| | | Final Mesh Size |
|---|
| Steel | Global | 25 |
| | Local | 9 |
| Concrete | Global | 20 |
| | Local | 6 |
| | Weight | 11 |
| | Support | 11 |
| FRP | Global | 23 |
| | Local | 6 |
Table 11.
Final mesh configuration of FRP-strengthened reinforced concrete (RC) slab.
Table 11.
Final mesh configuration of FRP-strengthened reinforced concrete (RC) slab.
| Part | Slab | Supports | Drop Weight | Steel Reinforcement | FRP |
|---|
| Impact Region | Outer Region |
|---|
| Seed size | 8 | 20 | 23 | 16 | 16 | 2 |
Table 12.
Values used in parametric testing.
Table 12.
Values used in parametric testing.
| Parameter | Unit | Min. Value | Max. Value |
|---|
| FRP fracture energy, | mJ/mm3 | 0.10 | 250 |
| FRP thickness, | mm | 0.10 | 0.50 |
| FRP bond length, | mm | 150 | 1500 |
| Concrete Young’s Modulus, | GPa | 20 | 40 |
| Steel yield strength, | MPa | 245 | 600 |
Table 13.
Summary of range of tested parameters.
Table 13.
Summary of range of tested parameters.
| Parameter | / | CFRP Thickness/ | | | |
|---|
| Fixed | 150 | 2 | 70 | 8000 | 69.4 |
| Range | 10–250 | 1.2–3.2 (0.923–2.462) | 30–110 (1.667–6.111) | 1000–12,000 | 30–69.4 |


