A Systematic Approach to Calculate Unit Emergy Values of Cement Manufacturing in China Using Consumption Quota of Dry and Wet Raw Materials


Abstract
1. Introduction
- (1)
- Renewability rate (R%): it is a ratio between the renewable element and the total element. A higher renewability rate means a better ecological level.
- (2)
- Non-renewability rate of the local resource (N%) displays the ratio within the local resource emergy and total emergy. Higher N% demonstrates worse ecological degrees.
- (3)
- Emergy yield ratio (EYR): EYR can be computed in the light of the total emergy section and imported emergy section, which shows an ability that can generate emergy. The higher the EYR is, the better the consequent of the cement plant is. The higher input of purchased emergy could bring about the lower EYR, revealing the competitive ability of the evaluated cement plant.
- (4)
- Environmental loading ratio (ELR): as the ratio of the non-renewable emergy and purchased emergy to the renewable emergy, the EIR is defined, which can be used to elaborate the ecological load of the evaluated ecosystem, including a non-resource emergy pressure, purchased emergy pressure and others.
- (5)
- Emergy sustainability index (ESI): ESI demonstrates the ratio between the EYR and the ELR. It expresses the comprehensive effect of the environment and economy for the evaluated system.
1.1. Emergy Analysis of Construction of Buildings and Pavements in China
1.2. A Need for an Updated UEV for Cement Manufacturing in China
1.3. Primary vs. Secondary Raw Materials in Cement Manufacturing
1.4. Emergy Baseline
2. Emergy Analysis of Cement Manufacturing in China Using Dry and Wet Raw Materials
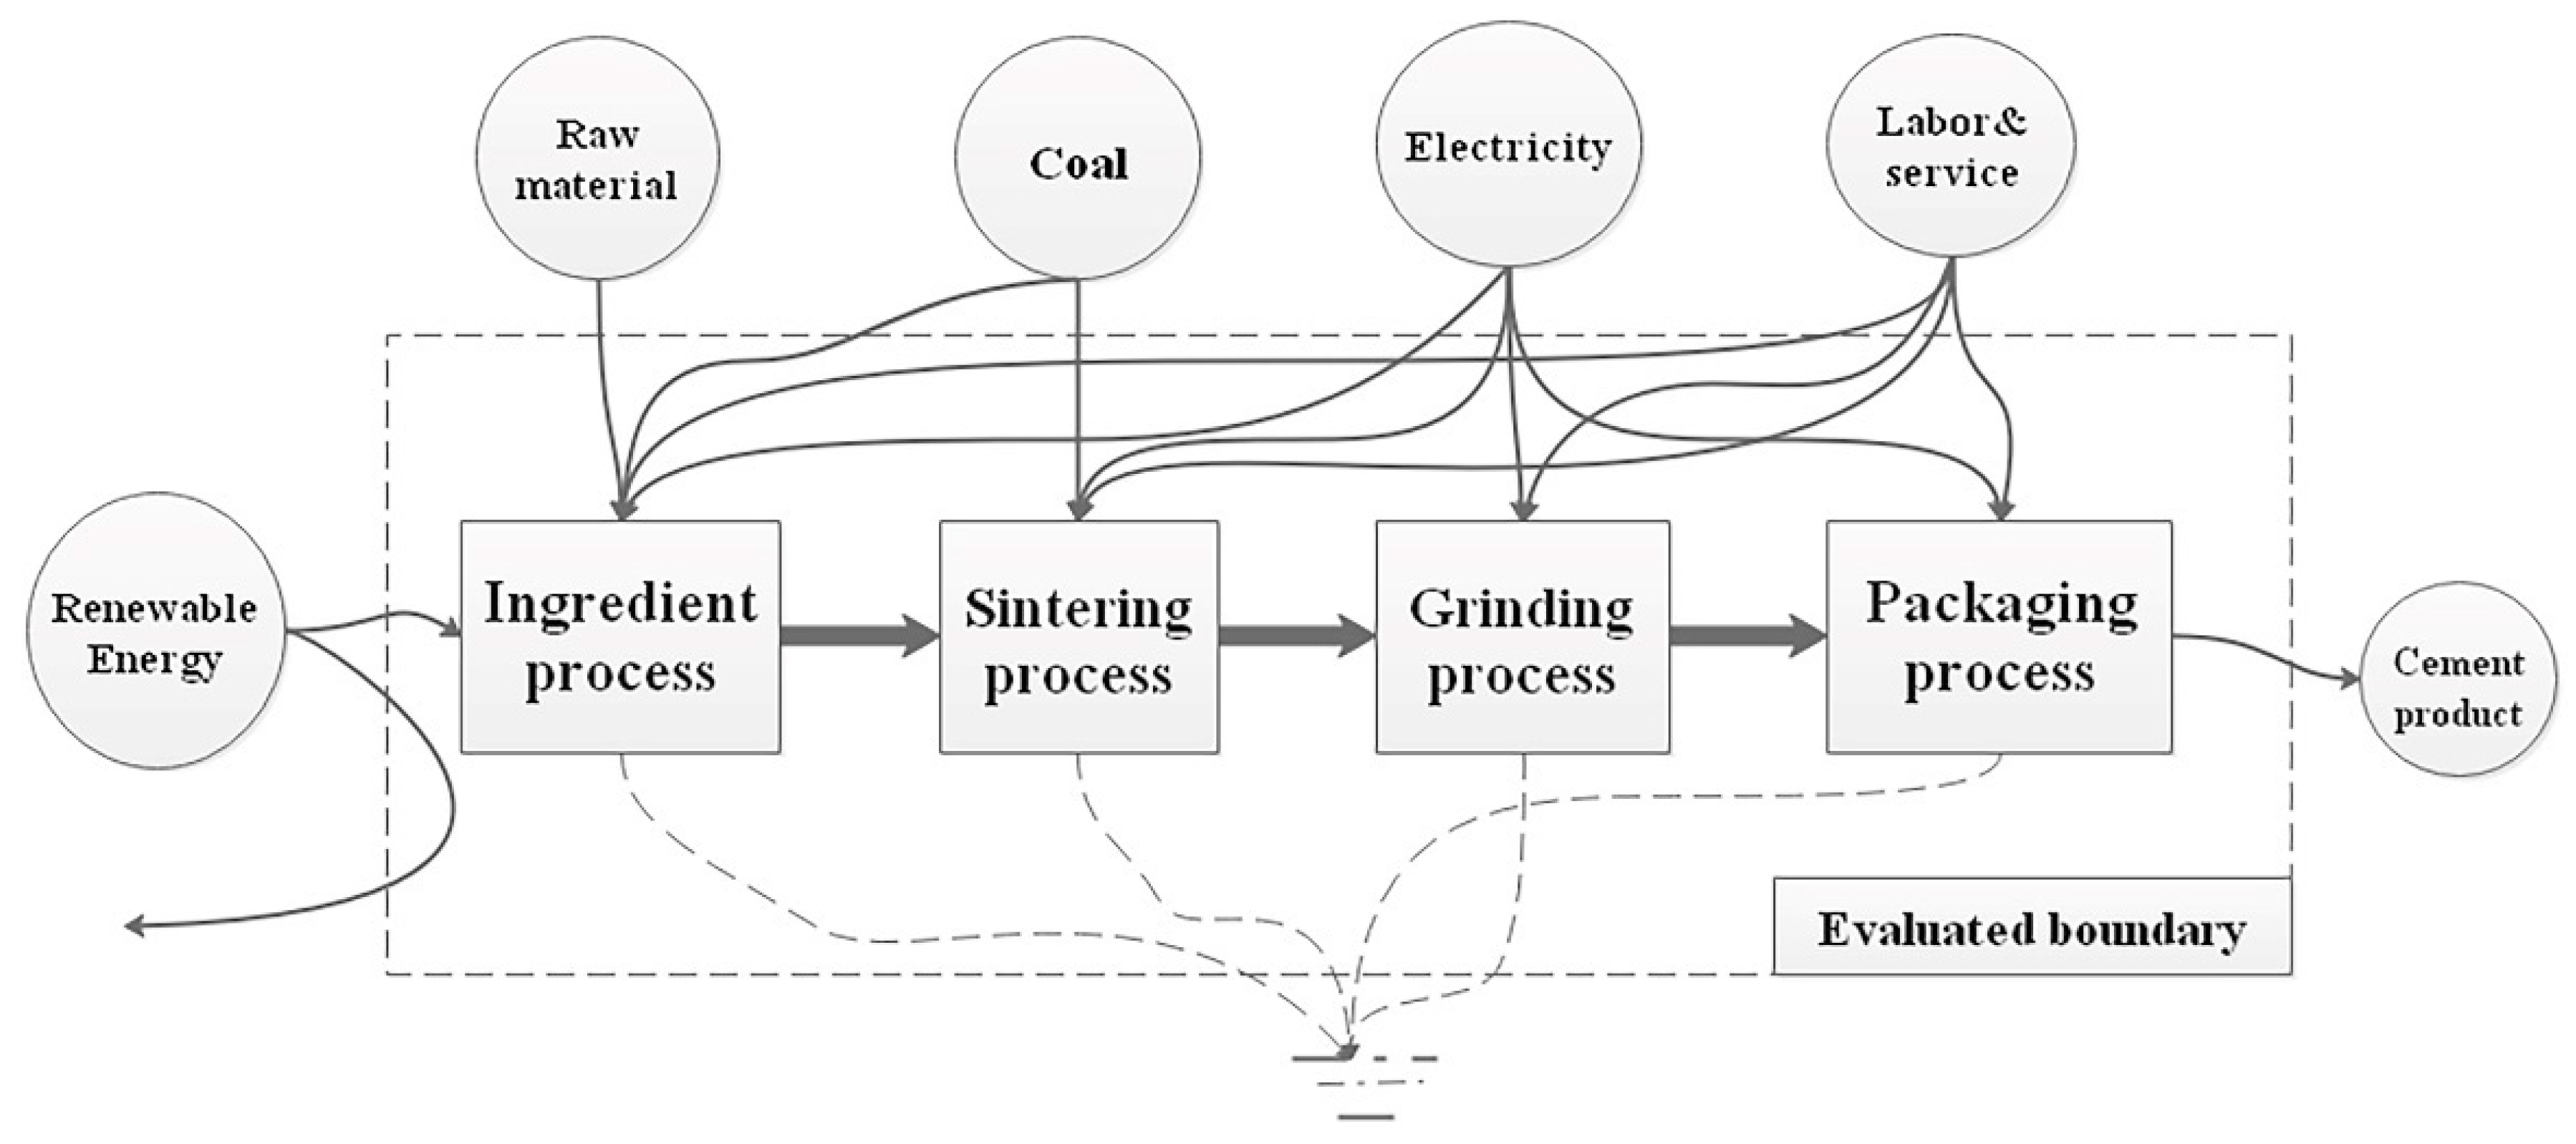
2.1. Emergy Flow Diagram of Cement Manufacturing
2.2. Data Quantity Calculation and Sources
2.2.1. Renewable Resources
- (1)
- Solar energy calculation:
- Area of cement plant = 13,424 m2 (collected data);
- Insolation (Jiangsu Province, China) = 5.00 × 10⁹–5.85 × 10⁹ J/m2/yr [30];
- Albedo = 0.30 [30];
- Energy = (insolation) × (1-albedo) × (area) = (5.43 × 10⁹ J/m2/yr) × (1 − 0.30) × (13,424 m2) = 5.10 × 10¹³ J/yr;
- UEV = 1.00 sej/j by definition [14];
- Emergy of one year = 5.10 × 10¹³ J/yr × 1 yr × 1.00 sej/j = 5.10 × 10¹³ sej;
- Emergy of one day = 5.10 × 10¹³ sej/365 = 1.39 × 10¹¹ sej.
- (2)
- Rain (geopotential energy) calculation:
- Area of cement plant = 13,424 m2 (collected data);
- Rainfall (annual average, n = 5) = 0.68 m/yr [31];
- Energy = (area) × (rainfall) × (runoff rate) × (water density) × (average elevation) × (gravity) = (13,424 m2) × (0.68 m/yr) × (40%) × (1000 kg/m3) × (316 m) × (9.8 kg/m2) = 1.13 × 10¹⁰ J/yr;
- UEV = 1.31 × 10⁴ sej/j [34];
- Emergy of one year = 1.13 × 10¹⁰ J/yr × 1 yr ×1.31 × 104 sej/j = 1.48 × 10¹⁴ sej;
- Emergy of one day = 1.48 × 10¹⁴ sej/365 = 4.09 × 10¹¹ sej.
- (3)
- Rain (chemical potential energy) calculation:
- Area of cement plant = 13,424 m2 (collected data);
- Rainfall (annual average, n = 5) = 0.68 m/yr;
- Water density = 1000 kg/m3;
- Gibbs free energy of water = 4940 J/kg;
- Energy = (area) × (rainfall) × (evapotranspiration rate) × (water density) × (Gibbs free energy of water) = (13,424 m2) × (0.68 m/yr) × (1000 kg/m3) × (60%) × (4.40 J/kg) = 2.71 × 10¹⁰ J/yr;
- UEV = 2.35 × 10⁴ sej/j [35];
- Emergy of one year = 2.71 × 10¹⁰ J/yr × 1 yr × 2.35 × 104 sej/j = 6.37 × 10¹⁴ sej;
- Emergy of one day = 6.37 × 10¹⁴ sej/365 = 1.75 × 10¹¹ sej.
- (4)
- Wind energy calculation:
- Area of cement plant = 13,424 m2 (collected data);
- Air density = 1.29 kg/m3;
- Wind velocity (annual average, n = 2) = 1.95 m/s [35];
- Velocity of geostrophic wind = 3.25 m/s (surface winds are considered as 0.6 of geostrophic wind [35];
- Energy = (area) × (air density) × (drag coefficient) × (velocity of geostrophic wind)3 = (13,424 m2) × (1.29 kg/m3) ×0.001 × (3.25 m/s)3 × (3.15 × 107 s/yr) = 1.77 × 10⁹ J/yr;
- UEV = 1.90 × 10³ sej/j [14];
- Emergy of one year = 1.77 × 10⁹ J/yr × 1 yr × 1.90 × 103 sej/j = 3.36 × 10¹² sej;
- Emergy of one day = 3.36 × 10¹² sej/365 = 9.21 × 10⁹ sej.
- (5)
- Geothermal heat calculation:
- Area of cement plant = 13,424 m2 (collected data);
- Heat flow (average) = 0.035 J/m2/s. Energy = (area) × (heat flow) = (13,424 m2) × (0.035 J/m2/s) × (3.15 × 10⁷ s/yr) = 1.48 × 10¹⁰ J/yr;
- UEV = 4.37 × 10⁴ sej/j [38];
- Emergy of one year = 1.48 × 10¹⁰ J/yr × 1 yr × 4.37 × 104 sej/j = 6.47 × 10¹⁴ sej;
- Emergy of one day = 6.47 × 10¹⁴ sej/365 = 1.77 × 10¹¹ sej.
2.2.2. Nonrenewable Resources
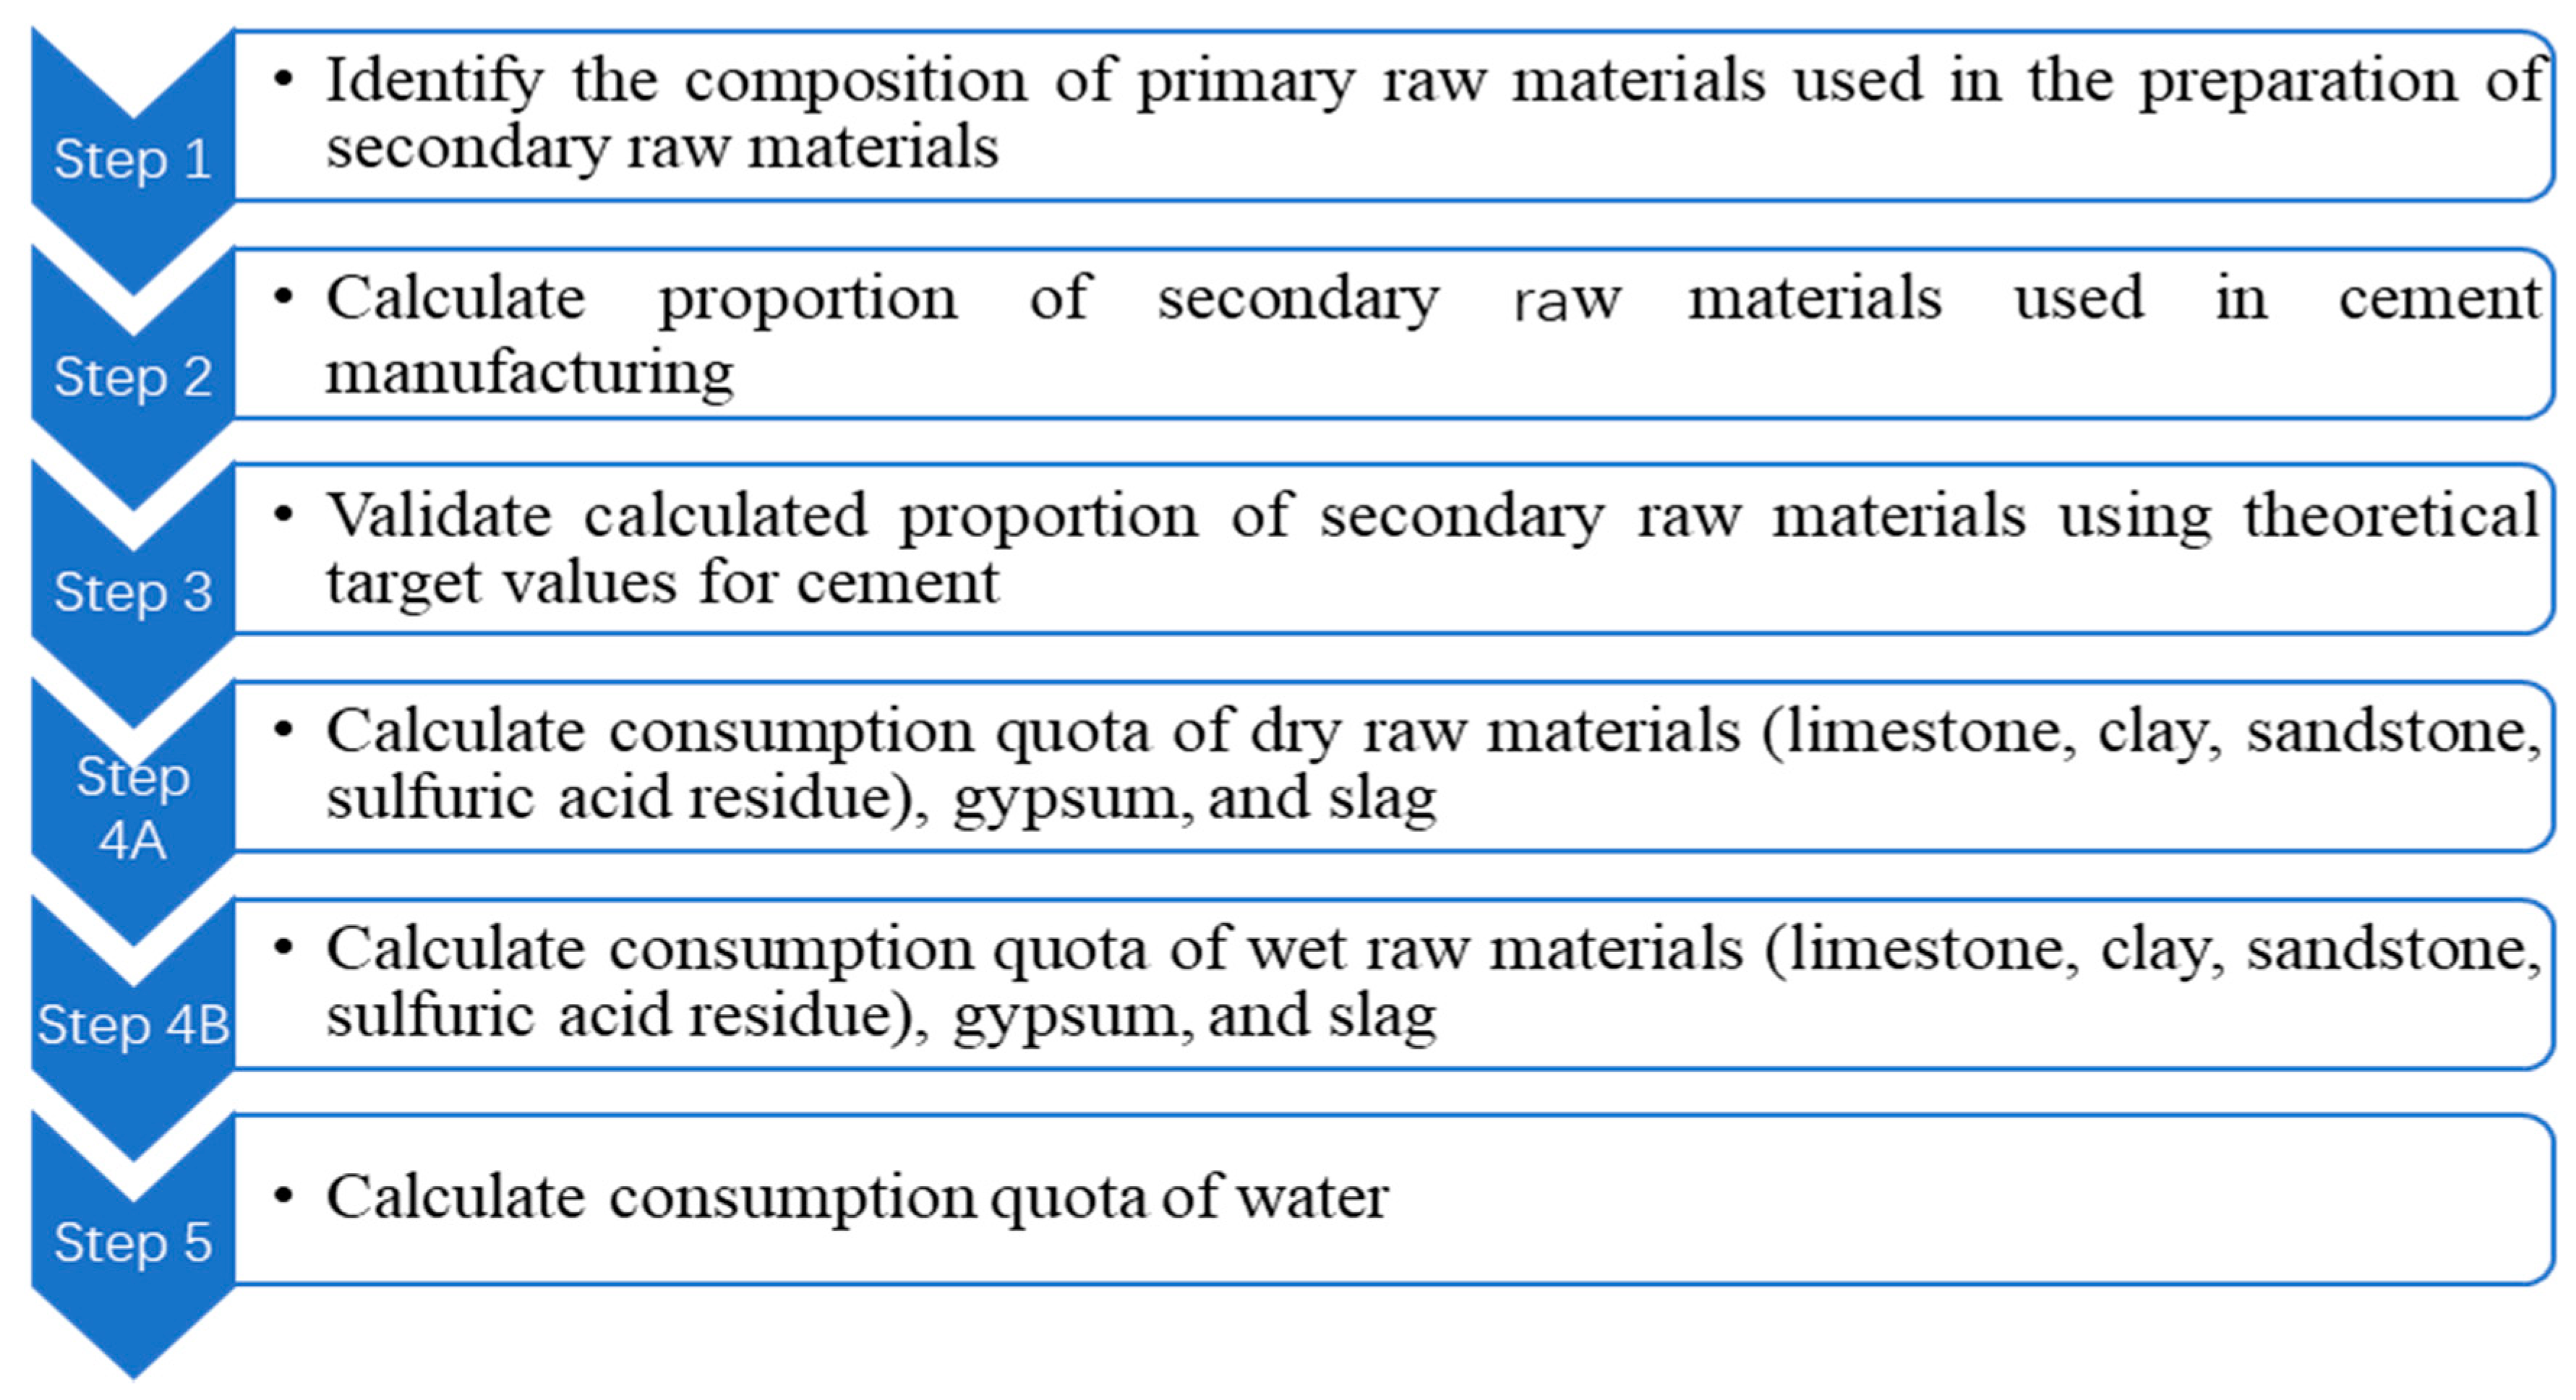
A. Consumption Quota of Dry and Wet Secondary Raw Materials Used in Cement Manufacturing
- q—heat consumption of clinker, KJ/Kg-cl;
- unit heat consumption of clinker = 0.12 × 20,900 = 2508 Kj/Kg-cl;
- Ay—ash of fuel air, %;
- s—coal ash sinking rate, 100%;
- Qy—low calorific value of coal, 20,900 KJ/Kg.
- I—Loss of dry raw material (%);
- s—coal ash amount (%).
- P—loss of the dry raw materials (%), Reasonable value is 3%;
- A—proportion of dry raw materials (%).
- Four dry raw material consumption quotas:
- Klimestone = 1.513 × 0.82 = 1.241 g/g-cl;
- Kclay = 1.513 × 0.05 = 0.076 g/g-cl;
- Ksandstone = 1.513 × 0.12 = 0.182 g/g-cl;
- Ksulfuric acid residue = 1.513 × 0.02 = 0.030 g/g-cl.
- d, e—gypsum amount and mixed materials in cement (%);
- p—cement production loss (%), value = 3%.
- d, e—slag amount and mixed materials in cement (%);
- p—Cement production loss (%), value = 3% [46].
B. Calculate Consumption Quota of Wet Raw Materials
2.2.3. Energy
2.2.4. Electricity Used in Both Dry and Wet Materials-Based Cement Manufacturing
- Gy—cement factory-scale (t/a);
- d—slag amount in cement (%);
- e—mixed materials in cement (%);
- p—cement production loss (%), value = 5%.
- Qy—required annual output of clinker (t/a);
- Qh—production of selected kiln (t/(n·h));
- β—annual utilization rate of the kiln (0.85);
- 8760—the number of hours throughout the year.
- Qd—daily output of clinker (t/d).
- Manual quota and machine quota
2.2.5. Labor and Service
3. Results and Discussions
3.1. UEVs’ Calculation of a Whole Cement Production Line of 5500 t/d
3.2. Emergy Indicators
- (1)
- Renewability rate (R%) is 0.03% of wet material and 0.04% of dry material, which demonstrates the poor renewable energy input for the evaluated system.
- (2)
- Non-renewability rate of local resource (N%) reveals the ratio (0.8262 and 0.8276) of wet material and dry material, and the result illustrates the excessive local resource input and has caused huge pressure on the local environment.
- (3)
- Environmental loading ratios (ELR) are 2390 (wet material) and 2300 (dry material), which show the excessive pressure on the system and some measures should carefully considered to decrease the ELR.
- (4)
- Emergy yield ratios (EYR) are 15.7 and 15.8, representing the competitive ability of the evaluated system. It needs to balance the relationship between the total emergy section and the purchased emergy for the sustainability of the evaluated cement manufacturing.
- (5)
- Emergy sustainability index (ESI) are 0.0066 and 0.0069. They express the poor comprehensive effect on the environment for the evaluated system, and the ESI of cement manufacturing has an unsustainable status in the long term.
4. Conclusions
Author Contributions
Funding
Conflicts of Interest
Appendix A
A1. Cement Composition

| No. | Unit | Meanings |
|---|---|---|
| 1 | Sej | Solar emjoules |
| 2 | sej/yr | Average annual emergy |
| 3 | m2 | Cement plant area |
| 4 | J/m2/yr | Annual average energy per unit area |
| 5 | J/yr | Annual mean energy |
| 6 | m/yr | Average annual rainfall |
| 7 | sej/j | Unit emergy value |
| 8 | kg/m3 | Density unit |
| 9 | J/kg | Water Gibbs free energy unit |
| 10 | m/s | Wind velocity unit |
| 11 | Kj/Kg-cl | Energy consumed per kilogram of clinker |
| 12 | g/g-cl | Energy consumed per gram of clinker |
| 13 | KJ/Kg | Energy of 1 kg substance |
| 14 | t/day | Daily production of cement |
| 15 | t/a | The cement produced every year |
| 16 | t/h | Hourly cement output |
| 16 | t/(n·h) | Production of selected kiln |
| 17 | CNY/t | RMB per ton of cement |
| 18 | kWh/t | Electricity consumption per ton of cement |
| 19 | sej/kg | Emergy value per kilogram |
References
- Raposo, C.; Rodrigues, F.; Rodrigues, H. BIM-based LCA assessment of seismic strengthening solutions reinforced concrete precast industrial buildings. Innov. Infrastruct. Solut. 2019, 4, 51. [Google Scholar] [CrossRef]
- Saade, M.R.M.; Guest, G.; Amor, B. Comparative whole building LCAs: How far are our expectations from the documented evidence? Build. Environ. 2020, 167, 106449. [Google Scholar] [CrossRef]
- Kamali, M.; Hewage, K.; Sadiq, R. Conventional versus modular construction methods: A comparative cradle-to-gate LCA for residential buildings. Energy Build. 2019, 204, 109479. [Google Scholar] [CrossRef]
- Zhang, Y.; Yan, D.; Hu, S.; Guo, S. Modelling of energy consumption and carbon emission from the building construction sector in China, a process-based LCA approach. Energy Policy 2019, 134, 110949. [Google Scholar] [CrossRef]
- Morales, M.; Moraga, G.; Kirchheim, A.P.; Passuello, A. Regionalized inventory data in LCA of public housing: A comparison between two conventional typologies in southern Brazil. J. Clean. Prod. 2019, 238, 117869. [Google Scholar] [CrossRef]
- Shah, S.M.; Liu, G.; Yang, Q.; Wang, X.; Casazza, M.; Agostinho, F.; Lombardi, G.V.; Giannetti, B.F. Emergy-based valuation of agriculture ecosystem services and dis-services. J. Clean. Prod. 2019, 239, 118019. [Google Scholar] [CrossRef]
- Pan, H.; Zhuang, M.; Geng, Y.; Wu, F.; Dong, H. Emergy-based ecological footprint analysis for a mega-city: The dynamic changes of Shanghai. J. Clean. Prod. 2019, 210, 552–562. [Google Scholar] [CrossRef]
- Srinivasan, R.S.; Braham, W.W.; Campbell, D.E.; Curcija, C.D. Re(De)fining Net Zero Energy: Renewable Emergy Balance in environmental building design. Build. Environ. 2012, 47, 300–315. [Google Scholar] [CrossRef]
- Shen, J.; Zhang, X.; Lv, Y.; Yang, X.; Wu, J.; Lin, L.; Zhang, Y. An improved emergy evaluation of the environmental sustainability of China’s steel production from 2005 to 2015. Ecol. Indic. 2019, 103, 55–69. [Google Scholar] [CrossRef]
- Wu, Z.; Di, D.; Wang, H.; Wu, M.; He, C. Analysis and emergy assessment of the eco-environmental benefits of rivers. Ecol. Indic. 2019, 106, 105472. [Google Scholar] [CrossRef]
- Srinivasan, R.S.; Ingwersen, W.; Trucco, C.; Ries, R.; Campbell, D. Comparison of energy-based indicators used in life cycle assessment tools for buildings. Build. Environ. 2014, 79, 138–151. [Google Scholar] [CrossRef]
- Brown, M.T.; Buranakarn, V. Emergy indices and ratios for sustainable material cycles and recycle options. Resour. Conserv. Recycl. 2003, 38, 1–22. [Google Scholar] [CrossRef]
- Fan, Y.P.; Qiao, Q.; Fang, L.; Yao, Y. Emergy analysis on industrial symbiosis of an industrial park–a case study of Hefei economic and technological development area. J. Clean. Prod. 2017, 141, 791–798. [Google Scholar] [CrossRef]
- Odum, H.T. Environmental Accounting Emergy and Environmental Decision Making; Wiley: West New York, NJ, USA, 1996. [Google Scholar]
- Brown, M.; Ulgiati, S. Emergy measures of carrying capacity to evaluate economic investment. Popul. Environ. 2001, 22, 471–501. [Google Scholar] [CrossRef]
- Liu, Z.; Geng, Y.; Wang, H.; Sun, L.; Ma, Z.; Tian, X.; Yu, X. Emergy-based comparative analysis of energy intensity in different industrial systems. Environ. Sci. Pollut. Res. 2015, 22, 18687–18698. [Google Scholar] [CrossRef] [PubMed]
- Srinivasan, R.S.; Campbell, D.E.; Wang, W. Renewable Substitutability Index: Maximizing Renewable Resource Use in Buildings. Buildings 2015, 5, 581–596. [Google Scholar] [CrossRef]
- Yi, H.; Srinivasan, R.S.; Braham, W.W. An integrated energyeemergy approach to building form optimization: Use of EnergyPlus, emergy analysis and Taguchi-regression method. Build. Environ. 2015, 84, 89–104. [Google Scholar] [CrossRef]
- Yi, H.; Srinivasan, R.S.; Braham, W.W.; Tilley, D.R. An ecological understanding of net-zero energy building: Evaluation of sustainability based on emergy theory. J. Clean. Prod. 2017, 143, 654–671. [Google Scholar] [CrossRef]
- Yi, H.; Braham, W.W.; Tilley, D.R.; Srinivasan, R. A metabolic network approach to building performance: Information building modeling and simulation of biological indicators. J. Clean. Prod. 2017, 165, 1133–1162. [Google Scholar] [CrossRef]
- Yi, H.; Brahamb, W.W.; Tilley, D.R.; Srinivasan, R. Measuring ecological characteristics of environmental building performance: Suggestion of an information-network model and indices to quantify complexity, power, and sustainability of energetic organization. Ecol. Indic. 2017, 83, 201–217. [Google Scholar] [CrossRef]
- Wang, Q.; Ma, Z.; Yuan, X.; Wang, J.; Mu, Z.; Zuo, J.; Zhang, J.; Hong, J.; Wang, S. Is cement pavement more sustainable than permeable brick pavement. A case study for Jinan, China. J. Clean. Prod. 2019, 226, 306–315. [Google Scholar] [CrossRef]
- Li, D.; Zhu, J.; Hui, E.C.M.; Leung, B.Y.P.; Li, Q. An emergy analysis-based methodology for eco-efficiency evaluation of building Manufacturing. Ecol. Indic. 2011, 11, 1419–1425. [Google Scholar] [CrossRef]
- National Bureau of Statistics of China. China Statistical Yearbook 2019. 2019. Available online: http://www.stats.gov.cn/tjsj/ndsj/2015/indexch.htm (accessed on 16 September 2019). (In Chinese)
- Ministry of Environmental Protection of People’s Republic of China. 2015. Available online: http://www.mee.gov.cn/hjzl/ (accessed on 1 January 2020). (In Chinese)
- Chen, W.; Liu, W.; Geng, Y.; Ohnishi, S.; Sun, L.; Han, W.; Tian, X. Life cycle based emergy analysis on China’s cement production. J. Clean. Prod. 2016, 131, 272–279. [Google Scholar] [CrossRef]
- Zhang, X.; Shen, J.; Wang, Y.; Qi, Y.; Liao, W.; Shui, W.; Li, L.; Qi, H.; Yu, X. An environmental sustainability assessment of China’s cement industry based on emergy. Ecol. Indic. 2017, 72, 452–458. [Google Scholar] [CrossRef]
- Song, D.; Chen, B. Sustainability evaluation of a typical cement production chain in China-An emergy perspective. Energy Procedia 2016, 104, 98–103. [Google Scholar] [CrossRef]
- Brown, M.T.; Ulgiati, S. Assessing the global environmental sources driving the geo-biosphere: A revised emergy baseline. Ecol. Model. 2016, 339, 126–132. [Google Scholar] [CrossRef]
- Lu, Y.M.; Yue, T.X.; Chen, C.F.; Fan, Z.M.; Wang, Q.M. Solar radiation modeling based on stepwise regression analysis in China. J. Remote Sens. 2010, 14, 852–864. [Google Scholar]
- Anhui Conch Cement Company Limited. 2018 Annual Report; Anhui Conch Cement Company Limited: Wuhu, China, 2018; p. 22. [Google Scholar]
- Gao, G.; Chen, D.L.; Xu, C.Y.; Simelton, E. Trend of estimated actual evapotranspiration over China during 1960–2002. J. Geophys. Res. 2007, 112, D11120. [Google Scholar] [CrossRef]
- Lou, B.; Ulgiati, S. Identifying the environmental support and constraints to the Chinese economic growth-an application of the emergy accounting method. Energy Policy 2013, 55, 217–233. [Google Scholar] [CrossRef]
- Campbell, D.; Andrew, O. Environmental Accounting Using Emergy: Evaluation of Minnesota; EPA/600/R-09/002; US Environmental Protection Agency: Narragansett, RI, USA, 2009.
- Lu, H.; Campbell, D.E.; Chen, J.; Qin, P.; Hai, R. Conservation and economic vitality of nature reserves: An emergy evaluation of the yancheng biosphere reserve. Biol. Conserv. 2007, 139, 415–438. [Google Scholar] [CrossRef]
- Miller, B.I. A Study of the Filling of Hurricane Donna over Land (2000). In Monthly Weather Review; U.S. Department of Agriculture: Washington, DC, USA, 1964; Volume 92, pp. 389–406. [Google Scholar]
- Kraus, E.B. Atmosphere–Ocean Interaction. Oxford Monographs on Meteorology; U.K. Clarendon Press: Oxford, UK, 1972; p. 275. [Google Scholar]
- Brown, M.T.; Bardi, E. Handbook of Emergy Evaluation: A Compendium of Data for Emergy Computation in a Series of Folios, Folio. #3; Center for Environmental Policy, University of Florida: Gainesville, FL, USA, 2001. [Google Scholar]
- National Standardization Administration. General Portland Cement Standard, GB175; National Standardization Administration: Beijing, China, 2007.
- National Standardization Administration. Chemical Analysis Method of Limestone and Dolomite, GBT_3286.2; National Standardization Administration: Beijing, China, 2012.
- National Standardization Administration. National standard for bauxite ore, GB 24483; National Standardization Administration: Beijing, China, 2009.
- National Standardization Administration. Siliceous Sandstone Standard, GBW03112; National Standardization Administration: Beijing, China, 1998.
- National Standardization Administration. Industrial Sulfuric Acid, GBT 534; National Standardization Administration: Beijing, China, 2014.
- National Standardization Administration. Industrial Analysis Method of Coal, GB/T212; National Standardization Administration: Beijing, China, 2008.
- National Standardization Administration. Chemical Analysis Method of Gypsum, GB5484; National Standardization Administration: Beijing, China, 2000.
- National Standardization Administration. Blast Furnace Slag Powder in Cement and Concrete, GB/T/18046; National Standardization Administration: Beijing, China, 2008.
- Wei, S. Cement Technology (Rearrangement Version); Wuhan University of Technology Press: Wuhan, China, 2010. [Google Scholar]
- National Standardization Administration. Calculation method of heat balance, thermal efficiency and comprehensive energy consumption of cement rotary kiln, JC/T730-2007; National Standardization Administration: Beijing, China, 2020.
- De Quan, C. Principle and Application of New Dry Process Cement Technology; China Building Materials Industry Press: Beijing, China, 2004. [Google Scholar]
- National Standardization Administration. Fly ash used in cement and concrete, GB/T 1596; National Standardization Administration: Beijing, China, 2017.
- National Standardization Administration. General rules for comprehensive energy consumption calculation, GBT2589; National Standardization Administration: Beijing, China, 2008.
- National Standardization Administration. Cement unit product energy consumption limit and calculation method, DB33/ 645; National Standardization Administration: Beijing, China, 2007.
- Brown, M.T.; Protano, G.; Ulgiati, S. Assessing geobiosphere work of generating global reserves of coal, crude oil, and natural gas. Ecol. Model. 2011, 222, 879–887. [Google Scholar] [CrossRef]
- Brown, M.T.; Raugei, M.; Ulgiati, S. On boundaries and ‘investments’ in emergy synthesis and LCA: A case study on thermal vs. photovoltaic electricity. Ecol. Indic. 2012, 15, 227–235. [Google Scholar] [CrossRef]
- Buenfil, A.A. Emergy Evaluation of Water. Ph.D. Thesis, University of Florida, Gainesville, FL, USA, 2001. [Google Scholar]


| Author, Year | Building Type | Remarks | ||
|---|---|---|---|---|
| Dezhi et al., 2011 [23] | Six residential buildings | 1 | Concrete building, 5 storeys, 3225 m2 | Beijing city |
| 2 | Concrete building, 12 storeys, 9903.44 m2 | |||
| 3 | Concrete building, 21 storeys, 0.59 m2 | |||
| 4 | Concrete building, 4 storeys, 2017.21 m2 | Shanghai city | ||
| 5 | Concrete building, 11 storeys, 5011.95 m2 | |||
| 6 | Concrete building, 15 storeys, 7435.88 m2 | |||
| Author | Basic Data Source | Emergy Baseline (Sej/yr) | Raw materials | UEVs of Cement (Sej/kg) | ||||||
|---|---|---|---|---|---|---|---|---|---|---|
| Limestone | Gypsum | Sandstone | Clay | Pyrite Cinder | Water | Fly Ash | ||||
| Wei et al., 2016 [26] | One cement plant | 12.0 × 1024 | ☑ | ☑ | ☑ | × | ☑ | ☑ | ☑ | 1.93 × 10¹² |
| Xiao et al., 2017 [27] | The entire data of 2010 | 15.83 × 1024 | × | ☑ | ☑ | ☑ | × | ☑ | × | 3.64 × 10¹² |
| Song and Chen, 2016 [28] | One cement plant | 15.83 × 1024 | ☑ | ☑ | ☑ | × | ☑ | × | ☑ | 3.05 × 10¹² |
| Secondary Raw Materials Used in Cement | Primary Raw Materials (Chemical Composition) | |||||||
|---|---|---|---|---|---|---|---|---|
| Loss | SiO2 | Al2O3 | Fe2O3 | CaO | MgO | SO3 | ∑ | |
| Limestone | 41.98 | 3.20 | 0.52 | 0.11 | 53.10 | 0.53 | 0.05 | 99.62 |
| Clay | 13.37 | 31.42 | 33.21 | 15.16 | 0.48 | 1.13 | - | 94.95 |
| Sandstone | 3.53 | 83.83 | 8.66 | 1.65 | 0.15 | 0.16 | 0.02 | 99.60 |
| Sulfuric acid residue | 0.58 | 5.00 | 5.29 | 68.21 | 5.96 | 3.12 | 8.59 | 97.03 |
| Secondary Raw Materials Used in Cement | Loss | SiO2 | Fe2O3 | Al2O3 | CaO | MgO | K2O | Na2O | SO3 | ∑ |
|---|---|---|---|---|---|---|---|---|---|---|
| Gypsum | 9.12 | 16.75 | 0.97 | 4.85 | 25.12 | 1.02 | 0.88 | 0.50 | 39.64 | 99.80 |
| Limestone | Clay | Sandstone | Sulfuric Acid Residue | Coal | Gypsum | Slag |
|---|---|---|---|---|---|---|
| 1.50 | 1.00 | 15.00 | 17.60 | 8.00 | 4.00 | 8.00 |
| Raw Material | Proportion | Loss | SiO2 | Al2O3 | Fe2O3 | CaO | MgO | SO3 | ∑ |
|---|---|---|---|---|---|---|---|---|---|
| Limestone | 0.82 | 35.12 | 2.75 | 0.47 | 0.09 | 44.23 | 0.51 | 0.07 | 83.24 |
| Clay | 0.05 | 0.56 | 1.31 | 1.33 | 0.62 | 0.02 | 0.06 | 0.00 | 3.90 |
| Sandstone | 0.12 | 0.42 | 9.63 | 0.98 | 0.19 | 0.03 | 0.03 | 0.00 | 11.28 |
| Sulfuric acid residue | 0.02 | 0.01 | 0.07 | 0.09 | 1.05 | 0.11 | 0.05 | 0.14 | 1.52 |
| Dry raw material | 1.00 | 36.11 | 13.76 | 2.87 | 1.95 | 44.39 | 0.65 | 0.21 | 99.94 |
| Raw material after burning | - | - | 21.53 | 4.49 | 3.05 | 69.47 | 1.02 | 0.33 | 99.89 |
| Program | Proportion | SiO2 | Al2O3 | Fe2O3 | CaO | MgO | SO3 | ∑ |
|---|---|---|---|---|---|---|---|---|
| Burning base material | 96.54% | 20.79 | 4.33 | 2.94 | 67.07 | 0.98 | 0.32 | 96.43 |
| Coal ash composition | 3.46% | 1.94 | 0.91 | 0.35 | 0.04 | 0.04 | 0.10 | 3.38 |
| Clinker composition | 100% | 22.64 | 5.24 | 3.29 | 67.11 | 1.02 | 0.42 | 99.81 |
| Limestone | Clay | Sandstone | Sulfuric Acid Residue |
|---|---|---|---|
| 82% | 5.0% | 12% | 2.0% |
| Consumption Quota g/g-cl | Limestone | Clay | Sandstone | Sulfuric Acid Residue | ∑ |
|---|---|---|---|---|---|
| 1.260 | 0.077 | 0.214 | 0.033 | 1.584 |
| Wet Raw Material | Limestone | Clay | Sandstone | Sulfuric Acid Residue | ∑ |
|---|---|---|---|---|---|
| Proportion | 0.832 | 0.051 | 0.141 | 0.024 | 1.048 |
| Percentage | 79.4% | 4.9% | 13.5% | 2.2% | 100% |
| Cement | e % | d % | P % | K Dry Slag (g/g-cl) | Kwet Slag (g/g-cl) |
|---|---|---|---|---|---|
| Standard cement | 4 | 5 | 3 | 0.0453 | 0.0492 |
| Limestone | Clay | Sandstone | Sulfuric Acid Residue | Coal | Gypsum | Slag |
|---|---|---|---|---|---|---|
| 1.50 | 1.00 | 15.00 | 17.60 | 8.00 | 4.00 | 8.00 |
| Secondary Raw Material Used in Cement | Primary Raw Materials (Chemical Composition) | |||||||
|---|---|---|---|---|---|---|---|---|
| Loss | SiO2 | Al2O3 | Fe2O3 | CaO | MgO | SO3 | ∑ | |
| Coal | - | 56.12 | 26.40 | 10.00 | 1.12 | 1.19 | 3.02 | 98.25 |
| Name | Moisture | Ash | Volatile Ratio | Calorific Value |
|---|---|---|---|---|
| coal | 1.10 | 25.30 | 8.80 | 20,900 kJ/kg |
| Name | Type | Production (t/h) | Number (n) | Running Time per Week (h/w) |
|---|---|---|---|---|
| Limestone crusher | TKLPC2022.F | 700 | 1 | 72 |
| Raw mill | TRM53.4 | 430 | 1 | 157 |
| Rotary kiln | Φ4.8 × 72 m | 229.2 | 1 | 168 |
| Coal mill | HRM2200 | 45 | 1 | 168 |
| Dryer | φ2.4 × 18 m | 24.4 | 2 | 157 |
| Cement mill | φ4.2 × 13 m | 155 | 2 | 157 |
| Cement packaging machine | BX-8WY | 100 | 4 | 84 |
| Name | Moisture (%) | Loss (%) | Consumption Quota (g/g-cl) | Material Calculation Table (t) | ||
|---|---|---|---|---|---|---|
| Dry Material | Wet Material | |||||
| Dry Material | Wet Material | Day | Day | |||
| Limestone | 1.50 | - | 1.241 | 1.26 | 3681.49 | 3583.25 |
| Clay | 1.00 | - | 0.076 | 0.077 | 225.46 | 218.98 |
| Sandstone | 15.00 | - | 0.182 | 0.214 | 539.91 | 608.58 |
| Sulfuric acid residue | 17.60 | - | 0.03 | 0.033 | 88.99 | 93.847 |
| Raw material | - | 3.00 | 1.529 | 1.584 | 4535.87 | 4504.65 |
| Gypsum | 4.00 | 3.00 | 0.057 | 0.059 | 169.09 | 167.79 |
| Slag | 8.00 | 3.00 | 0.045 | 0.049 | 133.49 | 139.35 |
| Coal | 8.00 | 3.00 | 0.12 | 0.131 | 660 | 720.5 |
| Standard cement | - | - | - | - | 5500 | 5500 |
| Electricity | - | - | 88 kWh/t [52] | 4.84 × 10⁵ kWh | 4.84 × 10⁵ kWh | |
| Item | Wet Material Quantity | Dry Material Quantity | UEVs (sej/unit) | Ref. | Wet Material Emergy (sej) | Dry Material Emergy (sej) |
|---|---|---|---|---|---|---|
| Limestone | 1260 kg | 1241 kg | 1.27 × 10¹² | [12] | 1.60 × 10¹⁵ | 1.58 × 10¹⁵ |
| Clay | 77 kg | 76 kg | 1.27 × 10¹² | [12] | 9.78 × 10¹³ | 9.65 × 10¹³ |
| Sandstone | 214 kg | 182 kg | 1.42 × 10¹² | [14] | 3.04 × 10¹⁴ | 2.58 × 10¹⁴ |
| Slag | 49 kg | 48 kg | 1.68 × 10¹² | [12] | 5.49 × 10¹³ | 5.38 × 10¹³ |
| Gypsum | 59 kg | 57 kg | 1.27 × 10¹² | [12] | 7.49 × 10¹³ | 7.24 × 10¹³ |
| Sulfuric acid residue | 33 kg | 30 kg | 1.68 × 10¹² | [12] | 5.54 × 10¹⁰ | 5.04 × 10¹⁰ |
| Standard coal | 2.74 × 10⁹ J | 2.51 × 10⁹ J | 8.77 × 10⁴ | [53] | 2.41 × 10¹⁴ | 2.21 × 10¹⁴ |
| Labor and service | ¥25.68 | ¥25.68 | 1.06 × 10¹¹ | [33] | 2.72 × 10¹² | 2.72 × 10¹² |
| Electricity | 3.168 × 10⁸ J | 3.168 × 10⁸ J | 4.5 × 10⁵ | [54] | 1.43 × 10¹⁴ | 1.43 × 10¹⁴ |
| Materials Name | Wet Material Quantity | Dry Material Quantity | UEVs (sej/unit) | Ref. | Wet Material Emergy (sej) | Dry Material Emergy (sej) |
|---|---|---|---|---|---|---|
| Renewable Resources | ||||||
| Sunlight | 1.39 × 10¹¹ J | 1 | [14] | 1.39 × 10¹¹ | ||
| Geothermal heat | 4.05 × 10⁶ J | 4.37 × 10⁴ | [38] | 1.77 × 10¹¹ | ||
| Rain, geopotential | 3.12 × 10⁷ J | 1.31 × 10⁴ | [34] | 4.09 × 10¹¹ | ||
| Rain, chemical | 7.45 × 10⁶ J | 2.35 × 10⁴ | [35] | 1.75 × 10¹¹ | ||
| Wind energy | 4.85 × 10⁶ J | 1.90 × 10³ | [38] | 9.21 × 10⁹ | ||
| Nonrenewable Resources | ||||||
| Limestone | 1260 kg | 1241 kg | 1.27 × 10¹² | [12] | 1.60 × 10¹⁵ | 1.58 × 10¹⁵ |
| Clay | 77 kg | 76 kg | 1.27 × 10¹² | [14] | 9.78 × 10¹³ | 9.65 × 10¹³ |
| Sandstone | 214 kg | 182 kg | 1.42 × 10¹² | [12] | 3.04 × 10¹⁴ | 2.58 × 10¹⁴ |
| Slag | 49 kg | 48 kg | 1.68 × 10¹² | [12] | 8.23 × 10¹³ | 8.06 × 10¹³ |
| Gypsum | 59 kg | 57 kg | 1.27 × 10¹² | [12] | 7.49 × 10¹³ | 7.24 × 10¹³ |
| Sulfuric acid Residue | 33 kg | 30 kg | 1.68 × 10¹² | [12] | 5.54 × 10¹³ | 5.04 × 10¹³ |
| Water | 369 kg | 4.94 × 10¹⁰ | [55] | 1.82 × 10¹³ | ||
| Energy | ||||||
| Standard coal | 2.74 × 10⁹ J | 2.51 × 10⁹ J | 8.77 × 10⁴ | [53] | 2.41 × 10¹⁴ | 2.21 × 10¹⁴ |
| Electricity | 3.168 × 10⁸ J | 3.168 × 10⁸ J | 4.5 × 10⁵ | [54] | 1.43 × 10¹⁴ | 1.43 × 10¹⁴ |
| Labor and Service | ||||||
| Labor and service | ¥25.68 | ¥25.68 | 1.06 × 10¹¹ | [33] | 2.72 × 10¹² | 2.72 × 10¹² |
| Item | Wet Material Emergy (sej) | Dry Material Emergy (sej) | Total Emergy of Wet Material | Total Emergy of Dry Material | Wet Material Proportion (%) | Dry Material Proportion (%) |
|---|---|---|---|---|---|---|
| Renewable Resources | 0.04% | 0.04% | ||||
| Sunlight | 1.39 × 10¹¹ | 9.09 × 10¹¹ sej | 0.04% | 0.04% | ||
| Geothermal heat | 1.77 × 10¹¹ | |||||
| Rain, geopotential | 4.09 × 10¹¹ | |||||
| Rain, chemical | 1.75 × 10¹¹ | |||||
| Wind energy | 9.21 × 10⁹ | |||||
| Nonrenewable Resources | 84.84% | 85.04% | ||||
| Limestone | 1.60 × 10¹⁵ | 1.58 × 10¹⁵ | 2.17 × 10¹⁵ sej | 2.09 × 10¹⁵ sej | 62.56% | 64.29% |
| Clay | 9.78 × 10¹³ | 9.65 × 10¹³ | 3.82% | 3.93% | ||
| Sandstone | 3.04 × 10¹⁴ | 2.58 × 10¹⁴ | 11.89% | 10.5% | ||
| Slag | 8.23 × 10¹³ | 8.06 × 10¹³ | 3.22% | 3.28% | ||
| Gypsum | 7.49 × 10¹³ | 7.24 × 10¹³ | 2.93% | 2.95% | ||
| Sulfuric acid residue | 5.54 × 10¹³ | 5.04 × 10¹³ | 2.17% | 2.05% | ||
| Energy | 15.01% | 14.81% | ||||
| Coal | 2.41 × 10¹⁴ | 2.21 × 10¹⁴ | 2.41 × 10¹⁴ sej | 2.21 × 10¹⁴ sej | 9.42% | 8.99% |
| Electricity | 1.43 × 10¹⁴ | 1.43 × 10¹⁴ | 1.43 × 10¹⁴ sej | 5.59% | 5.82% | |
| Labor | 0.11% | 0.11% | ||||
| Labor and service | 2.72 × 10¹² | 2.72 × 10¹² | 2.72 × 10¹² sej | 0.11% | 0.11% | |
| Total | - | - | 2.56 × 10¹⁵ | 2.46 × 10¹⁵ | 100% | 100% |
| UEV | 2.56 × 10¹² sej/kg for wet material; 2.46 × 10¹² sej/kg for dry material | |||||
| No. | Items | Indicators | Calculated Results | |
|---|---|---|---|---|
| Wet Material | Dry Material | |||
| 1 | Renewability rate | R% | 0.03% | 0.04% |
| 2 | Non-renewability rate of local resource | N% | 82.62% | 82.76% |
| 3 | Environmental loading ratio | ELR | 2390 | 2300 |
| 4 | Emergy yield rate | EYR | 15.7 | 15.8 |
| 5 | Emergy sustainability index | ESI | 0.0066 | 0.0069 |
© 2020 by the authors. Licensee MDPI, Basel, Switzerland. This article is an open access article distributed under the terms and conditions of the Creative Commons Attribution (CC BY) license (http://creativecommons.org/licenses/by/4.0/).
Share and Cite
Zhang, J.; S. Srinivasan, R.; Peng, C. A Systematic Approach to Calculate Unit Emergy Values of Cement Manufacturing in China Using Consumption Quota of Dry and Wet Raw Materials. Buildings 2020, 10, 128. https://doi.org/10.3390/buildings10070128
Zhang J, S. Srinivasan R, Peng C. A Systematic Approach to Calculate Unit Emergy Values of Cement Manufacturing in China Using Consumption Quota of Dry and Wet Raw Materials. Buildings. 2020; 10(7):128. https://doi.org/10.3390/buildings10070128
Chicago/Turabian StyleZhang, Junxue, Ravi S. Srinivasan, and Changhai Peng. 2020. "A Systematic Approach to Calculate Unit Emergy Values of Cement Manufacturing in China Using Consumption Quota of Dry and Wet Raw Materials" Buildings 10, no. 7: 128. https://doi.org/10.3390/buildings10070128
APA StyleZhang, J., S. Srinivasan, R., & Peng, C. (2020). A Systematic Approach to Calculate Unit Emergy Values of Cement Manufacturing in China Using Consumption Quota of Dry and Wet Raw Materials. Buildings, 10(7), 128. https://doi.org/10.3390/buildings10070128