1. Introduction
The reasons that push a family or a businessperson towards buying an urban property are essentially twofold: (1) to take advantage of the direct utilization of a property, when the building is either destined for residence or if it is instrumental to production; and (2) to guarantee a flow of future income and/or to achieve a capital gain, when the property is considered an asset of investment.
This study focuses on the investor’s performance, whether a real estate company or a small real estate owner, and on how taxation can influence their choices.
For this purpose, the taxes applied to transfers, income and ownership, which are differentiated in relation to the subjective requirements of the operator and the objective requirements of the asset, are examined. A model of investor behavior will then be defined by a financial equation that identifies the ratio between income and the value of real estate as the internal rate of return. This rate constitutes a minimum threshold that, if exceeded, determines the convenience of the real estate investment in comparison with alternative investments whose profit is known.
Changes in this threshold produced by changes in taxes are able to highlight the influence of the current tax regime on the demand for real estate. For the development of the model, exemplary cases of real estate transfers are therefore constructed.
The results of the analyses carried out on these cases and the subsequent comparison of the results allow for the measurement of the influence of taxation on the minimum threshold of return. A sensitivity analysis is carried out for all the possible combinations of the characteristics that distinguish, on the one hand, the categories of the subjects taken into consideration, and on the other, the real estate property.
Section 2 provides a literature review on the subject of property taxation and its effects on house prices.
Section 3 describes the tax regime in the Italian real estate market.
Section 4 illustrates the model implemented for case analyses, and
Section 5 reports the results.
Section 6 shows the results of the sensitivity analysis obtained by varying each of the combinations, including the range of the cases examined, the rates of the income, ownership and transfer taxes, in different ways. To conclude, these results are discussed in the last section.
2. Real Estate Market and Taxation
The literature review shows that an increase in property taxes generates a decrease in the price of houses [
1,
2,
3,
4,
5]; however, it should be specified that the effect of taxation varies according to the local market conditions [
6,
7], to the quality of the home [
8] and also to the use of the real estate unit—i.e., if it is used as the owner’s home or as an investment. Regarding the latter, it should be clarified that the distinction also pertains to the type of taxation. Taxation can affect transfer, ownership or income. Property taxation on secondary homes (income and ownership) has opposite qualitative effects compared to transfer taxation on owner-occupied homes [
9]. In other words, in the first case, taxation is partially capitalized in prices, while in the second case taxes are paid by the seller [
10,
11].
Transfer transaction has negative consequences on the price of houses, while income tax has a significant positive effect [
12,
13]. Vendor taxes raise prices and buyer taxes lower them [
14]. This evidence is consistent with the results of some studies that show that property taxation affects demand but does not disturb the performance of the offer [
15,
16].
Therefore, in this study, we try to examine the behavior of demand and in particular of that part of the demand that sees the property as a production asset.
When the purchase of a property is determined by the desire to obtain a profit (flow of income or capital gain), the determining factors are the ease in repositioning the asset on the market (sale or lease), location, protection against inflation, loan security, capital protection and the weight of the tax system [
17,
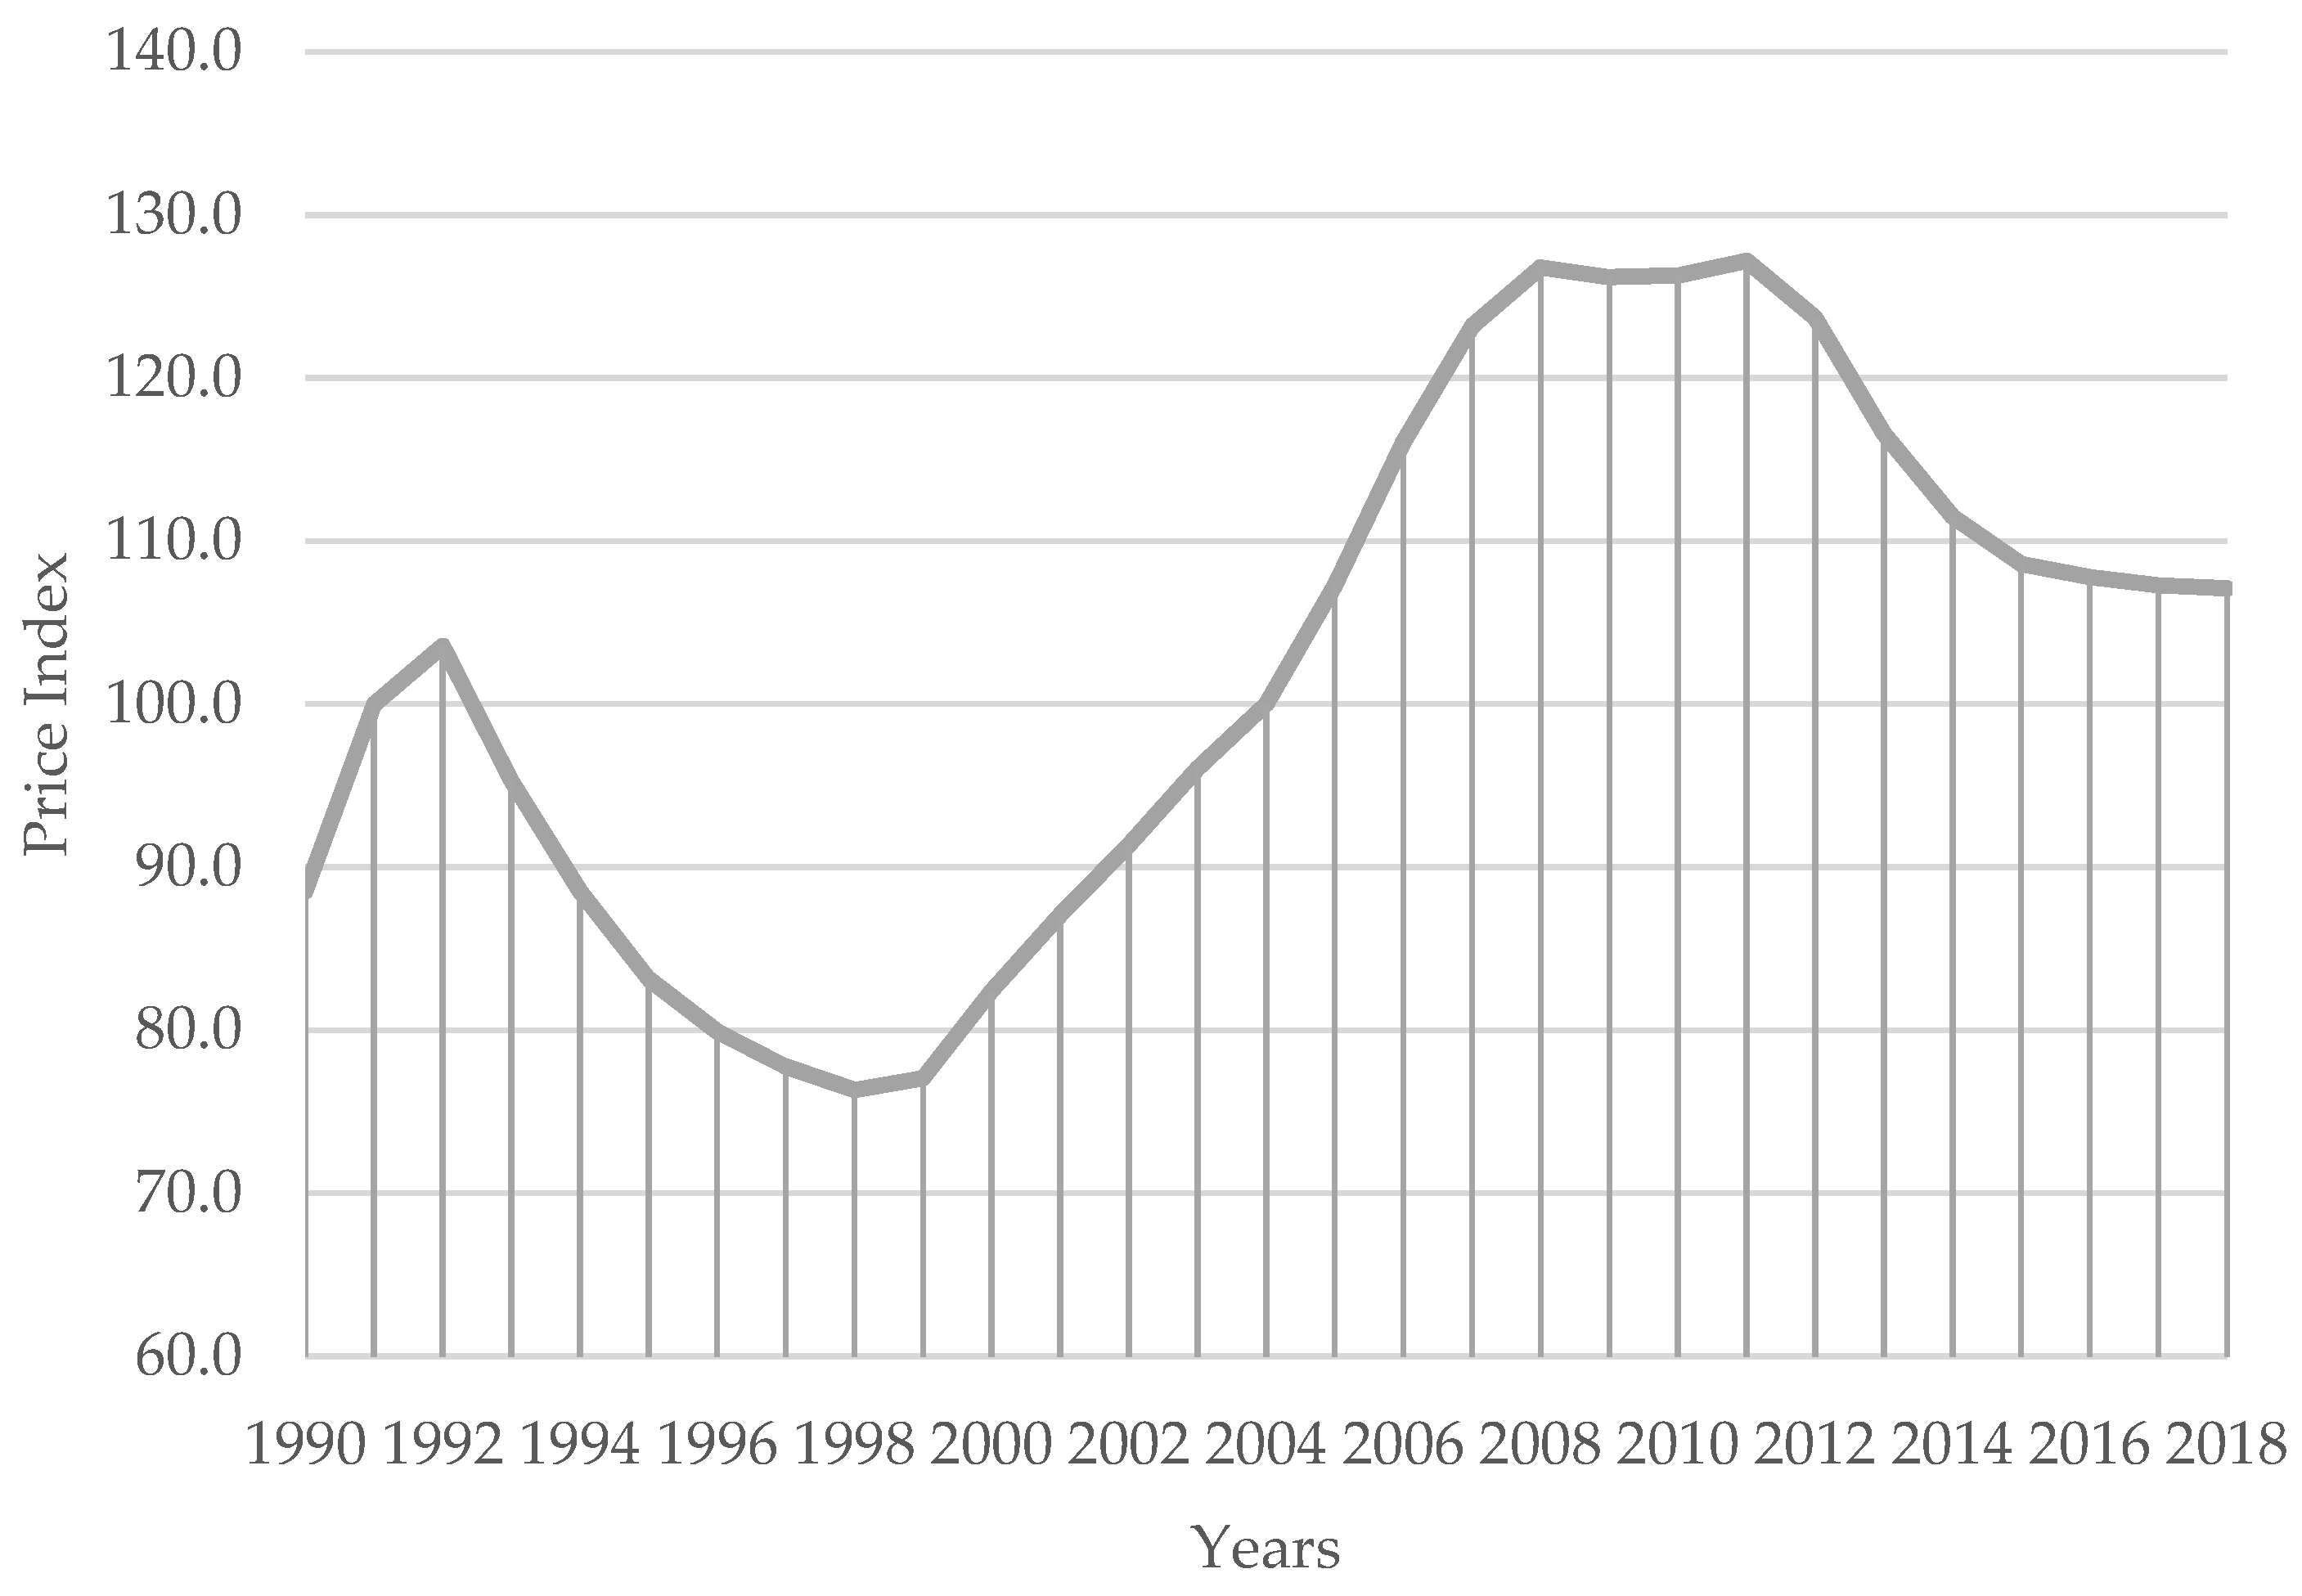
18]. This profit can be assessed by analyzing the cash flows generated by the real estate investment during the period in which the property is held. The accumulated rents and the price collected from the sale of the property at the end of the holding period are the incoming flows. Taking into account the volatility of the real estate market and its cyclical trend, the likelihood that the property increases in value compared to its purchase price (a capital gain) can obviously depend on the choice of the duration of the holding period.
Figure 1, which illustrates the change in the index of real average price of housing in Italy from 1990 to 2004, shows precisely the cyclicality of this market.
The estimation of incoming flows therefore implies the forecast of a series of factors closely linked to the volatility of the real estate market or, better still, of the two sub-markets: the sales and rental markets [
19].
Outgoing flows consist of the purchase price of the property and related expenses: maintenance and management expenses and financial and fiscal charges.
In this context, it is clear that the level of taxation is the only certain element among those that contribute to the formation of the return—at any rate, in the short term. This is a factor that could (even with small oscillations) act as a flywheel or a curb for the demand for real estate, which is undoubtedly true for the part that contains the prevailing economic component by virtue of the strong elasticity that it shows in proximity to an expected rate of return close to the rate of alternative investments [
20].
Following the economic crisis that has affected almost all global economies, an increase in property taxes has been one of the many corrections that have been applied in order to avoid the collapse of national budgets. In many countries, property taxes are a fundamental source of revenue for local and national administrations [
10,
21].
Real estate is considered a very attractive goal for the tax office because, in contrast to income, immovable property cannot be hidden [
22]. In almost all countries with modern tax systems, the basis for real estate tax is the property value. This is defined in very different ways in relation to particular social and historical circumstances [
23].
The benefits of property taxation are also recognized in those countries which do not have a comprehensive list of taxable properties and adequate data on transaction prices [
24].
3. The Tax Regime on Property in Italy
Between 2008 and 2013, the Italian tax policy brought Italy to the top of the ranking of European countries with the highest tax levy on real estate. Despite a taxation system on buildings which is very similar to that in other Euro-area countries, the level of total taxation in Italy is definitely higher.
Almost all Western economies do not include a figurative income of the main residence in the tax base. The focus of our study is not on this aspect but on the taxes that affect the purchase and holding of a residential property for investment use. In this case, the tax system common to most European countries means that income, ownership and transfer are affected by taxes. These effects are specified in more detail below.
Income tax: The income generated by ownership of the asset is the prerequisite for the application of this tax. If the property is owned by a company, the income is subject to a fixed tax percentage. In the event that the property belongs to a natural person, the income contributes to the determination of the total income and is subject to a progressive tax. For some cases of real estate units, and under certain conditions, the Italian legislation introduced the option to choose a fixed replacement tax, the so-called “cedolare secca” (flat tax). This involves compliance with the right to request, for the entire duration of the option, a revision of the rent, even if it is included in the contract. The option can be implemented for residential real estate units and leased for residential use. If a company has not opted for the “flat tax” the tax return must include the fee reduced by 5% (until 2012, the fee was reduced by 15%; the change was made in accordance with Article 4, paragraph 74, of Law No. 92/2012). This deduction represents a lump sum for the management costs of the building;
Possession tax: The requirement for this tax is the possession of an asset. This tax affects all buildings, with the exception of those used as a main residence.
Tax on public services provided to property owners: This is a tax paid to the municipalities and which concerns the indivisible municipal services; i.e., those services aimed at the entire community for which it is impossible to quantify the benefit to the individual citizen. Property taxes and taxes on public services are calculated as a percentage of the cadastral value of the property in line with the share and the months of possession of the property.
Transfer tax is a tax levied when purchasing a property (VAT, registration, mortgage, cadaster); The sale of a residential property, with some exceptions, is exempt from VAT. The exception is true in the case of buildings sold by the parties (companies) who built or restructured them. In the sale of residential properties, the principle of substitution between VAT and registration tax is applied. Mortgage taxes and cadastral taxes are fixed but vary depending on whether the sale is subject to VAT or exempt. The percentages of these two taxes and of the VAT and registration taxes, when they do not concern the purchase of a primary residence, have an equivalent measure for the buyer and are equal to about 10%. The payment of the registration tax is required for the annotation of every written deed (contracts, private writings, constitution of companies, etc.) in a public register, so as not to change the date and the content. This tax therefore also affects, as with transfers of wealth (if not subject to VAT), the property values contained in the sale or lease contracts of a building. For the cases involved here, the tax base consists of the amounts expressed in the contract. Only in the case of the sale of residential properties can the buyer—under certain conditions—request that the tax base be equal to the cadastral value and not the agreed price. When the transfer of ownership is subject to VAT, the mechanisms of control and taxation encourage contractors to write the cadastral value and not the one agreed upon in the contract. This means that, in any case, the tax on the transfer of a residential property for investment purposes has the cadastral value as the tax base at all times.
4. The Model
The model aims to measure the influence of the tax level on the choice of investment property, and it is therefore based on the analysis of the investor’s behavior.
The fundamental factors involved in the decision-making process are the return on an alternative investment, the duration of the investment (holding period), the incoming flows (rents and final sales value) and the purchase costs and expenses management. The taxes, which represent the object of this research, are part of the outgoing flows.
The income obtainable from the lease of real estate (rents) can be expressed with the use of the annual rate (which will be better defined as profitability, r) equal to the ratio between the same rents (Ri) and the price of the asset (PR).
The estimate of the sale value at the end of the holding period is based on a revaluation (or devaluation) ratio of the real estate capital, expressed by
rv in Equation (1).
where
Vi is the market value of the property at the end of the holding period (
n).
The eventual loss of value, if it were to occur, would be the consequence of contingent phenomena related to the generality of the real estate market (or segment) and not the effect of capital depreciation (aging of the building), which is taken into account in the analysis by the annual capital recovery (ACR).
Among the most effective instruments for the valuation of a real estate investment, the discounted cash flow is used, which is derived from the precedent equity valuation model or Ellwood model [
25,
26,
27,
28]. The proposed model starts precisely from the writing of a financial balance equation, on the basis of which the convenience of the real estate investment is assessed by focusing on one parameter: the minimum threshold of profitability (
Pmt). This threshold, defined by the ratio between gross rent and property value, if exceeded, determines the convenience for real estate investment.
The two terms—profitability and rate of return—which are equivalent with respect to a generic financial capital, instead assume different meanings for real estate capital. Profitability indicates the relationship between the rent and the capital value of the property. The rate of return considers not only the income from the lease but also the possible capital gain, net of all related investment costs.
The comparison between the gross profitability—the ratio between the annual market rent and the purchase price of the property—and the minimum profitability threshold defined above (Pmt) allows us to evaluate the convenience of real estate investment compared to alternative investments whose performance is known (r*).
The equation consists of terms which vary according to the objective characteristics of the goods, to the individual investor requirements and to the subjective requirements of the seller. On the one hand, in fact, by changing the actors of the real estate market, the types and percentages of tax can change; on the other hand, in relation to the investor’s attitudes, the parameters of comparison change.
When the point of view changes, the minimum threshold of profitability also changes. This is higher for companies, as their expected return on investment is higher due to their greater risk attitude, compared to that which characterizes the behavior of the small owner (or family). The latter, as an alternative to real estate investment, would probably use their savings to buy public debt securities, bonds or equity funds with guaranteed capital.
The financial analysis attempts to define the economic advantage of a real estate investment compared to an alternative investment whose performance is known (
r*). The financial balance equation is
where
PR is the market value (price);
Vc is the cadastral value of the property;
Pmt is the minimum threshold of profitability;
Lv is the percentage of loss on income for vacancies and non-collection;
Cm is the percentage of construction costs for maintenance, administrative and insurance;
ARC is the percentage of construction costs for annual recovery capital;
Pt is the percentage of possession tax;
It is the percentage of income tax;
r* is the rate of return of the alternative investment;
rv is the rate relative to the increase or decrease in a capital asset’s value (capital gain or capital loss);
Tt is the percentage of transfer tax; and
Nf is the percentage of notary fees.
The
ARC is calculated using the formula
where
u indicates the years of probable residual life of the asset. It is an exogenous variable, and its estimate depends on a series of parameters (the type and age of the building, its state of conservation).
The first part of the Equation (2) consists of two elements that together express the return: the income flows (profitability) and the increase or decrease in a capital asset’s value. Volatility in the real estate market can generate capital gain or loss at the end of the holding period. The series of the property price index shows a long-term trend of growth. In addition to this dynamic, property prices often deviate from their fundamental values, with a cyclical trend that depends on some macroeconomic variables that influence demand and/or supply, on the friction in the interaction between supply and demand and on speculation [
29,
30,
31,
32,
33].
In the first element, the gross revenue from the fees is reduced by the costs that the owner must bear for the maintenance, administration and insurance of the property (PR ∙ 2/3 ∙ (Cm + ARC)), the taxes on possession (Vc ∙ Pt) and income taxes (PR ∙ Pmt ∙ It ∙ 0.95). The costs for the administration, maintenance and insurance of the property are related to the construction cost, which is assumed here to be equal to two-thirds of the market value, assuming that the area of land has an incidence of approximately 30%. In the case of ordinary taxation (the inequality refers to this hypothesis), the income taxes are related to the contracted agreement reduced by 5%.
In the second part of the inequality (2), the principal and interest of the invested capital at the end of the holding period are included, which are calculated using the return rate of the alternative investment.
If all parameters are given in in Equation (2) with the exception of
Pmt, it can be transformed into Equation (4), where
Pmt represents the explained variable. If the profitability exceeds the calculated minimum threshold (
Pmt) in Equation (4), then the inequality is satisfied and the investment becomes convenient. Therefore,
Pmt is an indicator of the convenience of the investment; the lower this threshold, the better the investment.
The measurement of the minimum threshold of profitability (Pmt) requires that the parameters be estimated. The financial analysis is developed below based on two illustrative cases.
According to Equation (4), calculating the first derivative as a function of the holding period could help to determine the condition of convenience. By placing the first derivative as equal to zero and setting all the other variables, the most convenient holding period can be identified.
5. Analysis
The property examined is a residential apartment in the center of Salerno. Salerno is a city in the south of Italy; it is one of the provincial capitals of the Campania region, with about 135,000 inhabitants. It is located on the northern coast of the homonymous gulf.
The purchase price of the property is €300,000.00, while the cadastral value is Vc = €108,564.12. The latter is the tax base for the payment of transfer taxes. The first case assumes that the buyer is a juridical person (an entrepreneur) while the second case assumes that the investor is a natural person who, therefore, could opt—in the phase of leasing to another natural person—for the flat tax on rent.
5.1. Case 1
In relation to the two selected cases, it is reasonable to assume that some parameters of the inequality have values which oscillate in a defined interval, while other parameters a fixed measure.
Specifically, the parameters defining the property management costs and the taxation are defined with a fixed measure. The percentages of tax are different depending on the type of buyer and the type of lease. The rate of return on the alternative investment and the holding period are variable in the defined range.
In the first case, the fixed parameters are as follows:
Transfer tax (Tt) = 9%;
Possession tax (Pt) = 10.6 per million;
Income tax (It) = 24%;
Maintenance, insurance and administration costs (Cm) are defined at 1.8%;
The annual recovery capital (ARC) is calculated assuming that the residual life of the property is equal to 60 years (u); since the building is made of reinforced concrete, this is given by the difference between the maximum service life compared to the current conditions, the assumption of normal (extraordinary and ordinary) maintenance of the building (100 years) and the life already spent (40 years);
Notary fees (Nf) = 2%; and
The loss on income for vacancies and non-collection (Lv) is set equal to 4%.
Figure 2 shows the moving average calculated over a period of 15 years of the annual growth of the house price index illustrated in
Figure 1. Therefore, considering a holding period of 15 years, the average annual increase in capital value fluctuated between 0.8% and 3.2% over the last 30 years.
The first graph in
Figure 3 is constructed assuming that the annual increase in capital value is constant and roughly equivalent to the maximum average value recorded (rate
rv = 3%).
When the return on alternative investment exceeds 4%, the most convenient holding period is between 15 and 20 years. In fact, the lowest values of the minimum thresholds of profitability are recorded in this period.
The next graph (
Figure 4) shows the change in the minimum threshold of profitability according to the annual rate of increase in capital value and the rate of return of an alternative investment. The holding period is instead set to 5 years.
Figure 4 shows, as expected, that the
Pmt is directly proportional to the profitability rate of an alternative investment (opportunity cost) while it decreases when the revaluation rate of the real estate capital increases (capital gain).
It is interesting to note that when the annual increase in capital value exceeds 4%, the minimum threshold of profitability is lower, or roughly equal, to the return on alternative investment.
In some cases, the minimum profitability threshold becomes null: this means that the profitability of the property constitutes an additional value since real estate investment without profitability is already financially advantageous. The cancellation of the profitability threshold is also achieved when its variation is calculated on the basis of the annual increase rate in capital value and of the holding period (
Figure 5). The return on the alternative investment (
r*) is set at 2% in this example. The minimum threshold of profitability becomes null already from the 10th year if the annual increase in capital value is at least 4%. Even in these cases, the profitability of the property constitutes an additional value since the real estate investment is already financially convenient without a minimum threshold.
5.2. Case 2
The second case concerns the evaluation of the affordability of an investment made by a natural person who in turn acquires a residential real estate unit from another natural person.
The property considered in the example is the same as previously presented.
The case is structured in two parts: the first (case 2.1) is related to the lease of the property under ordinary taxation, while the second (case 2.2) assumes the choice of a flat tax.
It is assumed that the investor, when they opt for ordinary taxation, has a total income subject to a tax of 38%, while the single rate of 21% will apply in the case of the choice of a flat tax. The other tax items will be the same as seen in the previous case.
In the case of ordinary taxation (
Figure 6), the analysis shows a general increase in the minimum threshold of profitability, as an effect of the greater tax burden. With respect to the previous case, it seems advantageous to extend the duration of the investment. In fact, it is observed that when the holding period exceeds 15 years—in particular, for returns of alternative investment of more than 5%—the changes in the minimum threshold of profitability are almost negligible.
In the case of a flat tax (
Figure 7), the data show a general lowering of the minimum threshold of profitability that stabilizes after the 10th to 12th year. In comparison with the previous cases, we can say, in general, that the flat tax option certainly makes the investment more advantageous. However, higher returns could be achieved through the foundation of a business entity (legal person) which would enjoy a lower tax level and some tax benefits (for example, the possibility of deducting operating costs).
6. Comment on the Results and Sensitivity Analysis
The above figures show the results obtained for the cases described, depending on the characteristics of the purchaser and the seller and of property features, in order to provide indications of the impact of the taxation level on the demand for investment properties.
A comparison between
Figure 3,
Figure 6 and
Figure 7 is possible. The minimum profitability threshold is an indicator of the convenience of the real estate investment; the lower the threshold, the better the investment. Based on the current taxation regime in Italy, for the same holding period and rate of return on the alternative investment, the lowest
Pmt values are recorded when the investment is made by a legal person. When the investment is made by a family (natural person), it is better to opt for the flat tax.
The graph om
Figure 8 shows the results of the sensitivity analysis. In the inequality represented by the model, the rates of income, possession and transfer taxes are modified in an alternative way for each of the combinations included in the range of the cases examined. The weight of the individual tax items on the change in the minimum threshold of profitability, and consequently on the demand for real estate, is measured. The diagram in
Figure 8 shows the results of the sensitivity analysis, which can be generalized to be less than the ratio between the market value and the tax base of the property. This ratio, which is very important in the composition of the total measure of the actual tax burden, was excluded from the analysis because it was too variable. This ratio should be measured for each case and included in the calculation of the change in the minimum threshold of profitability. In each case, the diagram shows, for an equal percentage change of the individual tax items—for example, 10%—that the minimum real estate profitability threshold is strongly sensitive to the level of income tax. In fact, the
Pmt varies by 5.7% due to the change in income tax, or 2.3% when transfer tax changes, while its variation due to the change of possession tax is relatively negligible, at 0.9%.
7. Conclusions
The real estate market has always been perceived in Europe—in particular, in Italy—as a good investment opportunity for savings. The differences that characterize properties offer a wide range of choices that allow amounts of any size to be invested, depending on the needs and the risk that characterizes the investor. An investor who wishes to invest in real estate, as well as a company, makes choices with the aim of obtaining the best return. The choices stem from a series of information and expectations relating both to the real estate market (sales and rental values, expenses and taxes) and to the long-term capital market. In fact, it is precisely the comparison between the interest rate of the capital invested in the financial market and the return on the real estate capital that provides the elements for the assessment of the economic advantage of the investment. The level of taxation on the possession, transfer and income of a property can significantly affect the affordability of real estate investment. If property taxes are considered by local governments as a reliable source of income to the local budget, they can become a tool for promoting the effective development of real estate. Property tax is a factor that could determine, through modest fluctuations, the revival of real estate demand, generating positive effects also for the construction sector [
34,
35,
36].
The present research analyzed the effects of taxation on the investment demand of urban properties destined for residence in the Italian real estate market. For this purpose, a model of investor behavior expressed through financial inequality has been defined. With the modification of the parameters that define the inequality, the model has been adapted to the characters of the parties involved in the buying of real estate. The model has been applied to some cases constructed as extremes of the range of combinations of the different elements that characterize real estate investment. The analyses have shown that the highest returns are achievable by those who operate systematically in this sector by a company (legal person). If, on the other hand, the investor is a small saver (e.g., family), higher returns can be achieved through the flat tax option. The elaboration of the inequality was then repeated for each of these combinations, alternatively varying—according to the sensitivity analysis scheme—the rates of the tax types (possession, income and transfer) and recording the consequent variation of the minimum threshold of profitability. The results suggest that, within the current tax regime, tax policy interventions aimed at stimulating the real estate market and supporting investment demand should be directed towards reducing income taxation. However, the operation could be effectively implemented by increasing the flat-rate reduction applied to income for maintenance costs.
The tax on the transfer of real estate has minor importance in terms of influencing investors’ choices; even less important in percentage terms is the effect of changes in the possession tax [
37].


