Article

Early-Stage Temperature Gradients in Glazed Spandrels Due to Aesthetical Features to Support Design for Thermal Shock

1
Algorixon, 43125 Parma, Italy
2
Ai Studio, 10128 Turin, Italy
*
Author to whom correspondence should be addressed.
Buildings 2020, 10(5), 80; https://doi.org/10.3390/buildings10050080
Submission received: 11 March 2020 / Revised: 6 April 2020 / Accepted: 22 April 2020 / Published: 26 April 2020
(This article belongs to the Section Building Materials, and Repair & Renovation)

Abstract

:
Investigating thermal breakage of glass panes requires careful analysis of the environmental boundary conditions to determine the expected thermal gradient between the sunlit and shaded parts of the glass. This is particularly critical for glazed spandrels, where an opaque posterior insulation layer normally increases the system’s temperatures. The choice of the spandrel system should also be evaluated against the aesthetical impression that it conveys. The aim of this study is to understand how early design factors, such as aesthetical features like color, are driving temperature gradients in the glazed pane to design for thermal shock. Multiple finite-differences analyses in a quasi-static regime for non-ventilated, single glazed spandrels were conducted in three locations (London, New York and Mumbai). Results were then analyzed via a general linear model in SAS 9.4 and Tuckey post hoc analysis. It was shown that a low absorptance of the back insulation (e.g., light color) can lead to a wide range of possible temperature gradients depending on the glass transparency, with higher values of the thermally induced temperature gradients for more opaque glasses. Conversely, a high absorptance of the insulation layer leads to moderate values of glass temperature gradients, which are not substantially sensitive to the effect of the glass transparency.

1. Introduction

In recent years, the design of façades has become a complex decision-making process characterized by a multiplicity of stakeholders, intricacies and key decision points along the design process [1,2,3,4]. The early-stage selection of aesthetical features in glazed spandrels are an example of how decisions taken at conceptual stage affect following stages. Given the combined presence of insulation, glass and polymeric materials (e.g., interlayers, gaskets), and external solar radiation, temperatures in spandrel elements tend to increase significantly. Exceedingly elevated temperatures can lead to potential failures such as polyvinyl butyral (PVB) delamination, excessive temperatures in polymeric gaskets and, lastly, thermal shock in the glazed layer.
Current research on spandrels is mainly focusing on performance of finished products, rather than on providing approaches that can effectively support the early design of the system. The effect of surface treatment like fritting on the structural resistance [5] or condensation risk [6] has been studied. There are examples of temperature of real-world spandrel systems monitored over time [7] also to understand specific spandrel failures [8]. Other research strands performed parametric studies on the incidence of early-stage design parameters on energy consumption [9,10,11], on many design criteria concurrently [12,13] or, at a smaller scale, on the influence of design parameters on the expected performance of specific materials [14]. In the domain of opaque façades, parametric studies have been conducted to understand the impact of aesthetical features on the expected performance. Widiastuti et al. [15,16] measured the influence of leaves density on a green façade on energy transfer. Tarabieh et al. [17] used the “hotbox” method to measure the U-value of different wall types in Egypt. However, there is no specific work aiming to provide design support for the specification of spandrels, although spandrels play a fundamental role in potential operational failures of the entire façade of buildings.
The present paper investigates how the spandrel system’s basic aesthetical features induce temperature gradients in glazed spandrels to facilitate the early specification of system’s thermo-physical properties against thermal shock. The analyses conducted in this paper explored different combinations of insulation, glass types for different locations, orientations and external shading to understand the key design drivers for the problem at hand. Inference over the generated data was then made by means of statistical analysis. Section 2 introduces the materials and methodology, whereas Section 3, Section 4 and Section 5 will present results, discussion and conclusion.

2. Materials and Methods

2.1. Materials

2.1.1. Spandrel Build-Up

A commonly used spandrel build-up was chosen as the base configuration to be analyzed (Figure 1). The build-up consists of a 150 mm rockwool insulation = 0.035 W/mK), 6mm air cavity (λ = 0.26 W/mK) and a 66.2 (12.76 mm) laminated glass. The configuration shown in Figure 1 was then varied by changing those thermo-physical parameters that governed the aesthetics of the spandrel and the glass, such as the exterior insulation color and the transparency of the glass.
Table 1 shows the chosen variations on the insulation types. It can be seen that the absorptance is the only factor that varies. This is motivated by the fact that the thermal resistance of the insulation, which arises from the combination of the material’s thermal conductivity and thickness, does not affect the problem significantly (Appendix A). The color of external insulation is instead driving the effective absorptances of the whole system, thus playing a major role in the heat exchange between the different layers of the spandrel system. Since spandrels generally consist of sandwich panels made from an insulated core and two steel face sheets with low-emissivity properties, the emissivity for radiative exchange calculations was assumed to be fixed (0.02).
The thermo-physical properties of the laminated glass were chosen for different solar absorptances (Table 2). Clear (G1), coated (G2) and fritted (G3) glass panes were chosen. All the selected glass panes have standard emissivity values (0.84) except for glass G2, whose internal coating reduces the emissivity towards the interior to 0.30.

2.1.2. Environmental Conditions

The analyses were conducted for three different climates. The environmental conditions were chosen for three urban areas based on different conditions of irradiance/maximum temperature/minimum temperature. Table 3 shows the main climatic data of the chosen locations.
External heat exchange coefficients were assumed to be fixed and equal to 13 W/m2K for the summer season and 11 W/m2K otherwise as in [18]. These heat exchange coefficients assume absence of local wind on the external surface. Internal temperature equals 20°C in winter and 26 °C in spring, autumn and summer, whereas the internal heat exchange coefficient equals 7.7 W/m2K.

2.2. Methods

The thermally induced stresses that cause thermal breakage in the glass pane arise from the difference in temperature Δ T between the sunlit part of the glass Tsunlit and the shaded part Tshaded. The relevant thermal stress σ is calculated as:
σ = k t · E · α · Δ T
where k t depends on the frame thermal inertia and the presence of drop shadow and can be taken to be equal to 1.1 as in [18]; E is the elastic modulus of the glass equal to 70 GPa; α is the linear expansion coefficient equal to 6 × 10⁻⁶ K−1, and Δ T is the above-mentioned temperature differential.
The temperature gradient ΔT between the sunlit and shaded parts of a glass was calculated in the first two steps of the process map shown in Figure 2. Step 1 determined the 8760 hourly values of environmental boundary conditions (Test, Idir, Idiff) for each parameter shown in Table 4. Step 2 then determined the values of Tsunlit, and of Tshaded, for each possible combination of insulation/glass types shown in Table 1 and Table 2. Overall, 2,128,680 temperature gradients ΔT were generated. Step 3 involved data analysis as described in 2.2.3.

2.2.1. Step 1: Hourly Environmental Conditions

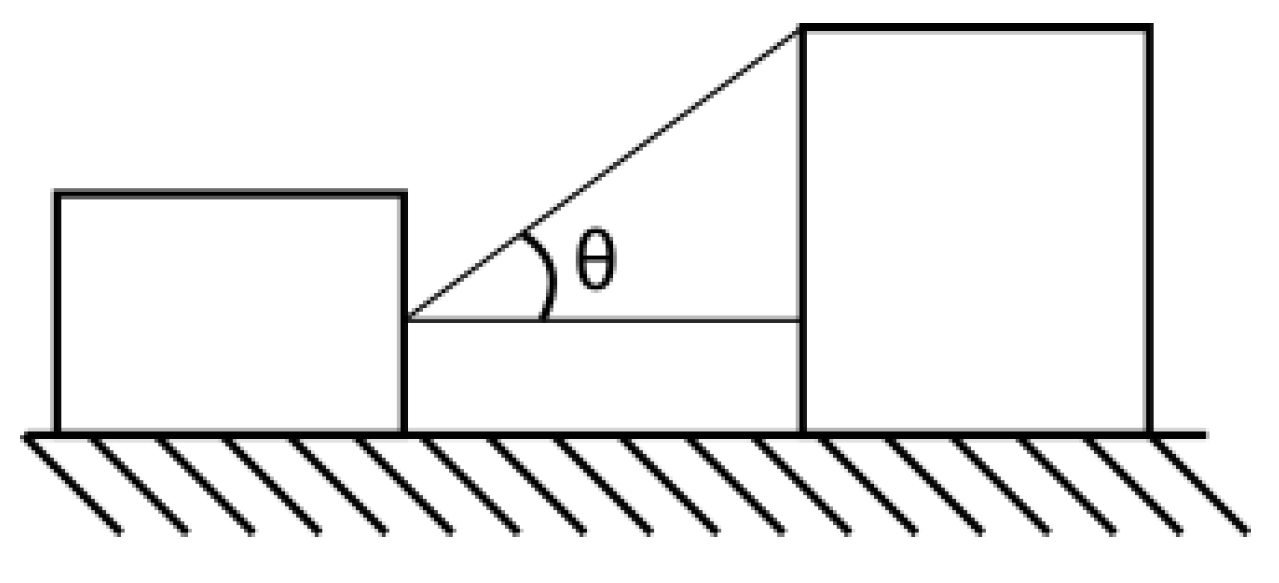
The environmental boundary conditions for the problem were determined by running a number of energy models in Integrated Environmental Solutions Virtual Environment (IESVE) 2015 as in Figure 3. The models consisted of three rooms with different external building configurations providing shading in accordance with the view angles listed in Table 4 and as shown in Figure 4. The view angle measures the level of shading that the investigated point receives from front-facing buildings. Three orientations (East, South, West) were analyzed.
Overall, 236,520 hourly values of environmental boundary conditions (Test, Idir, Idiff) were found.

2.2.2. Step 2: Hourly Glass Temperatures

The above-mentioned boundary conditions were then used to solve the steady state (i.e., no heat storage), 1-D heat transfer problem for a multi-layered system with a modified version of Fourier’s law by adding the convective and radiative heat exchange between adjacent layers:
α ie Φ s = j h c , ij ( T i T j ) + k h r , ij ( T i T k ) + l ( λ / s ) il ( T i T l )
The left-hand side of (2) corresponds to the internal heat generation, represented as the product between the incident radiation Φ s and the effective absorptance α i e   of the ith layer. The incident radiation equals the sum of the direct and the diffuse components, or the diffuse component only, depending on whether Tsunlit or Tshaded is sought. The right-hand side of (2) represents the heat exchange between layers. The coefficients h c , i j and h r , i j represent the convective and radiative heat exchanges between the analyzed ith layer and the adjacent layers j (for convective exchange) and k (for radiative exchange). The ratio ( λ / s ) i l represents the conduction exchange between the ith layer under analysis and the lth adjacent layer. Temperatures T i , T j , T k and T l represent the temperature of the ith layer under analysis, the jth adjacent layer to the ith layer for convective exchange, the kth adjacent layer to the ith layer for radiative exchange and the lth adjacent layer to the ith layer for conduction exchange.
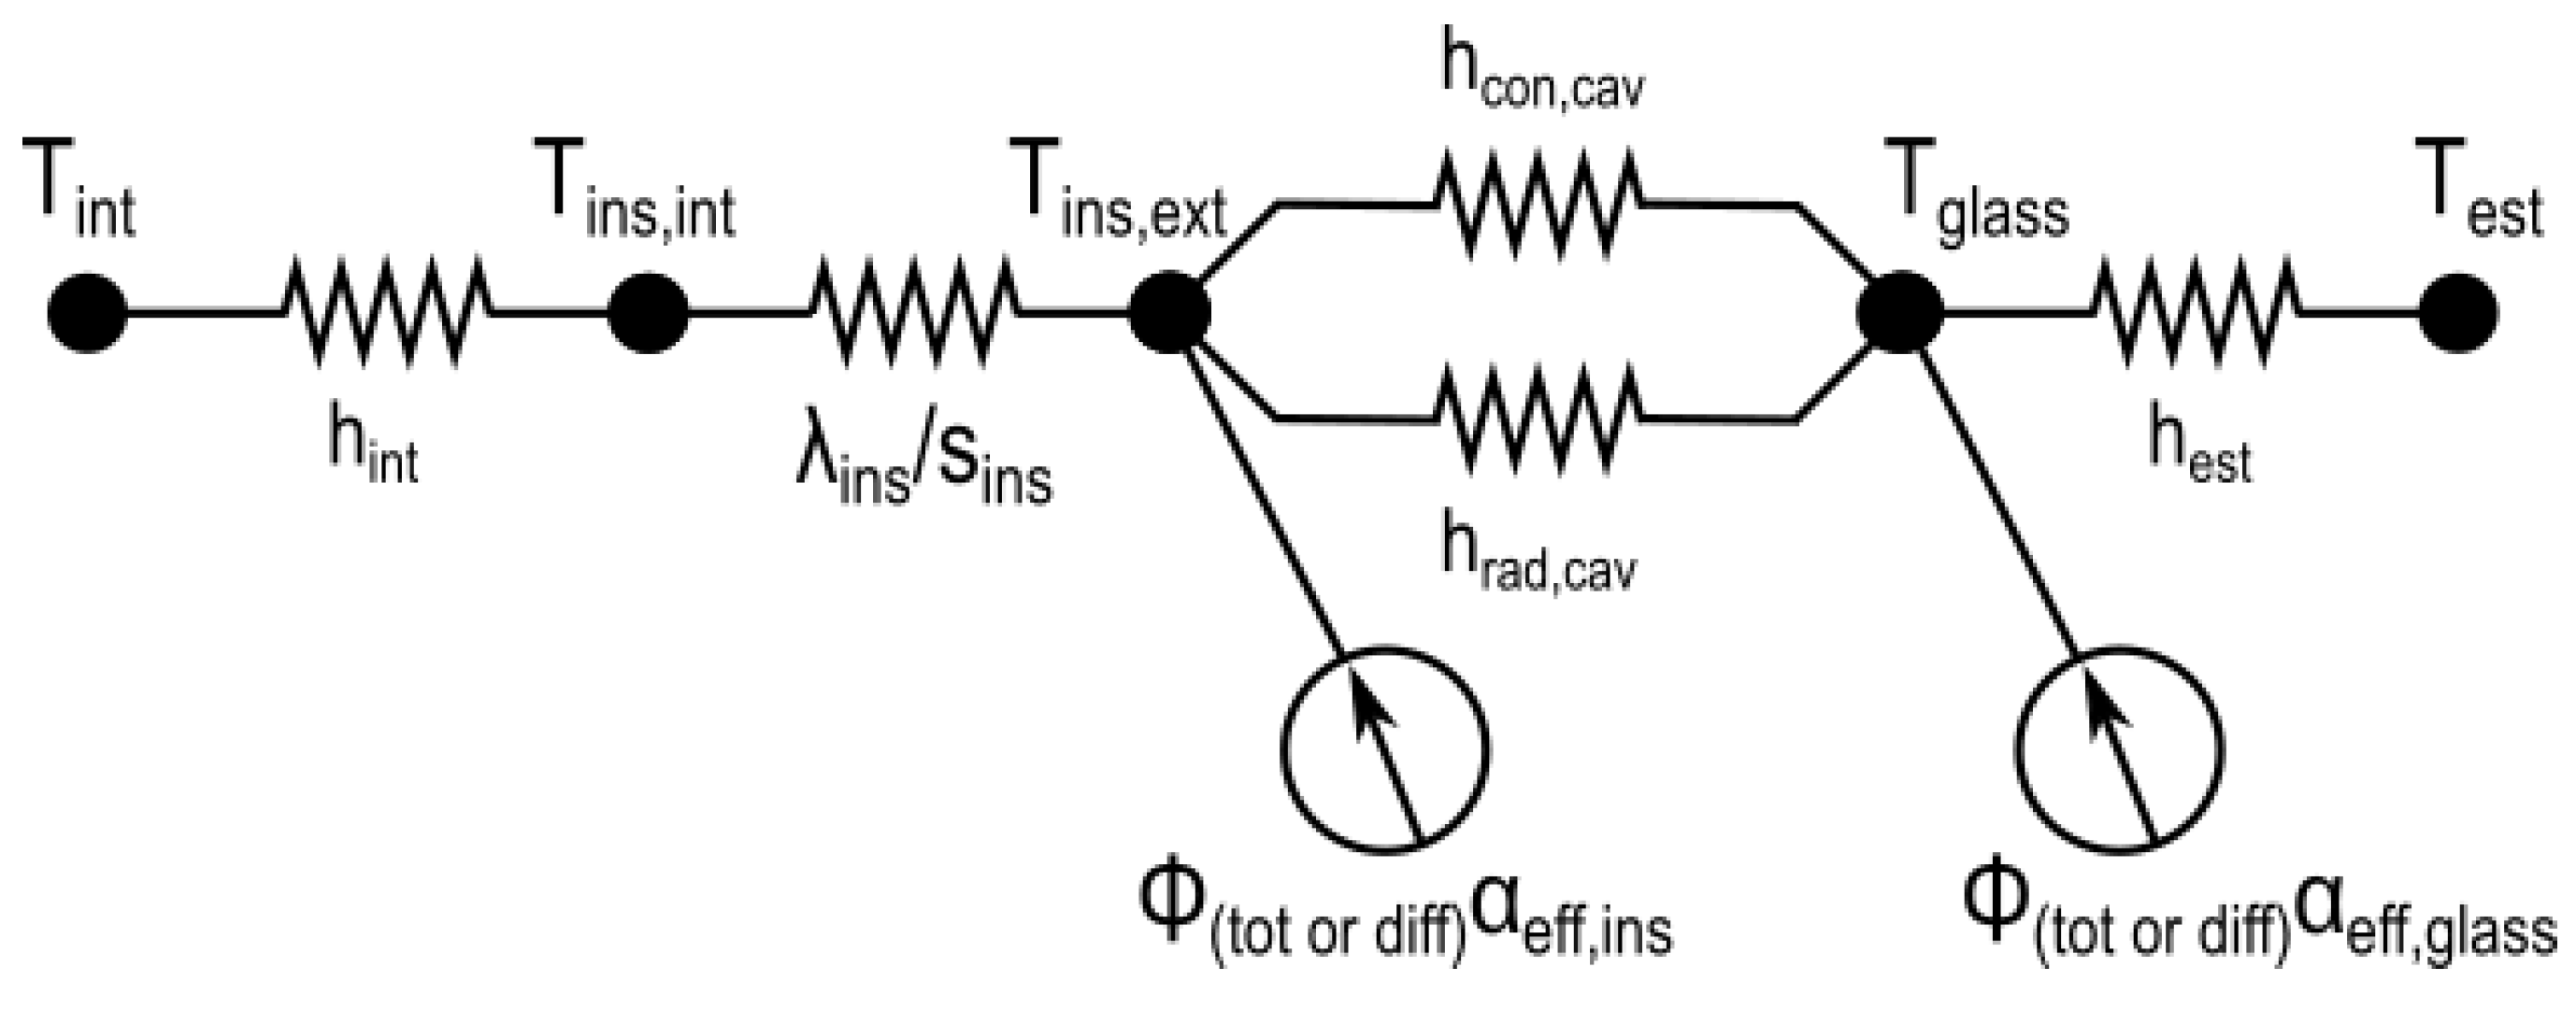
The generated thermal network for the problem is shown in Figure 5. h c o n , c a v and h r a d , c a v are the convective and radiative conductances of the air cavity and they are defined in [19]. The former was defined as:
h c o n , c a v = N u λ a i r t a i r
N u = A ( G r   · P r ) n
G r = 9.81   t a i r 3   Δ T   ρ a i r T m μ a i r 2
P r = μ a i r c a i r λ a i r
where N u is the Nusselt number,   G r is the Grashof number, P r is the Prandtl number, λ a i r is the thermal conductivity of still air (equal to 0.26   W / m K ), t a i r is the thickness of air (equal to 0.6 cm as shown in Figure 1), A and n are constants equal to 0.035 and 0.38, Δ T and T m are the temperature gradient and the average temperature of the surfaces bounding the air gap, ρ a i r is the density of air equal to 1.18 kg/m3, μ a i r is the dynamic viscosity of air equal to 1.85 × 10⁻⁵ kg/ms, and c a i r is the specific heat capacity of air equal to 1005 J/kgK. The radiative air conductance is defined as:
h r a d , c a v = 4 σ ( 1 ε 1 + 1 ε 2 1 ) 1 T m 3
where σ is the Stephan–Boltzmann constant (5.67 × 10⁻⁸ W/m2K4), and ε 1 and ε 2 are the emissivities of the surfaces, equal to 0.02 and 0.89.
Equation (2) generated a system of equations of the type   A T _ = b _ , where A is the coefficient matrix, b _ is a constant vector, and T _ is the solution for the problem. Once A and b _ are found, the solution T _ is equal to   T _ = A 1 b _ . Since internal heat exchange coefficients varied with temperature, A = A ( T _ ) c o n s t . Thus, the solution was found iteratively until the value of the error e is less than 0.05K, where e is defined as:
e = i ( T i , t + 1 T i , t )
where t represents the instant under analysis. The effective absorptance of the ith layer α i e is such that:
α t o t = i α i e
where α t o t is the total absorptance of the system, including opaque components positioned behind the glazed system (like in a spandrel system). In general,   α t o t α g l a s s , where α g l a s s is the value normally provided by the glass manufacturer. Thus, α i e is the ratio of the solar radiation that is absorbed by the ith component. This value was calculated from an additional system of equations describing the balance of the radiative fluxes between the layers of the system, when the external solar radiation is unity ( Φ s = 1 ). The fluxes in each layer were divided into reflected, transmitted and absorbed. Thus, under the hypothesis that the surrounding environment was totally absorptant, the following three equations were written for each layer:
Φ i , i + 1 = τ i , 1 Φ i 1 , i + ρ i , 2 Φ i + 1 , i
Φ i , i 1 = ρ i , 1 Φ i 1 , i + τ i , 2 Φ i + 1 , i
Φ i , i = α i , 1 Φ i 1 , i + α i , 2 Φ i + 1 , i
where the subscripts i − 1, i and i + 1 refer to the radiative fluxes from the ith component towards the exterior, absorbed by the ith component and towards the interior. The subscript 1 and 2 refer to radiative properties towards the exterior and the interior. Φ i , i is the effective absorptance of the ith component ( Φ i , i = α i e ) and it was included into the left-hand side of Equation (2).
Analyses were conducted for both total ( Φ t o t = Φ d i f f + Φ d i r ) and diffuse ( Φ d i f f ) radiations to determine Tsunlit and Tshaded, respectively. The temperature gradient Δ T was calculated as Tsunlit-Tshaded.

2.2.3. Step 3: Data Analysis

The quality of the generated data (QC) was first checked in SAS 9.4 [20] by looking for missing values, outliers and distribution normality. The interaction between glass transparency and insulation absorptance to determine temperature gradients at extreme irradiance conditions was then analyzed. Quartile classes of irradiance were first calculated at each location; then, the 4th quartile was further subdivided into quartiles, and the 4th quartile of the latter set was taken to consider the most extreme cases. The extreme case was then the value corresponding to a 6.25% probability of being exceeded. The irradiances corresponding to these values were above 404 W/m2 in Mumbai, above 326 W/m2 in London and above 397 W/m2 in New York.
The chosen statistical model considered the interaction between glass transparency and insulation absorptance, and it was defined as:
y ij = μ + glass _ transparency i · insulation _ absorptance j + e ij
where y ij is the observed temperature gradient, μ is the mean temperature gradient at each location; the product of glass _ transparency i and insulation _ absorptance j represents the fixed effect of the interaction between the ith level of glass transparency (i = [0.4,0.6,0.8]) and the jth level of absorptance insultation (j = [0.2,0.6,0.9]); and e ij is the random residual effect e ij N ( 0 ,   σ e 2 ) .
The Tuckey post hoc test was then applied to evaluate the differences across locations per each level of interaction between glass transparency and absorbance insultation. This statistical analysis aimed to (1) estimate differences for all pairwise comparisons and (2) adjust the p-values for multiple testing and evaluate least square mean (LSM) differences. Differences were declared significant if p-value < 0.05 and results were reported as LSM.

3. Results

In total, 243 (3 locations, 3 orientations, 3 view factors, 3 glass types and 3 insulation colors) simulations were run on a Dell Inspiron laptop with an Intel Core i7 processor at 2.40GHz. The overall calculation time was 34.3 h. The generated data can be found in the Supplementary Materials (Tables S1–S3) that accompanies this paper. The results can be used by designers to swiftly acquire a better understanding of how design choices can affect thermal shock risk and the expected temperature differential as a function of the principal visual features of the spandrel element.

3.1. Maximum Temperature Gradients and Relevant Thermal Stresses

Each simulation determined 8760 hourly data in which the temperature gradient was defined. Table 5, Table 6, Table 7, Table 8, Table 9 and Table 10 show the maximum values of temperature gradient for the three climates analyzed and the relevant thermally induced stress. Each table defines values for a specific combination of the analyzed variables. The values of the thermo-physical properties of the glass have been adjusted to their descriptive values (description fields in Table 1 and Table 2).

3.2. Temperatures of the Shaded and Sunlit Parts of the Glass at Peak Conditions the Worst Combination of Insulation and Glass Types

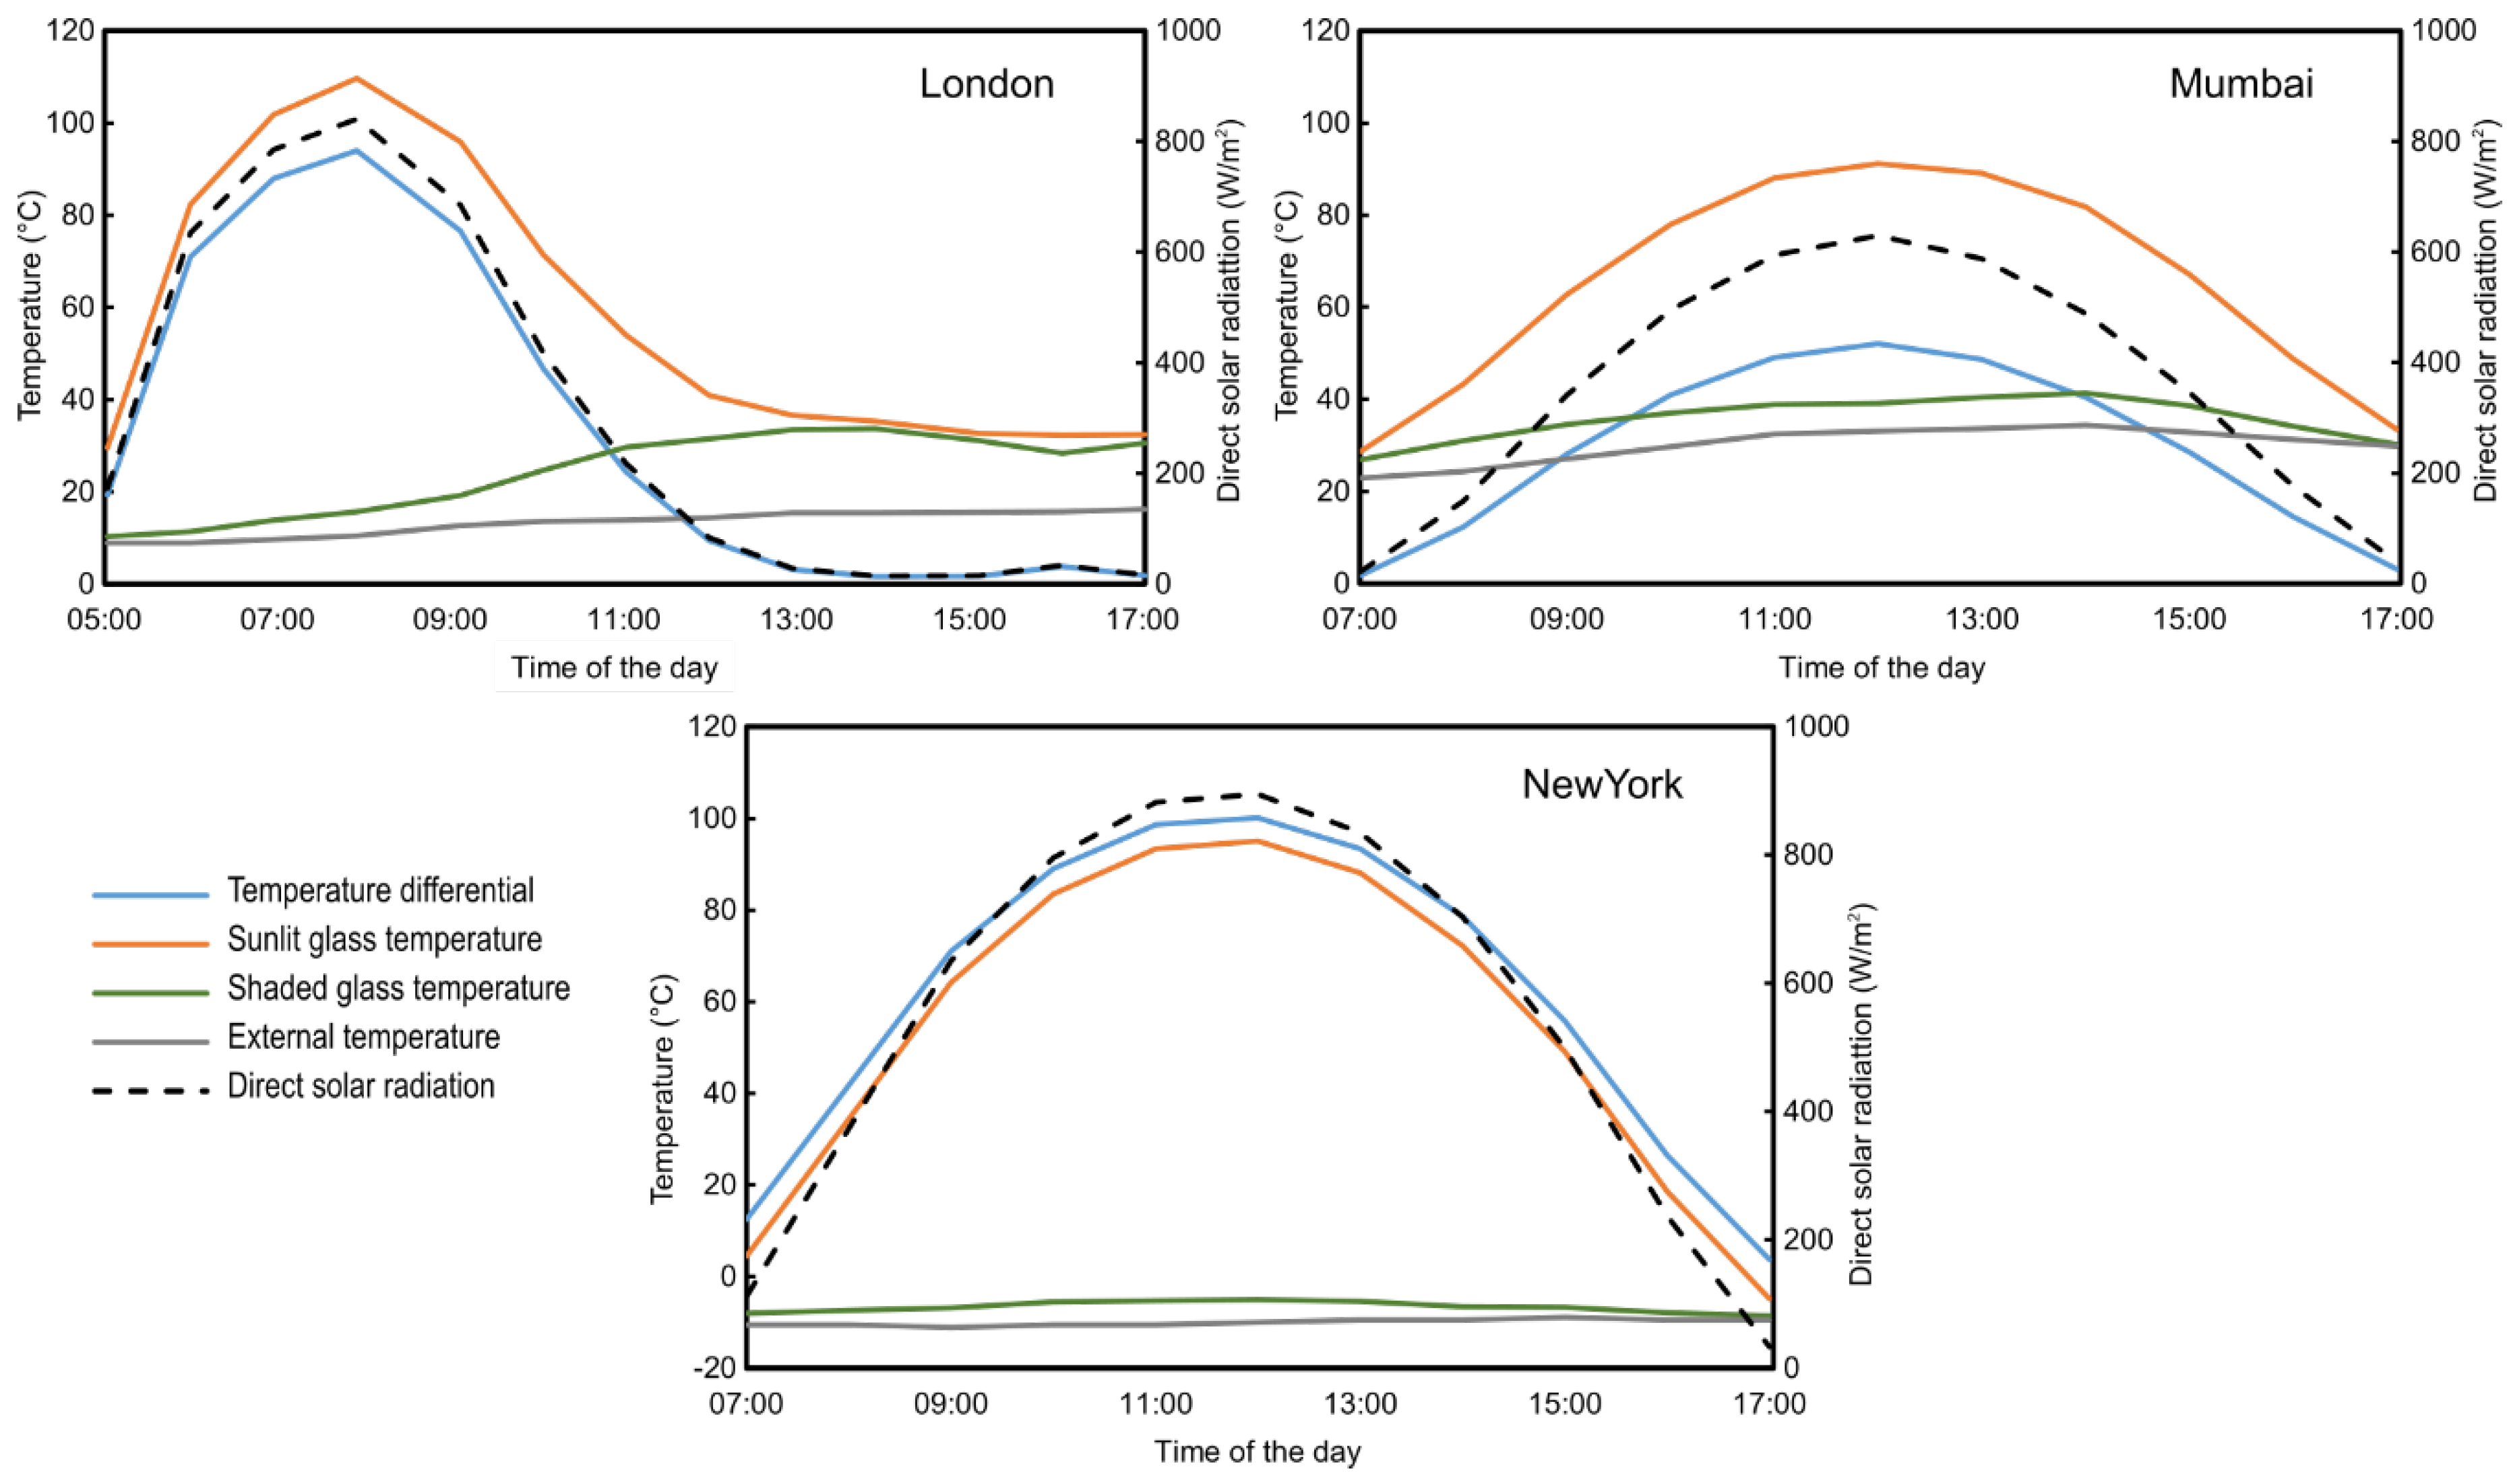
The days of occurrence of the highest temperature gradient have been plotted per each location in Figure 6, showing the temperature variation and the relevant daily fluctuation of the direct solar radiation. The combination of glass type and insulation color was “nearly opaque”/“light” for all conditions. Peak values from these days have been used for the sensitivity analysis shown in Appendix A.

3.3. Thermal Stress Variation across the Year for the Worst Combination of Insulation and Glass Types

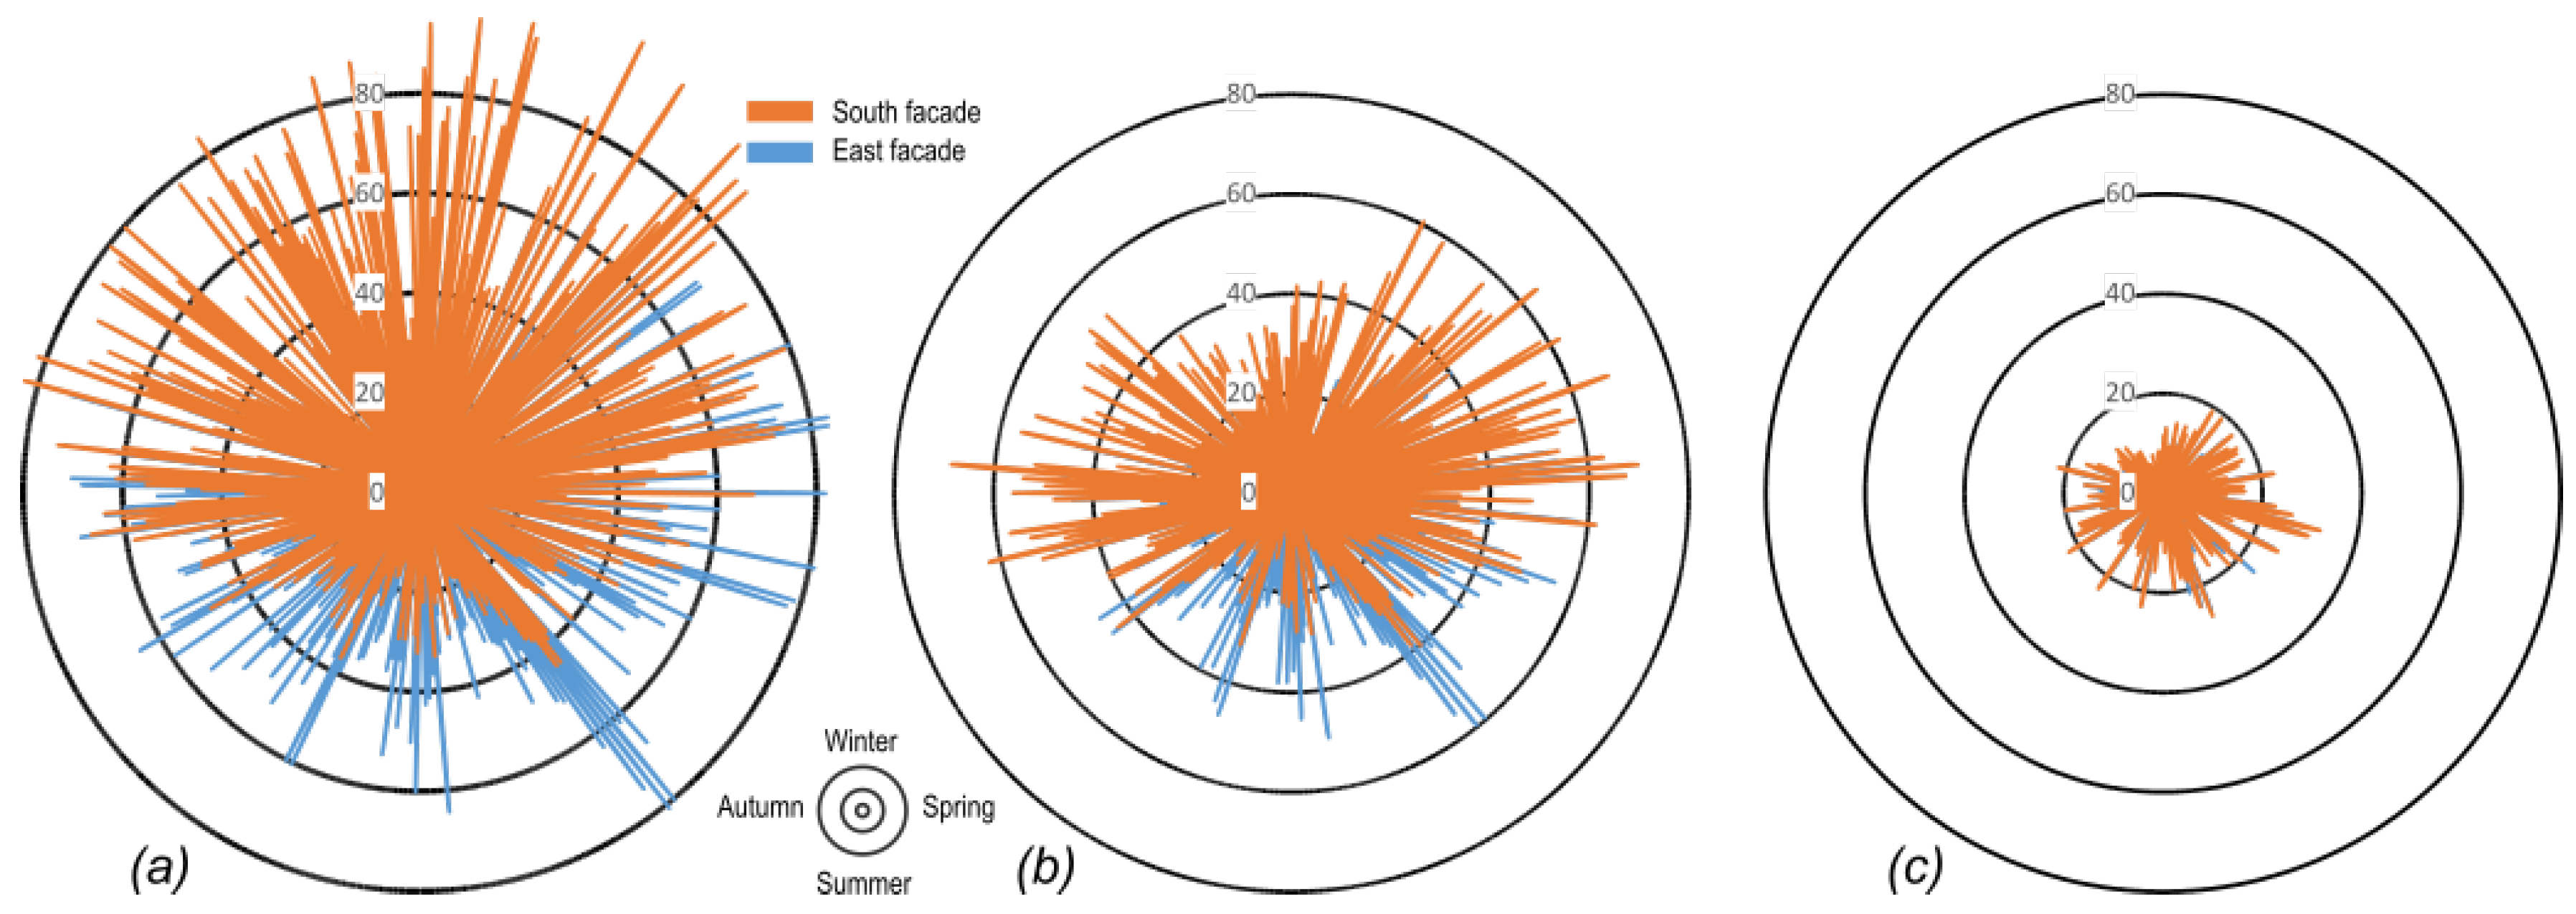
Figure 7, Figure 8 and Figure 9 show the yearly variation of the temperature difference for the three locations, the three view angles (0°, 30° and 60°) and two out of three orientations (south and east). The combination of the thermo-physical properties of glass and insulation were the ones leading to the maximum temperature gradient: nearly opaque glass and light insulation color.

3.4. Incidence of the Thermo-physical Properties of the Spandrel (Step 3)

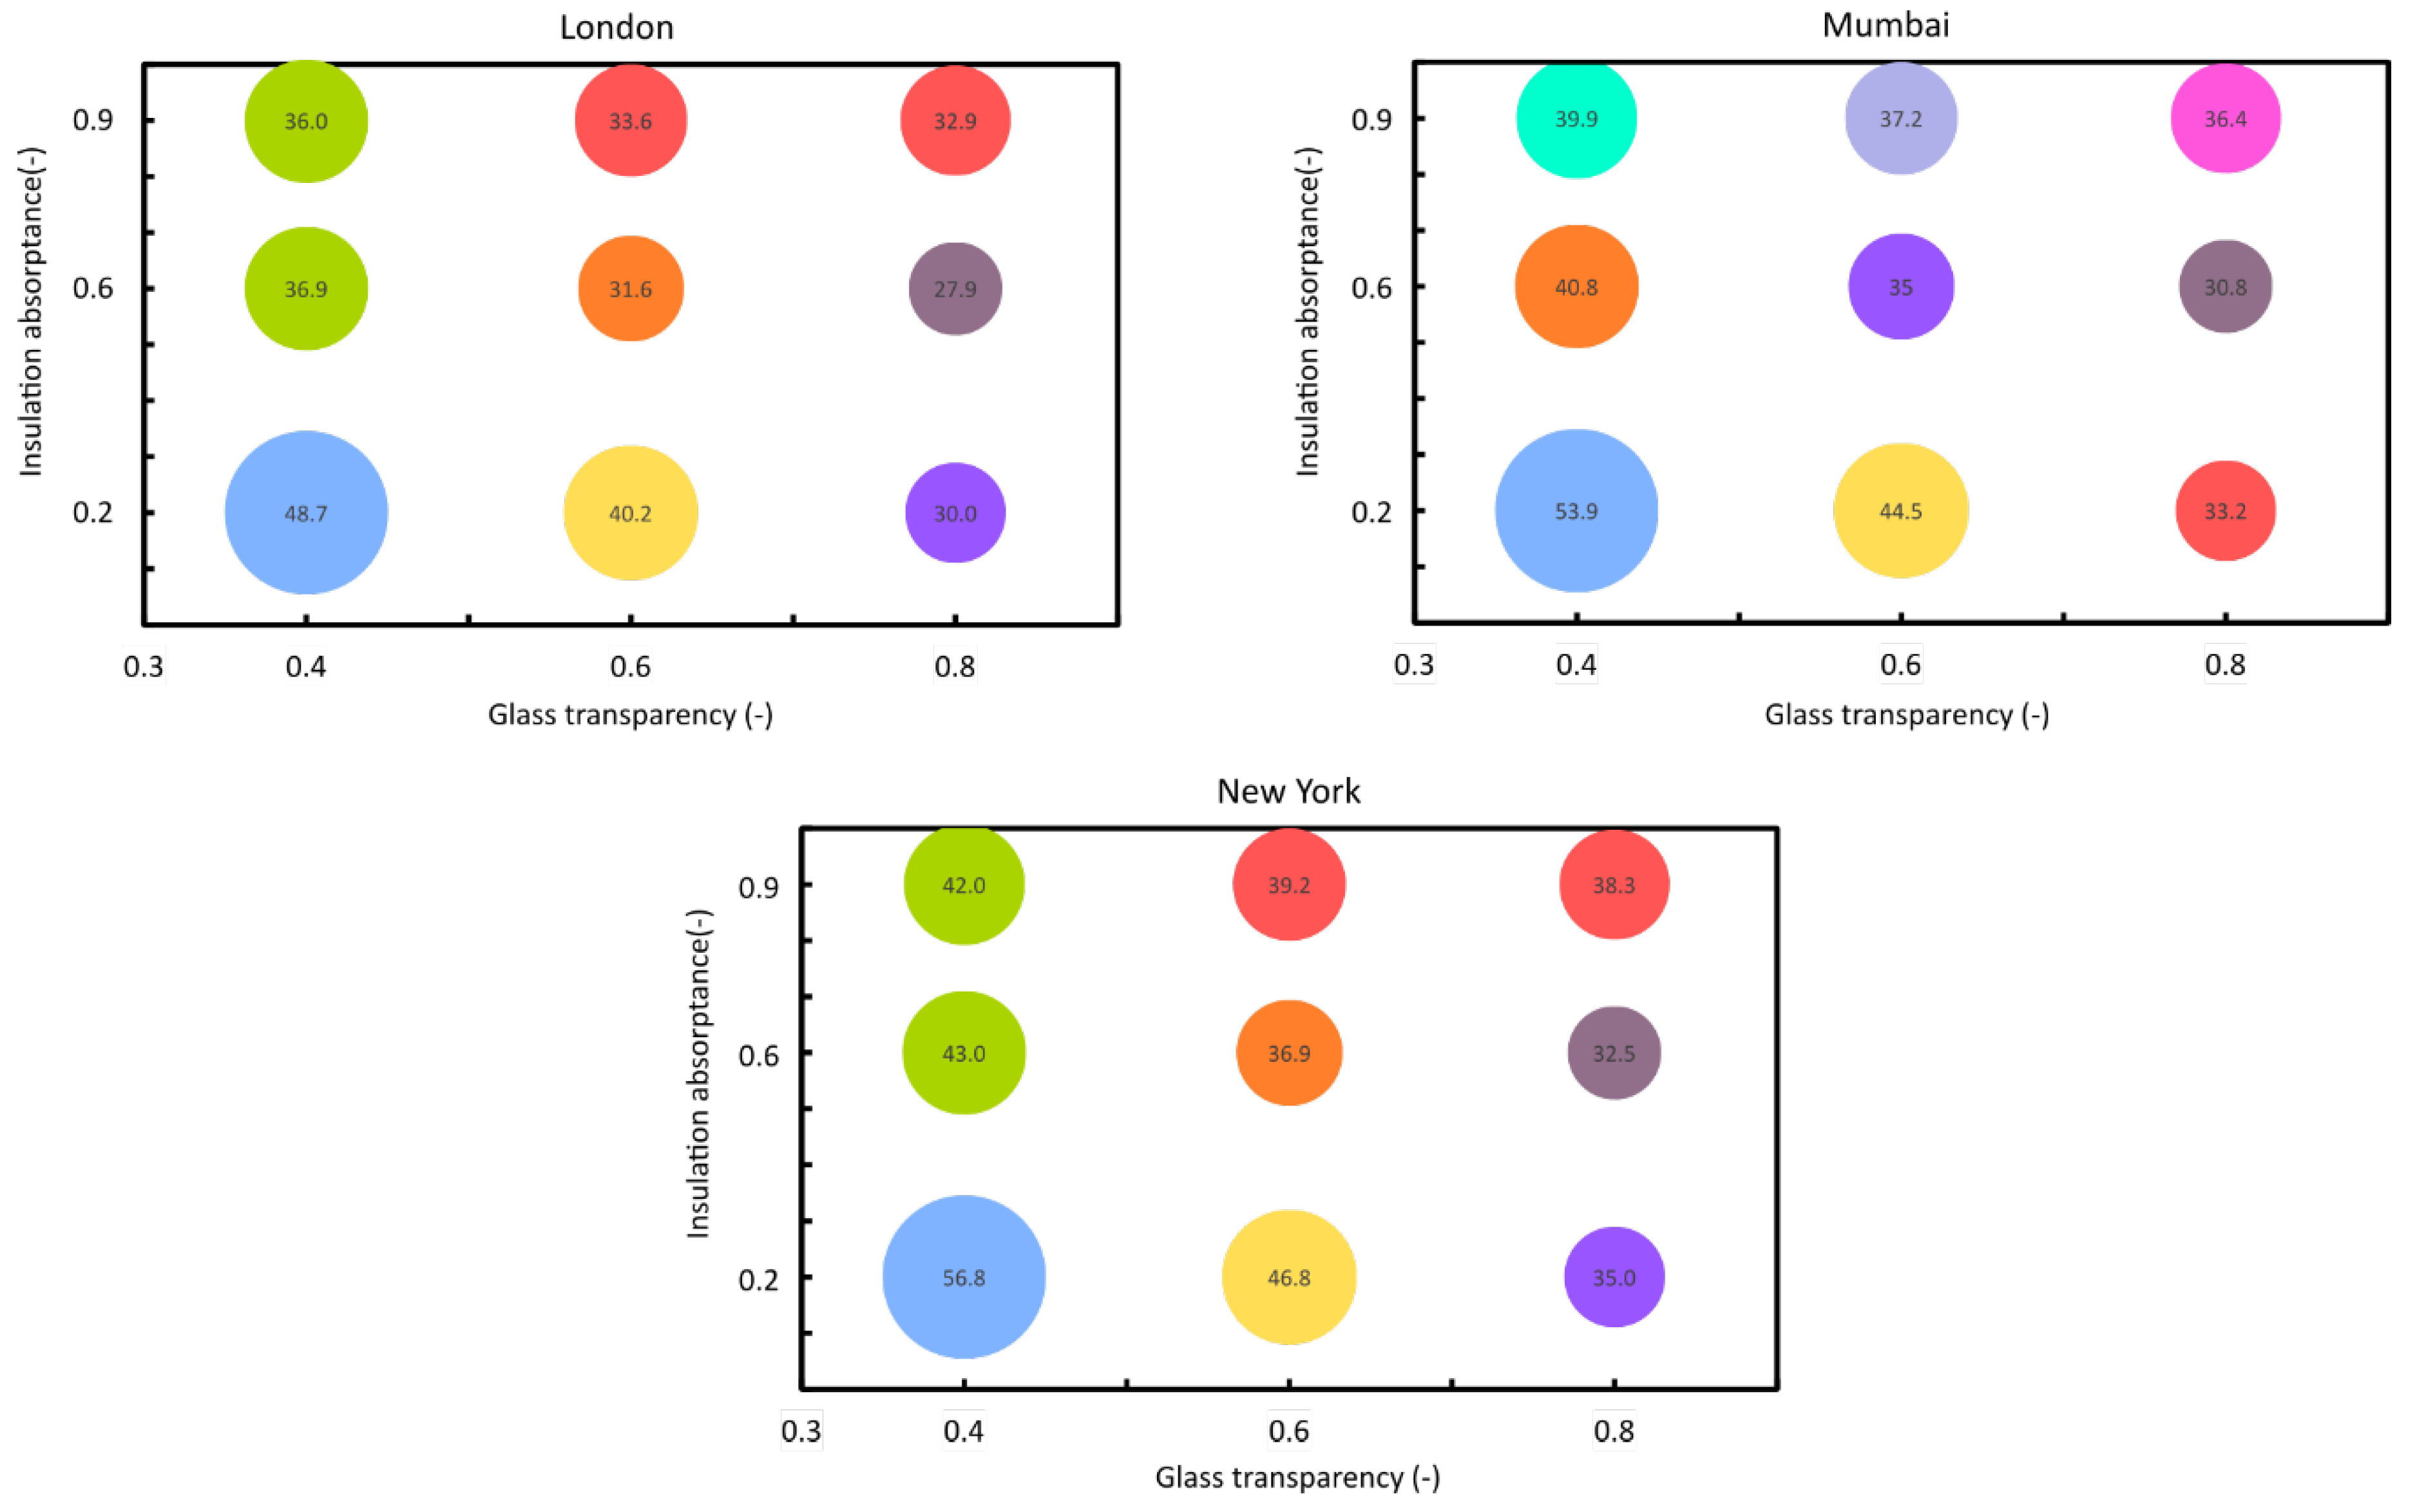
In step 3, the incidence of the thermo-physical properties of the analyzed spandrel on the temperature gradients was determined. Figure 10 shows, for the three locations, the least-square mean (radius) of the temperature gradients per each level of interaction between glass transparency and insulation absorbance. In each of the diagrams in Figure 10, all values that share the same color are not to be considered statistically different, i.e., the combination of glass transparency/insulation absorptance leads to similar results in the Tuckey post hoc test. In London, all combinations of glass transparency/insulation absorbance resulted in statistically different values except for two combinations: glass transparency equal to 0.4 and insulation absorbance equal to 0.6 and 0.9. In Mumbai, all possible combinations led to statistically different results in terms of temperature gradients (p < 0.05). Akin to London, in New York, glass transparency equal to 0.4 with insultation absorbance equal to 0.6 and 0.9 showed predicted means which were not statistically different (p > 0.05). The combinations between glass transparency and insulation absorbance, (0.4, 0.6) and (0.4, 0.9), and (0.6, 0.9) and (0.8, 0.9), led to non-statistically different results (p > 0.05); all other combinations resulted significantly different from each other.

4. Discussion

4.1. Discussion of Results

Results from Table 5, Table 6, Table 7, Table 8, Table 9 and Table 10 showed specific trends with respect to the selected variables. Understanding the view angle is of fundamental importance, as the solar radiation is reduced by the presence of external shading from the front-facing buildings. On average, reduction rates of 35% and 60% in the maximum temperature gradient were found for view angles of 30° and 60°, respectively, if compared with the 0° case in the three locations analyzed.
The location and the orientation were other important factors governing the phenomenon under investigation, with maximum temperature gradients equal to 100, 94 and 70 K for New York, London and Mumbai, respectively. The peak values for New York and Mumbai took place during winter for south-facing façades, whereas the critical condition for London was during spring for east- and west-facing façades.
Yearly variations showed that south-facing façades in all locations displayed the largest values of temperature gradients in winter, as the direct solar radiation on the vertical plane can reach high values due to the low solar altitudes. East facing façades showed instead larger temperature gradients in spring/summer towards the summer solstice. The role of external shadings from building is fundamental, as the reduction in temperature gradients reduces nearly proportionally to the increase in view angle θ . Hence, it is important to perform accurate solar analysis at early-design stages to evaluate the risk of thermal shock more accurately.
The combination of nearly opaque glass/light insulation color appears to be generally the one leading to the highest temperature gradient. This is also confirmed by the diagrams in Figure 10 that showed how increasing the glass transparency is generally beneficial in reducing such gradient. A dark insulation color (i.e., high absorptance) also made the problem of thermally induced temperature gradients less sensitive to the glass transparency and led to lower values of temperature gradients. This evidence might be motivated by the fact that the low emissivity of the insulation surface reduces the radiative heat transfer between the insulation and the glass layer.
The Tuckey post hoc analysis showed that most combinations of glass transparency and insulation led to statistically different predicted values of temperature gradients, except for two identical cases in London and New York. In these two locations, fixing the glass transparency to a low value and choosing medium-to-high values of insulation absorptance led to similar results. Similarly, fixing the insulation absorptance at high values and choosing medium-to-high glass transparency led to comparable values of temperature gradients. In Mumbai, despite the low glass transparency/low insulation, absorptance led to the highest value of temperature gradient like in all other locations, and all results were considered statistically different.
Finally, as shown in Appendix A, the value of the thermal resistance of the insulation was not a governing parameter, if it was within reasonable ranges for building applications (e.g., for global U-value compliance).

4.2. Limitations of the Study

The present publication shows a series of limitations, which require further analyses and more insights for subsequent refinements, including model calibration that however falls beyond the scope of this paper. First, although the choice of environmental/thermo-physical variables was aimed at representing the largest spectrum of real-world situations, the number of possible combinations could in fact be larger. For this reason, it is recommended that further studies be conducted. Second, the environmental data were taken from a typical meteorological year (TMY). By default, these values are considered as average for each location. Therefore, indefinable peak conditions (e.g., reflections from the ground) or site-specific peculiarities are not evaluated in this study. Climate change is not considered either, with environmental conditions not considering exceedingly cold or hot days, months or even years. That being the case, and in line with the initial aim of the paper, we recommend not to use the present analyses for code-compliance checking or specific consultancy activities other than initial, early-stage assessment of potential thermally related risks in glasses.

5. Conclusions

The present paper has suggested a methodology for analyzing the thermal shock risk by conducting a three-step process: (1) selection of the hourly environmental conditions, (2) calculation of the detailed temperatures for a widely-used build-up for spandrels in building façades and (3) statistical analysis of the obtained results. The methodology has been applied to different climates, orientations and material properties to identify the underlying factors and trade-offs for material selection to prevent thermal shock risk at early-design stages. The study shows that factors such as climate, orientation and external shading from other buildings govern the risk of thermal breakage. The study further suggests that aesthetically related thermophysical properties of glass and insulation should be carefully selected. This is evidenced by the fact that combining opaque glasses and light insulation colors leads to the highest temperature gradient between sunlit and shaded areas of the glass pane.
Authors would like to recommend this work to be considered by architects, designers, façade engineers and contractors who are interested in understanding how the combination of climate, orientation/shading, and spandrel color may pose a significant risk regarding the occurrence of thermal shock in façades. The paper is thus contributing to support the façade sector in risk mitigation at the early stages of design, which is known to have a prominent role in the final performance and cost of buildings.
Future work will extend the created database by including additional spandrel build-ups (e.g., insulation and double-glazing units) to provide a more direct and user-friendly guidance on the glass specification in terms of required strength.

Supplementary Materials

The following are available online at https://www.mdpi.com/2075-5309/10/5/80/s1, Table S1: Data for London; Table S2: Data for Mumbai; Table S3: Data for New York.

Author Contributions

Conceptualization, J.M., L.L. and C.M.; Methodology, J.M., L.L. and C.M.; Formal Analysis, J.M. and L.L.; Data Curation, J.M. and L.L.; Writing—Original Draft Preparation, J.M.; Writing—Review & Editing, L.L. and C.M.; Visualization, J.M. and L.L.; Supervision, L.L. and C.M. All authors have read and agreed to the published version of the manuscript.

Funding

This research received no external funding

Conflicts of Interest

The authors declare no conflicts of interest.

Appendix A

A spandrel system is normally made of a glazed, externally facing layer and an opaque, highly insulated, internal layer. These two layers are separated by a third, intermediate and sometimes ventilated, air gap. From an energy standpoint, the whole system can be defined as the sum of the thermal resistance of each of the three layers plus the external and internal resistances:
R t o t = R e x t e r n a l + R g l a z e d + R a i r   g a p + R i n s u l a t i o n + R i n t e r n a l
The incidence of the insulation resistance R i n s u l a t i o n on the glass temperature gradient was studied by running a sensitivity analysis. The insulation resistance was varied between the minimum and maximum ranges shown in Table A1, by assuming two typically used insulation materials and thicknesses.
Table A1. Variability of the insulation resistance as a function of thickness and material type.
Rinsulation for tins,min = 10 cm
(m2K/W)
Rinsulation for tins,max = 20 cm
(m2K/W)
Polyurethane ( λ i n s = 0.026   W / mK )3.87.7
Rockwool ( λ i n s = 0.035   W / mK )2.95.7
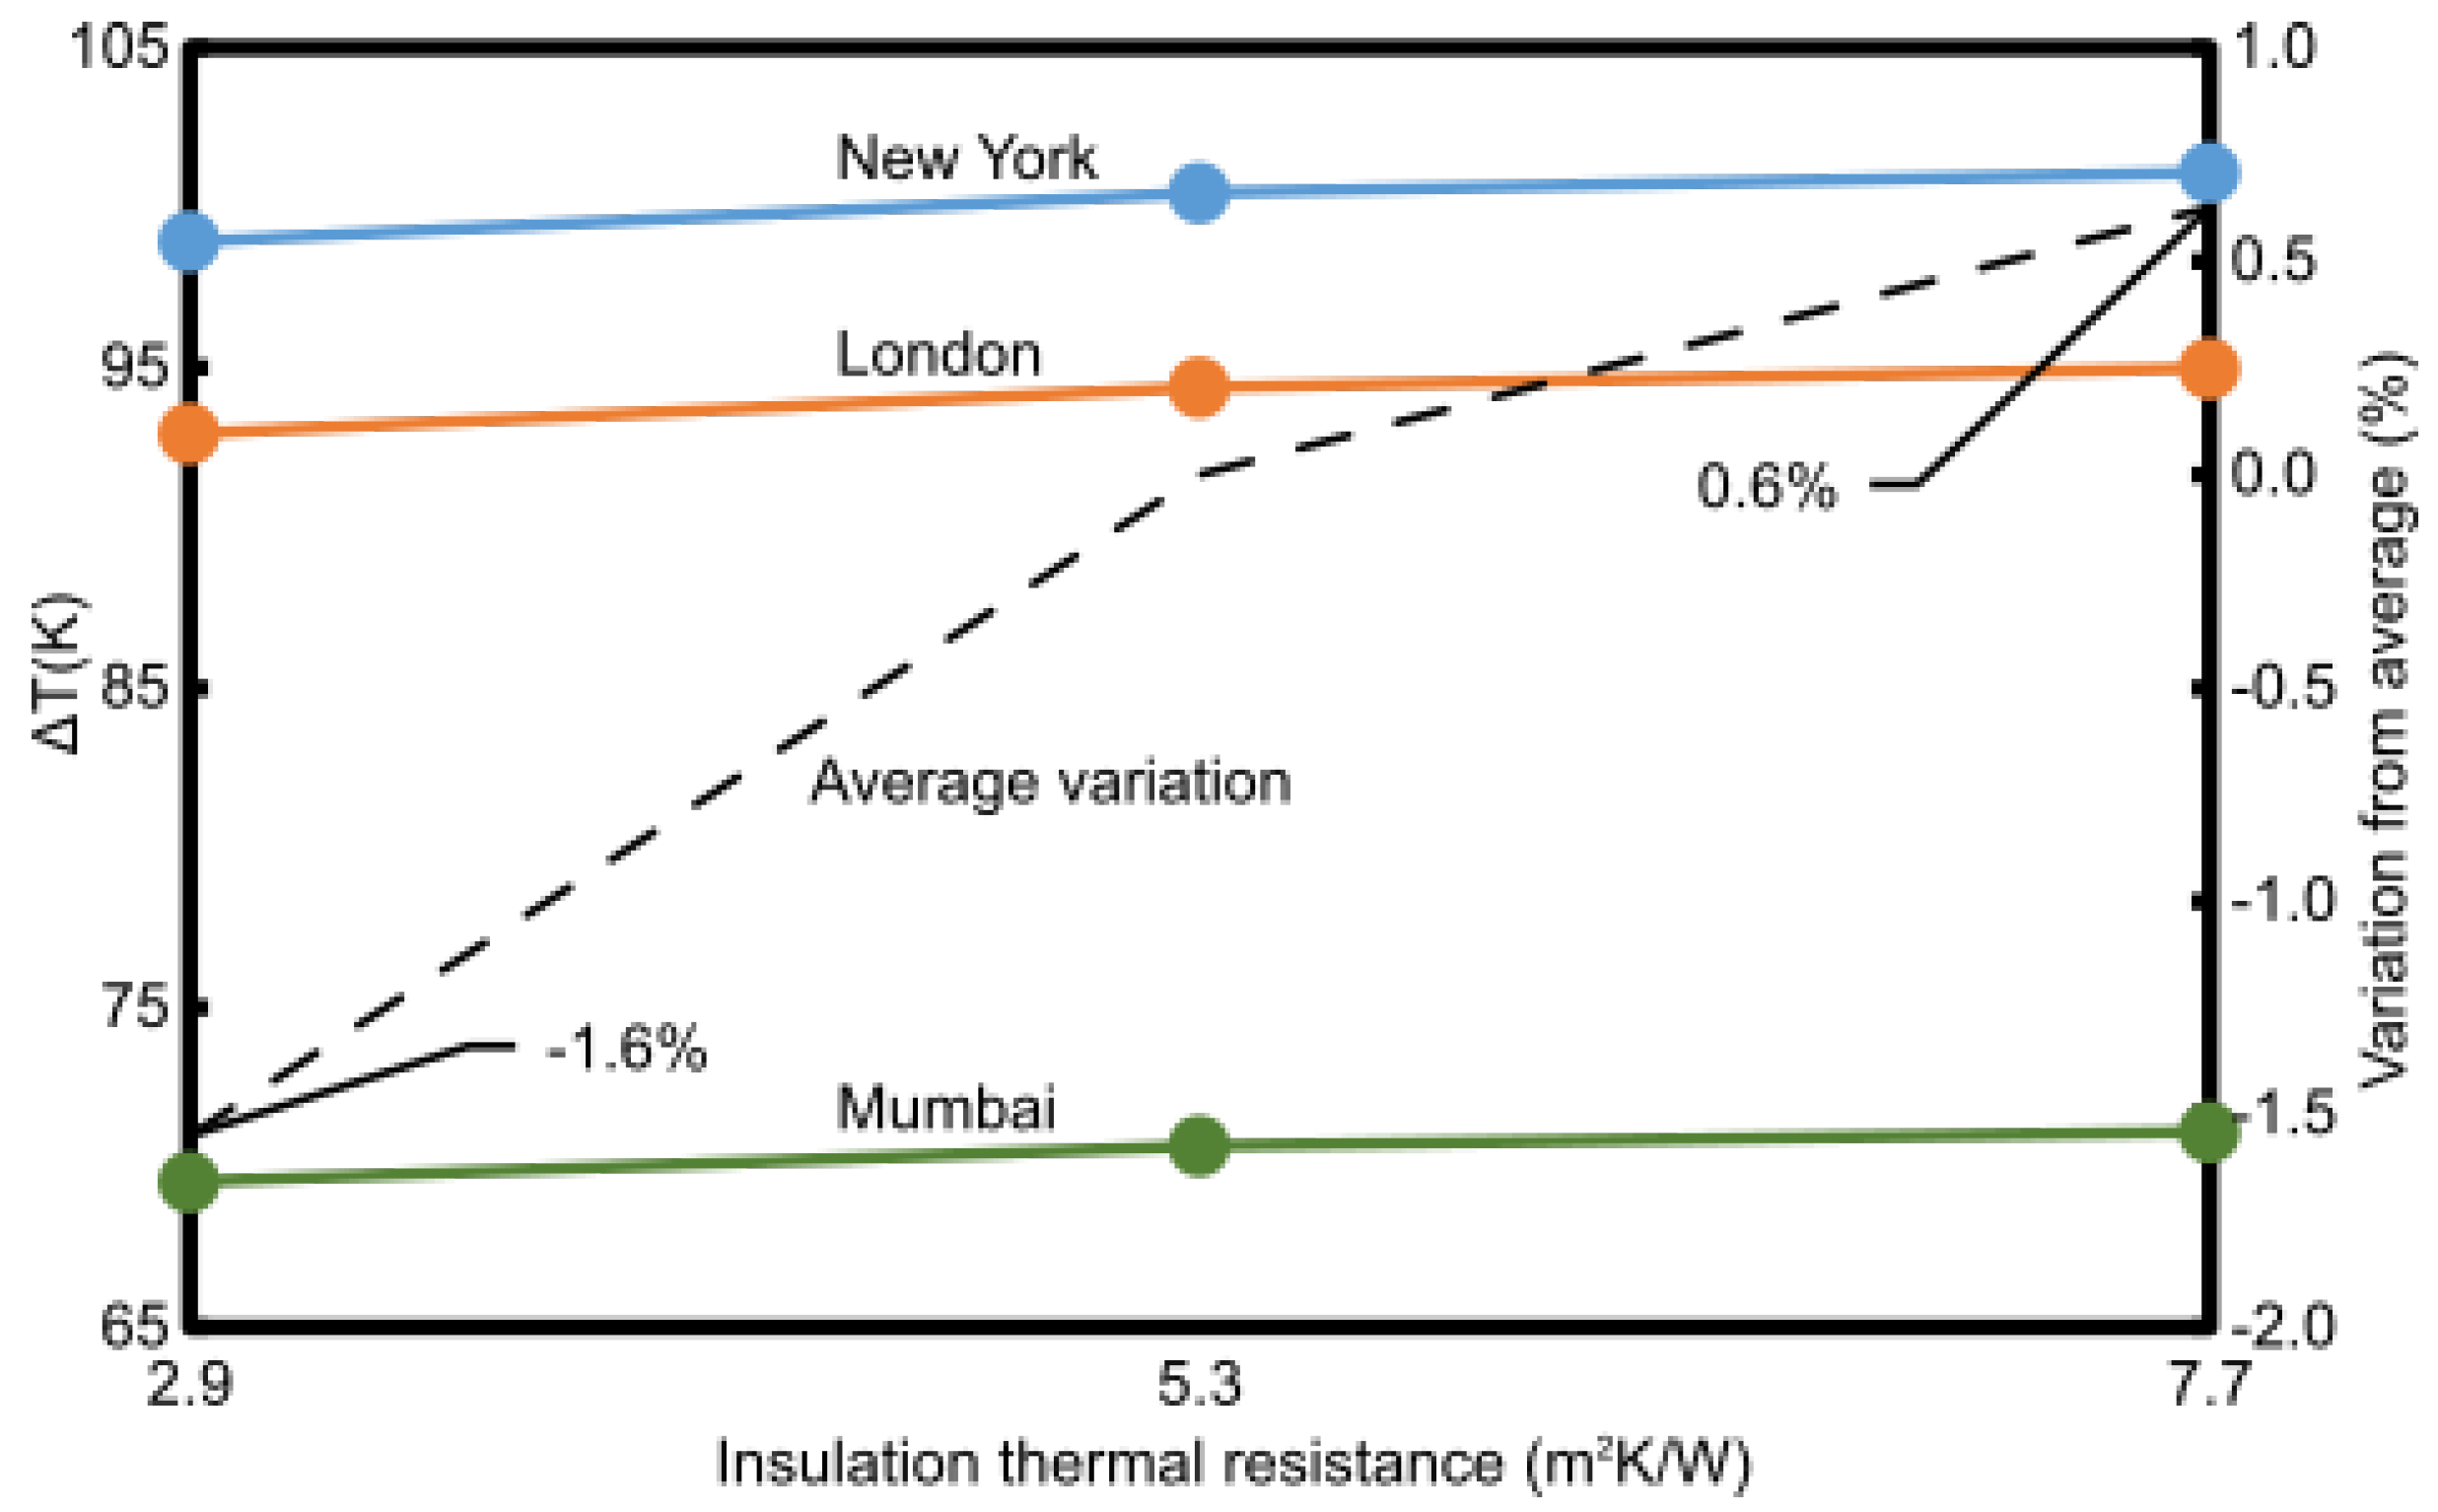
The insulation resistance thus varied in the range [2.9, 7.7] m2K/W, with an average value of 5.3 m2K/W. The sensitivity analysis is therefore run by checking how the glass temperature gradient varies with the insulation resistance over three representative instants. Those instants have been chosen to correspond to the peak values already shown in Section 2 and as summarized in Table A2.
Table A2. Environmental parameters and physical properties of the glass at peak conditions of temperature gradients for the analyses conducted in the paper.
LocationTime of the DayTest (°C)Idir (W/m2)Glass TypeInsulation Color
Condition 1New York12:00 pm−10.0894Nearly opaqueLight
Condition 2London8:00 am10.4840Nearly opaqueLight
Condition 3Mumbai12:00 pm33.1629Nearly opaqueLight
For each of the three conditions, the three values of insulation resistance [2.9,5.3,7.7] have been used to verify the sensitivity of the problem. Results are shown in Figure A1.
Figure A1. Sensitivity of the problem to the thermal resistance of the insulation.
Buildings 10 00080 g0a1
What emerges is that the problem is weakly sensitive to the variation in insulation resistance, with average variations from the central point (5.3 m2K/W) ranging from −1.6% to 0.6%. Therefore, the insulation thickness can be assumed arbitrarily for the present problem (if it is within “normal” design ranges) since this parameter does not affect results significantly.

References

  1. Kassem, M.; Mitchell, D. Bridging the gap between selection decisions of façade systems at the early design phase: Issues, challenges and solutions. J. Façade Des. Eng. 2015, 3, 165–183. [Google Scholar] [CrossRef] [Green Version]
  2. Montali, J.; Overend, M.; Pelken, P.M.; Sauchelli, M. Knowledge-Based Engineering in the design for manufacture of prefabricated façades: Current gaps and future trends. Archit. Eng. Des. Manag. 2017, 14, 78–94. [Google Scholar] [CrossRef] [Green Version]
  3. Klein, T. Integral Façade Construction-Towards a New Product Architecture for Curtain Walls. Ph.D. Thesis, Delft University, Delft, The Netherlands, 2013. [Google Scholar]
  4. Voss, E. An Approach to Support the Development of Manufacturable Façade Designs. Ph.D. Thesis, University of Cambridge, Cambridge, UK, 2013. [Google Scholar]
  5. Bergers, M.; Natividad, K.; Morse, S.M.; Norville, H.S. Full scale tests of heat strengthened glass with ceramic frit. Glas. Struct. Eng. 2016, 1, 261–276. [Google Scholar] [CrossRef] [Green Version]
  6. Dunlap, A.; Asava, R. Three-dimensional condensation risk analysis of insulated curtain wall spandrels. In Advances in Hygrothermal Performance of Building Envelopes: Materials, Systems and Simulations; ASTM International: West Kanshohoken, PA, USA, 2017; Volume 1599, pp. 232–260. [Google Scholar]
  7. Behr, R.A. On-site investigations of spandrel glass microenvironments. Build. Environ. 1995, 30, 61–72. [Google Scholar] [CrossRef]
  8. Triano, J.; Cocca, J. Thermal breakage of spandrel glass: A case study in Forensic Engineering 2012: Gateway to a Better Tomorrow. In Proceedings of the 6th Congress on Forensic Engineering, San Francisco, CA, USA, 31 October–3 November 2012; 2013; pp. 143–150. [Google Scholar]
  9. Jazaeri, J.; Gordon, R.L.; Alpcan, T. Influence of building envelopes, climates, and occupancy patterns on residential HVAC demand. J. Build. Eng. 2019, 22, 33–47. [Google Scholar] [CrossRef]
  10. Favoino, F.; Overend, M.; Jin, Q. The optimal thermo-optical properties and energy saving potential of adaptive glazing technologies. Appl. Energy 2015, 156, 1–15. [Google Scholar] [CrossRef] [Green Version]
  11. Ko, M.; Gosti, T.; Kristl, Ž. Influence of architectural building envelope characteristics on energy performance in Central European climatic conditions. J. Build. Eng. 2018, 15, 278–288. [Google Scholar]
  12. Kültür, S.; Türkeri, N.; Knaack, U. A Holistic Decision Support Tool for Façade Design. Buildings 2019, 9, 186. [Google Scholar] [CrossRef] [Green Version]
  13. Stamoulis, M.N.; Santos, G.H.; Lenz, W.B.; Tusset, A.M. Genetic Algorithm Applied to Multi-Criteria Selection of Thermal Insulation on Industrial Shed Roof. Buildings 2019, 9, 238. [Google Scholar] [CrossRef] [Green Version]
  14. Faye, M.; Lartigue, B.; Kane, S. Influence of structural and thermophysical parameters of insulating aggregates on the effective thermal conductivity of lightweight concrete. J. Build. Eng. 2019, 21, 74–81. [Google Scholar] [CrossRef]
  15. Widiastuti, R.; Caesarendra, W.; Prianto, E.; Budi, W.S. Study on the Leaves Densities as Parameter for Effectiveness of Energy Transfer on the Green Façade. Buildings 2018, 8, 138. [Google Scholar] [CrossRef] [Green Version]
  16. Widiastuti, R.; Caesarendra, W.; Zaini, J. Observation to Building Thermal Characteristic of Green Façade Model Based on Various Leaves Covered Area. Buildings 2019, 9, 75. [Google Scholar] [CrossRef] [Green Version]
  17. Tarabieh, K.; Aboulmagd, A. Thermal Performance Evaluation of Common Exterior Residential Wall Types in Egypt. Buildings 2019, 9, 95. [Google Scholar] [CrossRef] [Green Version]
  18. CSTB, NF DTU P3-Travaux de Bâtiment-Travaux de Vitrerie-Miroiterie-Partie 3: Mémento Calculs des Contraintes Thermiques. 2006. Available online: https://boutique.cstb.fr/39-vitrerie-miroiterie/207-nf-dtu-39-travaux-de-vitrerie-miroiterie-3260050850032.html (accessed on 2 April 2020).
  19. British Standard Institution, BS EN 673-Glass in Building—Determination of Thermal Transmittance (U Value)—Calculation Method; BSI Standards Publication: London, UK, 2011.
  20. Statistical Analysis System Institute. 2019. Available online: https://www.sas.com/en_us/home.html (accessed on 3 April 2020).
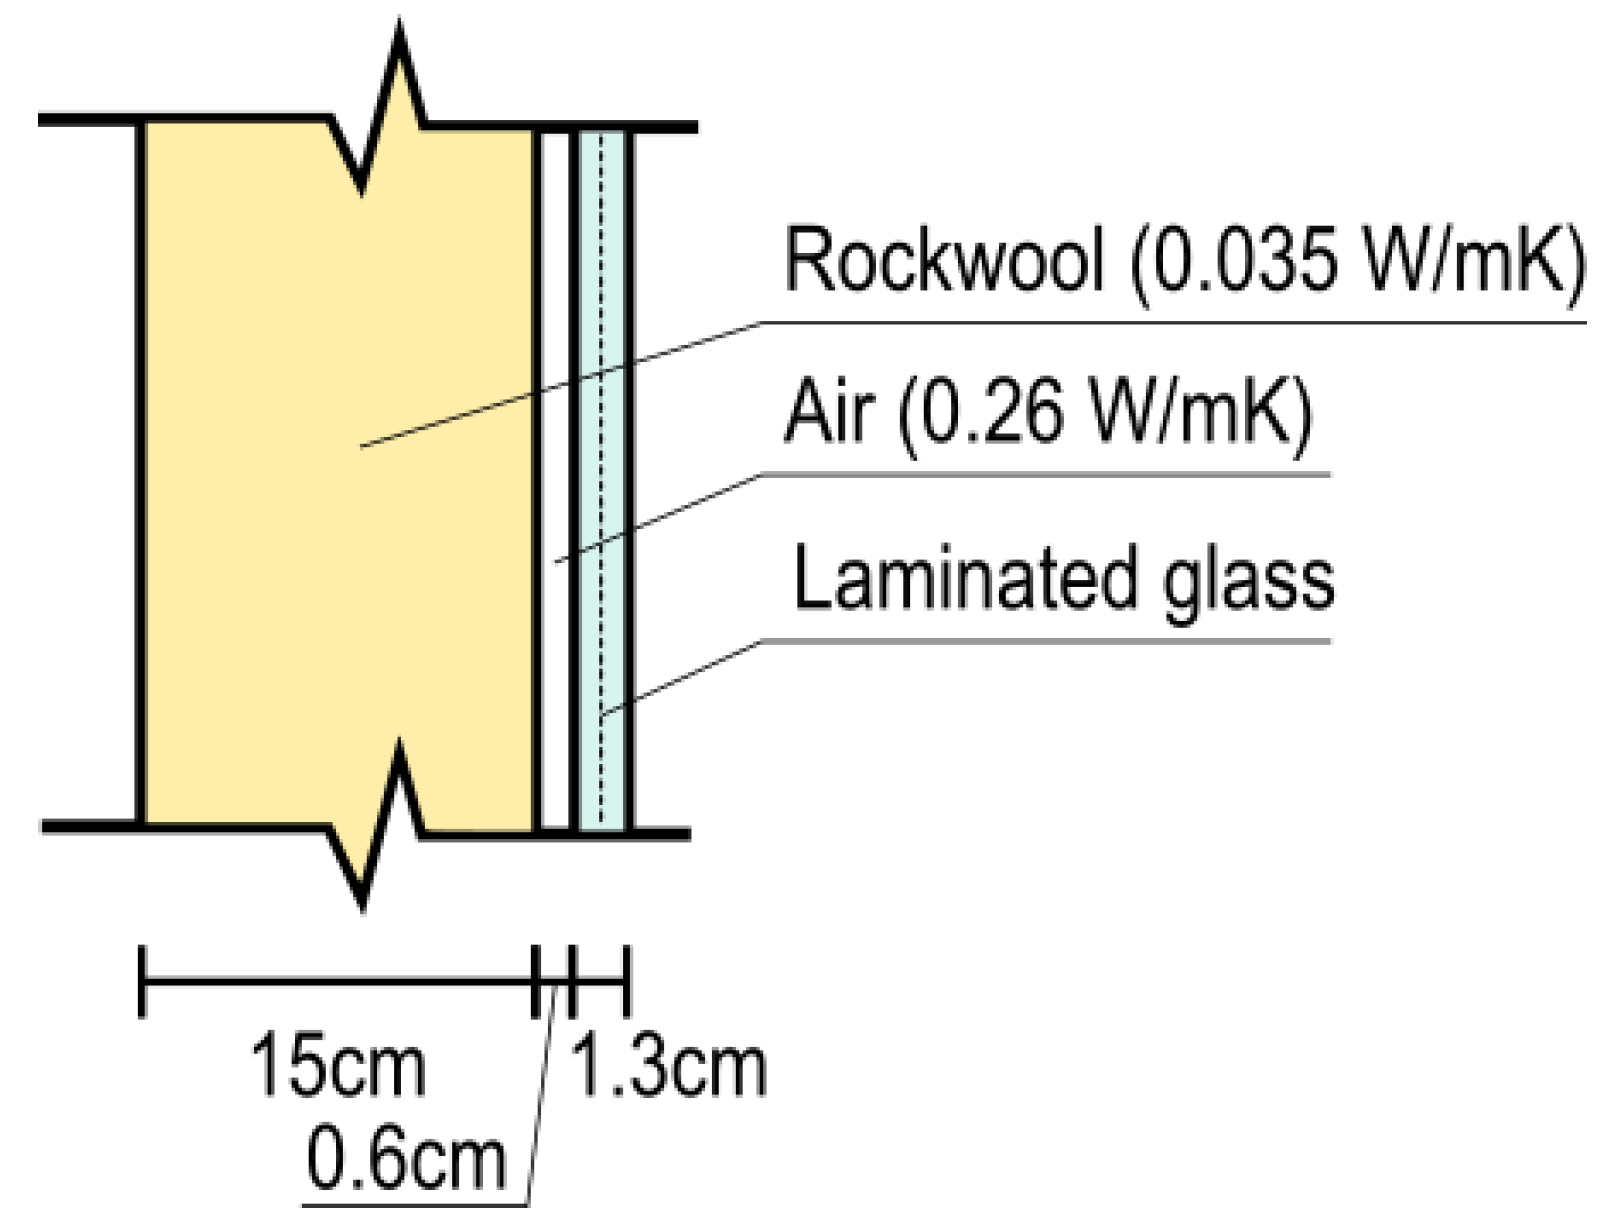
Figure 1. Build-up of analyzed spandrel.
Buildings 10 00080 g001
Figure 2. Three-step process for the calculation of the temperature gradient in glasses.
Buildings 10 00080 g002
Figure 3. IES VE models generated for different view angles (a) 0°, (b) 30°, (c) 60°.
Buildings 10 00080 g003
Figure 4. View angle to identify the presence of external obstructions limiting the solar radiation.
Buildings 10 00080 g004
Figure 5. Thermal network generated from the local analysis of the spandrel system shown in Figure 1.
Buildings 10 00080 g005
Figure 6. Daily variation of the thermally induced temperature gradients (in Kelvin) for the three analyzed configurations.
Buildings 10 00080 g006
Figure 7. Yearly variation of the thermally induced temperature gradients (K) in New York for values of view angles of 0° (a), 30° (b) and 60° (c) for the worst combination of glass type/insulation type in Table 5 and Table 6.
Buildings 10 00080 g007
Figure 8. Yearly variation of the thermally induced temperature gradients (K) in London for values of view angles of 0° (a), 30° (b) and 60° (c) for the worst combination of glass type/insulation type in Table 7 and Table 8.
Buildings 10 00080 g008
Figure 9. Yearly variation of the thermally induced temperature gradients (K) in Mumbai for values of view angles of 0° (a), 30° (b) and 60° (c) for the worst combination of glass type/insulation type in Table 9 and Table 10.
Buildings 10 00080 g009
Figure 10. Least square mean (radius of circles) of temperature gradients for the three analyzed locations. Per each location, a combination of variables that leads to results sharing the same circle color means that the combination is not statistically different.
Buildings 10 00080 g010
Table 1. Thermo-physical properties for the analyzed insulation.
Insulation CodeDescriptionAbsorptance (-)Emissivity (-)Thermal Conductivity (W/mK)Thickness (cm)
A1Light color0.200.020.03515
A2Medium color0.550.020.03515
A3Dark color0.900.020.03515
Table 2. Thermo-physical properties for the analyzed single glazing.
Insulation CodeDescriptionSolar Transmittance (-)Solar Absorptance (-)Emissivity towards Interior (-)Emissivity towards Exterior (-)
G1Very transparent0.810.120.840.84
G2Semi-transparent0.630.290.300.84
G3Nearly opaque0.360.590.840.84
Table 3. General environmental data for the three cities under analysis.
LocationTypical Meteorological YearLatitude/LongitudeMaximum Global Irradiance on the Horizontal (W/m2)Maximum External Temperature (°C)Minimum External Temperature (°C)
LondonKew EWY51°34′ N–0°11′ W952.626.6−6.1
New YorkNew York TMY240° 42′ N–74° 0′ O1038.535.0−15.6
MumbaiMumbai IWEC19°04′ N–72°52′ E1011.940.012.4
Table 4. View angles (°) and orientations analyzed for each location.
LocationView Angles Analyzed (°)Orientations Analyzed
London0-30-60E-S-W
New York0-30-60E-S-W
Mumbai0-30-60E-S-W
Table 5. Maximum temperature gradients (K) for New York.
Exposition Type
SouthEastWest
View Angle θView Angle θView Angle θ
Glass TypeInsulation Color30°60°30°60°30°60°
Very transparentLight372612302210302210
Medium34241128211028219
Dark402813332411332411
Semi-transparentLight493416413014413013
Medium392713322311322310
Dark412913342512342511
Nearly opaqueLight594219493617493616
Medium453115372713372712
Dark443114362713372712
Table 6. Maximum thermal stresses (MPa) for New York.
Exposition Type
SouthEastWest
View Angle θView Angle θView Angle θ
Glass TypeInsulation Color30°60°30°60°30°60°
Very transparentLight54351258321158289
Medium50321154301154269
Dark593813643513633110
Semi-transparentLight724716784315773813
Medium573712613412613010
Dark603913653613653111
Nearly opaqueLight875719945219944615
Medium664314713914713412
Dark644214703914693411
Table 7. Maximum temperature gradients (K) for London.
Exposition Type
SouthEastWest
View Angle θView Angle θView Angle θ
Glass TypeInsulation Color30°60°30°60°30°60°
Very transparentLight54351258321158289
Medium50321154301154269
Dark593813643513633110
Semi-transparentLight724716784315773813
Medium573712613412613010
Dark603913653613653111
Nearly opaqueLight875719945219944615
Medium664314713914713412
Dark644214703914693411
Table 8. Maximum thermal stresses (MPa) for London.
Exposition Type
SouthEastWest
View Angle θView Angle θView Angle θ
Glass TypeInsulation Color30°60°30°60°30°60°
Very transparentLight322173419734176
Medium301963218632155
Dark352383821738186
Semi-transparentLight432894626946228
Medium342273620736186
Dark362383921838196
Nearly opaqueLight52341156311156279
Medium392584223842207
Dark382584123841207
Table 9. Maximum temperature gradients (K) for Mumbai.
Exposition Type
SouthEastWest
View Angle θView Angle θView Angle θ
Glass TypeInsulation Color30°60°30°60°30°60°
Very transparentLight434018372913403114
Medium403716352712372913
Dark484319413214443415
Semi-transparentLight585324503917534219
Medium464219393114423315
Dark494420423314453516
Nearly opaqueLight706429614821655023
Medium534922463616493817
Dark524821453516483717
Table 10. Maximum thermal stresses (MPa) for Mumbai.
Exposition Type
SouthEastWest
View Angle θView Angle θView Angle θ
Glass TypeInsulation Color30°60°30°60°30°60°
Very transparentLight2624102217824188
Medium2422102116722178
Dark2826112419826209
Semi-transparentLight343214302310322511
Medium2725112318825199
Dark2926122520926219
Nearly opaqueLight423817362812383014
Medium32291327219292310
Dark31281327219282210