3.1. Geometrical and Structural Characteristics of the Building
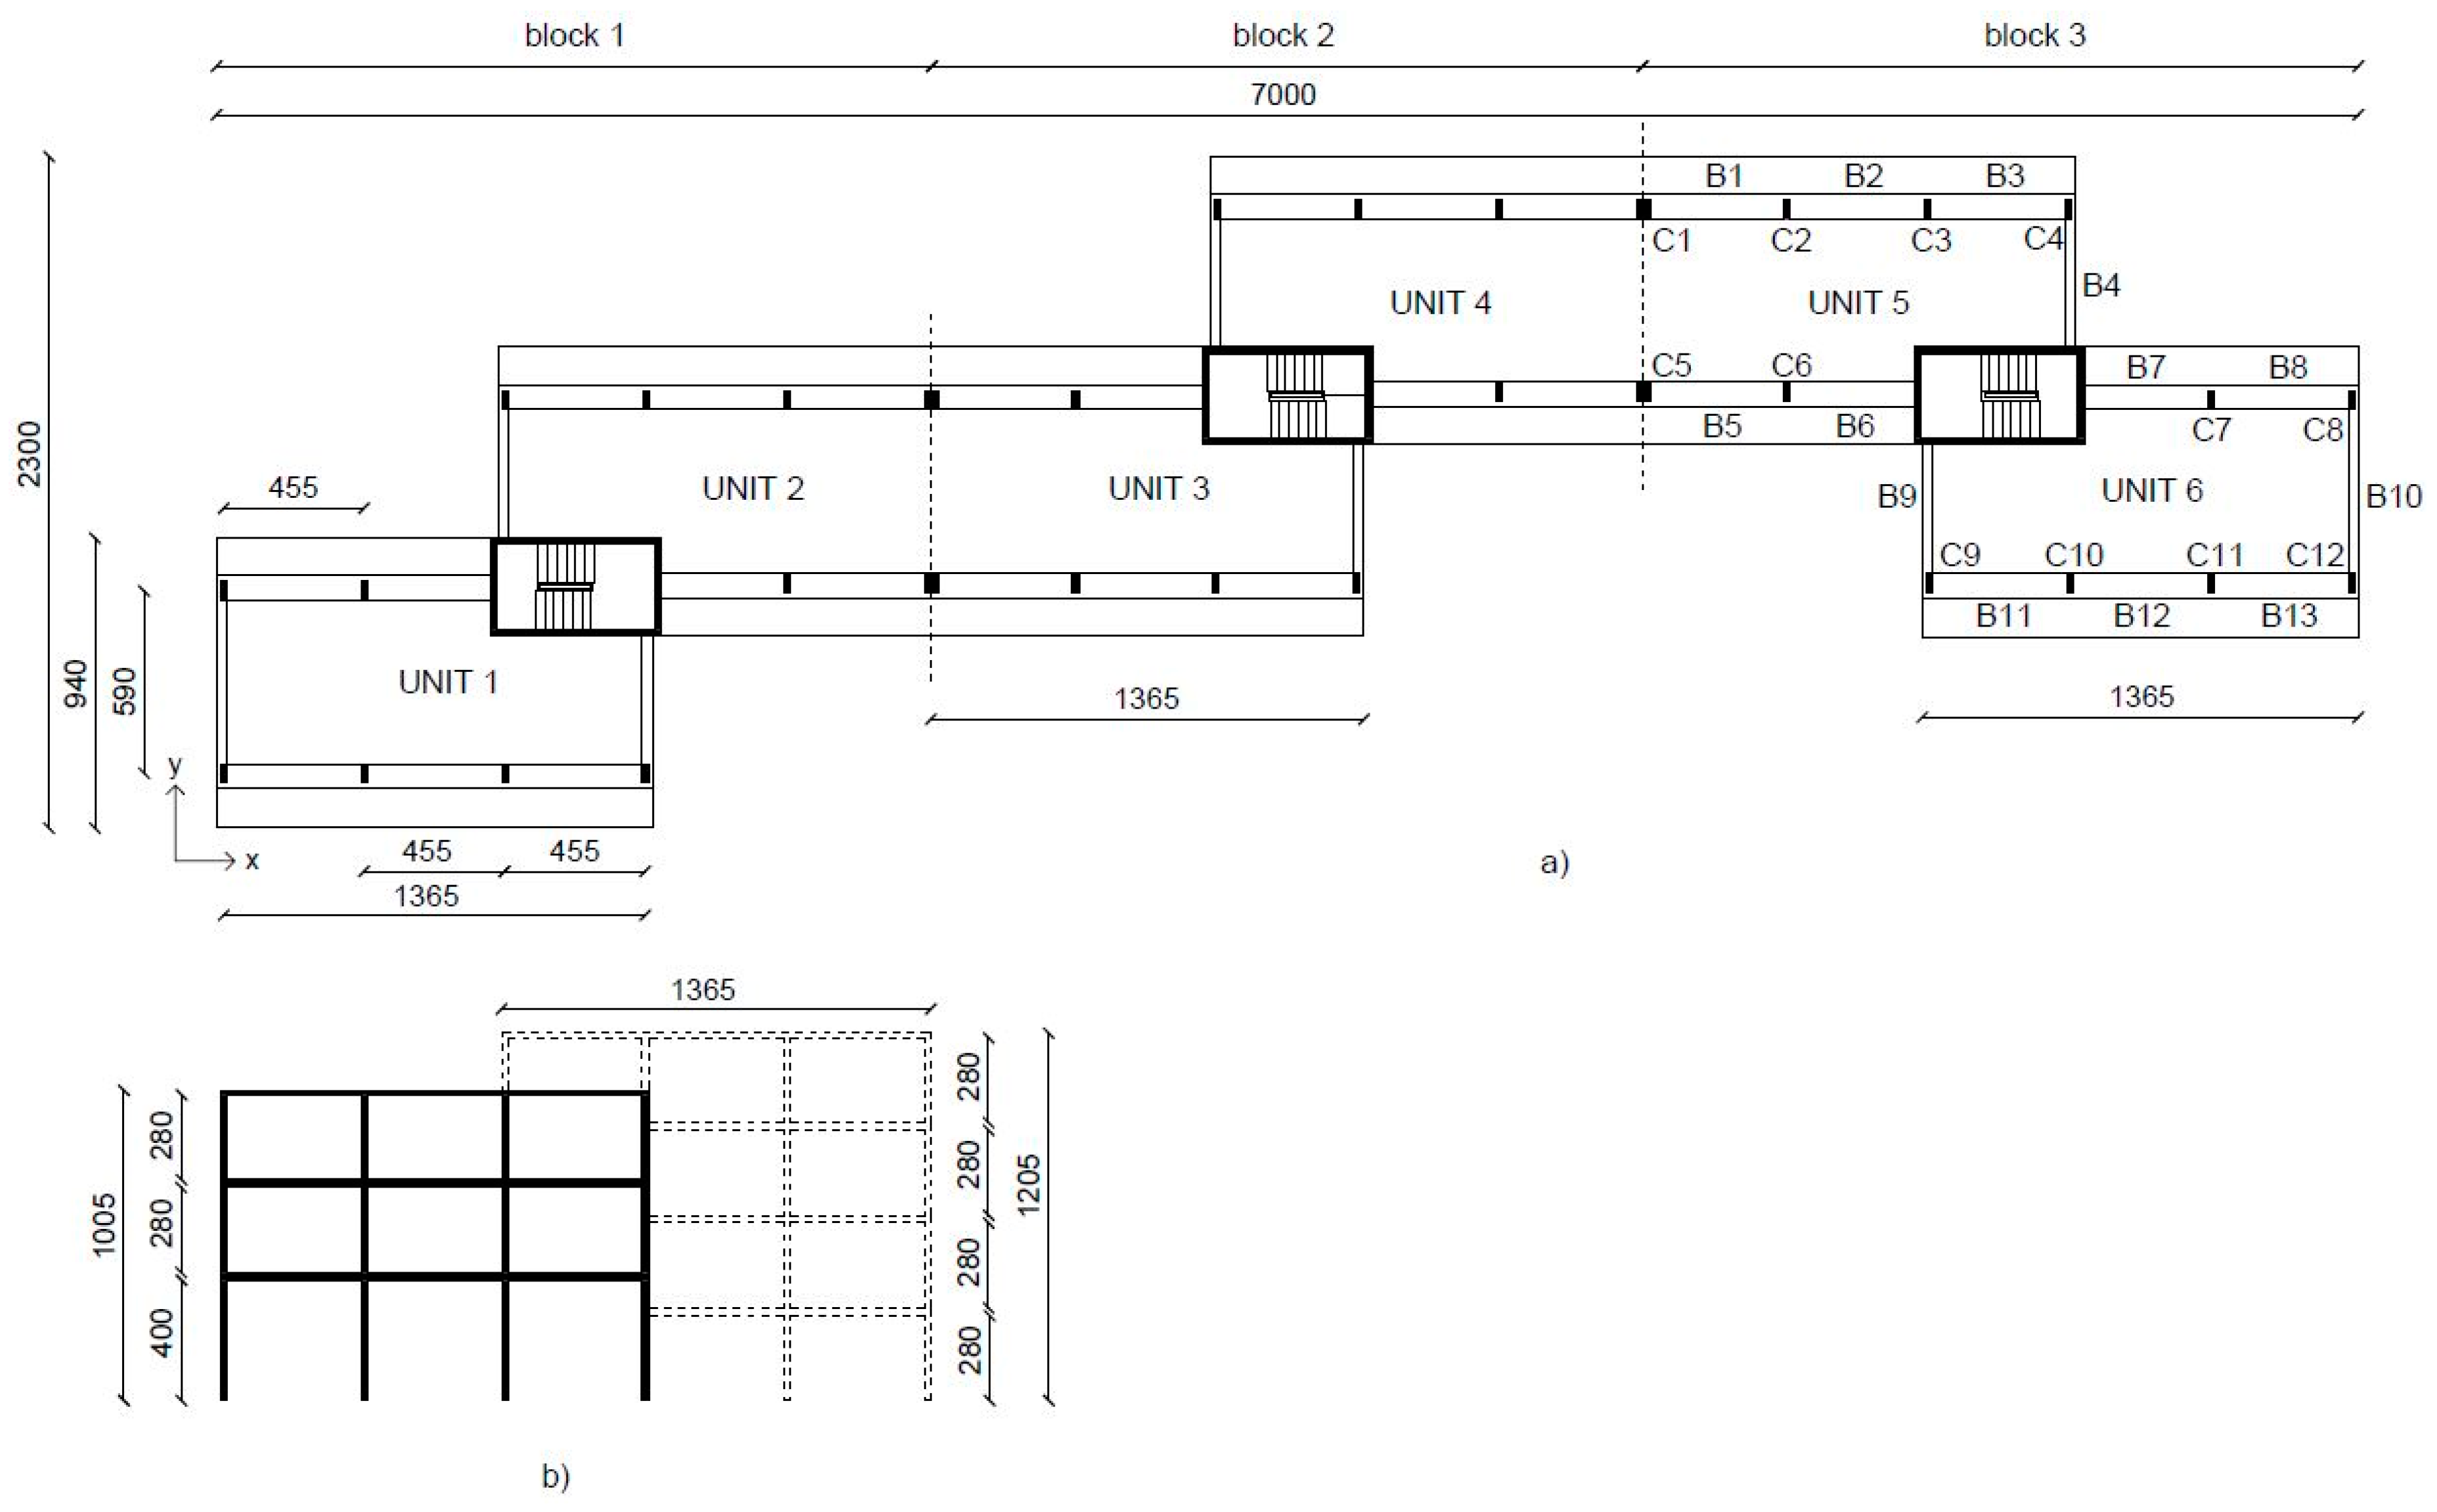
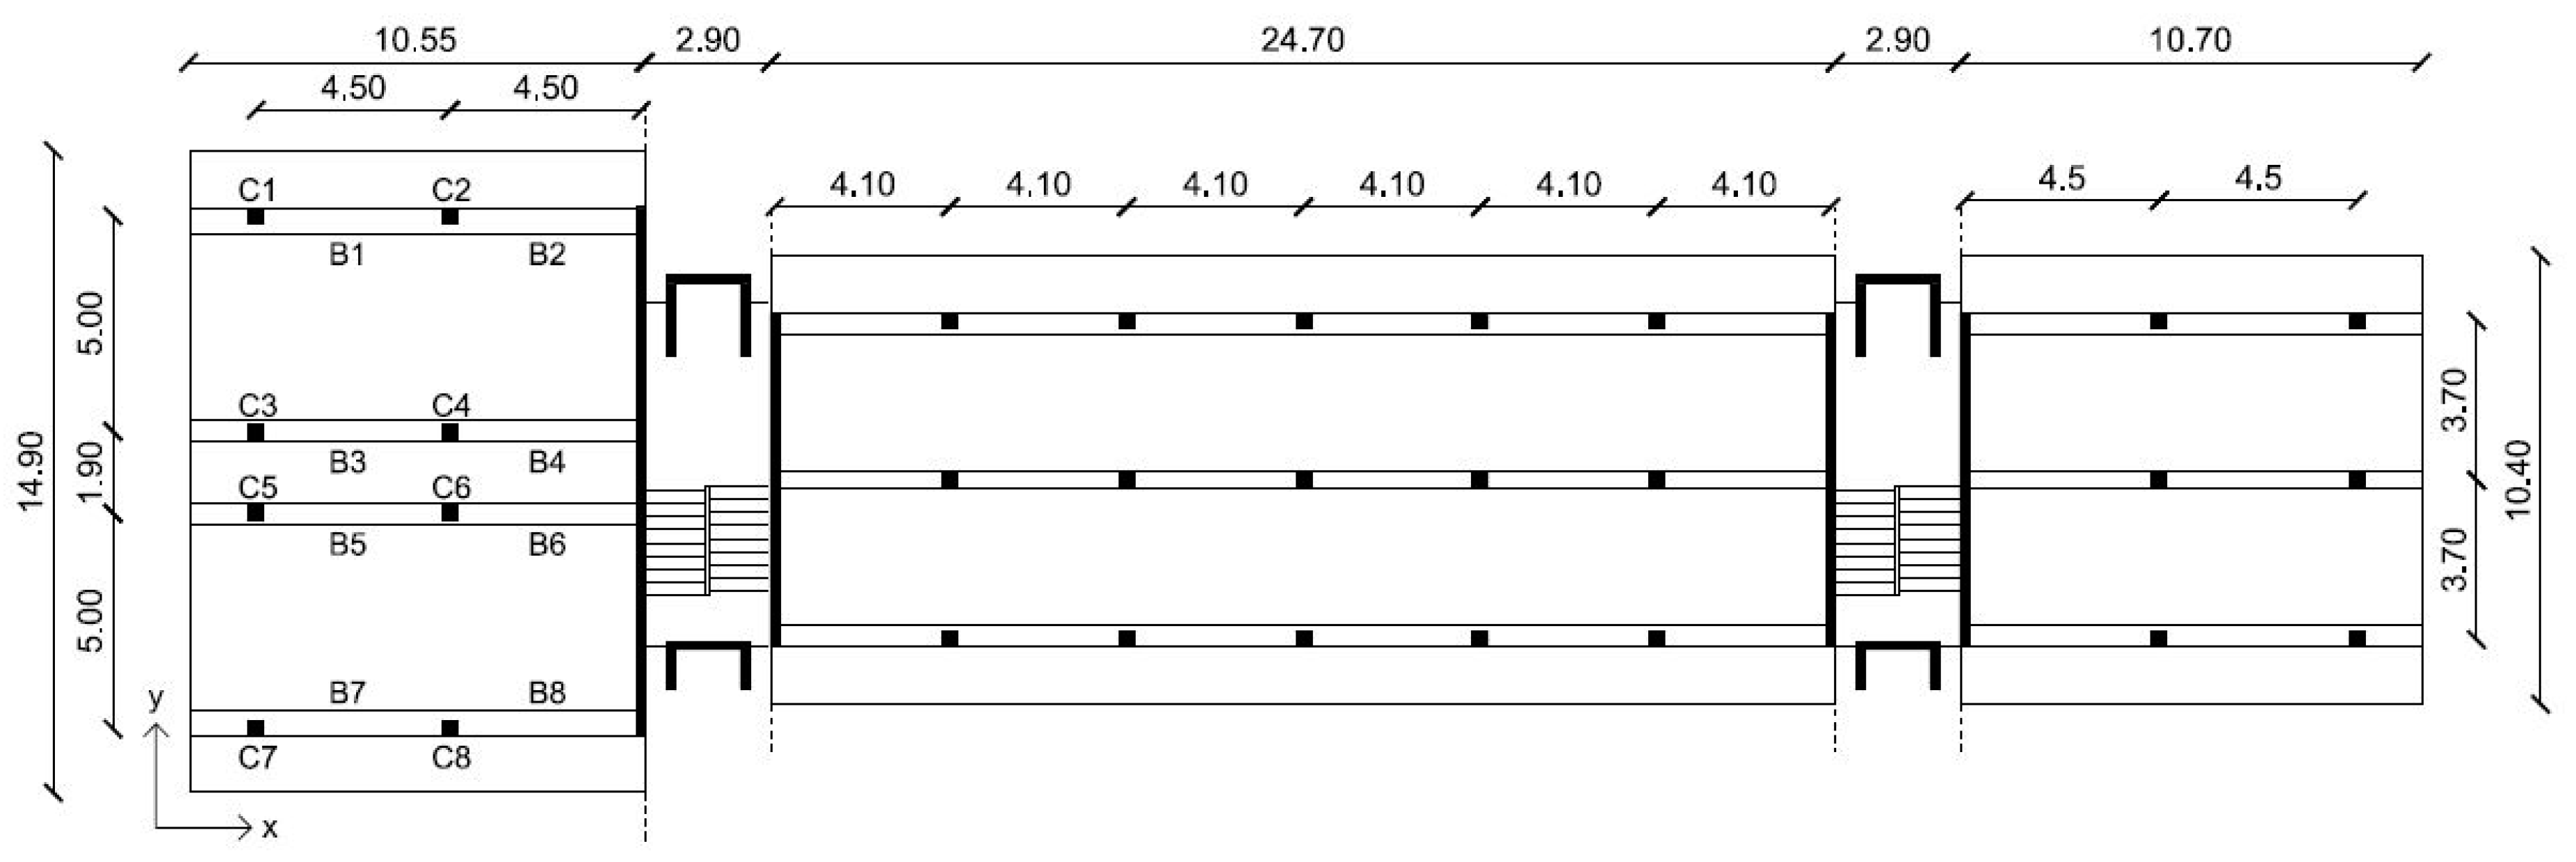
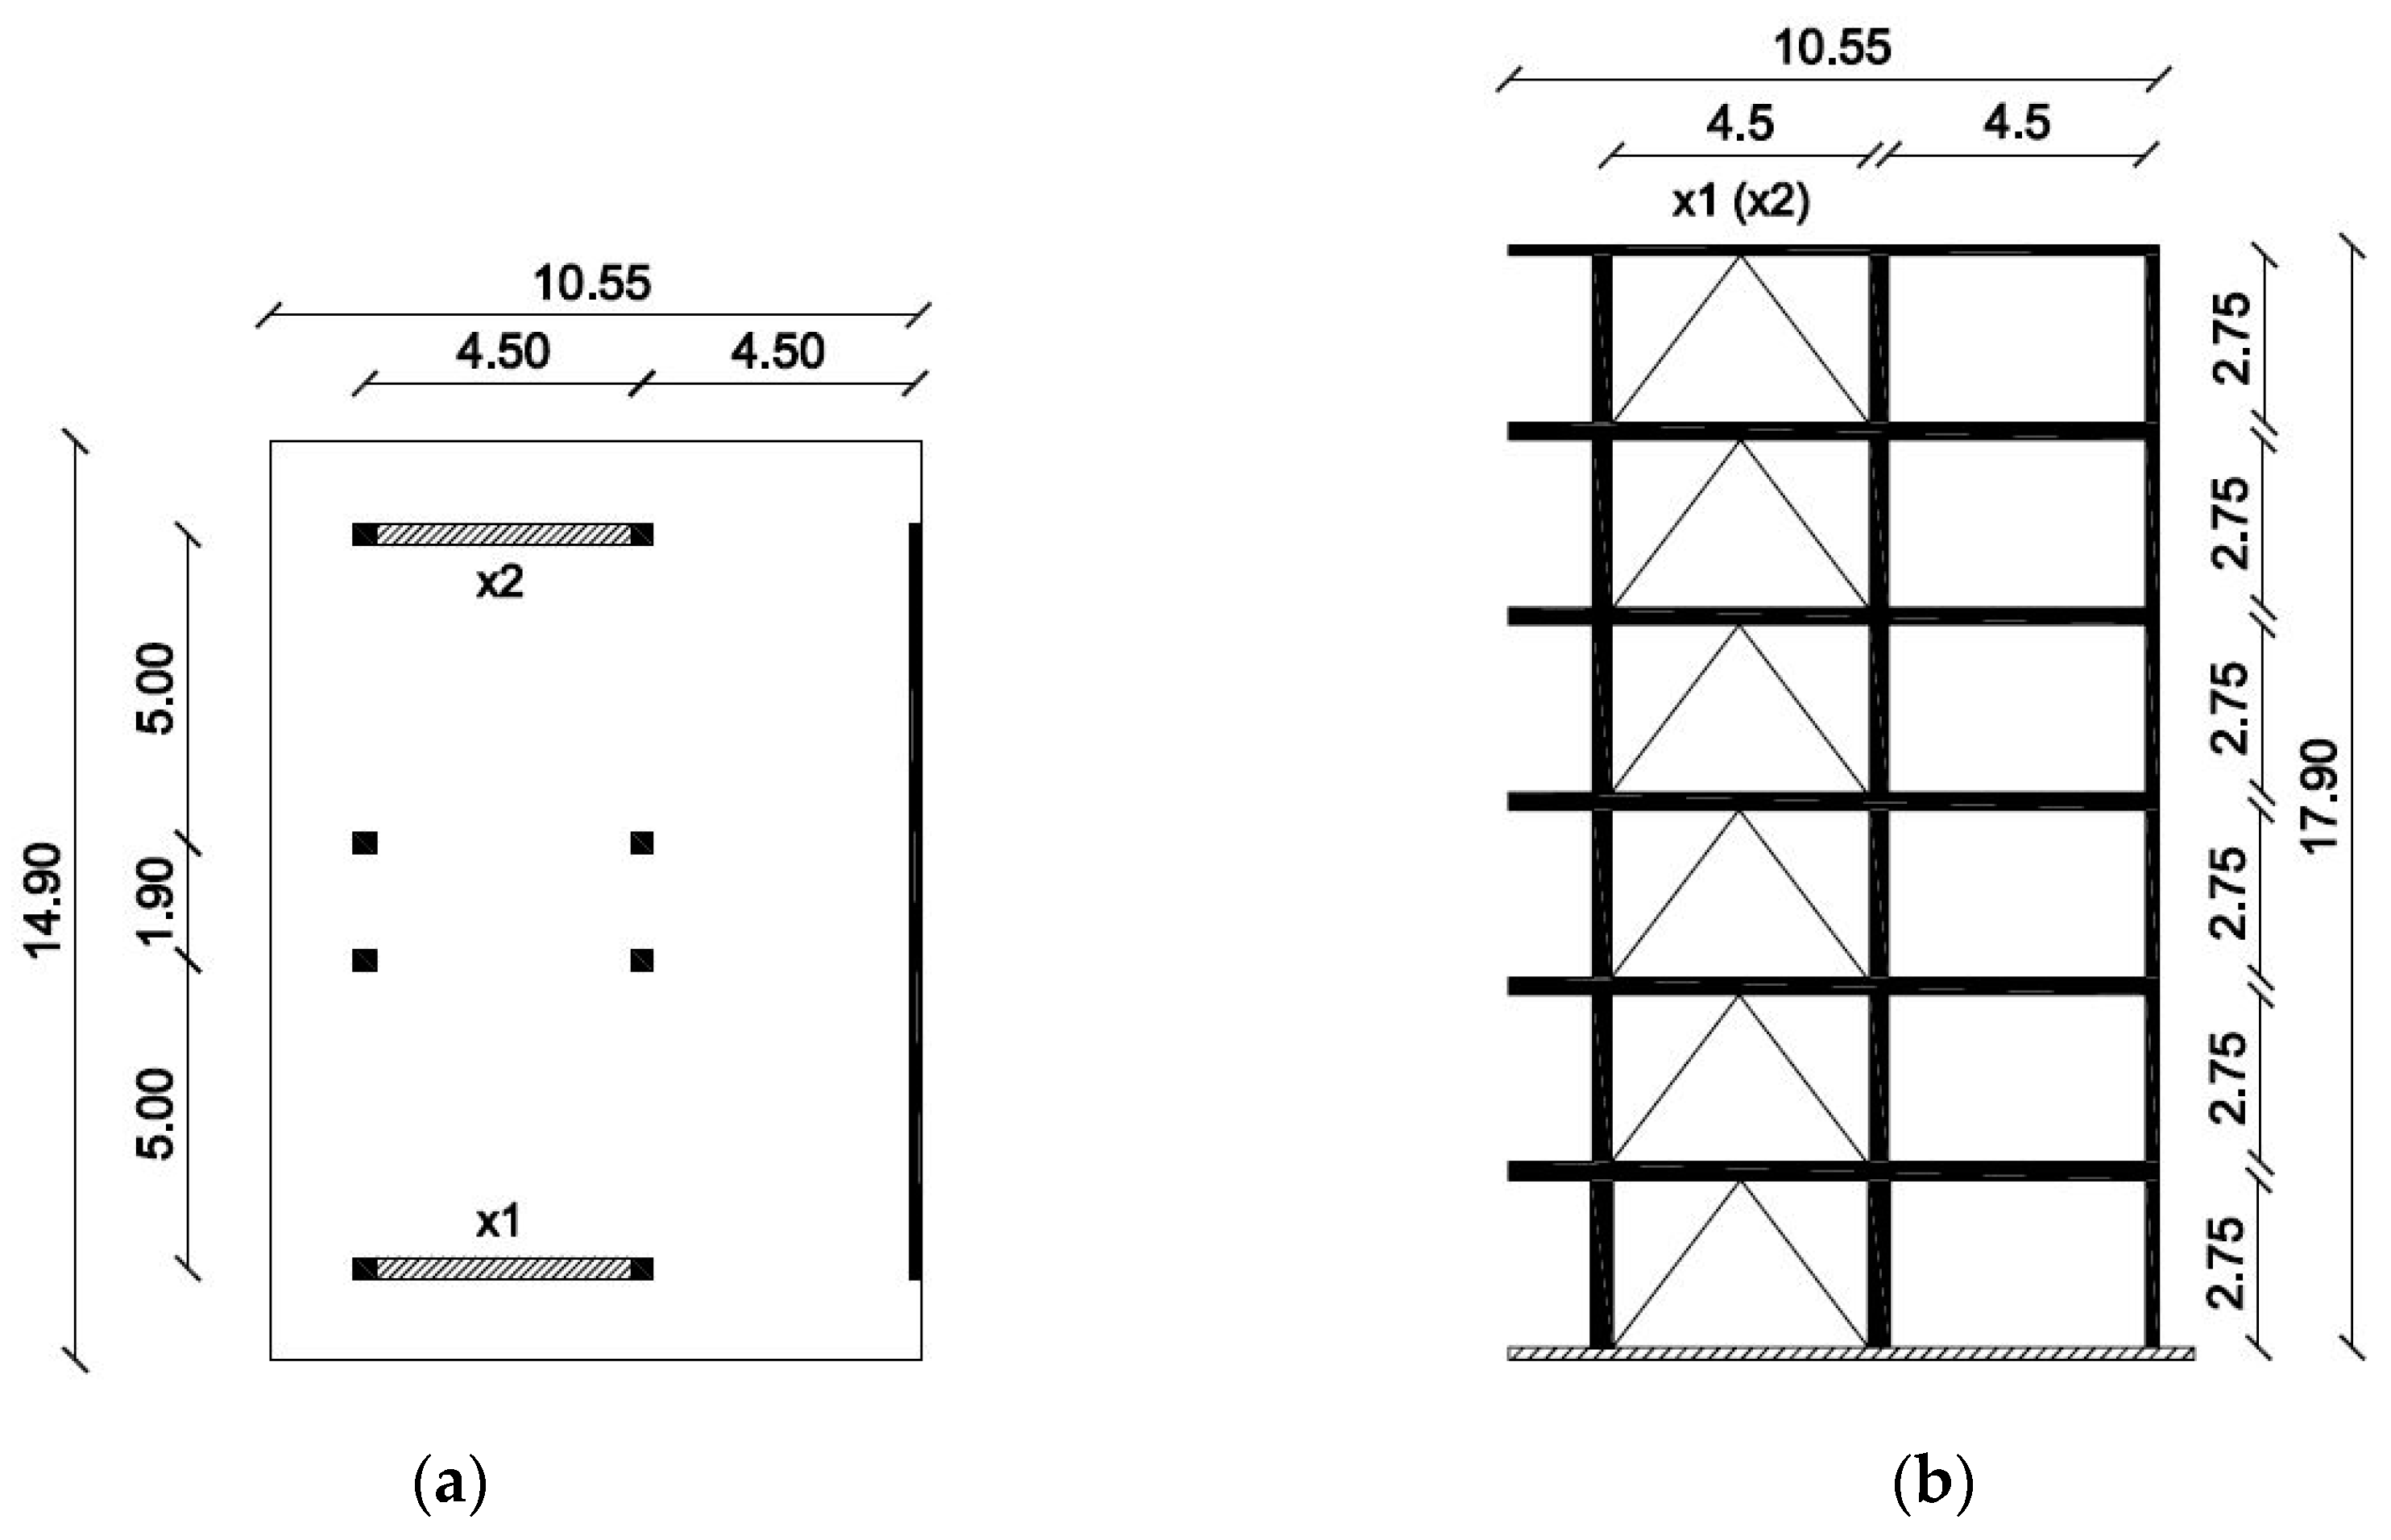
The first case study, building A, whose plan and elevation are shown in
Figure 3, is an RC residential building in Udine, Italy, designed and built between 1963 and 1966, in accordance with the provisions of the first Italian Building Code [
23].
The building is 70-m long and 23-m wide. Dotted lines in
Figure 3a represent the presence of two technical joints, each made of elastomeric material and having a width of 4 cm. These two joints divide the building in three blocks. Each block is composed of two units, which are in opposite position with respect to the central stairwell.
Considering units 2 and 3, the maximum relative displacement in approach between them under seismic action occurs on the fourth floor and it is equal to 2.9 cm. Considering units 4 and 5, the maximum relative displacement in approach between them occurs on the fourth floor and it is equal to 3.2 cm.
In both cases the relative displacement of the two blocks is smaller than the width of the technical joint. Moreover, being that the joints are made of elastomeric material, their rigidity is assumed negligible. Hence, the blocks are not likely to interact during the seismic motion. For this reason, the building can be divided into three independent blocks.
According to [
14], each block is irregular both in plan and along the height. The irregularity in plan (
Figure 3a) is due to the dispersed layout and the asymmetrical distribution of mass and stiffness with respect to two orthogonal directions of the block. The irregularity along the height (
Figure 3b) is due to the different heights of the units and the staggered floors.
The two lateral housing units (no. 1 and 6) have three floors; the others have four floors. In all of the units the under-roof floor is impracticable, and the inter-story height of units is about 2.8 m, except for the first floor of units no. 1, 4, and 6, whose height is 4 m. On the ground floor of units no. 1, 4, and 6, the RC frame is not filled in by masonry walls, while the other three units have RC ground frames filled by masonry walls up to about 30 cm from the first floor. In this 30 cm there is a continuous strip window.
Building A’s vertical structures consist of columns, all with a section of 20 × 60 cm, with the larger side parallel to the y axis (
Figure 3a), and walls only in correspondence with stairwells. All walls are 20-cm thick: the ones in X direction have length 520 cm and the ones in Y direction have length 315 cm. The longitudinal reinforcement of central columns (columns like C2, C3 and C6 in
Figure 3a) is made by 4
Φ16 at corners along the entire height. The reinforcement of external columns (columns like C1, C4 and C5) is composed of two layers per story, with layers comprising 4
Φ16 parallel to the two larger sides of the section in the lower three stories, and two layers of 3
Φ16 in the top story where there are short columns that bear the roof. The transverse reinforcement of the columns consists of
Φ6 every 10 cm.
Primary beams, oriented in X direction, have a section of 80 × 15 cm2. Secondary beams, oriented parallel to the Y direction, are present only in the exterior sides of the building and have a section of 33 × 23.5 cm2. All under-roof floors have beams parallel to the X direction, with a section of 80 × 15 cm2, and beams parallel to the y direction with a section of 20 × 15 cm2. The longitudinal reinforcement of all beams is made by Φ16. The transverse reinforcement for beams in the X direction consists of Φ8 every 7 cm close to the ends and every 25 cm in the middle, while beams parallel to the Y direction are reinforced by Φ6 every 25 cm.
Floors are made of precast RC joists, oriented parallel to the Y direction and having a depth of 20.5 cm and an interaxle spacing of 25 cm, completed with clay bricks and a cast-in-place concrete slab 3-cm thick. The under-roof floor is of the same type with the only difference being the joint depth, which is equal to 15.5 cm. In addition, the structure of the roof is similar, with a joint depth of 19.5 cm.
Foundations are composed of inverse T-shape RC beams, which connect the columns in the Y direction, and RC curbs in the X direction.
The characteristics of the materials are defined on the basis of available documentation. The concrete characteristic cylindrical compressive strength is equal to 25 MPa. The concrete average strength can be calculated as 25 + 8 = 33 MPa. Reinforcing bars are of Aq50 type, hence, according to [
24], have a characteristic yield strength of 264.9 MPa. According to [
14], the yield average strength of steel can be calculated as 264.9 × 1.125 = 298 MPa.
For the considered case study, a level of knowledge LC2 is assumed, to which a confidence factor FC = 1.2 corresponds [
14]. Consequently, the concrete design compressive strength to be used for ductile mechanism verifications is 33/1.2 = 27.5 MPa, and that for brittle mechanism verifications is 33/(1.2 × 1.5) = 18.3 MPa. The steel design yield strength for ductile mechanism verifications is 298/1.2 = 248.3 MPa, and that for brittle mechanism verifications is 298/(1.2 × 1.15) = 215.9 MPa. To take account of cracking, a reduced concrete elastic modulus equal to 22,033 MPa for beams and 15,738 MPa for columns is considered.
Gravity loads due to the floor weight are represented by a dead load of 4 kN/m2 on habitable stories, 2.35 kN/m2 on the under-roof story, and 2.70 kN/m2 for the roof. The weight of the infill perimeter walls is considered assuming a linearly distributed load of 9.97 kN/m acting on the beams below. Live loads of 2 kN/m2 are applied on all habitable stories, as well as 4 kN/m2 on balconies and staircases, 0.5 kN/m2 on under-roof floors, and 1.2 kN/m2 on the horizontal projection of the roof, due to the snow.
Since the three two-unit blocks of which the building is made are equivalent to each other, an analysis of only the block formed by units 5 and 6 is presented in the following.
3.2. Results of the Modal and FNA Analyses
The results of the modal analysis on one building block are summarized in
Table 1, where the period of vibration of the main modes are reported together with the corresponding Modal Participating Mass Ratio (MPMR) in the three principal directions of the building.
Table 1 shows that modes 8 and 10 are mixed rotationally around the vertical axis z and translationally along Y axis. Mode 12 is translational along X.
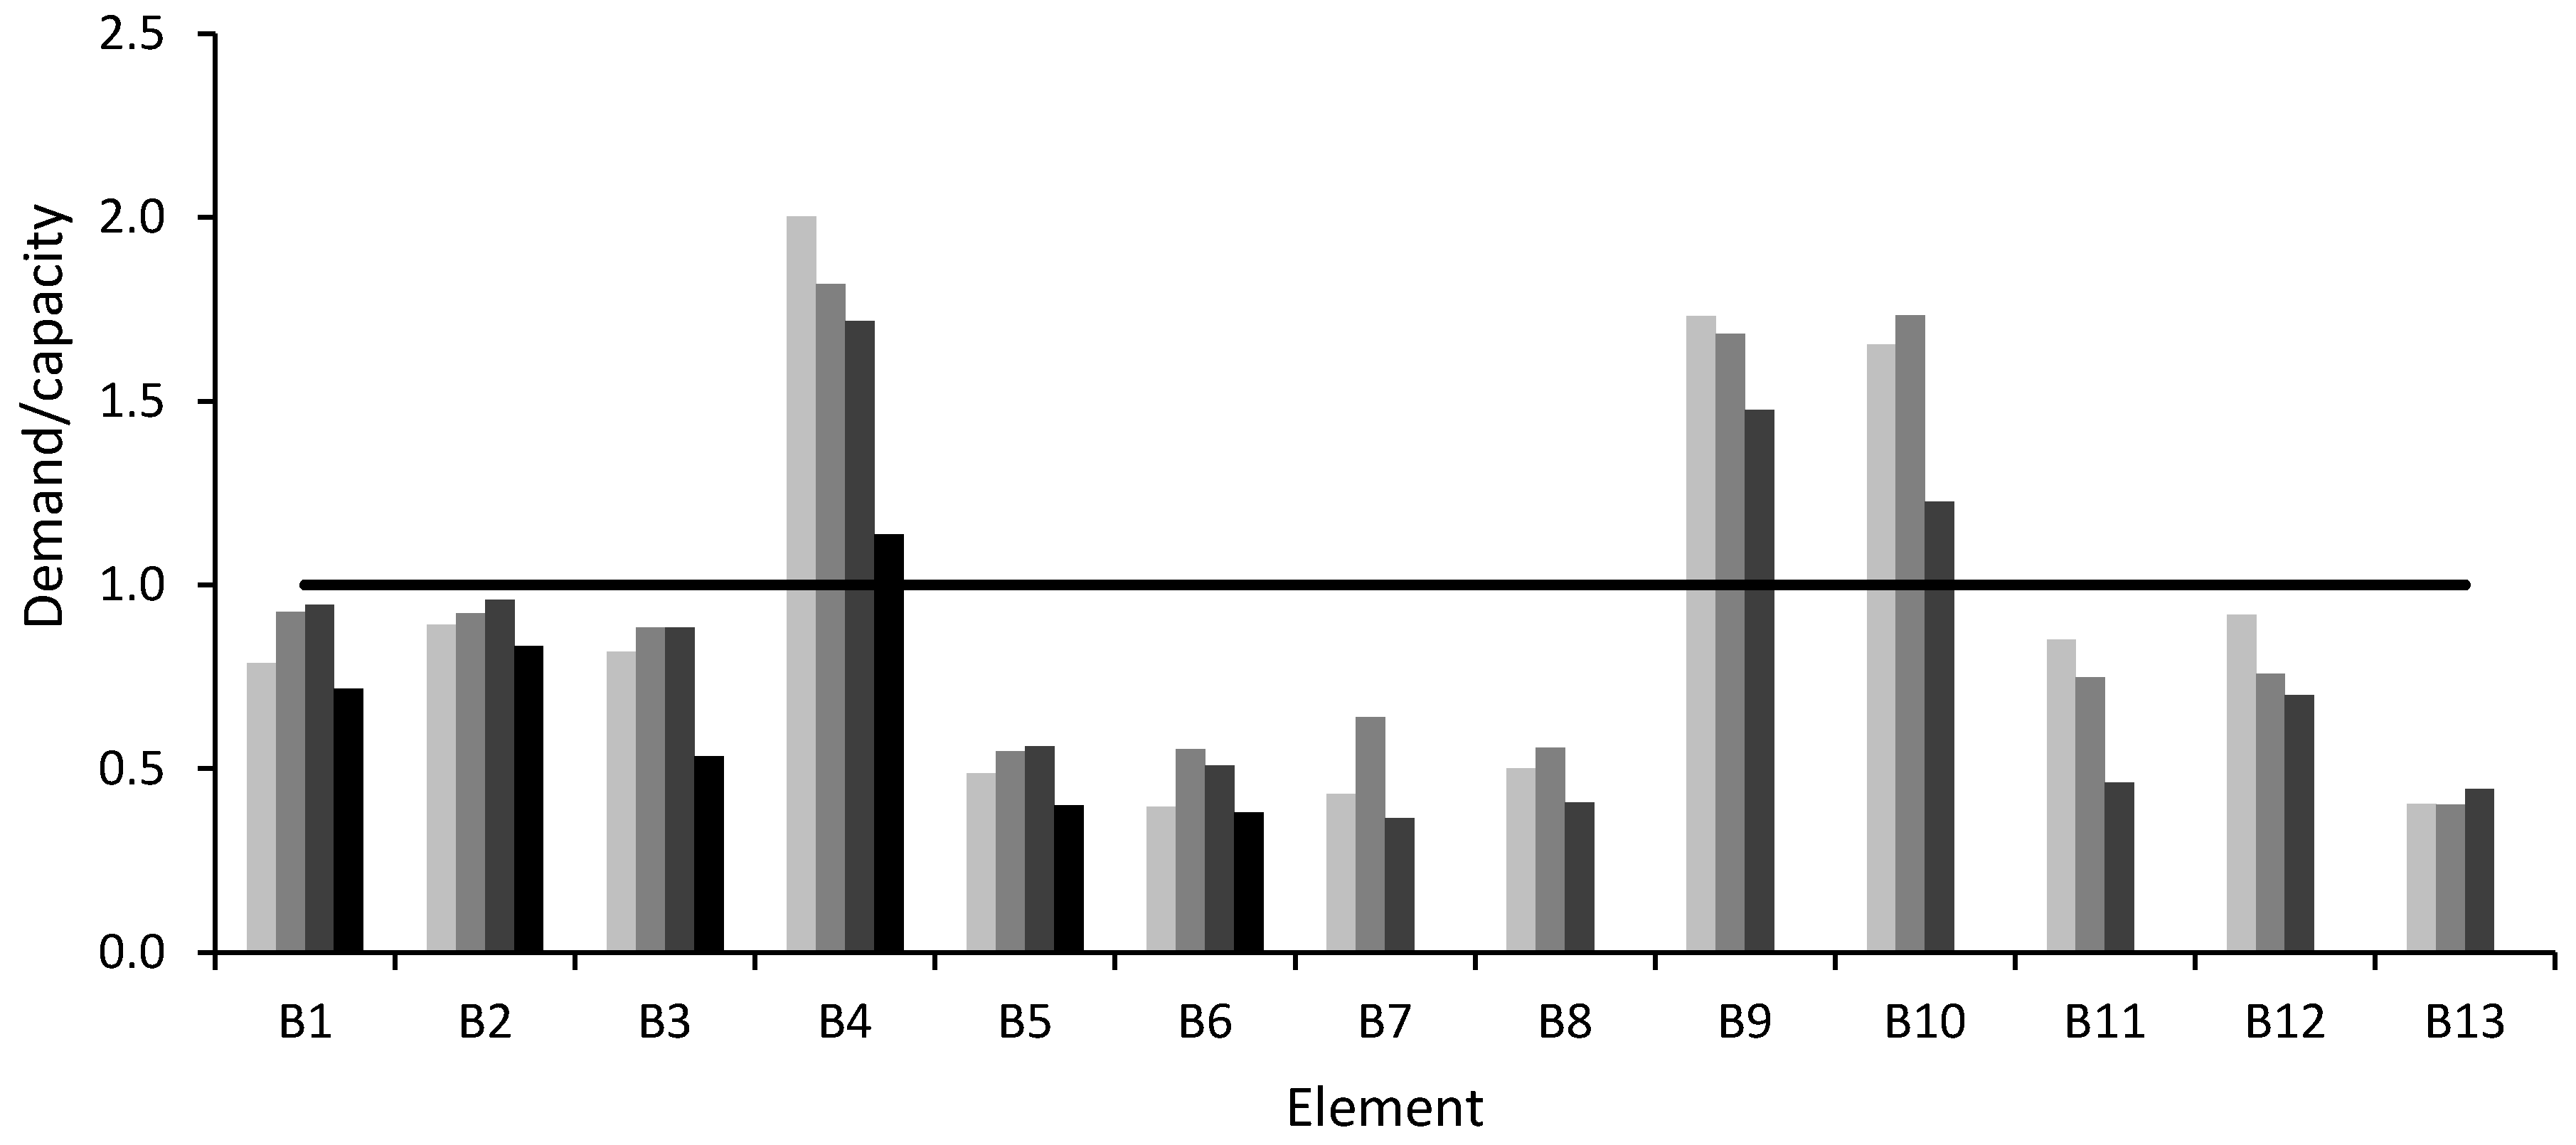
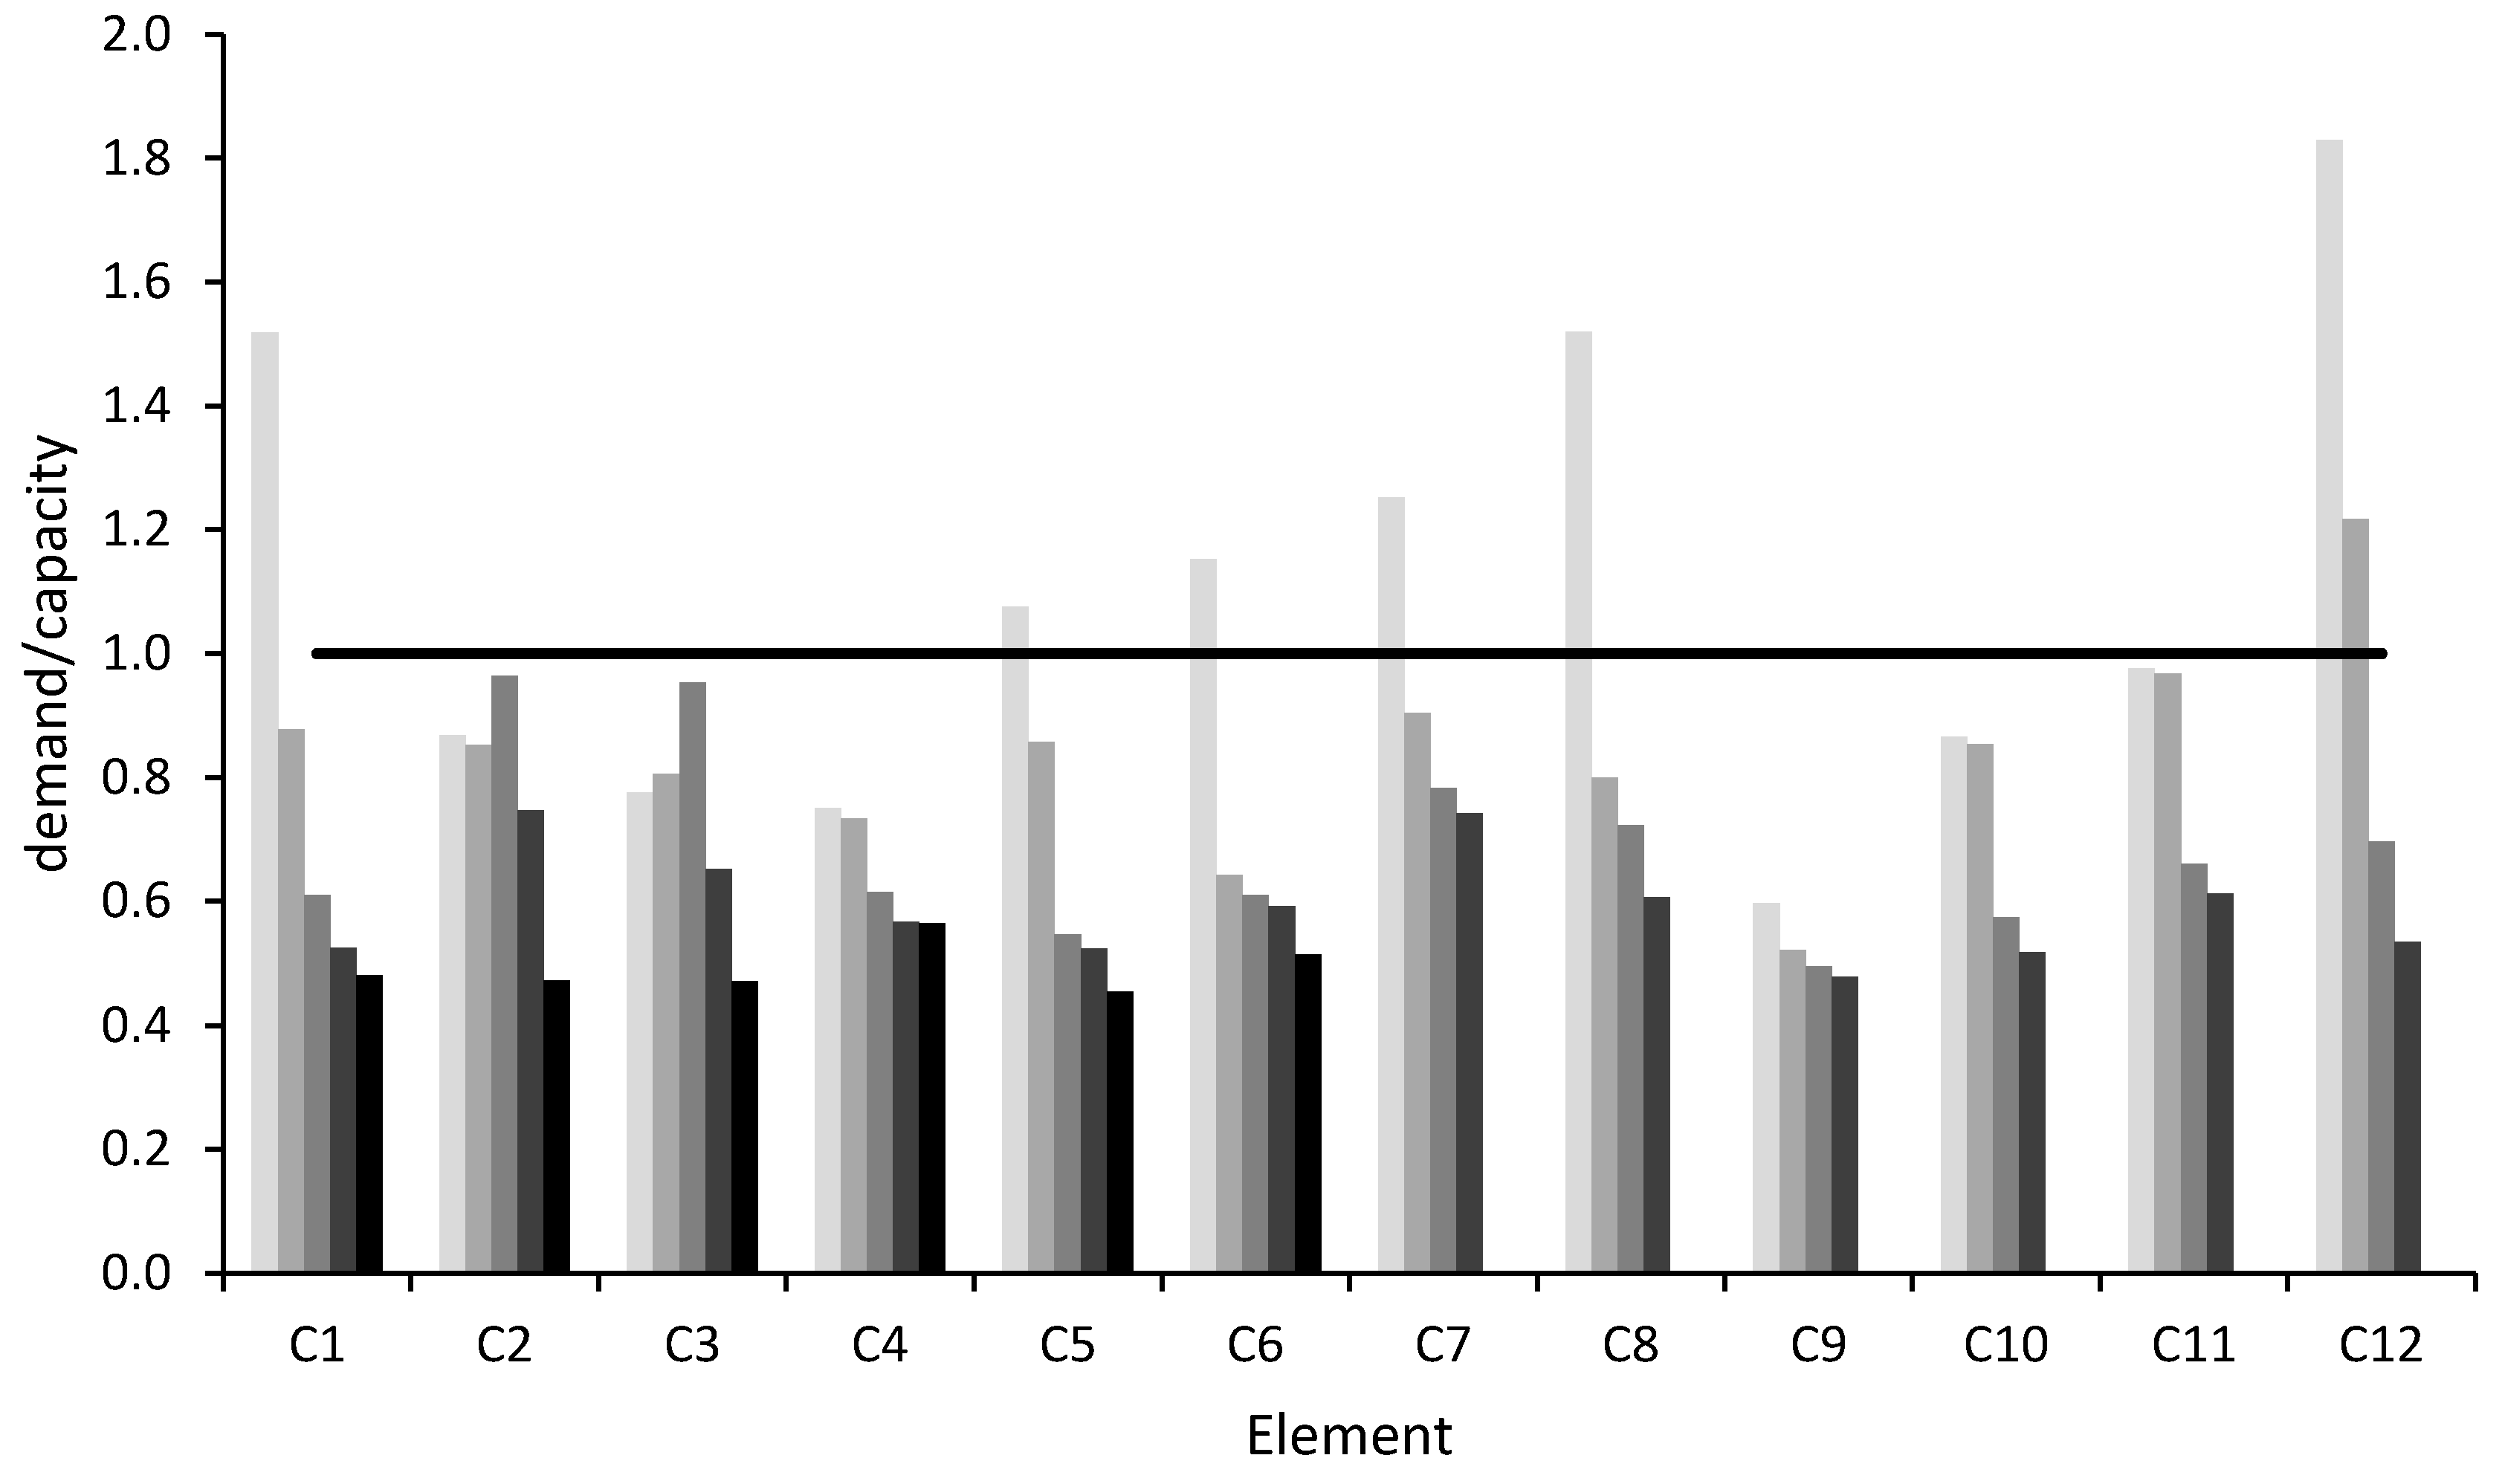
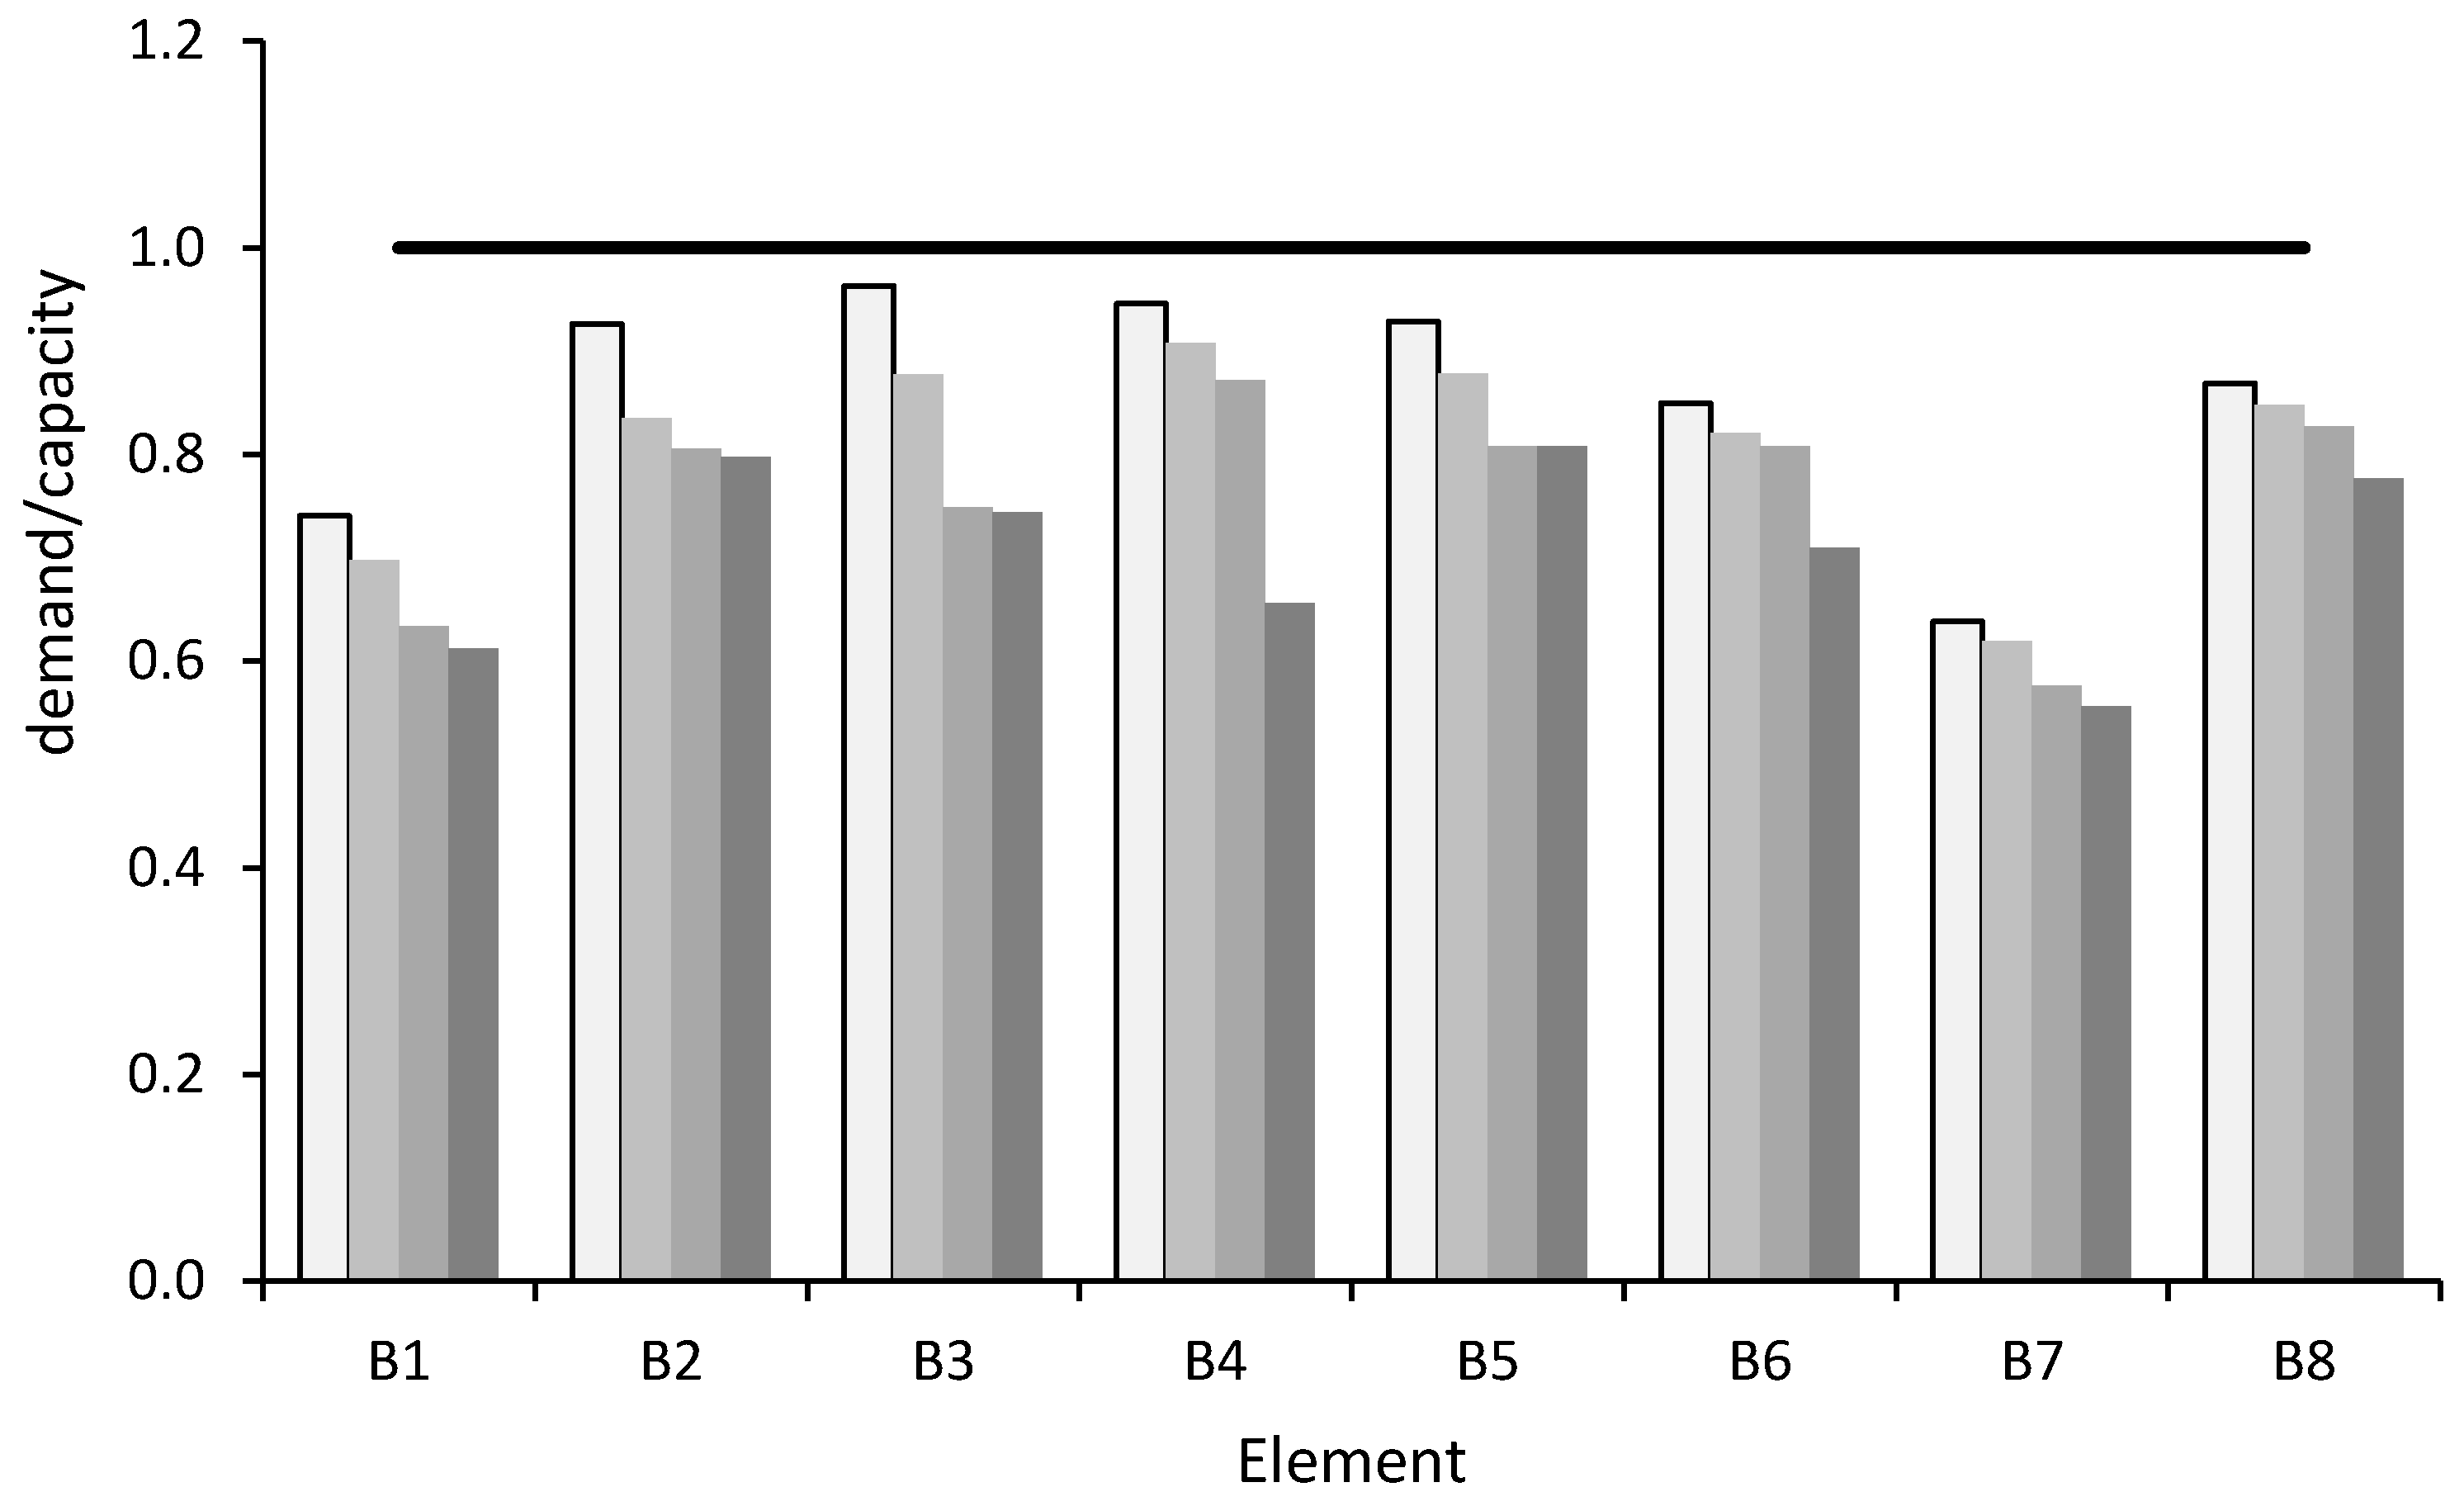
All the results of the verifications for beams and columns are shown in
Figure 4,
Figure 5,
Figure 6 and
Figure 7, where on the horizontal axis the names of the members are reported, with beams indicated by letter B and columns by C. The letter is followed by an ordinal number, which identifies the position of the member with respect to the building plan, as shown in
Figure 3.
In the diagrams of
Figure 4,
Figure 5,
Figure 6 and
Figure 7, for every member, three or four differently colored columns are drawn. These columns indicate the position of the member with respect to the stories of the building, where the lighter column corresponds to the lower level, while the gradually darker columns indicate higher and higher levels.
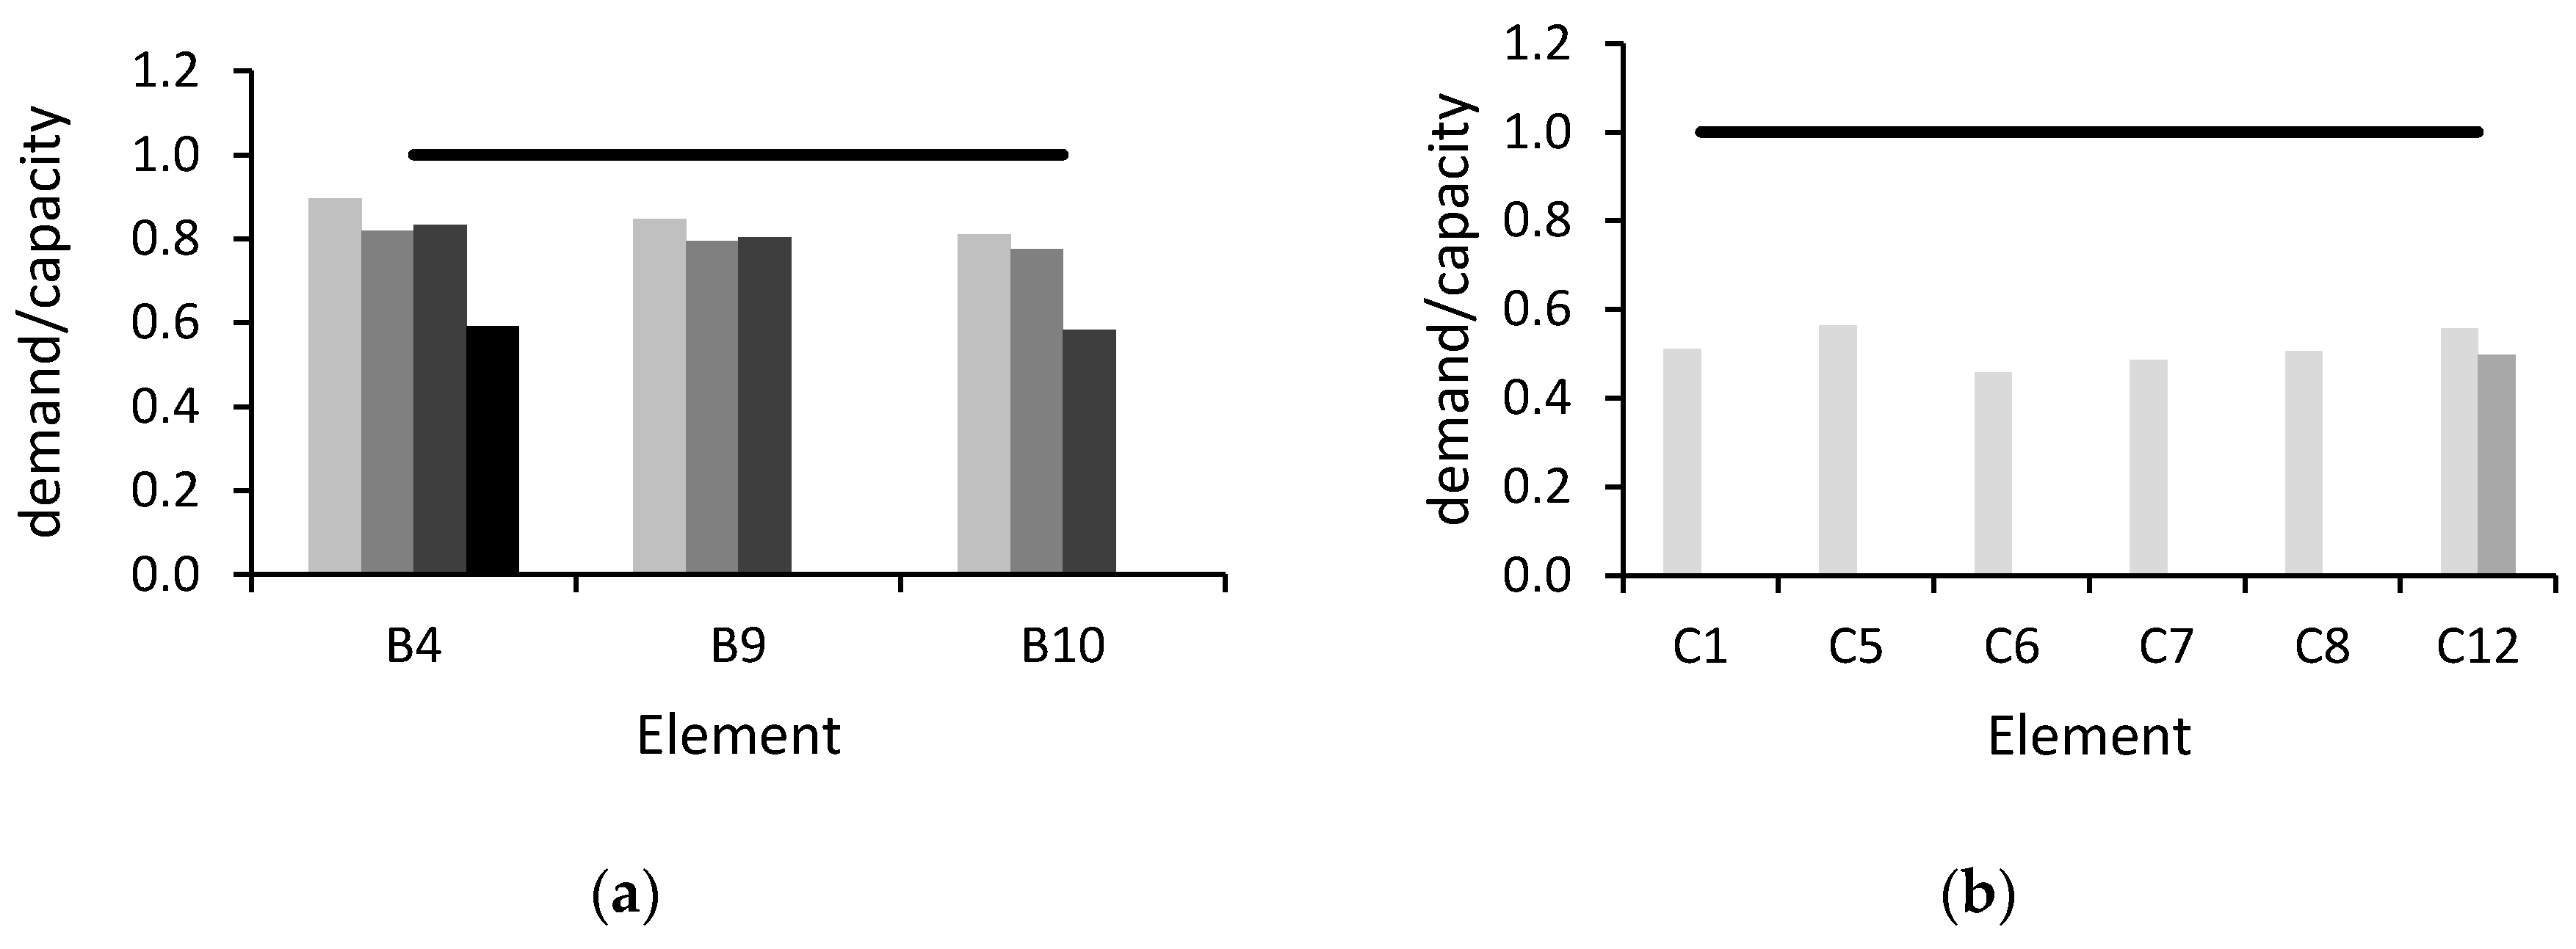
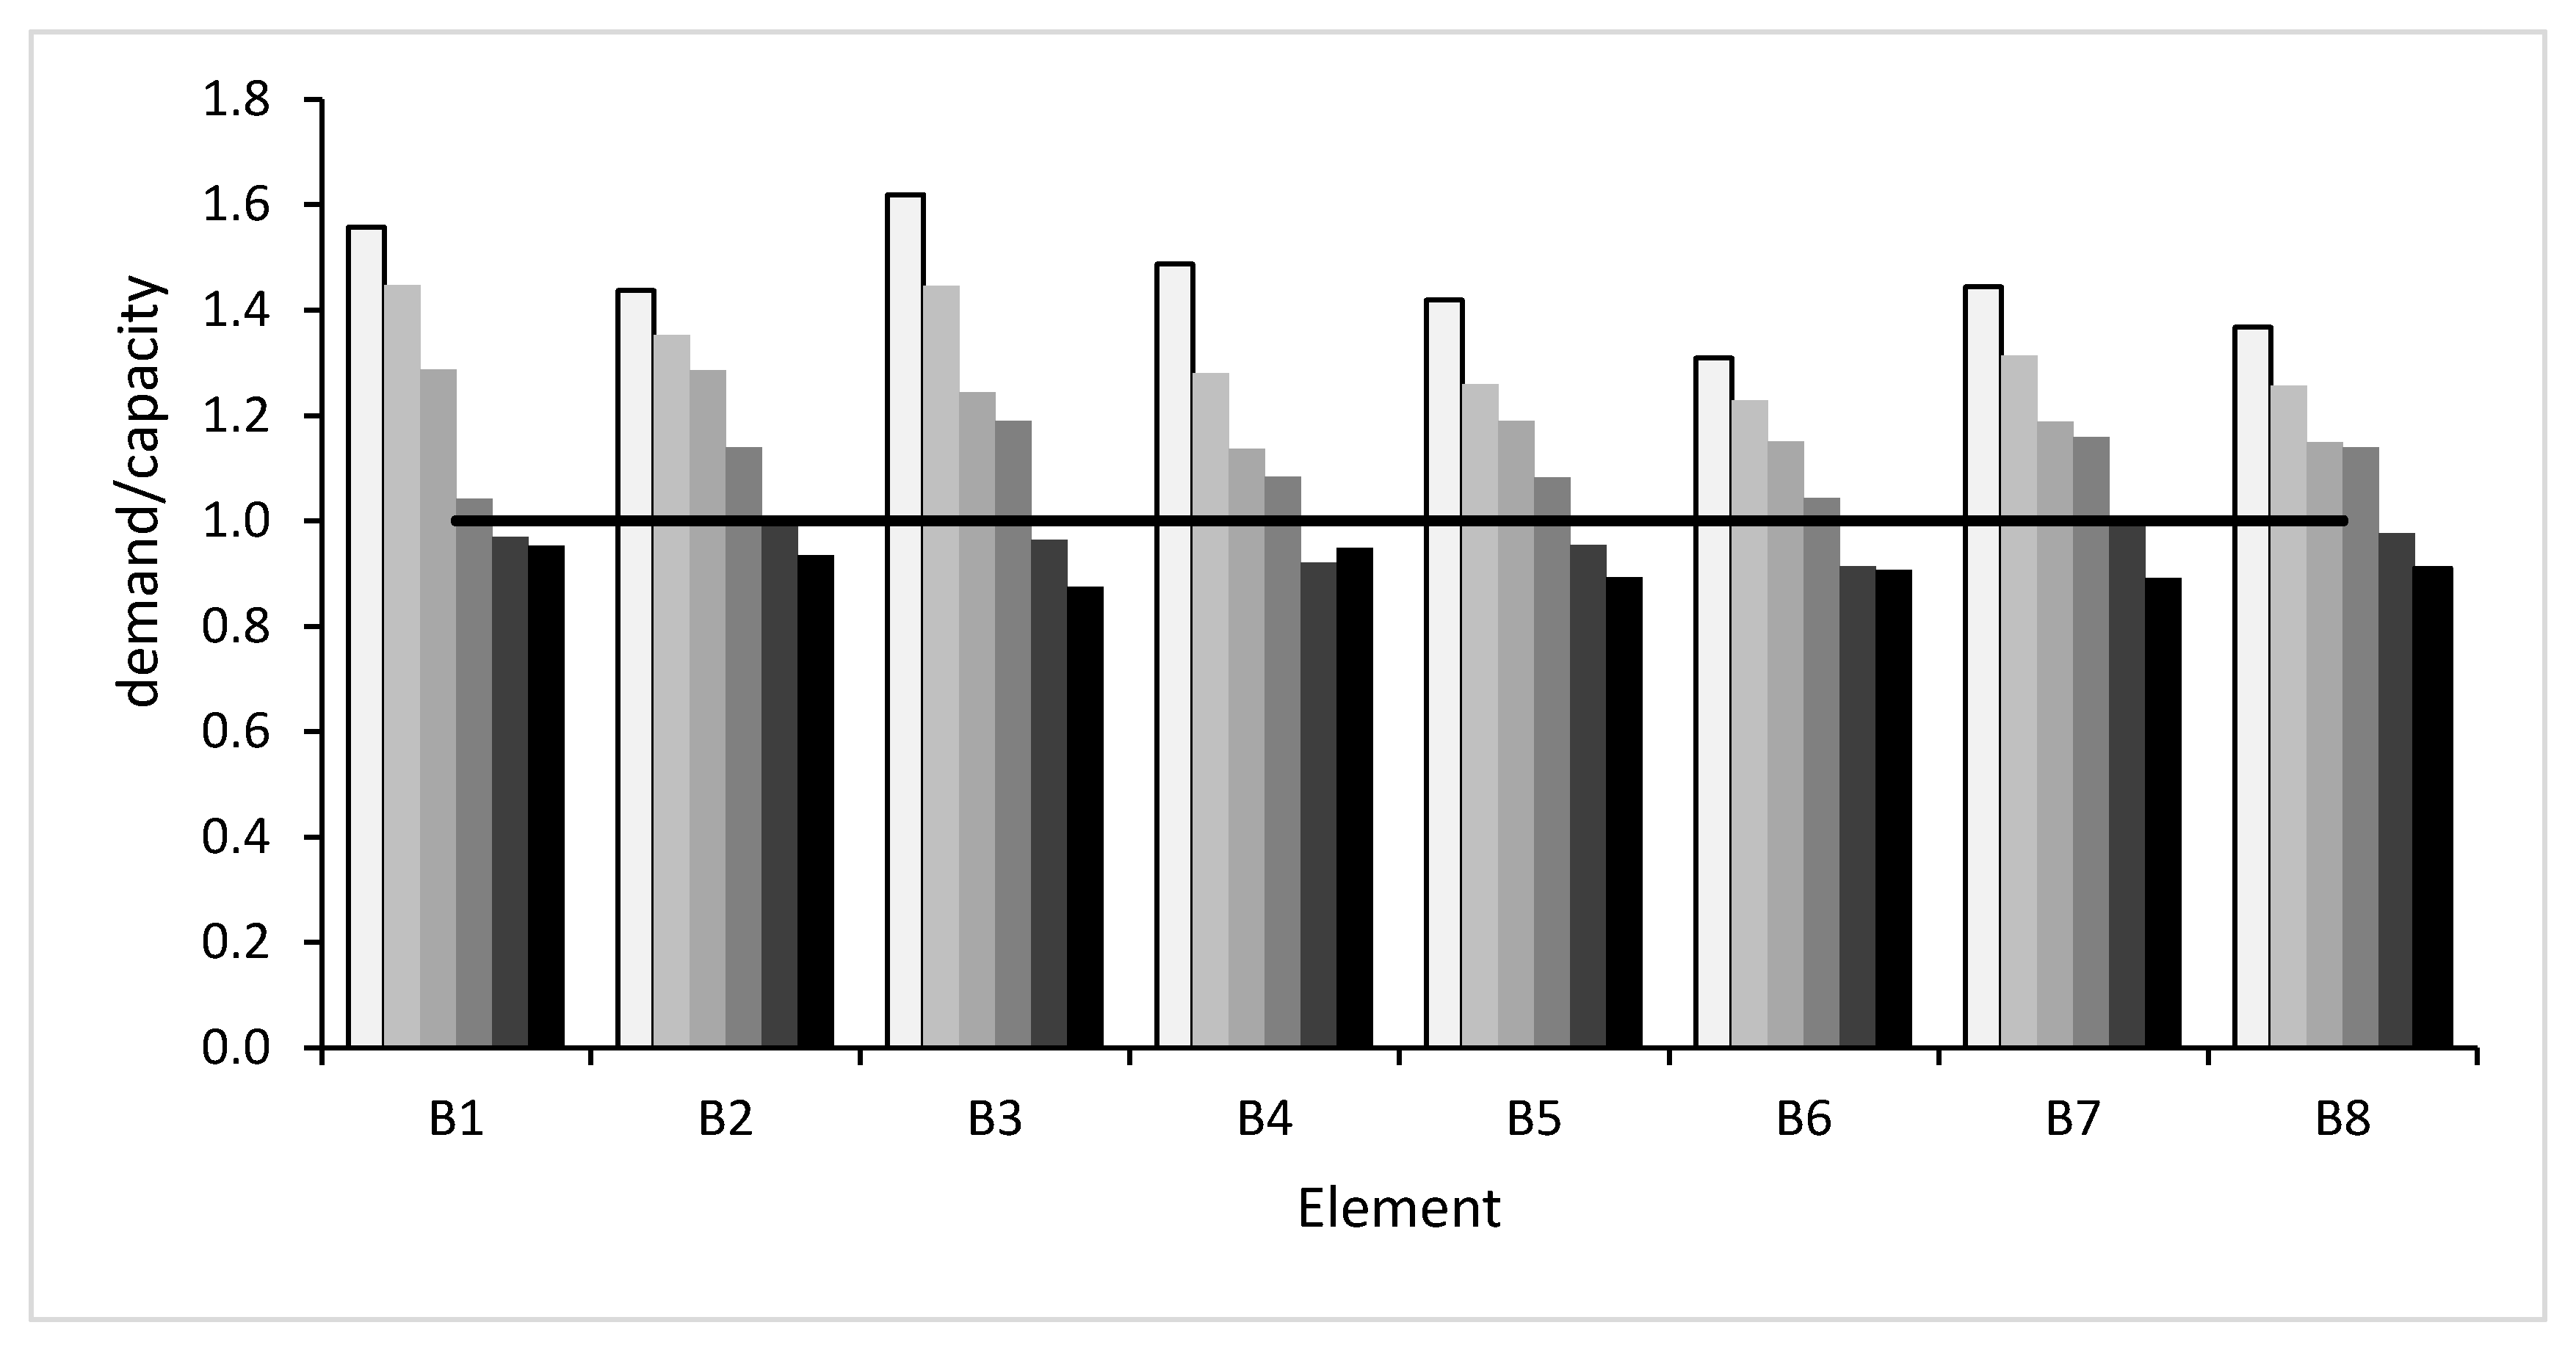
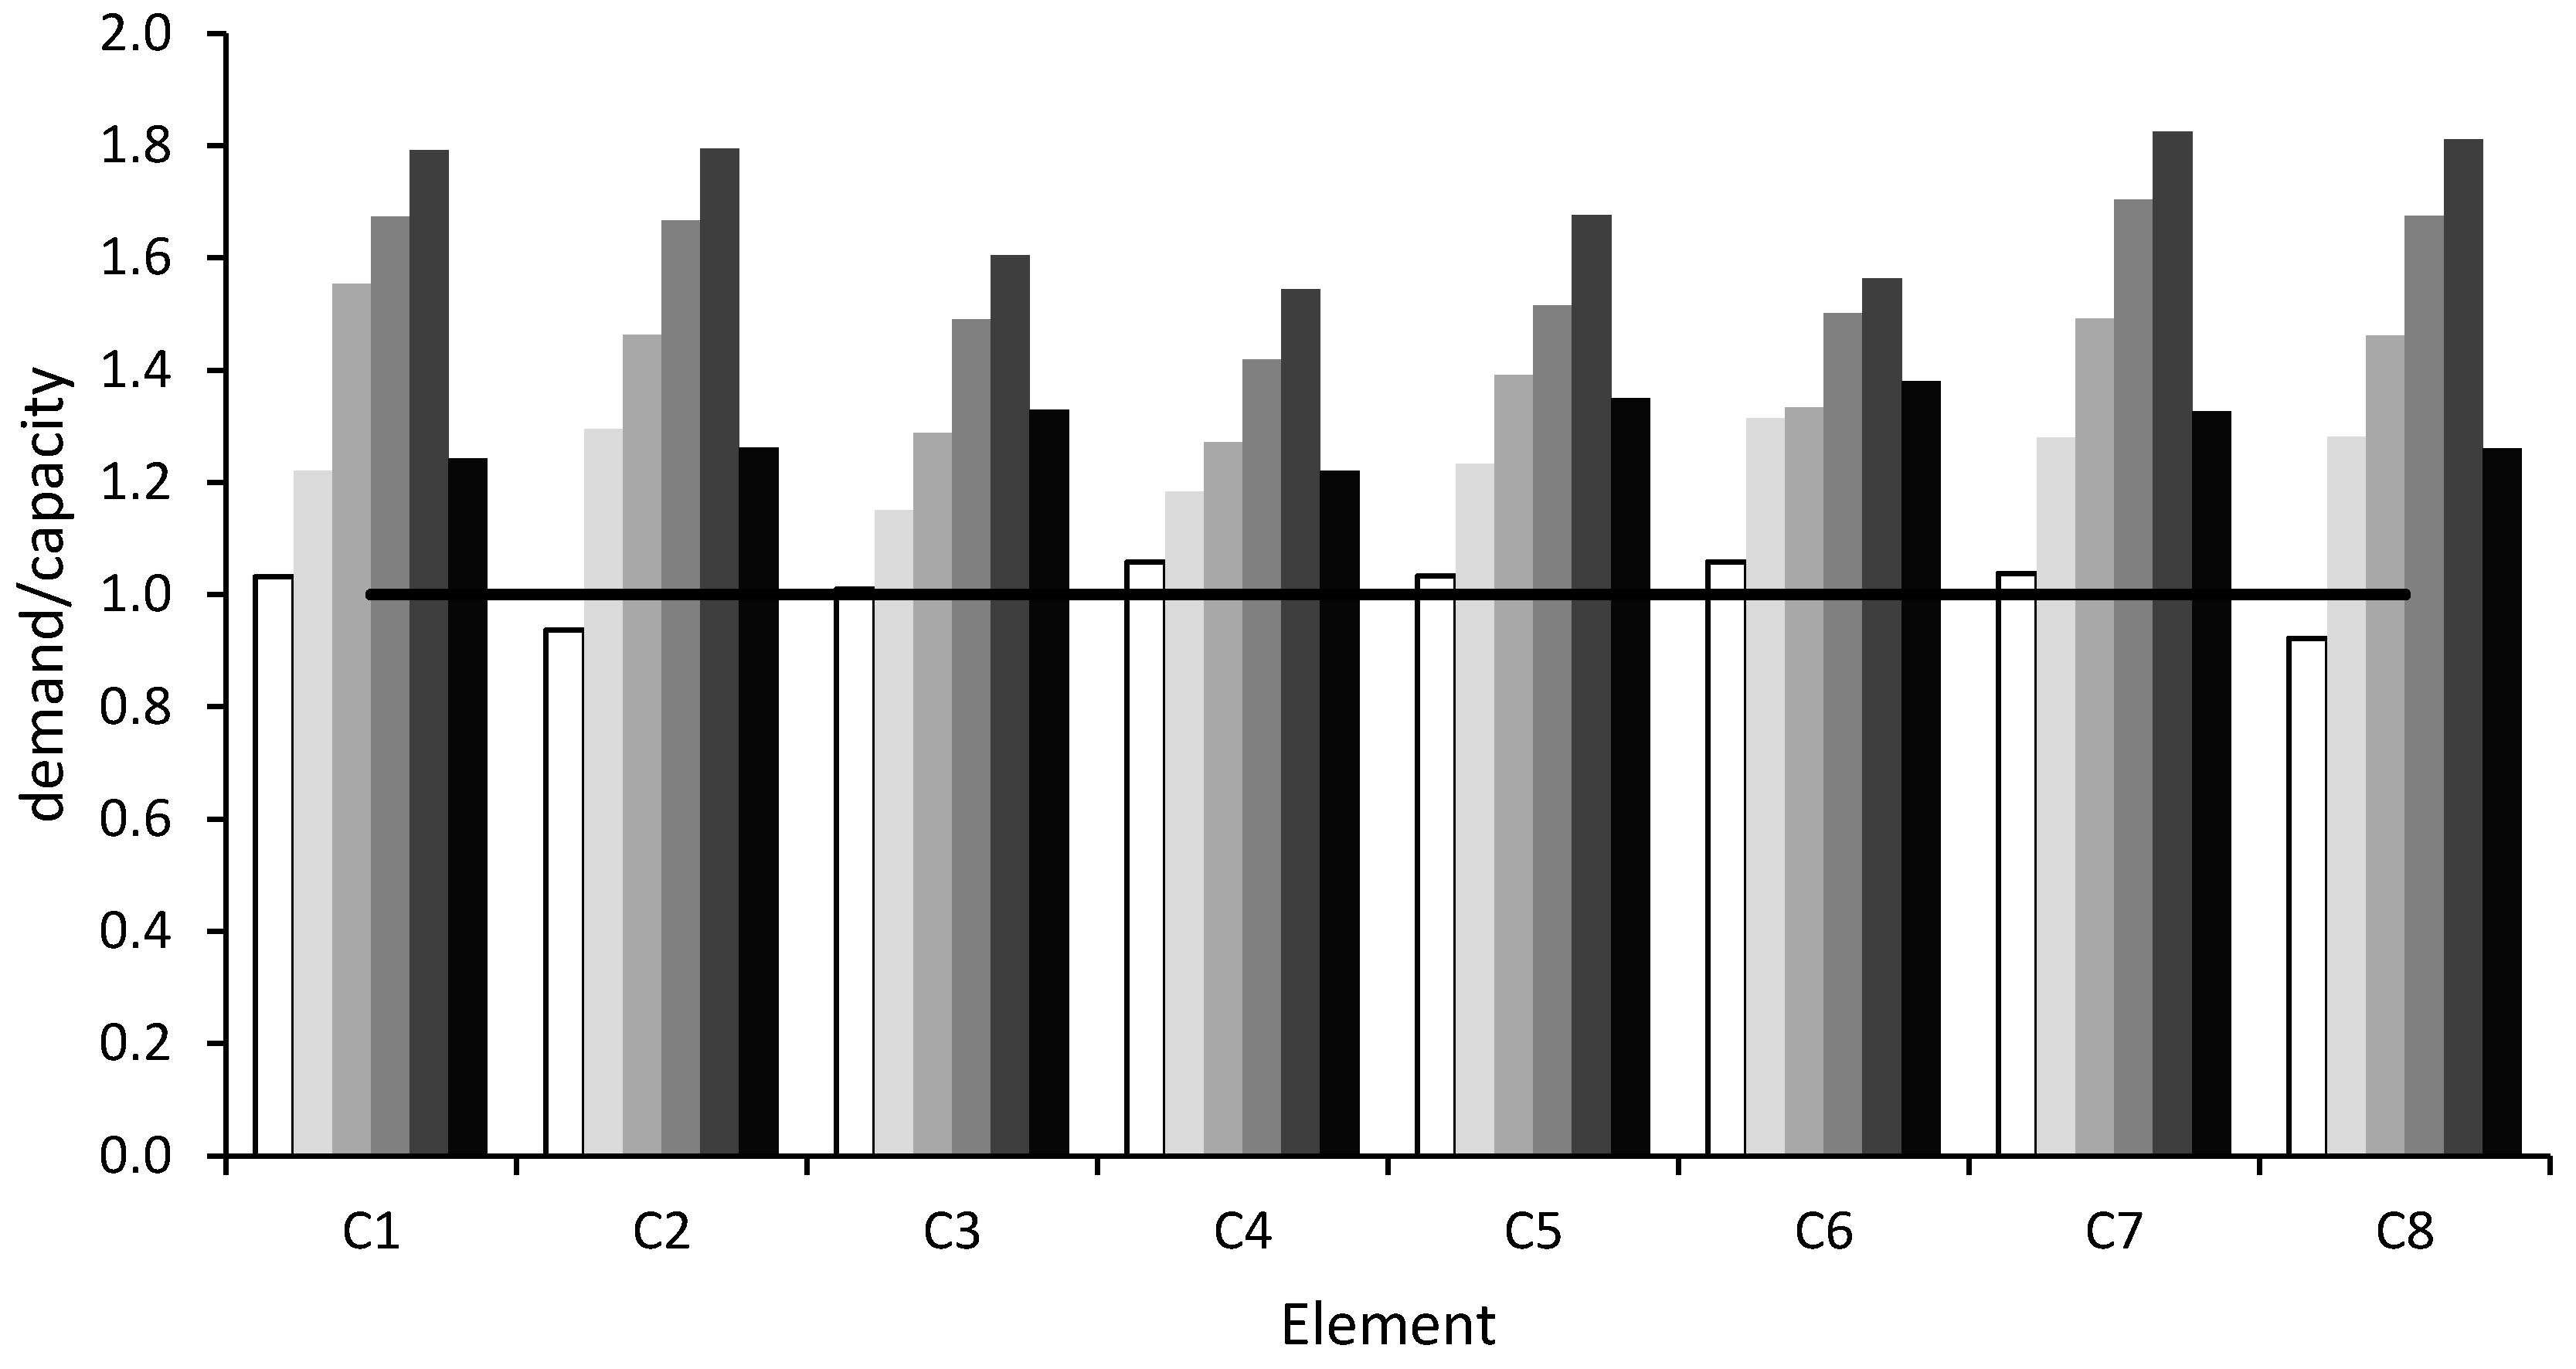
For the verification of ductile mechanisms, in
Figure 4 and
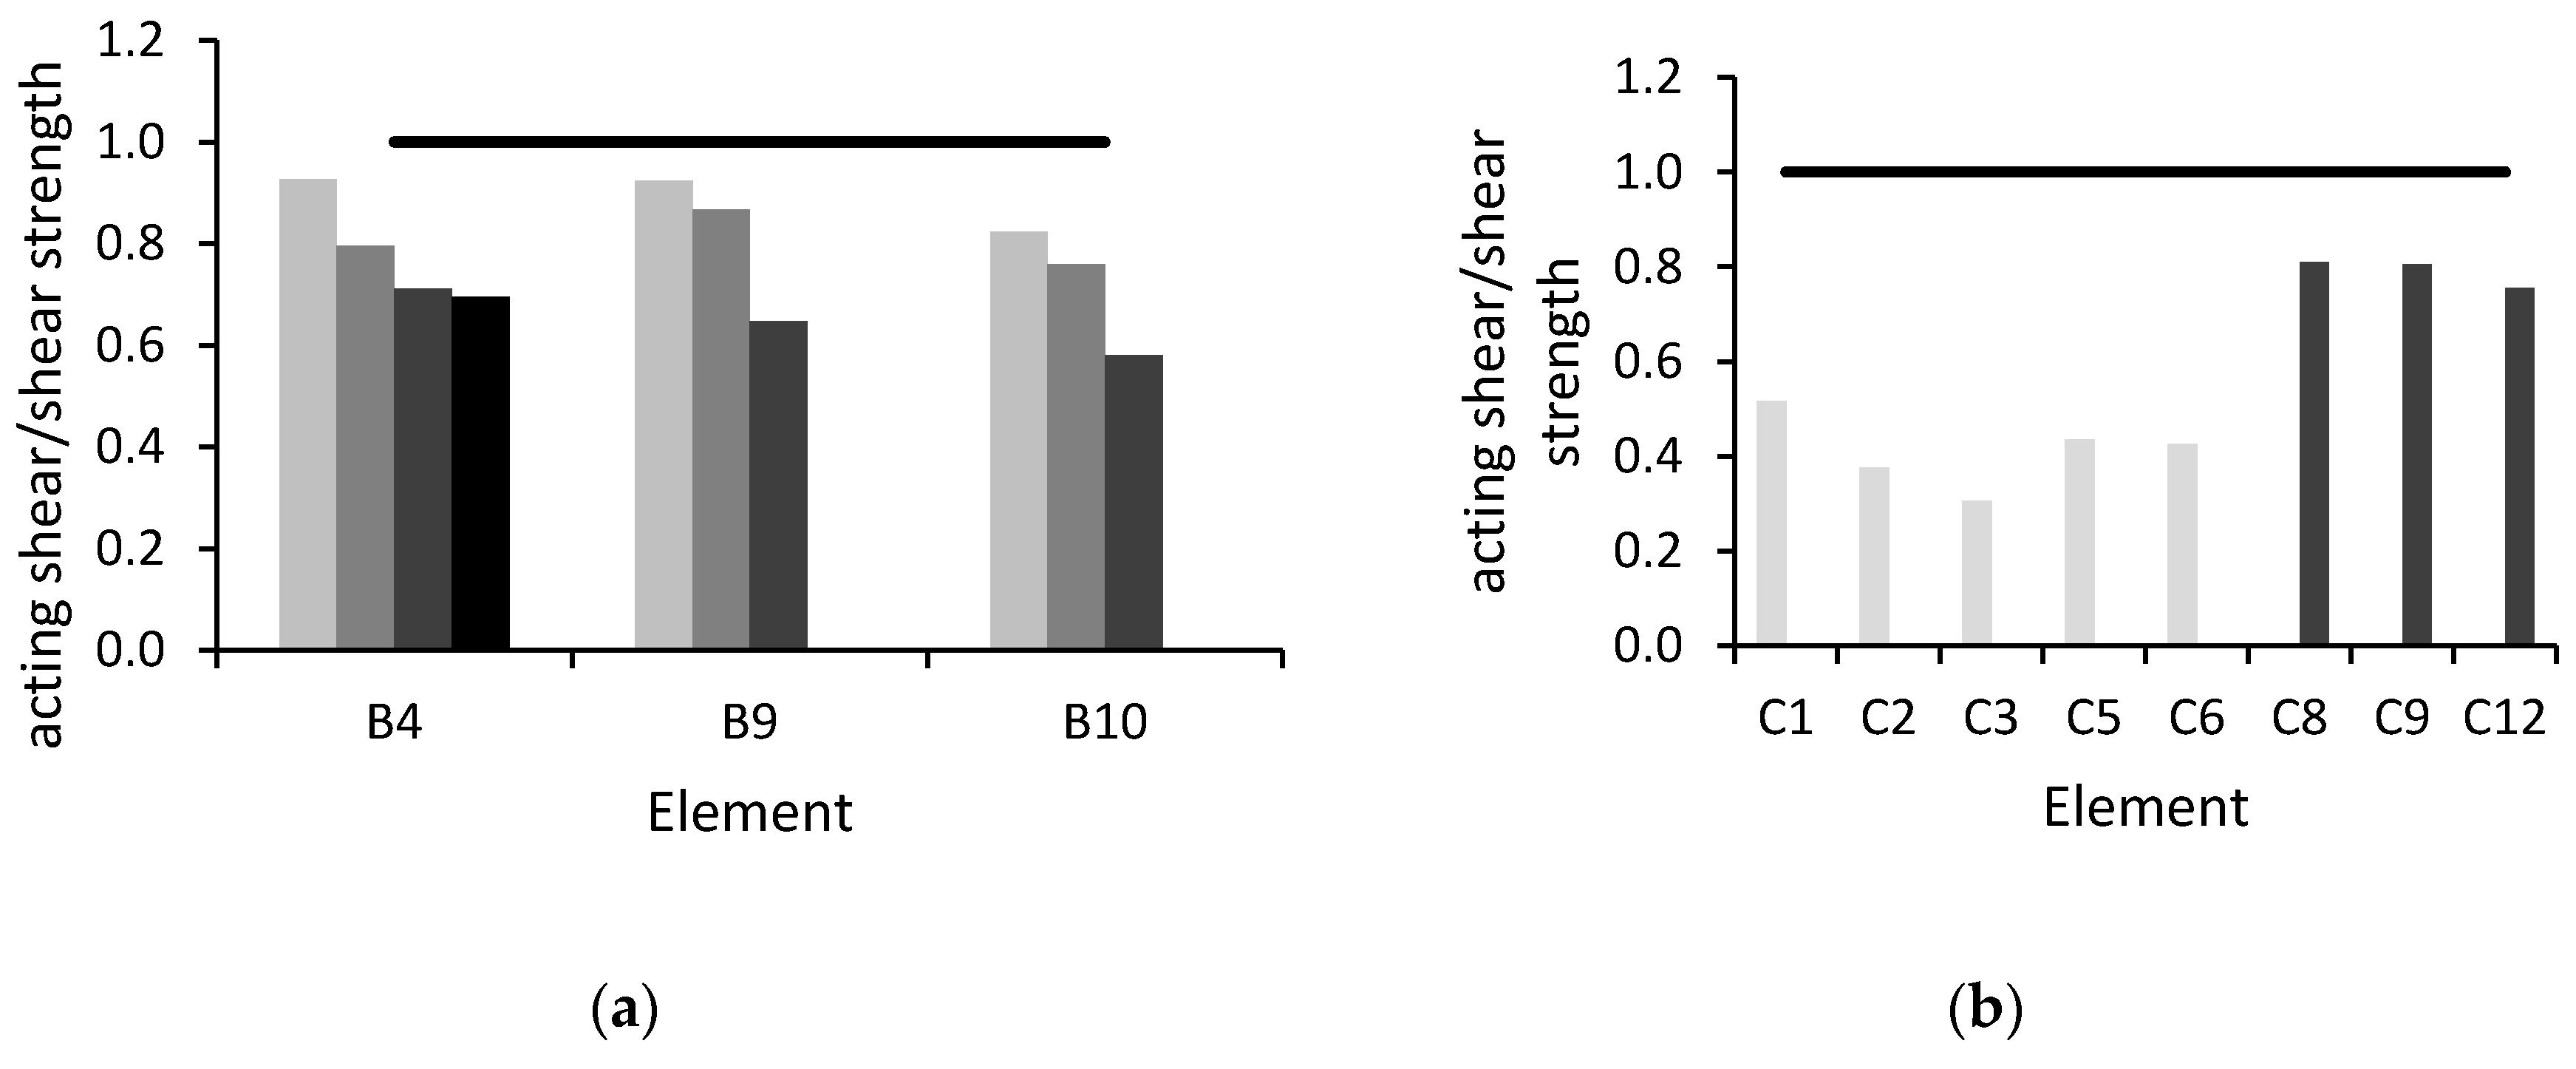
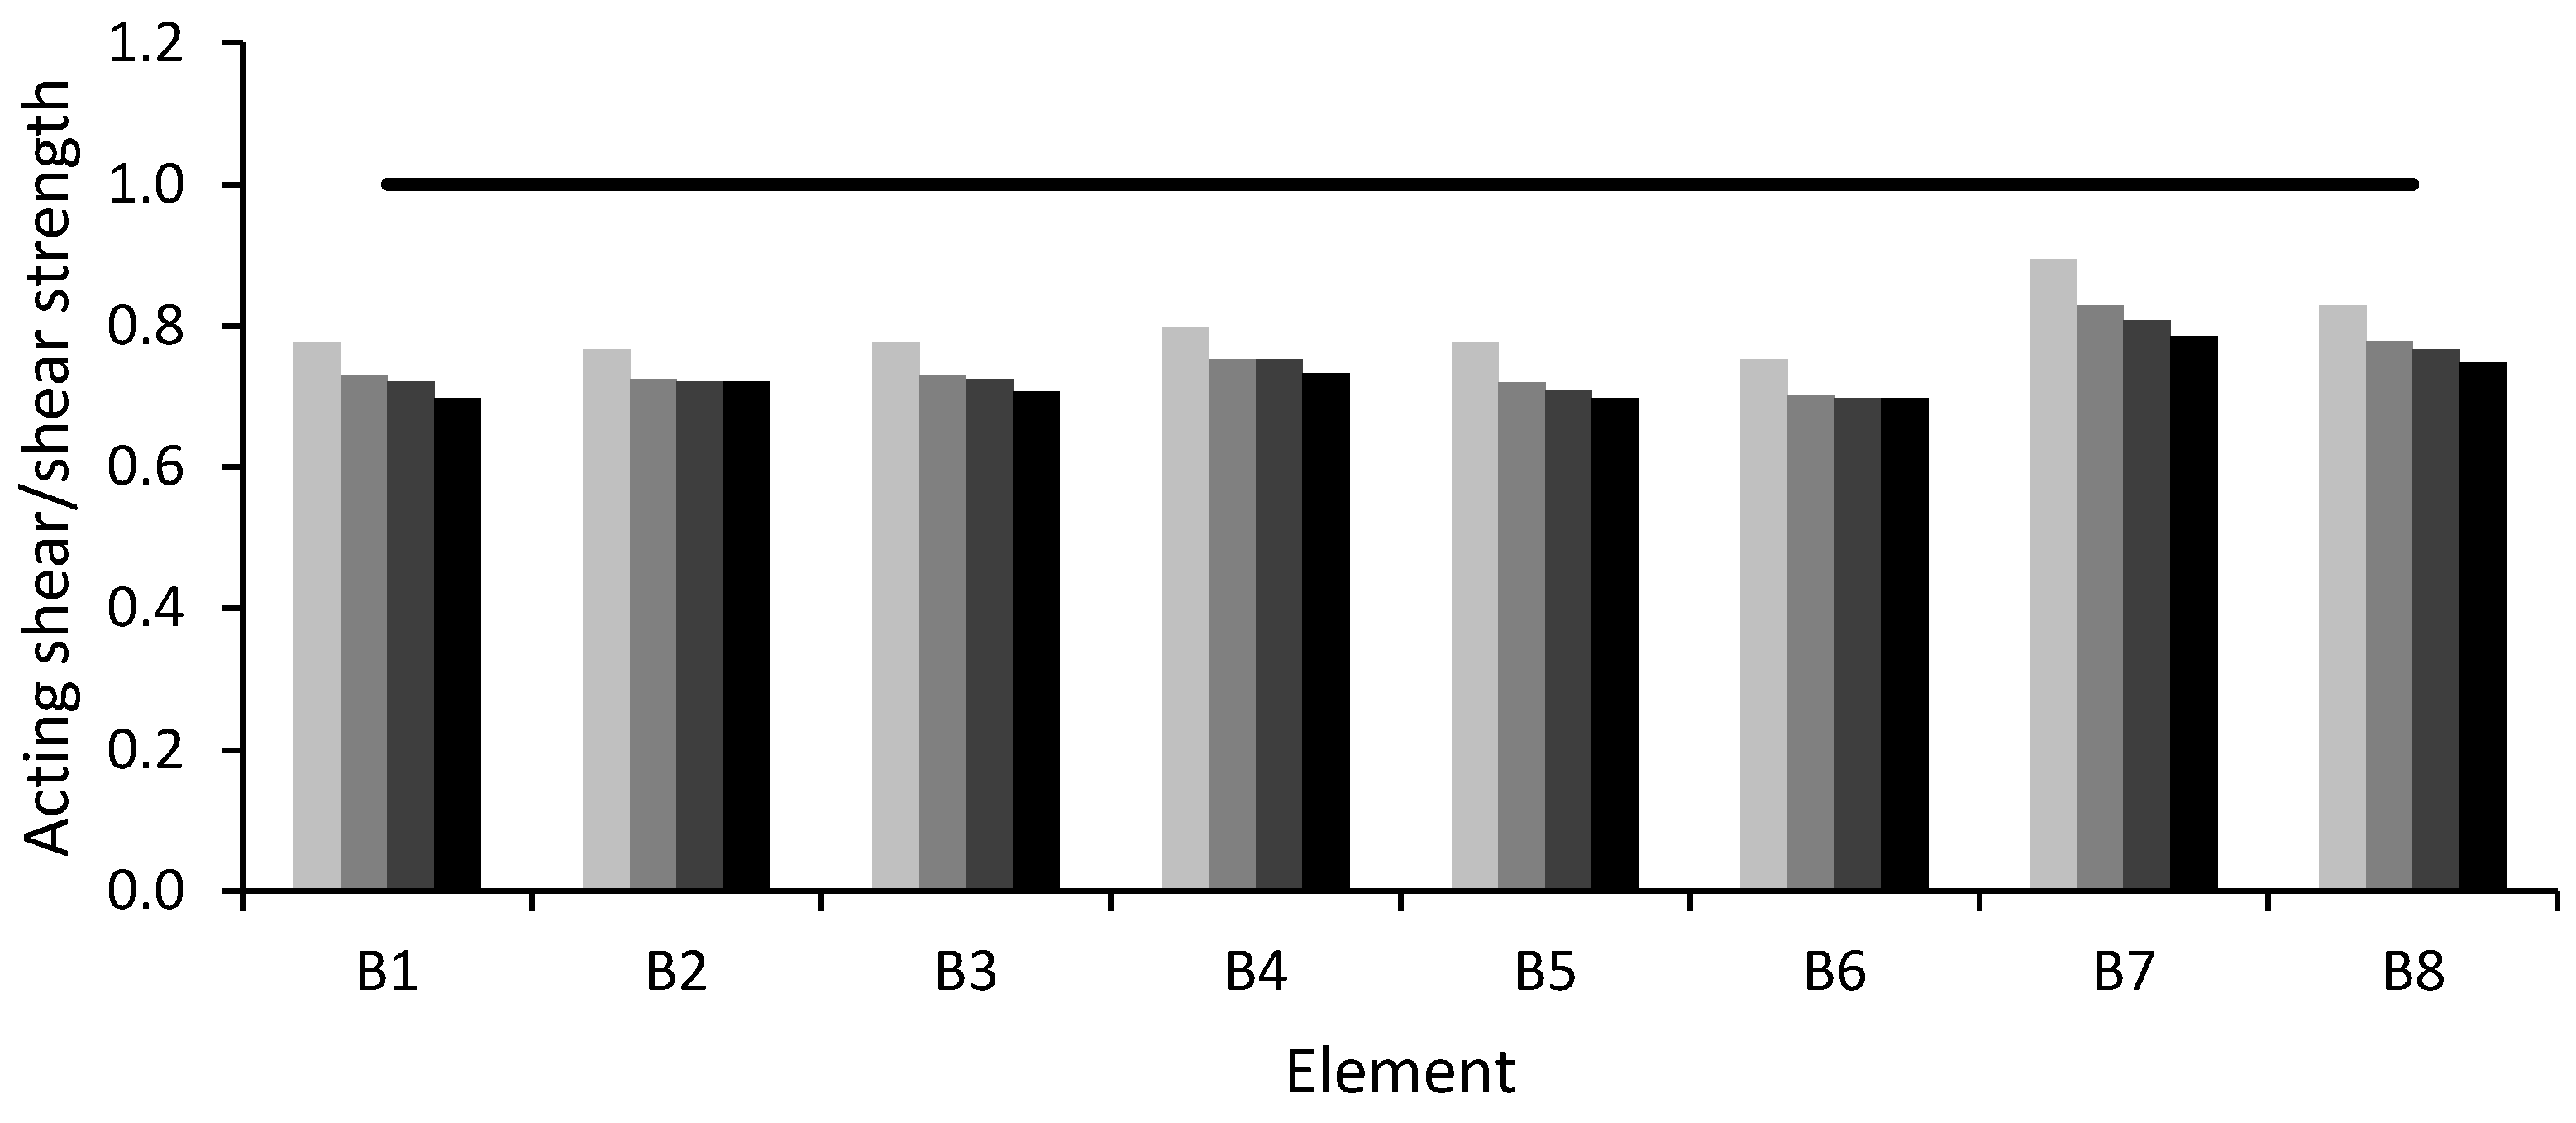
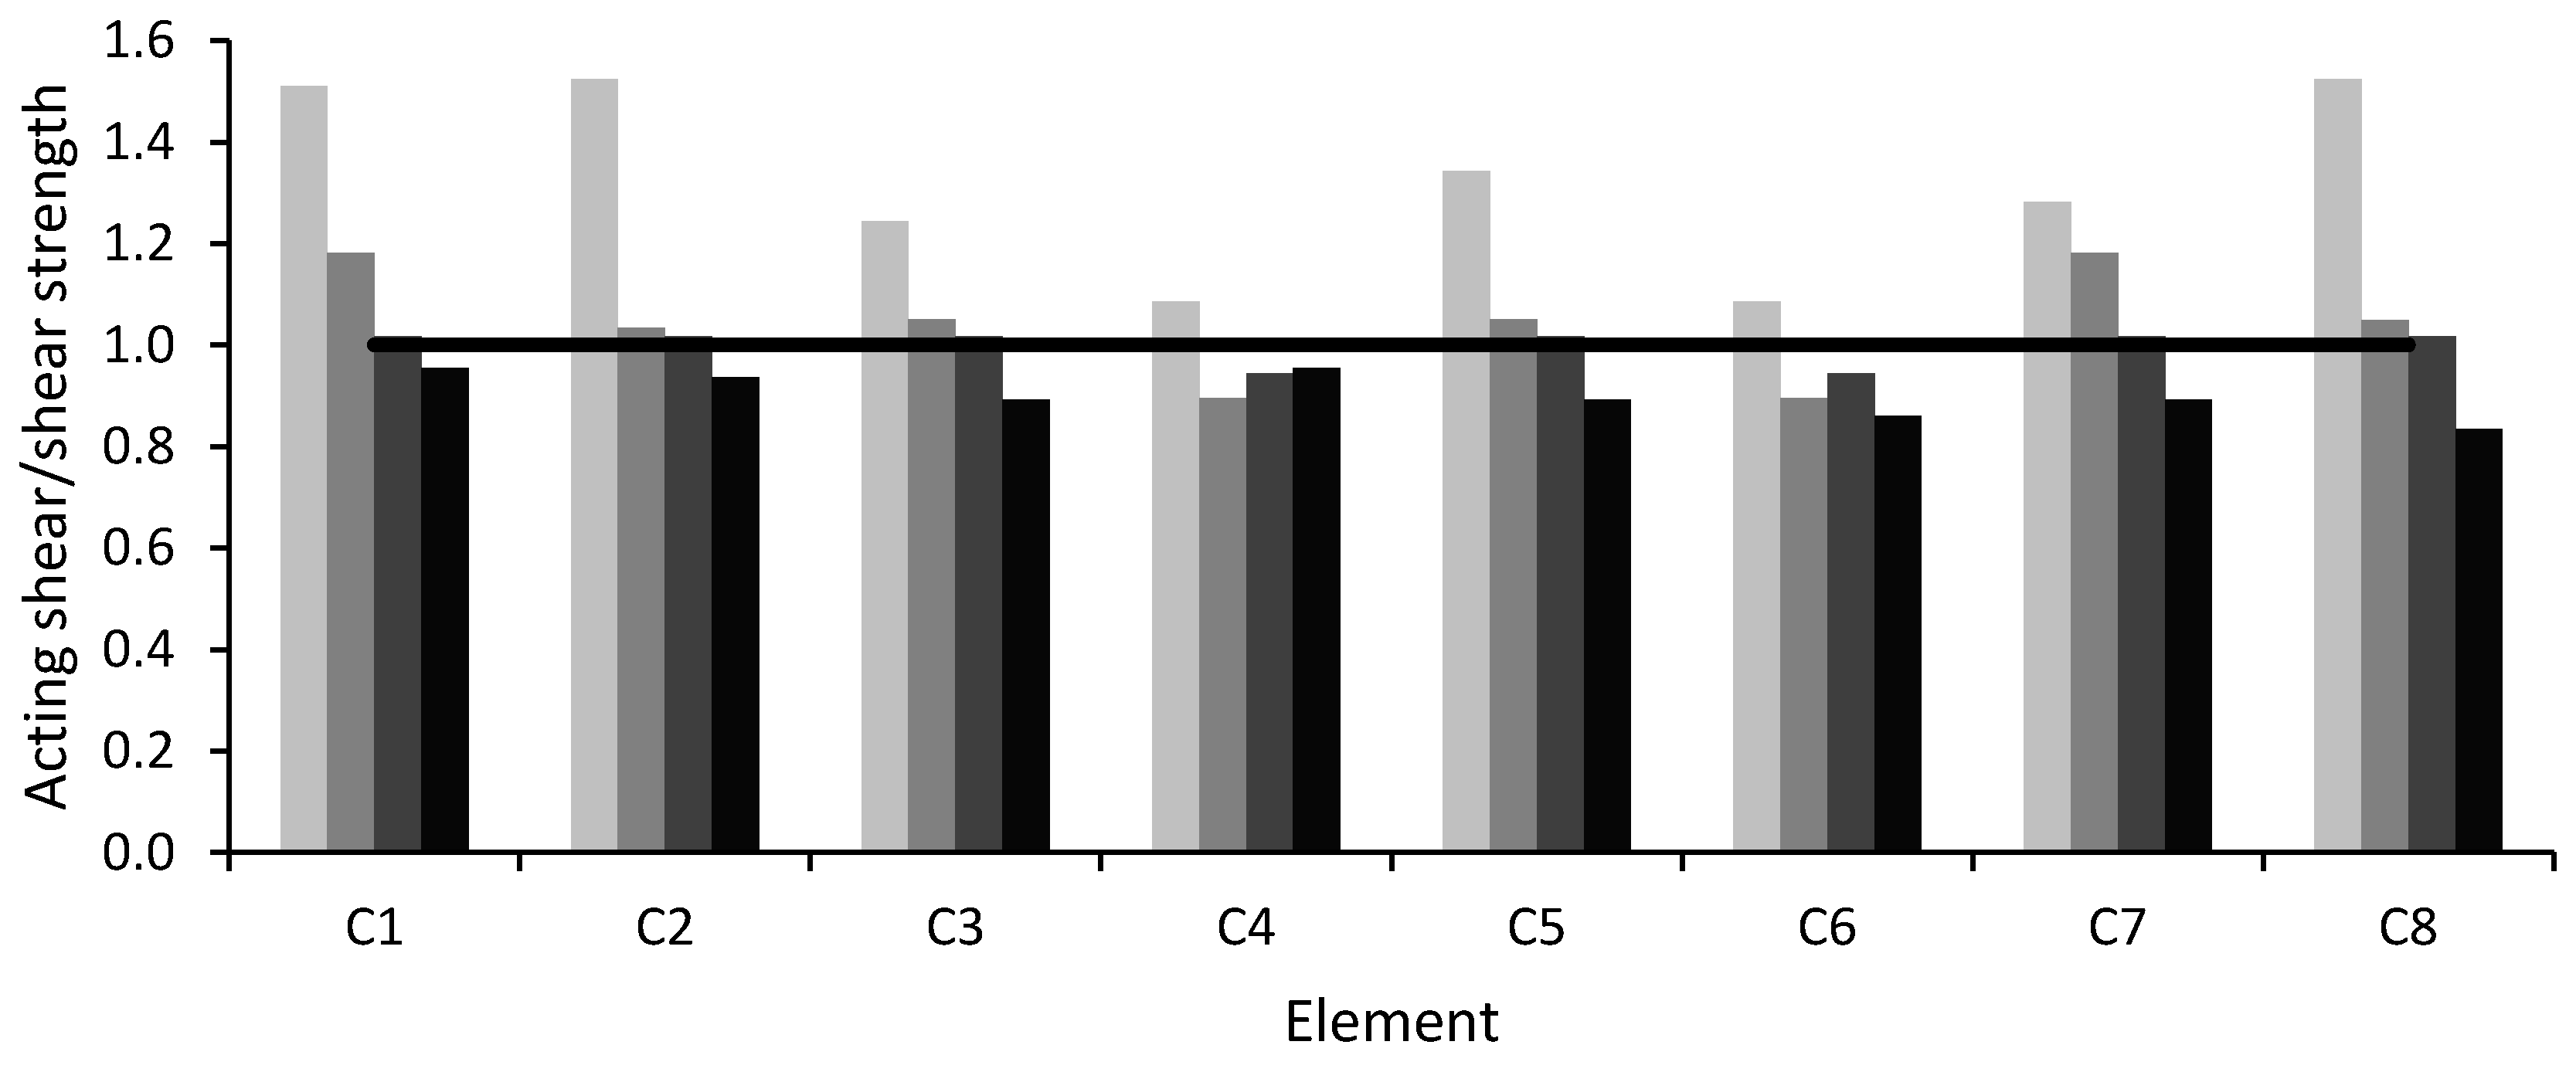
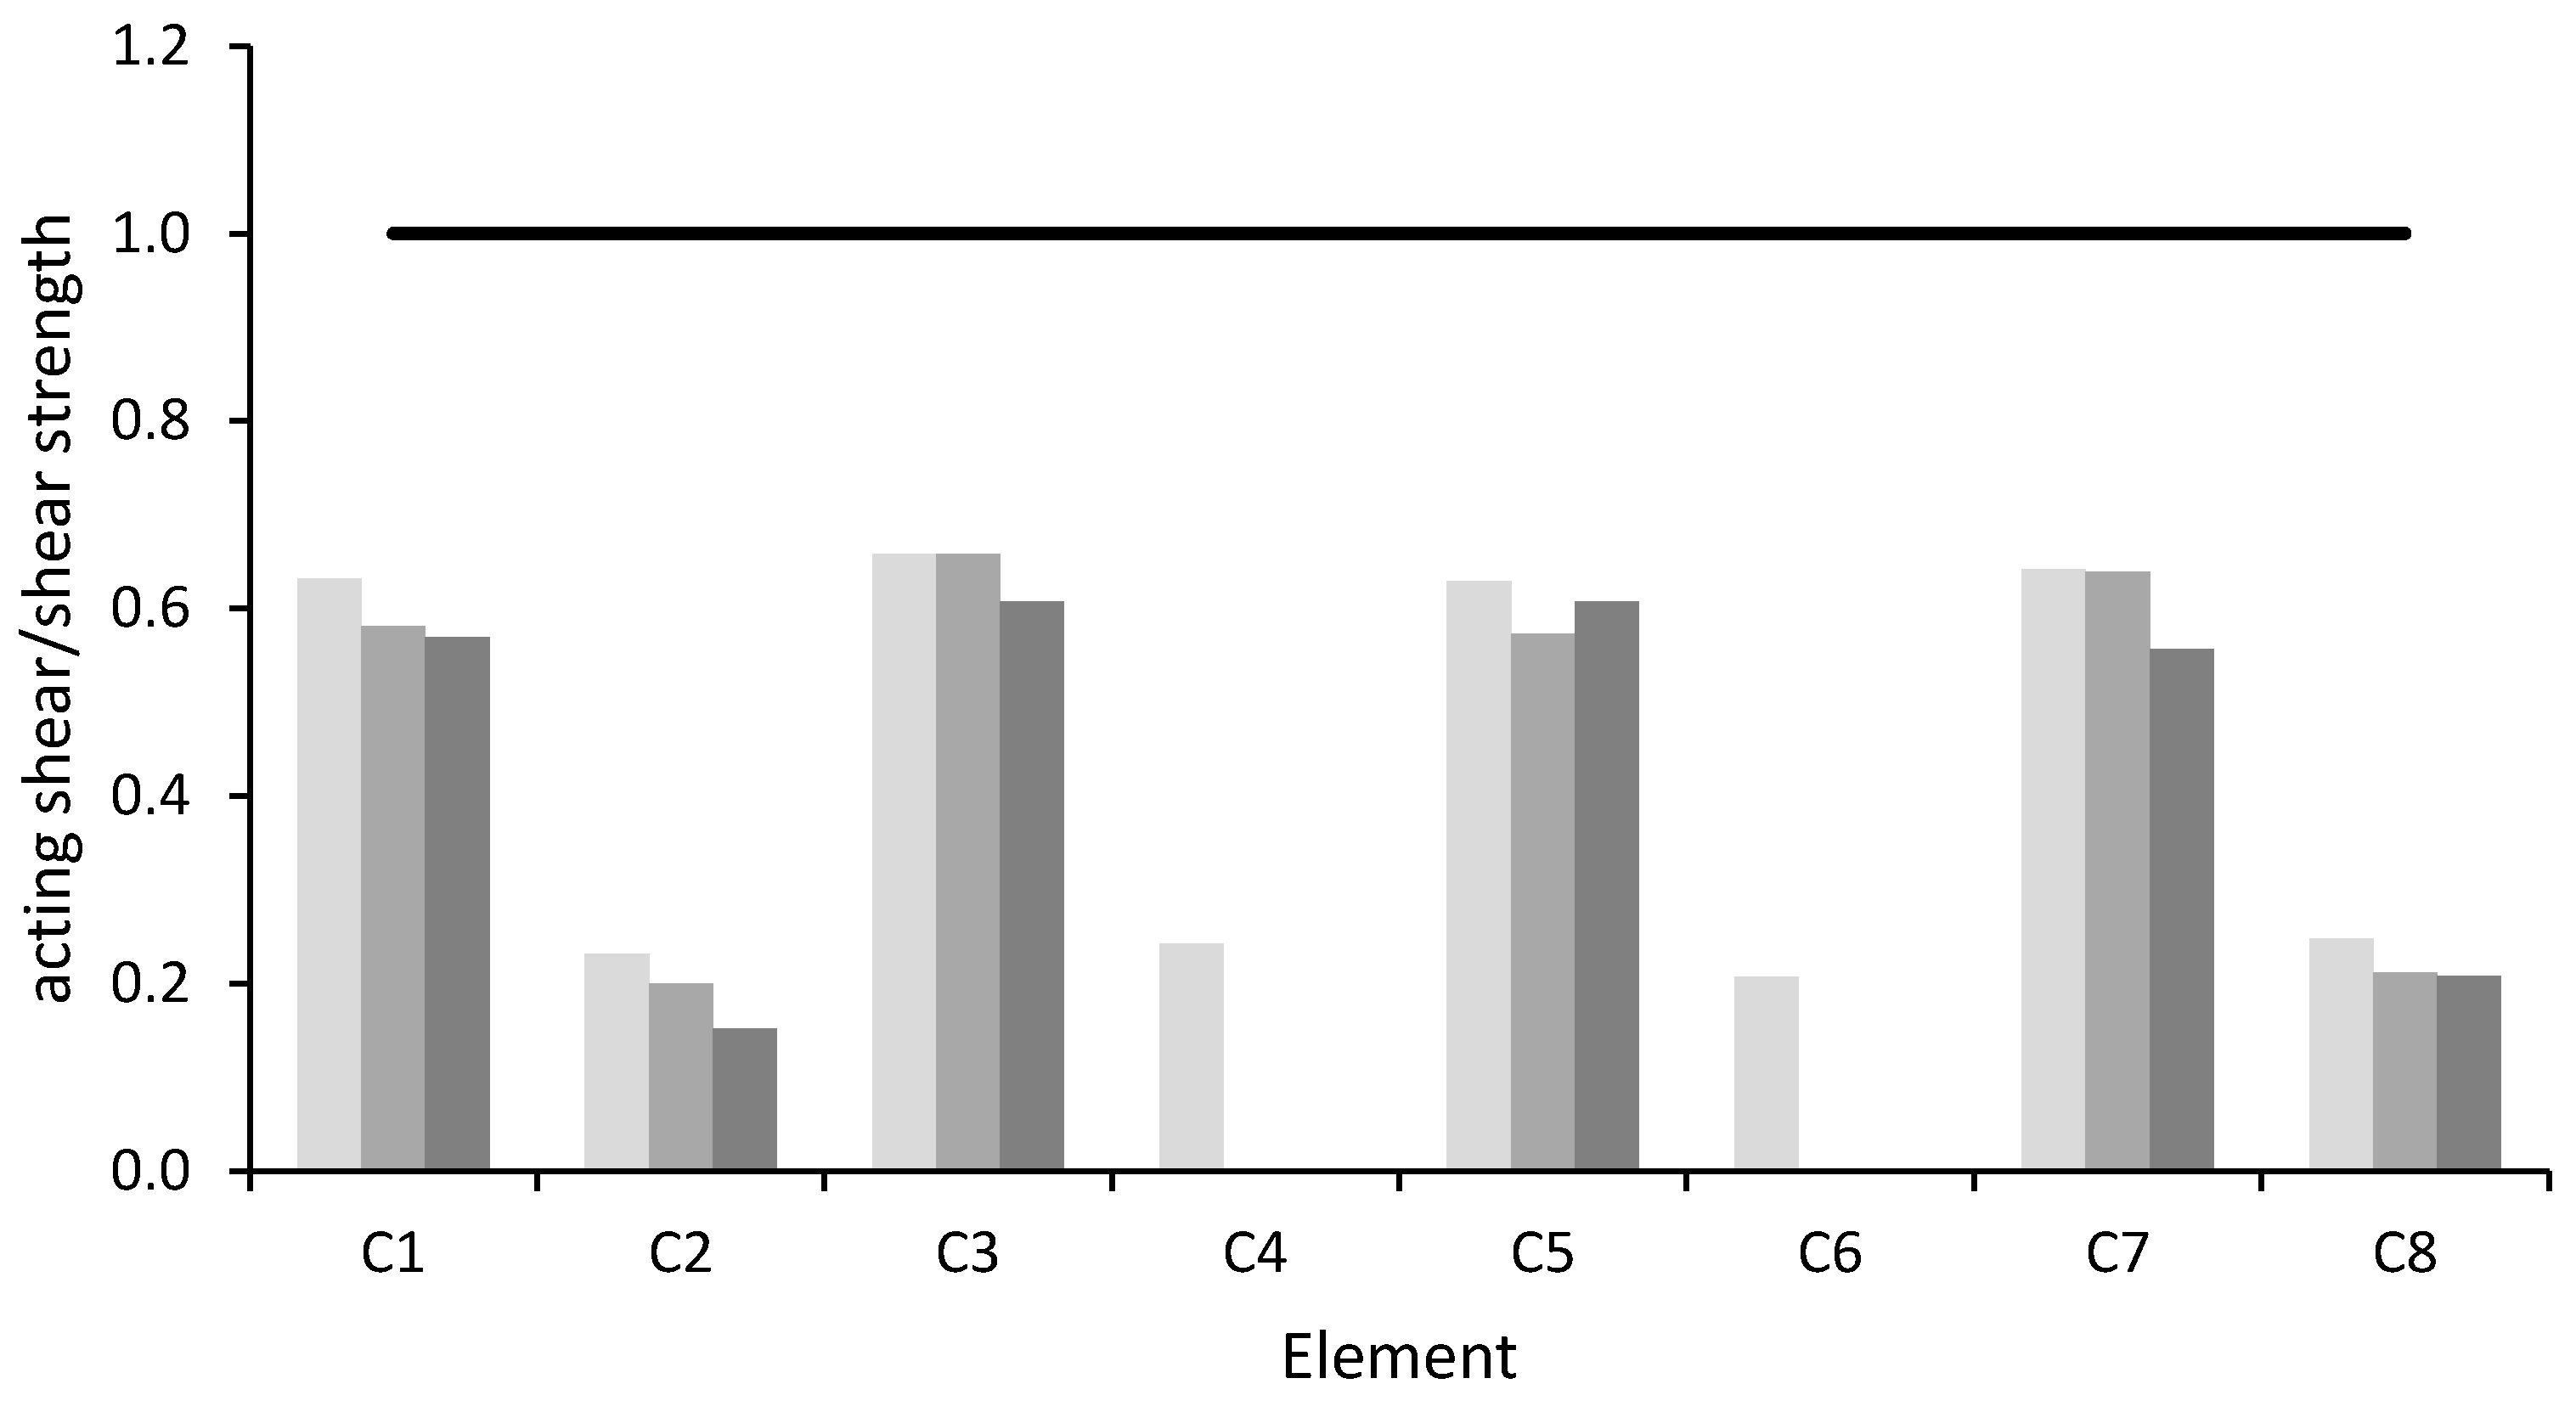
Figure 5 the ratio between demand and capacity is represented on the vertical axis. For the verification of brittle mechanisms, in
Figure 6 and
Figure 7 the ratio between acting shear force and the shear strength is reported. For both types of mechanisms, the verification is satisfied if the ratio is less than 1; otherwise it is not satisfied.
Figure 4 shows that all beams in the x direction satisfy ductile mechanism verifications, since the ratio between demand and capacity is lower than 1 in all cases. Secondary beams, in the y direction, do not satisfy this verification, due to the small section and the low amount of steel reinforcement.
Figure 5 shows that the columns that are more distant from the walls, namely C1, C5, C8 and C12, do not satisfy the ductile verification at the base. Additionally, columns C6 and C7 do not satisfy the ductile verification at the base, because they have less longitudinal reinforcement.
Figure 6 shows that the ratio between shear acting force and shear strength is lower than 1 for all beams in the X direction (B1–B3, B5–B8 and B11–B13), which have transverse reinforcement spacing equal to 25 cm in the middle and 7 cm at the beam ends. Conversely, the ratio is greater than 1 for the beams in the y direction (B4, B9 and B10), which have a constant spacing of 25 cm everywhere along the beam.
Figure 7 shows that, in unit 6, the acting shear force exceeds the shear strength on the last level, where columns connect the top floor with the roof and have a short length, equal to 1.4 m. In unit 5 this occurs also on the first story, due to the presence, at this level, of infill walls with an opening of about 30 cm at the top. This configuration induces shear failure due to short column effect.
The joints of the building have no transverse reinforcement for shear resistance. For this reason, none of them satisfy the tensile verification for beam–column joints according to [
15]. Furthermore, none of the interior joints satisfy the compressive verification, which is satisfied only for the exterior joints.
Regarding the walls, both ductile and brittle verifications are satisfied. On the basis of the previously described results, it can be said that the building may develop brittle non-dissipative failure mechanisms under seismic action. To improve its behavior a retrofit intervention with the use of dissipative devices is proposed.
3.3. Retrofit Intervention with BRADs and Effects
A BRAD [
25,
26] is a non-linear anti-seismic device whose behavior depends on displacement. The most common configuration of BRADs consists of an internal steel core encased in an external hollow steel profile, filled with concrete. A layer of low friction material is interposed between the steel core and concrete and allows relative axial deformation between the inner core and the external steel profile. This slip surface allows the steel core to deform in the plastic field and, therefore, dissipate energy. Lateral confinement, conferred by the concrete layer and the external steel profile, prevents buckling of the steel core during the compression phase. In this way, it is possible to dissipate energy both during tension and compression phases. BRADs are particularly suitable to be mounted on steel braces for seismic retrofit of steel and RC frame buildings, both new and existing. Their use leads to an improvement in the dissipative capacity of the building, concentrating the dissipation in the devices and, therefore, reducing the actions on the building structural members. The advantages of BRADs are evident from the large hysteresis loops, significant stiffness after yielding, and slight strength deterioration under cyclic loading, all of which contribute to a reduction in displacements and good energy dissipation capacity.
In SAP2000, BRADs can be implemented by using the Nlink “Plastic wen”, due to the fact that the hysteretic cycles obtained using this Nlink are similar to the ones obtained from experimental tests.
In the catalogue [
25] from which the devices have been chosen, each BRAD type is identified by a code of the type N/M-b, where N is the number of the model. As this number increases, there is an increase in the elastic stiffness, the yielding strength and the ultimate strength of the device. The second number, M, represents the sum of the devices’ allowed displacements in tension and compression and the letter “b” means BRAD. Elastic stiffness, yield strength, post yield stiffness ratio and yielding exponent are the parameters required to define the constitutive relationship of the devices.
BRAD choice and position inside the structure have been arranged by a trial and error method. Different in plan and in elevation dispositions, with different BRAD types, were analyzed. It was observed that placing the devices as much as possible near the perimeter gave the best results. Moreover, it was observed that by using different devices with gradually lower stiffness along the elevation, large hysteretic cycles were developed also by the devices in the highest floors. Many of the studied configurations had good results, but the one proposed in the following gave the best results in terms of width of device hysteretic cycles and, consequently, in terms of energy dissipation.
According to the analyses carried out, the authors believe that they have achieved the optimization of the devices. For BRADs of 34/30-b type the elastic stiffness, the yielding strength, the post yield stiffness ratio and the yielding exponent are equal to 194,000 kN/m, 301 kN, 0.01 and 1, respectively. The same properties are equal to 156,000 kN/m, 239 kN, 0.01 and 1, respectively, for BRADs of 27/30-b type, to 115,000 kN/m, 178 kN, 0.01 and 1, respectively, for BRADs of 21/30-b type, and to 79,000 kN/m, 119 kN, 0.01 and 1, respectively, for BRADs of 14/30-b type.
To realize the building retrofit, V-shaped steel braces on which BRADs are mounted are installed as shown in
Figure 8.
Considering that the distribution of the total shear force in buildings decreases with the height, and that the building has bays without infill walls on the first level, starting from this level, gradually less rigid devices are used. In particular, BRADs of 34/30-b type are installed on the first story, 27/30-b on the second, 21/30-b on the third and, only in unit 5, which has a fourth story, 14/30-b on the last level. The braces are inserted in both the two main directions of the building to globally increase its resistance. They are placed in the perimeter frames, to increase the torsional stiffness of the building.
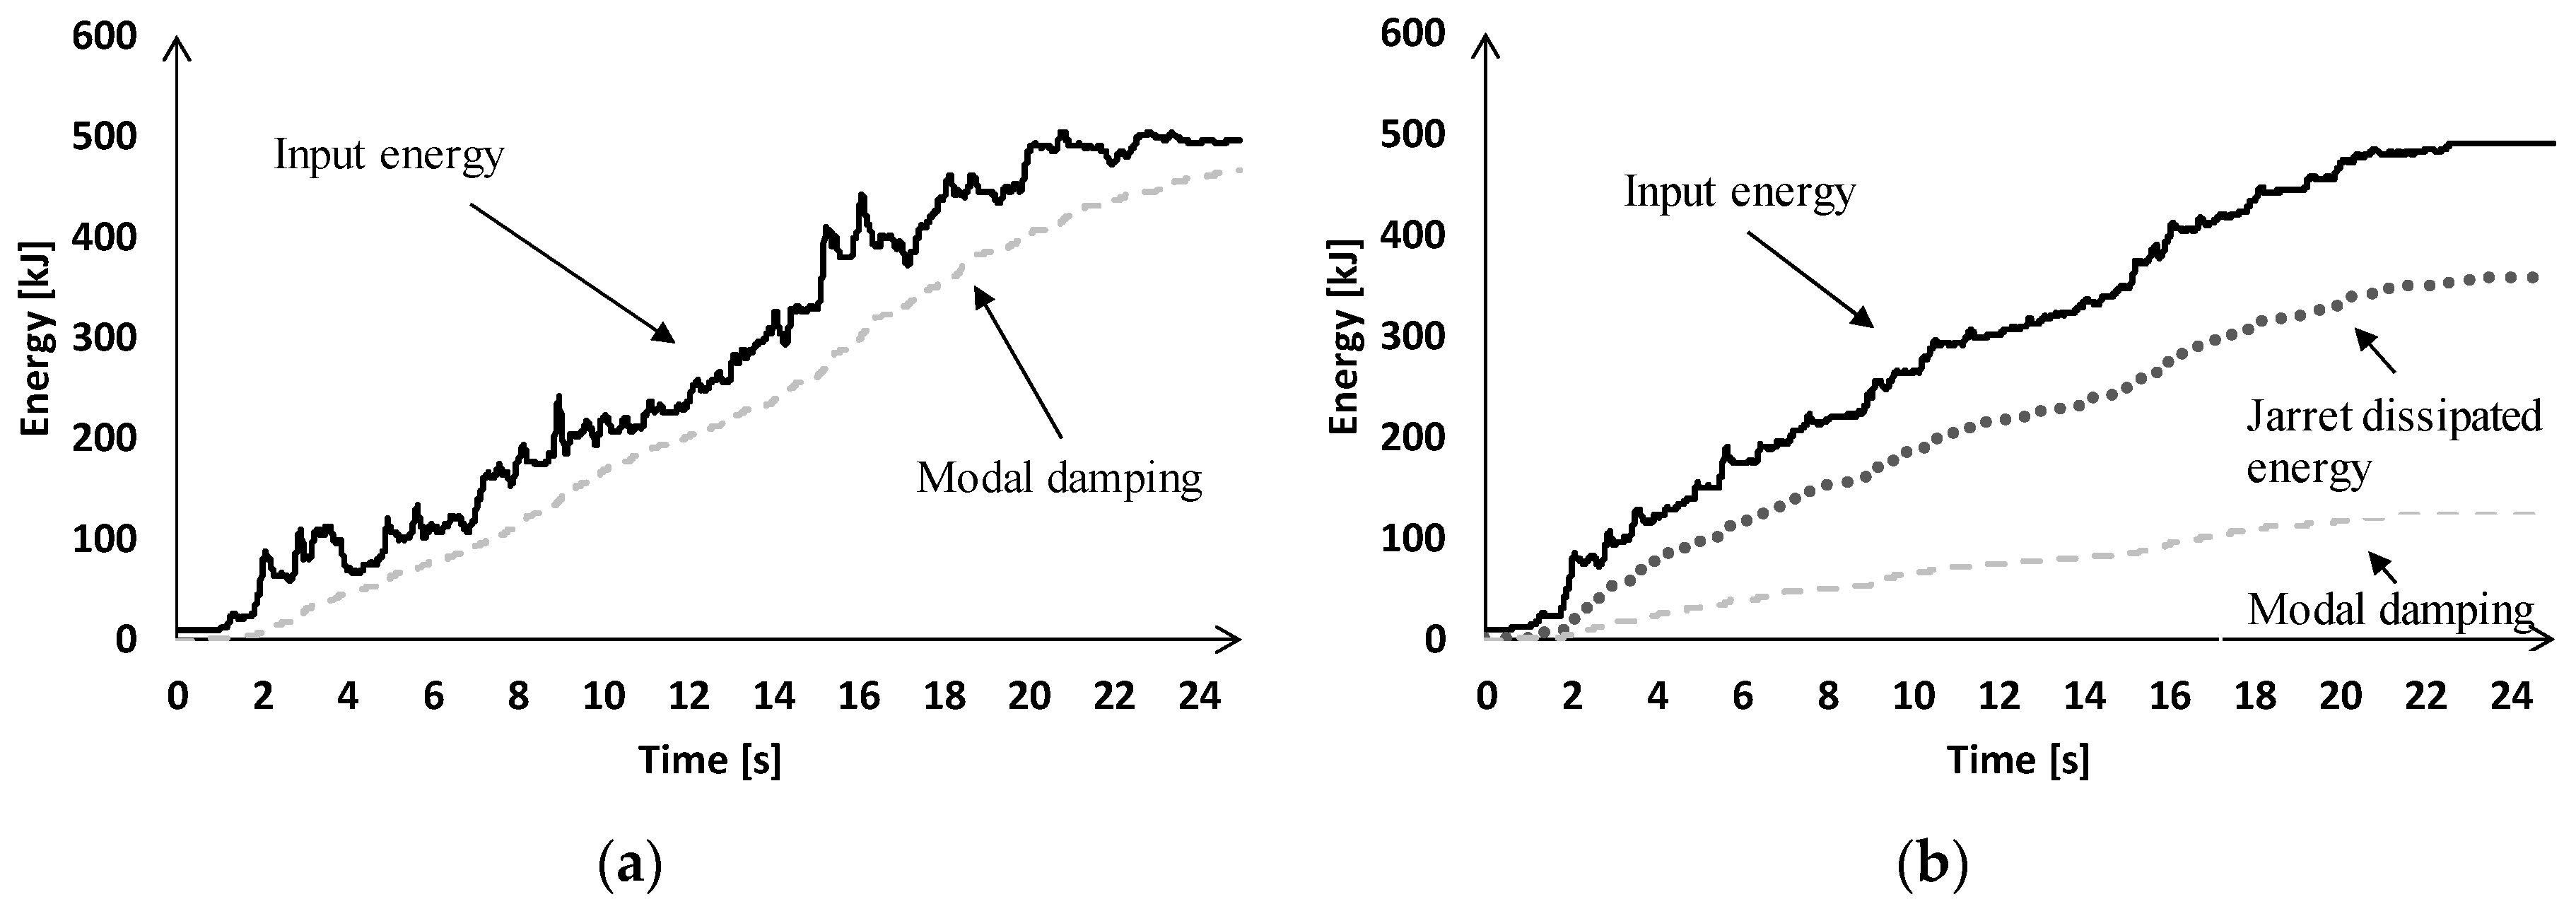
After the introduction of the devices in the FE building model, the FNA is performed and the energy dissipated by the devices is evaluated. The graphs representing the energy patterns are plotted in
Figure 9.
In
Figure 9a, the graph relative to the energy dissipated by the as-built construction through modal damping is compared to the total input energy. It is observed that the great part of input energy is dissipated precisely by modal damping, while the remaining small amount is balanced by the kinetic and the elastic energy of the building, not represented in the diagram.
In
Figure 9b, the graph relative to the energy dissipated by the retrofitted building is shown. From this figure it can be seen that, at t = 30 s, i.e., at the end of the seismic event, more than half of the input energy is dissipated by BRAD devices. For the energy balance it follows that, at the same instant of time, the energy dissipated by the modal damping of the structure is lower than the half of the input energy. Thus, from the comparison between
Figure 9a,b, it can be observed that the adoption of BRADs leads to a reduction in the energy absorbed by the building structural members, represented by the modal damping energy, and a consequent reduction or elimination of structural damage.
Great reliability of the energy dissipation system is required by the Italian Building Code [
14], due to the important role the devices play during a seismic event. In particular, it is required that the devices not break or exhibit damage under the MCE. This is assured by checking the device peak displacement, which, as prescribed by [
14], is obtained by the sum two values. The first one is the displacement due to an earthquake with intensity greater than the one used for the BDE, for which the displacement due to the MCE is assumed. The second value is obtained considering the maximum between the residual displacement at the SDE and the displacement corresponding to axial force equal to zero, following the path starting from the point of maximum displacement at the SDE, reduced by 50%. The peak displacement obtained by the sum of these two values must be kept below the device’s allowed displacement.
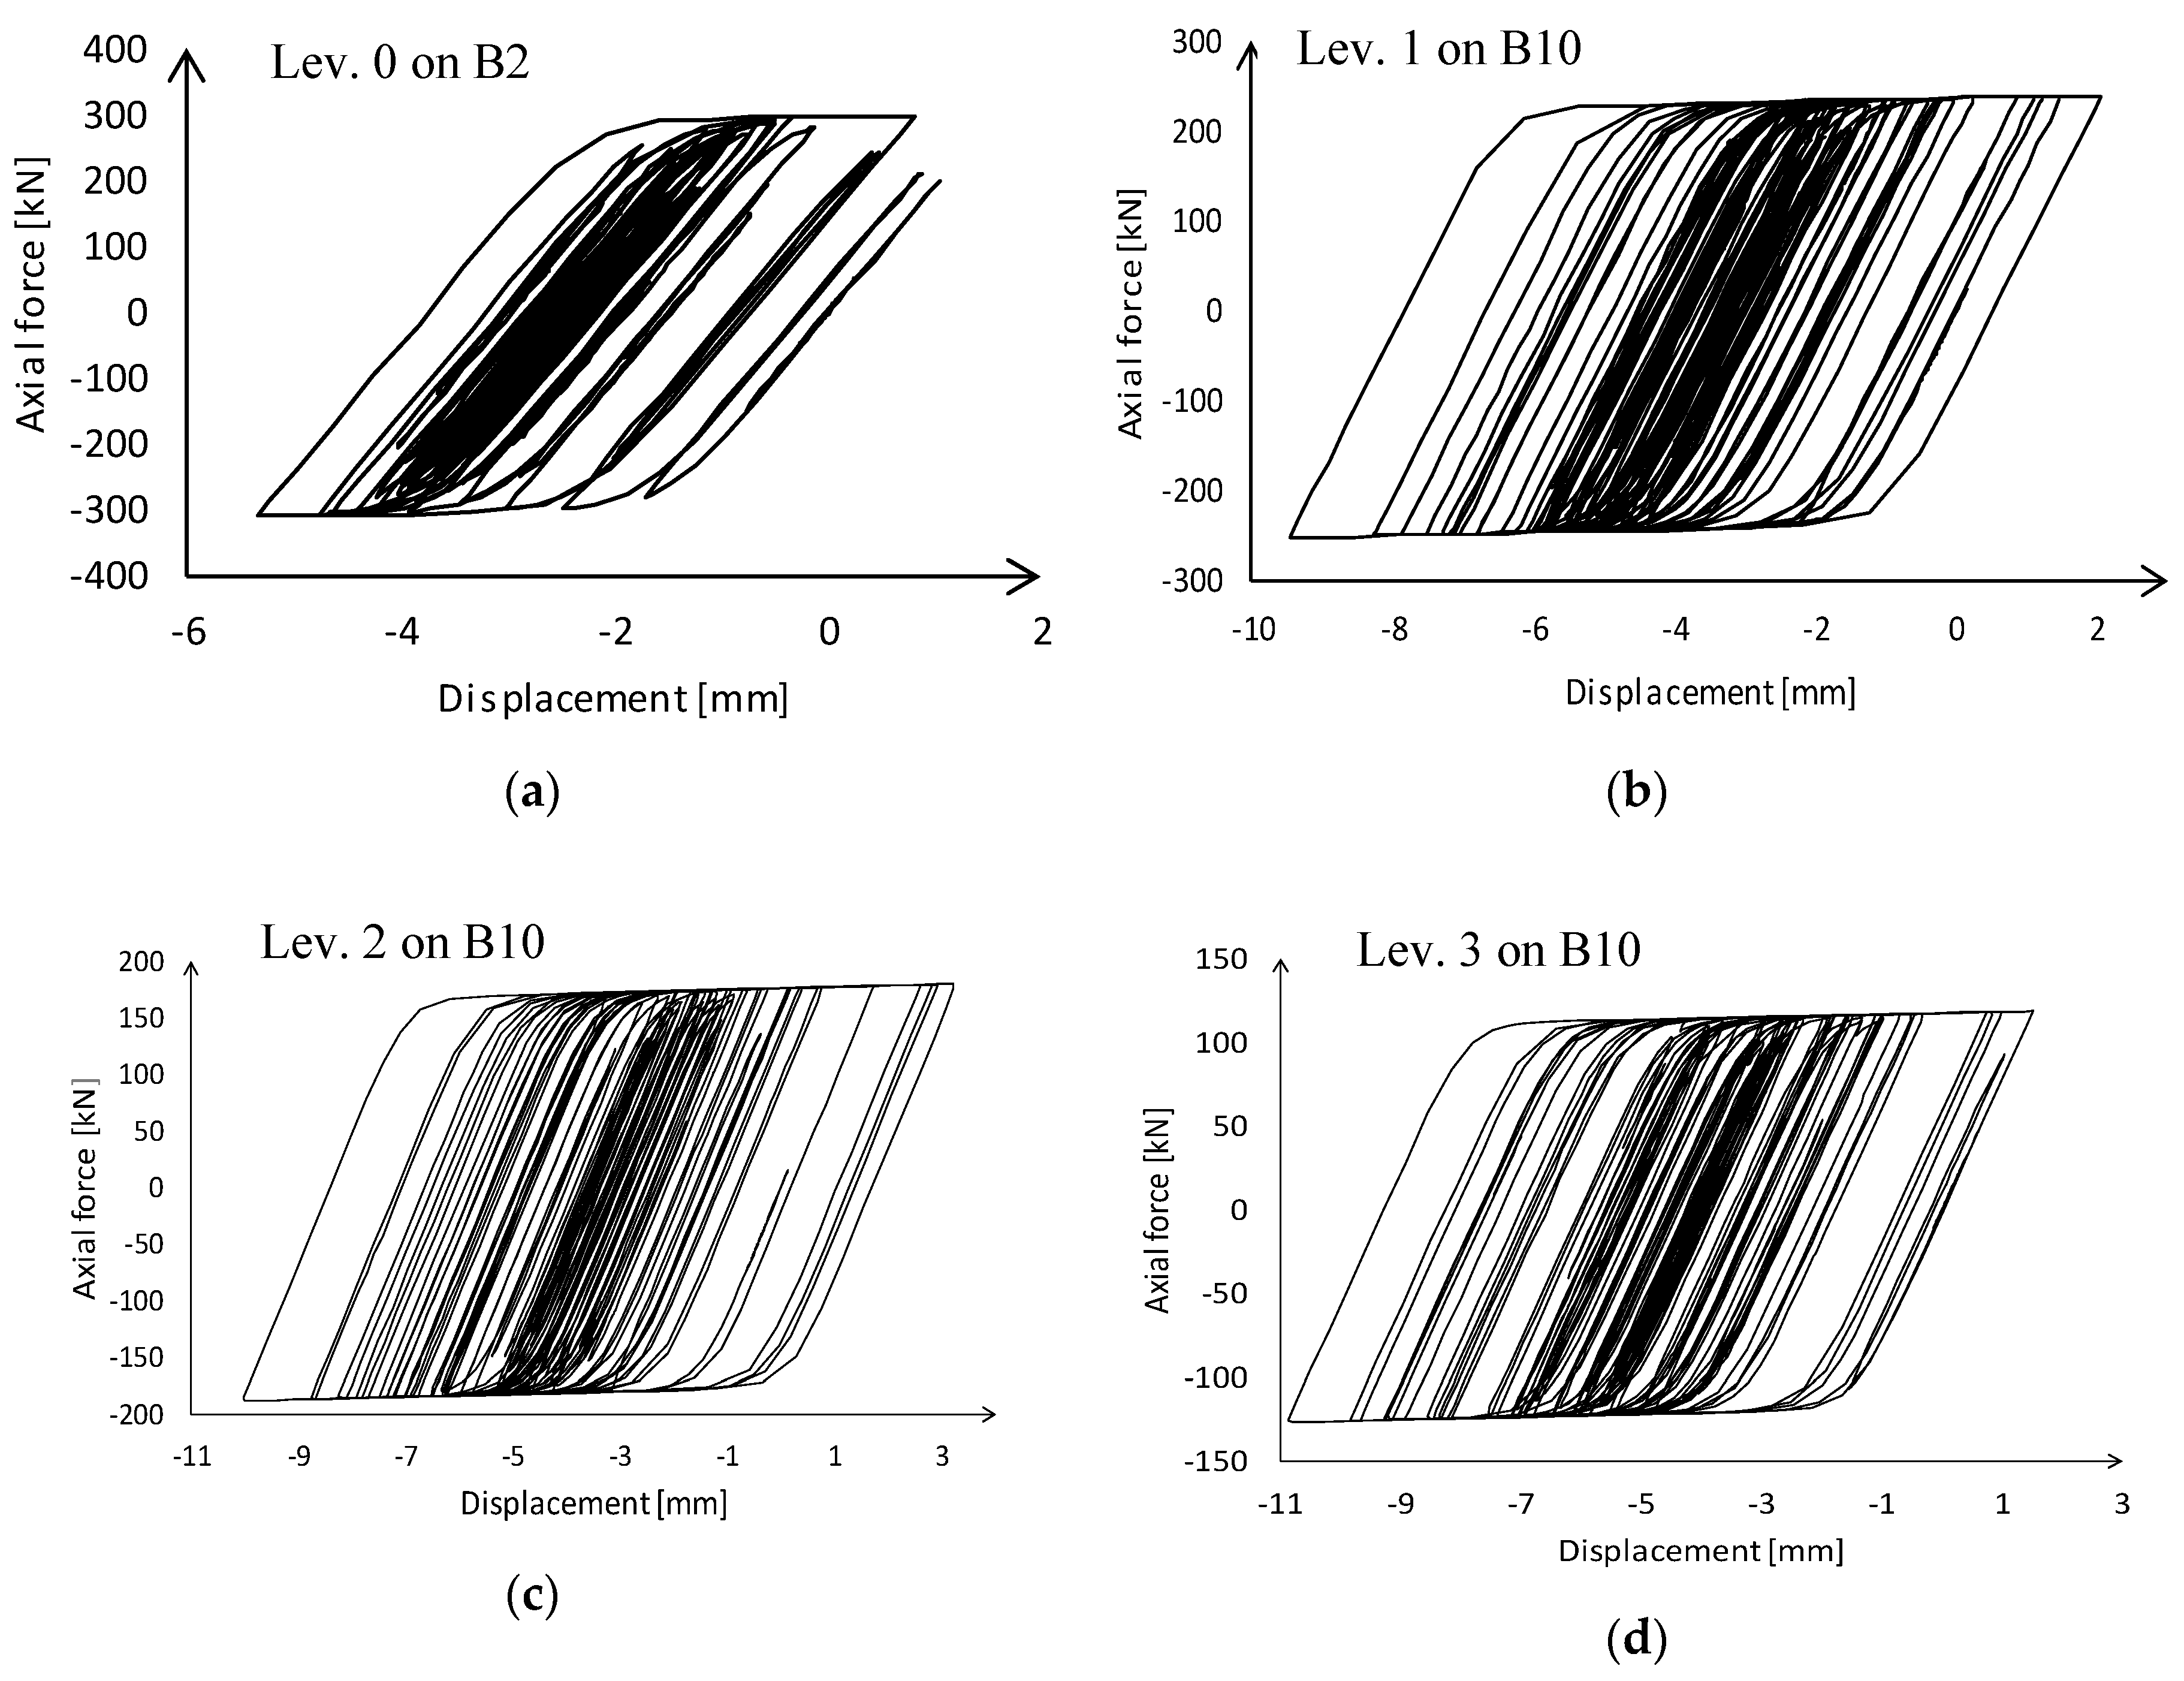
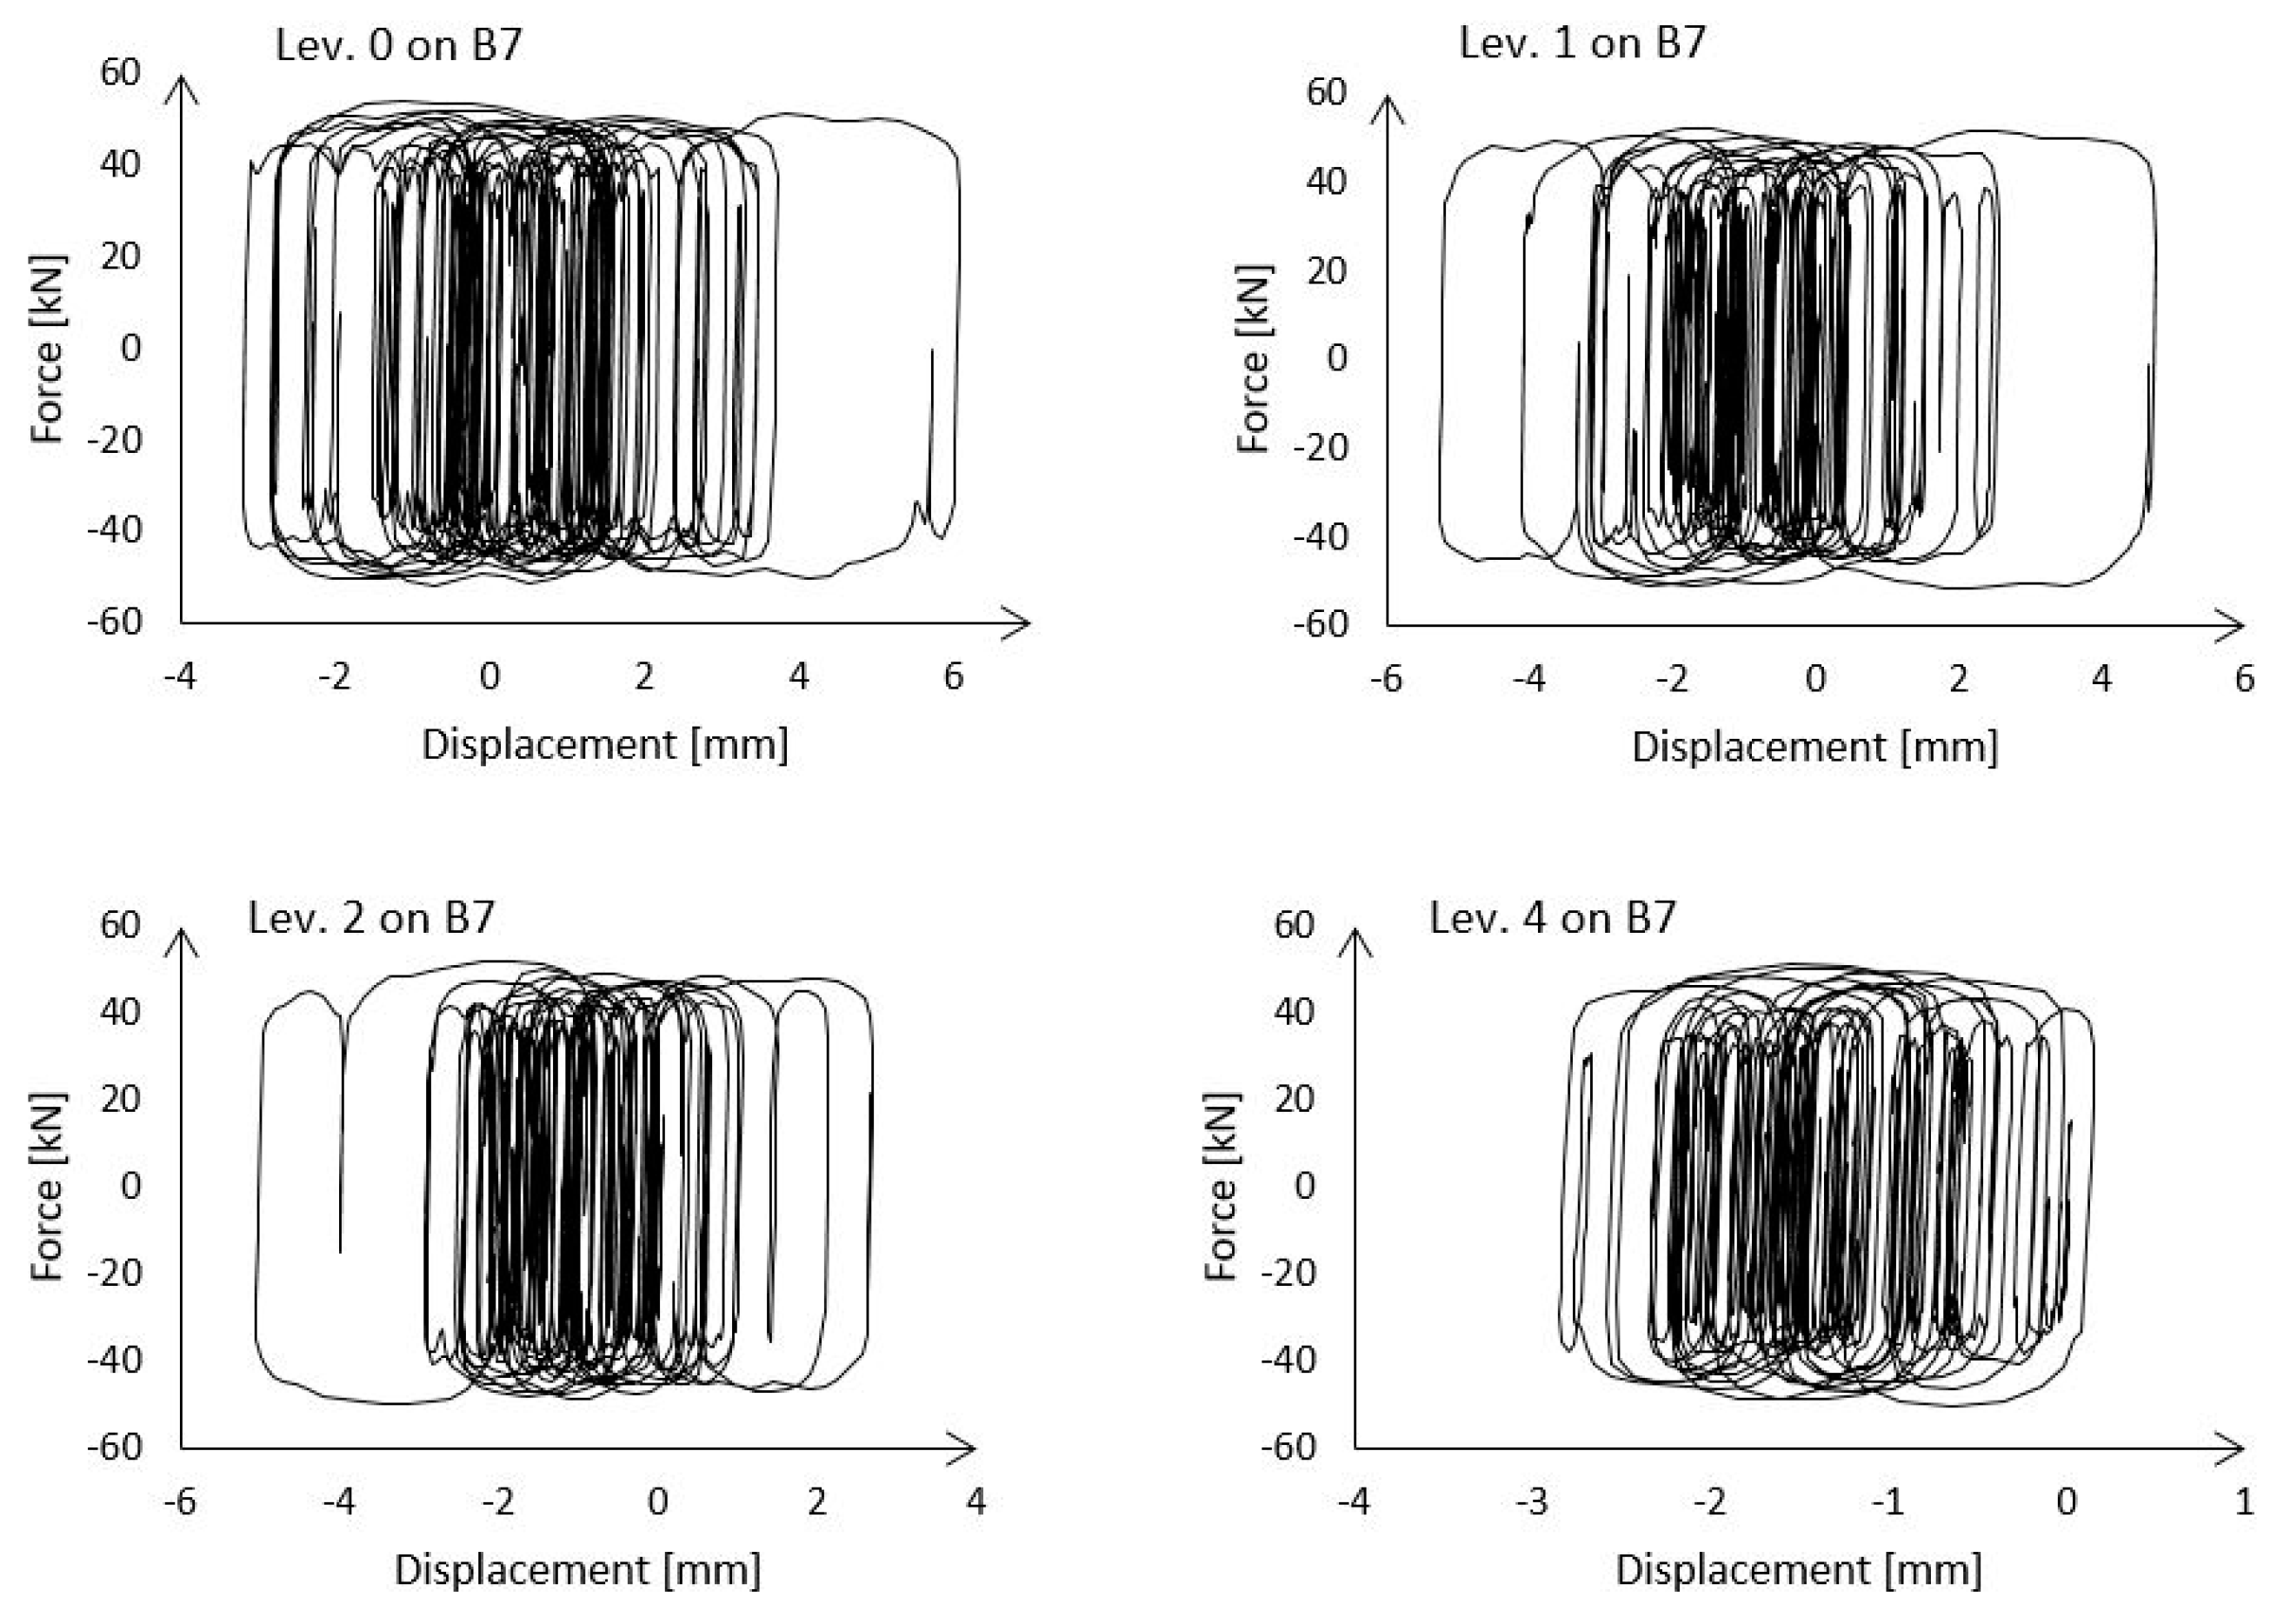
Figure 10 shows the cyclic response of four devices, one for each type used, under the MCE, representing the most stressed ones.
From the diagrams in this figure it is possible to obtain the first value necessary to calculate the peak displacement. For the four devices, the second value is always found to be the residual displacement at the SDE. The peak displacements, obtained as described, for BRAD 34/30-b, 27/30-b, 21/30-b and 14/30-b are, respectively, 3.1 mm, 8.7 mm, 10.7 mm and 11.1 mm. All of them are lower than the device’s allowed displacement, that is 15 mm.
Having verified that the behavior of the anti-seismic devices is compliant with the code [
14], verifications of the structural members are performed. In the as-built configuration, secondary beams and some of the columns at the base do not satisfy ductile verifications. Hence the verifications of only these members of the retrofitted building are shown in
Figure 11.
In this figure, the names of the members are reported in the horizontal axis, where beams are indicated with letter B and columns with C. From
Figure 11 it can be observed that, thanks to the retrofit intervention, the ratio demand/capacity is always lower than 1. For example, column C1, which does not satisfy the ductile verification in the as-built condition, after the retrofit intervention shows a reduction in the acting bending moment of about 66% (from 322.2 kN·m to 108.6 kN·m). On average, the reduction in the acting bending moment is of 49% for beams and 62% for columns.
The results of brittle verifications only, for members not verified before the introduction of BRADs, are shown in
Figure 12.
From this figure it can be observed that, thanks to the retrofit intervention, the demand/capacity ratio is always lower than 1. For example, beam B4, which did not satisfy the shear verification in the as-built condition, after the retrofit intervention shows a reduction in the acting shear of about 57% (from 23.4 kN to 10.1 kN). On average, the reduction in the acting shear is of 55% for beams and 64% for columns. These results show the great benefits obtained from the use of the dissipative system.
Regarding verification of beam–column joints, many of them are still not verified even after retrofit. Hence, for improving their performance, local strengthening interventions are needed.
Regarding the walls, verifications are already satisfied in the as-built configuration, before the introduction of the dissipative devices.
3.4. Building Torsional Stiffness
Torsional stiffness of the building is an important parameter that has to be considered in the design of retrofit interventions. In fact, low torsional stiffness, together with irregularity in plan, may produce additional non-negligible displacements in the columns, especially in those that are placed along the building perimeter. To evaluate if the installation of dissipative braces is able to increase the building torsional stiffness, this parameter is calculated before and after the introduction of BRADs. To calculate the torsional stiffness of the building, the torsional stiffness of each floor has to be determined, and the minimum among the determined stiffnesses has to be considered. The torsional stiffness of each floor is calculated by applying a torsional moment around the z-axis (perpendicular to the floor) and surveying its rotation.
To perform this calculation, since the considered building has slightly staggered floors (
Figure 3b) a simplification is introduced by assigning the same diaphragm constraint to the pairs of floors that are closest to each other. Then the torsional moment
Mtor around the Z-axis is applied to the center of mass of a diaphragm, while all other diaphragms are embedded. The rotation of the center of mass,
γ, due to this torsional moment, is obtain from the FE model, and the torsional stiffness,
ktor, is calculated as Equation (12):
To evaluate the improvement of the torsional stiffness of each building floor due to the presence of BRADs,
ktor is calculated in the same way on the FE model with dissipative devices. Relative results are reported in
Table 2.
The introduction of the dissipative devices increases the building torsional stiffness, especially on the first level (ground floor), where an improvement of about 12% is obtained, while in the other two levels, the increase in torsional stiffness is about 7%.
To assess whether a structure is torsionally deformable, the Italian Building Code [
14] prescribes the determination of the minimum of the ratios between
rs2 and
ls2, where
rs2 =
ktor/
kf is the ratio between
ktor and the flexural stiffness,
kf, of each floor, and
ls2, in cases of a rectangular plan, is equal to (
L2 +
B2)/12, with
L and
B the dimensions of the floor in the plan. For building A, considering the floor coinciding with a diaphragm,
ls2 = 61.9 m
2 for all diaphragms. Since
ls2 is constant, to obtain the minimum ratio
rs2/
ls2, the minimum value of
rs has to be considered; hence, the maximum
kf has to be calculated. To do this, a unitary point load,
F, is applied, along one of the building’s principal directions, to the center of rigidity of the considered diaphragm, while the other diaphragms are embedded. This results in a translational displacement,
d, of the floor without torsional effect. The flexural stiffness, is then obtained from Equation (13):
The maximum flexural stiffness of the building is gained in the y direction. The corresponding results are shown in
Table 2, where it can be seen that the ratios
rs2/
ls2 are higher than 1.0 for all levels. This is the limit above which a building can be considered not torsionally deformable according to [
14]. For this reason, from the point of view of torsional deformability, the behavior of building A before retrofitting cannot be regarded as satisfactory.
There is still a benefit brought by the use of BRADs, because, after retrofit, on the first level rs2/ls2 increases by about 11%, and on the other two levels it increases by more than 6%.


