Article

Tool Wear, Surface Topography, and Multi-Objective Optimization of Cutting Parameters during Machining AISI 304 Austenitic Stainless Steel Flange

1
School of Mechanical Engineering, Shandong University, Jinan 250061, China
2
Key Laboratory of High Efficiency and Clean Mechanical Manufacture of MOE/Key National, Demonstration Center for Experimental Mechanical Engineering Education, Jinan 250061, China
*
Author to whom correspondence should be addressed.
Metals 2019, 9(9), 972; https://doi.org/10.3390/met9090972
Submission received: 20 July 2019 / Revised: 1 September 2019 / Accepted: 2 September 2019 / Published: 3 September 2019

Abstract

:
The application of AISI 304 austenitic stainless steel in various industrial fields has been greatly increased, but poor machinability classifies AISI 304 as a difficult-to-cut material. This study investigated the tool wear, surface topography, and optimization of cutting parameters during the machining of an AISI 304 flange component. The machining features of the AISI 304 flange included both cylindrical and end-face surfaces. Experimental results indicated that an increased cutting speed or feed aggravated tool wear and affected the machined surface roughness and surface defects simultaneously. The generation and distribution of surface defects was random. Tearing surface was the major defect in cylinder turning, while side flow was more severe in face turning. The response surface method (RSM) was applied to explore the influence of cutting parameters (e.g., cutting speed, feed, and depth of cut) on surface roughness, material removal rate (MRR), and specific cutting energy (SCE). The quadratic model of each response variable was proposed by analyzing the experimental data. The optimization of the cutting parameters was performed with a surface roughness less than the required value, the maximum MRR, and the minimum SCE as the objective. It was found that the desirable cutting parameters were v = 120 m/min, f = 0.18 mm/rev, and ap = 0.42 mm for the AISI 304 flange to be machined.

Graphical Abstract

1. Introduction

Among the existing types of stainless steel, austenitic stainless steel is currently the most widely used and consumed in industry [1]. AISI 304 austenitic stainless steel is highly applied in high-tech fields such as aviation, nuclear power, medicine, and shipping because of its excellent comprehensive performance in high-temperature and strong corrosion conditions. Austenitic stainless steel has the characteristics of poor thermal conductivity and easy work hardening [2,3,4]. Its physical and mechanical properties greatly affect its cutting performance, making its machinability worse than other alloy steels; hence, it belongs to the category of difficult-to-cut metals.
Poor surface quality and severe tool wear are two of the most concerning problems in stainless steel machining [5,6]. Therefore, it is significant to investigate the machinability of stainless steel for optimizing the machining process. Ahmed et al. [7] proposed that the reasonable control of built-up edge (BUE) could effectively improve the machining surface quality of stainless steel. Both Özbek et al. [8] and Patil et al. [9] adopted cryogenically treated cutting tools to turn austenitic stainless steel. It was found that cryogenically treated cutting tools were not only more wear-resistant, but could also reduce the surface roughness to a certain extent. Mahdavinejad and Saeedy [10] explored the role of cutting fluids on AISI 304 machining. Pereira et al. [11] tried the cryogenic minimum quantity of lubrication method during machining AISI 304. The results demonstrated that this method improved tool life and processing efficiency.
The optimization of cutting parameters is very important for providing high-quality and high-efficiency machining [12]. Some related research work has been done to discuss this problem. The Taguchi method and analysis of variance (ANOVA) were used to explore the relationship between the cutting parameters and machining performance [1,4,13]. On this basis, the optimum process parameters were obtained. The effectiveness of Taguchi’s technique in the analysis of surface roughness was confirmed. Tekıner and Yeşılyurt [14] employed the process sound technique to identify the processing conditions in order to adjust the processing conditions to the best. This method could reduce the workload of measurement and data acquisition. Junaidha et al. [15] focused their work on collecting cutting force data and chips and measuring surface roughness during turning stainless steel. The cutting parameters selected based on this analysis effectively improved the processing quality.
There are often multiple optimization objectives in the actual production. Usually, the best cutting parameters for one quality characteristic will worsen other quality characteristics. Therefore, it is necessary to select multiple machining quality indicators as the objectives of simultaneous optimization, in order to improve the machining quality in a balanced way [16]. For example, Nayak et al. [17] measured material removal rate (MRR), cutting force, and surface roughness in experiments and used the grey correlation method to obtain suitable cutting parameters with these three quality characteristics as objectives. But this method could not reflect the interaction between independent variables.
The response surface method (RSM) is an effective analytical method widely utilized in various fields [18]. It adopts a multivariate quadratic regression equation to fit the functional expression between values of experimental variables and response values [19,20,21]. It can be used to model and predict the target response affected by multiple input variables to optimize the response [22]. Bouzid et al. [18] dealt with tool life and surface roughness when machining AISI 304 and developed the corresponding quadratic regression model. The impact of the process parameters on machining performance was studied comprehensively employing the ANOVA and RSM. Carmita [23] applied RSM to the turning experiment of AISI 6061 T6 aluminum and took energy consumption as one of the optimization objectives. Experiments showed that the RSM was superior to the traditional optimization method.
A literature review revealed that much of the related research has been done to explore the effect of the cutting parameters on surface roughness during turning AISI 304. However, there are few studies dealing with the tool wear and surface topography. The related work of cutting energy consumption was rarely noticed in the AISI 304 turning process. Therefore, the purpose of this study is to investigate the tool wear and surface topography of AISI 304 in dry turning. RSM was utilized to optimize the cutting parameters with the objective of optimizing surface roughness, MRR, and specific cutting energy (SCE).

2. Materials and Methods

2.1. Workpiece Material and Cutting Tool

To run the experiments, AISI 304 was chosen as the experimental material which is often used to make equipment and parts that require a good overall performance. The composition and physical properties of AISI 304 are shown in Table 1 and Table 2. The tests were carried out with Sandvik’s turning inserts CNMG 120404–SF H13A (Sandvik, Sandwich, Sweden). The tool had an effective working rake of 9° and an edge inclination angle of 6°.

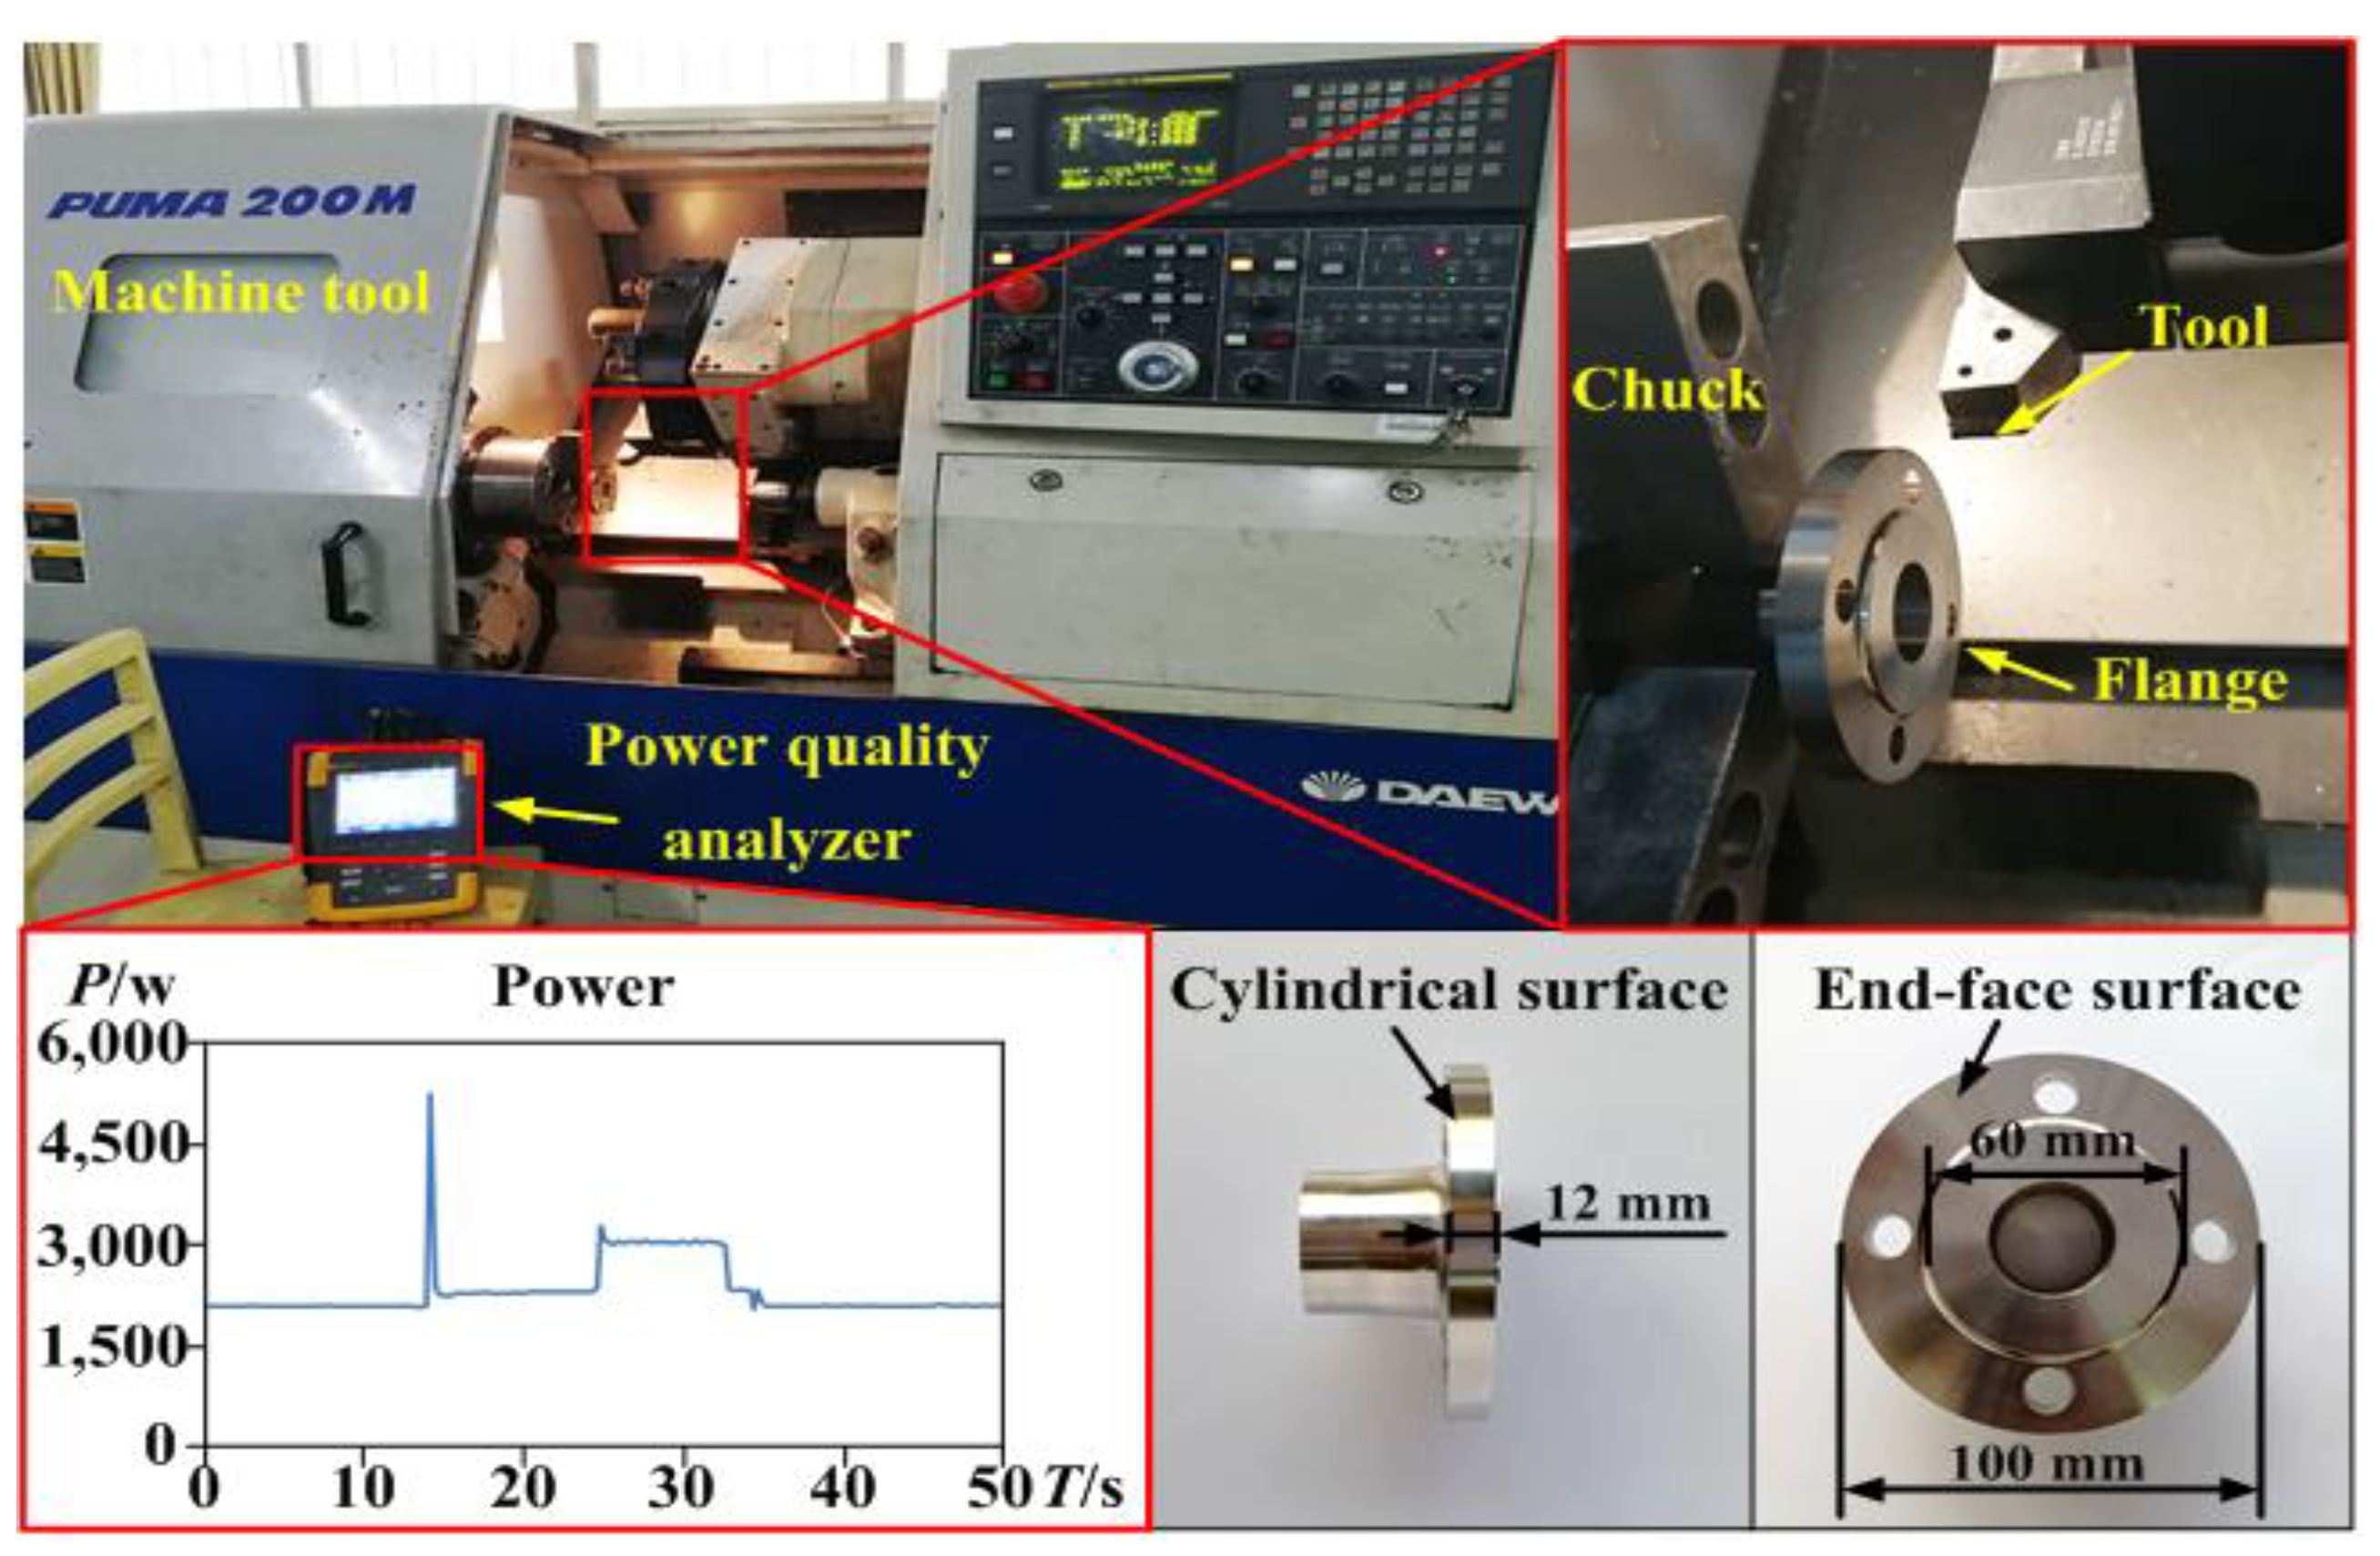
2.2. Experimental Equipment

The experimental equipment was displayed in Figure 1. In this study, all the experiments were conducted using a turning lathe PUMA 200M (Daewoo, Seoul, Korea) under dry conditions. The maximum driving power of this lathe was 15 kW, and the maximum spindle speed was 6000 rpm. Scanning electron microscopy (SEM) SH-3000 (Zeiss, Oberkochen, Germany) was employed to photograph tool wear and machined surface defects. A laser scanning confocal microscope VK-X250K (Keyence, Osaka, Japan) was used to obtain the 3D surface morphology and measure surface roughness. In addition, the power consumed at the input of the machine was measured with a Fluke 434 energy analyzer (Fluke, Everett, WA, USA). All experiments were continuously performed without shutting down the machine tool. Power data acquisition started from machine tool start-up until all programs were completed.

2.3. Design of Experiments

Cylindrical and end-face surfaces are the main process features of machining flanges. Hence, tool wear and the surface topography of two process features were explored in the present work. Cylinder turning experiments were performed at different cutting speeds of 50 and 100 m/min, various feed of 0.1 and 0.2 mm/rev, and a constant depth of cut of 0.5 mm. In face turning, the spindle speed remained constant at 450 rpm. Tests were accomplished at different feed rates of 0.1 and 0.2 mm/rev and various depths of cut of 0.3 and 0.5 mm.
In the present work, RSM was utilized to study the impact of cutting parameters on the surface quality, machining efficiency, and cutting energy consumption during cylinder turning. Cutting parameters were the experimental variables, and the response variables were SCE, MRR, and surface roughness. The experimental scheme is shown in Table 3.

3. Results and Discussions

3.1. Tool Wear

In this study, tool wear patterns in turning of AISI 304 were analyzed. The tool wear patterns in cylinder turning and face turning are shown in Figure 2 and Figure 3, respectively. The main types of tool wear included crater wear, flank wear, notch wear, BUE, built-up layer (BUL), chipping, etc. As displayed in Figure 2a, material particles formed BUE on the rake face under the condition v = 50 m/min, f = 0.1 mm/rev. BUE effectively protected the tool tip, so that the tool wear was less severe. Under a higher cutting speed (v = 100 m/min, f = 0.1 mm/rev), BUE disappeared. The material particles formed BUL on the rake face, which can be seen in Figure 2b. This was attributed to the high amounts of heat generated as the speed increased, which softened the material and made it difficult to form BUE. In Figure 2c, a slight chipping occurred at the tip of tool under the condition v = 50 m/min, f = 0.2 mm/rev. Furthermore, it is obvious that the crater wear was more serious, and the notch wear also increased. This was because the cutting speed was low, but the feed was large, and the thermal softening of materials was not significant, which caused the cutting edge to crack easily. In Figure 2d, the tool wear was the most severe under the parameters v = 100 m/min, f = 0.2 mm/rev, and the flank wear was the main tool wear pattern. Chipping did not occur under these parameters. A large amount of heat was produced due to the high cutting parameters, which made the metal highly softened. This also explains why the BUE did not form.
Figure 3 reveals that the flank wear was dominant, while the crater wear was less severe due to the protection of the adhered material. As shown in Figure 3a, the deformed material particles adhered to the rake face to form BUE under the cutting parameters ap = 0.5 mm, f = 0.1 mm/rev. Due to the effective protection of BUE, tool wear was less severe. As displayed in Figure 3b–d, cutting speed or feed increased separately or simultaneously. As a result, tool wear increased in varying degrees. BUE disappeared, and notch wear of different degrees occurred at the tool edge. However, in general, there was little difference in the degree of tool wear and tool wear patterns under the four sets of parameters.

3.2. Surface Topography

3.2.1. Surface Defects

There were many small defects on the machined surface. Photographs of machined surface defects taken by SEM are shown in Figure 4 and Figure 5. In the present study, the most common types of surface defects were tearing surface, scratch marks, feed marks, side flow, plastic flow, plowing grooves, and adhered material particles. These defects had a great effect on the service life of parts. This chapter will discuss the causes of surface defects.
Figure 4 presented the surface defects of the cylinder turning surface. In the cutting process, BUE was formed at the tip of the tool. The BUE was unstable during the cutting process, and the material particles were formed after dropping off, and adhered to the processed surface as displayed in Figure 4b–c. As shown in Figure 4a, severe tearing surface existed on the machined surface, which was related to the extrusion and friction of BUE and material particles. Tearing surface was the major defect in cylinder turning. Feed marks were formed by cutting residues between adjacent tool paths, and its characteristics are displayed in Figure 4f. It was generated by the relative movement of tool and workpiece and distributed in parallel lines. The width between tool paths was related to the feed rate. Side flow occurred on the feed marks as can be seen in Figure 4f. The metal was softened by the high cutting temperature during turning and was extruded by the tool to produce side flow. In addition, some scratch marks were observed as presented in Figure 4d. This type of defect was mainly caused by scratching of chips.
The defects of the face turning surface are shown in Figure 5. The characteristics and causes of most defects were the same as those of the cylinder turning surface. The biggest difference was that the side flow near the feed marks was more severe, as shown in Figure 5c–d. Side flow was the dominant type of surface defects in face turning. As displayed in Figure 5e, there were some plowing grooves in the machined surface. It was formed by extrusion of peeled material particles or BUE. Furthermore, plastic flow occurred due to the softening of materials caused by thermal loads and the extrusion effect, as presented in Figure 5a,f.

3.2.2. 3D Surface Topography

For the sake of analyzing the influence of different processing parameters on the surface topography, 3D surface topography of the machined surface was measured. Figure 6 and Figure 7 presents the 3D surface topography of the machined surface in cylinder turning and face turning, respectively. The machined surface presented regular peaks and valleys. The width between adjacent peaks equals the values of feed. As can be seen from Figure 6, the peak height of the cylinder turning surface at a lower speed was higher than that at a higher speed, and a higher feed corresponded to a higher peak height. As can be seen from Figure 7, the surface characteristics in face turning varied greatly with different parameters. The peak height of the machined surface at a lower feed was lower than that at a higher feed. Similarly, the peak height was higher under a larger depth of cut than under smaller ones.

3.3. Optimization

The experiments corresponding to the cutting parameters in Table 3 were carried out, and important experimental data, such as surface roughness and input power of the turning lathe, were measured. The results of three response variables are shown in Table 4.
Sa is a roughness evaluation parameter based on regional morphology. It is used to represent the roughness of a two-dimensional surface topography. It describes surface roughness more comprehensively than Ra, which reflects roughness of a one-dimensional contour. Sa can be calculated by Equation (1).
S a = 1 A A | z ( x , y ) | d x d y
where, z(x, y) is the distance from the point on the surface contour to the reference plane, and A is the measurement area.
MRR reflects the processing efficiency of the corresponding cutting parameters. MRR can be obtained using Equation (2).
M R R = v f a p
SCE refers to the energy consumed by removing material per unit volume. It can not only reflect the corresponding relationship between the cutting energy consumption and MRR, but also indicate the energy efficiency of the turning lathe. The SCE is determined according Equations (3) and (4).
P c = P P 0
S C E = P c M R R
where, P refers to the total power, and P0 is the idle power. The idle power consists of standby power and spindle rotation power. Pc represents the power consumed by the material removal.
In the present research, Design-Expert software was utilized to analyze the relationships between three response variables and processing parameters based on RSM. The quadratic model of each response variable was developed by analyzing the experimental data. The models of each response were given as Equations (5)–(7).
S a = 9.834 0.078 v 15.627 f 18.614 a p 0.019 v f + 0.02 v a p + 18.9 f a p + 53.601 f 2 + 19.075 a p 2
M R R = 6093.658 59.997 v 40805.8 f 14932.736 a p + 400 v f + 150 v a p + 100000 f a p
S C E = 14.12 0.1 v 27.963 f 6.108 a p 0.023 v f + 0.022 v a p + 0.417 f a p + 3.343 v 2 + 59.026 f 2 + 3.777 a p 2
ANOVA was carried out to evaluate the accuracy of the above models, and the results are shown in Table 5. R2 was close to 1, implying that the model fitted better. The Pred. R2 indicated that the model could be applied to predict response values [24].
The relationship of the predicted and actual values of surface roughness, MRR, and SCE are displayed in plots in Figure 8, respectively. As can be seen from the figures, all points were distributed around the diagonal line. It suggested that the error of the predicted value was very small. This result further verified the goodness of fit and accuracy of the developed models.
Figure 9 consists of a perturbation diagram and three contour plots. It describes the impact of factors on the surface roughness. Figure 9a is a perturbation plot, which can clearly help to compare the influence of each factor on surface roughness. A, B, and C in the figure represented cutting speed, feed, and depth of cut, respectively. It was obvious that the Sa decreased gradually with increasing cutting speed but increased with the rise of feed. The feed rate was the dominant factor affecting the surface roughness. The Sa first fell and then rose with the development of the depth of cut. This was related to work hardening behaviors of AISI 304. The depth of the hardened layer of AISI 304 austenitic stainless steel was 0.1–0.3 mm [25]. Therefore, avoiding a hardened layer as far as possible was beneficial to improving the quality of the machined surface. The interaction terms were included in the quadratic model developed previously. The contour plots in Figure 9b–d visually illustrated the interaction between the cutting parameters. Figure 9b,d suggests that the smaller the feed, the smaller the surface roughness. A global minimum point can be found from Figure 9c, at which the Sa was the smallest.
The impact of three factors on MRR can be clearly seen from the perturbation plot in Figure 10a. It is easy to see that all three cutting parameters had a significant positive impact on MRR. The increase of feed and depth of cut had a greater effect on MMR than that of cutting speed. Figure 10b–d depicts the influence of the interaction among three cutting parameters. It is not difficult to find that the maximum MRR, i.e., the maximum processing efficiency, can be obtained when all three parameters were maximized.
SCE was related to cutting power and MRR. Cutting power was the energy consumed per time unit by the machine tool to remove material. Therefore, the higher the material removal rate, the higher the corresponding cutting power. However, SCE was equal to the ratio of cutting power to MRR. It was difficult to estimate the influence of the cutting parameters on SCE directly. Figure 11 presents the effect of the factors on SCE. The perturbation plot in Figure 11a illustrated that all three cutting parameters had a negative impact on SCE. The cutting speed and feed had a greater impact on SCE, while depth of cut had a relatively insignificant impact. Figure 11b–d depicts the effects of the interaction terms of three experimental variables on SCE. Figure 11b illustrates that increasing cutting speed and feed led to a reduction of SCE. It is easy to see from Figure 11c that when the cutting speed was at a low level, the depth of cut had a slight influence on SCE. However, a higher depth of cut was beneficial to reduce SCE, when the cutting speed was higher. It can also be seen from Figure 11d that the depth of cut had a slight influence on SCE when the feed was small, and the depth of cut had a greater influence on SCE when the feed was large. In general, a smaller SCE was obtained when the cutting parameters were larger.
In actual production, the roughness of the machined surface is a dominant indicator for evaluating the quality of a workpiece. It is generally required that the surface roughness is less than a given value. Under the premise of ensuring the surface quality, it is desirable to improve productivity and reduce energy consumption. Therefore, it is very important to optimize the processing parameters for actual production.
In this study, the desirability function was employed to achieve the optimization of the cutting parameters. Desirability ranges from 0 to 1. The closer it approaches 1, the more desirable it is. It is defined as Equation (8). n is the number of responses, di is the desirability function for each response, and ri is related to the importance of the corresponding response.
D = ( d 1 r 1 × d 2 r 2 × × d i r i ) 1 r i = ( i = 1 n d i r i ) 1 r i
The process requirement of the flange was that the surface roughness was less than 1.6 μm. While meeting the process requirement, the goal was to achieve a maximum MRR and minimum SCE. Design-Expert software was employed to optimize the cutting parameters with the multi-objective function. The weights of the three optimization objectives were equal. The results of the optimization of the cutting parameters are presented in Table 6. It is obvious that the most desirable cutting parameters are v = 120 m/min, f = 0.18 mm/rev, and ap = 0.42 mm.

4. Conclusions

In this research, experiments involving AISI 304 austenitic stainless steel and an uncoated fine tool under different cutting parameters were conducted. The following conclusions can be drawn.
(1)
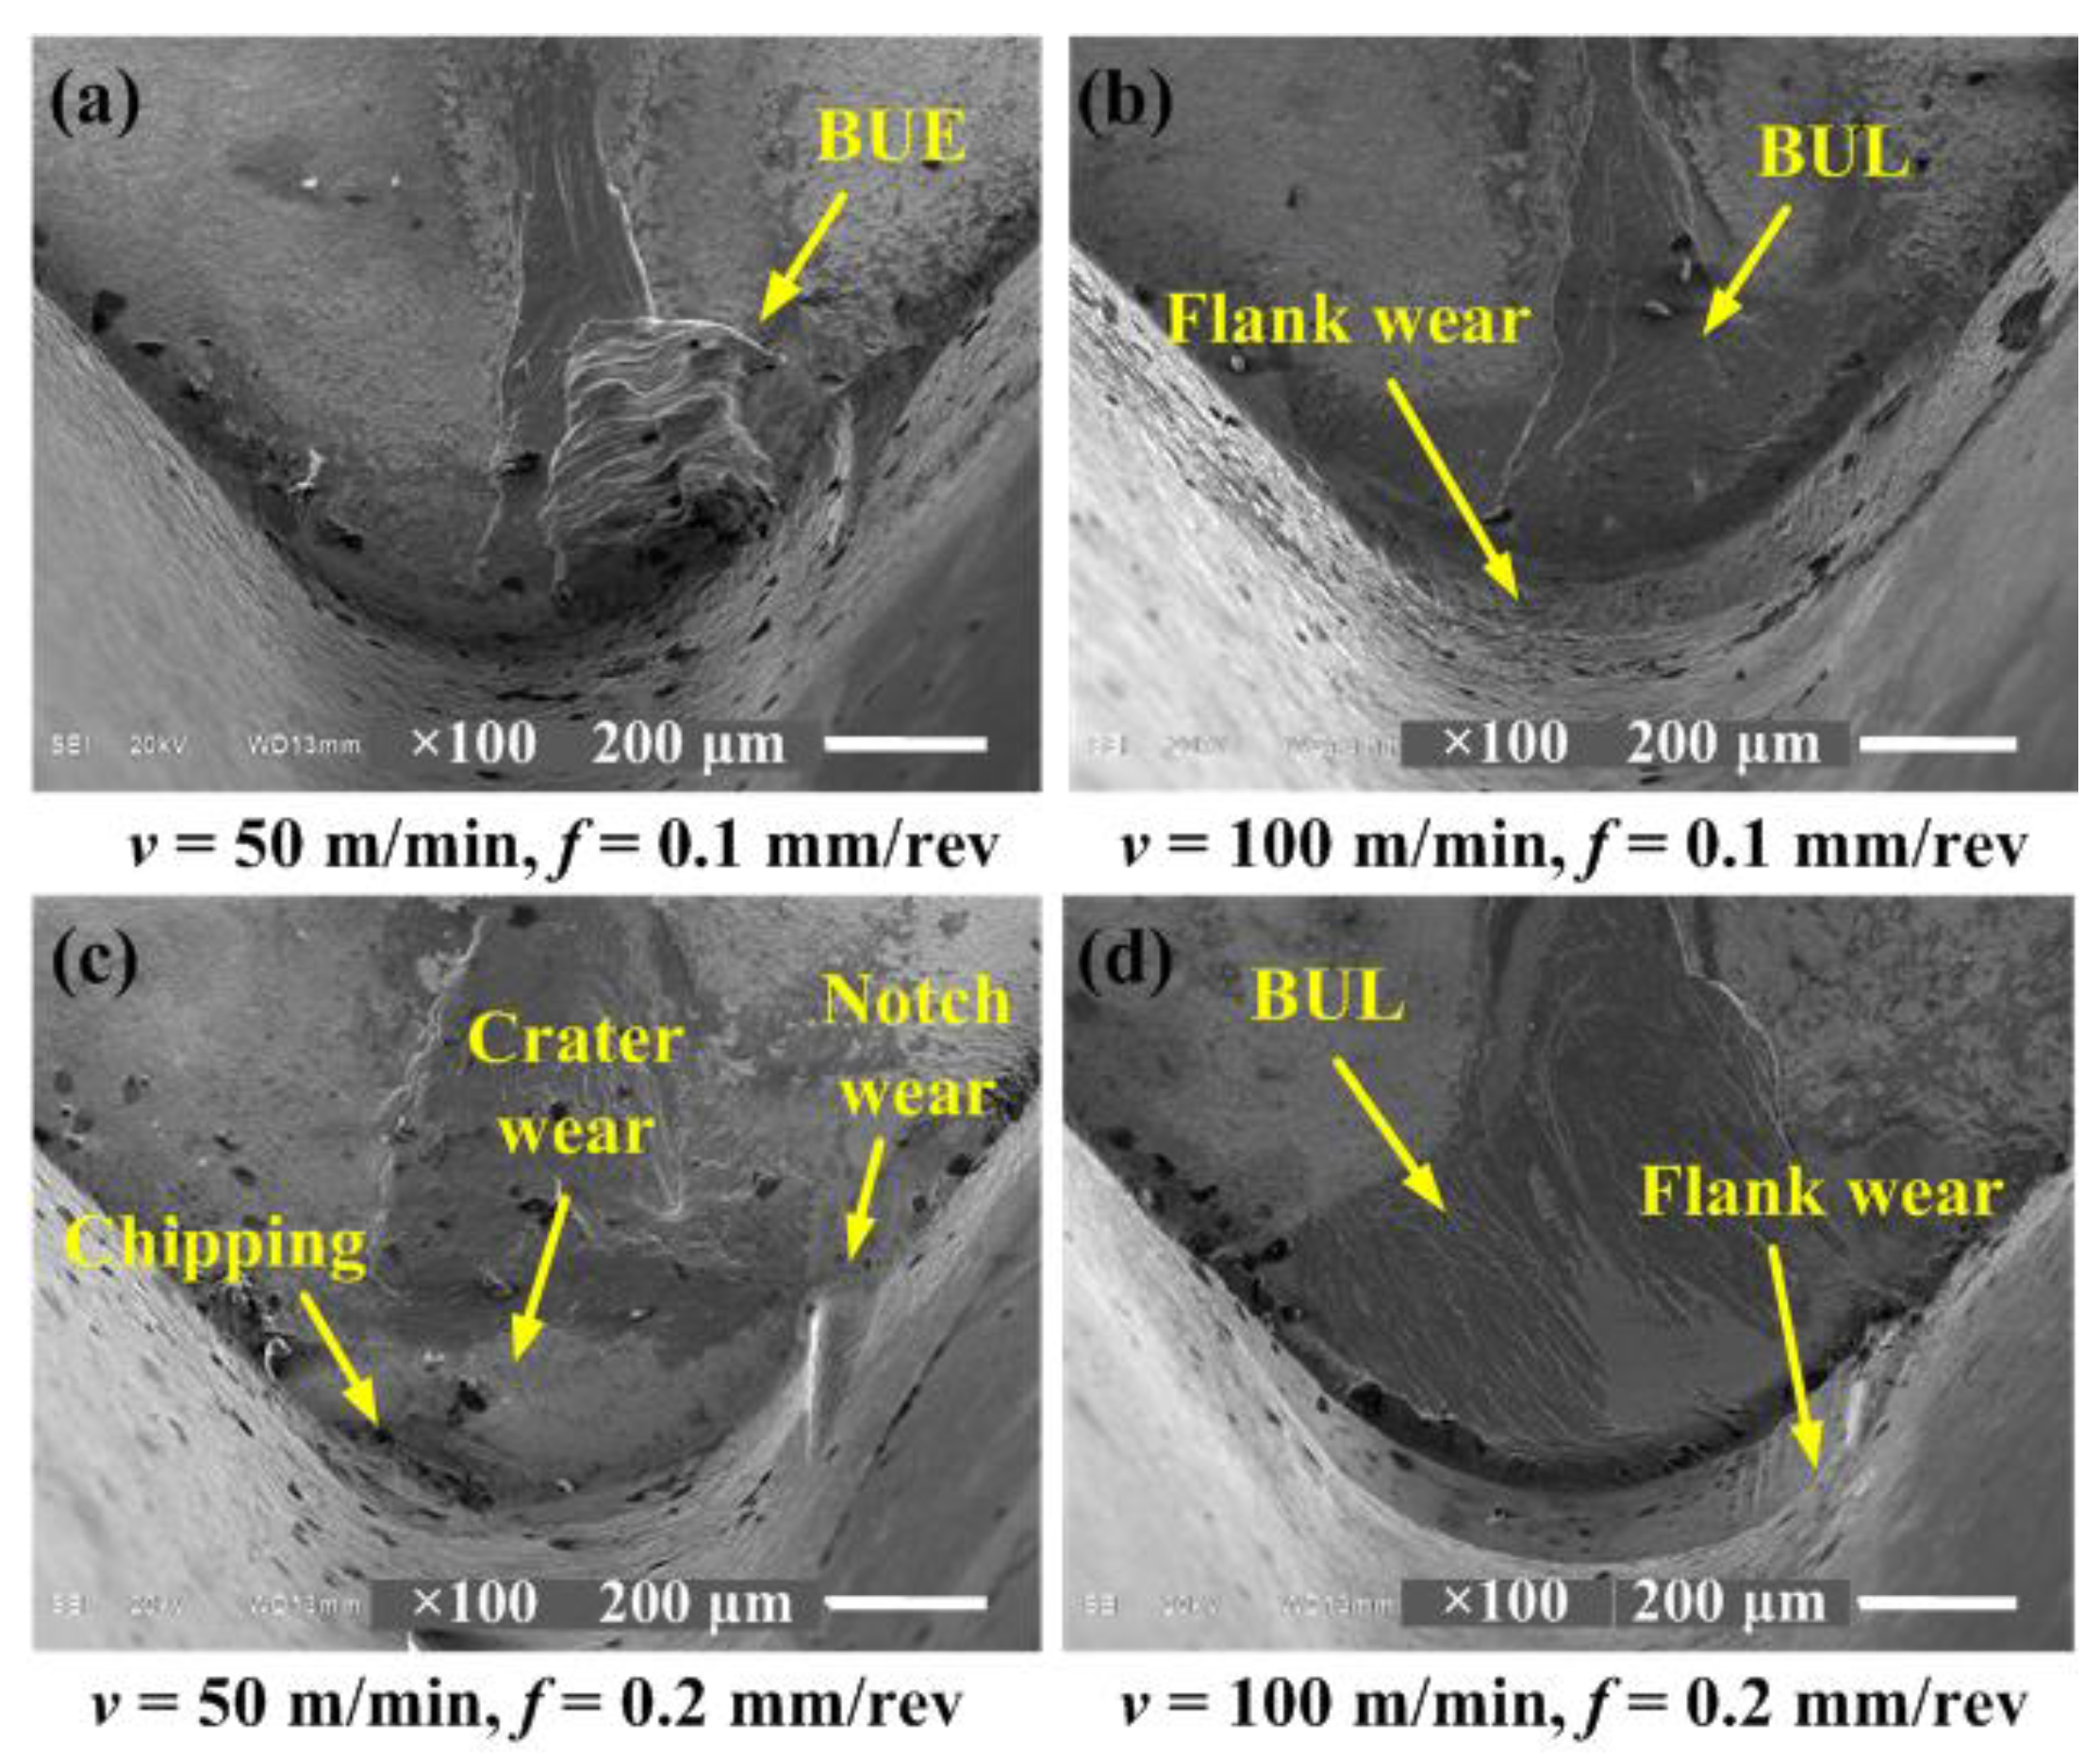
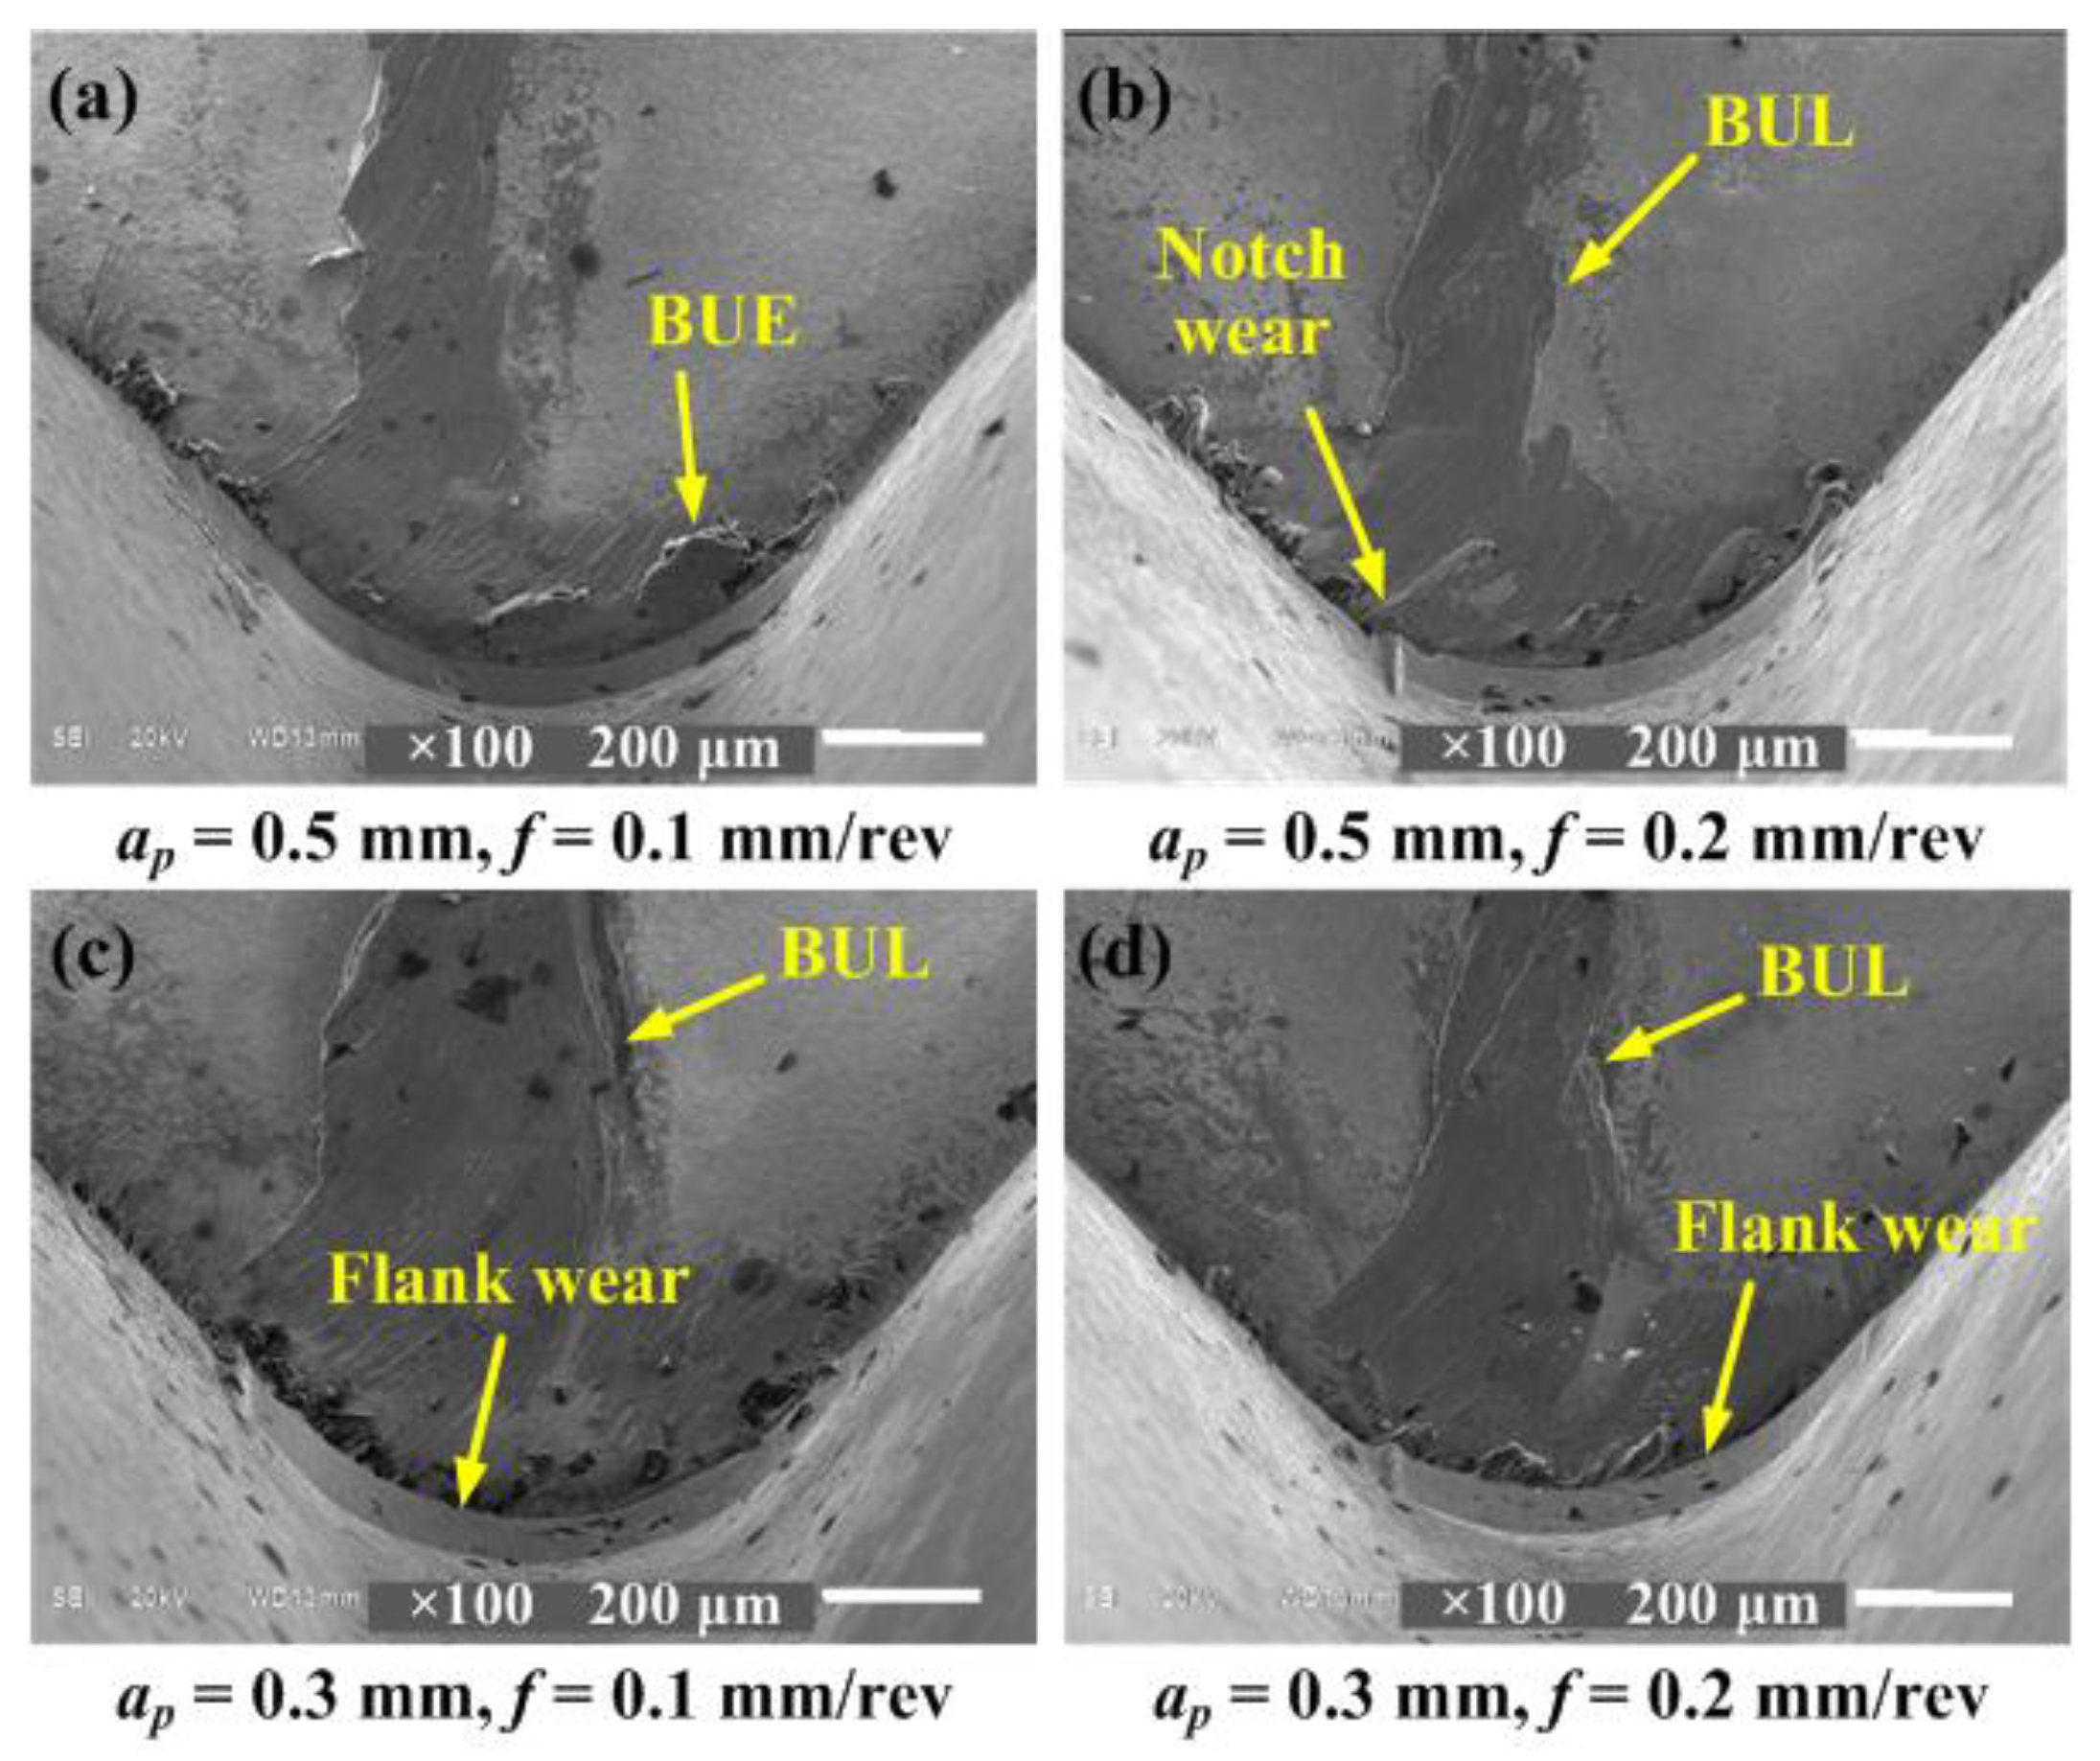
The main types of tool wear included crater wear, flank wear, notch wear, BUE, BUL, chipping, etc. In cylinder turning, BUE formed at a lower speed, and lower feed effectively protected the tool tip and reduced tool wear. The rise of cutting speed or feed aggravated tool wear. In face turning, the impact of depth of cut and feed on tool wear was relatively insignificant.
(2)
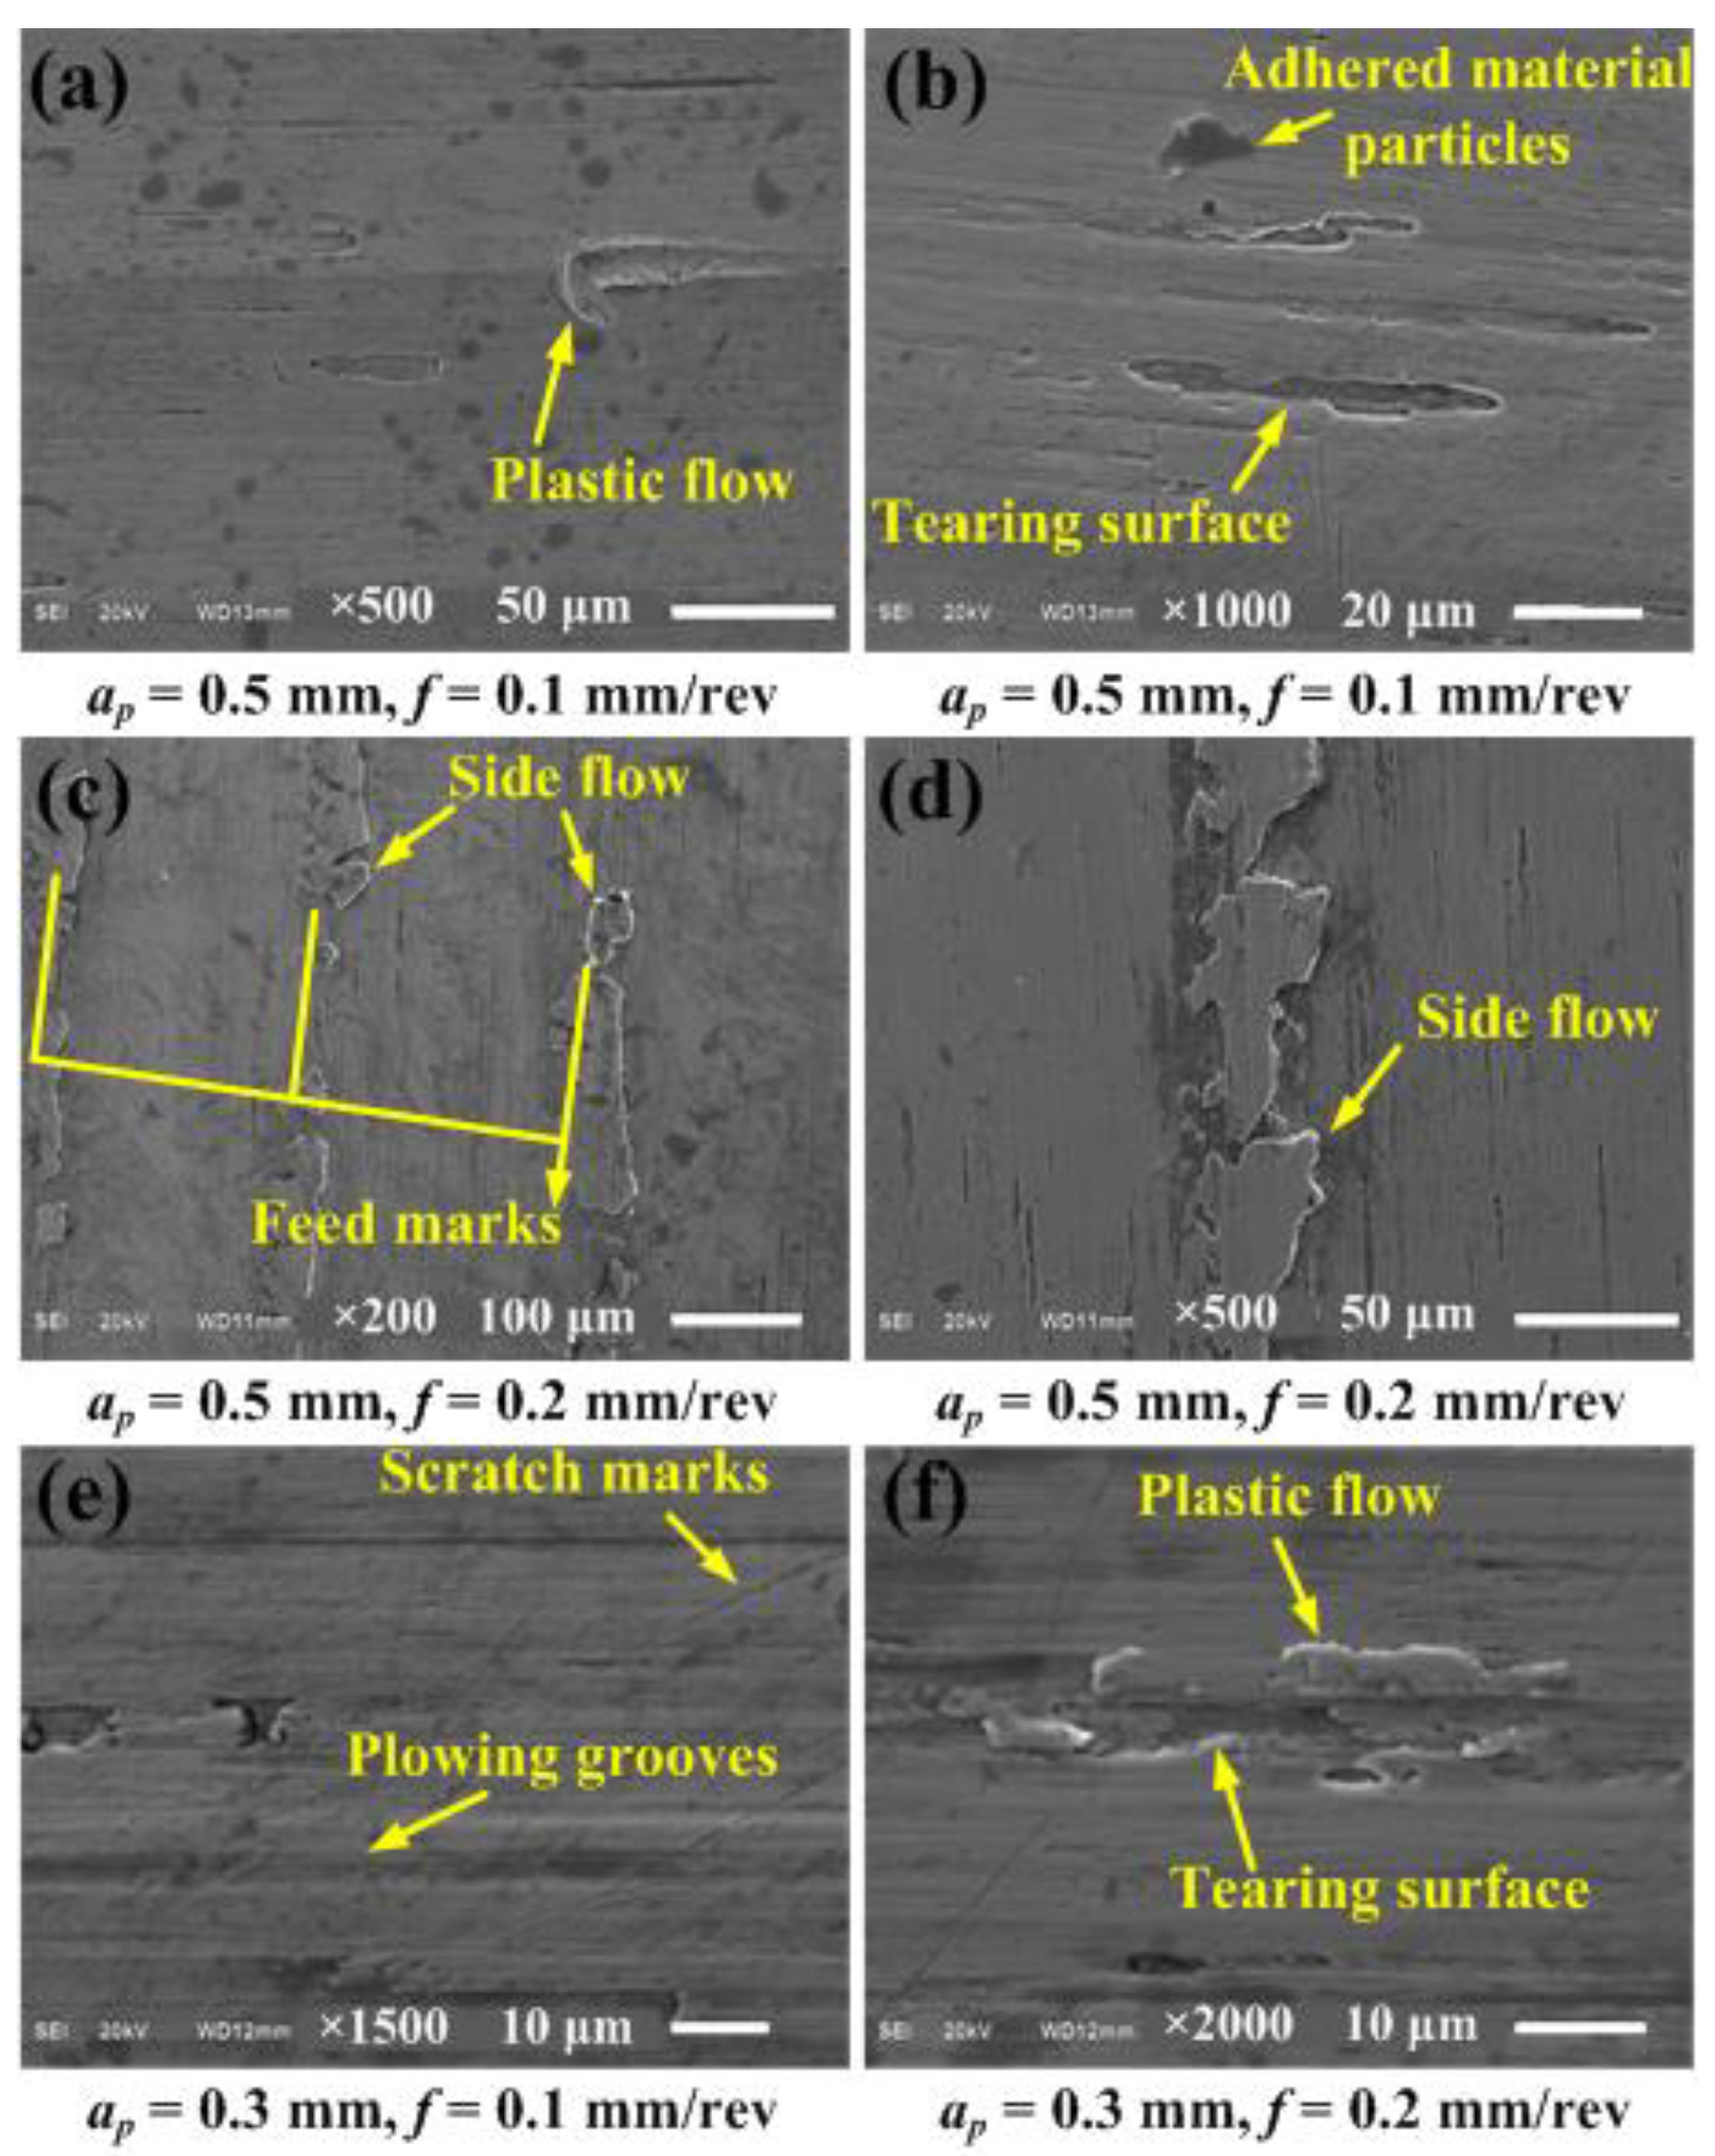
There were a lot of defects on the surface for both cylindrical turning and face turning. The main types of surface defects included tearing surface, adhered material particles, scratch marks, feed marks, side flow, plastic flow, and plowing grooves. Tearing surface was the major defect in cylinder turning, while side flow was more severe in face turning. The generation and distribution of surface defects was random, and there was no obvious change trend under different cutting parameters.
(3)
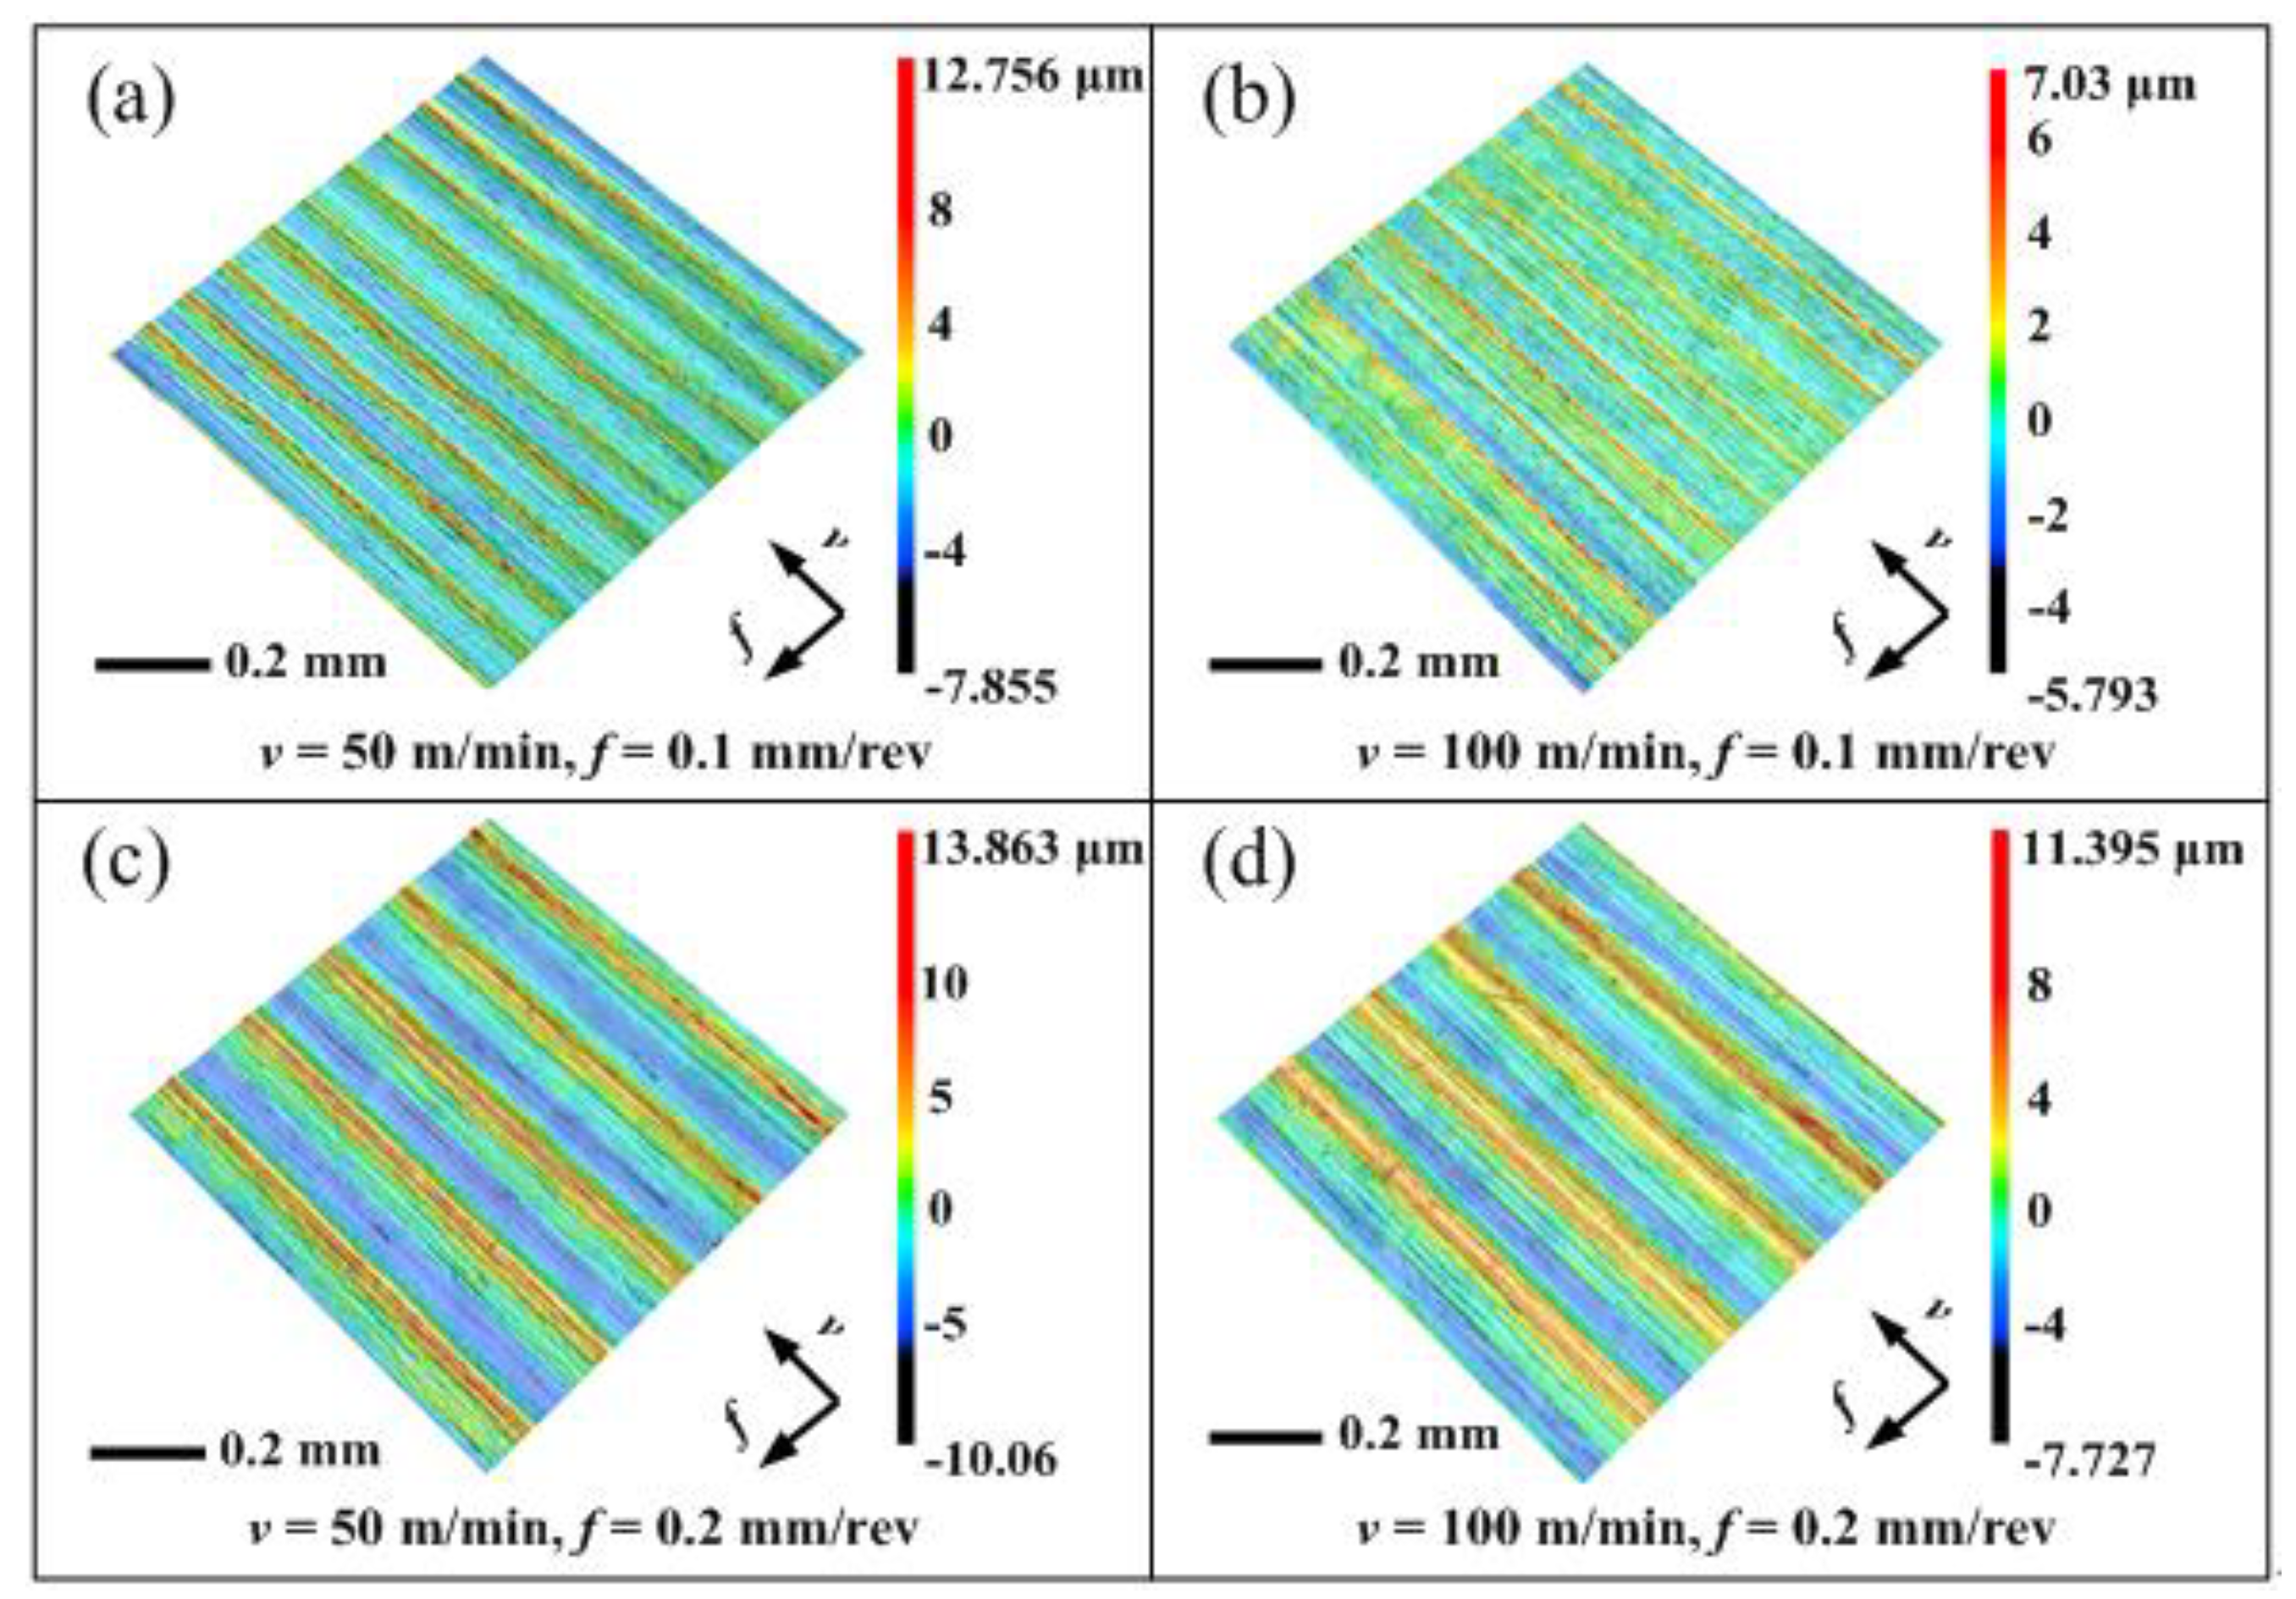
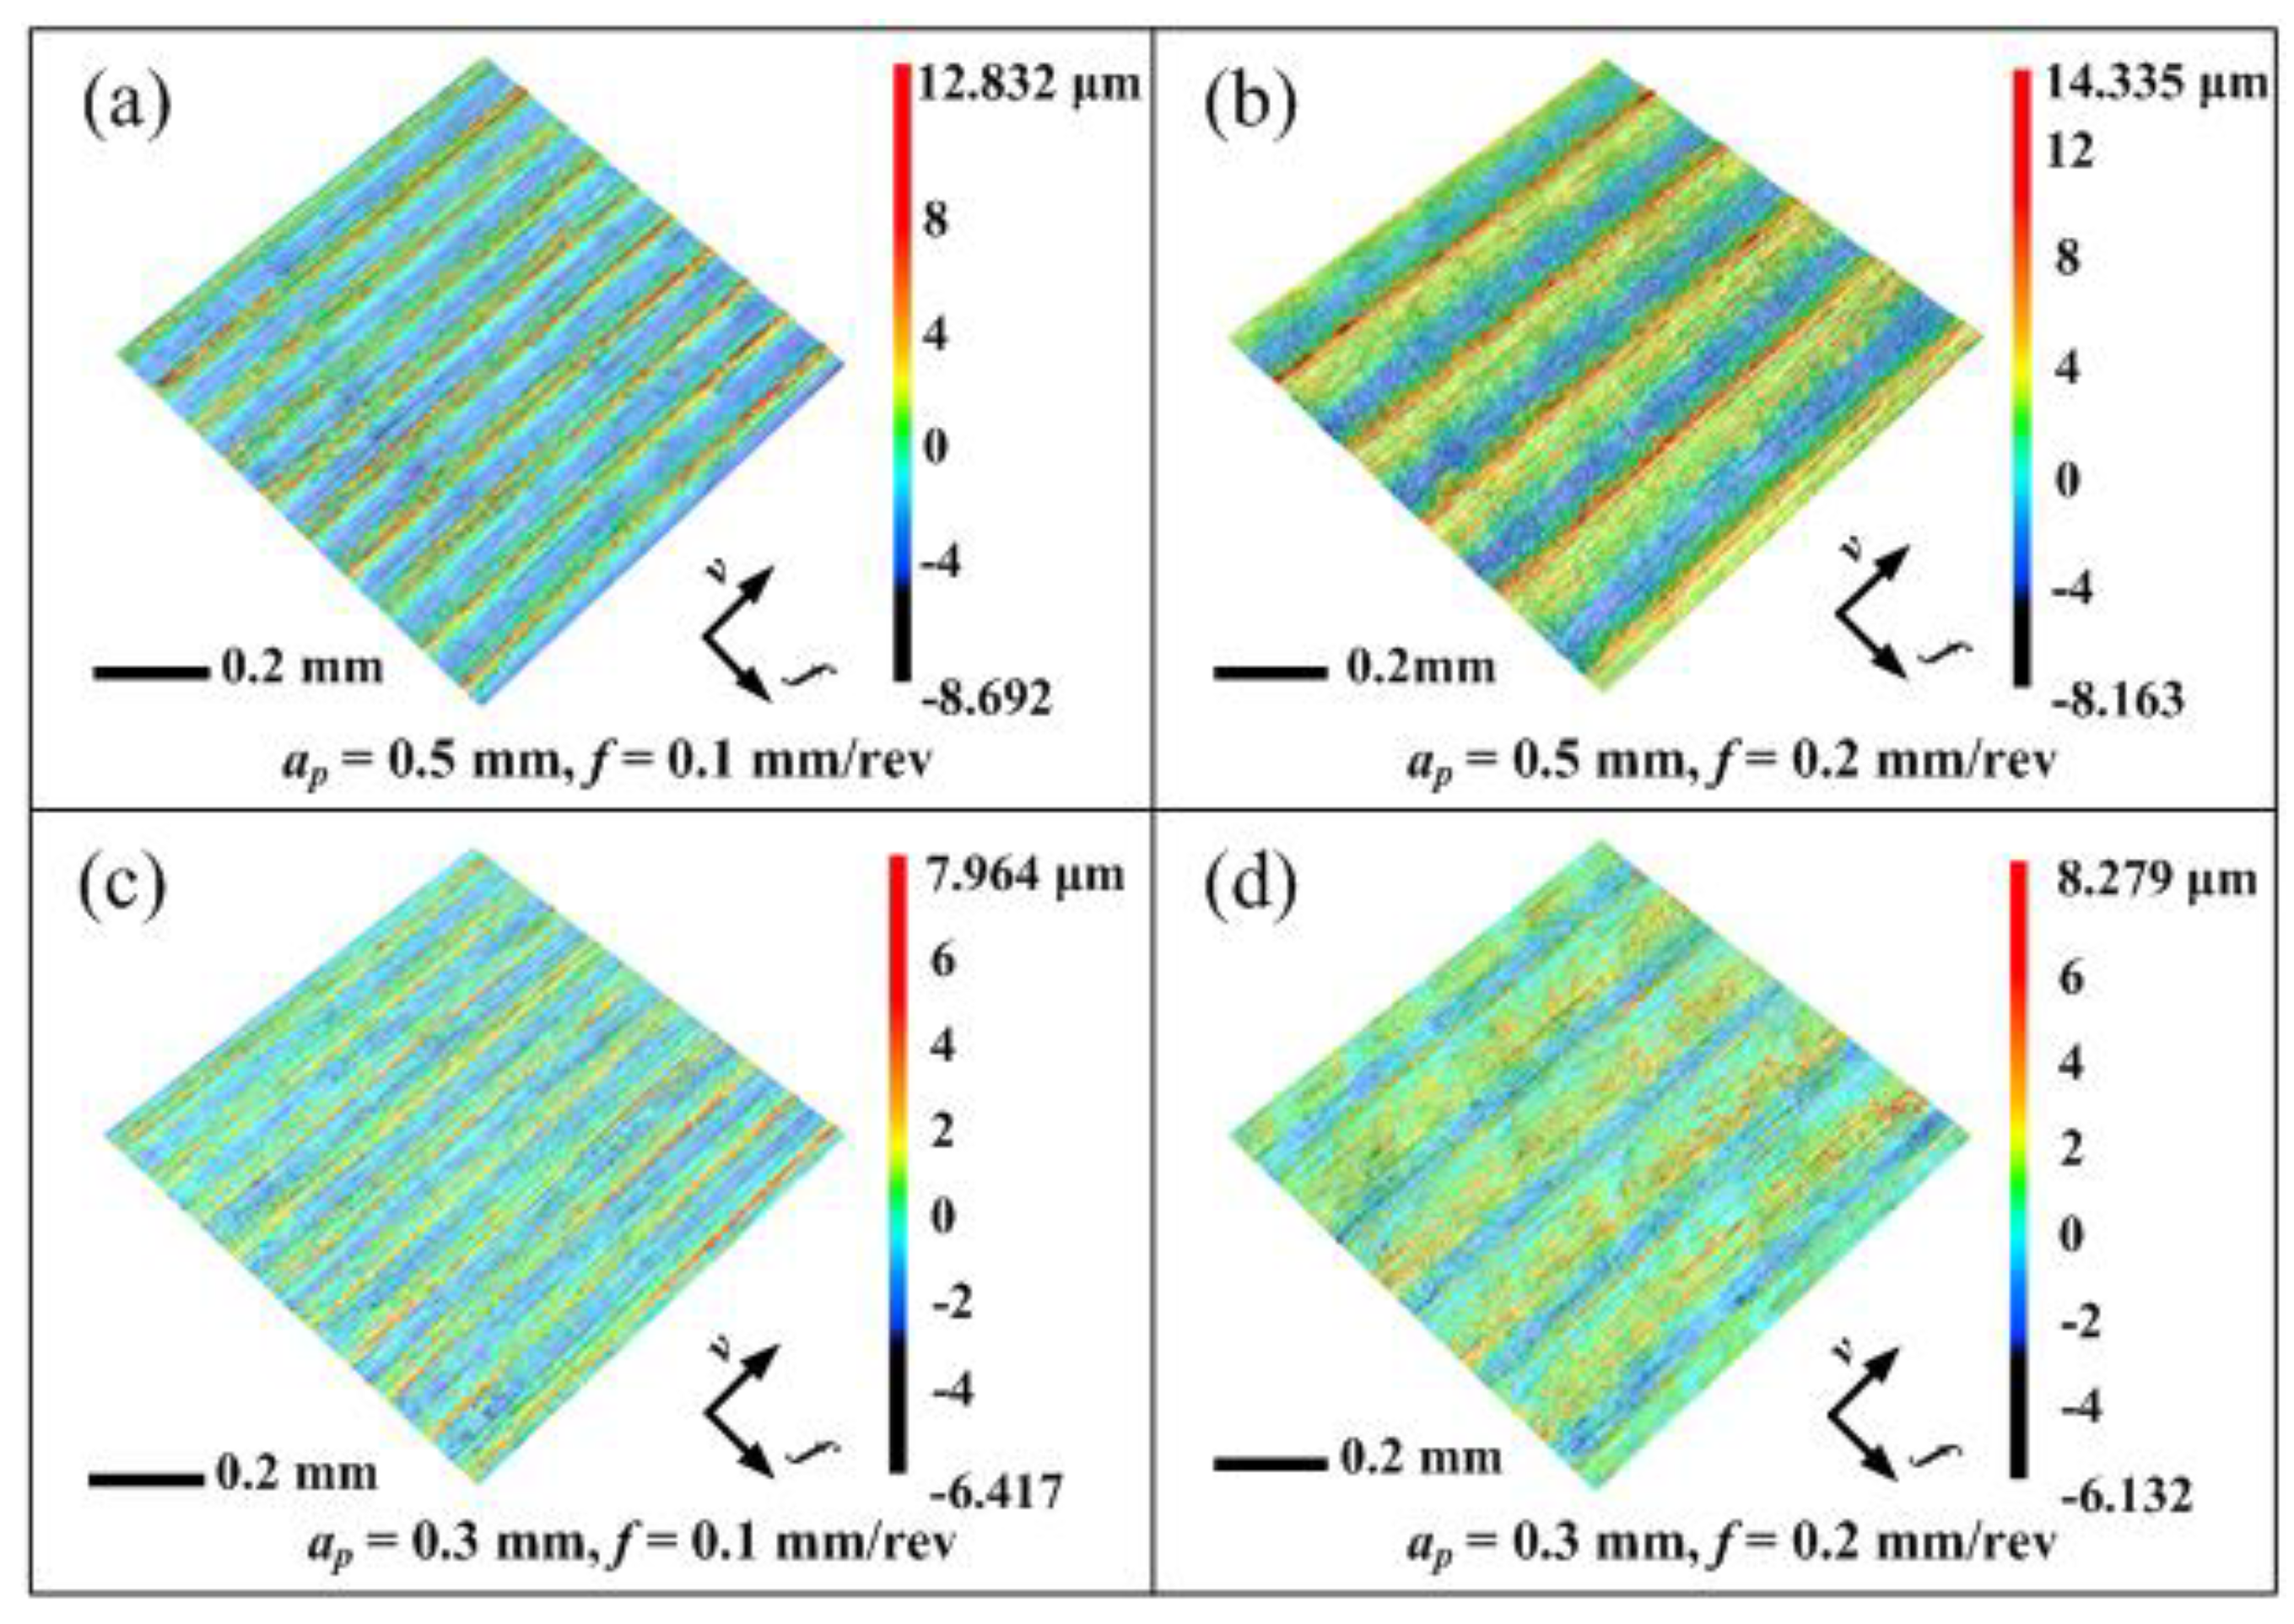
The turning surface presented regular peaks and valleys. Peak height of the cylinder turning surface at a lower cutting speed was higher than that at a higher speed, and higher feed corresponded to higher peak height. In face turning, the peak height of the machined surface at a lower feed was lower than that at a higher feed, and it was higher under a larger depth of cut than under a smaller one.
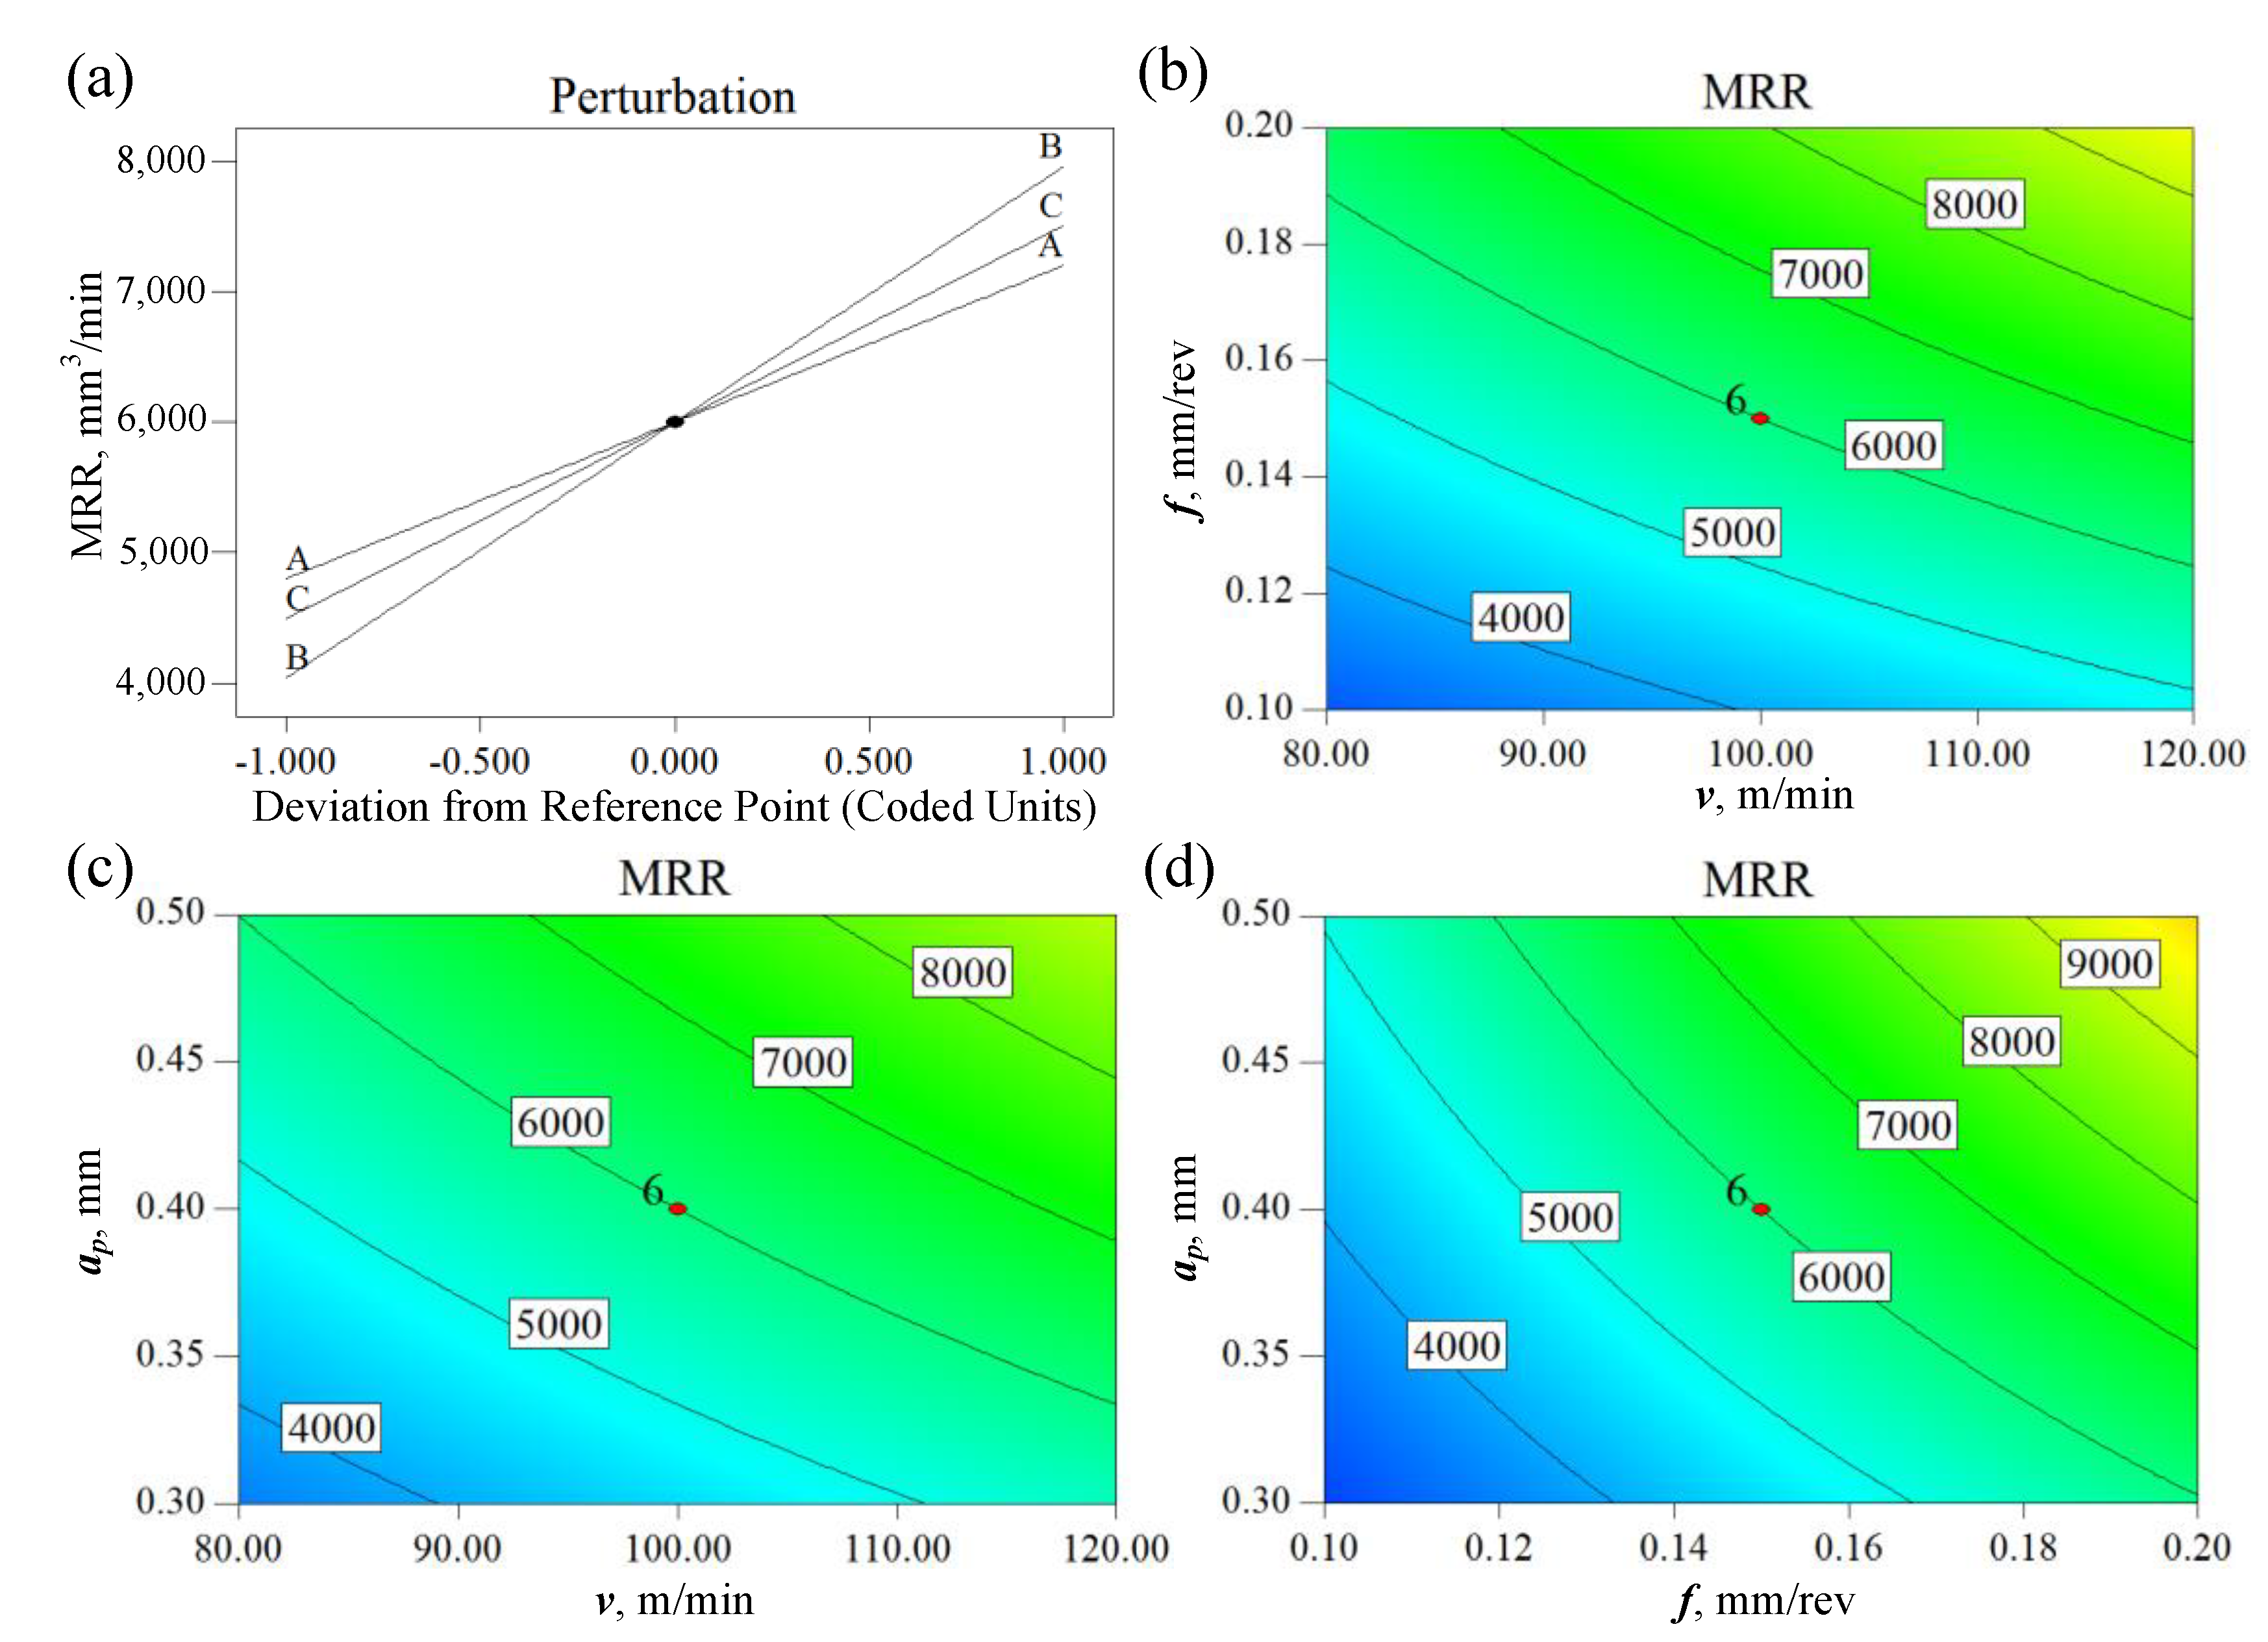
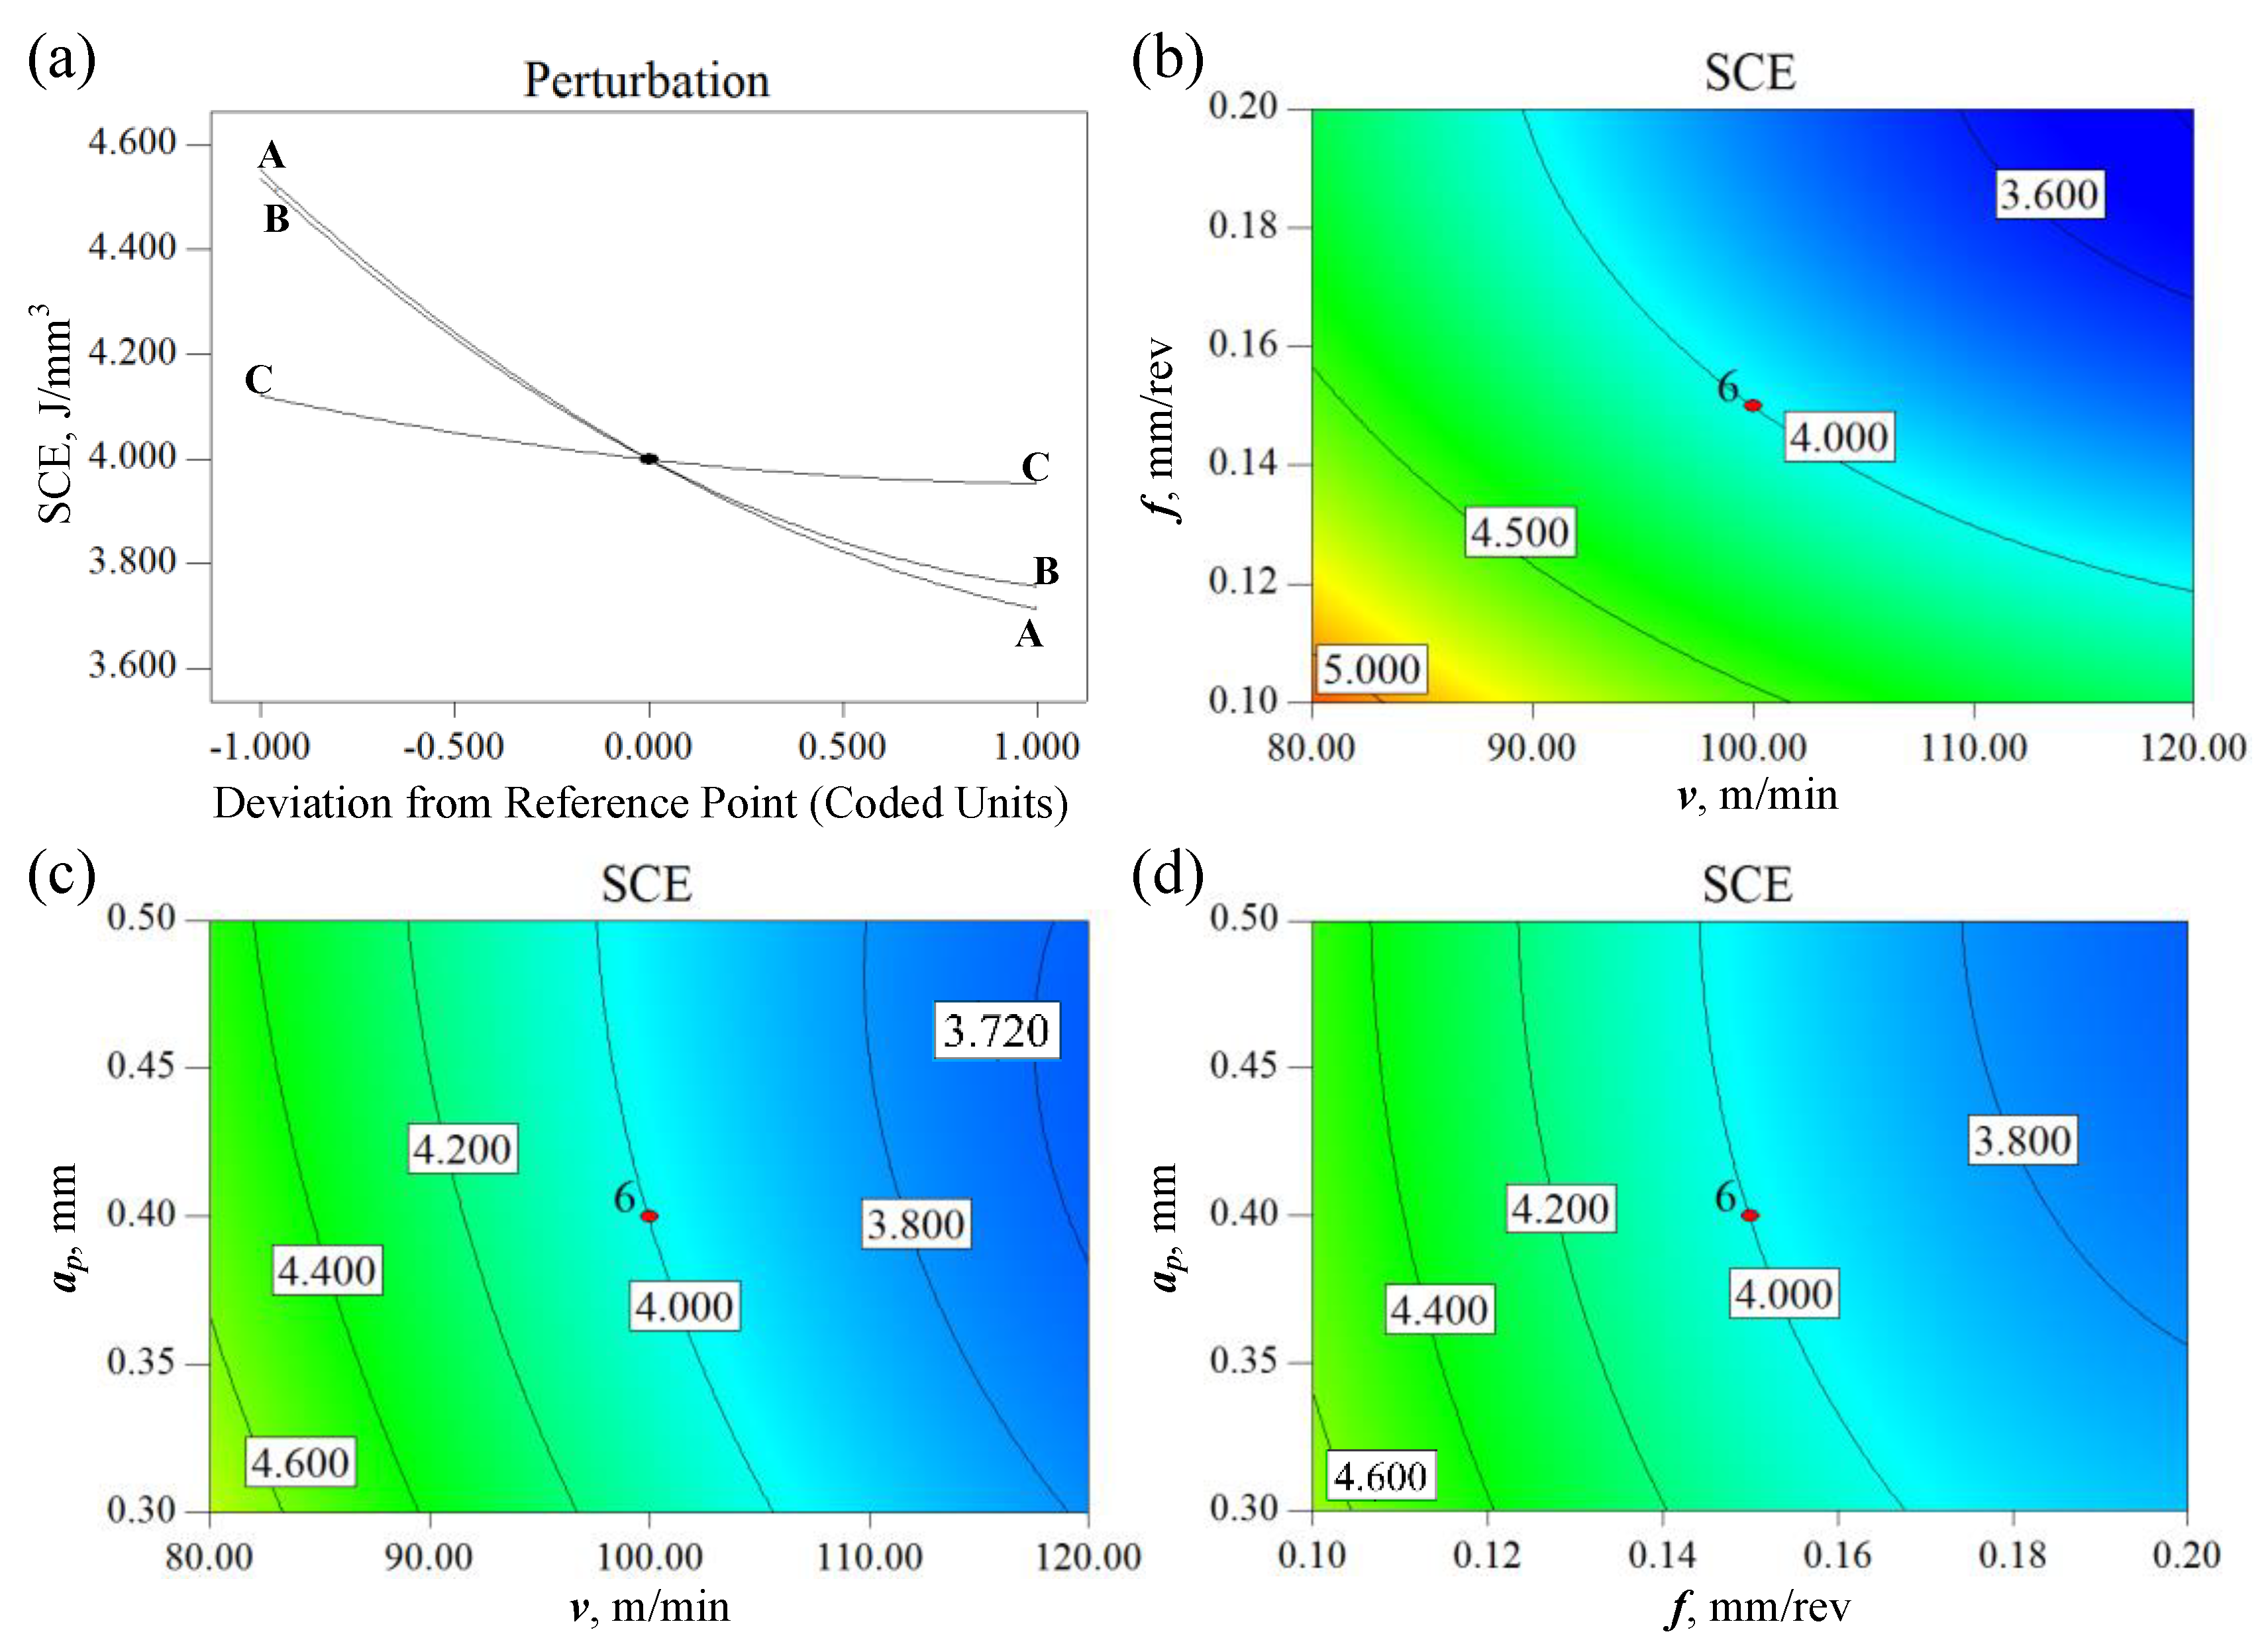
(4)
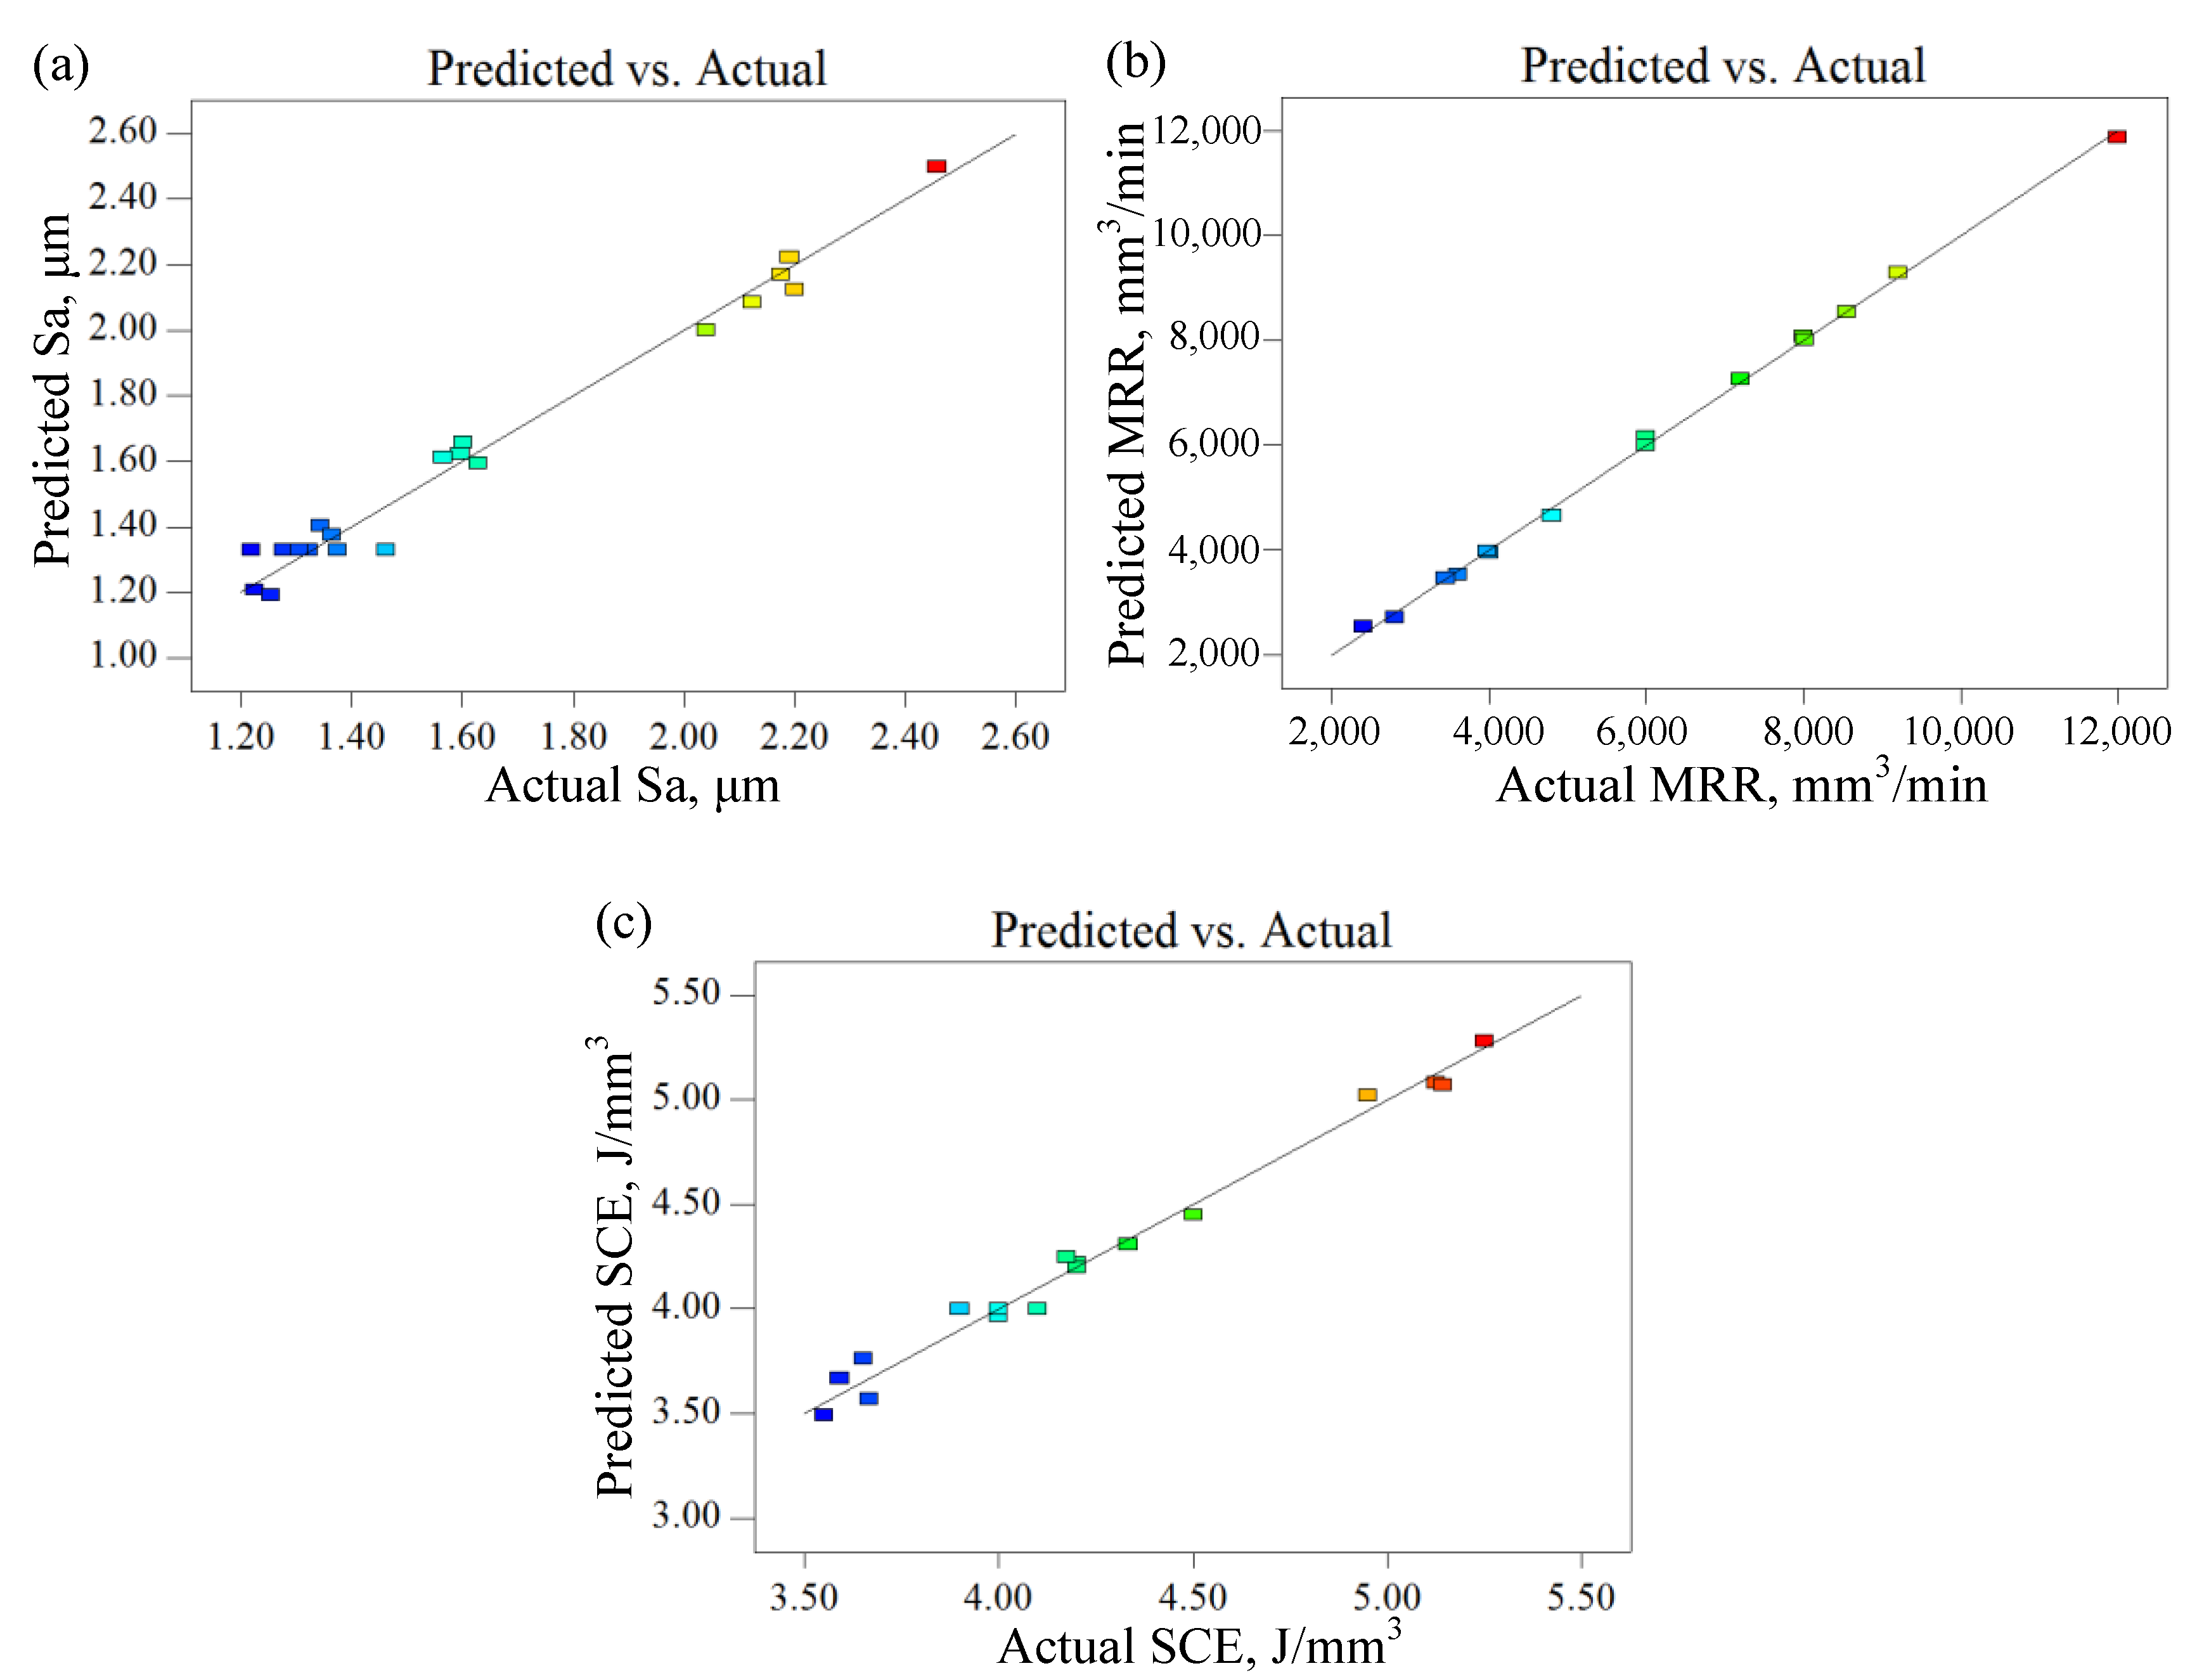
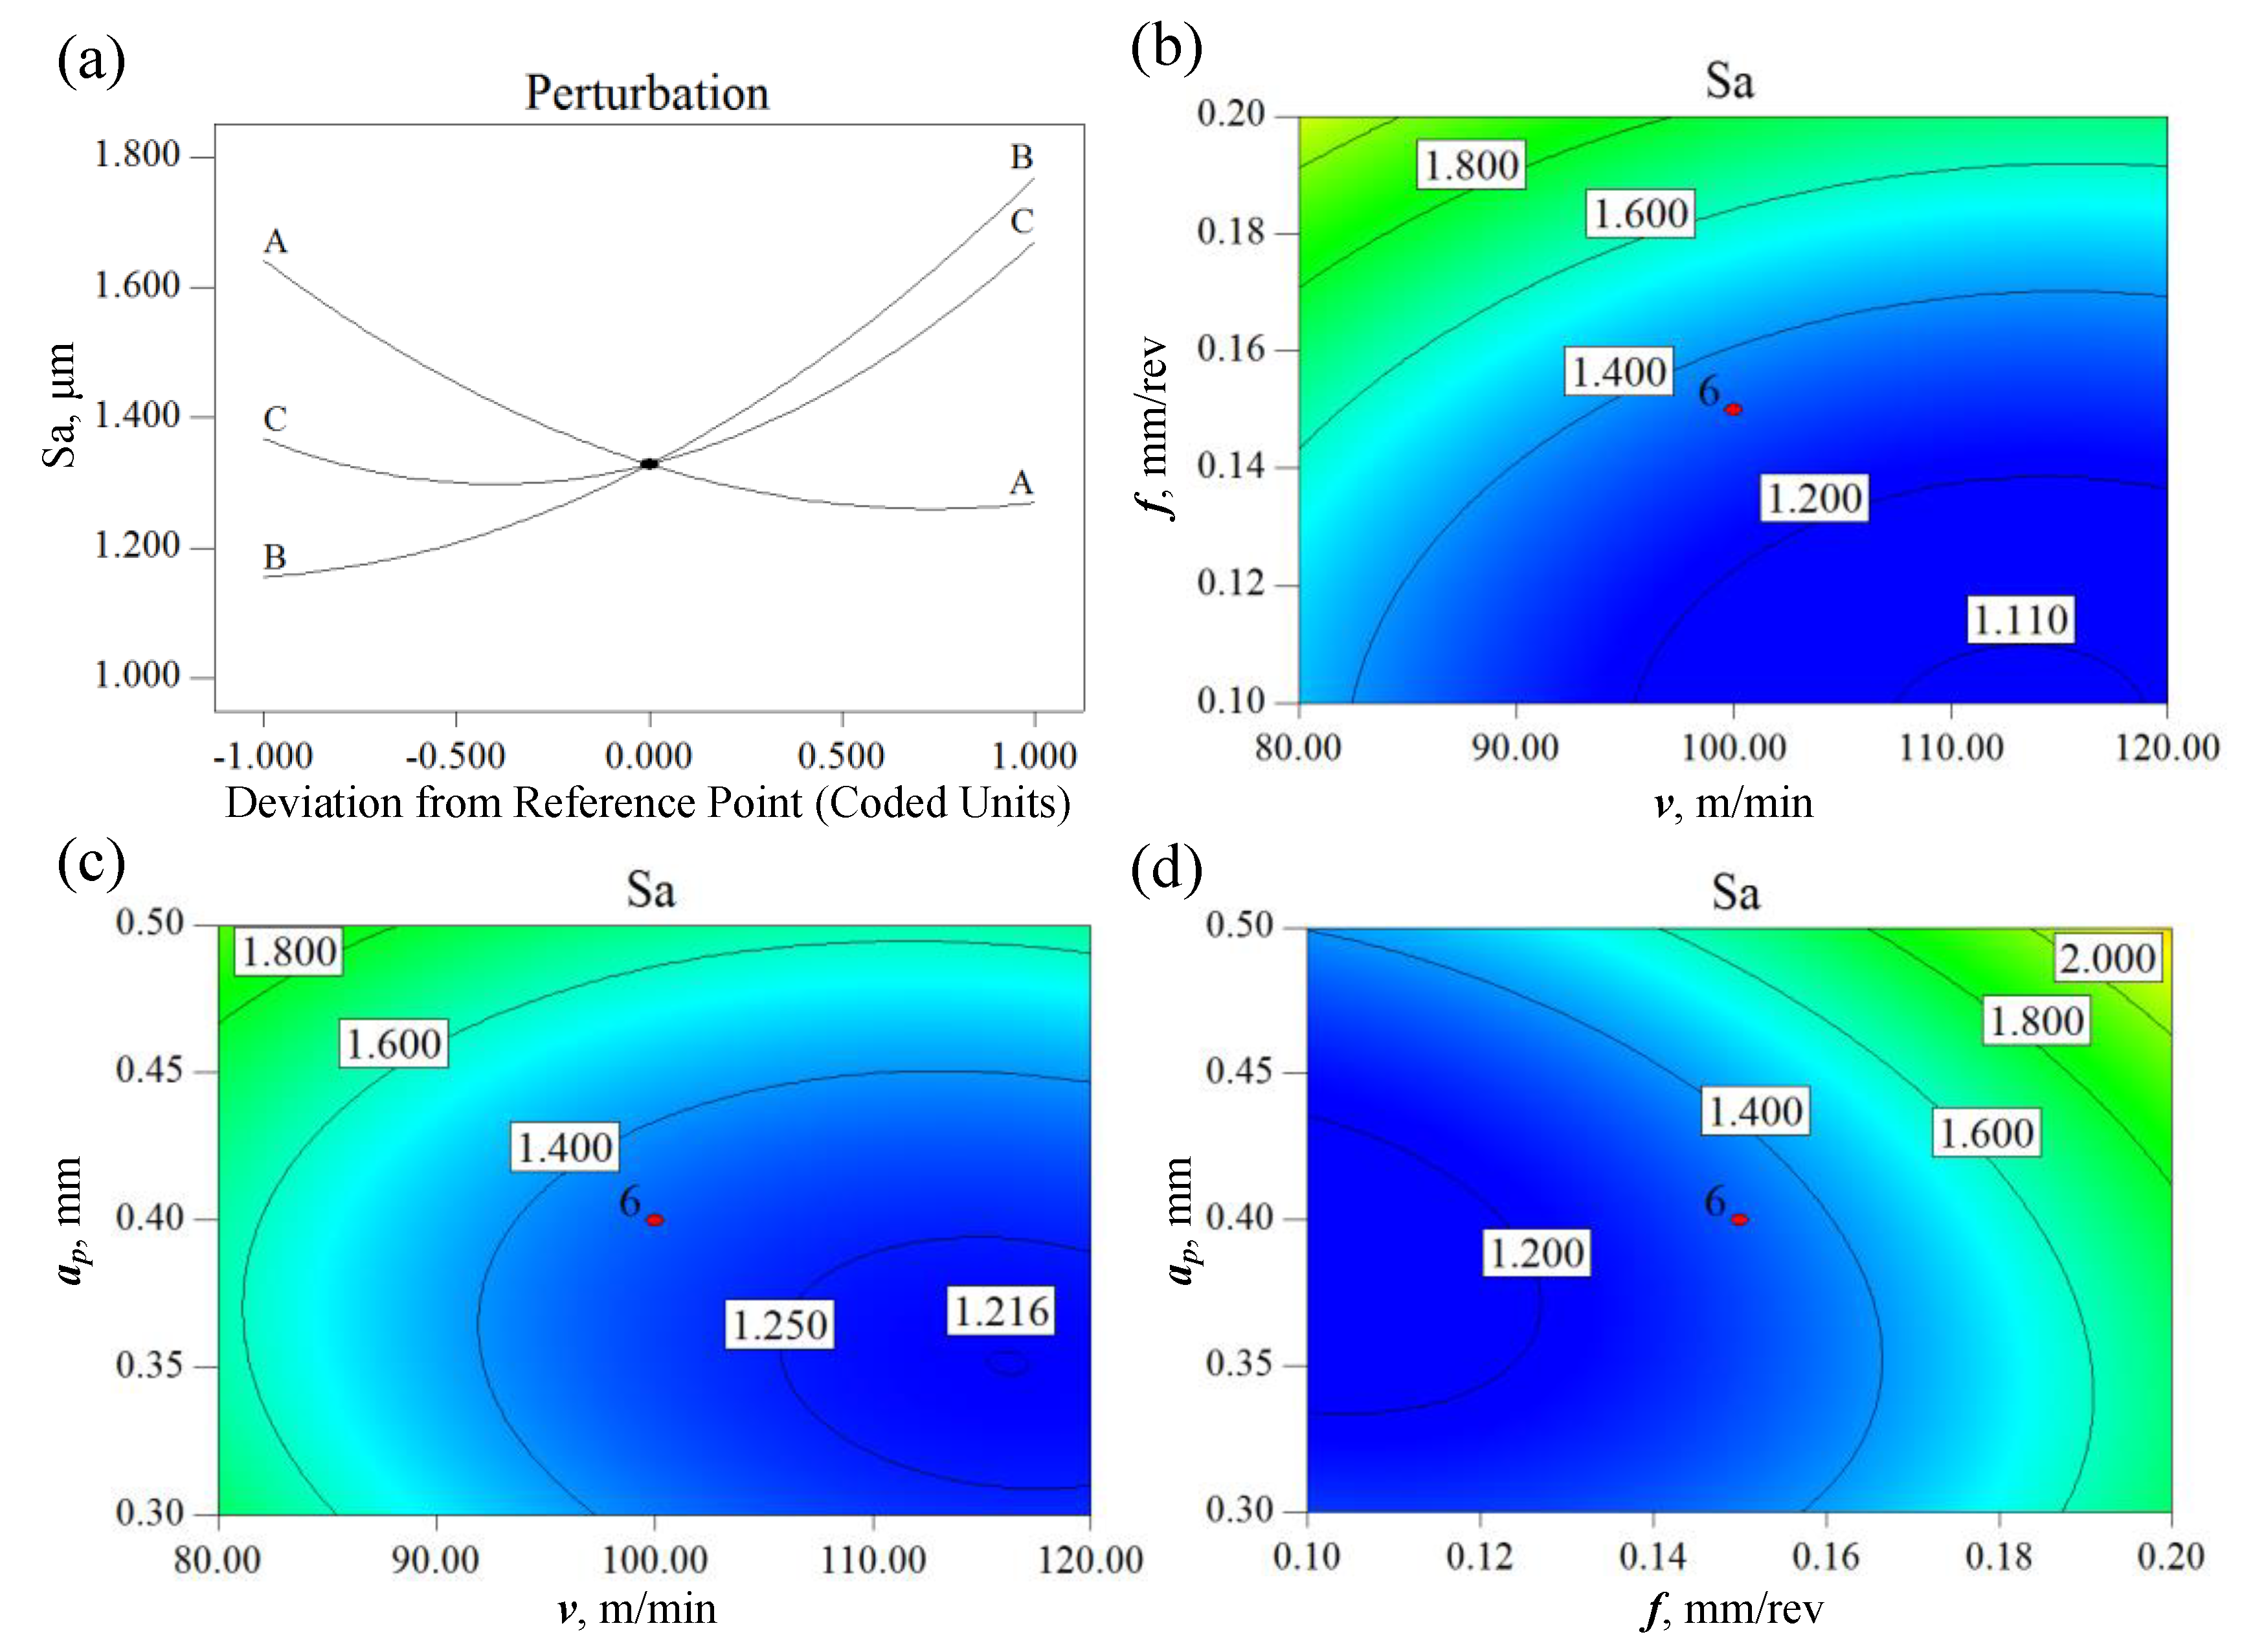
The effect of the cutting parameters on surface roughness, MRR, and SCE was studied. The quadratic model of each response variable was proposed by analyzing the experimental data. The RSM was employed to achieve the optimization of the cutting parameters, with the surface roughness below 1.6 μm, the maximum MRR, and the minimum SCE as the objective. The optimization of the cutting parameters was carried out when the three desired responses were in equal weight, and the most desirable cutting parameters are v = 120 m/min, f = 0.18 mm/rev, and ap = 0.42 mm.

Author Contributions

Conceptualization, X.L. (Xiaojun Li) and Z.L.; Methodology, X.L. (Xiaojun Li) and Z.L.; Software, X.L. (Xiaojun Li); Investigation, X.L. (Xiaojun Li); Resources, X.L. (Xiaojun Li); Data Curation, X.L. (Xiaojun Li); Writing—Original Draft Preparation, X.L. (Xiaojun Li); Writing—Review and Editing, X.L. (Xiaojun Li), Z.L. and X.L. (Xiaoliang Liang); Supervision, Z.L.; Project Administration, Z.L.; Funding Acquisition, Z.L.

Funding

This research was funded by National Natural Science Foundation of China (grant numbers 51425503 and 91860207), and Taishan Scholar Foundation, the National Key Research and Development Program of China (grant number 2018YFB2002201), and Shandong Provincial Natural Science Foundation of China (grant number ZR2019MEE073).

Acknowledgments

The authors are grateful to Guangchao Hao for English proofreading.

Conflicts of Interest

The authors declare no conflict of interest.

References

  1. Kaladhar, M.; Subbaiah, K.V.; Rao, C.S. Determination of optimum process parameters during turning of AISI 304 austenitic stainless steels using Taguchi method and ANOVA. Int. J. Lean Think. 2012, 3, 1–19. [Google Scholar]
  2. Xavior, M.A.; Adithan, M. Determining the influence of cutting fluids on tool wear and surface roughness during turning of AISI 304 austenitic stainless steel. J. Mater. Process. Technol. 2009, 209, 900–909. [Google Scholar] [CrossRef]
  3. Çaydaş, U.; Ekici, S. Support vector machines models for surface roughness prediction in CNC turning of AISI 304 austenitic stainless steel. J. Intell. Manuf. 2012, 23, 639–650. [Google Scholar]
  4. Selvaraj, D.P.; Chandramohan, P. Optimization of surface roughness of AISI 304 austenitic stainless steel in dry turning operation using Taguchi design method. J. Eng. Sci. Technol. 2010, 5, 293–301. [Google Scholar]
  5. Zaharudin, A.M.; Budin, S. Influence of cutting speed on coated TiCN cutting tool during turning of AISI 316L stainless steel in dry turning process. IOP Conf. Ser. Mater. Sci. Eng. IOP Publ. 2019, 505, 012044. [Google Scholar] [CrossRef]
  6. Kaladhar, M.; Subbaiah, K.V.; Rao, C.S. Machining of austenitic stainless steels-a review. Int. J. Mach. Machin. Mater. 2012, 12, 178–192. [Google Scholar] [CrossRef]
  7. Ahmed, Y.S.; Paiva, J.M.; Bose, B.; Veldhuis, S.C. New observations on built-up edge structures for improving machining performance during the cutting of superduplex stainless steel. Tribol. Int. 2019, 137, 212–227. [Google Scholar] [CrossRef]
  8. Özbek, N.A.; Çiçek, A.; Gülesin, M.; Özbek, O. Effect of cutting conditions on wear performance of cryogenically treated tungsten carbide inserts in dry turning of stainless steel. Tribol. Int. 2016, 94, 223–233. [Google Scholar] [CrossRef]
  9. Patil, N.; Gopalakrishna, K.; Sangmesh, B.; Sudhakar, K.; Vijaykumar, G.C. Performance studies on cryogenic treated carbide cutting tool for turning of AISI304 steel. J. Mech. Eng. Sci. 2018, 12, 3927–3941. [Google Scholar] [CrossRef]
  10. Mahdavinejad, R.A.; Saeedy, S. Investigation of the influential parameters of machining of AISI 304 stainless steel. Sadhana 2011, 36, 963–970. [Google Scholar] [CrossRef]
  11. Pereira, O.; Rodríguez, A.; Fernández-Abia, A.I.; Barreiro, J.; de Lacalle, L.L. Cryogenic and minimum quantity lubrication for an eco-efficiency turning of AISI 304. J. Clean. Prod. 2016, 139, 440–449. [Google Scholar] [CrossRef]
  12. Sahu, S.; Choudhury, B.B. Optimization of surface roughness using Taguchi methodology & prediction of tool wear in hard turning tools. Mater. Today Proc. 2015, 2, 2615–2623. [Google Scholar]
  13. Karunya, G.; Ravikumar, P.; Krishna, P.G.; Krishna, P.S. Optimization of the surface roughness by applying the Taguchi technique for the turning of AISI 304 austenitic stainless steel. Int. J. Mech. Eng. Technol. 2017, 8, 694–701. [Google Scholar]
  14. Tekıner, Z.; Yeşılyurt, S. Investigation of the cutting parameters depending on process sound during turning of AISI 304 austenitic stainless steel. Mater. Des. 2004, 25, 507–513. [Google Scholar] [CrossRef]
  15. Junaidha, A.P.; Yuvaraj, G.; Peter, J.; Bhuvaneshwari, V.; Kanagasabapathi; Karthik, K. Influence of process parameters on the machining characteristics of austensite stainless steel (AISI 304). Mater. Today Proc. 2018, 5, 13321–13333. [Google Scholar] [CrossRef]
  16. Dubey, A.K.; Yadava, V. Multi-objective optimisation of laser beam cutting process. Opt. Laser Technol. 2008, 40, 562–570. [Google Scholar] [CrossRef]
  17. Nayak, S.K.; Patro, J.K.; Dewangan, S.; Gangopadhyay, S. Multi-objective optimization of machining parameters during dry turning of AISI 304 austenitic stainless steel using grey relational analysis. Proc. Mater. Sci. 2014, 6, 701–708. [Google Scholar] [CrossRef]
  18. Bouzid, L.; Berkani, S.; Yallese, M.A.; Girardin, F.; Mabrouki, T. Estimation and optimization of flank wear and tool lifespan in finish turning of AISI 304 stainless steel using desirability function approach. Int. J. Ind. Eng. Comput. 2018, 9, 349–368. [Google Scholar] [CrossRef]
  19. Myers, R.H.; Montgomery, D.C.; Anderson-Cook, C.M. Response surface methodology: Process. and product optimization using designed experiments, 4th ed.; John Wiley & Sons: Hoboken, NJ, USA, 2016. [Google Scholar]
  20. Jahanbakhsh, M.; Akhavan Farid, A.; Lotfi, M. Optimal flank wear in turning of Inconel 625 super-alloy using ceramic tool. Proc. Inst. Mech. Eng. Part. B J. Eng. Manuf. 2018, 232, 208–216. [Google Scholar] [CrossRef]
  21. Sun, Y.; Hao, M. Statistical analysis and optimization of process parameters in Ti6Al4V laser cladding using Nd: YAG laser. Opt. Lasers Eng. 2012, 50, 985–995. [Google Scholar] [CrossRef]
  22. Camposeco-Negrete, C.; de Dios Calderón-Nájera, J. Sustainable machining as a mean of reducing the environmental impacts related to the energy consumption of the machine tool: A case study of AISI 1045 steel machining. Int. J. Adv. Manuf. Technol. 2019, 102, 27–41. [Google Scholar] [CrossRef]
  23. Camposeco-Negrete, C. Optimization of cutting parameters using response surface method for minimizing energy consumption and maximizing cutting quality in turning of AISI 6061 T6 aluminum. J. Clean. Prod. 2015, 91, 109–117. [Google Scholar] [CrossRef]
  24. Shafi’I, S.N.; Ahmad, N.; Abidin, M.Z.; Hani, N.M.; Ismail, N. Optimization of hydrocolloids and maltodextrin addition on roselle-based fruit leather using two-level full factorial design. Int. J. Biosci. Biochem. Bioinform. 2013, 3, 387–391. [Google Scholar]
  25. Ahmed, Y.S.; Fox-Rabinovich, G.; Paiva, J.M.; Wagg, T.; Veldhuis, S.C. Effect of built-up edge formation during stable state of wear in AISI 304 stainless steel on machining performance and surface integrity of the machined part. Materials 2017, 10, 1230. [Google Scholar] [CrossRef] [PubMed]
Figure 1. Processing and measuring equipment.
Metals 09 00972 g001
Figure 2. Tool wear patterns in cylinder turning, (a) v = 50 m/min, f = 0.1 mm/rev; (b) v = 100 m/min, f = 0.1 mm/rev; (c) v = 50 m/min, f = 0.2 mm/rev; (d) v = 100 m/min, f = 0.2 mm/rev.
Metals 09 00972 g002
Figure 3. Tool wear patterns in face turning, (a) ap = 0.5 mm, f = 0.1 mm/rev; (b) ap = 0.5 mm, f = 0.2 mm/rev; (c) ap = 0.3 mm, f = 0.1 mm/rev; (d) ap = 0.3 mm, f = 0.2 mm/rev.
Metals 09 00972 g003
Figure 4. Surface defects of turned cylinder surfaces, (a) v = 100 m/min, f = 0.1 mm/rev; (b) v = 100 m/min, f = 0.1 mm/rev; (c) v = 100 m/min, f = 0.2 mm/rev; (d) v = 100 m/min, f = 0.2 mm/rev; (e) v = 100 m/min, f = 0.2 mm/rev; (f) v = 100 m/min, f = 0.2 mm/rev.
Metals 09 00972 g004
Figure 5. Surface defects of turned face surfaces, (a) ap = 0.5 mm, f = 0.1 mm/rev; (b) ap = 0.5 mm, f = 0.1 mm/rev; (c) ap = 0.5 mm, f = 0.2 mm/rev; (d) ap = 0.5 mm, f = 0.2 mm/rev; (e) ap = 0.3 mm, f = 0.1 mm/rev; (f) ap = 0.3 mm, f = 0.2 mm/rev.
Metals 09 00972 g005
Figure 6. 3D surface topography in cylinder turning, (a) v = 50 m/min, f = 0.1 mm/rev; (b) v = 100 m/min, f = 0.1 mm/rev; (c) v = 50 m/min, f = 0.2 mm/rev; (d) v = 100 m/min, f = 0.2 mm/rev.
Metals 09 00972 g006
Figure 7. 3D surface topography in face turning, (a) ap = 0.5 mm, f = 0.1 mm/rev; (b) ap = 0.5 mm, f = 0.2 mm/rev; (c) ap = 0.3 mm, f = 0.1 mm/rev; (d) ap = 0.3 mm, f = 0.2 mm/rev.
Metals 09 00972 g007
Figure 8. Plots of predicted vs. actual of (a) surface roughness; (b) material removal rate (MRR); (c) specific cutting energy (SCE).
Metals 09 00972 g008
Figure 9. Effect of cutting parameters on surface roughness. (a) Perturbation plot of the effect of cutting parameters on surface roughness, (b) contour plot of the effect of cutting speed and feed on surface roughness, (c) contour plot of the effect of cutting speed and depth of cut on surface roughness, (d) contour plot of the effect of feed and depth of cut on surface roughness.
Metals 09 00972 g009
Figure 10. Effect of cutting parameters on MRR. (a) Perturbation plot of the effect of cutting parameters on MRR, (b) contour plot of the effect of cutting speed and feed on MRR, (c) contour plot of the effect of cutting speed and depth of cut on MRR, (d) contour plot of the effect of feed and depth of cut on MRR.
Metals 09 00972 g010
Figure 11. Effect of cutting parameters on SCE. (a) Perturbation plot of the effect of cutting parameters on SCE, (b) contour plot of the effect of cutting speed and feed on SCE, (c) contour plot of the effect of cutting speed and depth of cut on SCE, (d) contour plot of the effect of feed and depth of cut on SCE.
Metals 09 00972 g011
Table 1. Chemical composition of AISI 304. Reproduced from [2], with permission from Elsevier, 2009.
CompositionCSiMnCrNiMoCuFe
(wt) %0.0550.641.6618.29.110.0920.1469.7
Table 2. Physical properties of AISI 304. Reproduced from [2], with permission from Elsevier, 2009.
Density (g/cm3)Elastic Modulus (GPa)Poisson′s RatioCoefficient of Thermal Expansion (10−6∙K−1)Thermal Conductivity (W∙m−1∙K−1)Specific Heat Capacity (J∙kg−1∙K−1)
7.931930.317.216.3500
Table 3. Process parameters and their levels.
ParametersLevels
α−10+1+α
v (m/min)66.3680100120133.64
f (mm/rev)0.070.100.150.200.23
ap (mm)0.270.30.40.50.57
Table 4. Experimental design array and results.
RunV (m/min)f (mm/rev)ap (mm)Sa (μm)MRR (mm3/min)SCE (J/mm3)
180.000.100.301.60 ± 0.1024005.25 ± 0.25
2120.000.100.301.23 ± 0.0936004.33 ± 0.17
380.000.200.302.12 ± 0.1648004.50 ± 0.13
4120.000.200.301.63 ± 0.1172003.67 ± 0.08
580.000.100.501.60 ± 0.1040004.95 ± 0.15
6120.000.100.501.34 ± 0.0760004.20 ± 0.10
780.000.200.502.46 ± 0.1280004.20 ± 0.08
8120.000.200.502.18 ± 0.1112,0003.55 ± 0.05
966.360.150.402.04 ± 0.1339825.13 ± 0.15
10133.640.150.401.37 ± 0.0880183.59 ± 0.07
11100.000.070.401.25 ± 0.0828005.14 ± 0.21
12100.000.230.402.19 ± 0.1592003.65 ± 0.07
13100.000.150.231.57 ± 0.1234504.17 ± 0.17
14100.000.150.572.20 ± 0.1185504.00 ± 0.07
15100.000.150.401.32 ± 0.0760003.90 ± 0.10
16100.000.150.401.28 ± 0.1060004.00 ± 0.10
17100.000.150.401.46 ± 0.1060004.10 ± 0.10
18100.000.150.401.37 ± 0.1160004.00 ± 0.10
19100.000.150.401.31 ± 0.0860004.00 ± 0.10
20100.000.150.401.22 ± 0.0960004.00 ± 0.10
Table 5. Analysis of variance (ANOVA) for response variables.
ResponseP-Value of ModelStd. Dev.R2Adj. R2Pred. R2Adeq. Precision
Sa<0.00010.0790.97990.96180.916623.489
MRR<0.0001105.940.99900.99800.9909124.592
SCE<0.00010.0860.98580.97300.915629.391
Table 6. Solutions of numerical optimization.
No.FactorsResponsesDesirability
v (m/min)f (mm/rev)ap (mm)Sa (μm)MRR (mm3/min)SCE (J/mm3)
1120.000.180.421.6009324.133.5250.843
2120.000.180.431.6009331.763.5270.843
3119.950.180.431.6009323.843.5260.843
4120.000.180.431.6009340.353.5310.843
5119.990.180.431.6009342.003.5320.843
6119.980.190.411.6009263.113.5160.842
7120.000.190.411.6009254.633.5150.841
8120.000.180.441.6009350.673.5430.840
9119.670.180.441.6009331.163.5420.840
10120.000.190.401.6009201.123.5120.839

