Thermoelectric Properties of Cu2SnSe3-Based Composites Containing Melt-Spun Cu–Te

School of Materials Science and Engineering, University of Jinan, Jinan 250022, China
*
Author to whom correspondence should be addressed.
Metals 2019, 9(9), 971; https://doi.org/10.3390/met9090971
Submission received: 19 July 2019
/
Revised: 26 August 2019
/
Accepted: 30 August 2019
/
Published: 3 September 2019
(This article belongs to the Special Issue Thermoelectric Compounds: Processing, Properties and Applications)
Abstract
:In this study, the Cu–Te alloy ribbons containing nanocrystalline structures were prepared by melt spinning (MS), and were composed of Cu2−xTe, Cu2Te, Cu3−xTe, and CuTe phases. Crystal grains on both sides of the ribbons were uniformly distributed and the grain size of the contact surface was about 400 nm. The Cu–Te powder was incorporated into the Cu2SnSe3 powder by the ball milling process and the Cu–Te/Cu2SnSe3 thermoelectric composite was prepared by spark plasma sintering (SPS). With the amount of Cu–Te powder increasing, the carrier concentration of the Cu–Te/Cu2SnSe3 composite increased, while the carrier mobility and electrical conductivity initially increased and then decreased. Compared to the Seebeck coefficient of the Cu2SnSe3 matrix, the Seebeck coefficient of the Cu–Te/Cu2SnSe3 samples increased slightly. Moreover, the Cu–Te/Cu2SnSe3 composites had lower thermal conductivity and lattice thermal conductivity over the whole temperature range. The lattice thermal conductivity of the 0.8 vol.% Cu–Te/Cu2SnSe3 composite achieved the lowest value of 0.22 W/m·K, which was 78% lower than that of the Cu2SnSe3 matrix. The maximum figure of merit of the 0.8 vol.% Cu–Te/Cu2SnSe3 composite was 0.45 at 700 K.
1. Introduction
With the development of modern society, global energy crisis and environmental pollution are becoming increasingly severe. Thermoelectric materials become increasingly compelling due to their unique advantages in the field of energy materials. Thermoelectric materials not only achieve direct conversion between thermal and electrical energies, but also have good stability [1,2]. However, the figure of merit that characterizes thermoelectric properties is difficult to improve effectively, which leads to the failure of thermoelectric materials in achieving a wide range of applications. It is well known that the figure of merit ZT is defined as ZT = α2σT/κ, where α and σ are the Seebeck coefficients and electrical conductivity of material, respectively; T is the absolute temperature; κ is the sum of lattice thermal conductivity (κL) and carrier thermal conductivity (κc) of material [3,4,5]. These parameters are limited by the internal structure of the material, and interact with each other. Therefore, the coordinated development and optimization of various parameters is the most important task for thermoelectric materials.
Cu-based thermoelectric materials have attracted wide attention due to their special crystal structure, relatively high carrier mobility, and low cost. Recently, research on the p-type Cu2SnSe3 ternary thermoelectric semiconductor has been increasing. Cu2SnSe3 is a promising thermoelectric material due to its narrow band gap (0.84 eV) and large carrier effective mass [6,7]. Various doping on the Sb site of Cu2SnSe3 have been carried out to improve its thermoelectric properties and some valuable work has been achieved [8,9,10]. Besides substituting or doping, the introduction of nanophase/matrix interfaces can also enhance phonon scattering and decrease lattice conductivity, thus improving the ZT value of thermoelectric materials. The melt spinning (MS) process has been widely used in the preparation of various thermoelectric materials, such as PbTe [11,12], Mg2Si0.4Sn0.6 [13,14], skutterudite compounds [15,16], AgSbTe2 [17,18], etc. Previous results show that a large number of finely microstructured and nanoscale grains can be obtained by MS. However, there is little information regarding Cu-based thermoelectric materials involving the MS process.
In this study, Cu–Te ribbons containing a nanocrystalline structure were prepared using the MS process. The Cu–Te powder-containing nanocrystalline structure was introduced into the Cu2SnSe3 matrix by ball milling and the Cu–Te/Cu2SnSe3 thermoelectric composites were prepared by spark plasma sintering (SPS). Effects of the Cu–Te nanocrystalline structure on the thermoelectric properties of Cu–Te/Cu2SnSe3 composites were discussed.
2. Experimental Procedures
The element mass of Cu (99.99%) and Te (99.99%) were weighed at a molar ratio of 1.9:1 due to the sublimation of Te. The mixed raw materials were loaded into a quartz tube, and the quartz tube was subjected to high-frequency induction melting furnace. The chamber was evacuated to 5 × 10⁻³ Pa and the alloys were melted under the protection of high purity argon (99.999%). The Cu–Te master alloy melt was sprayed onto the surface of a copper roller with a linear speed of 25 m/s under a pressure of 0.04 MPa to obtain Cu–Te ribbons-containing nanocrystalline structure. Then the obtained ribbons were ground into fine powder in agate mortar. Cu2SnSe3 ingots were synthesized by conventional melting–annealing methods in which the raw materials used were powders with a purity of more than 99.99%. The stoichiometric mixtures of pure elements Cu, Sn, and Se were sealed in evacuated quartz tube at 1273 K for 12 h, followed by annealing at 923 K for 36 h. Then the obtained Cu2SnSe3 ingots were ground into fine powder in agate mortar and mixed with Cu–Te powder by ball milling at 300 r/min for 2 h. The weight ratio of balls to powders was ~10:1. Finally, the resulting Cu–Te/Cu2SnSe3 powder was sintered by spark plasma sintering (SPS) process at 693 K for 8 min in a vacuum under 60 MPa.
The density (ρ) of Cu–Te/Cu2SnSe3 composites was tested by the Archimedes method. The densities of Cu–Te/Cu2SnSe3 composites were above 95% of the corresponding theoretical density. X-ray diffraction (D8-ADVANCE, Karlsruhe, Germany) was used to analyze the phase composition of Cu–Te/Cu2SnSe3 composites at a scanning rate of 4°/min. The microstructure of Cu–Te/Cu2SnSe3 samples was characterized by scanning electron microscopy (QUANTA FEG250, FEI, Hillsboro, OR USA). The laser thermometer (LFA-457, Netzsch, Selb, Germany) was used to measure the thermal diffusivity of composites with a diameter of 10 mm and a thickness of 1.5 mm. The surfaces of the measured sample were coated with carbon. The thermal conductivity of Cu–Te/Cu2SnSe3 composites was calculated from the κ = λρCp formula where λ is the thermal diffusivity of the sample, Cp is the specific heat (estimated according to Dulong–Petit’s law), and ρ is the density of the sample. The electrical conductivity and Seebeck coefficient were determined simultaneously using ZEM-3 equipment (ULVAC-RIKO, Yokohama, Japan). Uncertainty in the electrical conductivity, Seebeck coefficient, and thermal conductivity measurements was at most 5%. The van der Pauw method was used to measure the Hall coefficient RH of the composites in a self-made equipment. All composites’ measurements were carried out in the temperature range of 300–700 K.
3. Results and Discussion
3.1. XRD Analysis and Microstructure
Figure 1 shows the X-ray diffraction pattern of Cu–Te alloy powder after MS. It can be seen that the Cu–Te alloy after MS consists of the Cu2−xTe, Cu2Te, Cu3−xTe2, and CuTe phase. Figure 2 shows the SEM image of Cu–Te alloy ribbons, with both sides of Cu–Te alloy ribbons depicting a uniform microstructure. The free surface was relatively rough and the grain size was about 800 nm, as shown in Figure 2a,b. On the other hand, the contact surface was smooth and the grain size was about 400 nm, which were smaller than those of the free surface, as shown in Figure 2c,d.
Figure 3 shows the X-ray diffraction patterns of x vol.% Cu–Te/Cu2SnSe3 composites (x = 0, 0.4, 0.8, 1.2). It can be seen that the diffraction peaks of the Cu–Te/Cu2SnSe3 composites were consistent with peaks of the Cu2SnSe3 matrix except for the 1.2 vol.% Cu–Te/Cu2SnSe3 composite. There was a peak at about 30° in the XRD pattern of the 1.2 vol.% Cu–Te/Cu2SnSe3 sample. The unknown phase at ~30° was indexed to be Cu–Te phases such as Cu2−xTe, Cu2Te, and Cu3−xTe2. The EDS result of the 1.2 vol.% Cu–Te/Cu2SnSe3 sample also confirmed the presence of Cu–Te phases, just as shown in Figure 4. Neither the phases in the Cu–Te alloy ribbons nor the new phase were found in other Cu–Te/Cu2SnSe3 composites. This was due to the fact that the addition of melt-spun Cu–Te was relatively too low compared to the Cu2SnSe3 matrix.
In order to better show the microstructure of Cu–Te/Cu2SnSe3 composites after SPS sintering, SEM for the fracture morphology of composites was carried out. As shown in Figure 4, with the increase in Cu–Te powders, grain growth of the Cu2SnSe3 matrix was inhibited significantly and the grain size decreased. Moreover, it can be seen that there were some micro-pores that were ~250 nm in the grain boundaries, which is shown in Figure 5. The formation of micro-pores was possibly attributed to the low melting point phases such as CuTe, etc., in Cu–Te powders, which melted during the sintering process. Previous studies have shown that there is similar micro-porosity in the sintered skutterudites materials, which is beneficial to the improvement of thermoelectric properties due to the additional long-wavelength phonon scattering [19]. However, when the addition amount of Cu–Te reached 1.2%, an unusual phenomenon of grain growth can be found in the 1.2 vol.% Cu–Te/Cu2SnSe3 composite, just as shown in Figure 4d. This phenomenon should be related to the aggregation of Cu–Te phases. With the increase of Cu–Te phases, the aggregation of Cu–Te phases was easy to occur. Figure 5 shows the SEM image of the 1.2 vol.% Cu–Te/Cu2SnSe3 sample and EDS results. The presence of micro-voids/nanopores in the 1.2 vol.% Cu–Te/Cu2SnSe3 sample can also be easily seen. As the melting points of Cu–Te phases are relatively low, the aggregation region of the Cu–Te phases had relatively weak inhibition ability for grain growth in the sintering process. Therefore, grains of the 1.2 vol.% Cu–Te/Cu2SnSe3 composite were relatively coarse and the size of micro-voids was larger accordingly.
3.2. Electrical Transport Properties
Table 1 lists the electrical transport properties and relative densities of Cu–Te/Cu2SnSe3 composites at room temperature. Due to the presence of micro-pores/nanopores, an additional carrier scattering mechanism which preferentially scatters low energy carriers in the Cu–Te/Cu2SnSe3 composite can be introduced. With the amount of Cu–Te phases increasing, the carrier concentration of Cu–Te/Cu2SnSe3 composites increased. While the carrier mobility and electrical conductivity of Cu–Te/Cu2SnSe3 composites first increased and then decreased with the amount of Cu–Te phases increasing. The decrease in carrier mobility and electrical conductivity should be attributed to the large number of large-size vacancies or micro-voids in the 1.2 vol.% Cu–Te/Cu2SnSe3 composite.
Figure 6 shows the temperature dependence of electrical conductivity for Cu–Te/Cu2SnSe3 composites with different volume fraction Cu–Te phases. At high temperature, the electrical conductivity of the 1.2 vol.% Cu–Te/Cu2SnSe3 composite was even lower than that of the pure Cu2SnSe3 matrix. The 0.8 vol.% Cu–Te/Cu2SnSe3 composite showed the highest electrical conductivity, and the σ was 2.04 × 10³ S/cm at 700 K. This is possibly related to the 0.8 vol.% Cu–Te/Cu2SnSe3 composite’s higher density.
The temperature dependence of Seebeck’s coefficient (α) for the Cu–Te/Cu2SnSe3 composite is shown in Figure 7. The Seebeck coefficient of Cu–Te/Cu2SnSe3 composites was slightly higher than that of the pure Cu2SnSe3 matrix, indicating that the decrease in Seebeck’s coefficient caused by carrier concentration was not enough to balance the increase in Seebeck’s coefficient by the carrier scattering of Cu–Te/Cu2SnSe3 composites. The maximum α was ~80 μV/K for the 1.2 vol.% Cu–Te/Cu2SnSe3 composite at 700 K. Figure 8 shows the temperature dependence of the power factor (PF) for all Cu–Te/Cu2SnSe3 samples. The 0.8 vol.% Cu–Te/Cu2SnSe3 composite showed the best PF, and the maximum PF reached 6.3 × 10⁻⁴ W·m−1·K−2 at 700 K, which was ~1.4 times that of the Cu2SnSe3 matrix.
3.3. Thermal Transport Properties
Figure 9 shows the temperature dependence of total thermal conductivity κ and lattice thermal conductivity κL for Cu–Te/Cu2SnSe3 composites. It can be seen that the addition of melt-spun Cu–Te decreased the κ and κL of Cu2SnSe3 thermoelectric material evidently. It is already reported that the micro-voids/nanopores or holey structures can suppress the average group velocities at low temperatures and this suppression is expected to intensify as the temperature increases. Therefore, the micro-voids/nanopores in Cu–Te/Cu2SnSe3 could potentially introduce additional phonon scattering and play a great role in reducing the κL by targeting long-wavelength phonon scattering. However, there was little difference in κ among the Cu–Te/Cu2SnSe3 composites in the whole temperature range. The κ is composed of κL and carrier thermal conductivity (κc). The κc can be estimated using the Wiedemann–Franz law, κc = LσT, where L is the Lorenz constant and has a value of 2.45 × 10⁻⁸ V2/K2 [20,21]. The κL can be calculated by subtracting the κc from κ. As the 0.8 vol.% Cu–Te/Cu2SnSe3 composite had a large κc, κL of the 0.8 vol.% Cu–Te/Cu2SnSe3 was minimal and ~0.22−1.1 W/m·K. The minimum κL of 0.8 vol.% Cu–Te/Cu2SnSe3 was 0.22 W·m−1·K−1 at 700 K, which was 78% lower than that of the Cu2SnSe3 matrix. In addition, κL showed temperature dependence of T−1 in the whole temperature range, suggesting that phonon–phonon scattering dominated the scattering mechanism for the Cu–Te/Cu2SnSe3 composites.
3.4. Figure of Merit
Figure 10 depicts that temperature dependence of the dimensionless figure of merit (ZT) for Cu–Te/Cu2SnSe3 composites. ZT of all Cu–Te/Cu2SnSe3 composites increased with increasing temperatures. The addition of melt-spun Cu–Te improved the thermoelectric performance of Cu2SnSe3 thermoelectric material. The maximum ZT value of 0.45 was obtained at 700 K for the 0.8 vol.% Cu–Te/Cu2SnSe3 composite, which was two times that of the Cu2SnSe3 matrix. Improvement in ZT of the Cu–Te/Cu2SnSe3 composite was mostly attributed to the decreased κ. The addition of melt spun Cu–Te had great effects on the microstructure and chemical composition of Cu2SnSe3 material. In addition, due to the presence of micro-voids/nanopores in the Cu–Te/Cu2SnSe3 composite, there might be another x value between 0.4 and 1.2 that give even better result. We will refine and optimize the x value in future work.
4. Summary
The Cu–Te alloy ribbon containing nanocrystalline structures was prepared by melt spinning, and was composed of Cu2−xTe, Cu2Te, and Cu3−xTe2 phases. Both sides of Cu–Te ribbons had a uniform microstructure and the grain size was 400–800 nm. The Cu–Te/Cu2SnSe3 thermoelectric composites were prepared using the ball milling and spark plasma sintering method. The addition of melt-spun Cu–Te phases improved the thermoelectric performance of Cu2SnSe3 thermoelectric material. Increase in ZT of the Cu–Te/Cu2SnSe3 composite was mostly attributed to the decreased thermal conductivity. Maximum ZT of the 0.8 vol.% Cu–Te/Cu2SnSe3 composite was 0.45 at 700 K.
Author Contributions
All authors participated in the research, analyses, and editing of the manuscript. D.Z., designed the experiments and wrote the manuscript; D.W., conducted the experiments; L.W. and L.B., participated in discussing the data. All the authors contributed to the characterization and data analysis.
Funding
We gratefully acknowledge the financial support from the National Natural Science Foundations of China (No. 51772132) and the Natural Science Foundation of Shandong Province of China (ZR2019MEM019).
Acknowledgments
The authors would like to thank Tongji University for help with TE properties’ measurements.
Conflicts of Interest
The authors declare no conflict of interest.
References
- Disalvo, F.J. Thermoelectric cooling and power generation. Science 1999, 285, 703–706. [Google Scholar] [CrossRef] [PubMed]
- Bell, L.E. Cooling, heating, generating power, and recovering waste heat with thermoelectric systems. Science 2008, 321, 1457–1461. [Google Scholar] [CrossRef] [PubMed]
- Pei, Y.Z.; Shi, X.; Lalonde, A. Convergence of electronic bands for high performance bulk thermoelectric. Nature 2011, 473, 66–69. [Google Scholar] [CrossRef] [PubMed]
- Biswas, K.; He, J.; Blum, I.D. High-performance bulk thermoelectrics with all-scale hierarchical architectures. Nature 2012, 489, 414–418. [Google Scholar] [CrossRef] [PubMed]
- Heremans, J.P.; Dresselhaus, M.S.; Bell, L.E.; Morelli, D.T. When thermoelectrics reached the nanoscale. Nat. Nano Technol. 2013, 8, 471–473. [Google Scholar] [CrossRef] [PubMed]
- Marcano, G.; Rincon, C.; Chalbaud, L.M. Crystal growth and structure, electrical, and optical characterization of the semiconductor Cu2SnSe3. J. Appl. Phys. 2001, 90, 1847–1853. [Google Scholar] [CrossRef]
- Choi, S.G.; Kang, J.; Li, J.; Haneef, H.; Podraza, N.J.; Beall, C.; Wei, S.H.; Christensen, S.T.; Repins, I.L. Optical function spectra and bandgap energy of Cu2SnSe3. Appl. Phys. Lett. 2015, 106, 043902. [Google Scholar] [CrossRef]
- Shi, X.; Xi, L.L.; Fan, J.; Zhang, W.Q.; Chen, L.D. Cu-Se bond network and thermoelectric compounds with complex diamondlike Structure. Chem. Mater. 2010, 22, 6029–6031. [Google Scholar] [CrossRef]
- Liu, H.; Shi, X.; Zhang, L.; Zhang, W.Q.; Chen, L.D.; Li, Q.; Uher, C.; Day, T.; Snyder, G.J. Copper ion liquid-like thermoelectrics. Nat. Mater. 2012, 11, 422–425. [Google Scholar] [CrossRef]
- Skoug, E.J.; Jeffrey, D.C.; Morelli, D.T. Thermoelectric properties of the Cu2SnSe3–Cu2GeSe3 solid solution. J. Alloy. Compd. 2010, 506, 18–21. [Google Scholar] [CrossRef]
- Ding, G.C.; Si, J.X.; Yang, S.D.; Wang, G.W.; Wu, H.F. High thermoelectric properties of n-type Cd-doped PbTe prepared by melt spinning. Scr. Mater. 2016, 122, 1–4. [Google Scholar] [CrossRef]
- Ding, G.C.; Si, J.X.; Wu, H.F.; Wang, G.W. Thermoelectric properties of melt spun PbTe with multi-scaled nanostructures. J. Alloy. Compd. 2015, 662, 368–373. [Google Scholar] [CrossRef]
- Tang, X.D.; Qang, G.W.; Zheng, Y.; Zhang, Y.M.; Peng, K.L.; Guo, L.J.; Wang, S.X.; Zeng, M.; Dai, J.Y.; Wang, G.Y.; et al. Ultra rapid fabrication of p-type Li-doped Mg2Si0.4Sn0.6 synthesized by unique melt spinning method. Scr. Mater. 2016, 115, 52–56. [Google Scholar] [CrossRef]
- Tang, X.D.; Zhang, Y.M.; Zheng, Y.; Peng, K.L.; Lu, X.; Zhou, G.Y.; Zhang, X.Y. Improving thermoelectric performance of p-type Ag-doped Mg2Si0.4Sn0.6 prepared by unique melt spinning method. Appl. Therm. Eng. 2017, 111, 1396–1400. [Google Scholar] [CrossRef]
- Guo, L.J.; Wang, G.W.; Peng, K.L.; Yan, Y.C.; Tang, X.D.; Zeng, M.; Dai, J.Y.; Wang, G.Y.; Zhou, X.Y. Melt spinning synthesis of p-type skutterudites: Drastically speed up the process of high performance thermoelectrics. Scr. Mater. 2016, 116, 26–30. [Google Scholar] [CrossRef]
- Son, G.; Lee, K.H.; Park, H.W.; Caron, A.; Kim, I.H.; Lee, S.; Choi, S.M. Control of electrical to thermal conductivity ratio for p-type LaxFe3CoSb12 thermoelectrics by using a melt-spinning process. J. Alloy. Compd. 2017, 729, 1209–1214. [Google Scholar] [CrossRef]
- Du, B.; Li, H.; Xu, J.J.; Tang, X.F.; Uher, C. Enhanced thermoelectric performance and novel nanopores in AgSbTe2 prepared by melt spinning. J. Solid State Chem. 2011, 184, 109–114. [Google Scholar] [CrossRef]
- Chen, Y.; Zhu, T.J.; Yang, S.H.; Zhang, S.N.; Miao, W.; Zhao, X.B. High performance (AgSbTe)(GeTe) thermoelectric materials prepared by melt spinning. J. Electron. Mater. 2010, 399, 1719–1723. [Google Scholar] [CrossRef]
- Atta, U.K.; Kazuaki, K.; Tang, D.M.; Yamauchi, Y.; Hasegawa, K.; Mitome, M.; Xue, Y.M.; Jiang, B.Z.; Tsuchiya, K.; Golberg, D.; et al. Nano-micro-porous skutterudites with 100% enhancement in ZT for high performance thermoelectricity. Nano Energy 2017, 31, 152–159. [Google Scholar]
- Zhao, D.G.; Wang, X.Z.; Wu, D. Enhanced thermoelectric properties of graphene/Cu2SnSe3 composites. Crystals 2017, 7, 71. [Google Scholar] [CrossRef]
- Fan, J.; Liu, H.L.; Shi, X.Y.; Bai, S.Q.; Shi, X.; Chen, L.D. Investigation of thermoelectric properties of Cu2GaxSn1−xSe3 diamond-like compounds by hot pressing and spark plasma sintering. Acta Mater. 2013, 61, 4297–4304. [Google Scholar] [CrossRef]
Figure 1.
X-ray diffraction pattern of Cu–Te alloy powder.

Figure 2.
SEM images of Cu–Te alloy ribbons after MS; (a) free surface, low magnification; (b) free surface, high magnification; (c) contact surface, low magnification; and (d) contact surface, high magnification.
Figure 2.
SEM images of Cu–Te alloy ribbons after MS; (a) free surface, low magnification; (b) free surface, high magnification; (c) contact surface, low magnification; and (d) contact surface, high magnification.
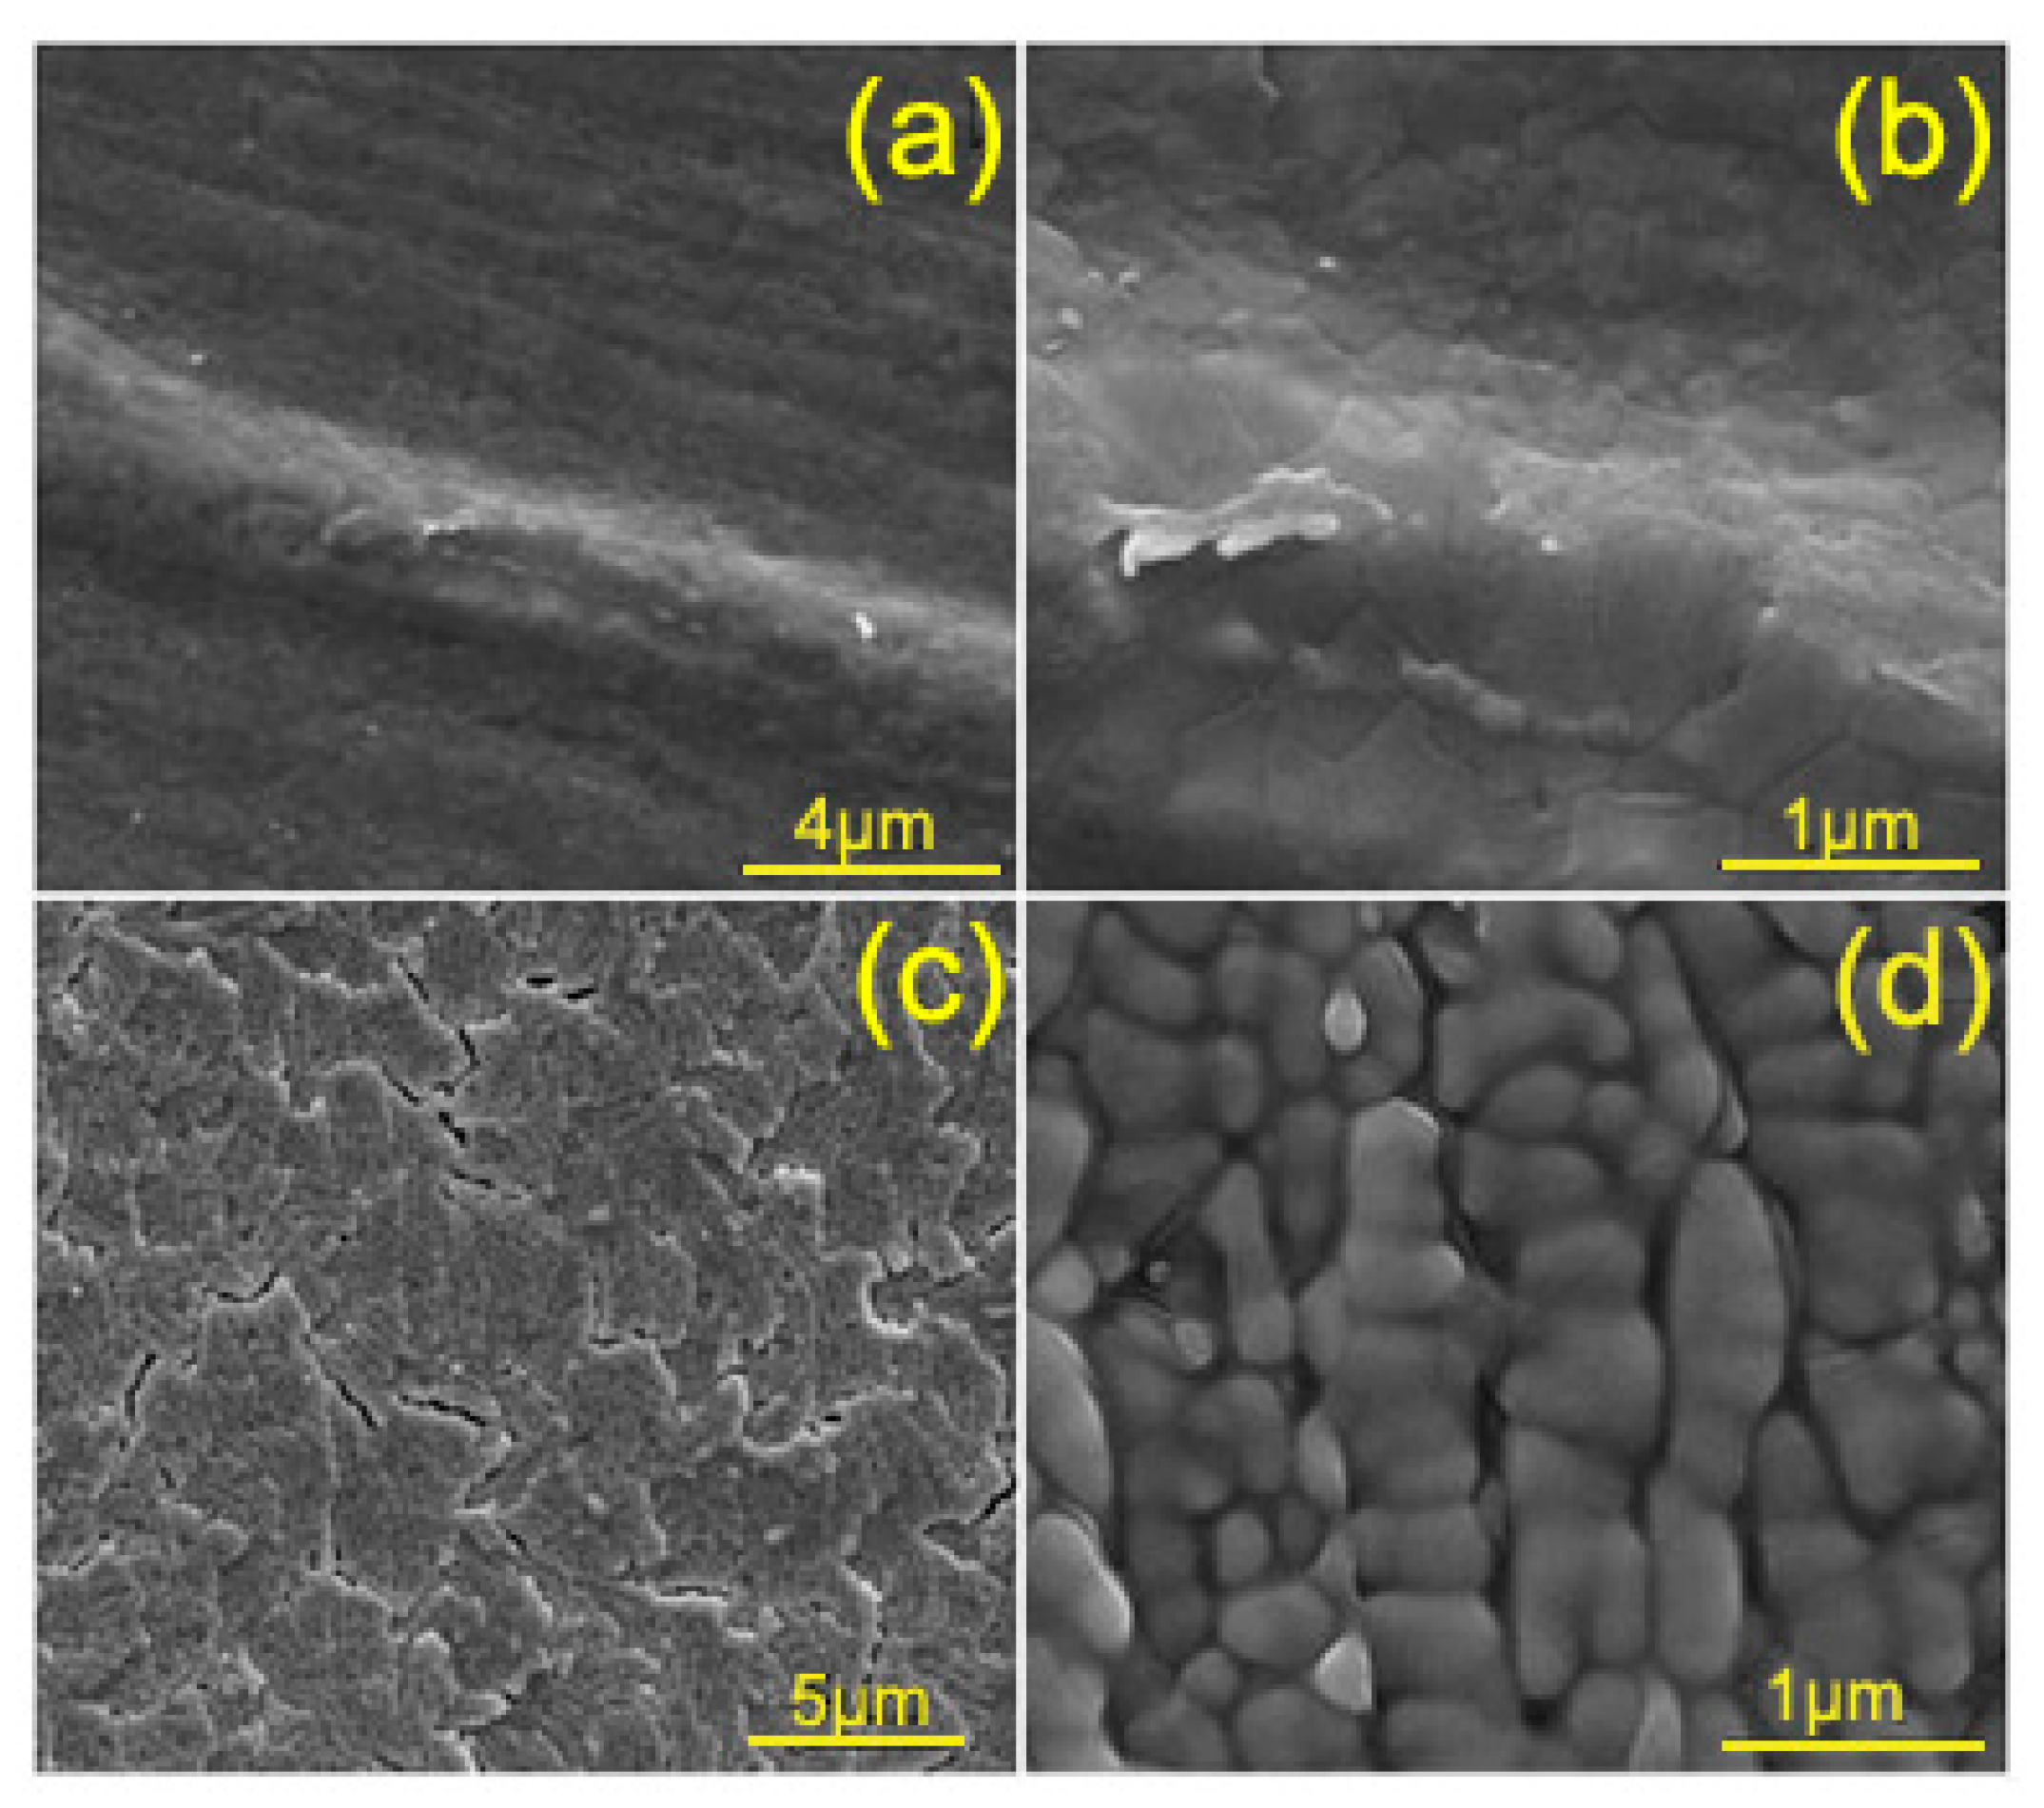
Figure 3.
X-ray diffraction patterns of Cu–Te/Cu2SnSe3 composites.
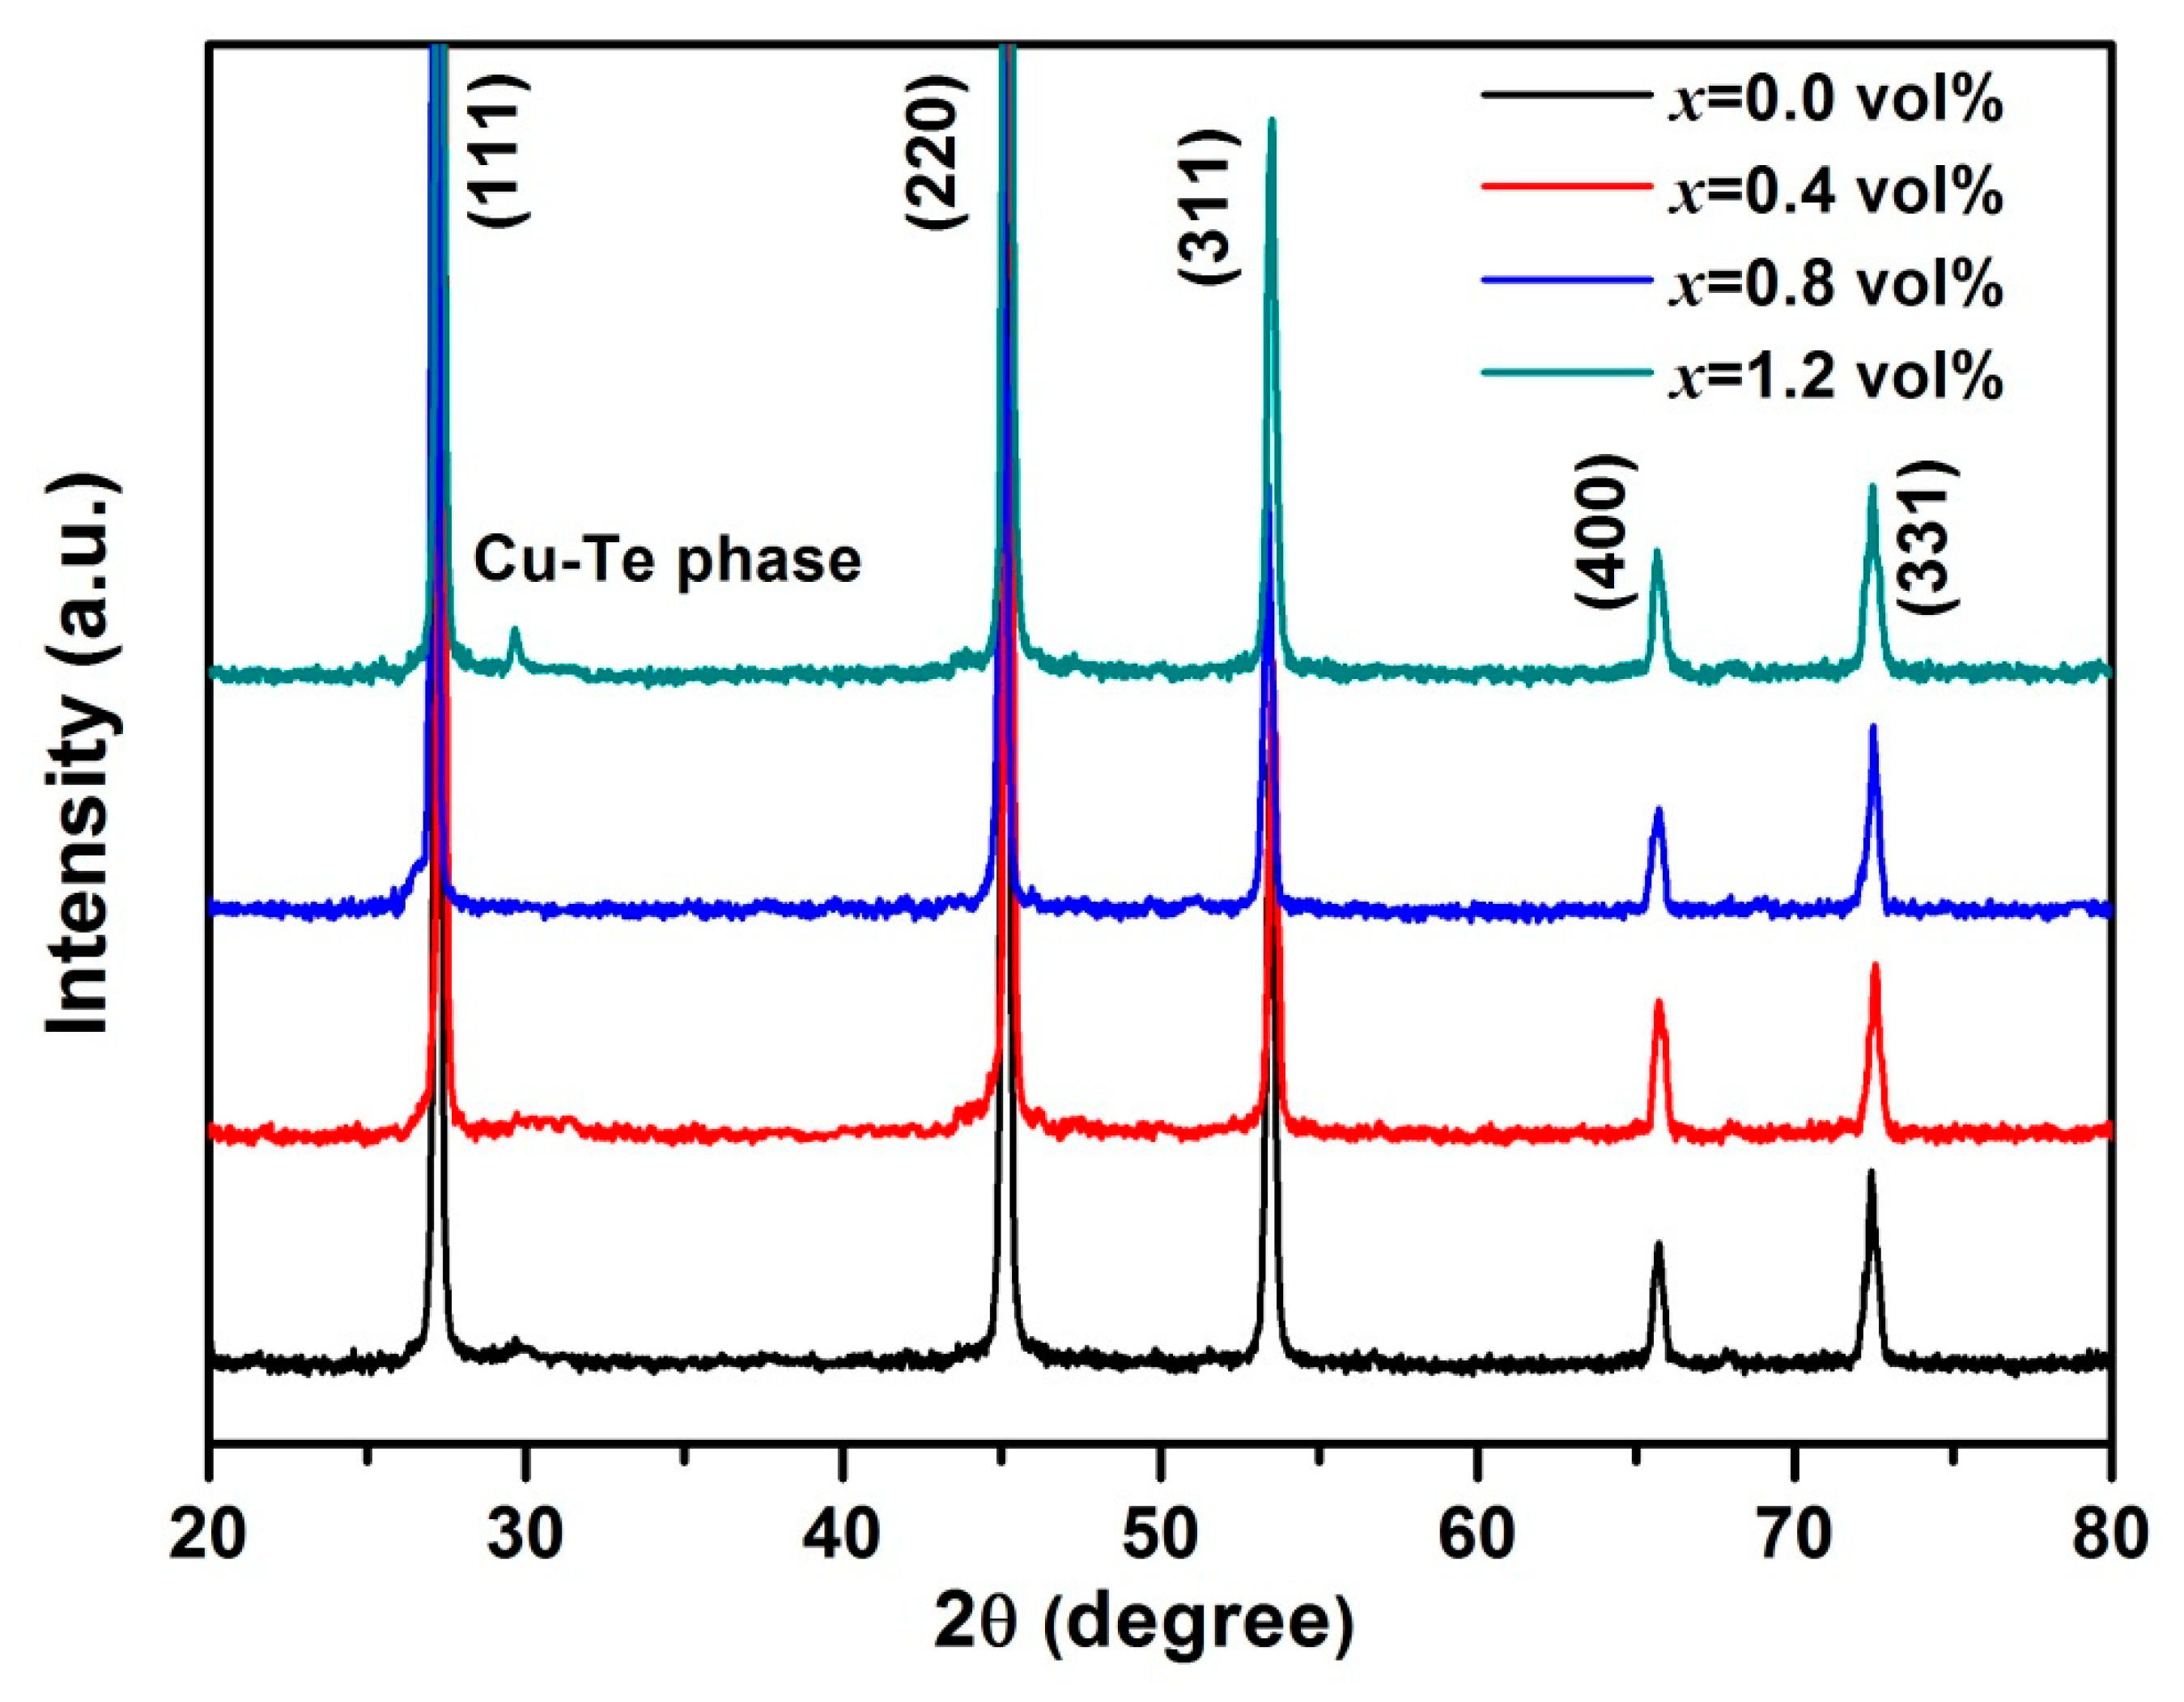
Figure 4.
SEM image of fracture morphology of (a) Cu2SnSe3; (b) 0.4 vol.% Cu–Te/Cu2SnSe3; (c) 0.8 vol.% Cu–Te/Cu2SnSe3; and (d) 1.2 vol.% Cu–Te/Cu2SnSe3.
Figure 4.
SEM image of fracture morphology of (a) Cu2SnSe3; (b) 0.4 vol.% Cu–Te/Cu2SnSe3; (c) 0.8 vol.% Cu–Te/Cu2SnSe3; and (d) 1.2 vol.% Cu–Te/Cu2SnSe3.

Figure 5.
SEM images of the 1.2 vol.% Cu–Te/Cu2SnSe3 sample and EDS (Energy Dispersive X-ray Spectroscopy) results.
Figure 5.
SEM images of the 1.2 vol.% Cu–Te/Cu2SnSe3 sample and EDS (Energy Dispersive X-ray Spectroscopy) results.

Figure 6.
Temperature dependence of the electrical conductivity (σ) of Cu–Te/Cu2SnSe3 composites.
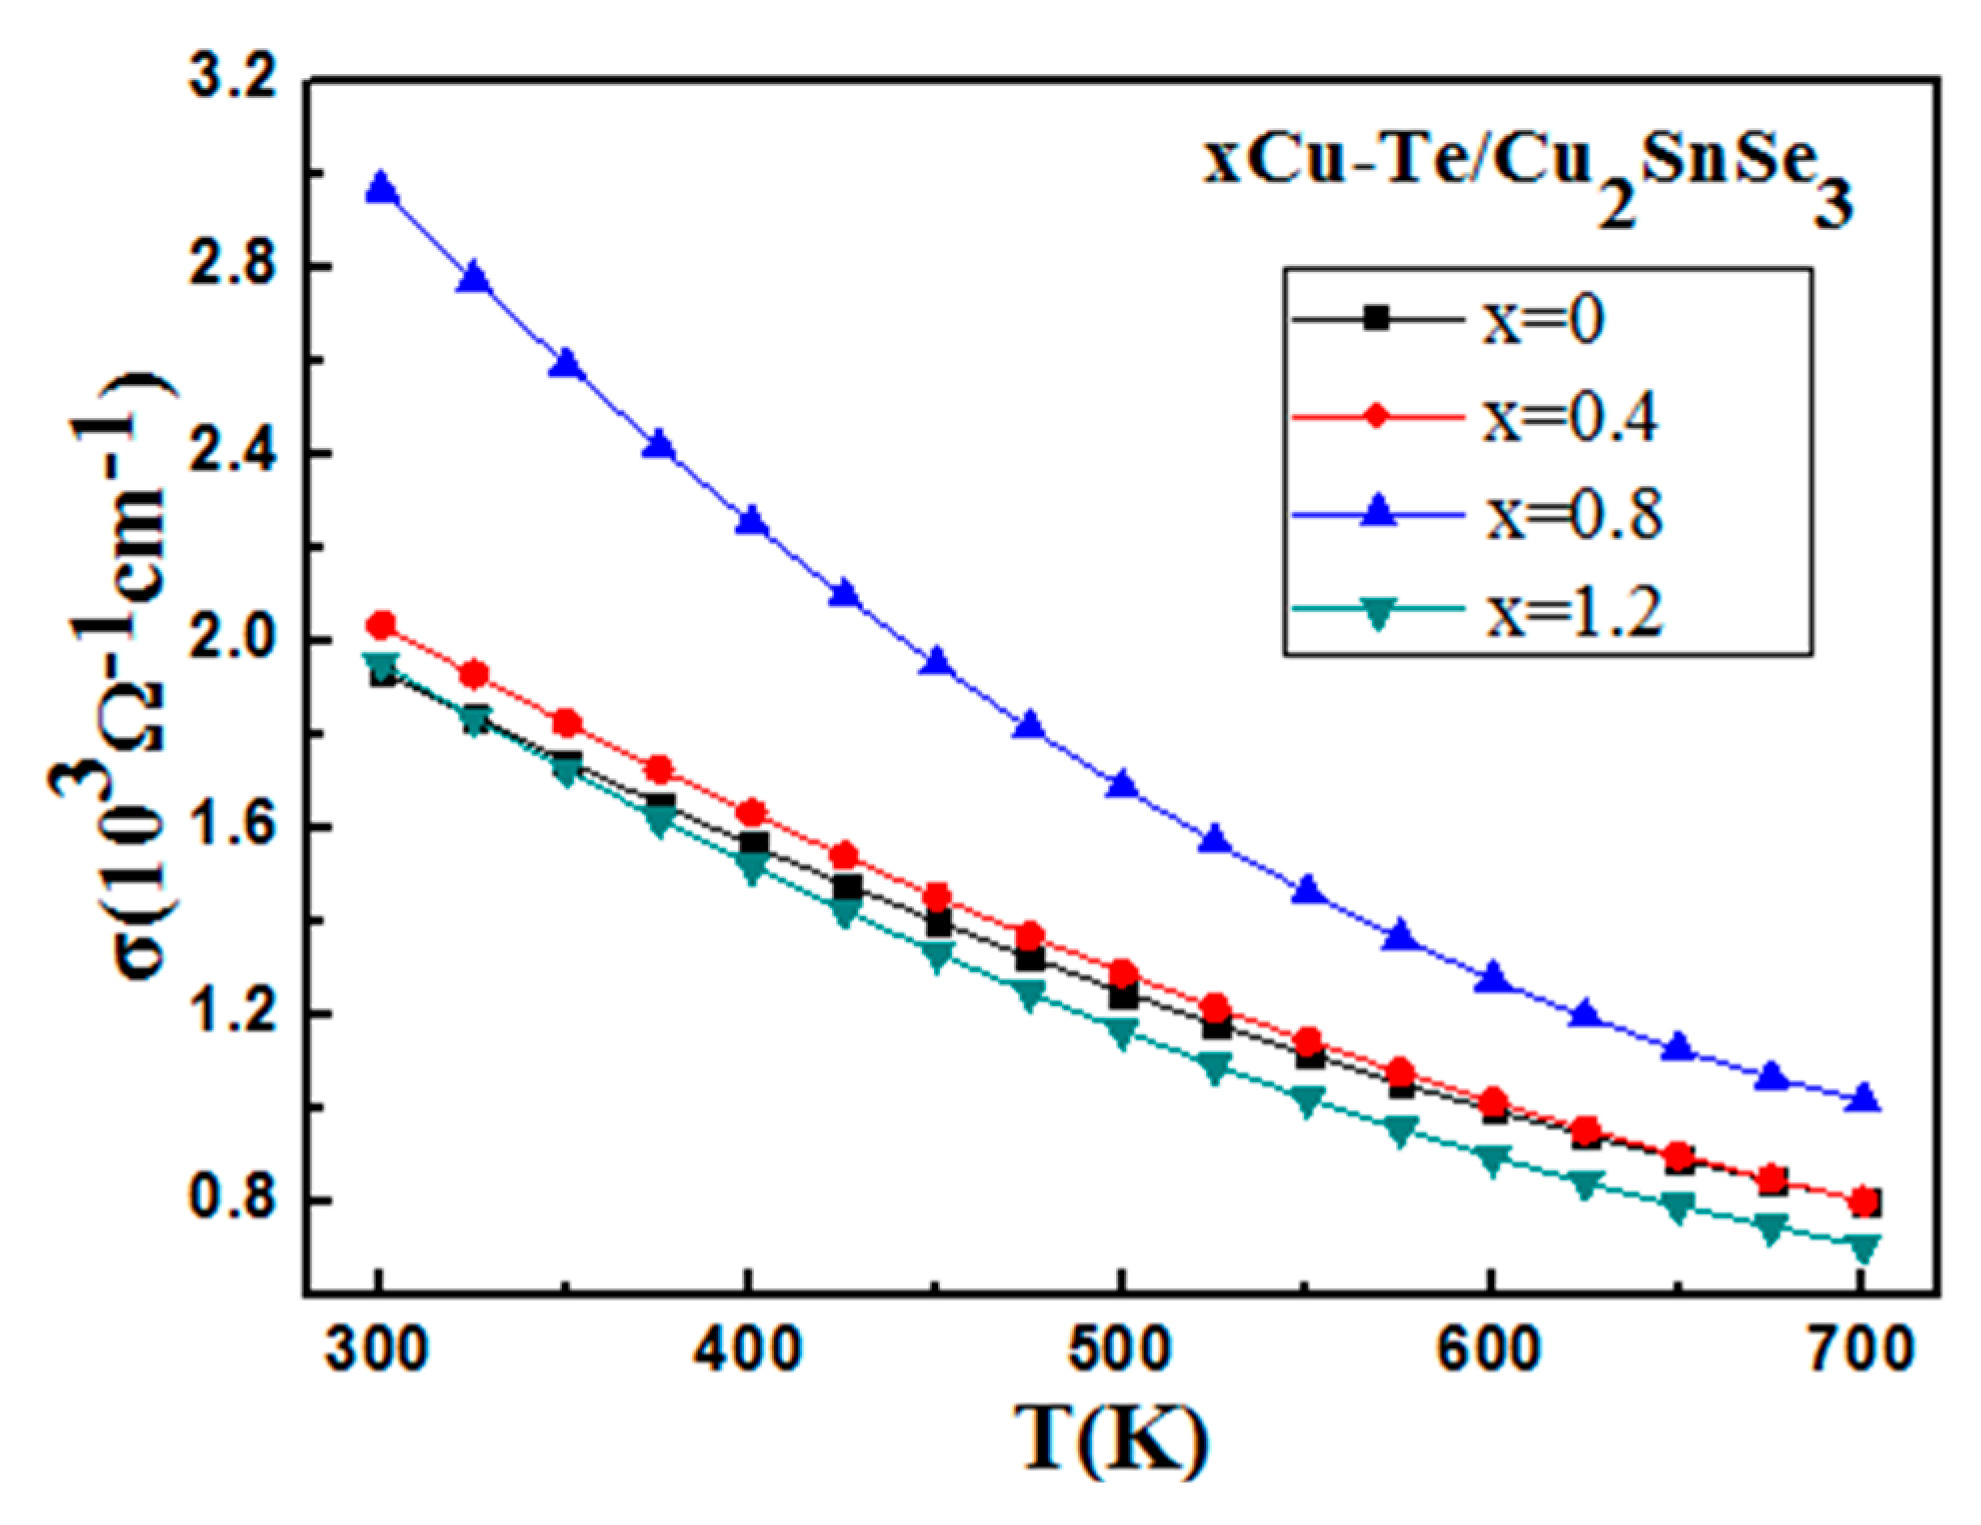
Figure 7.
Temperature dependence of Seebeck’s coefficient (α) of Cu–Te/Cu2SnSe3 composites.
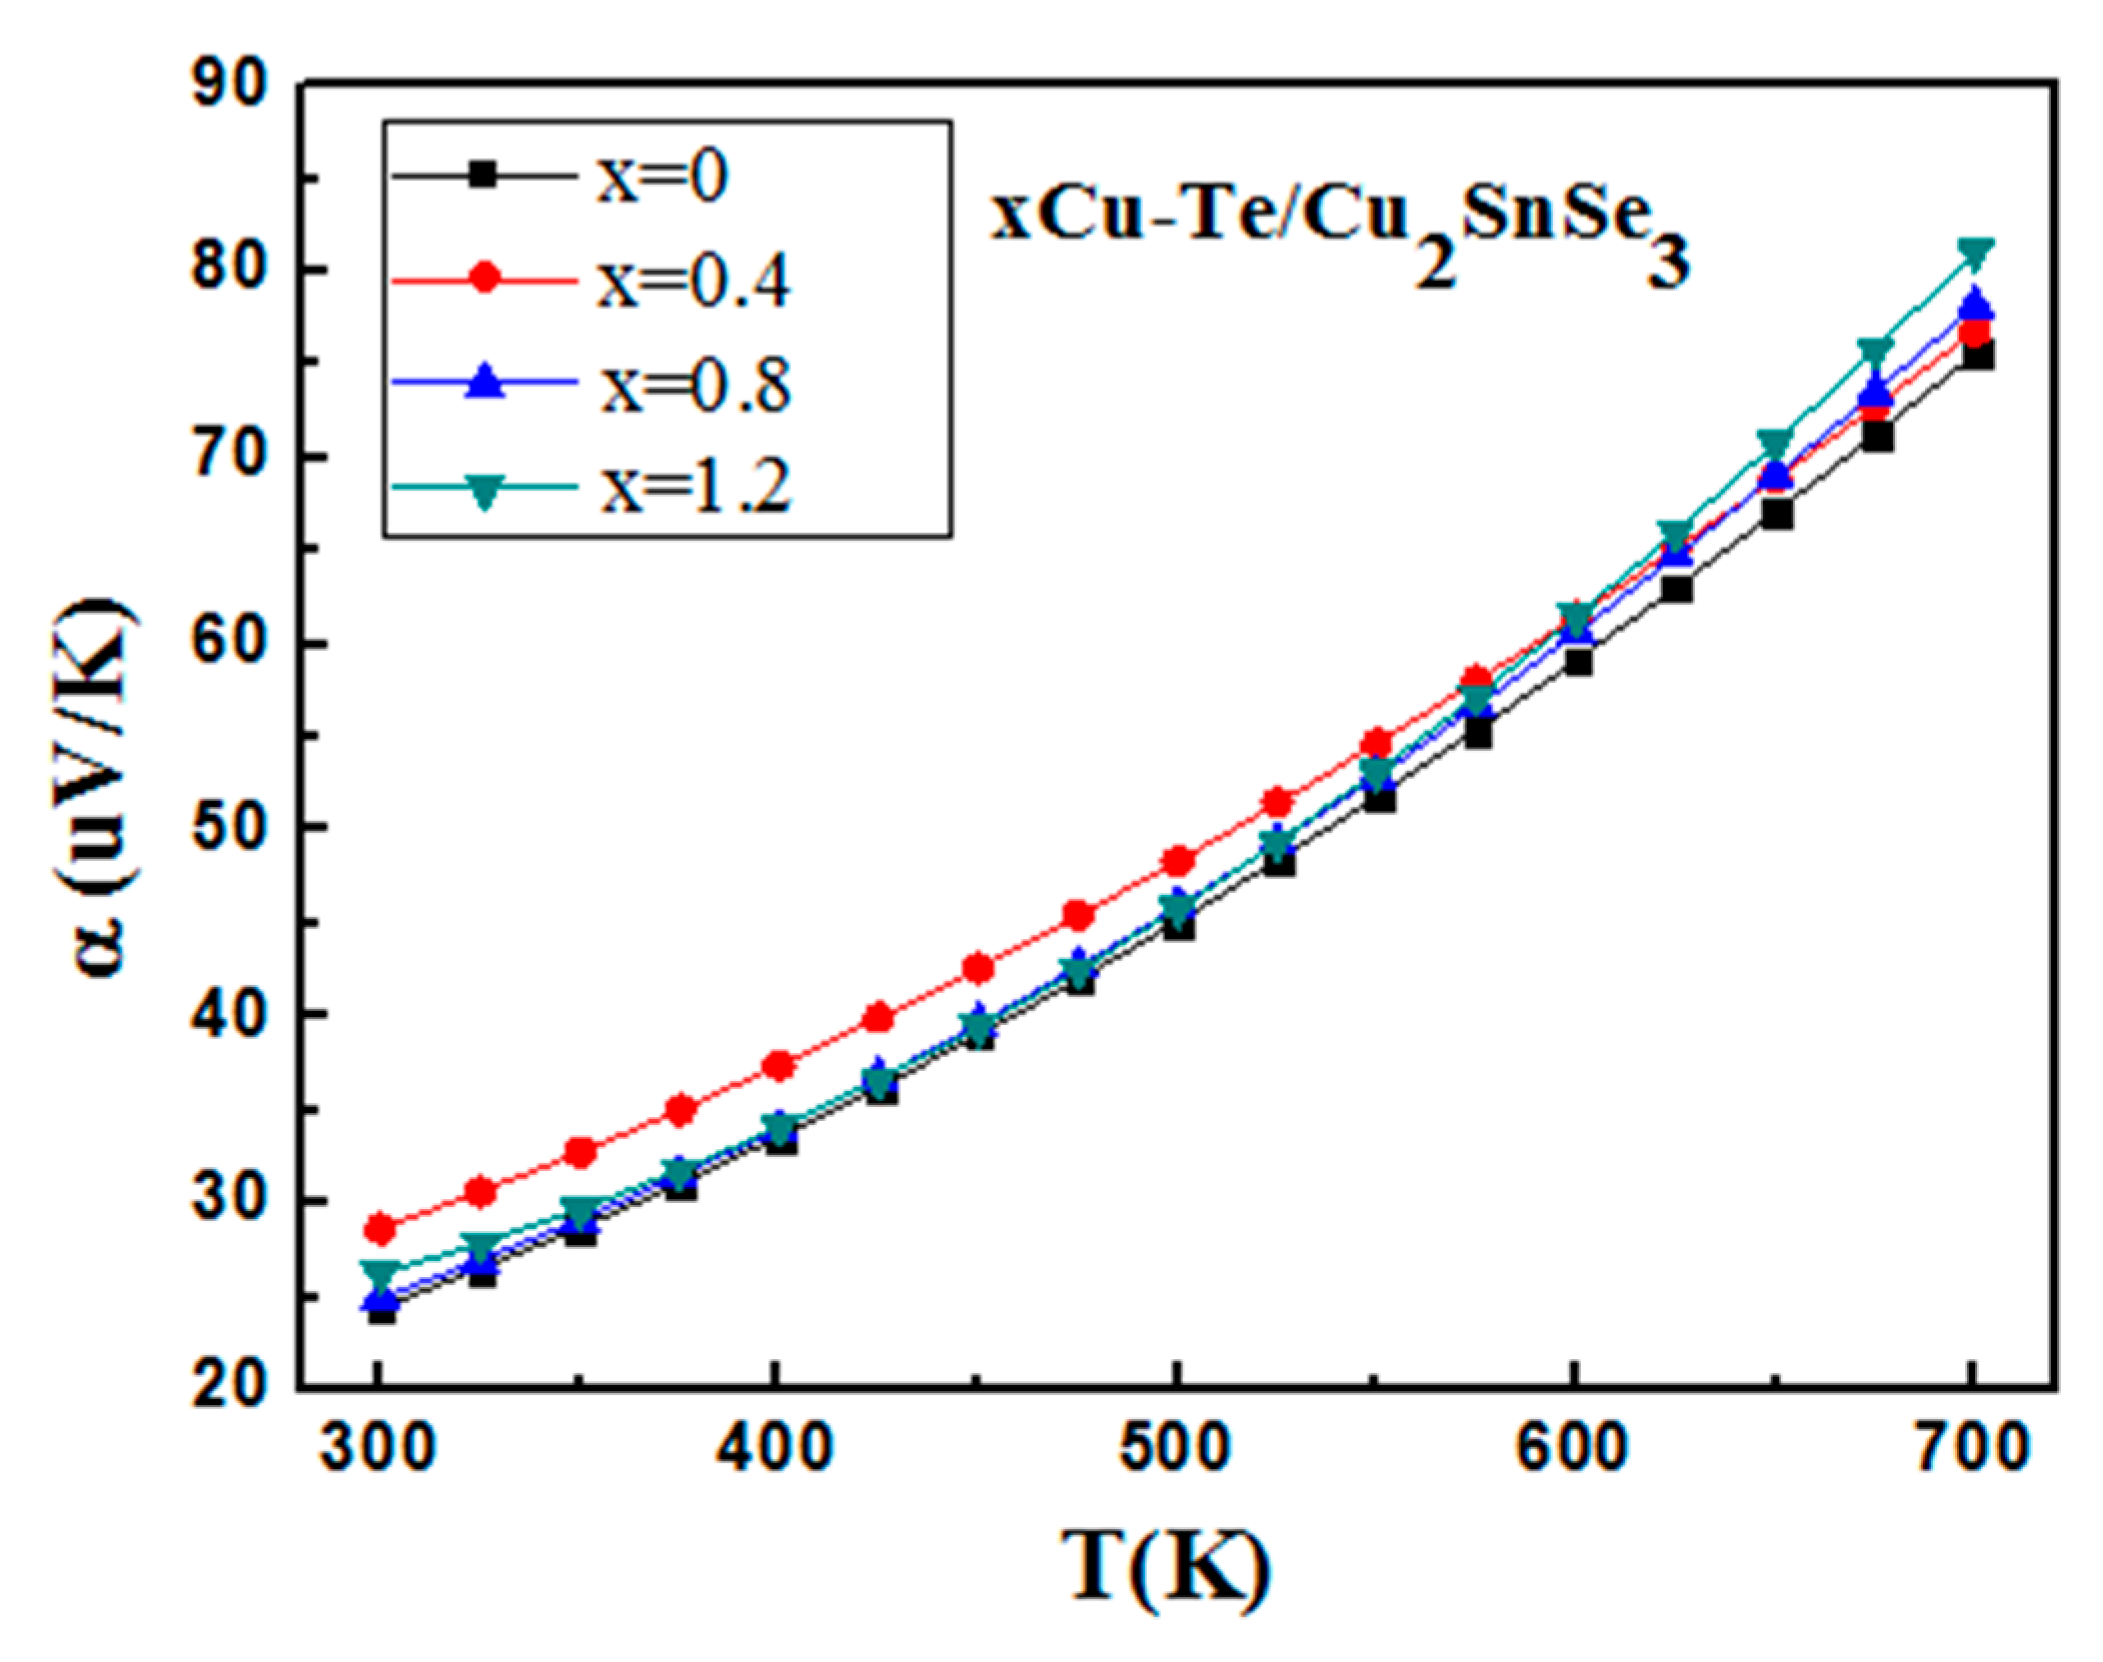
Figure 8.
Temperature dependence of the power factor (PF) of Cu–Te/Cu2SnSe3 composites.
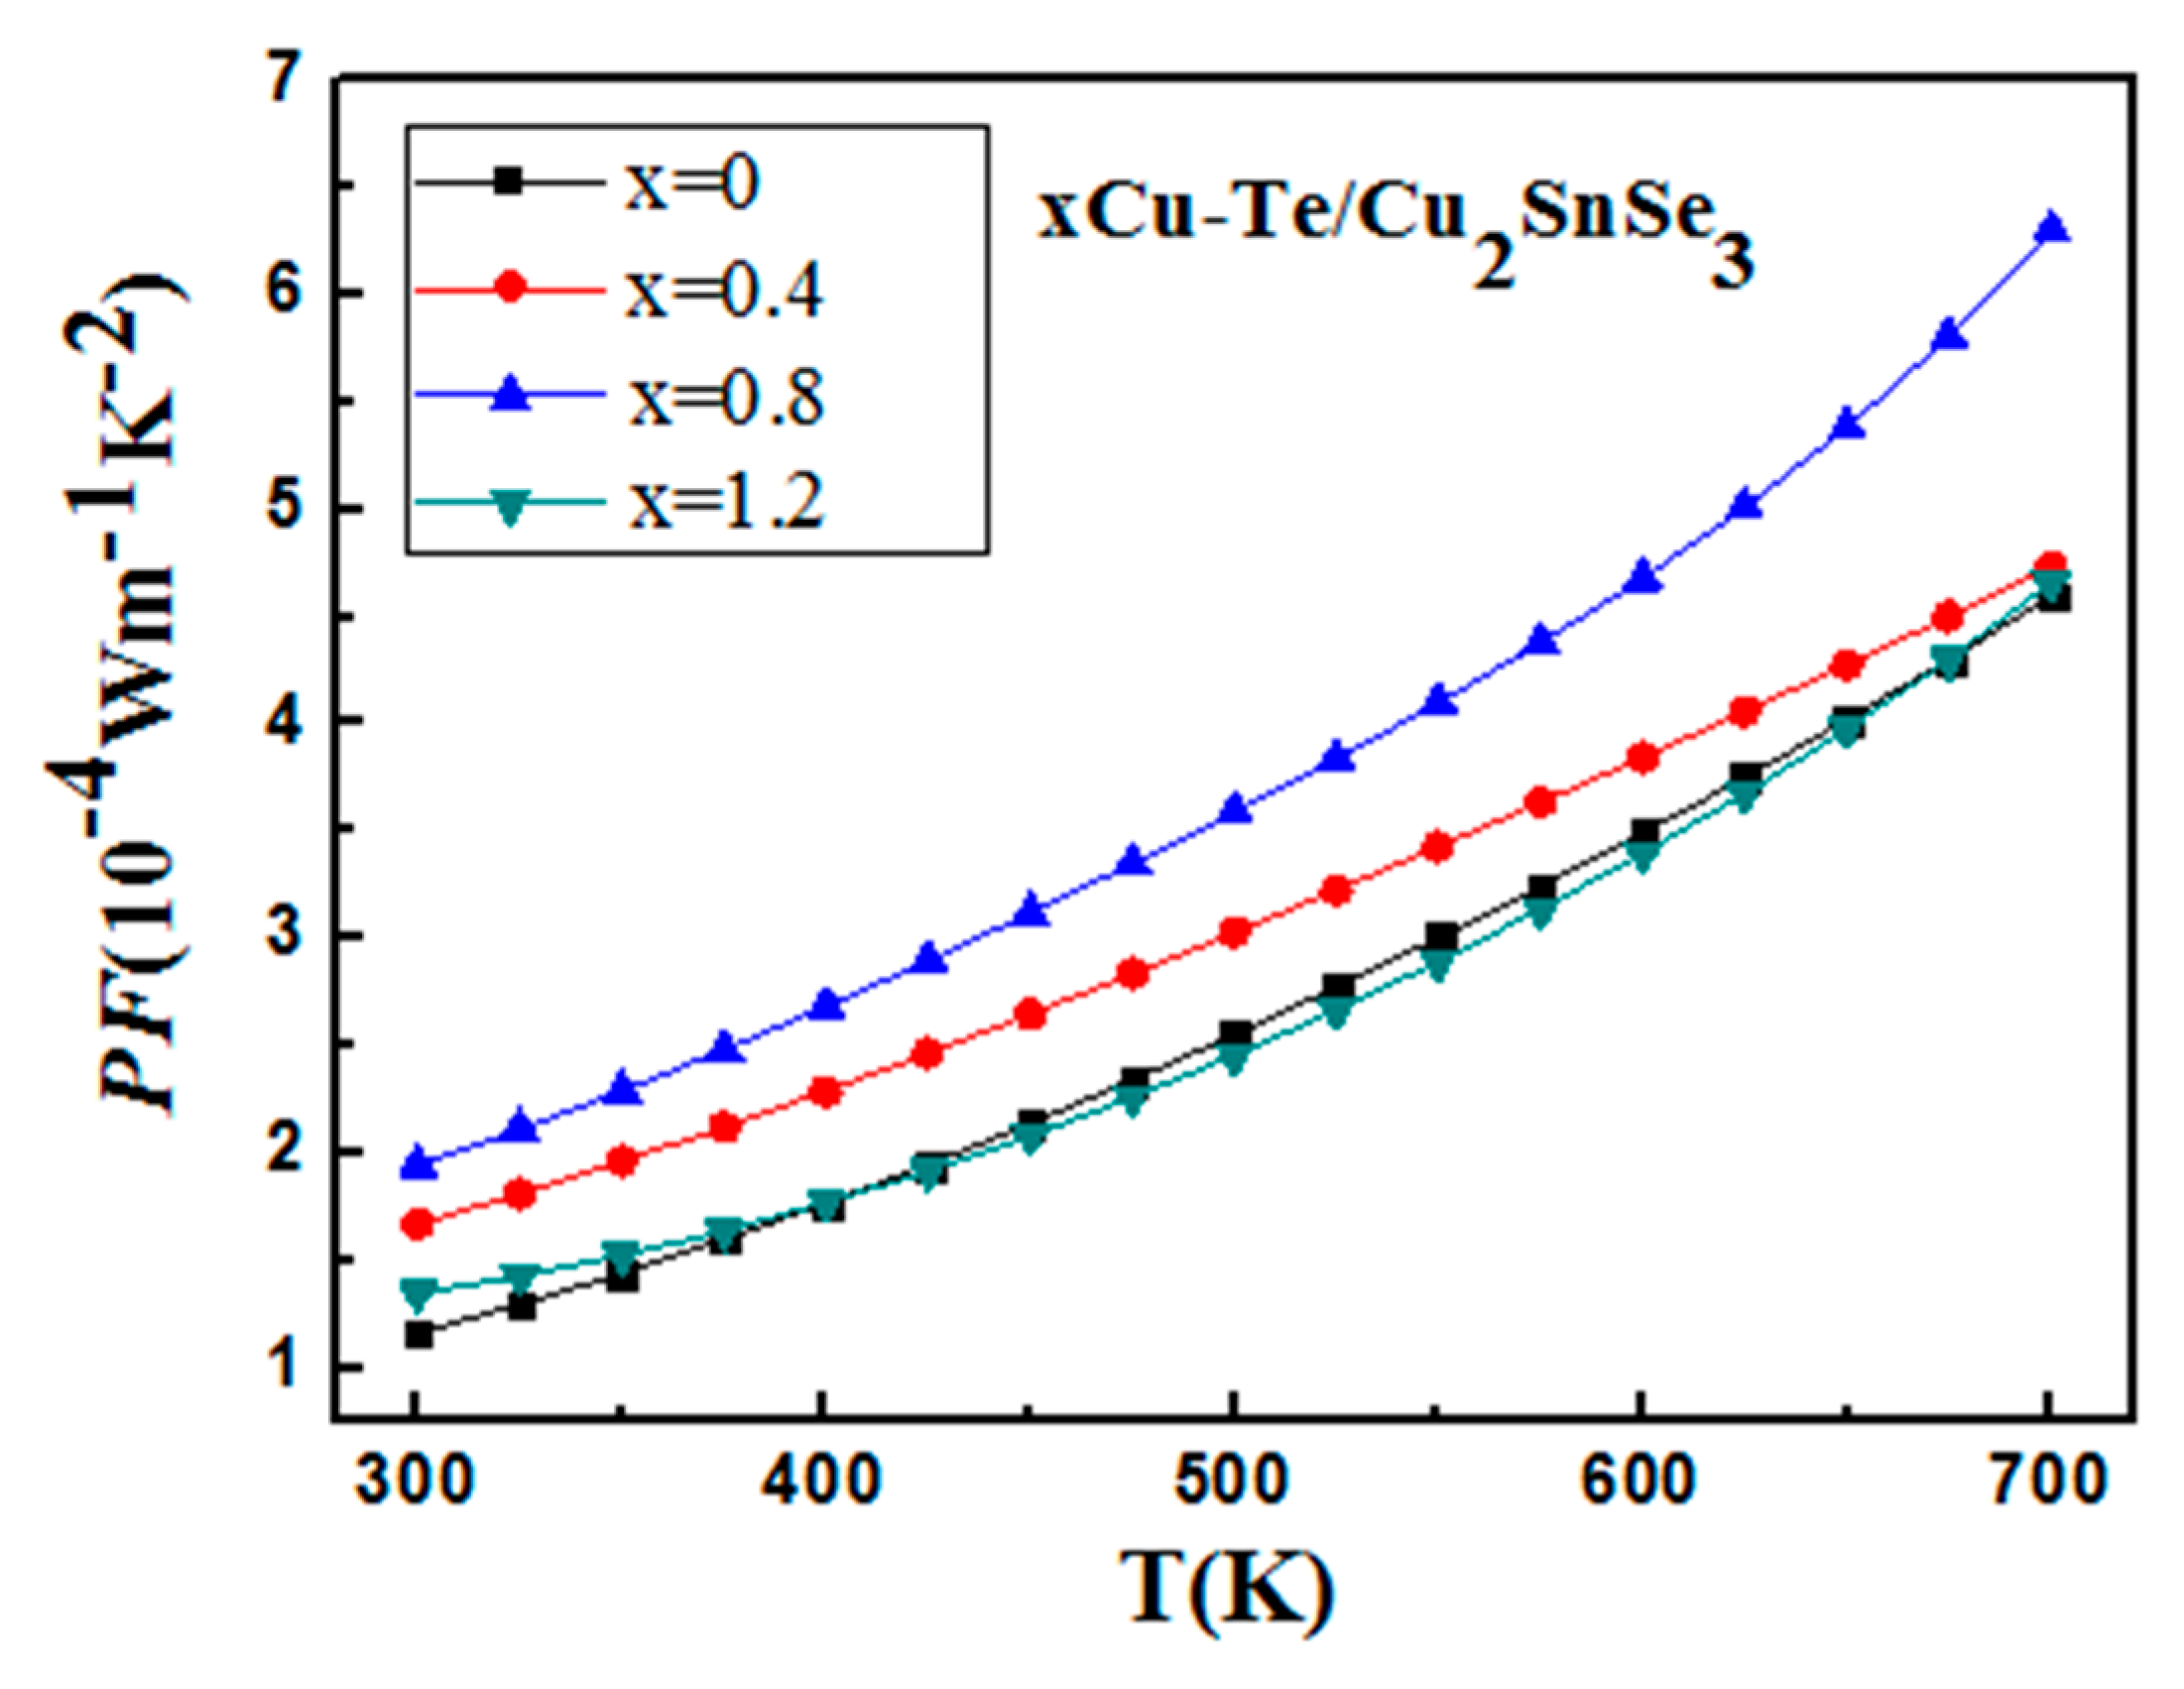
Figure 9.
The temperature dependence of thermal conductivity κ (a) and lattice thermal conductivity κL (b) for Cu–Te/Cu2SnSe3 composites.
Figure 9.
The temperature dependence of thermal conductivity κ (a) and lattice thermal conductivity κL (b) for Cu–Te/Cu2SnSe3 composites.

Figure 10.
The dimensionless figure of merit of (ZT) of Cu–Te/Cu2SnSe3 composites.


Table 1.
Chemical composition and some physical parameters of x vol.% Cu–Te/Cu2SnSe3 composites at room temperature.
Table 1.
Chemical composition and some physical parameters of x vol.% Cu–Te/Cu2SnSe3 composites at room temperature.
| x | Hall Coefficient RH (10−3 cm3/C) | Carrier Concentration n (cm−3) | Carrier Mobility μ (cm2/Vs) | Electrical Conductivity σ (S/cm) | Relative Density |
|---|---|---|---|---|---|
| 0 | 3.368 | 1.866 × 10²¹ | 7.14 | 1.94 × 10³ | 96.2% |
| 0.4 | 3.550 | 1.923 × 10²¹ | 7.21 | 2.04 × 10³ | 95.2% |
| 0.8 | 9.212 | 1.990 × 10²¹ | 9.63 | 2.97 × 10³ | 96.9% |
| 1.2 | 2.257 | 2.291 × 10²¹ | 6.16 | 1.95 × 10³ | 96.3% |
© 2019 by the authors. Licensee MDPI, Basel, Switzerland. This article is an open access article distributed under the terms and conditions of the Creative Commons Attribution (CC BY) license (http://creativecommons.org/licenses/by/4.0/).
Share and Cite
MDPI and ACS Style
Zhao, D.; Wang, L.; Wu, D.; Bo, L. Thermoelectric Properties of Cu2SnSe3-Based Composites Containing Melt-Spun Cu–Te. Metals 2019, 9, 971. https://doi.org/10.3390/met9090971
AMA Style
Zhao D, Wang L, Wu D, Bo L. Thermoelectric Properties of Cu2SnSe3-Based Composites Containing Melt-Spun Cu–Te. Metals. 2019; 9(9):971. https://doi.org/10.3390/met9090971
Chicago/Turabian StyleZhao, Degang, Lin Wang, Di Wu, and Lin Bo. 2019. "Thermoelectric Properties of Cu2SnSe3-Based Composites Containing Melt-Spun Cu–Te" Metals 9, no. 9: 971. https://doi.org/10.3390/met9090971
Note that from the first issue of 2016, this journal uses article numbers instead of page numbers. See further details here.