Article

Investigation on the Quench Sensitivity of 7085 Aluminum Alloy with Different Contents of Main Alloying Elements

1
School of Materials Science and Engineering, Central South University, Changsha 410083, China
2
Guangdong Hoshion Industrial Aluminium Co., Ltd., Zhongshan 528463, China
3
School of Mechanical and Electrical Engineering, Central South University, Changsha 410083, China
*
Author to whom correspondence should be addressed.
Metals 2019, 9(9), 965; https://doi.org/10.3390/met9090965
Submission received: 27 June 2019 / Revised: 22 August 2019 / Accepted: 27 August 2019 / Published: 2 September 2019

Abstract

:
The quench sensitivity of 7085 aluminum alloy with different contents of the main alloying elements (Zn, Mg and Cu) was investigated using time-temperature-transformation (TTT) curves and end quenching experiments. Then, the quenching microstructure was analyzed using transmission electron microscopy. With increasing the contents of the main alloying elements, the transitions and nose temperatures of the TTT curves are obviously increased, while the incubation time of 0.5% η (MgZn2) phase precipitation content is decreased. In addition, as the contents of the main alloying elements decrease, the conductivity of the quenched samples is increased, but the hardness of the quenched samples is decreased. Moreover, the size and area fraction of the η phase are increased with increasing the contents of the main alloying elements. Based on the experimental results, the increase of Mg and Cu contents can decrease the stability of supersaturated solid solution and increase the lattice distortion energy, which can increase the quench sensitivity of 7085 aluminum alloy.

1. Introduction

Due to its low density, high strength, good toughness and excellent corrosion resistance, Al-Zn-Mg-Cu alloy has been widely used in the aerospace industry [1,2]. With the development of large-scale and integrated aircraft structural parts, high-performance aluminum alloy forgings and plates with excessive thickness are urgently needed [3]. Generally, the performance of aerospace super thick parts is mainly determined by the quench sensitivity of aluminum alloy [4,5]. Especially, 7085 aluminum alloy has been widely used to manufacture super thick plates and forgings with large sections, and its quench sensitivity can weaken the performance of 7085 aluminum alloy along the thickness [6]. The quench sensitivity of 7085 aluminum alloy is affected by the main alloying elements. Therefore, it is meaningful to investigate the effects of the main alloying elements on the quench sensitivity of 7085 aluminum alloy, which can provide the theorical basic for manufacturing high performance 7085 aluminum alloy plates.
In the last decades, the quench sensitivity of aluminum alloys has been widely investigated. The quench factor analysis (QFA) was developed by Evancho and Staley to model and quantify the quench sensitivity of alloys [7]. Based on the Evancho-Staley model, Tiryakioğlu and Shuey improved the traditional QFA method and developed high-accuracy quench models for Al-7 pct Si-0.6 pct Mg alloy, aluminum alloy 2024, 2219-T87 aluminum alloy and 7010 aluminum alloy [8,9,10,11]. Generally, the quench sensitivity of aluminum alloy is increased with increasing the contents of the main alloying elements (Zn, Mg and Cu). Bryant et al. [12] found that Zn, Mg and Cu elements have a significant influence on the quench sensitivity of aluminum alloy. Tang et al. [13] found that the influence order of the alloying elements (Zn, Mg and Cu) on the quench sensitivity of Al-Zn-Mg-Cu alloy can be described as Cu > Mg > Zn, and appropriately reducing the Cu content and increasing the Zn/Mg ratio can significantly reduce the quench sensitivity of Al-Zn-Mg-Cu alloy. In addition, Liu et al. [14] observed that the Mg element has the most significant effect on quench sensitivity of Al-Zn-Mg-Cu alloy compared to Zn and Cu elements. Moreover, Lim et al. [15] found that the quench sensitivity of 7175 aluminum alloy is significantly decreased with decreasing the total contents of Cu-Mg and increasing the Zn/Mg ratio. Therefore, the effect of the main alloying elements contents on the quench sensitivity of aluminum alloy is very complex.
The 7085 aluminum alloy, as a typical Al-Zn-Mg-Cu alloy, was firstly developed by the Alcoa company in 2003 [4]. Due to the advantages of ultra-high strength, excellent fatigue resistance and good hardenability, the 7085 aluminum alloy has been widely utilized to manufacture aerospace parts. In recent years, some research focused on the effect of Zn, Mg and Cu alloying elements on the quench sensitivity of 7085 aluminum alloy has been reported. Deng et al. [16] studied the effect of Mg element on the quench sensitivity of 7085 aluminum alloy using a terminal quenching experiment, and the results show that when the contents of Mg element are 1.0%, 1.4%, and 2.0%, the hardening depths are 100, 65, and 40 mm, respectively. Ouyang [17] systematically investigated the influence of Zn/Mg ratio on the quench sensitivity of 7085 aluminum alloy and found that the influence of Zn/Mg ratio on quench sensitivity is significant. Wang [18] observed that the high content of Cu element can increase the quench sensitivity of 7085 aluminum alloy. In addition, Nie et al. [19] investigated the effect of compositions on the quench sensitivity of 7050 and 7085 aluminum alloys, and they found that the increase in the Zn/Mg ratio and the decrease in Cu element cause the α phase region to expand, thereby reducing the quench sensitivity of 7085 aluminum alloy. Furthermore, Chen et al. [20] found that the higher Cu content leads to higher quench sensitivity in Al-Zn-Mg-Cu alloys with the same content of Zn, Mg, and other trace elements. Moreover, the effect of alloying elements on the quench sensitivity, microstructure and mechanical properties of 7085 aluminum alloy has been deeply investigated [21,22,23,24]. However, only the effect of a single alloying element or Zn/Mg ratio on the quench sensitivity of 7085 aluminum alloy has been studied and reported. Therefore, it is meaningful and necessary to investigate the comprehensive influence of the main alloying elements’ (Zn, Mg and Cu) contents on the quench sensitivity of 7085 aluminum alloy.
In this paper, the cubic end quenched tests of 7085 aluminum alloy with different contents of main alloying elements (Zn, Mg and Cu) are conducted to quantitatively and qualitatively investigate the quench sensitivity of the studied alloy from the perspective of lattice distortion. The time-temperature-transformation (TTT) curves are calculated to investigate the effects of the content of the main alloying elements on the incubation time of 0.5% η (MgZn2) phase precipitation contents, the transitions and nose temperatures. Then, the effects of the content of main alloying elements on conductivity, hardness and η phase are presented. Finally, the effects of the content of the main alloying elements on the quench sensitivity of 7085 aluminum alloy are analyzed.

2. Material and Experiments

The material used in the present research is a three-component 7085 aluminum alloy hot-rolled slab. The chemical compositions of the studied alloy are shown in Table 1. The TTT curves of 7085 aluminum alloy with different contents of main alloying elements (Zn, Mg and Cu) were calculated using JmatPro software (Version 8. 0, Sente Software Ltd., Surrey, United Kingdom). The cubic end quenched (CEQ) samples with the dimensions of 25 mm × 25 mm × 125 mm were cut along the rolling direction in the surface layer of the hot rolled sheet. One end surface of the CEQ samples is the water-cooling end, and the other surface is the fixed end. For the water-cooling end of the sample, a circular hole ( Φ 20   mm × 10   mm ) was machined. For the fixed end of the sample, a M5 mm threaded hole with 15 mm depth was manufactured. The samples were kept at 470 °C with 1 h for solution treatment, and then cooled in the end quenching device. As the water-cooling was finished, the specimens were aged at 120 °C for 24 h in an oil bath furnace.
The conductivity and hardness of the quenched samples were analyzed. For the conductivity tests, the plates with the dimension of 25 mm × 25 mm × 2 mm were cut from the water-cooling end to the fixed end of the CEQ samples at intervals of 10 mm. Then, the plates were mechanically grinded and polished. For the hardness tests, the samples were manufactured along the central axis, and the surfaces were grinded and polished.
In order to quantitatively determine the cooling rate, five thermo-couples were put in the holes (Φ3 mm) machined using an electric drill at distances of 3, 23, 53, 78 and 98 mm from the water-cooling end. It was found that the average values of cooling rate at 3, 23, 53, 78 and 98 mm from the water-cooling end were 1048, 526, 152, 132 and 129 °C/min, respectively. In addition, the variations of microstructure under different cooling rates were analyzed using transmission electron microscopy (TEM). A TECNAI G2 F20 electron microscope (FEI Co., Hillsboro, OR, USA) was used in the TEM analysis, and the working voltage was set as 200 kV. For the TEM observation, several sections, which were cut from the water-cooled specimens, were grinded to a thickness of 0.08 mm and punched into disks (Φ3 mm). Then, the disks were electro-polished in a solution (40 mL HNO3 and 160 mL CH3OH). The representative TEM images were randomly selected from the interior of the grain. The size and area fraction of η phase were evaluated from at least 100 TEM images using the Image-J software (Version 1.43, National Institutes of Health, New York, NY, USA). It should be noted that the η phase size was evaluated along a lengthwise direction, and the area fraction of η phase was identified by the chromatic aberration between the back of the TEM image and η phase.

3. Results

3.1. TTT and Continuous-Cooling-Transformation (CCT) Curves

Based on the experimental results, it is found that η (MgZn2) phase is the main precipitated phase, however, other phases are rarely precipitated. So, only the TTT and CCT curves of η (MgZn2) phase for 7085 aluminum alloy with different contents of main alloying elements are calculated using JMatPro software in this research. As shown in Figure 1a, the TTT curves are calculated according to the model developed by Kirkalday and co-workers [25]. This model, which combines the theoretical and empirical data, can reasonably and accurately evaluate the TTT curves. In addition, the non-isokinetic and unstable factors are considered in this model. This is because the kinetic and thermodynamic models are combined in this model, which can effectively evaluate the information in the non-isokinetic and unstable conditions. From Figure 1b, the CCT curves shift to the left with increasing the contents of the main alloying elements, which implies that the precipitated behaviors of η (MgZn2) phase are sensitive to the contents of the main alloying elements. Using statistical analysis, the transitions temperature, nose temperature and the incubation time of 0.5% η (MgZn2) phase precipitation contents are statistically identified, as shown in Table 2. It is found that the transitions and nose temperatures are evaluated as 404.1 and 331.4 °C, respectively, when the content of the main alloying elements is 10%. Meanwhile, the incubation time of 0.5% η (MgZn2) phase precipitation content is evaluated as 1427 s. As the content of the main alloying elements is increased, the transitions and nose temperatures are significantly increased, while the incubation time of 0.5% η (MgZn2) phase precipitation content is decreased.

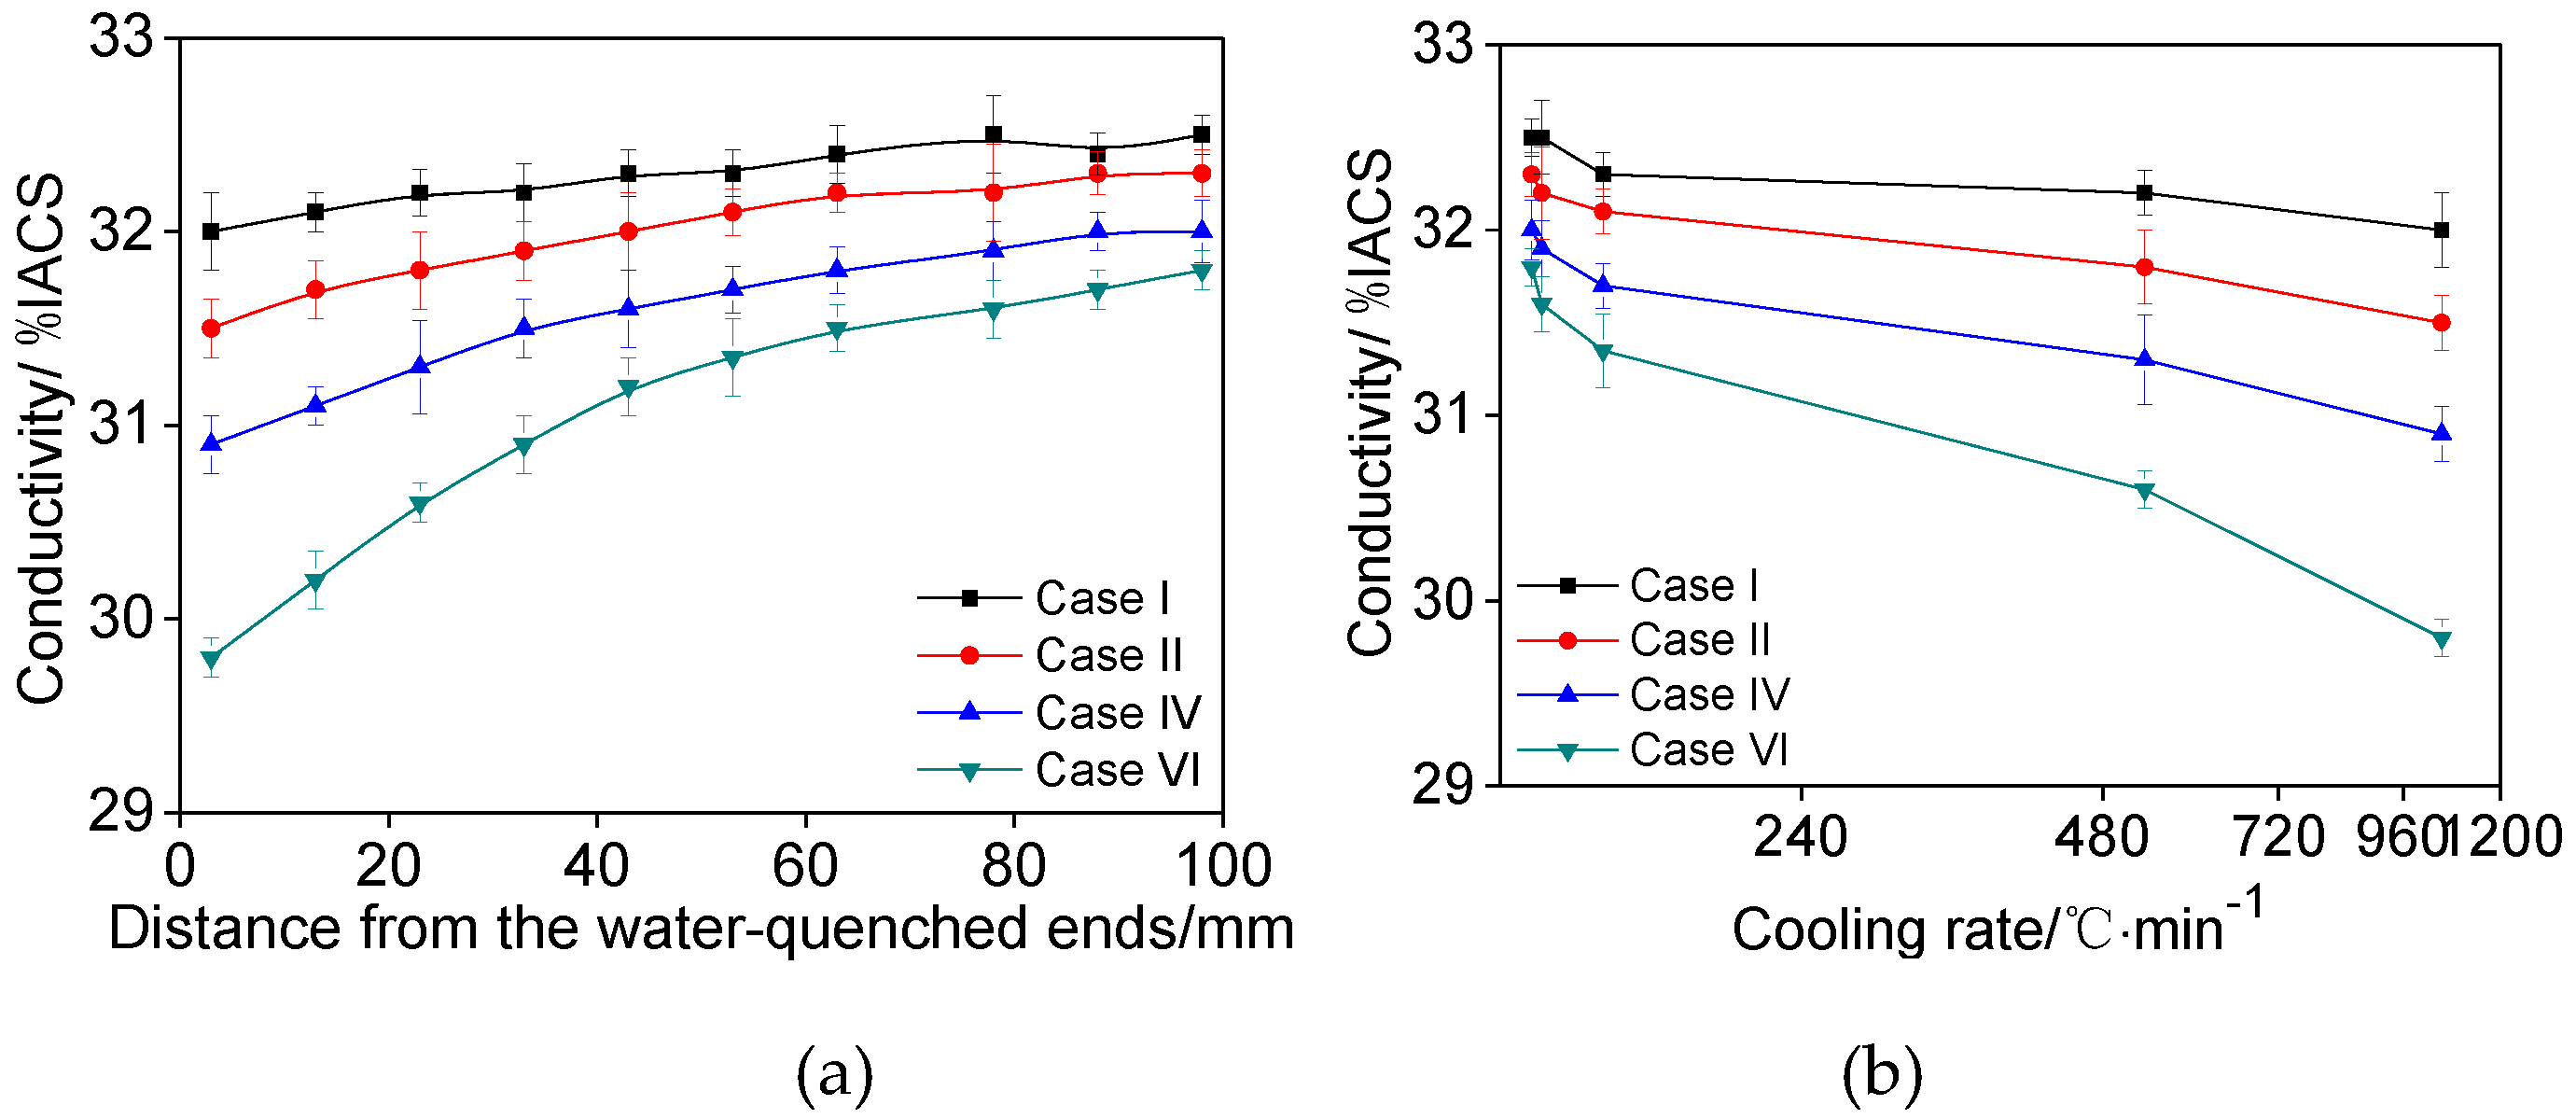
3.2. Effects of Main Alloying Elements Content on Conductivity

As shown in the TTT results in Figure 1, the evolution of conductivity in 7085 aluminum alloys under four different contents of main alloying elements are investigated. The variation of conductivity vs. distance from the water-quenching ends and cooling rate is shown in Figure 2. From Figure 2a, it is observed that not only the distance from the water-cooled ends but also the content of the main alloying elements can abruptly affect the conductivity of the studied alloy. At the given distance from the water-cooled ends, the conductivity is increased with decreasing the content of the main alloying elements. In addition, the conductivity is distinctly increased with increasing the distance from the water-cooled ends. For Case I (the content of main alloying elements is 10%), the conductivity increases from 32 to 32.5 %IACS as the distance from the water-cooled ends is raised from 3 to 98 mm. When the content of main alloying elements is 11.3%, the conductivity increases from 29.8 to 31.8 %IACS as the distance from the water-cooled ends is raised from 3 to 98 mm. For Cases I, II, IV and VI, the differences of conductivity between the two ends of the studied alloy are 0.5, 0.8, 1.1 and 2.0 %IACS, respectively. The difference of conductivity between the two ends is the smallest in Case I, which indicates that the studied alloy under the main alloying elements content of 10% has the lowest quench sensitivity. Moreover, the conductivity is decreased with increasing cooling rate, as shown in Figure 2b. Because the cooling rate is increased with decreasing the distance from the water-quenching ends, the variation of conductivity vs. cooling rate is consistent with that vs. distance from the water-quenching ends.

3.3. Effects of Main Alloying Elements Content on Hardness

Figure 3 shows the relationships of hardness and hardness relative values vs. distance from the water-quenching ends. It can be seen that the hardness gradually decreases with the increase of distance from the quenching end. Meanwhile, the variation of hardness is sensitive to the content of the main alloying elements. For Case VI (the content of main alloying elements is 11.3%), the hardness sharply decreases with increasing the end distance to 80 mm, and then slowly decreases, as shown in Figure 3a. For Cases I, II and IV, the hardness slightly varies when the end distance exceeds 60 mm. Obviously, the hardness of Case VI is the highest. This is because the contents of Mg and Cu elements of Case VI are the highest in this research. Generally, increasing the content of Mg element can improve the number of strengthening phase, and increasing the content of Cu element is also beneficial for the aging strengthening, which can improve the hardness of the studied alloy. In order to further investigate the hardness variation of four kinds of 7085 aluminum alloys, the hardness retention values, hardness retention percentages and terminal distance curves of the four alloys were obtained by processing the curves of the four alloys, as shown in Figure 3b. The hardness reductions of the two ends for Cases VI, IV, II and I are 12.5%, 8.6%, 5.8% and 4%, respectively. This is because Mg and Cu are quench sensitivity elements and can decrease the stability of solid solution. The equilibrium phase is easy to precipitate with decreasing the quenching rate, so the number of the strengthening phase is reduced, which can result in the steepest drop of hardness for Case VI. Generally, the end distance at the hardness drop of 10% is defined as the depth of the hardened layer. Thus, the depth of the hardened layer for Case VI (the content of main alloying elements is 11.3%) is 60 mm, and the others are all over 100 mm. Therefore, the 7085 aluminum alloy with 11.3% content of the main alloying elements has the highest quench sensitivity, while the 7085 aluminum alloy with 10% content of the main alloying elements has the lowest quench sensitivity.

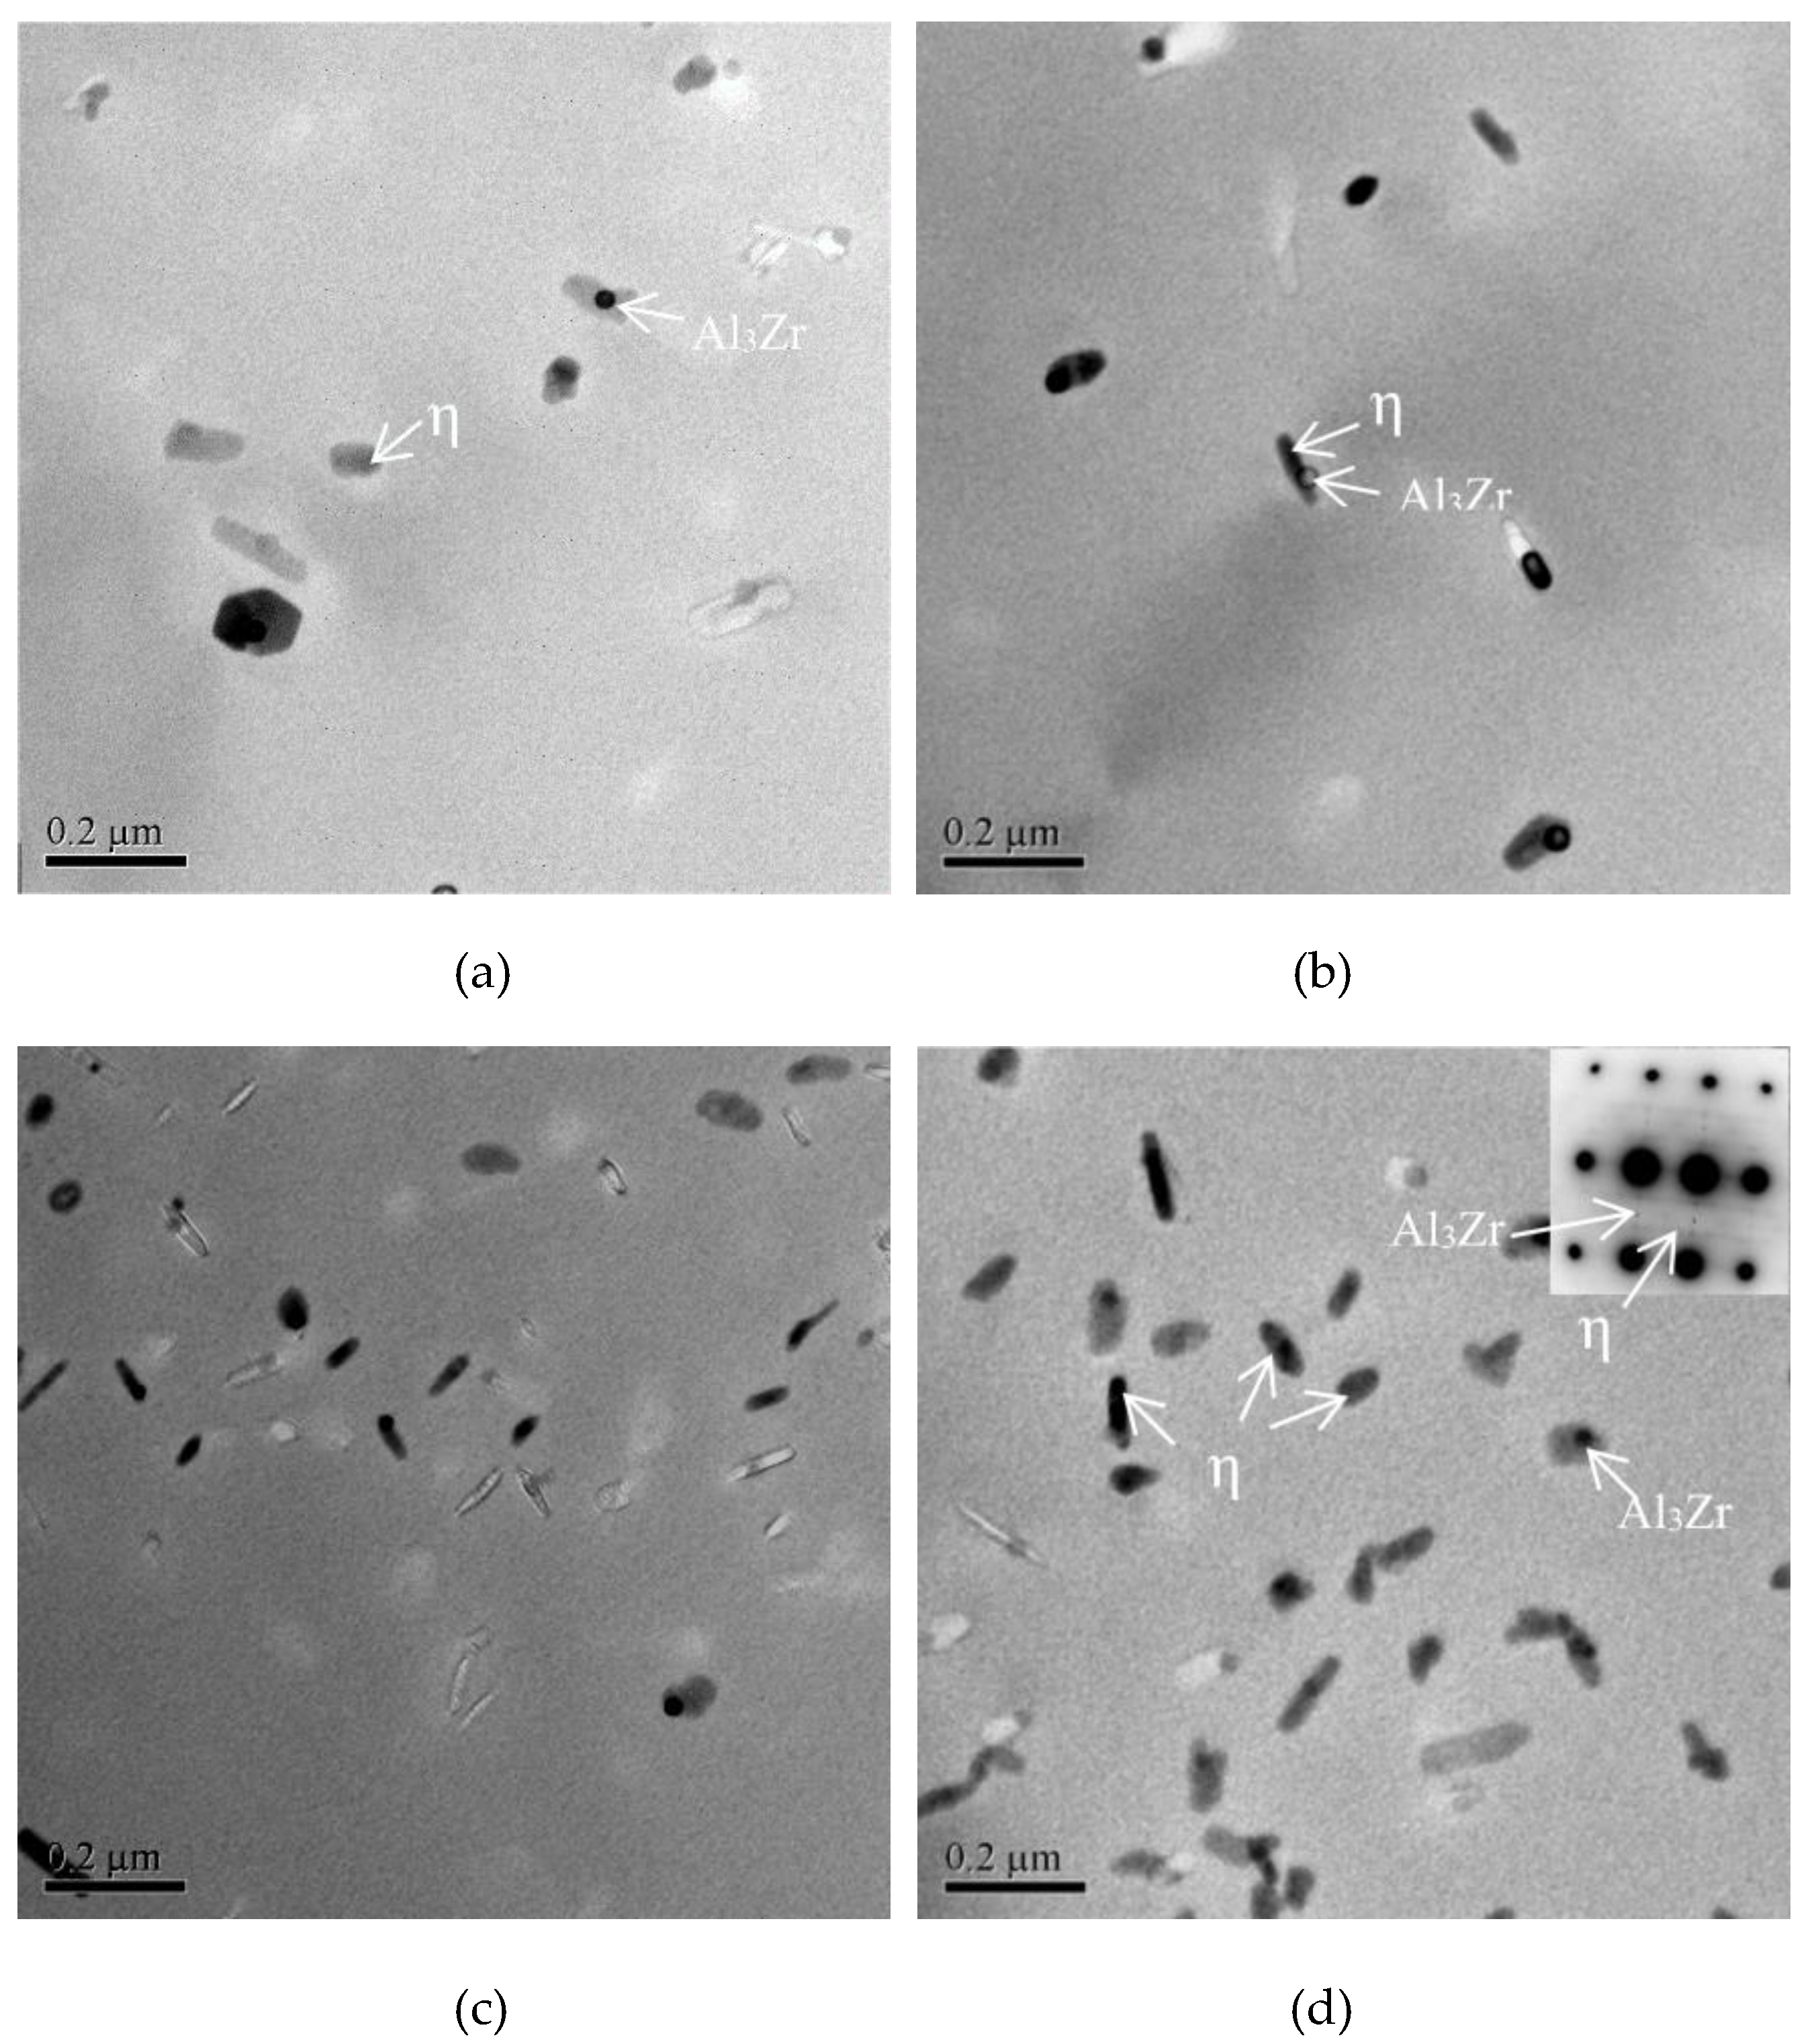
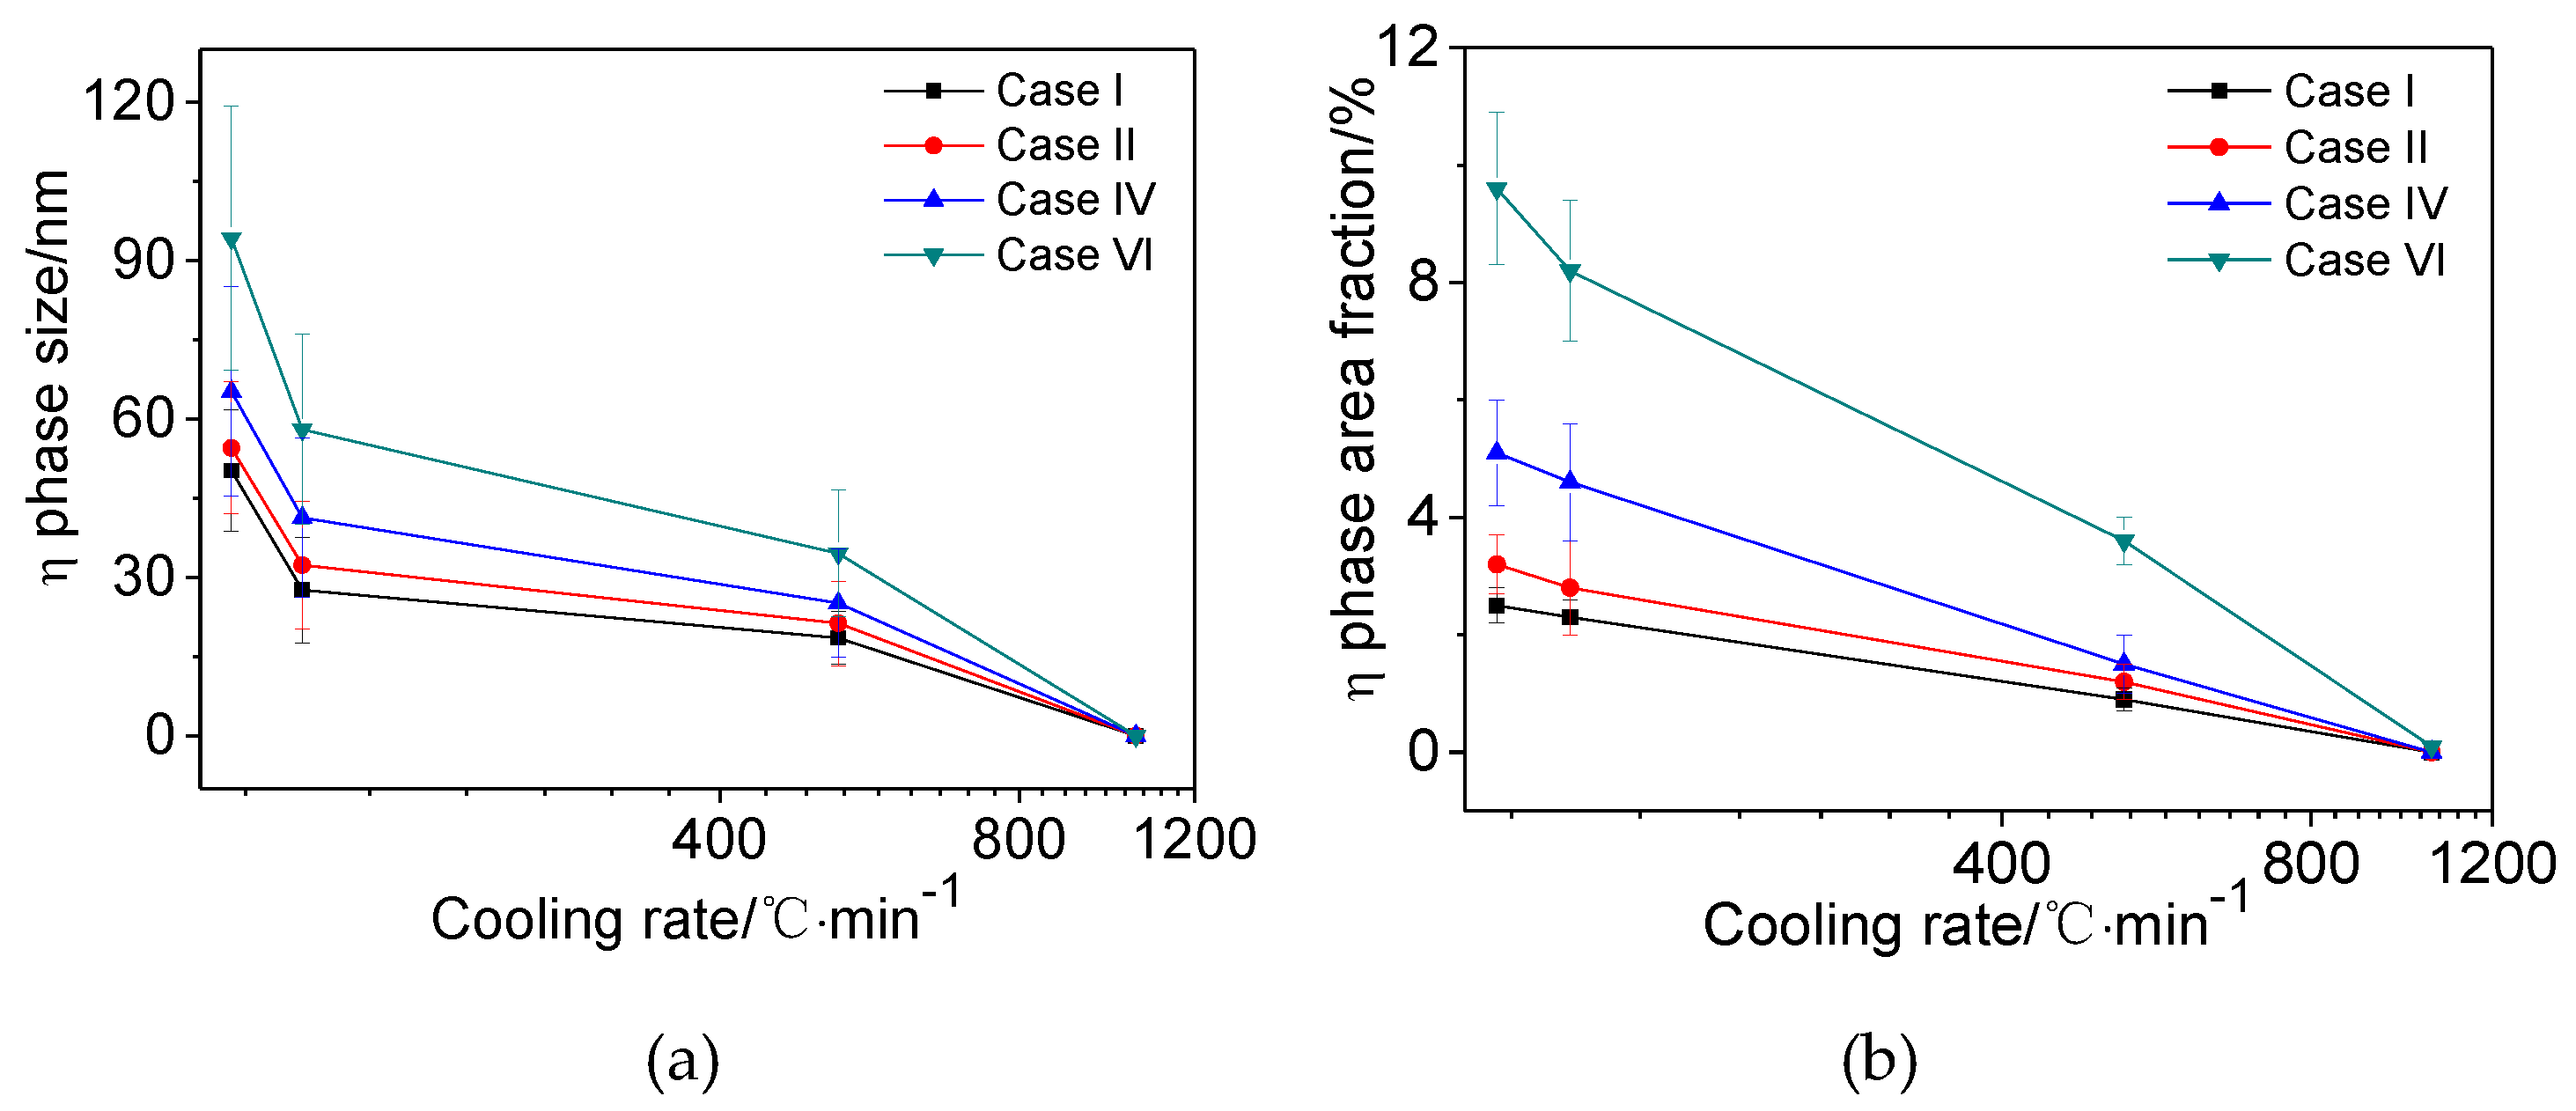
3.4. Effects of Main Alloying Elements Content on η Phase

Figure 4 shows the TEM images of the studied alloys under different contents of the main alloying elements. Here, the cooling rate is 129 °C/min. Obviously, the long bar of quenching is precipitated with the Al3Zr particles as the core of nucleation. Meanwhile, from the <112> SADP, it can be seen that the precipitated phase is η (MgZn2) phase. In addition, the η phase precipitated by quenching can be observed in the three alloy crystals. The η phase sizes of Cases I, II, IV and VI are 100, 120, 160 and 200 nm, respectively, and the η phase area fractions of Cases I, II, IV and VI are 2.5%, 3.2%, 5.1% and 9.6%, respectively. Thus, the size and area fraction of η phase are increased with increasing the content of the main alloying elements, which implies that the 7085 aluminum alloy with a high content of the main alloying elements has high quench sensitivity.
Figure 5 shows the relationship of the size and area fraction of η phase vs. cooling rate. Obviously, the size and area fraction of η phase are decreased with the increase of cooling rate for the studied alloys. Furthermore, the quench sensitivity of the studied alloys is decreased with the increase of cooling rate. This is because the precipitation of η phase consumes a large number of solute atoms when the cooling rate is low. Thus, the solute and vacancy concentration in the aluminum matrix are decreased, which reduces the precipitation of the aging strengthening phase to decrease the hardness of the studied alloys.

4. Discussion

Normally, the quench sensitivity of 7085 aluminum alloy is mainly controlled by the stability of supersaturated solid solution. During quenching, the precipitation phase and decline degree of aging strength are decreased with increasing the stability of supersaturated solid solution, which leads to the low quench sensitivity of 7085 aluminum alloy [26,27,28,29]. Generally, the stability of supersaturated solid solution is reflected by the synthesis of multiple field energies. For the studied 7085 aluminum alloy, the atomic radii of solute atoms (Zn, Mg and Cu) are different from that of an Al atom, which can induce different stress fields in quenching to generate a lot of vacancies and dislocations. The electronegativity of the Zn, Mg and Cu in the Al matrix is shown in Table 3. Obviously, the electronegativity of Zn is similar to that of Al. However, the difference between the electronegativity of Mg/Cu and Al is large. The narrow difference of the electronegativity between alloy elements can reduce the chemical affinity of atoms, which can effectively promote the stability of supersaturated solid solution [21,30]. Thus, the increase of Mg and Cu content can decrease the stability of supersaturated solid solution and increase the quench sensitivity of 7085 aluminum alloy.
In order to evaluate the solid solution distortion of 7085 aluminum alloys, there is an assumption that the solid solution distortion is caused by the difference of radii of Zn, Mg and Cu and Al atoms. Because the main alloying elements (Zn, Mg and Cu) are dissolved in the Al matrix, the Zn, Mg and Cu atoms replace the position of the Al atom, which results in the expansion or contraction of the Al matrix lattice. The variation of the Al matrix lattice produces lattice distortion energy, which can be calculated as [31].
ε = 8 π G r 1 3 ( r 2 r 1 r 2 ) 2
where G represents the shear modulus of Al atom, r1 is the atomic radius of the main alloying element and r2 is the atomic radius of the Al atom.
In this research, the quench sensitivity of 7085 aluminum alloy is characterized by the differences of conductivity and hardness between the two ends of the quenched samples. In order to quantitatively measure the quench sensitivity induced by different alloying elements, the differences of conductivity and hardness between the two ends of the quenched samples can be expressed as
Δ C = C 129 C 1048
Δ H = H 1048 H 129 H 1048 × 100 %
where Δ C and Δ H represent the differences of conductivity and hardness between the two ends of the quenched samples. C 1048 and H 1048 represent the conductivity and hardness at the cooling rate of 1048 °C/min, respectively. C 129 and H 129 represent the conductivity and hardness at the cooling rate of 129 °C/min, respectively.
The lattice distortion energy of Zn, Mg and Cu atoms can be evaluated as shown in Table 4. Obviously, for the 7085 aluminum alloy, the lattice distortion energy of Zn, Mg and Cu atoms in an Al matrix can be sequenced as Mg > Cu > Zn. Meanwhile, the lattice distortion energy decreases with decreasing the contents of Mg and Cu. The increase of lattice distortion energy results in the increase of the free energy of the 7085 aluminum alloy system, which can increase the driving force of the decomposition of solid solution and shorten the precipitation incubation period. In addition, both the size and number of η phase significantly increase with decreasing the cooling rate, which can induce the serious desolation and precipitation. Then, the differences of conductivity and hardness between the two ends of the quenched samples distinctly increase, as shown in Table 5, which can increase the quench sensitivity of 7085 aluminum alloy.

5. Conclusions

In this investigation, the quench sensitivity of 7085 aluminum alloy with different contents of main alloying elements (Zn, Mg and Cu) are analyzed. Some essential conclusions can be summarized as follow:
(1) As the content of main alloying elements is increased, the transitions and nose temperatures are significantly increased, while the incubation time of 0.5% η (MgZn2) phase precipitation contents is decreased from 1427.0 to 660.8 s.
(2) As the content of main alloying elements is increased from 10% to 11.3%, the difference of conductivity between two ends of the studied alloy is increased from 0.5 to 2.0 %IACS, and the difference of hardness between two ends of the studied alloy is increased from 4% to 12.5%, which indicates that the quench sensitivity of 7085 aluminum alloy is increased with increasing the content of the main alloying elements.
(3) When the cooling rate is 129 °C/min, the size of η phase is increased from 50.2 to 94.2 nm, and the area fraction of η phase is increased from 2.5% to 9.6% with increasing the contents of the main alloying elements.
(4) As the contents of Mg and Cu increase, the stability of supersaturated solid solution is decreased, but the lattice distortion energy is increased from 65.558 to 95.854, which can increase the quench sensitivity of 7085 aluminum alloy.

Author Contributions

Conceptualization, D.C.; methodology, C.L. and D.C.; validation, C.L. formal analysis, C.L. and D.C.; writing—original draft preparation, C.L. and D.C.; writing—review and editing, D.C.

Funding

This research received no external funding.

Acknowledgments

This work was supported by the Post-doctoral Research Mobile Station of Materials Science and Engineering in Central South University.

Conflicts of Interest

The authors declare no conflict of interest.

References

  1. Yang, D.; Miao, J.; Zhang, F.; Fu, Z.; Liu, Y. Effects of prebending radii on microstructure and fatigue performance of Al-Zn-Mg-Cu aluminum alloy after creep age forming. Metals 2019, 9, 630. [Google Scholar] [CrossRef]
  2. Kolb, G.K.; Scheiber, S.; Antrekowitsch, H.; Uggowitzer, P.J.; Pöschmann, D.; Pogatscher, S. differential scanning calorimetry and thermodynamic predictions—A comparative study of Al-Zn-Mg-Cu alloys. Metals 2016, 6, 180. [Google Scholar] [CrossRef]
  3. Li, C.B.; Liu, S.D.; Zhang, X.M. Effect of Zener-Hollomon parameter on quench sensitivity of 7085 aluminum alloy. J. Alloys Compd. 2016, 688, 456–462. [Google Scholar] [CrossRef]
  4. Xiong, B.Q.; Li, X.W.; Zhang, Y.A. Development of 7 XXX series aluminum alloy with high strength high toughness and low quench sensitivity. Mater. China 2014, 33, 114–119. [Google Scholar]
  5. Chakrabarti, D.J.; Liu, J.; Sawtell, R.R.; Venamav, G.B. New generation high strength high damage tolerance 7085 thick alloy product with low quench sensitivity. Mater. Sci. Forum 2004, 28, 969–974. [Google Scholar]
  6. Prabhu, T.R. An overview of high-performance aircraft structural Al alloy-AA7085. Acta Metall. Sin. 2015, 28, 909–921. [Google Scholar] [CrossRef]
  7. Evancho, J.W.; Staley, J.T. Kinetics of precipitation in aluminum alloys during continuous cooling. Metall. Trans. 1974, 5, 43–47. [Google Scholar]
  8. Tiryakioğlu, M.; Shuey, R.T. Quench sensitivity of an Al-7 Pct Si-0.6 Pct Mg alloy: Characterization and modeling. Metall. Mater. Trans. B 2007, 38, 575–582. [Google Scholar] [CrossRef]
  9. Tiryakioğlu, M.; Shuey, R.T. Modeling quench sensitivity of aluminum alloys for multiple tempers and properties: Application to AA2024. Metall. Mater. Trans. A 2010, 41, 2984–2991. [Google Scholar] [CrossRef]
  10. Tiryakioğlu, M.; Shuey, R.T. Quench sensitivity of 2219-T87 aluminum alloy plate. Mater. Sci. Eng. A Struct. 2010, 527, 5033–5037. [Google Scholar] [CrossRef]
  11. Tiryakioğlu, M.; Robinson, J.S.; Eason, P.D. On the quench sensitivity of 7010 aluminum alloy forgings in the overaged condition. Mater. Sci. Eng. A Struct. 2014, 618, 22–28. [Google Scholar] [CrossRef]
  12. Bryant, A.J. The effect of composition upon the quench-sensitivity of some Al-Zn-Mg alloy. J. Inst. Met. 1966, 94, 94–99. [Google Scholar]
  13. Tang, J.G.; Chen, H.; Zhang, X.M.; Liu, S.D.; Liu, W.J.; Ouyang, H.; Li, H.P. Influence of quench-induced precipitation on aging behavior of Al-Zn-Mg-Cu alloy. Trans. Nonferr. Met. Soc. China 2012, 22, 1255–1263. [Google Scholar] [CrossRef]
  14. Liu, W.J. The Research about the Quench Induced Precipitation and Quenching Sensitivity of Al-Zn-Mg-Cu Alloys. Master’s Thesis, Central South University, Changsha, China, 2011. [Google Scholar]
  15. Lim, S.T.; Yun, S.J.; Nam, S.W. Improved quench sensitivity in modified aluminum alloy 7175 for thick forging applications. Mater. Sci. Eng. A Struct. 2004, 371, 82–90. [Google Scholar] [CrossRef]
  16. Deng, Y.L.; Wan, L.; Zhang, Y.Y. Influence of Mg content on quench sensitivity of Al-Zn-Mg-Cu aluminum alloys. J. Alloys Compd. 2011, 509, 4632–4636. [Google Scholar] [CrossRef]
  17. Ouyang, H. Influence of Zn/Mg Ratio on Quench Sensitivity of Al-Zn-Mg-Cu Alloy. Master’s Thesis, Central South University, Changsha, China, 2013. [Google Scholar]
  18. Wang, L. Investigation on Microstructures, Mechanical Properties and Quench Sensitivity of Al-9.0Zn-1.5Mg-XCu Alloys. Master’s Thesis, Central South University, Changsha, China, 2013. [Google Scholar]
  19. Nie, B.H.; Liu, P.Y.; Zhou, T.T. Effect of compositions on the quenching sensitivity of 7050 and 7085 alloys. Mater. Sci. Eng. A Struct. 2016, 667, 106–114. [Google Scholar] [CrossRef]
  20. Chen, J.S.; Li, X.W.; Xiong, B.Q.; Zhang, Y.A.; Li, Z.H.; Yan, H.W.; Liu, H.W.; Huang, S.H. Quench sensitivity of novel Al-Zn-Mg-Cu alloys containing different Cu contents. Rare Met. 2017. [Google Scholar] [CrossRef]
  21. Liu, S.D.; Qun, L.; Lin, H.Q.; Lin, S.; Long, T.; Ye, L.Y.; Deng, Y.L. Effect of quench-induced precipitation on microstructure and mechanical properties of 7085 aluminum alloy. Mater. Des. 2017, 132, 119–128. [Google Scholar] [CrossRef]
  22. Wu, X.Z.; Xiao, D.H.; Zhu, Z.M.; Li, X.X.; Chen, K.H. Effects of Cu/Mg ratio on microstructure and properties of AA7085 alloys. Trans. Nonferr. Met. Soc. China 2014, 24, 2054–2060. [Google Scholar] [CrossRef]
  23. He, L.Z.; Li, X.H.; Zhu, P.; Cao, Y.H.; Guo, Y.P.; Cui, J.Z. Effects of high magnetic field on the evolutions of constituent phases in 7085 aluminum alloy during homogenization. Mater. Charact. 2012, 71, 19–23. [Google Scholar] [CrossRef]
  24. Chen, S.Y.; Chen, K.H.; Peng, G.S.; Chen, X.H.; Ceng, Q.H. Effect of heat treatment on hot deformation behavior and microstructure evolution of 7085 aluminum alloy. J. Alloys Compd. 2012, 537, 338–345. [Google Scholar] [CrossRef]
  25. Kirkaldy, J.S.; Thomason, B.A.; Beganis, E.A. Hardenability Concepts with Applications to Steel; American Institute of Mining, Metallurgical and Petroleum Engineers: Warrendale, PA, USA, 1978; p. 82. [Google Scholar]
  26. Li, P.Y.; Xiong, B.Q.; Zhang, Y.A. Quench sensitivity and microstructure character of high strength AA7050. Trans. Nonferr. Met. Soc. China 2012, 22, 268–274. [Google Scholar] [CrossRef]
  27. Zhang, X.M.; Tan, Q.; Liu, S.D. Effect of quenching rate on aging behavior of 7085 aluminum alloy. Trans. Nonferr. Met. Soc. China 2014, 24, 871–877. [Google Scholar]
  28. Li, C.B.; Liu, S.D.; Zhang, X.M. Grain structure effect on quench sensitivity of Al-Zn-Mg-Cu alloy. Trans. Nonferr. Met. Soc. China 2016, 26, 2276–2282. [Google Scholar] [CrossRef]
  29. Zhang, Y.; Pelliccia, D.; Benjamin, M. Analysis of age hardening precipitates of Al-Zn-Mg-Cu alloys in a wide range of quenching rates using small angle X-ray scattering. Mater. Des. 2018, 142, 259–267. [Google Scholar] [CrossRef] [Green Version]
  30. Sheng, X.F.; Lei, Q.; Xiao, Z. Precipitation behavior and quenching sensitivity of a spray deposited Al-Zn-Mg-Cu-Zr alloy. Materials 2017, 10, 1100. [Google Scholar] [CrossRef] [PubMed]
  31. Shi, D.K. Fundamentals of Material Science, 2nd ed.; China Machine Press: Beijing, China, 2003; pp. 21–65. [Google Scholar]
Figure 1. Calculated time-temperature-transformation (TTT) and continuous-cooling-transformation (CCT) curves of η (MgZn2) phase for 7085 aluminum alloy with different contents of main alloying elements: (a) TTT curves (b) CCT curves.
Metals 09 00965 g001
Figure 2. Variation of conductivity vs. (a) distance from the water-quenching ends and (b) cooling rate.
Metals 09 00965 g002
Figure 3. Relationships of (a) hardness vs. distance from the water-quenching ends and (b) hardness retention value vs. distance from the water-quenching ends.
Metals 09 00965 g003
Figure 4. Transmission electron microscopy (TEM) images of 7085 aluminum alloys under (a) Case I, (b) Case II, (c) Case IV and (d) Case VI.
Metals 09 00965 g004
Figure 5. Relationship of (a) the size of η phase vs. cooling rate and (b) the area fraction of η phase vs. cooling rate.
Metals 09 00965 g005
Table 1. Chemical compositions of 7085 aluminum alloys for comparison experiments.
Case IDZn (wt.%)Mg (wt.%)Cu (wt.%)Zn, Mg and Cu (wt.%)Zr (wt.%)Ti (wt.%)Si (wt.%)Fe (wt.%)Al (wt.%)
standard7.0~8.01.2~1.81.3~2.09.5~11.80.08~0.15≤0.06≤0.06≤0.08Bal.
I7.51.21.310.00.120.030.020.04Bal.
II7.51.41.3510.250.120.030.020.04Bal.
III7.51.41.610.50.120.030.020.04Bal.
IV7.51.61.710.80.120.030.020.04Bal.
V7.51.52.011.00.120.030.020.04Bal.
VI7.51.82.011.30.120.030.020.04Bal.
Table 2. TTT curve parameters of η (MgZn2) phase calculated using JMatPro.
Main Alloying Elements Contents (wt.%)10.010.2510.510.811.011.3
Transitions Temperature (°C)404.1415.2416.9420.8425.8435.2
Nose Temperature (°C)331.4339.9342.4348.5352.3360.8
Precipitation 0.5% Incubation Period (s)1427.01041.21003.9932.7841.9660.8
Table 3. Physical parameters of each alloying element in 7000 series aluminum alloy.
ElementsRadius/ÅΔr = rxrAlΔr/rAlRAMDensity/g∙cm³Electronegativity/ev
Al1.429--26.982.71.61
Zn1.379–0.05–3.50%65.387.141.65
Mg1.5980.16911.83%24.311.731.31
Cu1.276–0.153–10.71%63.558.961.90
Note: the subscript “x” represents Zn/Mg/Cu. “RAM” indicates the relative atomic mass.
Table 4. Variation of lattice distortion energy in solid solution.
Zn + Mg + Cu Content (wt.%)Lattice Distortion Energy Induced by Alloying Elements
Zn Mg CuTotal Values
106.57350.2898.69665.558
10.256.56958.6739.00974.252
10.86.54567.17311.38885.107
11.36.56975.81613.46895.854
Table 5. Lattice distortion energy of solid solution, quenching phase and quench sensitivity.
Zn + Mg + Cu Content (wt.%)Et (s)S (nm)AF (%)ΔC (%IACS)ΔH (%)
1065.558142750.2 ± 11.52.5 ± 0.30.54
10.2574.2521041.254.5 ± 12.43.2 ± 0.50.85.8
10.885.107932.765.2 ± 19.85.1 ± 0.91.18.6
11.395.854660.894.2 ± 25.19.6 ± 1.3212.5
Note: “E” represents the total lattice distortion energy; “t” represents the incubation period of precipitation 0.5%; “S” represents the size of η phase at 129 °C/min; “AF” represents the area fraction of η phase at 129 °C/min; “ΔC” represents the conductivity difference at both ends; “ΔH” represents the hardness difference at both ends.

