1. Introduction
The flash smelting process was developed in Finland in the late 1940s, and it has become one of the main copper production technologies in the world, given its high production and fast implementation capabilities at industrial and commercial scales. This process has attracted the interest of researchers for more than five decades, from the first works that allowed understanding the mineralogy and combustion kinetics of specific mineral particles, to modern works focused on the development and application of computer fluid dynamics (CFD) models [
1,
2,
3].
Mineral oxidation at high temperatures is the core in such processes, since it involves complex energy and mass transfer mechanisms, as well as gaseous and intermediate species production. The research related to this combustion process has tried to uncover the chemical and physical behaviors of those mineral particles present in copper concentrates in flash smelting conditions [
4,
5,
6]. The species involved during the combustion absorb and emit energy with specific characteristics, which can be used to retrieve information about the process condition [
7]. In particular, optical information at specific wavelengths has been used to describe the oxidation of the main sulfide minerals such as chalcopyrite (CuFeS
2) and pyrite (FeS
2) [
4,
6], to estimate ignition temperatures [
8,
9,
10], single particle temperature [
4,
6], and to model particle size distributions [
11].
In the combustion research field, visible and near-infrared (VIS-NIR) spectroscopic techniques are applied to characterize and retrieve relevant process information, e.g., Keyvan et al. [
12,
13] estimated natural gas flame temperature by means of the two-color pyrometry method; Romero et al. [
14] developed a real-time temperature and composition monitoring system for natural gas flames in a glass production process; and Cai et al. [
15] used least squares regression methods to fit coal flame spectral emission by means of using gray body models based on Planck’s radiation law, with temperature and emissivity as regression parameters.
Recently, researchers have reported on spectral measurements from laboratory-scale experiments of copper concentrate combustion [
16], and exploratory results depicted some spectral features related to the combustion process, such as Cu
xO spectral emissions at 606 nm and 616 nm, as well as a direct correlation among sulfur content in samples and broad band spectral intensity amplitudes. Furthermore, chemometrics techniques, i.e., analytical tools applied for the chemical characterization of samples, appear as a great tool to gain new insights from great volumes of data such as spectral data. One of these applications was shown in the work of Stumpe et. Al. [
17]. The researchers achieved classifying different slag species coming from the steel industry by means of PCA and SIMCA (Soft Independent Modelling of Class Analogy) models applied to the mid-infrared spectra. Finally, industrial equipment applying radiometric techniques to control copper pyrometallurgical processes has been developed, the Optical Process Controller (OPC) monitoring system manufactured by Scandinavian Emissions Technology (Semtech) company. They discovered that lead species such as PbS and PbO can be used as tracers to follow the conversion process state [
18,
19].
In this work, classification and exploratory analysis algorithms are applied to characterize high-grade sulfide minerals by means of their VIS-NIR spectral radiation emitted from controlled combustion experiments. Spectral information is measured in absolute radiometric amplitudes with a previously-calibrated spectrometer and algorithms such as PCA, SIMCA, PLS-DA (Partial Least Squares-Discriminant Analysis), k-Nearest Neighbors (k-NN), and SVM are applied to visualize the spectral information behavior and to develop predictive classification models, so a short overview about these methods is introduced in the next section. Classification model performance and comparisons are evaluated during the training and validation process with cross-validation techniques, accuracy, and error metrics.
The work is organized as follows: in
Section 2, a description of the combustion setup and an overview about the sensing techniques, preprocessing, and classification algorithms are given; in
Section 3, the results are discussed, and in
Section 4, some conclusions and future work are outlined.
2. Materials and Methods
In
Figure 1, the experimental setup is depicted. This experimental setup was installed in the Metallurgical Engineering Department at the Universidad of Concepción, Concepción, Chile. The system mainly consisted of: (i) gas and solid feeding systems; (ii) a reaction zone heated by an electrical furnace; and (iii) an optical sensing system.
The solid feeding system consisted of a LAMBDA DOSER® (Lambda CZ s.r.o., Brno, Czech Republic) of 0.2 L, with a feeding rate controller. Solids were fed by means of a water-cooled lance manufactured of stainless-steel; this system also refrigerates the optical fiber installed through the center to measure the radiation emitted in the zenithal position of the incandescent cloud of particles during combustion. The reaction zone was made with a stainless-steel tube of a 0.12-m inner diameter with a thickness of 3 mm, vertically positioned and heated on the surface by a controlled electrical furnace able to reach 1473 K. The furnace temperature was monitored by means of a K-type thermocouple. The process gas entering the reaction zone was a mixture of oxygen and nitrogen, and flows were controlled with mass flow controllers.
In
Figure 2, the general data acquisition and preprocessing pipeline is depicted. Particles during combustion emitted radiation from the reaction zone, and the radiation was guided to a spectrometer by a cooled optical fiber probe (Avantes Inc., Louisville, CO, USA) specially designed for high-temperature environments. In this work, the VIS-NIR spectrometer USB4000 (Ocean Optis Inc., Dunedin, FL, USA) was used to acquire the spectral data in the range from 400–900 nm with an average spectral resolution of ~0.22 nm; also, the spectrometer was calibrated to measure the emitted radiation in absolute irradiance units (µW/(cm
2∙nm)). The monitoring, acquisition, and spectrometer configuration stages were controlled with software developed in LabView™ (National Instruments Corporation, Austin, TX, USA ). Moreover, from a spectral point of view, it was assumed that the main spectral features were emitted by particles in ignition and that hot gasses inside the reaction zone, e.g., SO
2, N
2, and O
2, were optically transparent in the analyzed spectral range.
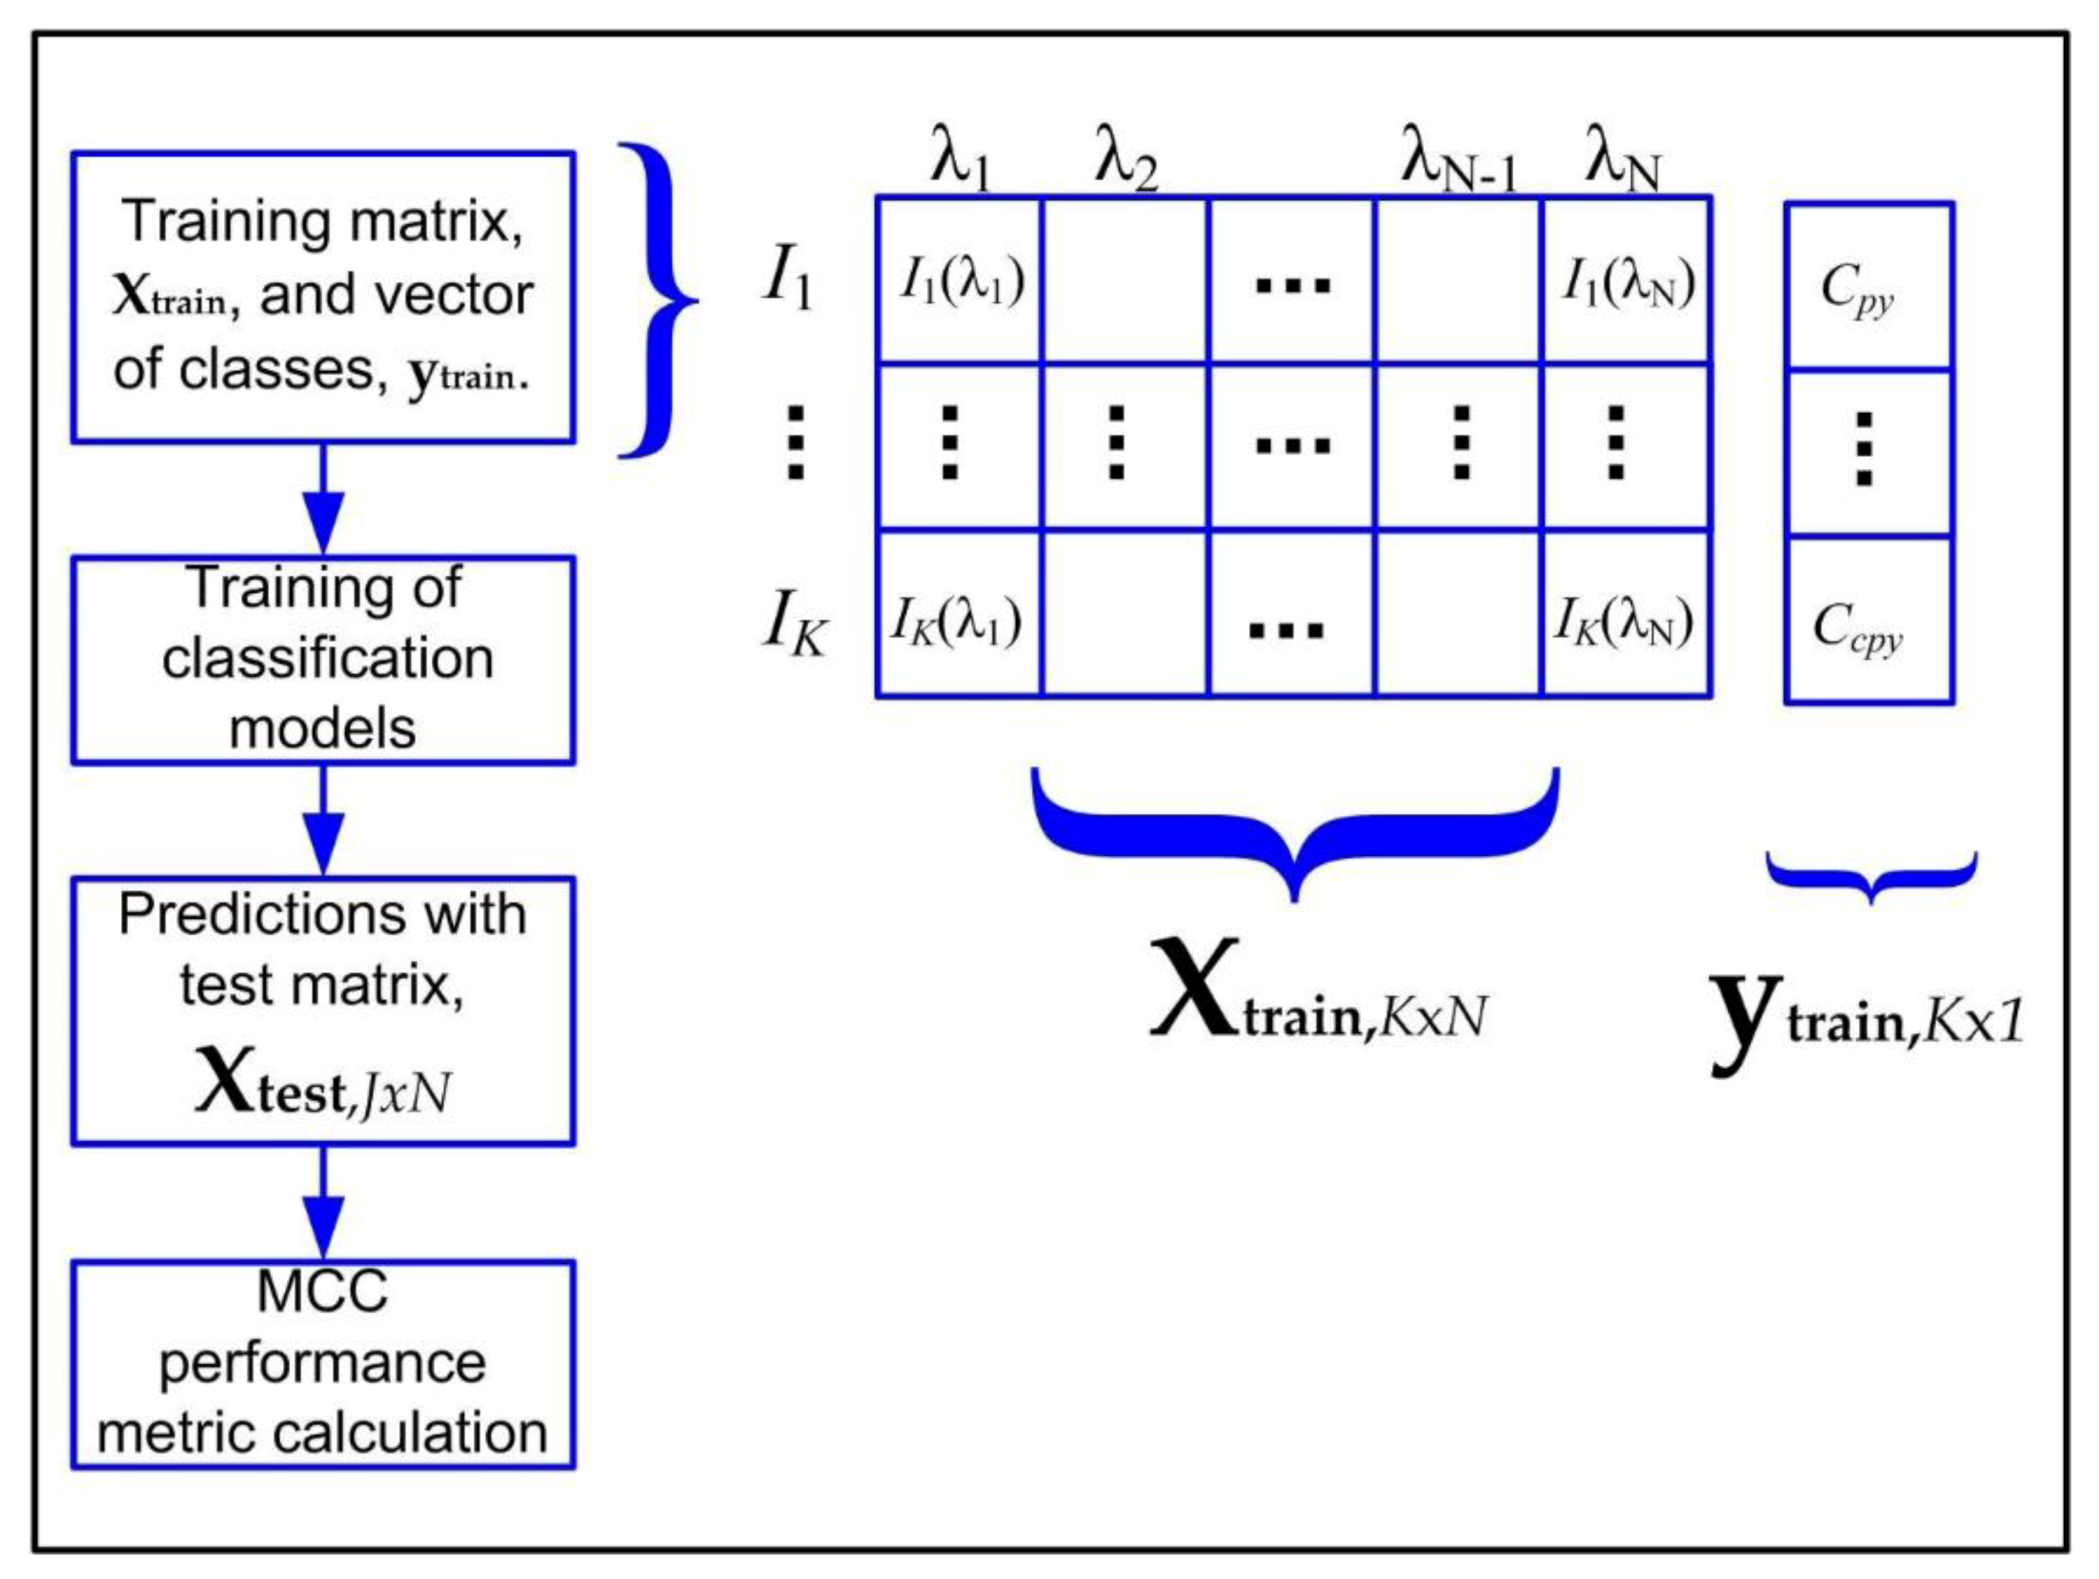
In order to manipulate the spectral data, the applied algorithms assumed the data as a matrix
XMxN with columns representing the variables or sampling wavelengths, λ
i,
I = 1, …,
N, with each row representing a spectrum,
Ij,
j = 1, …,
M, measured at some instant, as depicted in
Figure 2. In this work, the number of acquired spectra for each experiment was related to material availability, and a total of
N = 2576 discrete wavelengths in the 400–900 nm range were analyzed.
After the data were acquired, further preprocessing could be necessary to compensate for external perturbations such as particles size distribution and unstable feeding rates. Such methodologies are described next.
Signal processing and algorithm implementations were conducted in MATLAB
® (The MathWorks, Inc., Natick, MA, USA) [
20], with the PLS Toolbox 5.2 (Eigenvector Research, Inc., Manson, WA, USA) [
21] and the Classification Learner App from the Machine Learning Toolbox
TM (MATLAB
®).
3. Results and Discussion
In
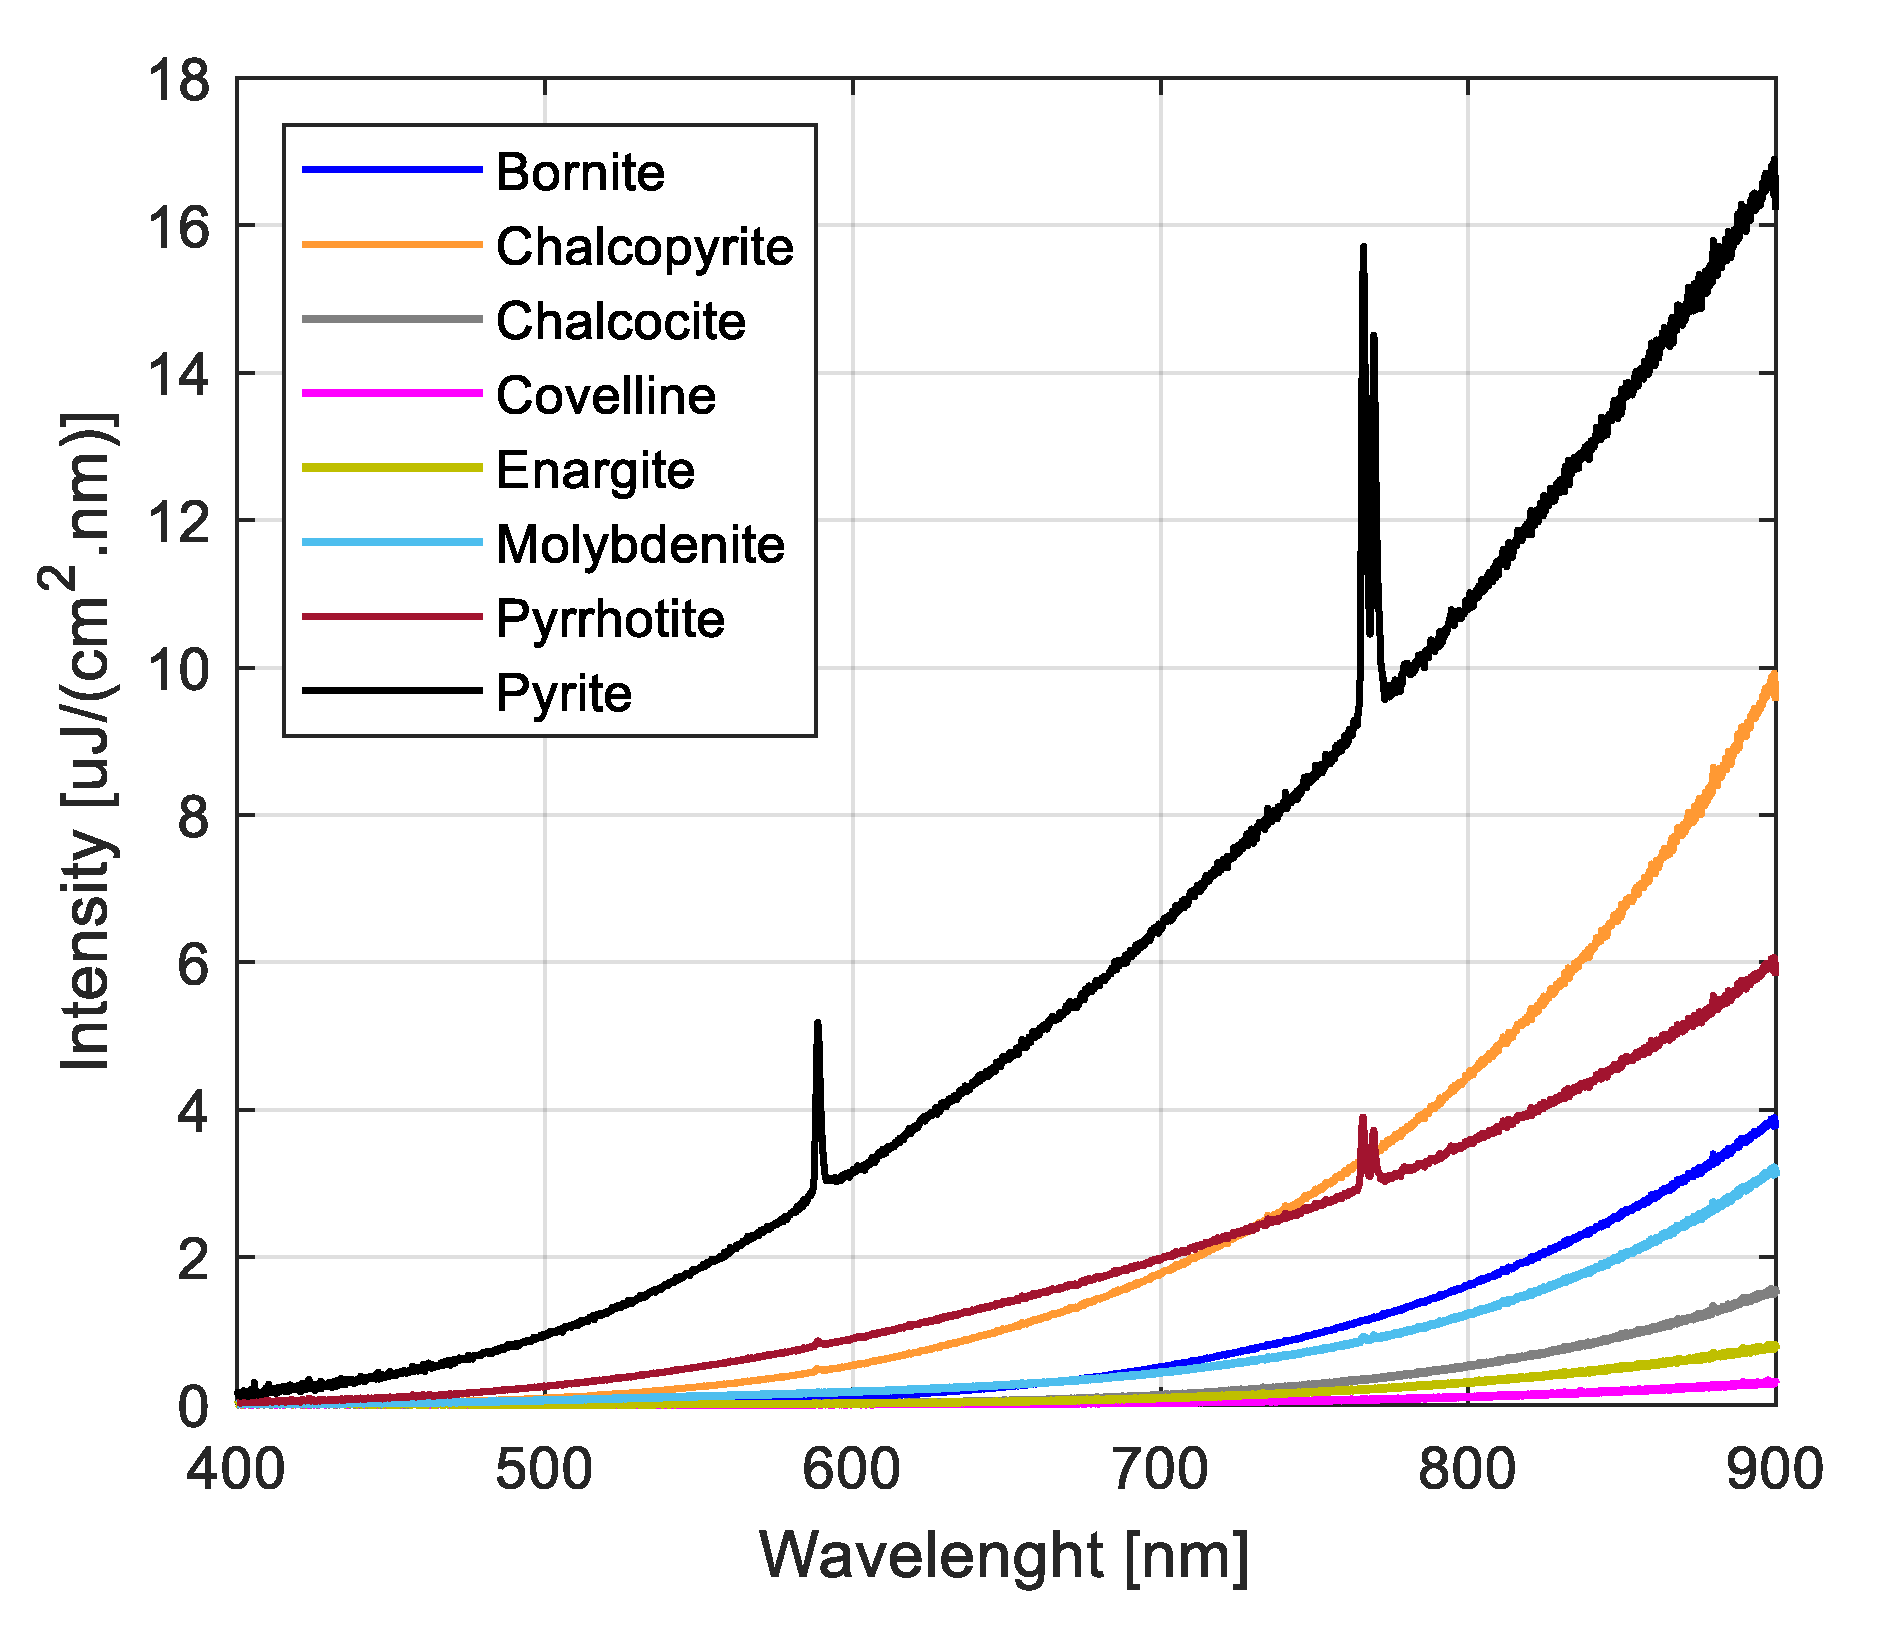
Figure 4, average measurements of calibrated spectra from each species are depicted, and differences among spectral intensities along the sensed spectral range are observed, with pyrite emission producing the highest intensity pattern. Moreover, the pyrite spectrum shows a pronounced peak at 588 nm and a doublet at 765.8–769.3 nm, and the same peaks appear in the pyrrhotite, but with less intensity. These signals were associated with sodium and potassium emissions, respectively, in previous works [
16]. On the other hand, the chalcopyrite spectrum shows slightly perceptible peaks, while the other mineral species show only continuum spectral patterns.
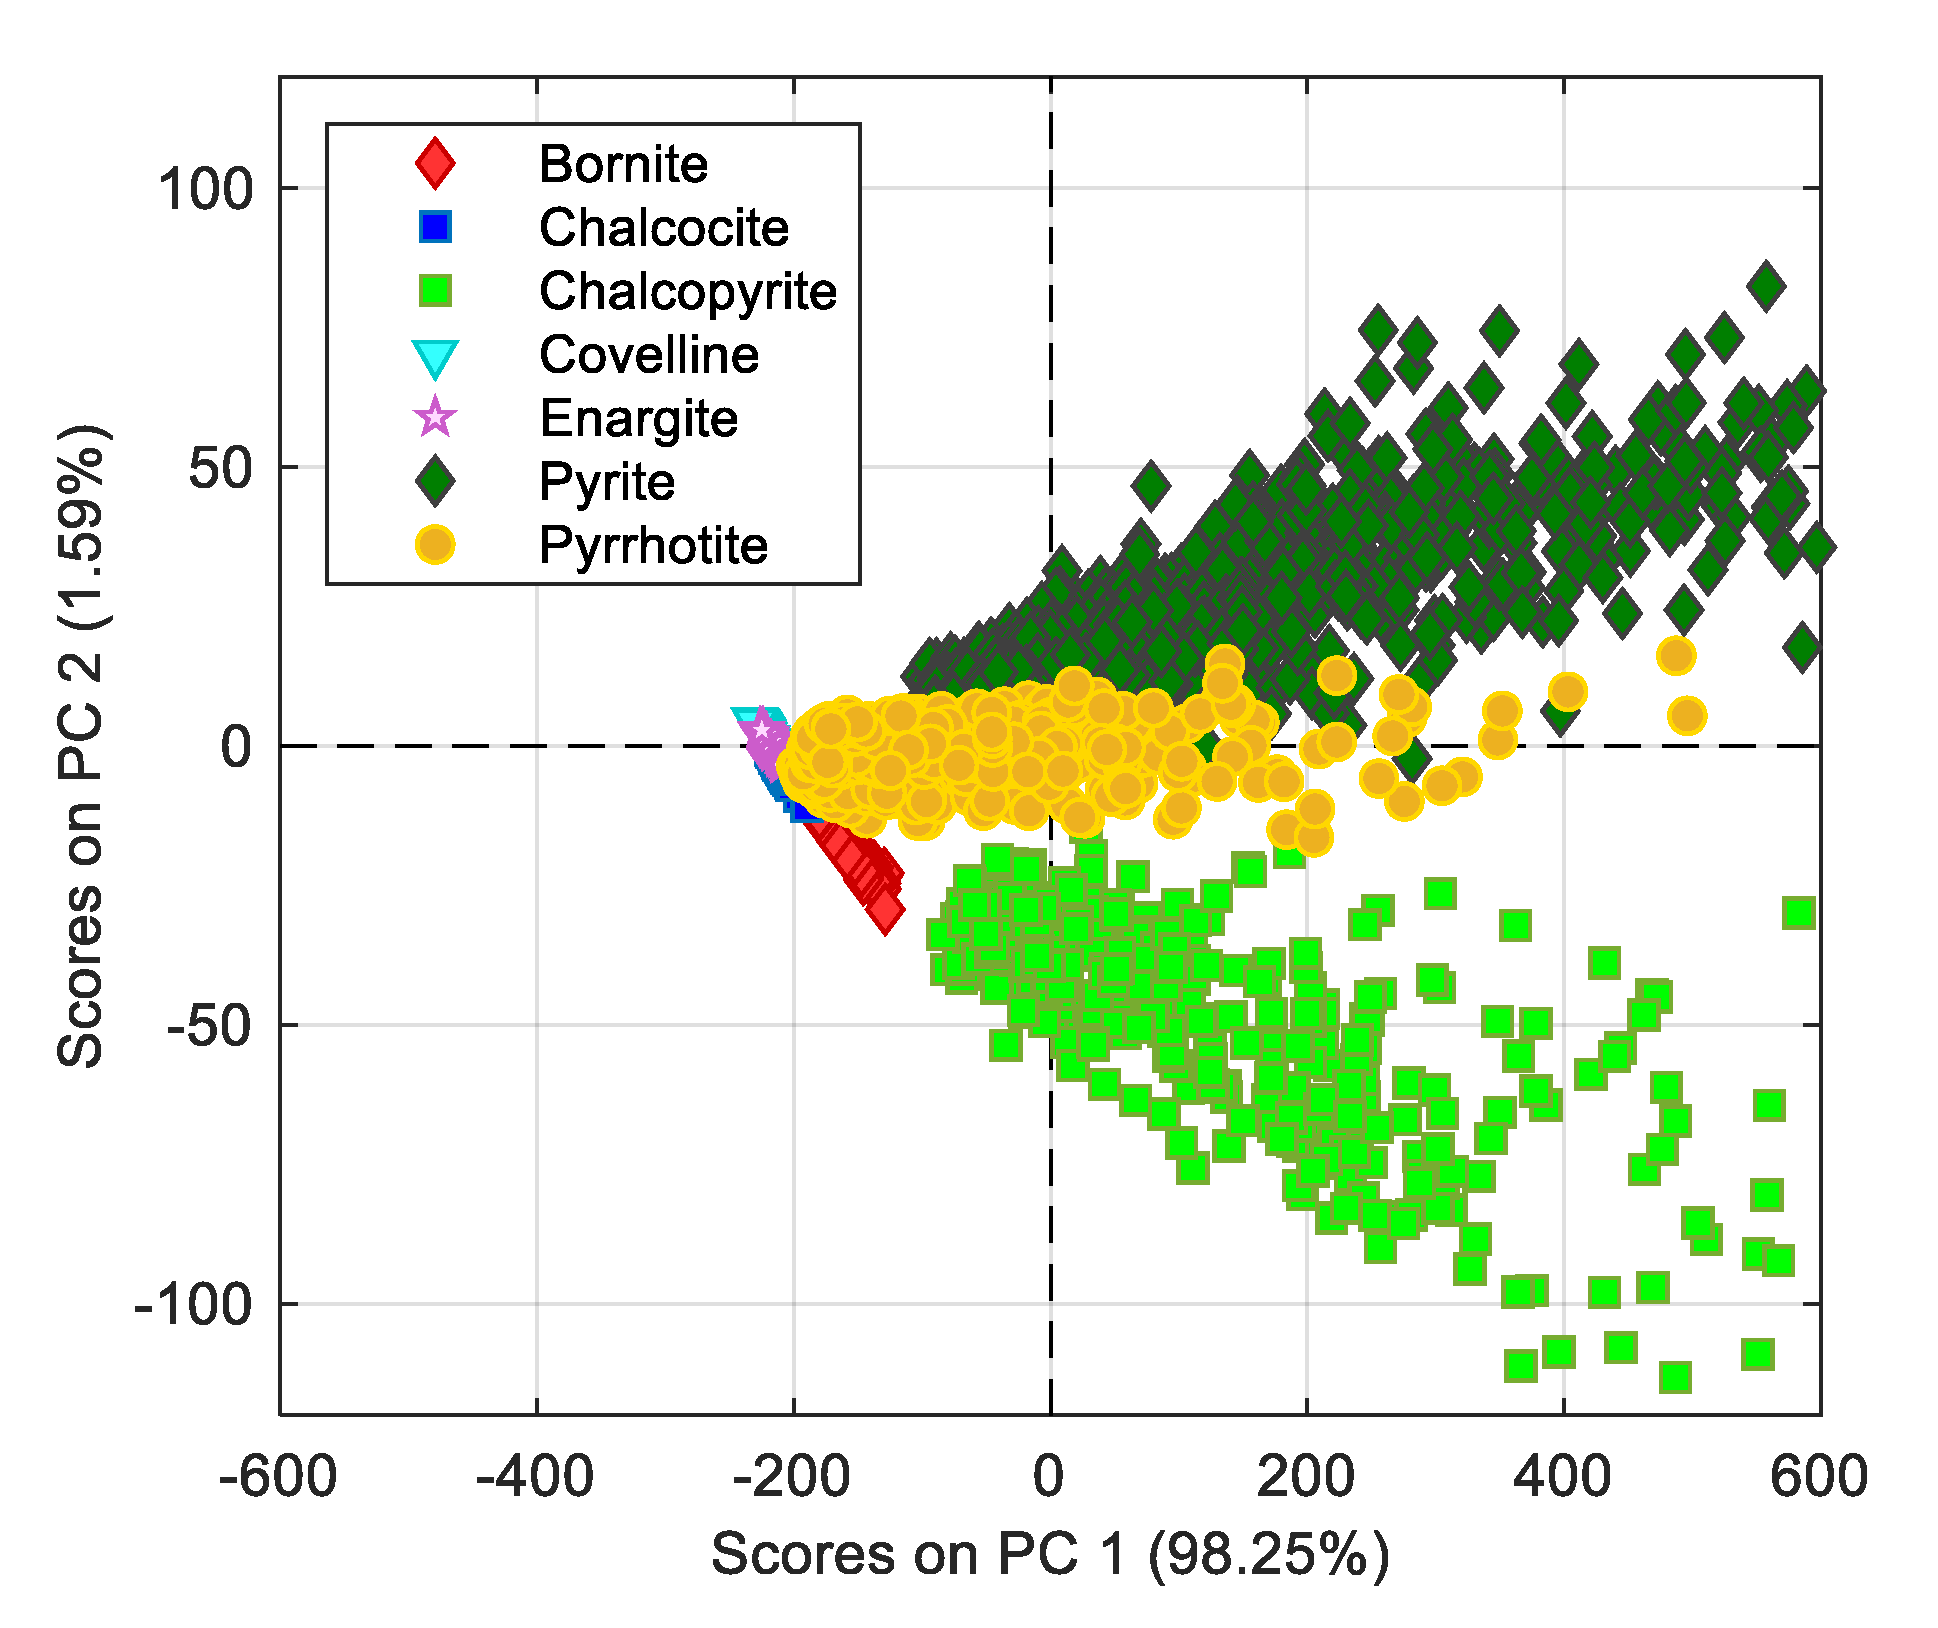
In order to compare the emission spectra from the different mineral species, a single measurement matrix was constructed containing all the data, following the structure described in
Figure 2. Because the size of the measurement matrix was very large, the application of principal component analysis (PCA) was chosen as an alternative to visualize the patterns of possible mineral species. Results from PCA application are depicted in the scatterplot of
Figure 5. The score analysis shows four very marked groups, two related to chalcopyrite and pyrite emissions, one produced by pyrrhotite scores, slightly overlapping on the pyrite spectra, and one group with the other species, which indicates a high correlation among their spectral emission patterns.
The pyrrhotite scores’ behavior can be explained by the fact that at temperatures above 873 K, the oxidation of chalcopyrite and pyrite occurs mainly through the decomposition of sulfur to produce FeS according to the reactions:
The spectra from the combustion of the sulfides presented in the previous equations can be confused with the spectra of the sulfide mineral species. As mentioned earlier, the overlapping among the score groups produced by bornite, chalcocite, covelline, and enargite [
29,
30,
31] emissions can be justified by the fact that the product of their thermal decomposition is Cu
2S (reactions thermodynamically favorable under the temperature attained by the combustion flames in each experiment), as shown in the following reactions:
Moreover, the results of PCA applied on copper sulfide spectra had a very marked separation with the chalcopyrite scores; in this case, this separation was given by the PC1, with most of chalcopyrite scores located on the negative side of PC2.
In
Table 4, the mineralogical composition of the combustion products is summarized. It can be seen that products from enargite and covelline combustion have a high content of the Cu
2S phase (chalcocite). On the other hand, bornite and chalcocite partially reacted, and they also depicted low intensity profiles, so their radiation was prone to be overshadowed by the radiation emitted by the furnace walls.
In
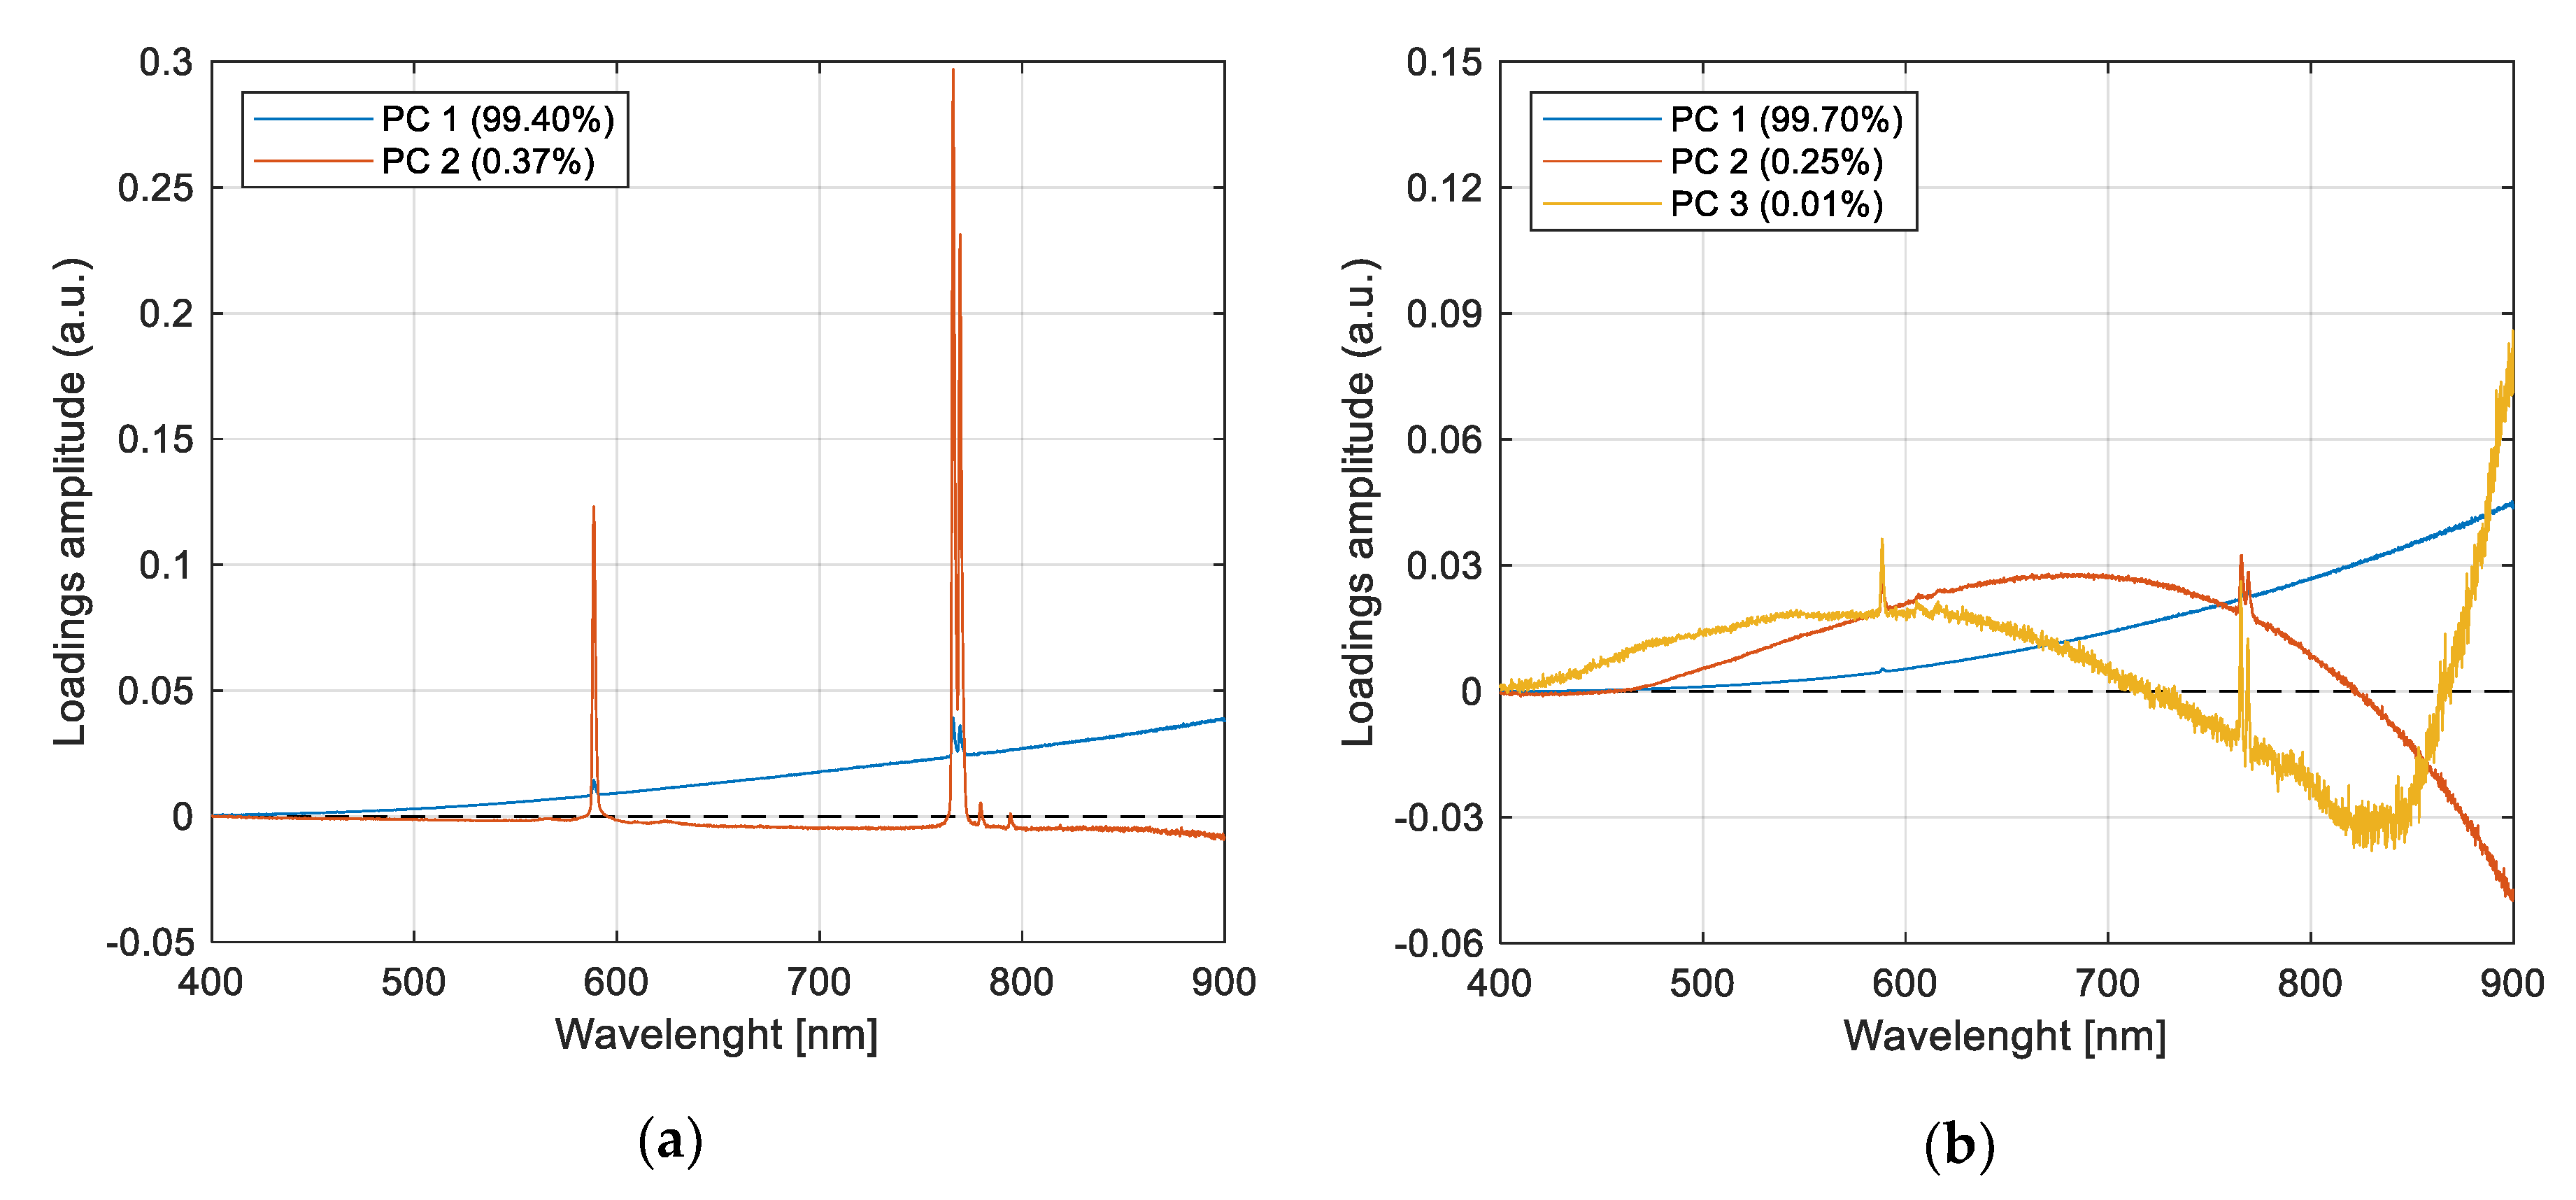
Figure 6a, the plot of PCs loadings depicts the variables’ (wavelengths) behavior for pyrite and chalcopyrite combustion spectra. The peaks mentioned above and less intense peaks at 779.1 and 793.9 nm are observed. These peaks have been previously reported and may be associated with iron species [
16]. These peaks are also observed in the loadings obtained with PCA using only pyrite spectra. For chalcopyrite spectra, loadings depict peaks at 606 and 616 nm (
Figure 6b), and they are associated with the presence of copper oxides [
32]. Note that loading vectors only give an idea of the wavelengths’ contribution to spectral data variance and that in any case, their amplitude can be interpreted as a relative concentration in the original spectra; however, they can be seen as a first approach to elucidate the structure of spectral patterns hidden in the data because of their weak emissions. Loading analysis for other species presented no relevant spectral patterns, so they are not shown in this work.
Due to the promising results obtained with PCA, supervised classification methods such as k-NN, PLS-DA, SIMCA, and SVM were applied. In this section, only chalcopyrite and pyrite emissions are considered for analysis. To accomplish this, a training matrix was constructed from the emission spectra that presented the best differentiation between mineral species, as depicted in
Figure 3. Under this assumption, 750 chalcopyrite and 750 pyrite spectra were chosen randomly. Finally, trained classification models were evaluated on 500 spectra from chalcopyrite and pyrite combustion, spectra from Copper Concentrate A and Copper Concentrate B combustion, and finally, spectra from mixtures of pyrite/chalcopyrite in proportions of 30% Cpy-70% Py and 70% Cpy-30% Py combustion.
From the set of applied preprocessing methods, the mean centering approach was chosen since it presented a good justification of the accumulated variance from exploratory PCA analysis with a good segregation of sample scores and low values of the root mean squared error of cross-validation for the different methods’ implementation. In this work, a 10-fold cross-validation method was implemented to estimate the optimum parameters of the trained models.
Table 5 summarizes the optimum assessed parameters for each implemented method.
Table 6 summarizes the results of predictions over the test matrices by using the optimal models, the values of the MCC metric, and confusion matrices. It can be seen that during the predictions, the k-NN model was not considered appropriate for the detection of pyrite combustion spectra, because it had a low specificity (a large number of false positive samples); the same issue is observed with SIMCA, with higher rates of false positives for both species; the PLS-DA and SVM methods show the best classification results for the sulfide mineral species’ predictions. In the case of predicting the class of copper concentrates, Concentrate A was mainly classified with a higher presence of pyrite, and the opposite can be observed for Concentrate B, which was accurate by considering their mineralogical composition; see
Table 3. The same results can be observed from the binary mixture combustion, and the algorithms predicted the high presence of pyrite or chalcopyrite species, accordingly.
Author Contributions
Conceptualization, W.D. and C.T.; methodology, W.D., G.R., C.T., and V.P.; software, W.D.; validation, W.D., C.T., and V.P.; formal analysis, W.D., C.T., and P.C.; investigation, W.D.; resources, E.B., R.P.; data curation, C.T. and V.P.; writing, original draft preparation, W.D.; writing, review and editing, C.T., V.P., E.B., W.D., P.C., and R.P.; visualization, W.D.; supervision, C.T.; project administration, E.B.; funding acquisition, R.B. and E.B.
Funding
This research was funded by the CONICYT, Anillo Minería ACM170008, and by Fondef IT under Grant Number 16M10029. The work of C. Toro was supported by the CONICYT Fondecyt/Postdoctorate grant under Project Number 3170897. The work of Pablo Coelho was supported by CONICYT PAI/CONVOCATORIA NACIONAL SUBVENCIÓN A LA INSTALACIÓN EN LA ACADEMIA, 2018 (77180078).
Acknowledgments
We thank the Metallurgical Engineering Department at the University of Concepción for giving access to their facilities, allowing us to conduct the experiments reported in this work.
Conflicts of Interest
The authors declare no conflict of interest. The funders had no role in the design of the study; in the collection, analyses, or interpretation of data; in the writing of the manuscript; n\or in the decision to publish the results.
References
- Jorgensen, F.R.A.; Segnit, E.R. Mineralogy of the products of the flash smelting of chalcopyrite. In Proceedings of the 25th International Geological Congress, Sidney, Australia, 16–25 August 1976; pp. 575–576. [Google Scholar]
- Jorgensen, F.R.A.; Segnit, E.R. Copper flash smelting simulation experiments. Proc. Australas. Inst. Min. Metall. 1977, 261, 39–46. [Google Scholar]
- White, M.; Haywood, R.; Ranasinghe, D.J.; Chen, S. The development and application of a cfd model of copper flash smelting. In Proceedings of the Eleventh International Conference on CFD in the Minerals and Process Industries, Melbourne, Australia, 7–9 December 2015. [Google Scholar]
- Jorgensen, F.R.A. Combustion of pyrite concentrate under simulated flash-smelting conditions. Trans. Inst. Min. Metall. Section C 1981, 90, C1–C9. [Google Scholar]
- Jorgensen, F.R.A. Heat transfer mechanism in ignition of nickel sulphide concentrate under simulated flash smelting conditions. Proc. Australas. Inst. Min. Metall. 1979, 271, 21–25. [Google Scholar]
- Sohn, H.Y.; Chaubal, P.C. The ignition and combustion of chalcopyrite concentrate particles under suspension-smelting conditions. Metall. Trans. B 1993, 24, 975–985. [Google Scholar] [CrossRef]
- Howell, J.R.; Menguc, M.P.; RSiegel, R. Thermal Radiation Heat Transfer, 6th ed.; CRC Press: Boca Raton, FL, USA, 2015; pp. 441–488. [Google Scholar]
- Jorgensen, F.R.A.; Zuiderwyk, M. Two-colour pyrometer measurement of the temperature of individual combusting particles. J. Phys. E Sci. Instrum. 1985, 18, 486–491. [Google Scholar] [CrossRef]
- Morgan, G.J.; Brimacombe, J.K. Kinetics of the flash converting of MK (chalcocite) concentrate. Metall. Mater. Trans. B 1996, 27, 163–175. [Google Scholar] [CrossRef]
- Wilkomirsky, I.; Otero, A.; Balladares, E. Kinetics and reaction mechanisms of high-temperature flash oxidation of molybdenite. Metall. Mater. Trans. B 2010, 41, 63–73. [Google Scholar] [CrossRef]
- Laurila, T.; Hernberg, R.; Oikari, R.T.; Mikkola, P.; Ranki-Kilpinen, T.; Taskinen, P. Pyrometric temperature and size measurements of chalcopyrite particles during flash oxidation in a laminar flow reactor. Metall. Mater. Trans. B 2005, 36, 201–208. [Google Scholar] [CrossRef]
- Keyvan, S.; Rossow, R.; Romero, C. Blackbody-based calibration for temperature calculations in the visible and near-IR spectral ranges using a spectrometer. Fuel 2006, 85, 796–802. [Google Scholar] [CrossRef]
- Keyvan, S.; Rossow, R.; Romero, C.; Li, X. Comparison between visible and near-IR flame spectra from natural gas-fired furnace for blackbody temperature measurements. Fuel 2004, 83, 1175–1181. [Google Scholar] [CrossRef]
- Romero, C.; Li, X.S.; Keyvan, S.; Rossow, R. Spectrometer-based combustion monitoring for flame stoichiometry and temperature control. Appl. Thermal Eng. 2005, 25, 659–676. [Google Scholar] [CrossRef]
- Cai, X.; Cheng, Z.; Wang, S. Flame measurement and combustion diagnoses with spectrum analysis. AIP Conf. Proc. 2007, 914, 60–66. [Google Scholar]
- Arias, L.; Torres, S.; Toro, C.; Balladares, E.; Parra, R.; Loeza, C.; Villagrán, C.; Coelho, P. Flash smelting copper concentrates spectral emission measurements. Sensors 2018, 18, 2009. [Google Scholar] [CrossRef] [PubMed]
- Stumpe, B.; Engel, T.; Steinweg, B.; Marschner, B. Application of PCA and SIMCA statistical analysis of FT-IR spectra for the classification and identification of different slag types with environmental origin. Environ. Sci. Technol. 2012, 46, 3964–3972. [Google Scholar] [CrossRef] [PubMed]
- Persson, W.; Wendt, W.; Demetrio, S.J. Use of optical on-line production control in copper smelters. In Proceedings of the 4th International Conference COPPER 99-COBRE 99, Phoenix, AZ, USA, 10–13 October 1999; pp. 491–503. [Google Scholar]
- Persson, W.; Wendt, W. Optical spectroscopy for process monitoring and production control in ferrous and non-ferrous industry. In Modeling, Control, and Optimization in Ferrous and Non-Ferrous Industry, Proceedings of the Materials Science & Technology 2003 Conference, Chicago, IL, USA, 9–12 November 2003; The Minerals, Metals & Materials Society: Pittsburgh, PA, USA, 2003; pp. 177–191. [Google Scholar]
- MATLAB. Available online: https://la.mathworks.com/products/matlab.html (accessed on 21 July 2019).
- PLS_Toolbox, Eigenvector. Available online: https://eigenvector.com/software/pls-toolbox/ (accessed on 21 July 2019).
- Rinnan, A.; van den Berg, F.; Engelsen, S.B. Review of the most common pre-processing techniques for near-infrared spectra. TrAC Trends Anal. Chem. 2009, 28, 1201–1222. [Google Scholar] [CrossRef]
- Parente, A.; Sutherland, J.C. Principal component analysis of turbulent combustion data: Data pre-processing and manifold sensitivity. Combust. Flame 2013, 160, 340–350. [Google Scholar] [CrossRef] [Green Version]
- Lindon, J.C.; Tranter, G.E.D.; Koppenaal, D. Encyclopedia of Spectroscopy and Spectrometry, 2nd ed.; Academic Press: Oxford, UK, 2016; pp. 1704–1709. [Google Scholar]
- Otto, M. Chemometrics: Statistics and Computer Application in Analytical Chemistry, 3rd. ed.; John Wiley & Sons: Weinheim, Germany, 2016; pp. 135–211. [Google Scholar]
- Ballabio, D.; Grisoni, F.; Todeschini, R. Multivariate comparison of classification performance measures. Chem. Intell. Lab. Sys. 2018, 174, 33–44. [Google Scholar] [CrossRef]
- Chevallier, S.; Bertrand, D.; Kohler, A.; Courcoux, P. Application of PLS-DA in multivariate image analysis. J. Chemometr. 2006, 20, 221–229. [Google Scholar] [CrossRef]
- Cortes, C.; Vapnik, V. Support-vector networks. Mach. Learn. 1995, 5, 273–297. [Google Scholar] [CrossRef]
- Chaubal, P.C.; Sohn, H.Y. Intrinsic kinetics of the oxidation of chalcopyrite particles under isothermal and nonisothermal conditions. Metall. Mater. Trans. B 1986, 17, 51–60. [Google Scholar] [CrossRef]
- Padilla, R.; Fan, Y.; Wilkomirsky, I. Decomposition of enargite in nitrogen atmosphere. Can. Metall. Q. 2001, 40, 335–342. [Google Scholar] [CrossRef]
- Dunn, J.G.; Muzenda, C. Thermal oxidation of covellite (CuS). Thermochim. Acta 2001, 369, 117–123. [Google Scholar] [CrossRef]
- Gole, J.L. Oxidation of small metal and metalloid molecules. In Gas-Phase Metal Reactions, 1st ed.; Fontjin, A., Ed.; Elsevier: New York, NY, USA, 1992; pp. 596–597. [Google Scholar]
© 2019 by the authors. Licensee MDPI, Basel, Switzerland. This article is an open access article distributed under the terms and conditions of the Creative Commons Attribution (CC BY) license (http://creativecommons.org/licenses/by/4.0/).


 ,
, 


