Article

Process and Parameter Optimization of the Double-Pulsed GMAW Process

1
College of Electromechanical Engineering, Guangdong Polytechnic Normal University, Guangzhou 510635, China
2
School of Mechatronical Engineering, Beijing Institute of Technology, Beijing 100081, China
*
Author to whom correspondence should be addressed.
Metals 2019, 9(9), 1009; https://doi.org/10.3390/met9091009
Submission received: 20 August 2019 / Revised: 7 September 2019 / Accepted: 10 September 2019 / Published: 15 September 2019
(This article belongs to the Special Issue Advanced Welding Technology in Metals)

Abstract

:
The double pulsed gas metal arc welding (DP-GMAW) process has been effectively employed to realize joining of steel plates and obtain weld bead surfaces with high quality fish scale ripples. In this work, a DP-GMAW process based on robot operation using the latest twinpulse XT DP control technology was employed to join the stainless-steel base plates. Four key operational parameters, which were robot welding speed, twin pulse frequency, twin pulse relation and twin pulse current change in percent, were selected to be input elements of orthogonal experimental design, which included nine experiments with three levels. To accurately understand the performance and process of weld bead obtained from DP-GMAW operation based on robot operation, the appearance observation and key shape parameters measurement, microstructure analysis, tensile and hardness testing, as well as stability analysis of the electrical signals, were conducted. Correlation analysis showed that the grain size was significantly correlative to the toughness and hardness. Then, to obtain quantitative evaluation results, fuzzy comprehensive evaluation (FCE) was employed to provide quality evaluation of weld beads from the above experiments. The influential levels of the key operational parameters on the appearance, grain size and FCE scores, and corresponding physical analyses, were respectively presented. In addition, optimal parameters combinations for obtaining weld beads with optimal appearance, grain size, and the highest FCE scores of weld bead quality were respectively provided according to the range analysis of the results from orthogonal experimental design. This work can provide an effective analysis method of influential levels of key operational parameters on the performance of the weld bead, optimal operational parameters combination seeking method, and quantitative quality evaluation method for the DP-GMAW process, which can improve the process optimization and increase the production efficiency, both in academic research and actual industrial production.

Graphical Abstract

1. Introduction

The double-pulsed gas metal arc welding (DP-GMAW) process is a mature arc welding operation technology that is prevalently employed in modern industrial manufacturing occasions. Though this process is designed based on the traditional pulsed-GMAW (P-GMAW), it has some significant merits when compared to the P-GMAW, such as the DP-GMAW process can reduce the porosity incidence [1] and improve the solidification cracking susceptibility [2]. Also, the process has better gap bridging ability [3], and better ability to control the mode of droplet transfer than those of the P-GMAW process [4]. This new technique is an effective variation of the traditional P-GMAW process, in which the pulsing current aiming to metal transfer control is overlapped by a thermal pulsation [5], which induces changes of temperature and stress of the welding pool [6]. Hence, it has been paid more and more attention in academic research and actual industrial production areas in recent years.
The difference between P-GMAW and DP-GMAW processes is the current waveform. During the DP-GMAW process, the current waveform is composed of a rhythmic thermal pulse phase (TPP) and a thermal base phase (TBP) [7], which have different frequencies and amplitudes, and the sum of durations of the two phases is equal to a thermal period (TP) [8]. Because of the existence of double pulses, it was also been named the twin-pulsed GMAW process in some published literature. To assure a stable welding process and obtain weld beads with high quality, researchers and scholars have put a lot of efforts to change the waveforms. The original waveform was a usual types of square waveforms where strong current and weak current were alternately appeared during the process. Under the circumstance, arc quenching may appear when actual currents switch between TPP and TBP, because the wire feeding equipment may not be able to catch up with the variation of the current pulse with adequate speed due to the mechanical inertia [8]. To alleviate the sudden changes of the current amplitude differences in these two phases, corresponding improvements have been revealed, such as trapezoid waveform, or sinusoidal waveform [8,9]. By means of the changes, the changes of the currents were replaced by gradual switches, which can improve the stability of the arc to achieve a stable droplet transfer [10]. Apart from arc quenching, splashes, short-circuit or open-circuit of the electrical system may frequently occur during the process if the parameters setting and matching are improper. All of these phenomena should be carefully considered during system design and operation in order to decrease the cost of production and improve the actual efficiency.
According to the principle of DP-GMAW, there are many parameters requiring proper setting during the process, such as the thermal period and corresponding frequency, twin pulse current change and duty cycles in two phases, and so on. Also, currently the welding robot has been employed more and more in manufacturing, and the robot traveling speed is also an important parameter. Hence, this is a typical multi-parameter system, and how to obtain an optimal operational parameters combination for achieving satisfactory performance is a challenge work for all users. In practical application, testing and justifying each parameter on the welding quality can cost so much and cannot be accepted in the majority of occasions.
No matter which type of welding technology is employed, quality estimation or evaluation is so important. For example, for resistance spot welding, the tensile-shear strength of the weld can be used for evaluating the welding quality [11]. For pulsed GMAW products, which is the weld bead, the quality involves more elements, such as crack, appearance, penetration, microstructure, and so on [12]. In general, these different elements should be properly combined to yield one reliable quality criterion. Nowadays, with developing computer technology, artificial intelligent (AI) technology has demonstrated many achievements. In welding research area, AI technology has been also employed, such as in quality estimation of resistance spot welding [11], or in optimal parameter prediction in double-wire-pulsed metal inert gas (MIG) arc welding [13]. As for the quality evaluation of arc welding products, many previous contributions have paid a lot attention to it. Casalino et al. [14] employed neural networks to establish a relation between process parameters and geometry of the molten zone of the welds, and then used a fuzzy C-means clustering algorithm to evaluate the quality. Wu et al. [15] used a Kohonen network to monitor the welding process and evaluate the quality in a GMAW process. The inputs were the probability density distribution (PDD) of the welding voltages and the class frequency distribution (CFD) of short circuiting times, and the network can recognize and classify the undisturbed and intentionally disturbed GMAW experiments. It can be noticed that the AI technology can be proper in estimating the quality of weld bead and exert remarkable effects.
This work aimed to explore how to obtain an optimal parameters matching in order to obtain the weld bead with satisfactory quality, while researching the influential levels of the key operational parameters on the different performances of the weld beads. The DP-GMAW process involves various input parameters, and the quality of weld bead also includes a lot of evaluation criteria. To achieve preliminary goals, two main contents have been included in this work. The first was the optimal parameters machining. Among various operational parameters, few key operational parameters were selected to do experiments. To achieve the desired effects and decrease experimental complexity, orthogonal experimental design, which is an important experimental design method to explore the system effects typically involving multiple factors and multiple levels [16], was employed. This experimental design method can reduce the workload and involves corresponding methods of analyzing the experimental results, so to yield more reliable conclusions [17].
After employing orthogonal experimental design to obtain weld beads using different operational parameter combinations, an appropriate quality evaluation method can be used to estimate the experimental results. Because the quality of weld bead involves various elements, the quality evaluation method should also be a multi-input system. In addition, to clearly reflect the evaluation results, the output is better when quantitatively presented. In this work, considering the characteristics of weld beads and application of current AI technology, fuzzy comprehensive evaluation (FCE), which was an effective evaluation method based on the fuzzy sets and fuzzy mathematics, was chosen to conduct the quality evaluation for the weld beads. FCE was introduced in the 1960s, and has become an effective multi-factor decision-making tool for comprehensive evaluations so far. During the actual application, combining with the expert experiences, this method can make a full and comprehensive refection on the evaluation criteria and the influence factors of fuzziness, and produces evaluation results closer to the actual situation [18]. It has been used in a lot of different areas, such as in power policy making [19], teaching and education performance evaluation [20], motion performance evaluation of autonomous underwater vehicle [21], water resources carrying capacity [22], distinct heating system evaluation [23], real estate investment risk research [24], quality assessment for compressed remote sensing images [25], and other relative areas.
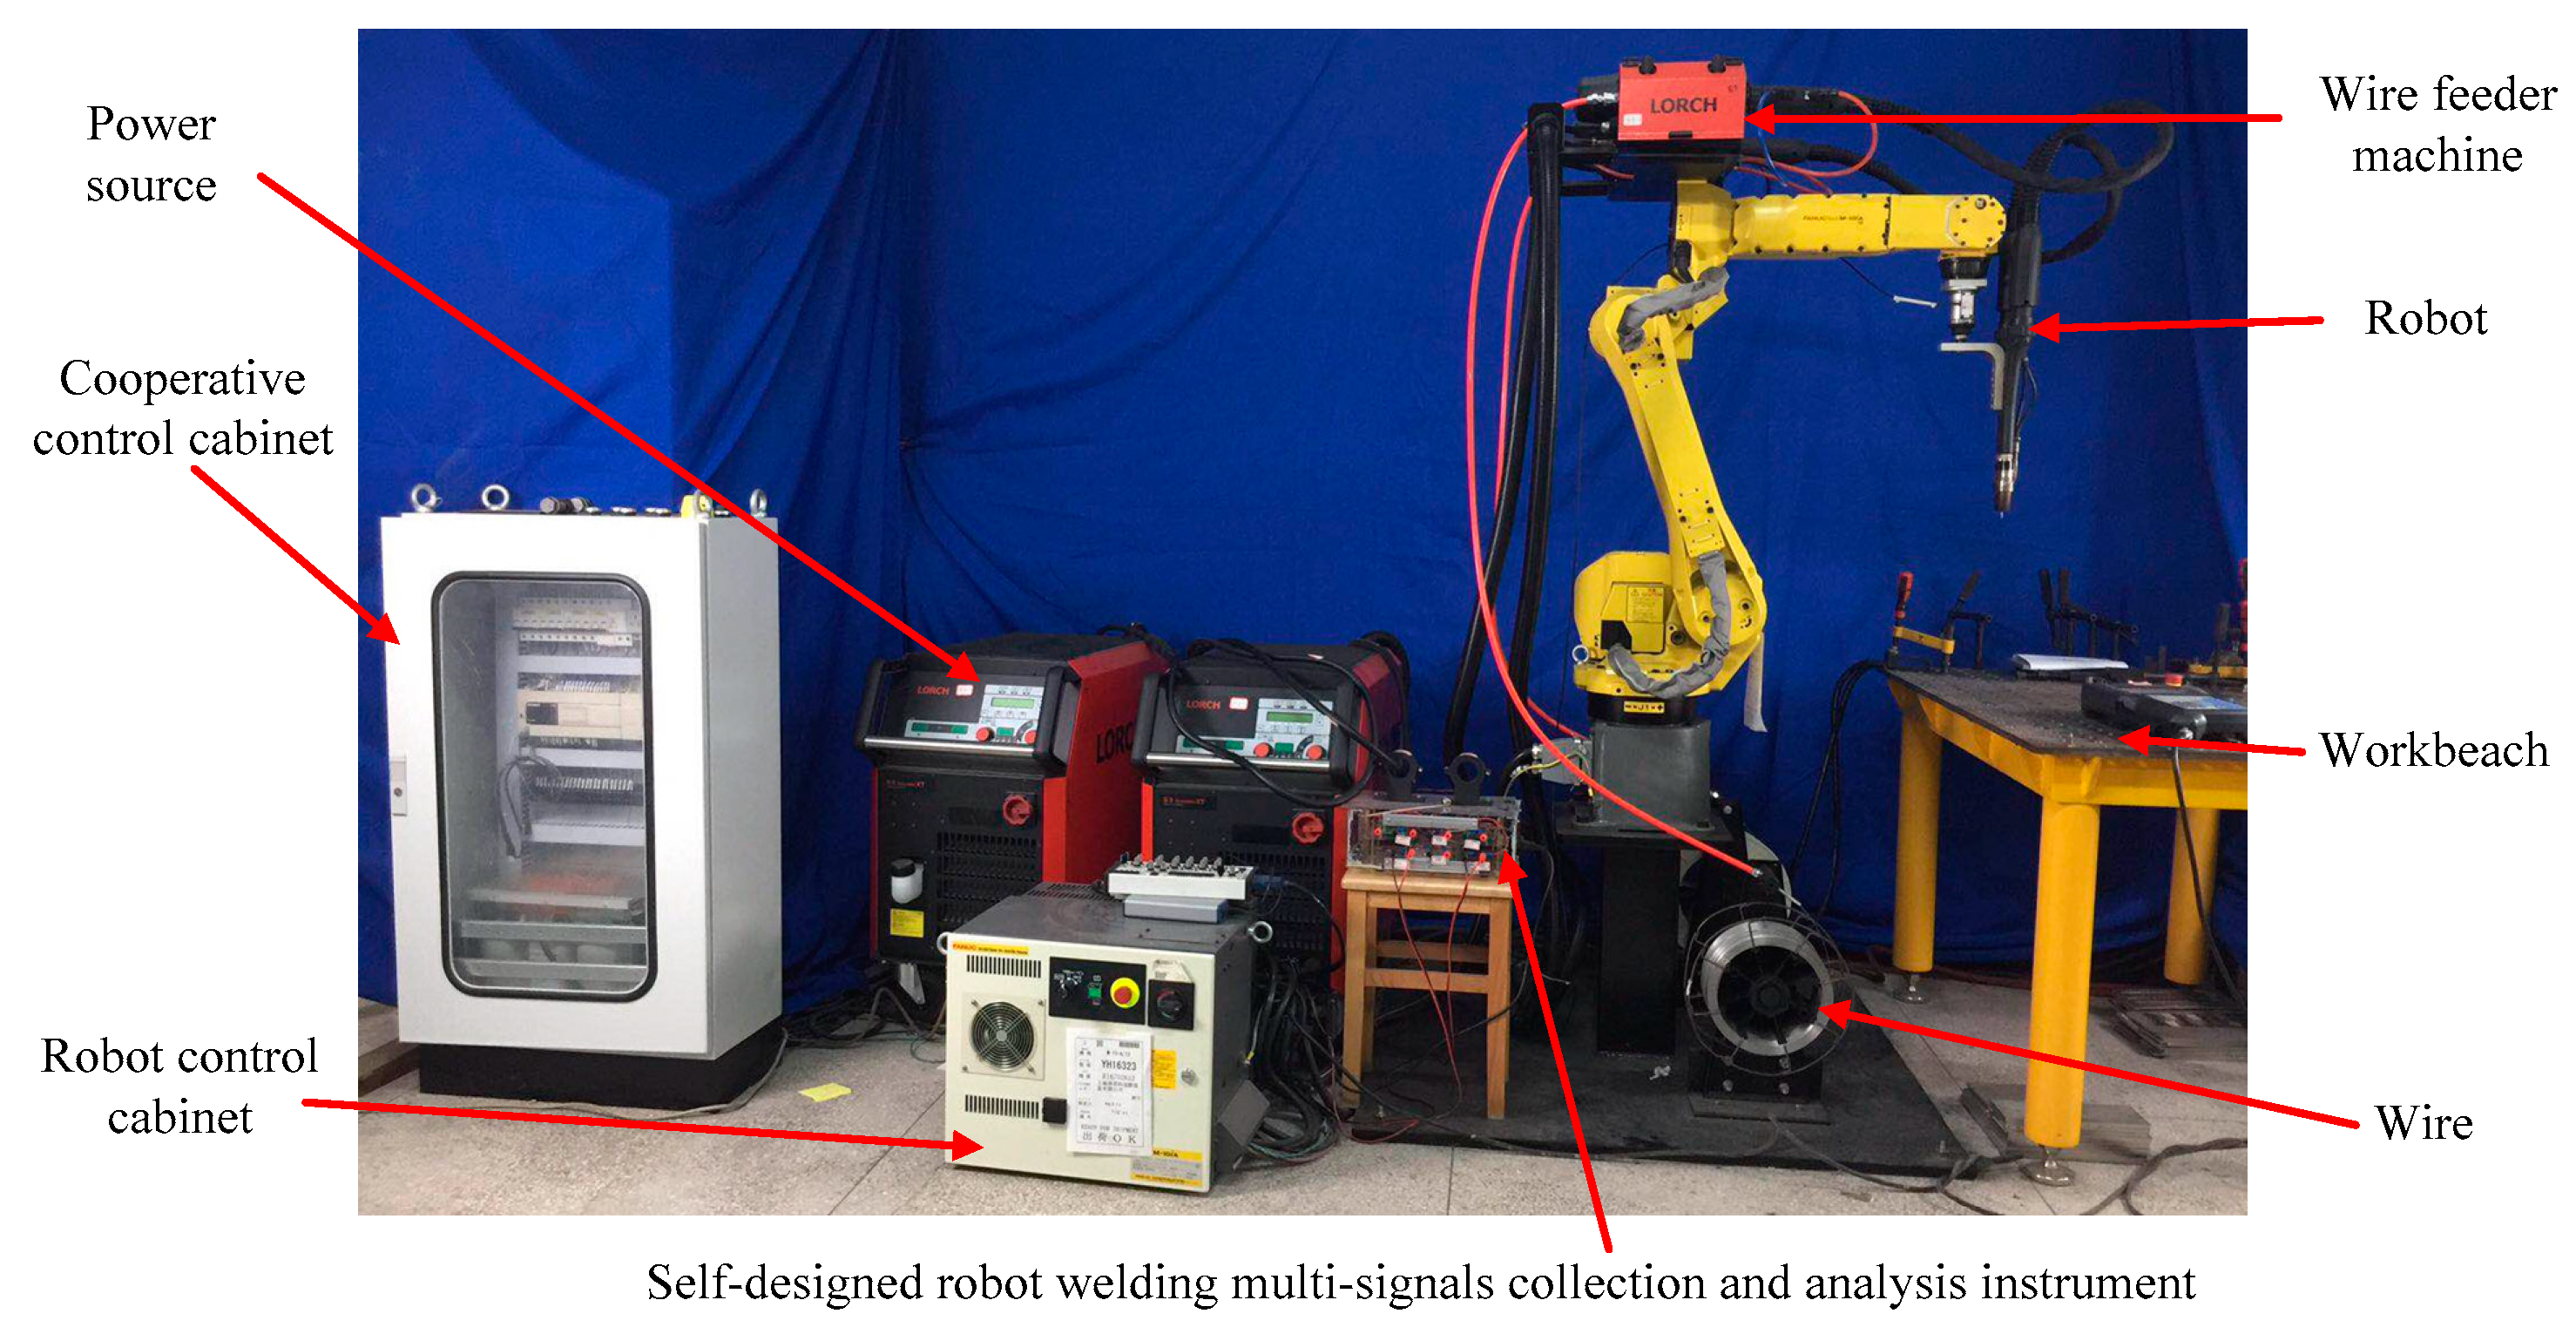
In this work, the DP-GMAW process based on an industrial robot operation was conducted, the objective was seeking optimal operational parameters combination in order to obtain weld bead with satisfactory quality, and obtaining the influential levels of different operational parameters on the performances of the weld bead. During the process, according to principle and operational characteristics of this process, some key operational parameters were selected to design orthogonal experiments, and then the FCE method was employed to do quality evaluation according to relative experimental results and obtained optimal operational parameters combinations. Advanced experimental designing methods and quantitative quality evaluation methods were effectively combined in this work, and the contribution can serve the current DP-GMAW process improvement and parameter optimization.

2. Operational Characteristics of the DP-GMAW Process

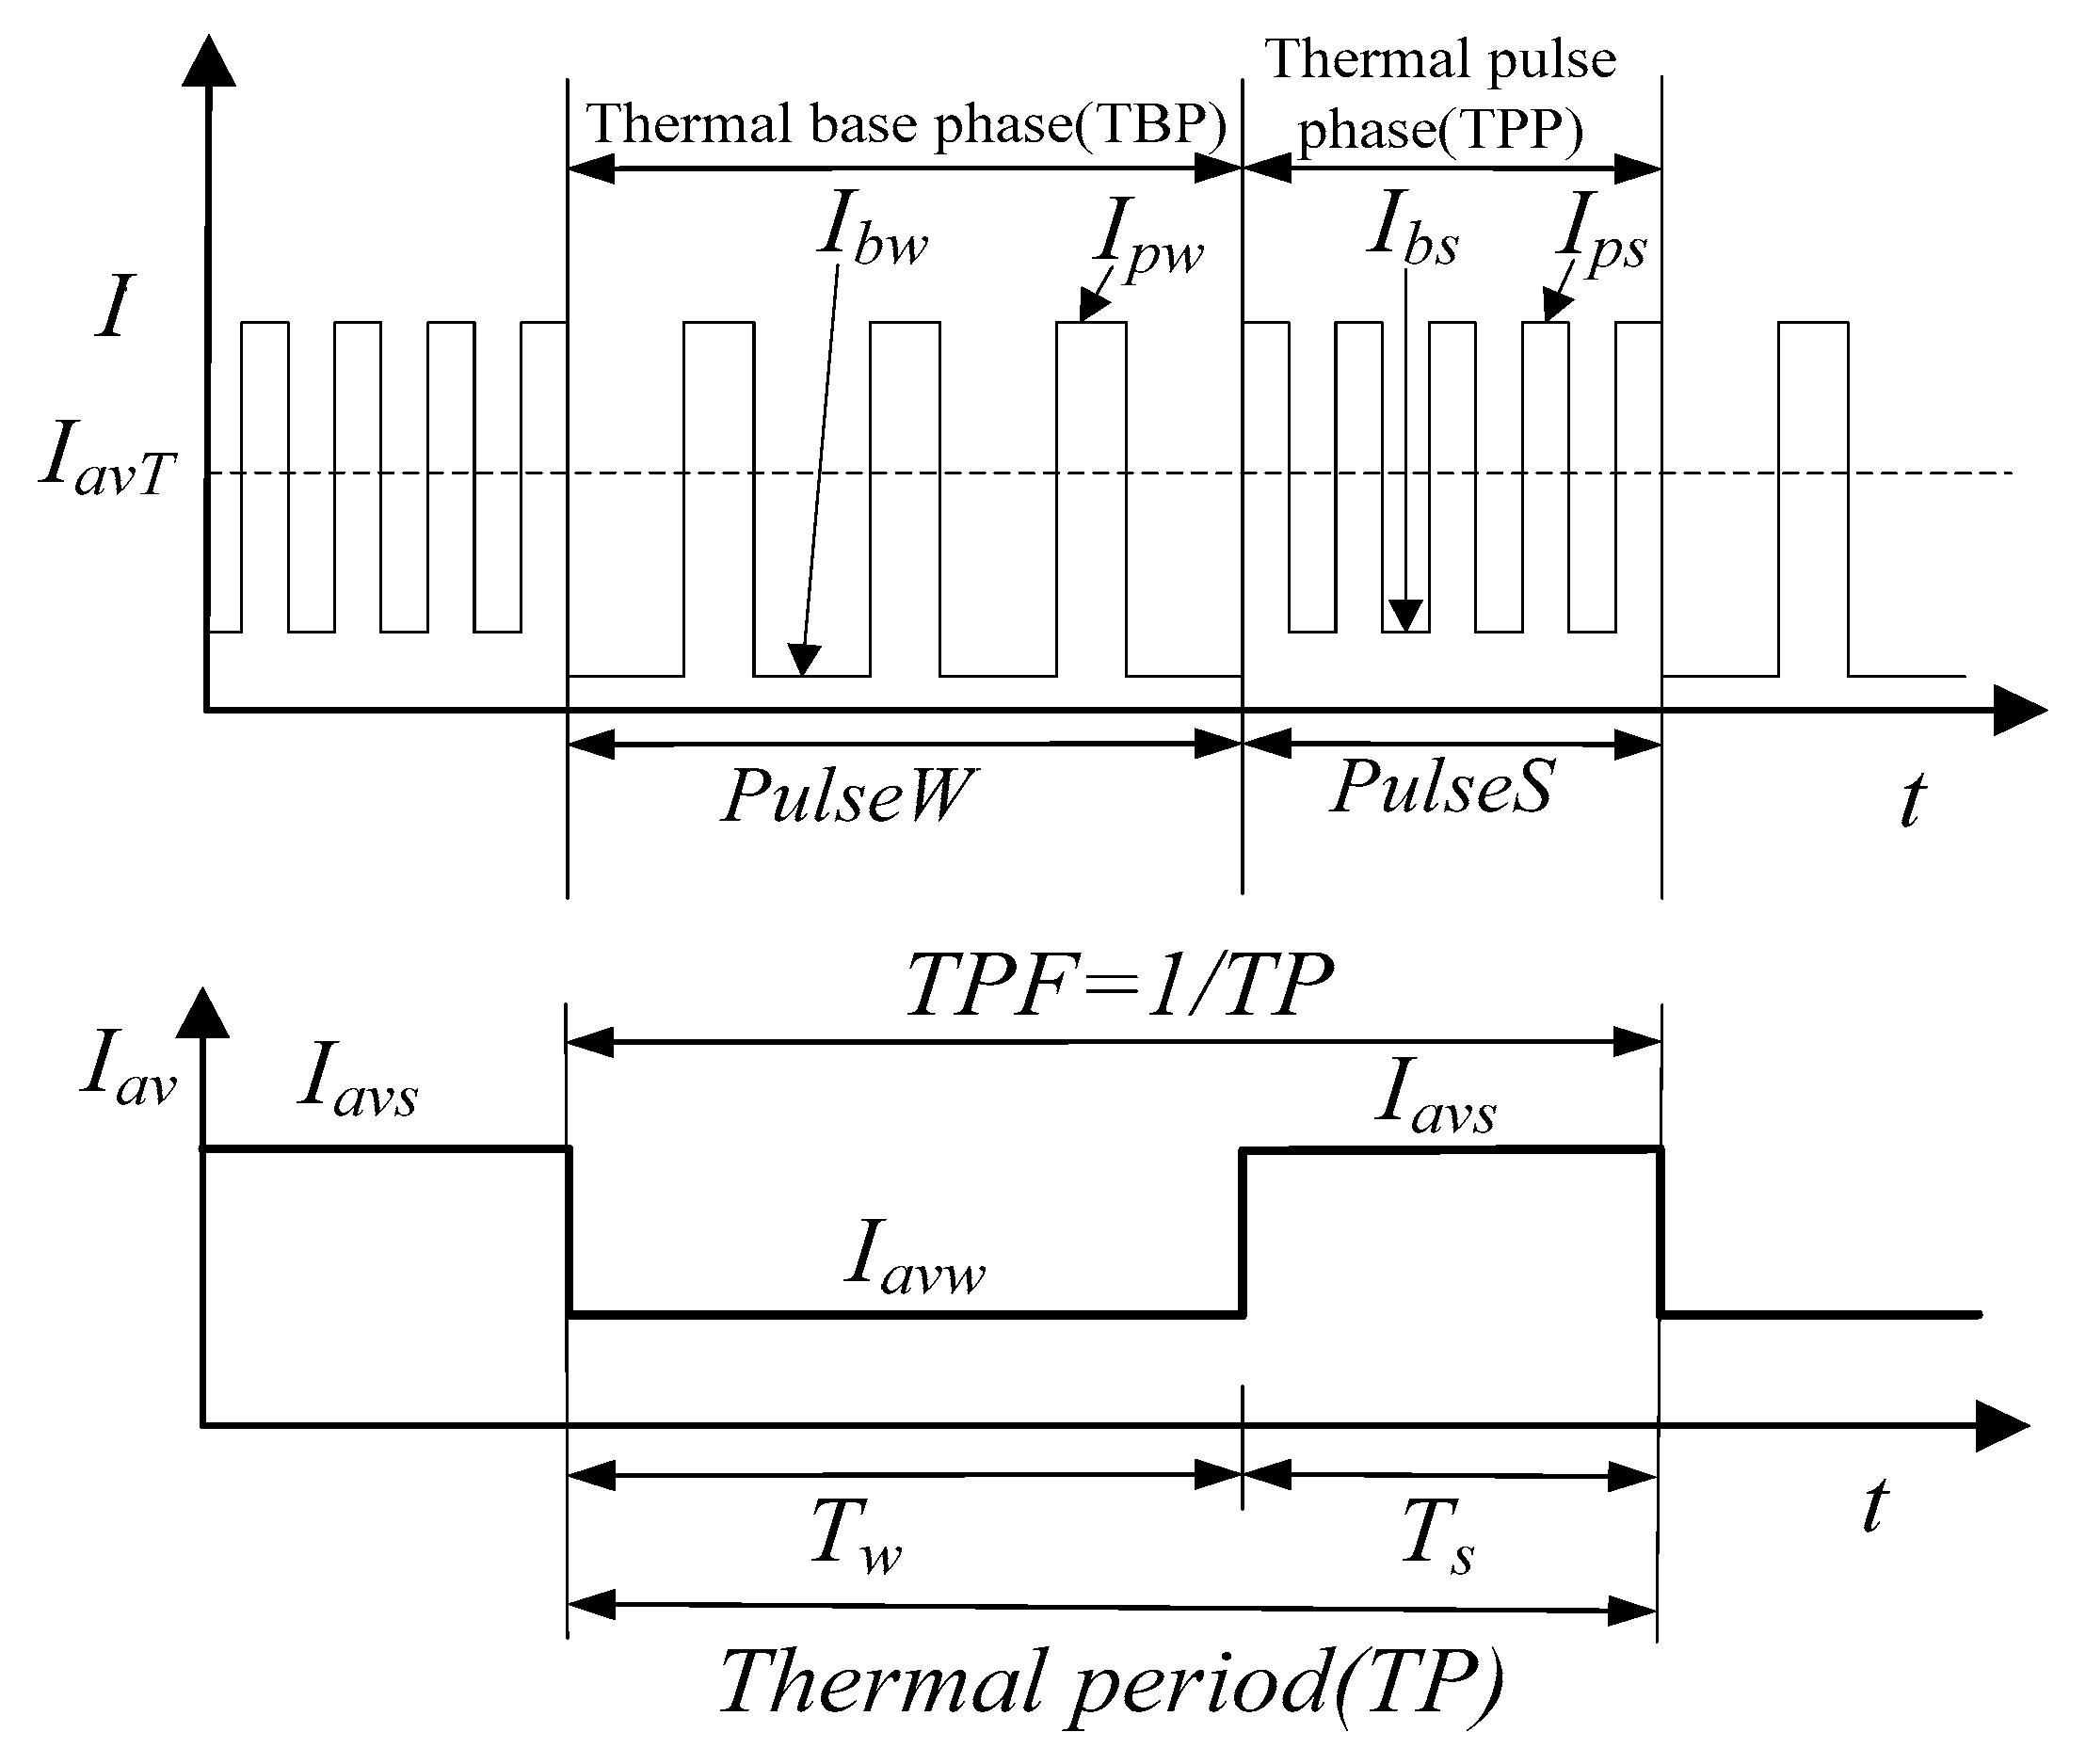
The DP-GMAW process involves a lot of typical operational parameters. The current pulses in TPP and TBP have different frequencies. The thermal period (TP) denotes the duration of two phases. Another important operational parameter, twin pulse frequency (TPF), which is a reciprocal of the TP, can describe the speed of current waveform adjustment between the two double pulses. Also, the TPF can determine the number of fish scale ripples. It can be noticed that this process is a low frequency modulation based on high frequency phases (TPP and TBP), in other words, the low frequency current pulsation or the thermal pulse is superimposed on a pulsed current for active metal transfer control and weld pool stirring [26]. During the process, TPF can reflect the varying speed of the strong set and weak pulses set, and each set may include up to 10–20 high frequency pulses, the maximum frequencies of the pulses may achieve is 100 Hz. Hence, in a general case, the value of TPF is below 5 Hz. The welding currents were switched between two high frequencies with TPF of the switch frequency. The frequency in TPP is higher than that in TBP, and the pulse set in TPP is called a strong pulse set, which is signed as PulseS, and the pulse currents are switched between base current Ibs and peak current Ips while the pulse set in TBP is called as weak pulse set, which is signed as PulseW, the corresponding base current and peak current are respectively Ibw and Ipw. The durations of TPP and TBP were, respectively, Ts and Tw. In addition, the proportion of the time of thermal pulse phase, which is Ts, in one thermal period TP, is called twin pulse relation, which can be mathematically described in Equation (1):
DT = Ts/TP
where this parameter is denoted as DT in this work.
The strong pulse set is to control the droplet transfer for obtaining enough welding penetration, in a general case, one pulse corresponds to one droplet, while the function of the weak pulse set is obtaining a series of regular pulses to stir the weld pool [27], and one TBP corresponds to one weld pool. In addition, the average current in TPP is Iavs, while the average current in TBP is Iavw, and the average current in one thermal period is marked as Iav. In general, the Iav is a preliminary arc welding setting value during the process. Under this circumstance, the regular fish scale grain can form if all the parameters are properly set. 
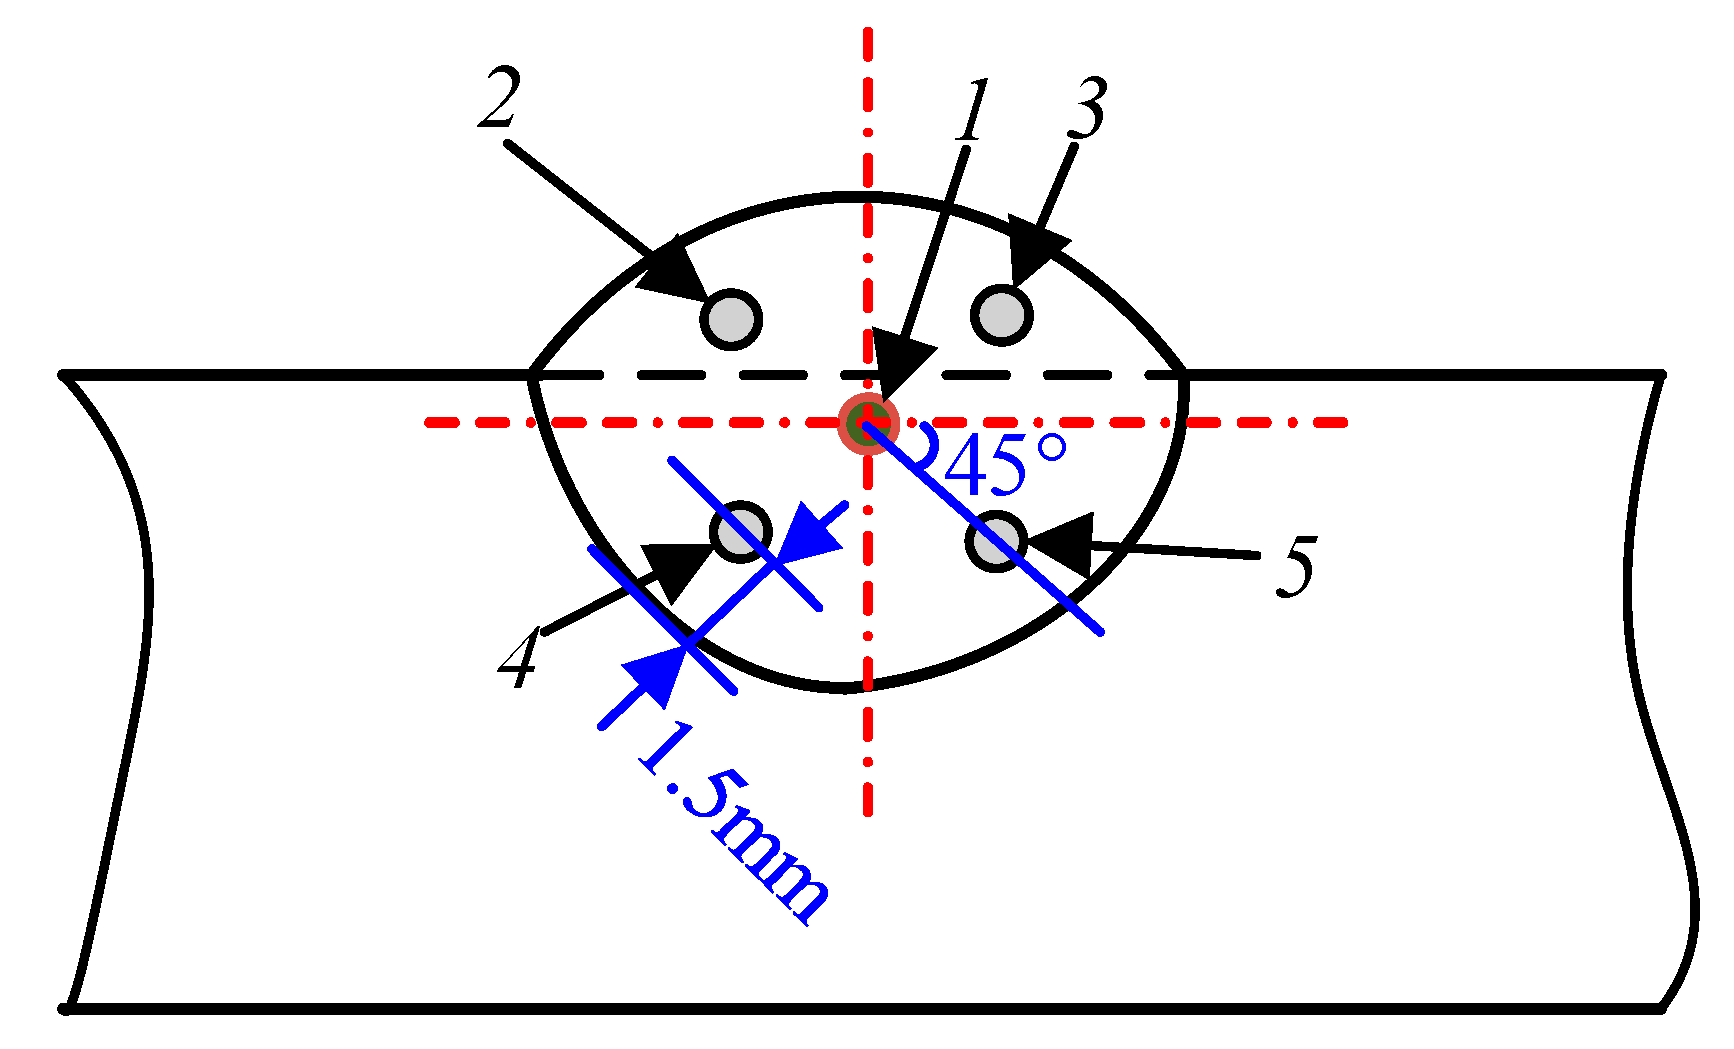
Figure 1 shows the schematic and main operational parameters of the DP-GMAW process.
In this figure, TP is the sum of Tw and Ts. Apart from the relations shown in the Figure 1, twin pulse current change, whose value is half of the subtraction between mean value of currents in TPP and TBP, is also an important parameter during the process because it can reflect the current variation in between two phases. In this work, to clearly reflect the current adjustment, this parameter can be described combining the Iav and in percent format as in the following equation:
I Δ = I a v s I a v w 2 I a v × 100 %
where IΔ is called twin pulse current change in percent. Moreover, the relations between IΔ, and Iavs as well as Iavw, can be also be derived as follows:
{ I a v s = I a v × ( 1 + I Δ / 100 ) I a v w = I a v × ( 1 I Δ / 100 )
During the welding process, proper combination of the operational parameters of the pulse sets in TPP and TBP, and other process parameters, are the utmost important for improving the welding quality and obtaining weld bead with satisfactory fish scale ripples. During the traditional DP-GMAW operation process, various relative operational parameters cannot be accurately adjusted and matched one by one. In this work, the latest twinpulse XT DP control technology developed by the LORCH Company was employed. This process has two significant features:
  • The pulse frequency in TPP is so high, which can achieve 100 Hz, on the other hand, the pulse frequency in TPB can also achieve 30 Hz, and both of these two pulse frequencies were higher than those of traditional DP- GMAW process.
  • The peak current and base current in TPP and TPB are unchanged when the average current Iav in one thermal period is unchanged. The process control can be conducted through only adjusting average current Iav and the twin pulse relation DT, then the parameters about PulseW and PulseS can correspondingly vary and need not to be adjusted, so that the number of operational parameters during the process which are required to be adjusted can be significantly decreased. Using this new control technology, the operational parameters of the arc welding process can be more effectively set and matched.
According to the above introduction about the DP-GMAW process, it can be noticed that there are various operational parameters included in the DP-GMAW process, and to obtain the weld bead with satisfactory quality, all the operational parameters should be carefully and seriously considered. Employing twinpulse XT DP control technology can decrease the setting complexity and improve the control performance, because this new control technology can use a few key operational parameters to control two waveforms, some important process parameters, such as peak current, base current, frequency, duty cycle, peak current, base current, peak time, base time, did not individually set. Therefore, realizing the proper control of energy delivery into the base plate was so convenient. Then in the next section, corresponding experiments can be conducted to produce weld beads with different qualities, and then the influential levels of different operational parameters on the selected performance of weld bead can be seriously explored after combining selected quality evaluation method.

3. Experimental Design of the DP-GMAW Based on Robot Operation

3.1. Experimental Platform

In this work, corresponding experimental design had been conducted. The experimental platform was composed of a FANUC Robot M-10IA industrial robot (FANUS Corporation, Oshino-mura, Yamanashi Prefecture, Japan), a LORCH S-RobotMIG arc welding machine (Lorch Schweißtechnik GmbH, Im Anwänder, Auenwald, Germany), a wire feeder machine, a welding torch and other auxiliary equipment. During the experimental process, the industrial robot controlled the welding speed, the current waveforms in TPP and TBP were controlled by the LORCH arc welding machine. In addition, one self-designed robot welding multi-signals collection and analysis instrument, which was based on the USB-6363 data acquisition card developed by NI (National Instruments) company (Austin, TA, USA), can be utilized to synchronously collect and analyze the current, voltage, arc sound signals. Figure 2 presented corresponding experimental instruments.
Where two cabinets were used in the experiment. The robot control cabinet was responsible for the robot control operation, while the cooperative control cabinet was responsible for coordinately controlling the DP-GMAW process and robot operation.

3.2. Experimental Conditions and Methods

3.2.1. Experimental Conditions

The experimental conditions used in this work was follows: the base plates are the stainless steel 304, whose tensile strength was 520 MPa, the diameter of the used welding wire was 1.2 mm, and the material was stainless steel 316L. The shielding gas was composed of 98% pure argon and 2% CO2 (15 L/min flow), the length of wire extension was 12 mm, and flat surfacing welding was used. The size of the base plate was 250 mm × 100 mm × 3 mm. The material characteristics of the base plate and the welding wire was shown in Table 1.
To accurately reflect the effects of the different operational parameters on the welding quality, the base plate should be carefully preprocessed: the surface has been processed by angle grinder to eliminate the oxides, and then washed by special alcohol. After the surface of base plate was clear and dry enough, the welding action can be taken.

3.2.2. The Design of Orthogonal Experiments

Orthogonal experimental design is a powerful tool to deal with the system with multiple input parameters. The method can pick some typical parameters combinations from full possible combinations to conduct the experiments. According to corresponding analyses for the experimental results to comprehensively figure out the full experimental situation, and then obtain an optimal parameters combination. This method can reduce the number of the experiments and instruct to seek an optimal parameters combination for a special system.
To further explore the effects of some key operational parameters during the DP-GMAW process on the quality or other performances of the weld bead, according to the principle and characteristics of this welding process combined robot operation, four key operational parameters, which were robot welding speed VR, twin pulse frequency TPF, twin pulse relation DT and twin pulse current change in percent IΔ, were chosen to design orthogonal experiments. The average welding current Iav during the process was set to 80 A, and the electrode inclination angle was 86° using backward inclination mode in this work. After serious preliminary analyses and process experiments, the value ranges of some main parameters can be confirmed during the ranges which the welding action can be normally conducted. Each chosen operational parameter corresponded to three levels as shown in Table 2, and then a detailed orthogonal experimental design, whose form was L9(34) with a four-element-three-level, can be depicted as shown in Table 3.
Hence, to sufficiently explore the effects of different operational parameters on the quality or other performances of weld bead, nine experiments with different effective parameters combinations should be conducted.

3.2.3. Quality Evaluation of the Weld Bead

After orthogonal experimental design using chosen key operational parameters with different levels, for different experimental results, an accurate quantitative quality evaluation should be employed. In this work, the FCE method was introduced to quantitatively evaluate the quality of weld bead. Because this evaluation method can provide quantitative evaluation results based on some input conditions, and the quality of weld bead involves various different aspects including the appearance and shape, microstructure, and process stability of electrical signals, hardness and tensile performance, and so on, these quality criteria can be inputs of the FCE model using fuzzy mathematical algorithm, and then quantitative scores can be obtained.
FCE used the principle of fuzzy logic to evaluate the targets. There were two important procedures, the first was making evaluation using single element, while the second was making comprehensive evaluation using all elements. The detailed evaluation steps are shown in many published contributions [18,23,25]. In the next section, FCE can be employed in quantitatively estimating the quality of weld bead after orthogonal experiments.

4. Experimental Results and Analyses

A series of corresponding experiments were conducted based on the orthogonal experiment design as shown in Table 2 and Table 3. Then, to deeply understand the welding quality, some relative measurement, observation and testing, which included appearance, shape parameters measurement, microstructure observation, tensile and harness testing, stability of electrical signals, can be sequentially conducted.

4.1. Appearance and Measurement of the Weld Beads

First, the macroscopic appearances, and cross-sections of weld beads of L1–L9 are shown in Table 4. In the table, the photos of the cross-sections of the weld beads, which were obtained using a microscopy with 20 times magnification, were provided. It can be observed that the overall appearance of the weld bead of L1 was unsatisfied, the grains of the fish scale ripples were rough, and there were some unfused parts appearing in the edge of the bead. The appearance of weld bead of L2 was still unsatisfied, the widths and heights of the ripples were non-uniform, as well as the weld bead was not straight and some curved bead existed. The bead of 2–5 cm was so thick, but the thickness in 7 cm was suddenly decreased, which meant that some sudden transitions occurred during the process. In addition, arc pits appeared in terminate of the bead. The quality of weld bead of L3 was very low and the appearance was irregular. Sudden transitions appeared in 10–15 cm, and serious splashes occurred in 13 cm, also, the shape located in the terminate was seriously irregular. The weld bead of L4 was regular and successive without any arc interruption or short-circuit occurring, however, the grain of the fish scale ripples was a bit rough and some unfused ripples appeared. The weld bead of L5 has high quality, the bead was straight and regular, and both of the penetration and height were reasonable. Moreover, compacted fish scale ripples are shown in the bead, and no obvious splash appeared during the process. The weld bead of L6 was very thin and high, and fish scale ripples were so obvious. However, the edge of the bead was irregular, and a few splashes occurred during the process. The weld bead of L7 was successive, but some irregular humps in the bead can seriously affect the mechanical performances. Both of the weld beads of L8 and L9 were regular, the overall shape of the bead was thin and high, though some splashes occurred during the process. According to the cross-sections of all the weld beads, the penetration of the weld beads in L1–L3 was so large that full penetrations appeared, while the widths of bead were irregular with a bit large. The penetration of weld bead of L4 was small, while the penetration of weld bead of L5 was 60% of the whole thickness of the base plate, which showed the penetration was proper. In addition, the penetrations of weld beads of L6, L8 and L9 were a bit small, while the penetration of weld bead of L7 can reach half of the whole thickness of the base plate.
Furthermore, to further understand the morphology of the weld bead, detailed measurements for the shape of the weld bead were also conducted. Relative key measurement parameters of the shape can be seen in Figure 3.
Where the key shape parameters included bead width B, bead height h, penetration H. Then for the above nine weld beads, corresponding measurements were also conducted; the results are shown in Table 5.
Combined with Table 4 and Table 5, it can be noticed that the bead height h of L1 was proper, while the same item of L3 was relatively larger. However, the bead height of L3 was irregular with some heaves appearing on the surface; in addition, the transition was also not smooth. Under this circumstance, the stress may concentrate, which may deteriorate the load bearing capacity of the joints, and the cracks may appear when special loads were applied, which can affect the appearance of the weld bead. In addition, the penetration of weld beads of L1–L3 were so large, even full penetrations appeared, and the values of the bead width were also large enough. According to the observation of the cross-sections of these three beads, the forming situation was also not satisfactory. The bead height and bead width of L4 and L5 were proper, however, the penetration H of weld bead of L4 was small. The value of bead height h of weld bead of L6 was a bit larger, this was because both of the penetration and the bead width were relatively small, which showed the thin and high weld bead as shown in Table 4. The reason for this phenomenon was that the heat delivery was not sufficient during the process. The weld bead of L7 was hump type bead, which had irregular bead height h, and the stress may concentrate under this situation. The bead heights of L8 and L9 were proper, but the values of penetrations were small. Especially for the weld bead of L9, the bead width B was very small, so the overall bead appeared high and thin, therefore the forming situation was not well enough.

4.2. Materials Characteristic Performance Analyses of the Weld Beads

4.2.1. Analysis of Microstructure for the Weld Beads

The grain size is very important for the material characteristics, especially for the metals. The influence of grain size on the materials characteristics actually resulted from the influence of the grain boundary surface area. A smaller grain size denotes a bigger grain boundary surface area, and larger influence on the materials characteristics. In general, smaller grain size means higher strength and stiffness, as well as higher toughness and ductility for the metals in room temperature. This is because a plastic deformation can occur in more grains when the grain sizes are smaller, which can make the deformation more equal. Moreover, smaller grain size means more overall grain boundary surfaces, and boundaries are more complex, which can make the combination of different grains may more compacted. Under this circumstance, the propagation and growth of the cracks may be effectively prevented, which means that the metal has good strength and toughness.
To explore the materials characteristics, above nine weld beads can be observed by Phenom pro-electron microscopy (Thermo Fisher Scientific Inc, Waltham, MA, USA), which has 2000 multiplication times. The observations can be seen in Figure 4. In addition, to clearly present the grain sizes of the weld beads, the grain length was introduced to describe the grain size. In general, smaller grain length meant smaller grain size. For these nine weld beads, the corresponding grain length were 10.8, 10.38, 11.74, 9.64, 7.94, 9.00, 8.44, 6.53 and 6.75 μm from the weld beads from L1 to L9. It can be noticed that all the microstructures were cellular grain structure. The grain sizes of the weld bead of L1–L3 were larger, while the grain sizes of weld beads of L4–L6 were relatively smaller. In addition, the grain size of weld bead of L4 was a little larger than that of L5 and L6, and the weld beads of L7–L9 have the smallest grain sizes.

4.2.2. Performance Testing for the Weld Beads

To comprehensively obtain the performances of the weld beads of L1–L9, key performance tests can also be conducted in this work, in this part, tensile and hardness testing were carried out.
The first was the tensile testing, which was employed to test the axial toughness of the weld bead at room temperature (20 °C). The instrument used the WA-600 hydraulic universal testing machine (Yangzhou Jiangdu Open Source Test Machinery Factory, Yangzhou, China) to explore the toughness of the weld beads. Two terminals of each weld bead were seriously processed in order to conveniently hold, and then each specimen can be stretched to completely fracture. The species and experimental results are shown in Figure 5.
It can be noticed that the species of L1–L8 were fractured at the base plate which located in terminals of the weld beads, only for the weld bead of L9, the fracture occurred in the middle of the weld bead, and this bead had the longest elongation. The elongation of each specimen is recorded in Table 6.
Combining the observation and analysis results about microstructure of the weld beads in preceding part, the results in Table 6 showed that the weld beads which had larger grain sizes had stronger toughness, and as the grain sizes decreased, the toughness was weaker and weaker.
Apart from the tensile testing, the hardness testing was also conducted. The measuring instrument used the SCTMC HR-150DT electric Rockwell hardness tester (Shanghai Shangcai Testermachine CO., LTD, Shanghai, China) to test the harness for the weld bead. To accurately reflect the performance of the weld bead, five testing points were selected from the cross-section of each weld bead to conduct the hardness testing. The first testing point was in the center of the cross-section, and other four testing points were evenly distributed. A Cartesian axis was used, the origin was the center, and the horizontal axis was a line which went through the origin and parallel the surface of the base plate, while the vertical axis was a line which also went through the origin and vertical to the horizontal axis. Then, the four testing points were distributed in the four quadrants and the distance between the point and the edge the bead was 1.5 mm, as shown in Figure 6, and the applied external force on each point was 980.7 N.
Where the dotted lines were axes. Then both maximum and minimum values in the five output values were rejected, and the final result was the mean value of the other three values for each specimen, corresponding results for nine weld beads are shown in Table 7.
Where HRB is the abbreviation of Hardness Rockwell B, which is a commonly used criterion to describe the hardness of the weld bead using stainless steel. According to the testing results, it can be observed that each three tests formed one array, and there were three arrays in the experiments: the first array was from L1 to L3, the second array corresponded to L4 to L6, while the last array referred to L7 to L9. The overall hardness was increasing from the first to the third array. The harness values from L1 to L3 were very small and the values were so approaching. The average value of the second array was about 78.5, which was a little bigger than that of the first array. The third array had the biggest HRB values, whose average value was about 80. The HRB of the base plate was 73, which denoted that the hardness of these weld beads was higher than that of base plate. It can be concluded that the variation characteristic of the hardness was approximately the same as that of grain size.

4.2.3. The Correlation Analysis

According to above analyses, it is noticed that the toughness and hardness of the weld beads were relative to the grain size. To analyze the relations between grain size, and toughness as well as the hardness, corresponding correlation analyses had been also conducted.
Firstly, the nine weld beads can be ranked according to their grain sizes as shown in Figure 4. The weld bead with the smallest grain size can be marked as “Excellent”, while the weld bead with the largest grain size was marked as “Poor”, the other weld beads can be considered as “Good” and “Medium”. Also, because the ranking values, toughness and hardness values had different value ranges, the normalized data processing must be conducted, in other words, the grain sizes, elongations and HRB values in the tensile testing were processed in between 0 and 1. The final results can be seen in Figure 7.
The vertical axis was the normalized parameter value whose range was between 0 and 1, the horizontal axis denoted the weld bead of L1–L9. It can be seen that the toughness, hardness and grain size of the weld beads had the approximately the same variation tendency.
Then, the correlation coefficients of above relation can also be calculated following the Equation (4), and the larger value of correlation coefficient denotes a greater degree of correlation.
r ( X , Y ) = C o v ( X , Y ) V a r [ X ] V a r [ Y ]
where r(X,Y) referred to the correlation between X and Y, Cov(X,Y) denoted that the Covariance of X and Y, and Var[X] and Var[Y], respectively, referred the variances of X and Y. The correlation coefficient between the ranking by grain sizes and the elongations of weld bead in the tensile test was calculated to be 77.56%, and the corresponding values between the ranking by grain sizes and hardness values was 84.35%, which can be considered as significant correlation. It can be concluded that a smaller grain size meant better toughness and higher hardness. Hence, in the following multi-parameter analysis, only considering the grain size should be enough.

4.3. Stability Analysis of the Electrical Signal

In this work, a one self-designed multiple-sensor-signal fusion system was employed to online collect the welding voltage and current signals. Using collected signals, the stability analysis of the welding current, which was closely relative to the stability of welding process and quality of weld bead, was conducted. After sampling all of nine welding current signals, three current signals corresponding to different stabilities, which were L3, L5 and L7 according to above analyses, were selected to make detailed stability analyses, corresponding results are shown in Figure 8, Figure 9 and Figure 10. Figure 8 shows the transient welding current waveform and corresponding possibility density function (PDF) results of welding current of L3. The PDF of the welding current, together with the transient welding current, were commonly employed methods to evaluate the stability of welding process [28,29]. As shown in Figure 8a, the larger values of welding current appeared in 37.7–37.8 s and 38–38.5 s; the values were above 350 A; this was because the welding currents were unstable, which can induce the metal transfer non-uniform, and short-circuits occurred so that the transient welding currents sharply increased. While in Figure 8b, two convex peaks appeared at 17 A and 36 A; this was because the base current in TBP and TPP were respectively 17 A and 36 A. another convex peak appeared at 316 A, which was the peak value of the pulse current. However, there are some current possibility densities distributed beyond 316 A; this was because the welding current was unstable, and big volume metal transfer may occur, which can also induce short-circuits and make the welding current sharply increase; this was why the welding current can be distributed from 316–400 A. Also, the welding current can be distributed from 0 to 17 A, the 0 A of the welding current denoted the open-circuit occurring. The appearance of short-circuit and open-circuit showed that the welding current was unstable.
Corresponding figures of L5 are shown in Figure 9. The signal in Figure 9a was so regular, which denoted that the process had no short-circuit or open circuit. While in Figure 9b, the possibility density distributions were concentrative on three convex peaks, which corresponded to 21, 32 and 316 A. These three current values were the base currents and peak currents in TPP and TBP. The variation of possibility density distribution curve had large slopes, which meant the current sharply changed. In addition, there was no current distributed in 0 A and beyond 316 A, which also demonstrated that no short-circuit or open circuit occured, and the currents were smoothly switched between bases and peak values.
Figure 10 shows the corresponding analyses results of L7. The signals in Figure 10a were regular, which denoted that no short-circuit and open circuit occurring. While in Figure 10b, the current possibility density distribution concentrated on three convex peaks, which were 19, 35 and 316 A corresponding to the base currents and peak current in TPP and TBP. However, the slopes of variation curve were smaller than that in Figure 9b. In addition, there were small flat slopes at 19 A and 35 A, which showed that the current cannot be stable in these setting values. Moreover, the current possibility density increased from 175 to 316 A, the amplitude was about 0.001%, which meant the current had a small variation over this range.
According to detailed analyses and comparisons of Figure 8, Figure 9 and Figure 10, it can be noticed that the welding current in Figure 8 was the most unstable, whose stability can be ranked as “Poor”. The welding current in Figure 9 had the highest stability and can be ranked as “Excellent”. The stability of welding current in Figure 10 was a little worse than that of Figure 9, and can be ranked as “Good”. The stability of the welding currents in between that of Figure 8 and that of Figure 10 can be ranked as “Medium”. In addition, in the above three experiments, it can be noticed that the peak values of the current pulses were the same, both in different experiments and in two current pulse sets, but the base values were different in different experiments and different current pulse sets. It was because the base values can be determined by the twin pulse frequency TPF and twin pulse current change, which were different in the above experiments.

4.4. Quality Evaluation of Weld Bead Using FCE

4.4.1. Evaluation Procedures

In this work, to employ the FCE method to evaluate the quality of weld bead, some steps were taken as follows.
Step1: Confirm the evaluation indexes elements set U for this work.
The most intuitive evaluation method for the weld bead is the appearance. In general, experienced welders can justify whether the process operational parameters are proper or not according to the appearance of the weld bead, and then make corresponding optimizations. Hence, the appearance was an important evaluation index element. In addition, the grain structure and size can determine the microstructure properties of the weld bead, therefore, the grain size was also an important index element. Moreover, some abnormal phenomena, such as short-circuiting, arc interruption and splashes, can induce the instability of the electrical signals, so the stability of the electrical signals can also be helpful for evaluating the quality of weld bead. Furthermore, the key shape measurement parameters of the weld bead were bead width, bead height and penetration. The bead height and penetration should follow a certain relation, hence, a new variable, which was bead height coefficient, was introduced to assist the evaluation, the bead height coefficient can be derived using a quotient between bead width and bead height (B/h). Also, the penetration and bead width should be individual evaluation index elements. Hence, a comprehensive evaluation index element set can be confirmed as shown in Equation (5):
U = {Appearance, grain size, stability of electrical signal, bead height coefficient, penetration, bead width}
Step2: Establish the evaluation indexes weights set W.
Considering the different levels of importance of above confirmed evaluation index elements, after consulting experienced experts and examined relative materials, corresponding weights set was shown in Equation (6):
W = { 0.3 , 0.3 , 0.2 , 0.06 , 0.07 , 0.07 }
Step3: Establish the evaluation results set V.
According to the experience of welding researches, hierarchy was used in this work, the quality evaluation of the weld bead can be divided into four grades, which are shown in Equation (7).
V = {Excellent, Good, Medium, Poor}
To provide accurate qualitative evaluation results, the four grades can correspond to mathematical values, as shown in Table 8.
In addition, the fuzzy operator used in this work was M (·,+) [21].

4.4.2. The Foundation and Evaluation Results of FCE

The foundation of quality evaluation for weld bead in this work can be seen in:
  • Weld bead had regular and a beautiful straight appearance, the fish scale ripple was compact, and no other obvious drawbacks, which can denoted that the weld bead had excellent appearance. According to the experimental observations, the appearance can be divided into four grades.
  • Smaller grain sizes denoted high quality of the weld bead, which can be also divided into four grades based on grain size.
  • Other four grades can also be divided according to the stability analyses of electrical signals, which included stability analyses of transient welding current and possibility density distribution.
  • The bead height coefficient whose value approached 4 denoted that the weld bead had high quality, while a proper penetration was that the value was beyond a half and approached 60% of the width of the base plate. At last, the bead width of the weld bead with high quality should be the width of base plate adding 3–4 mm. About these three criteria, four grades were divided for each criterion during the evaluation.
Hence, all of these five evaluation index elements should be divided into four grades, which used the division described in Equation (7) as shown in Step 4. Then using FCE algorithm, quantitative evaluation scores can be obtained. Corresponding evaluation for each criterion and final quantitative evaluation scores can be seen in Table 9.
As shown in Table 9, not only the individual evaluate criterion for weld bead was provided, but also the overall quality of weld bead can also be qualitatively presented, these results can also be used in the orthogonal experimental analyses in the following part.

4.5. Experimental Analyses

After obtaining the quality evaluation using FCE, which comprehensively considered various elements to accurately obtain the detailed analyses about how the process operational parameters affected the various elements which were important for the quality evolution of the weld bead, the orthogonal experimental analyses method was used in this work.

4.5.1. The Influence Analysis of Appearance on the Weld Bead

The first analysis target was the appearance, and the analysis was based on evaluation results in Table 9 and mapping between grades and mathematical values shown in Table 8. The analyses parameters selected the four key operational parameters, which were robot welding speed VR, twin pulse frequency TPF, twin pulse relation DT and twin pulse current change in percent IΔ. Each parameter had three different levels. For each parameter in each level, the corresponding Scoreavg can be calculated following Equation (8):
S c o r e a v g ( i , j ) = k = 1 3 S c o r e ( i , j , k ) 3
where i was the sequence of the operational parameter, i = 1, 2, 3 and 4, and j was the sequence of the level, j = 1, 2 and 3. For each parameter with one level, there were 3 scores in the experiment, these different scores were marked as k. The values of i, j and k were different under different situations. The value of Score can be obtained combing Table 8 and Table 9. Then, the influence analysis of four operational parameters on appearance is shown in Table 10.
Where the range value D can be calculated based on Equation (9):
D ( i ) = max j = 1 3 ( s c o r e a v g ( i , j ) ) min j = 1 3 ( s c o r e a v g ( i , j ) )
where the meanings of i and j were the same as those in Equation (8). It can be seen that the robot welding speed is the most influential factor on the appearance; the corresponding range value was 21.667, and the following influential factors were twin pulse current change in percent, twin pulse frequency and twin pulse relation. Hence, to obtain satisfactory appearance of weld bead, a proper combination of the robot welding speed and twin pulse current change in percent was very important. It was because the robot welding speed and twin pulse current change in percent can determine the amount of energy delivery into the base plate in one-unit length, and this energy delivery was a key factor which can determine the final appearance.
According to above analyses results, to obtain the weld bead with optimal appearance, the optimal level for VR should be Level2, the optimal level for TPF should be Level2, the optimal level for DT should be Level1, and the optimal level for IΔ should be Level1. Those corresponding values were respectively 30 cm/min, 2 Hz, 30% and 30%. Using these optimal parameters, an experiment was conducted and the result can be seen in Figure 11. It can be seen that the weld bead was straight and regular, and the fish scale ripples were so compact. The bead width and bead height were also proper, and the forming was satisfactory, which was the same as that in former analyses.

4.5.2. The Influence Analysis of Grain Size on the Weld Bead

Grain size is another important element affecting the quality of weld bead, corresponding analyses are shown in Table 11, based on the same calculation methods as that in the preceding part. It can be seen that the robot welding speed was still the most influential factor to determine the grain size. Higher robot welding speed denoted smaller grain size. When the robot welding speed was 40 cm/min, which corresponded to Level3 in the robot welding speed, the smallest grain size was obtained. It may be due to two reasons. The first was that when high robot welding speed was employed, the weld bead could be fast cooling, which induces the number of grains increasing and the size being reduced. The second reason was that the weld pool was stirred because a series of regular pulses with high and low frequencies were alternatively used during the DP-GMAW operational process, and then a high robot welding speed denoted more frequent stirring in the weld pool, which could deliver more extern energy into the liquid metal and energy fluctuations were more severe, which can also make the grain size smaller. Hence, to obtain a satisfactory microstructure of weld bead, the robot welding speed should be properly increased.
According to above analyses results, to obtain the weld bead with the most proper grain size, the optimal level for VR should be Level3, the optimal level for TPF should be Level2 or Level3, the optimal level for DT should be Level1, and the optimal level for IΔ should be Level1. Those corresponding values were, respectively, 40 cm/min, 2 Hz or 1 Hz, 30% and 30%.

4.5.3. Orthogonal Experiment Analysis for the Results of FCE

Apart from the appearance and grain size, which were important elements used in FCE, the results of the FCE method can also be analyzed using orthogonal experiment analysis, in order to obtain the influential levels of key operational parameters on the quality of weld bead. The analysis method was the same as in the above two analyses about appearance and grain size, however, all of the Scores used the accurate score of FCE in Table 9 and the parameters referred to the Table 3. The corresponding analyses results can be seen in Table 12. It can be seen that the effects of different parameters on the quality of weld bead were so obvious. The most influential factor was the robot welding speed of the welding robot and a corresponding range value achieved 24.283, and then the following factors were twin pulse frequency and twin pulse current change in percent, while the last was the twin pulse relation, whose influential effect was very low. It was because the robot welding speed can influence the heat delivery for weld bead and cooling rate of the weld pool. To obtain a weld bead with satisfactory quality, the system must provide a proper combination of robot welding speed and twin pulse frequency, which should appropriately match the average welding current and thickness of the base plate.
According to the range analysis results, the optimal parameter combination in these nine experiments can be obtained as follows: robot welding speed was 30 cm/min of Level2, the twin pulse frequency was 2 Hz of Level2, the twin pulse relation was 50% of Level3, and the twin pulse current change in percent was 30% of Level1. These parameter combinations can correspond to the L5 in the above experiments. Also, another testifying experiment was conducted to repeat testify this parameter combination. The obtained weld bead is shown in Figure 12.
It can be seen that the weld bead was regular with proper bead width. The appearance was bright with compact and smooth fish scale ripples. Also, the welding process was stable without short-circuit and interruption occurring. All of these characteristics meant that the weld bead with satisfactory quality can be obtained using this operational parameter combination.

5. Conclusions

In this work, the DP-GMAW process based on robot operation for stainless steel 304 was seriously considered; all of the operational procedures could be successfully accomplished, and stable welding processes and weld beads with satisfactory quality could be obtained. After introducing the principle and operational characteristics about this process, orthogonal experimental design based on four key operational parameters and corresponding performance testing, which included the appearance observation and key shape parameters measurement, microstructure analysis, tensile and hardness testing, as well as stability analysis of the electrical signals, were conducted. Then, the FCE method was employed to provide quantitative quality evaluation for the weld bead. According to the combined orthogonal experimental analyses about the appearance, grain size and FCE scores of quality of weld bead, an optimal operational parameter combination for each condition can be obtained. Based on these serious explorations, some important conclusions can be drawn:
  • The FCE method was employed in this work to evaluate the quality of weld bead, and during the evaluating process, the appearance, microstructure and key shape parameters measurement were comprehensively considered. This evaluating method can be helpful for realizing the quantitative evaluation for a weld bead.
  • The appearance of the weld can be mainly determined by robot welding speed and twin pulse current change in percent. The proper combination of these two operational parameters can achieve appropriate heat delivery into the weld bead in one-unit length, and then obtain a good appearance. In addition, the grain size was mainly determined by robot welding speed based on robot operation. Higher robot welding speed denoted the weld bead with smaller grain size, better toughness and hardness can be obtained with other operational parameters unchanged.
  • According to the orthogonal experimental analysis for the FCE scores of quality of weld bead, the most influential factor on the welding quality was the robot welding speed VR, the following were twin pulse frequency TPF and twin pulse current change in percent IΔ, and the last was the twin pulse relation DT. In the experiments in this work, the optimum process parameters were that the VR was 30 cm/min, the TPF was 2 Hz, the DT was 50% and the IΔ was 30%, which corresponded to the L5 in the experiments. Under this circumstance, the appearance was beautiful, and the obvious and bright fish scale ripples were obtained; in addition, the grain sizes were small enough, and the microstructure property was also satisfied when compared to that of other experiments.
This work can provide effective methods for analyzing the influential levels of key operational parameters on one or more performances of the weld, and then obtaining a corresponding optimal parameter combination. The work can improve the process parameter optimization and operational performance in the academic research or actual industrial production. In the future, corresponding works will probably continue to be applied in welding base plates of other materials, or other multi-parameter welding systems, and the influential levels of other operational parameters on the quality of weld bead will be further considered.

Author Contributions

There are three authors contributed to this manuscript. P.Y. conducted the experiments and analyzed the experimental results. K.Z. proposed the idea of the work, and originated the experiment, and write the paper. S.H. provided assisted works for the work, and calculated the fuzzy comprehensive evaluation scores and sorted out the experimental data, and conducted the microstructure observation experiments.

Funding

This research was funded by National Natural Science Foundation of China, China (Grant No: 51805099, 51605103), Science and Technology Planning Project of Guangdong Province, China (2017B090914005), Science and Technology Program of Guangzhou, China (201805010001), and Beijing Institute of Technology Research Fund Program for Young Scholars, China.

Conflicts of Interest

The authors declare no conflict of interest.

References

  1. Mathivanan, A.; Devakumaran, K.; Kumar, A.S. Comparative Study on Mechanical and Metallurgical Properties of AA6061 Aluminum Alloy Sheet Weld by Pulsed Current and Dual Pulse Gas Metal Arc Welding Processes. Mater. Manuf. Process. 2014, 29, 941–947. [Google Scholar] [CrossRef]
  2. da Silva, C.L.M.; Scotti, A. Performance Assessment of the (Trans) Varestraint Tests for Determining Solidification Cracking Susceptibility when using Welding Processes with Filler Metal. Meas. Sci. Technol. 2004, 15, 2215–2223. [Google Scholar] [CrossRef]
  3. Yamamoto, H.; Harada, S.; Ueyama, T.; Ogawa, S. Development of Low-Frequency Pulsed MIG Welding for Aluminium Alloys. Weld. Int. 1992, 6, 580–583. [Google Scholar] [CrossRef]
  4. Wang, L.L.; Wei, H.L.; Xue, J.X.; DebRoy, T. Special Features of Double-pulsed Gas Metal Arc Welding. J. Mater. Process. Technol. 2018, 251, 369–375. [Google Scholar] [CrossRef]
  5. Sen, M.; Mukherjee, M.; Pal, T.K. Prediction of Weld Bead Geometry for Double Pulse Gas Metal Arc Welding Process by Regression Analysis. In Proceedings of the 5th International & 26th All India Manufacturing Technology, Design and Research Conference (AIMTDR 2014), IIT Guwahati, Guwahati, India, 12–14 December 2014. [Google Scholar]
  6. Yi, J.; Cao, S.-F.; Li, L.-X.; Guo, P.-C.; Liu, K.-Y. Effect of Welding Current on Morphology and Microstructure of Al Alloy T-joint in Double-pulsed MIG Welding. Trans. Nonferrous Metals Soc. China 2015, 25, 3204–3211. [Google Scholar] [CrossRef]
  7. Devakumaran, K.; Rajasekaran, N.; Ghosh, P.K. Process Characteristics of Inverter Type GMAW Power Source under Static and Dynamic Operating Conditions. Mater. Manuf. Process. 2012, 27, 1450–1456. [Google Scholar] [CrossRef]
  8. Wang, L.; Xue, J. Perspective on Double-pulsed Gas Metal Arc Welding. Appl. Sci. 2017, 7, 894. [Google Scholar] [CrossRef]
  9. Wang, L.; Heng, G.; Chen, H.; Xue, J.; Lin, F.; Huang, W. Methods and Results Regarding Sinusoid Modulated Pulse Gas Metal Arc Welding. Int. J. Adv. Manuf. Technol. 2016, 86, 1841–1851. [Google Scholar] [CrossRef]
  10. Ghosh, P.K.; Dorn, L.; Kulkarni, S.; Hofmann, F. Arc Characteristics and Behaviour of Metal Transfer in Pulsed Current GMA Welding of Stainless Steel. J. Mater. Process. Technol. 2009, 3, 1262–1274. [Google Scholar] [CrossRef]
  11. Zhou, K.; Yao, P. Overview of Recent Advances of Process Analysis and Quality Control in Resistance Spot Welding. Mech. Syst. Signal Process. 2019, 124, 170–198. [Google Scholar] [CrossRef]
  12. Yao, P. Intelligent Control Strategies and Performance Evaluation of Integrated Double Wire Arc Welding Power Source. Ph.D. Thesis, South China University of Technology, Guangzhou, China, 2012. [Google Scholar]
  13. Yao, P.; Xue, J.; Zhou, K. Study on the Wire Feed Speed Prediction of Double-wire-pulsed MIG Welding based on Support Vector Machine Regression. Int. J. Adv. Manuf. Technol. 2015, 79, 2107–2116. [Google Scholar] [CrossRef]
  14. Casalino, G.; Hu, S.J.; Hou, W. Deformation Prediction and Quality Evaluation of the Gas Metal Arc Welding Butt Weld. Proc. Inst. Mech. Eng. Part B J. Eng. Manuf. 2003, 217, 1615–1622. [Google Scholar] [CrossRef]
  15. Wu, C.S.; Polte, T.; Rehfeldt, D. Gas Metal Arc Welding Process Monitoring and Quality Evaluation using Neural Networks. Sci. Technol. Weld. Join. 2000, 5, 324–328. [Google Scholar] [CrossRef]
  16. Yao, P.; Xue, J.; Zhou, K.; Wang, X.; Zhu, Q. Symmetrical Transition Waveform control on double-wire MIG welding. J. Mater. Process. Technol. 2016, 229, 111–120. [Google Scholar] [CrossRef]
  17. Keppel, G. Design and Analysis: A researcher’s Handbook; Prentice-Hall Inc.: Upper Saddle River, NJ, USA, 1991. [Google Scholar]
  18. Xie, Q.; Ni, J.-Q.; Su, Z. Fuzzy Comprehensive Evaluation of Multiple Environmental Factorsfor Swine Building Assessment and Control. J. Hazard. Mater. 2017, 340, 463–471. [Google Scholar] [CrossRef] [PubMed]
  19. Liang, Z.; Yang, K.; Sun, Y.; Yuan, J.; Zhang, H.; Zhang, Z. Decision Support for Choice Optimal Power Generation Projects: Fuzzy Comprehensive Evaluation Model based on the Electricity Market. Energy Policy 2006, 34, 3359–3364. [Google Scholar] [CrossRef]
  20. Chen, J.-F.; Hsieh, H.-N.; Do, Q.H. Evaluating Teaching Performance based on Fuzzy AHP and Comprehensive Evaluation Approach. Appl. Soft Comput. 2015, 28, 100–108. [Google Scholar] [CrossRef]
  21. Liu, Y.; Fang, P.; Bian, D.; Zhang, H.; Wang, S. Fuzzy Comprehensive Evaluation for the Motion Performance of Autonomous Underwater Vehicles. Ocean Eng. 2014, 88, 568–577. [Google Scholar] [CrossRef]
  22. Meng, L.; Chen, Y.; Li, W.; Zhao, R. Fuzzy comprehensive evaluation model for water resources carrying capacity in Tarim River Basin, Xinjiang, China. Chin. Geogr. Sci. 2009, 19, 89–95. [Google Scholar] [CrossRef]
  23. Wei, B.; Wang, S.-L.; Li, L. Fuzzy Comprehensive Evaluation of District Heating Systems. Energy Policy 2010, 38, 5947–5955. [Google Scholar] [CrossRef]
  24. Zhang, M.; Yang, W. Fuzzy Comprehensive Evaluation Method Applied in the Real Estate Investment Risks Research. Phys. Procedia 2012, 24, 1815–1821. [Google Scholar] [Green Version]
  25. Zhai, L.; Tang, X. Fuzzy Comprehensive Evaluation Method and Its Application in Subjective Quality Assessment for Compressed Remote Sensing Images. In Proceedings of the Fourth International Conference on Fuzzy Systems and Knowledge Discovery (FSKD 2007), Haikou, China, 24–27 August 2007. [Google Scholar]
  26. Sen, M.; Mukherjee, M.; Pal, T.K. Evaluation of Correlations between DP-GMAW Process Parameters and Bead Geometry. Weld. J. 2015, 94, 265s–279s. [Google Scholar]
  27. Bosworth, M.R.; Deam, R.T. Influence of GMAW Droplet Size on Fume Formation Rate. J. Phys. D Appl. Phys. 2000, 33, 2605–2610. [Google Scholar] [CrossRef]
  28. Rehfeldt, D.; Schmitz, T.H. A System for Process Quality Evaluation in GMAW. Weld. World 1994, 34, 227–234. [Google Scholar]
  29. Yao, P.; Zhou, K. Research of a Multi-Frequency Waveform Control Method on Double-Wire MIG Arc Welding. Appl. Sci. 2017, 7, 171. [Google Scholar] [CrossRef]
Figure 1. Schematic presentation of the double-pulsed gas metal arc welding (DP-GMAW) process.
Metals 09 01009 g001
Figure 2. Experimental instruments and equipment.
Metals 09 01009 g002
Figure 3. Schematic of shape parameter measurement for a weld bead.
Metals 09 01009 g003
Figure 4. Microstructures of the weld bead observed by electron microscopy. (a) The weld bead of L1, (b) the weld bead of L2, (c) the weld bead of L3, (d) the weld bead of L4, (e) the weld bead of L5, (f). the weld bead of L6, (g) the weld bead of L7, (h) the weld bead of L8, (i) the weld bead of L9.
Metals 09 01009 g004
Figure 5. (a) Geometry of your tensile samples, (b) Tensile tests of the weld beads.
Metals 09 01009 g005
Figure 6. Testing points in the weld bead during hardness testing.
Metals 09 01009 g006
Figure 7. The variation tendency of grain size, toughness and hardness.
Metals 09 01009 g007
Figure 8. Welding current in L3 experiment, (a) Transient welding current waveform, (b) Possibility density function (PDF) of the welding current.
Metals 09 01009 g008
Figure 9. Welding current in L5 experiment, (a) Transient welding current waveform, (b) PDF of the welding current.
Metals 09 01009 g009
Figure 10. Welding current in L7 experiment, (a) transient welding current waveform, (b) PDF of the welding current.
Metals 09 01009 g010
Figure 11. The appearance of the weld bead using optimal parameters combination.
Metals 09 01009 g011
Figure 12. The morphology of the weld bead using optimal parameters combination.
Metals 09 01009 g012
Table 1. Material characteristics of the base plate and welding wire.
MaterialsCSiMnCrNiSPNMo
304≤0.08≤1≤218–208–10.5≤0.03≤0.03≤0.1-
316L≤0.03≤1≤216–1810–14≤0.03≤0.045-2–3
Table 2. Parameters (elements) and levels.
LevelVR (cm/min)TPF (Hz)DT (%)IΔ (%)
120130%30%
230240%40%
340350%50%
Table 3. The program of the orthogonal experimental design.
IndexVR (cm/min)TPF (Hz)DT (%)IΔ (%)
L120130%30%
L220240%40%
L320350%50%
L430140%50%
L530250%30%
L630330%40%
L740150%40%
L840230%50%
L940340%30%
Table 4. The appearances and cross-sections of weld beads of L1–L9.
NoWeld Bead
AppearanceCross-Sections
L1 Metals 09 01009 i001 Metals 09 01009 i002
L2 Metals 09 01009 i003 Metals 09 01009 i004
L3 Metals 09 01009 i005 Metals 09 01009 i006
L4 Metals 09 01009 i007 Metals 09 01009 i008
L5 Metals 09 01009 i009 Metals 09 01009 i010
L6 Metals 09 01009 i011 Metals 09 01009 i012
L7 Metals 09 01009 i013 Metals 09 01009 i014
L8 Metals 09 01009 i015 Metals 09 01009 i016
L9 Metals 09 01009 i017 Metals 09 01009 i018
Table 5. Measurement of the weld bead (mm).
Weld BeadL1L2L3L4L5L6L7L8L9
h2.162.3352.541.9552.0652.131.5951.9952.1
H>3>3>31.161.581.091.330.981.17
B8.79.269.86.756.784.766.565.164.11
Table 6. Elongation of each specimen (mm).
Weld BeadL1L2L3L4L5L6L7L8L9
Elongation12.5110.1212.0716.5514.1714.5117.0119.1628.44
Table 7. Hardness test of weld beads.
Weld BeadL1L2L3L4L5L6L7L8L9
HRB7776.3376.1778.8378.57880.8379.8383
Table 8. Mapping from grades to mathematical values.
GradeExcellentGoodMediumPoor
Value100857050
Table 9. Evaluation results of FCE.
IndexAppearanceGrain SizeStability of Electrical SignalBead Height CoefficientPenetrationBead WidthScores
L1MediumPoorPoorExcellentPoorMedium60.4
L2MediumPoorPoorGoodPoorMedium59.5
L3PoorPoorPoorGoodPoorMedium53.5
L4MediumMediumMediumGoodGoodExcellent74.05
L5ExcellentGoodExcellentGoodExcellentExcellent94.6
L6GoodGoodMediumMediumMediumPoor77.6
L7PoorGoodGoodExcellentGoodExcellent76.45
L8MediumExcellentGoodMediumMediumGood83.05
L9MediumExcellentGoodPoorMediumPoor79.4
Table 10. Influence analysis of four operational parameters on appearance.
LevelScoreavg
VRTPFDTIΔ
163.333707580
285807075
37068.33373.33363.333
Range value D21.66711.667516.667
Table 11. Orthogonal analyses of the grain size of the weld bead.
LevelScoreavg
VRTPFDTIΔ
15068.33378.33378.333
28078.33373.33373.333
39578.33373.33373.333
Range value D451055
Table 12. Orthogonal analyses of FCE scores of the weld bead.
LevelScoreavg
VRTPFDTIΔ
157.870.373.68378.133
282.08379.0570.98371.183
379.63370.16774.8570.2
Range value D24.2838.8833.8677.933

