Determination of Hydrogen Transport Behaviour in Boron-Manganese Steels Using Different Methods and Boundary Conditions


Abstract
:1. Introduction
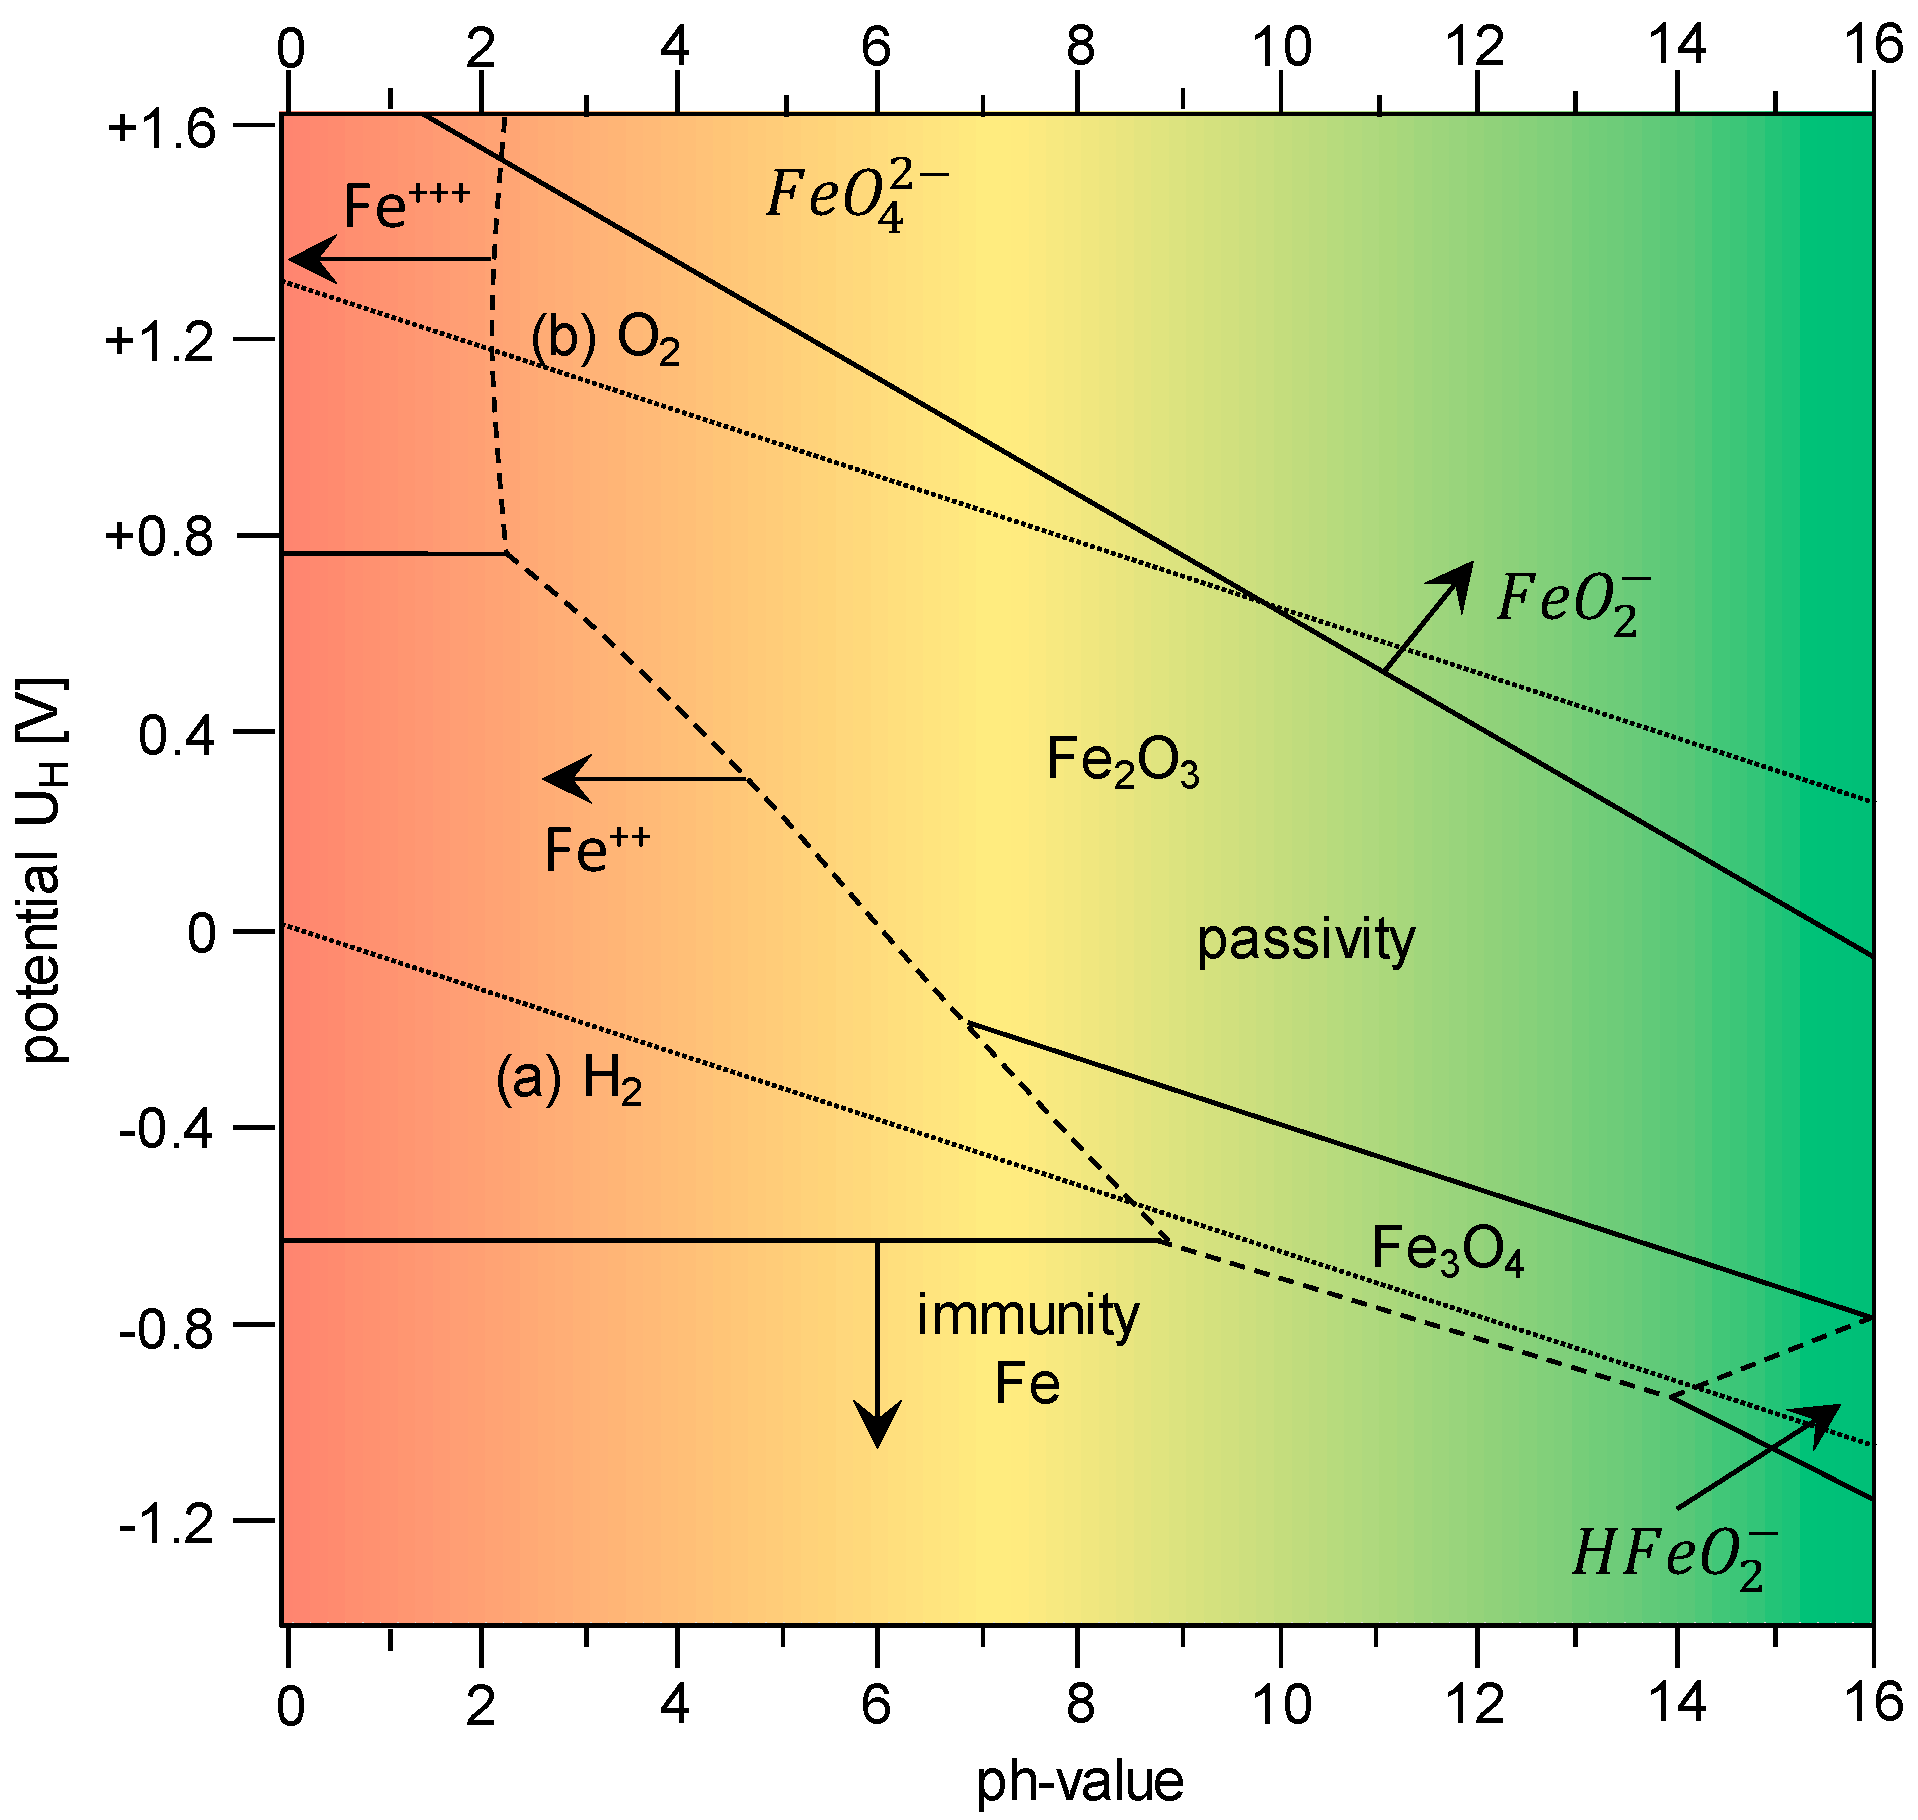
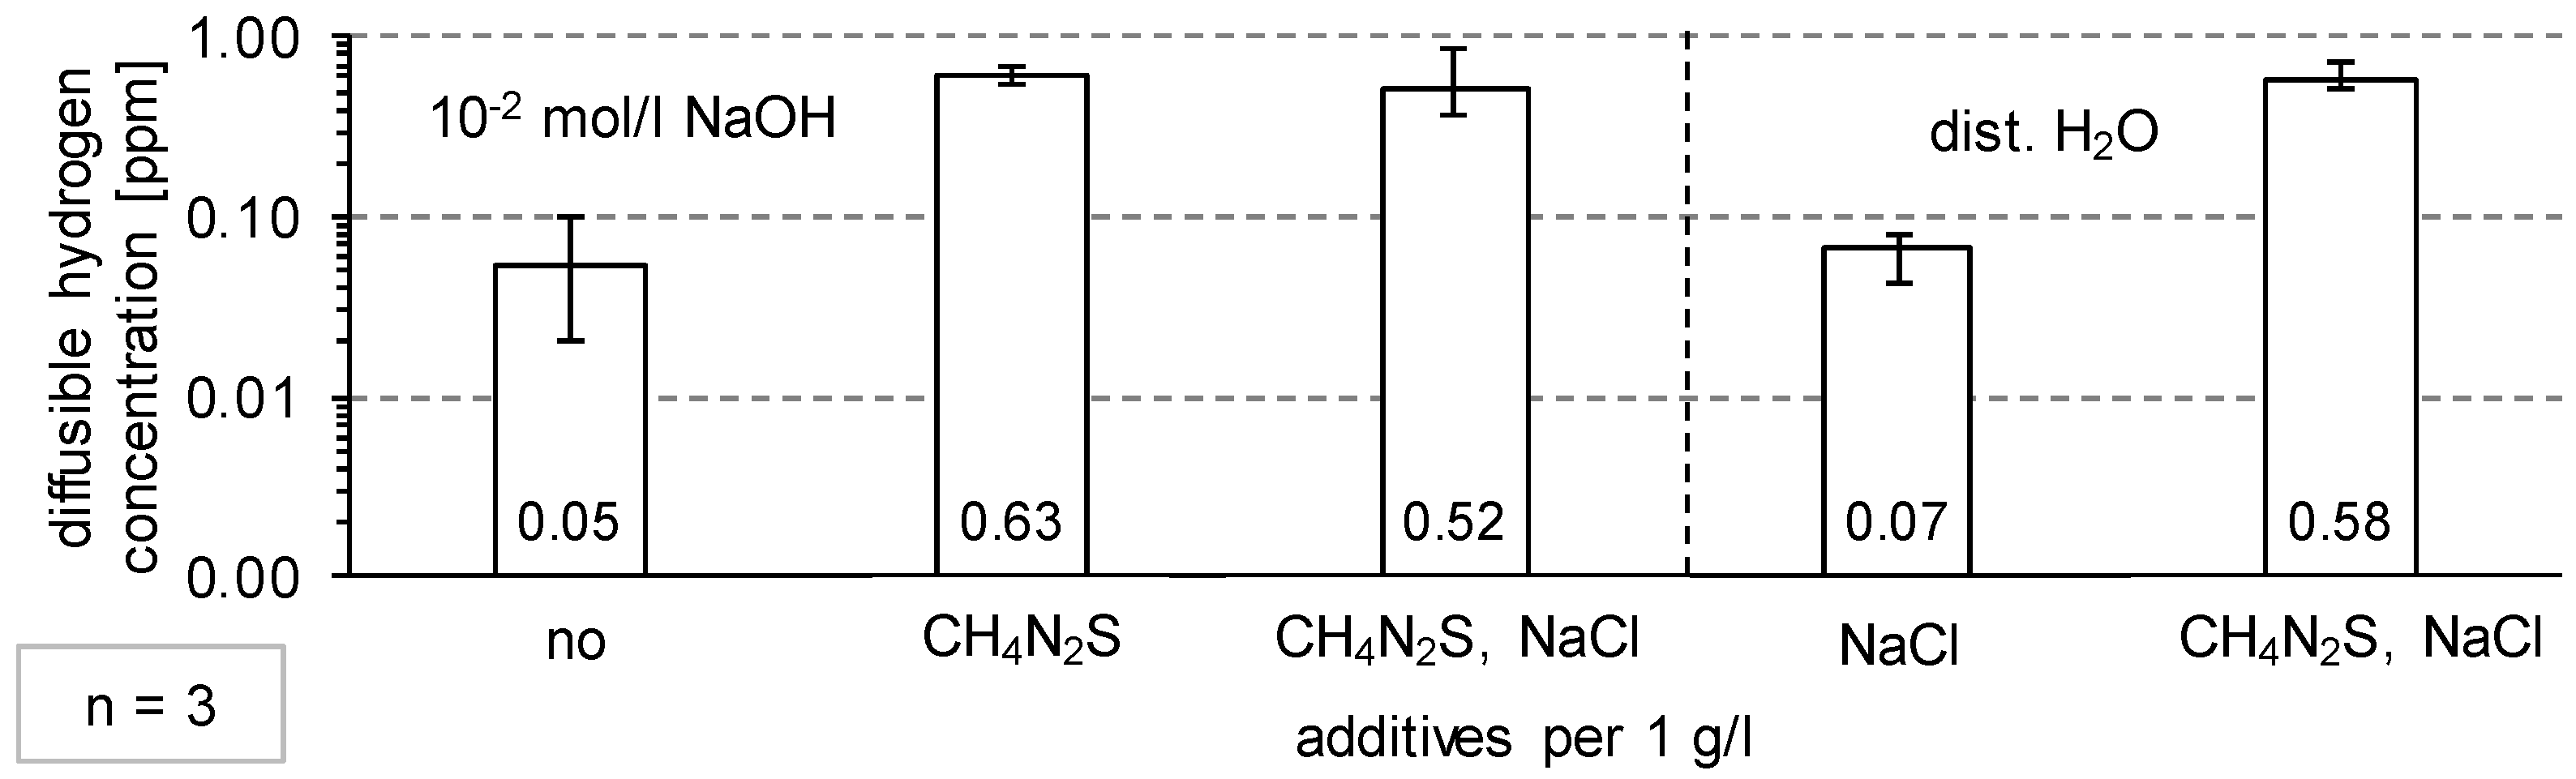
1.1. Hydrogen Absorption
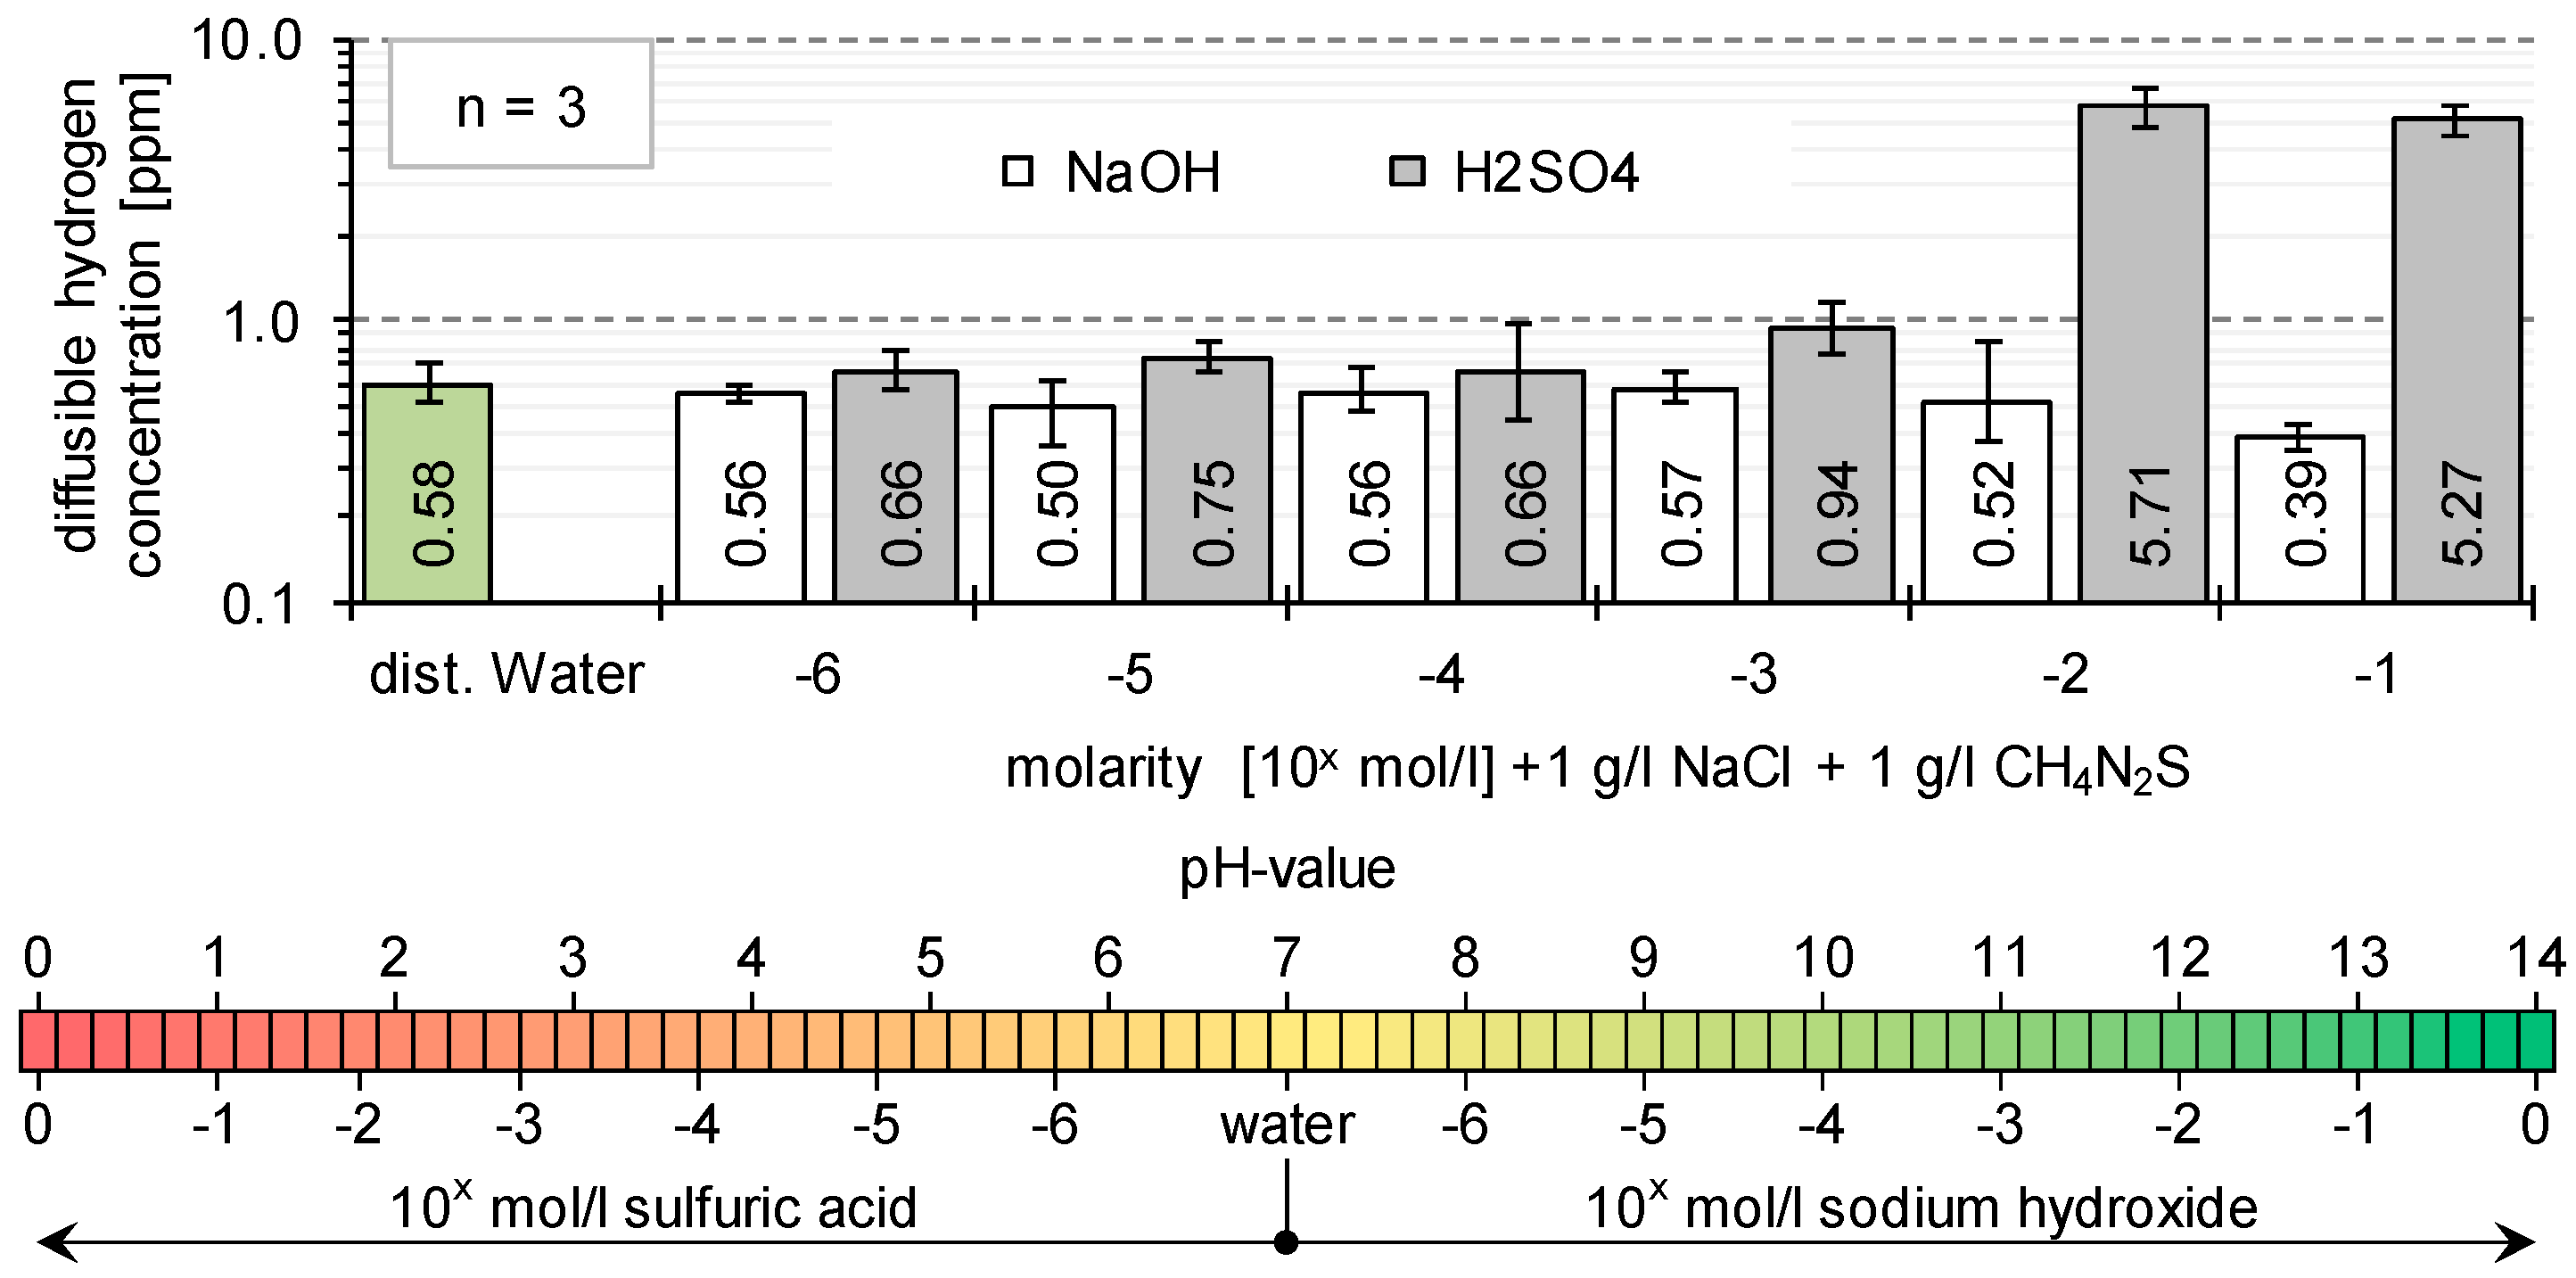
- Influence of the pH-value (passive layer and corrosion) on hydrogen absorption and hydrogen diffusion;
- Influence of sample thickness (ratio of substrate to passive layer); and
- Influence of the surface condition (surface roughness).
1.2. Hydrogen Transport
- Diffusion occurs only in the thickness direction, therefore the equations are only valid for sheets whose thickness is small compared to the remaining dimensions;
- The mean hydrogen concentration in the workpiece at the beginning is equal to the initial concentration (c = c0 for 0 ≤ x ≤ d for t = 0);
- The hydrogen concentration in the sample at time t = 0 is uniformly distributed; and
- The hydrogen concentration on the metal surface is constant (cR = constant for x = 0 and x = d for t > 0).
2. Materials and Methods
2.1. Material Characterization and Sample Preparation
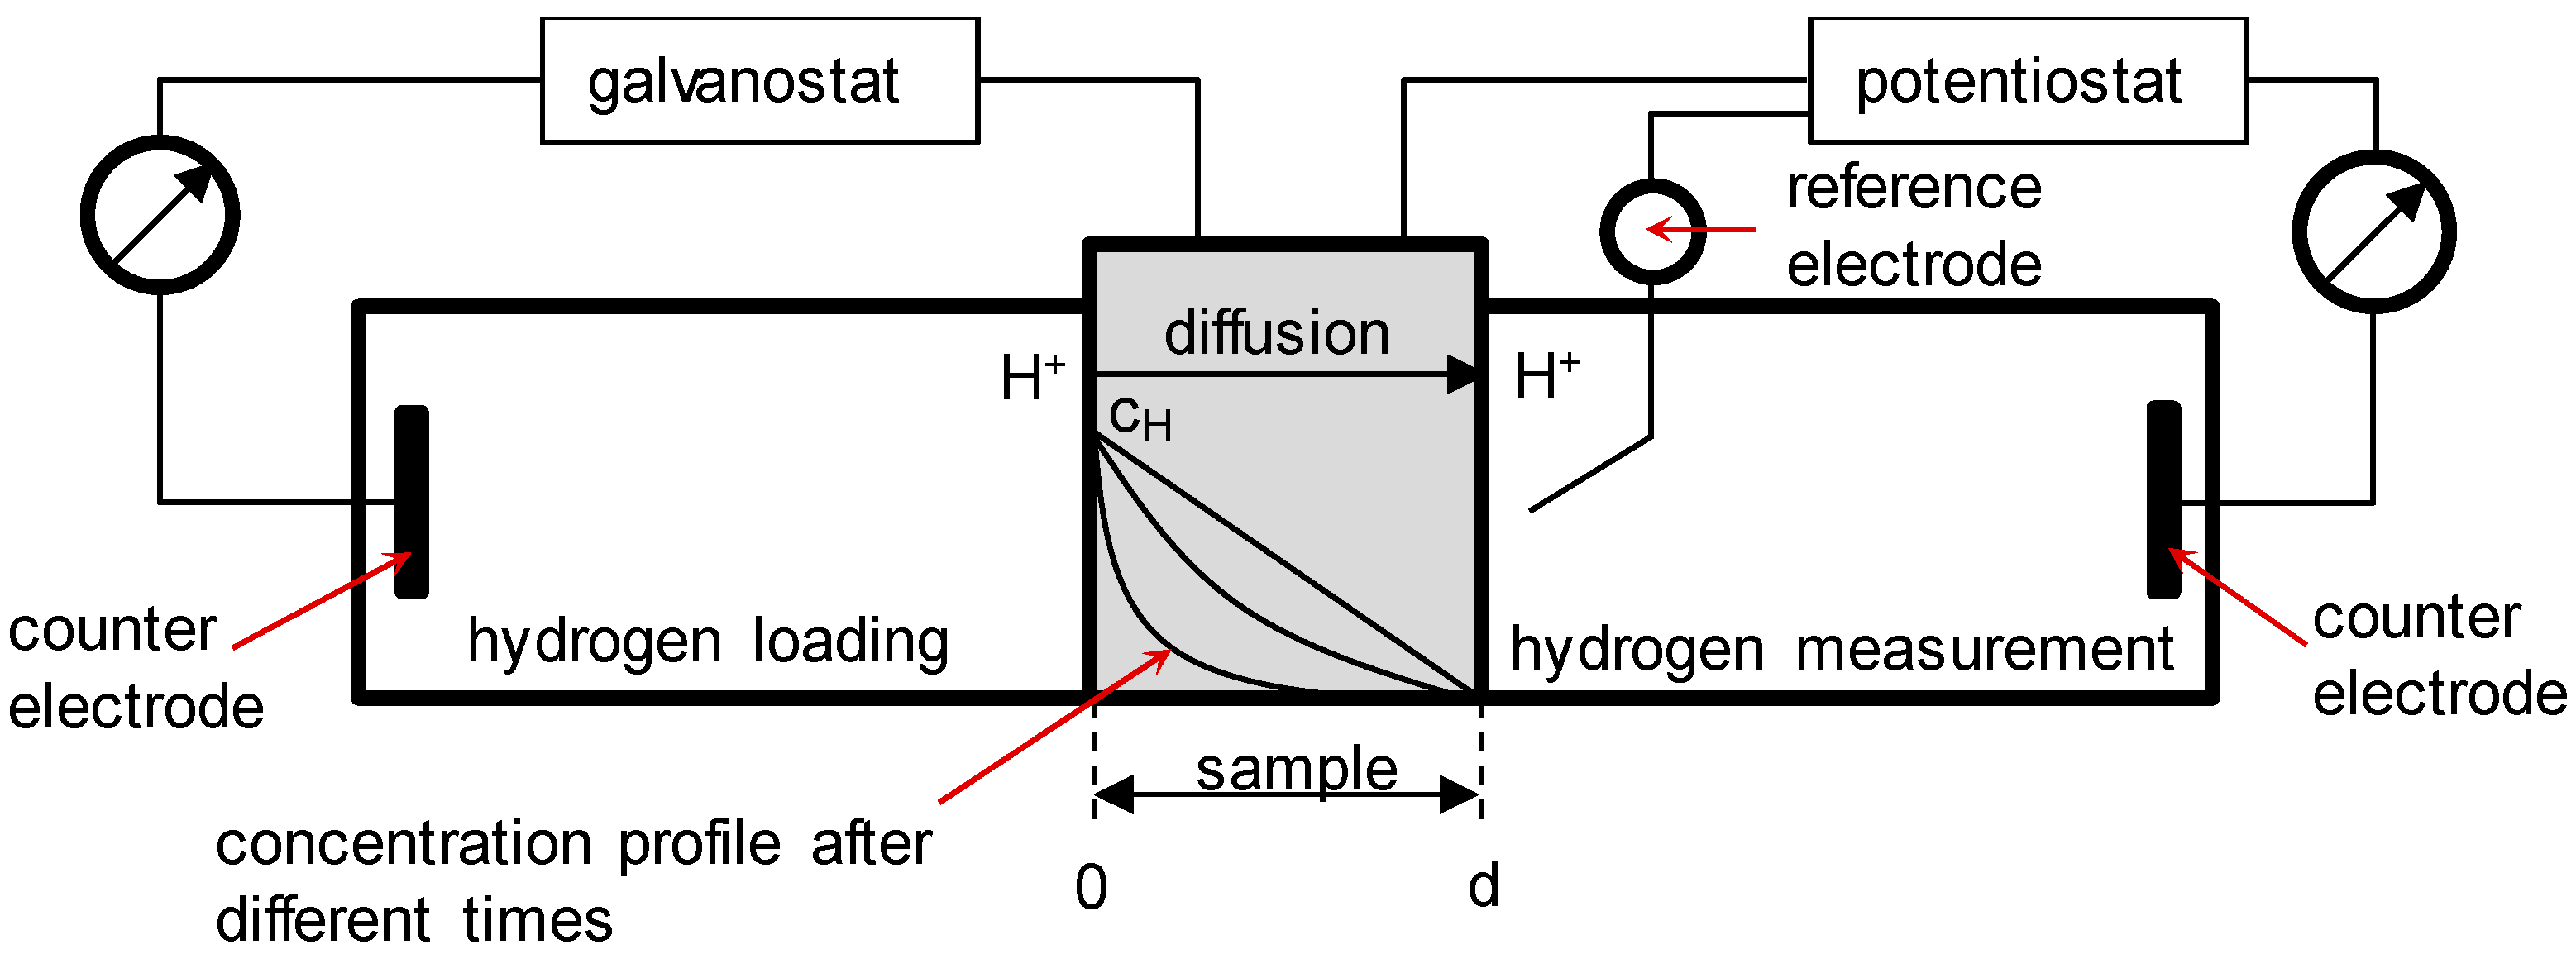
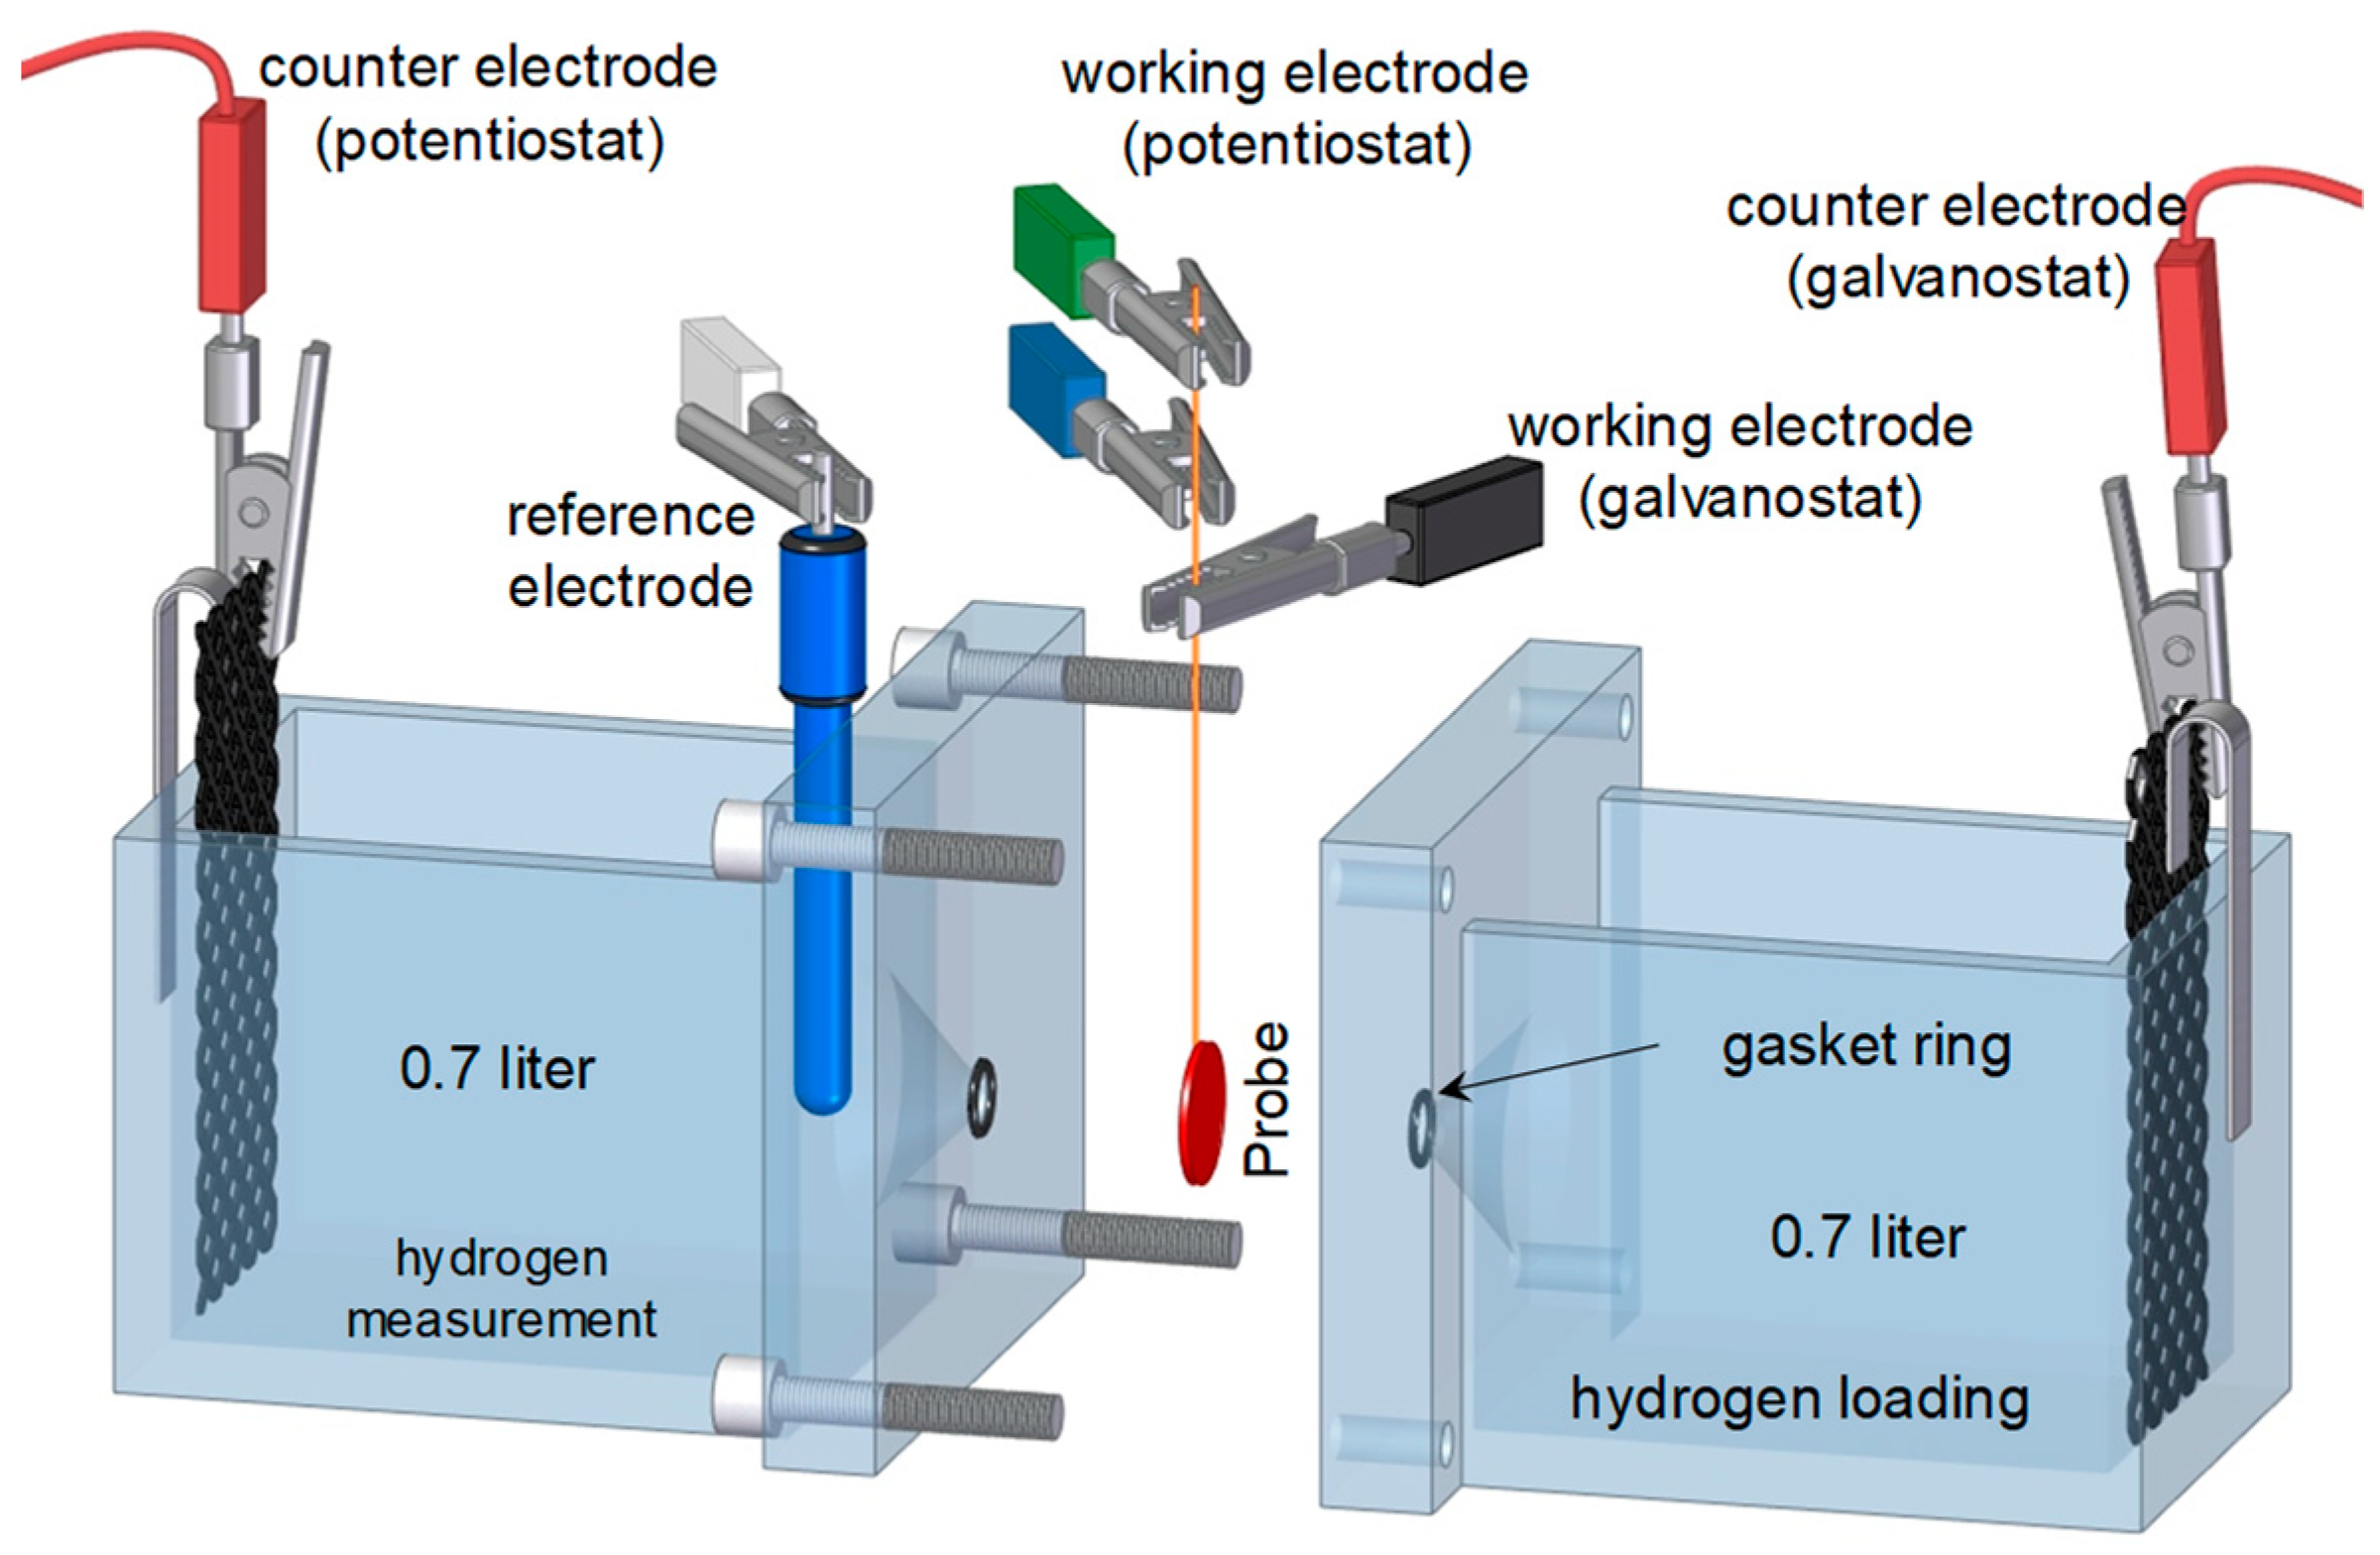
2.2. Permeation Measurements
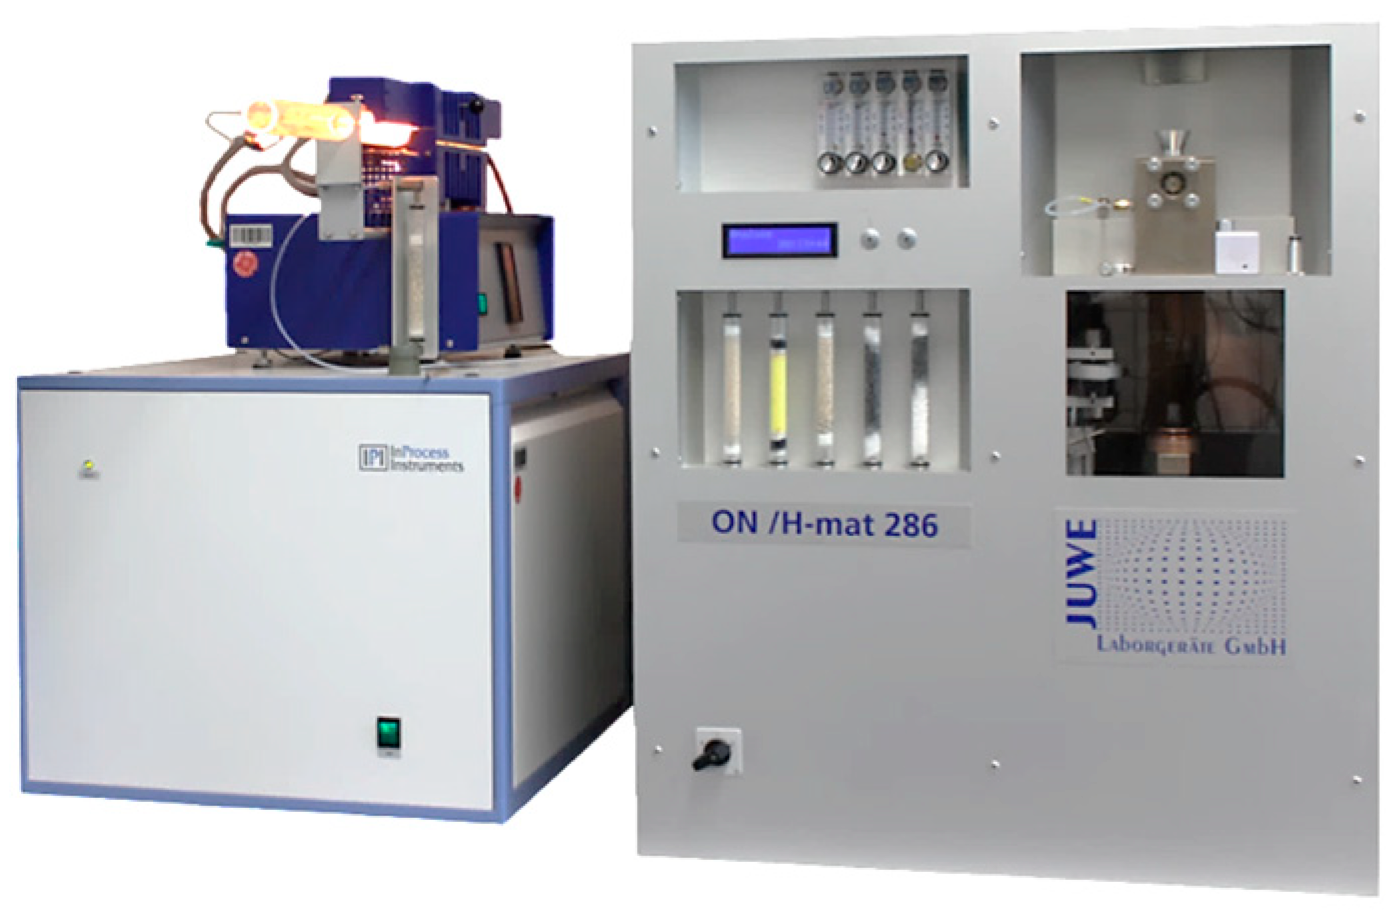
2.3. Thermal Desorption Analysis
3. Results and Discussion
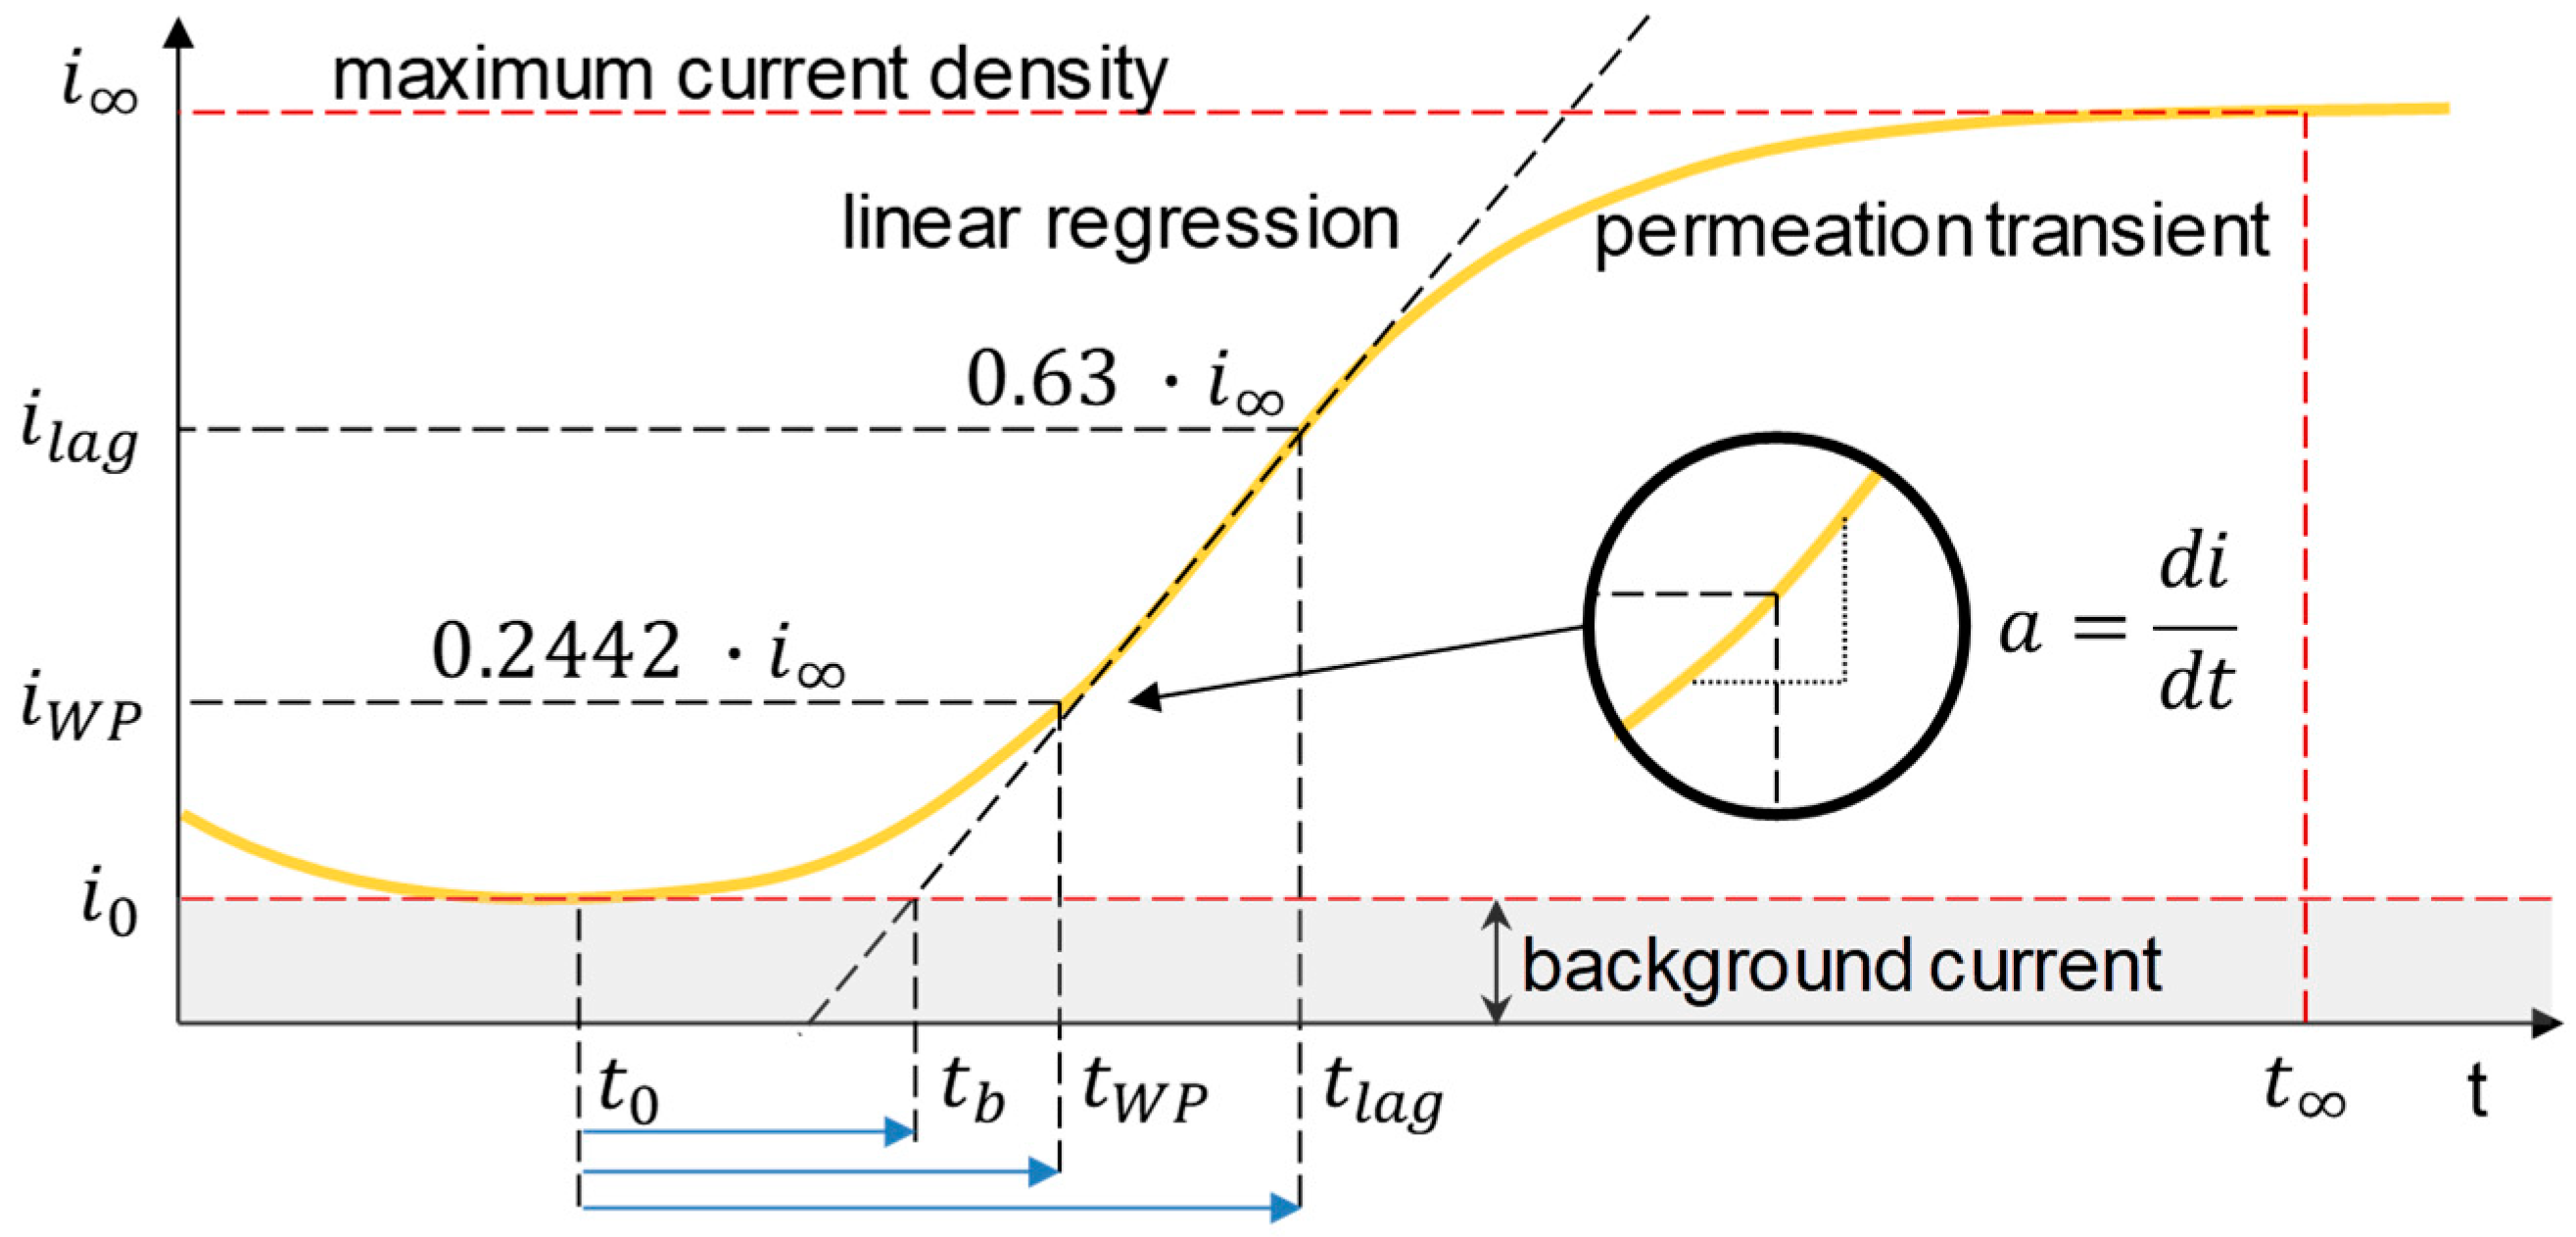
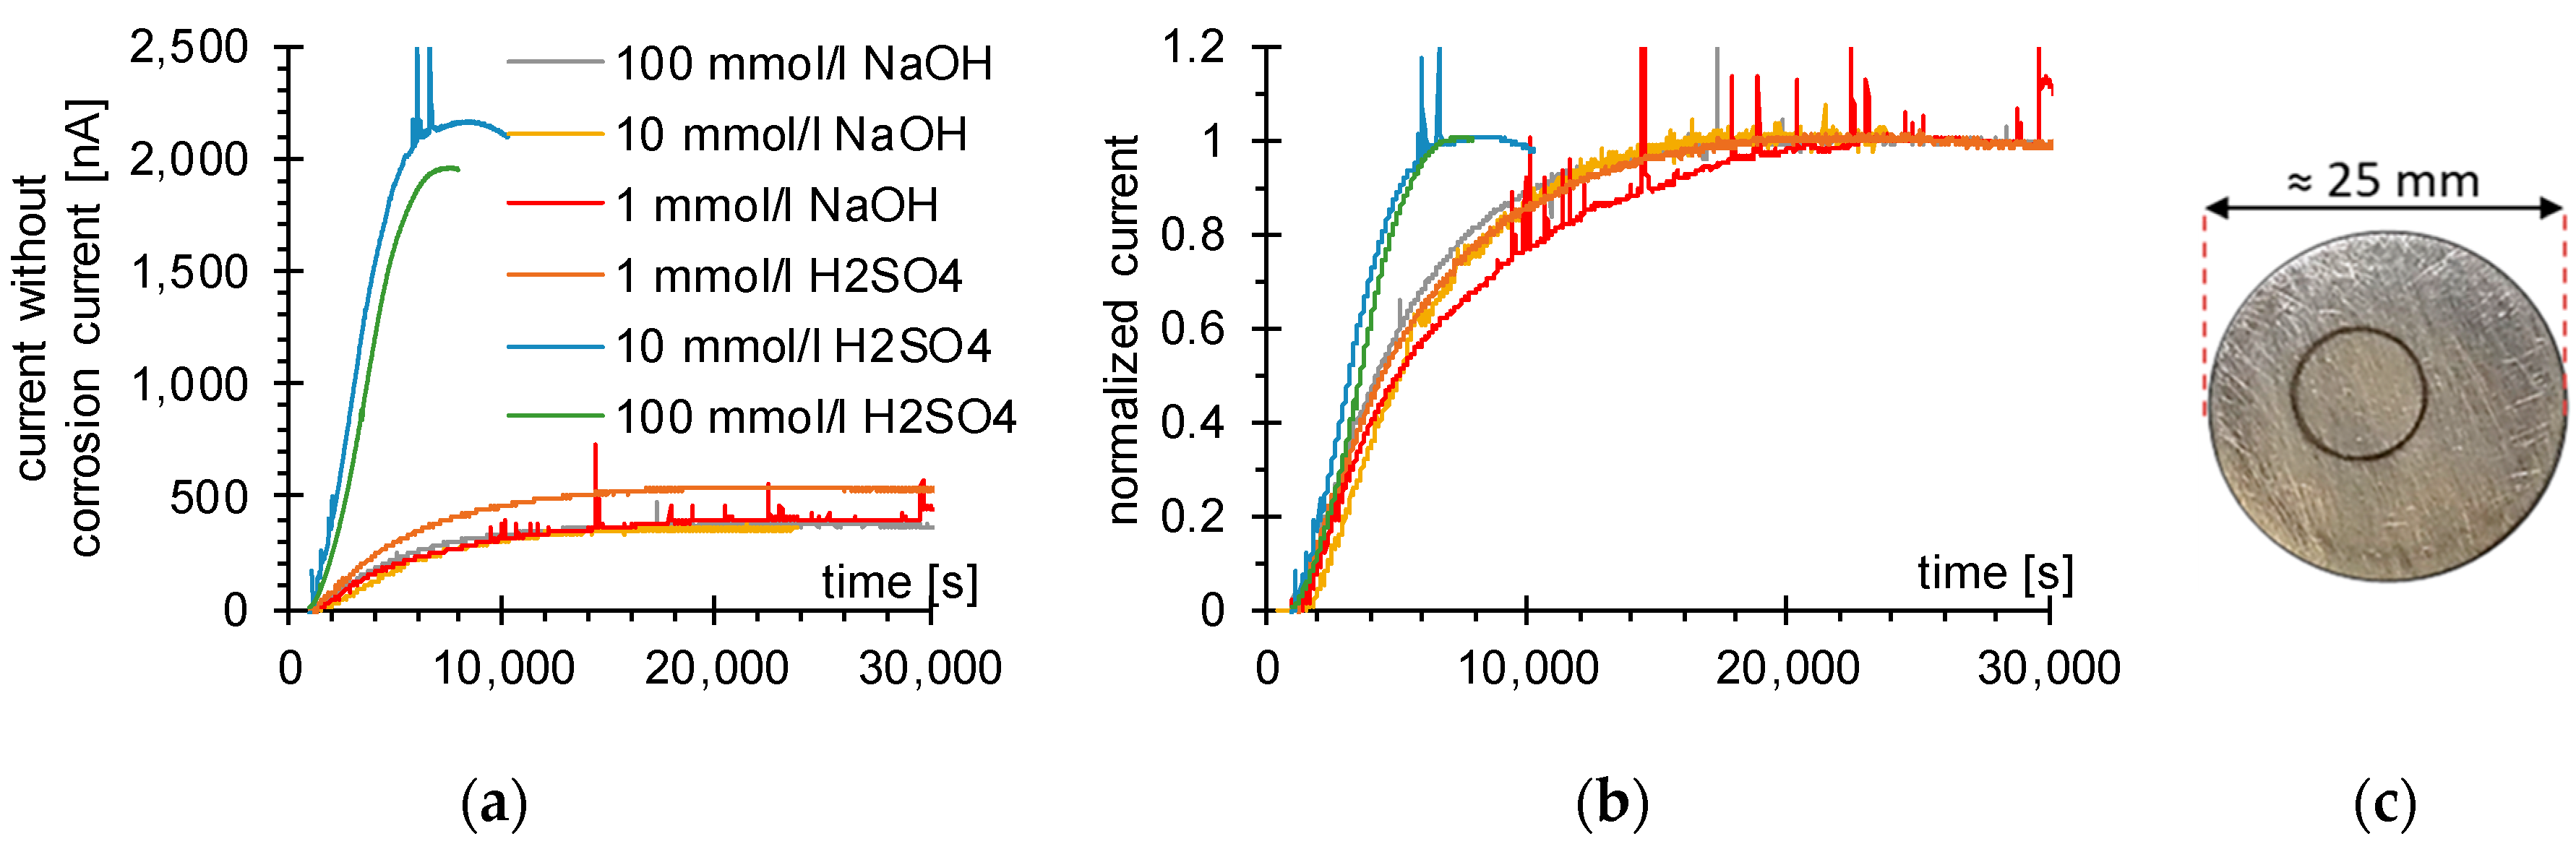
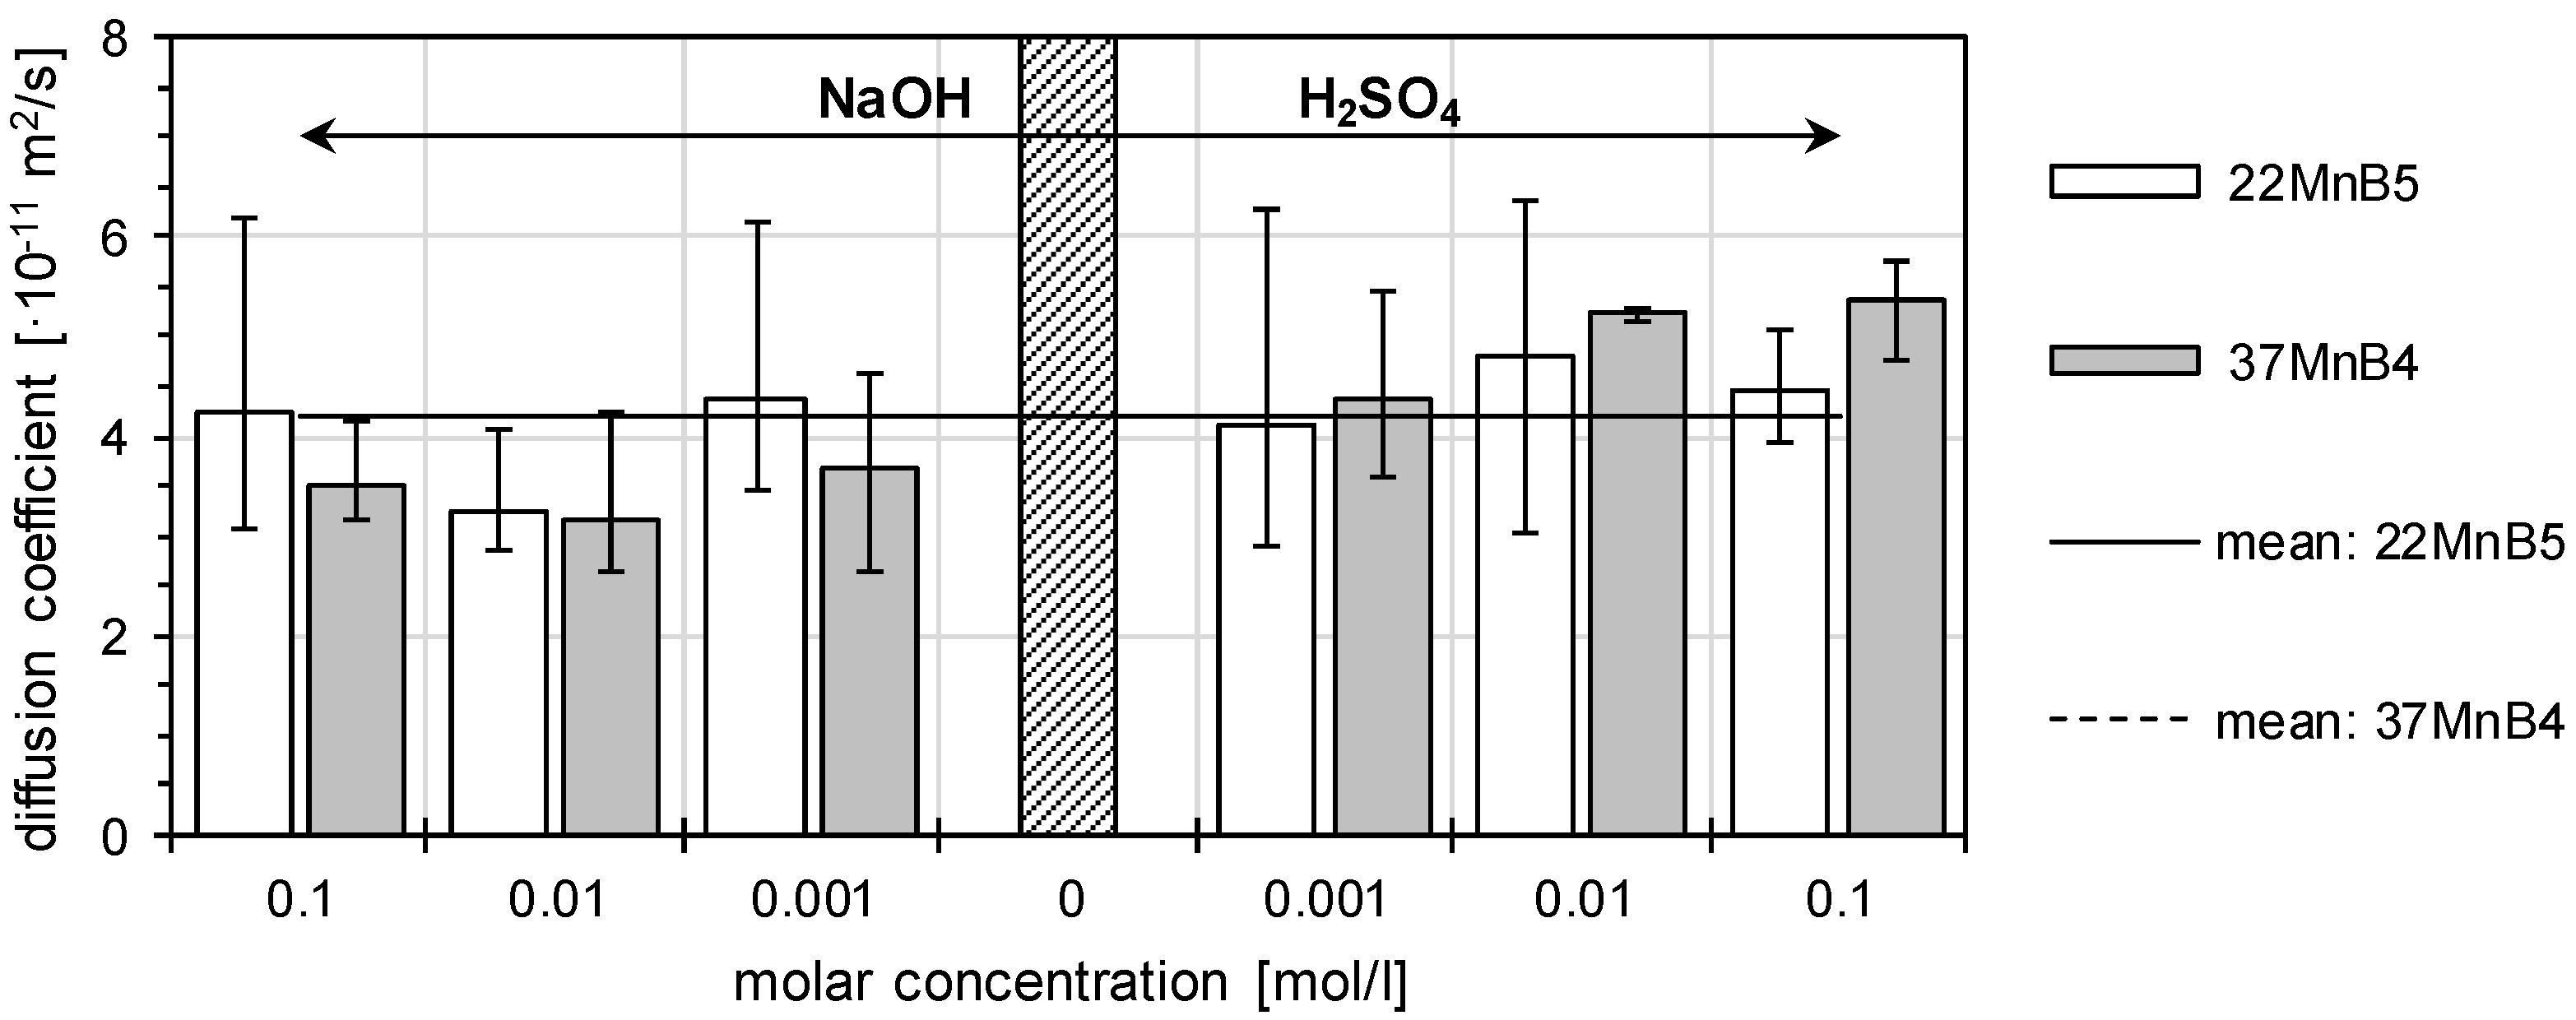
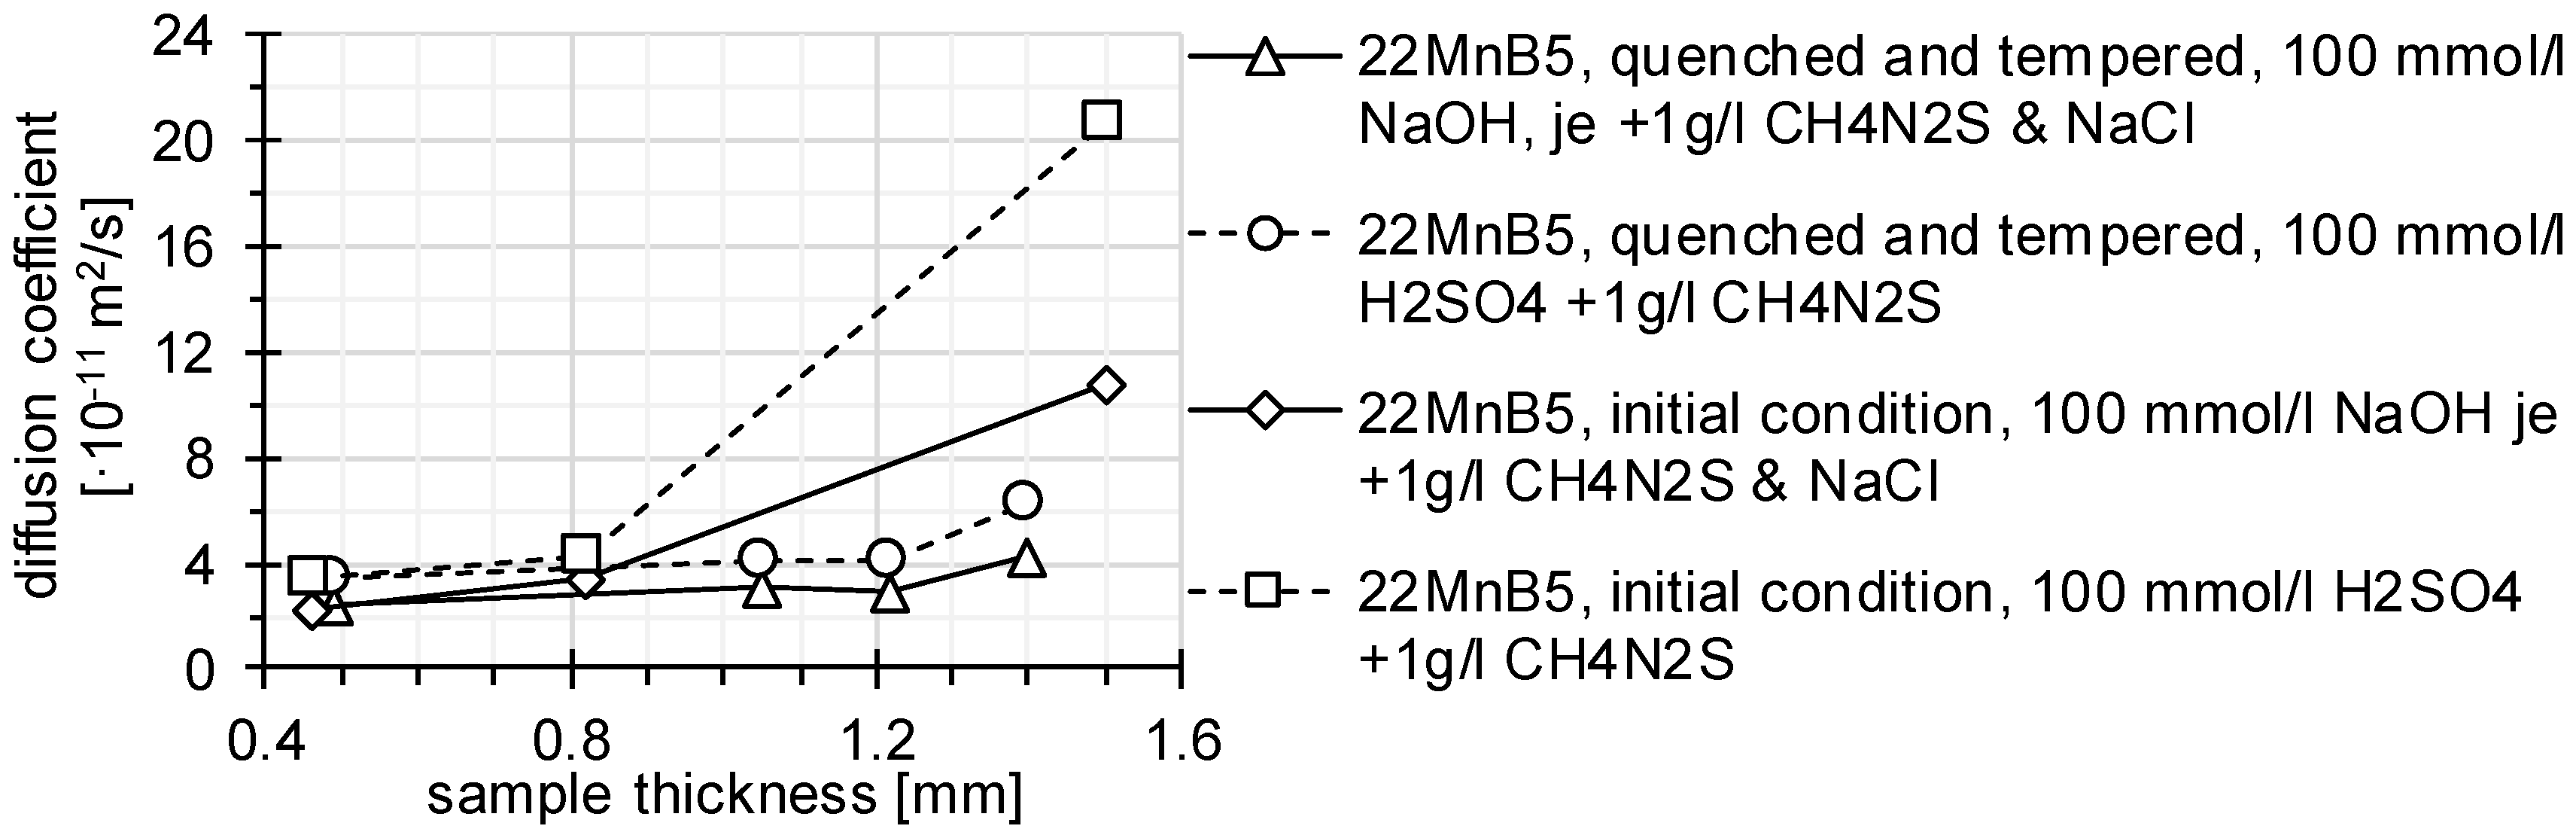
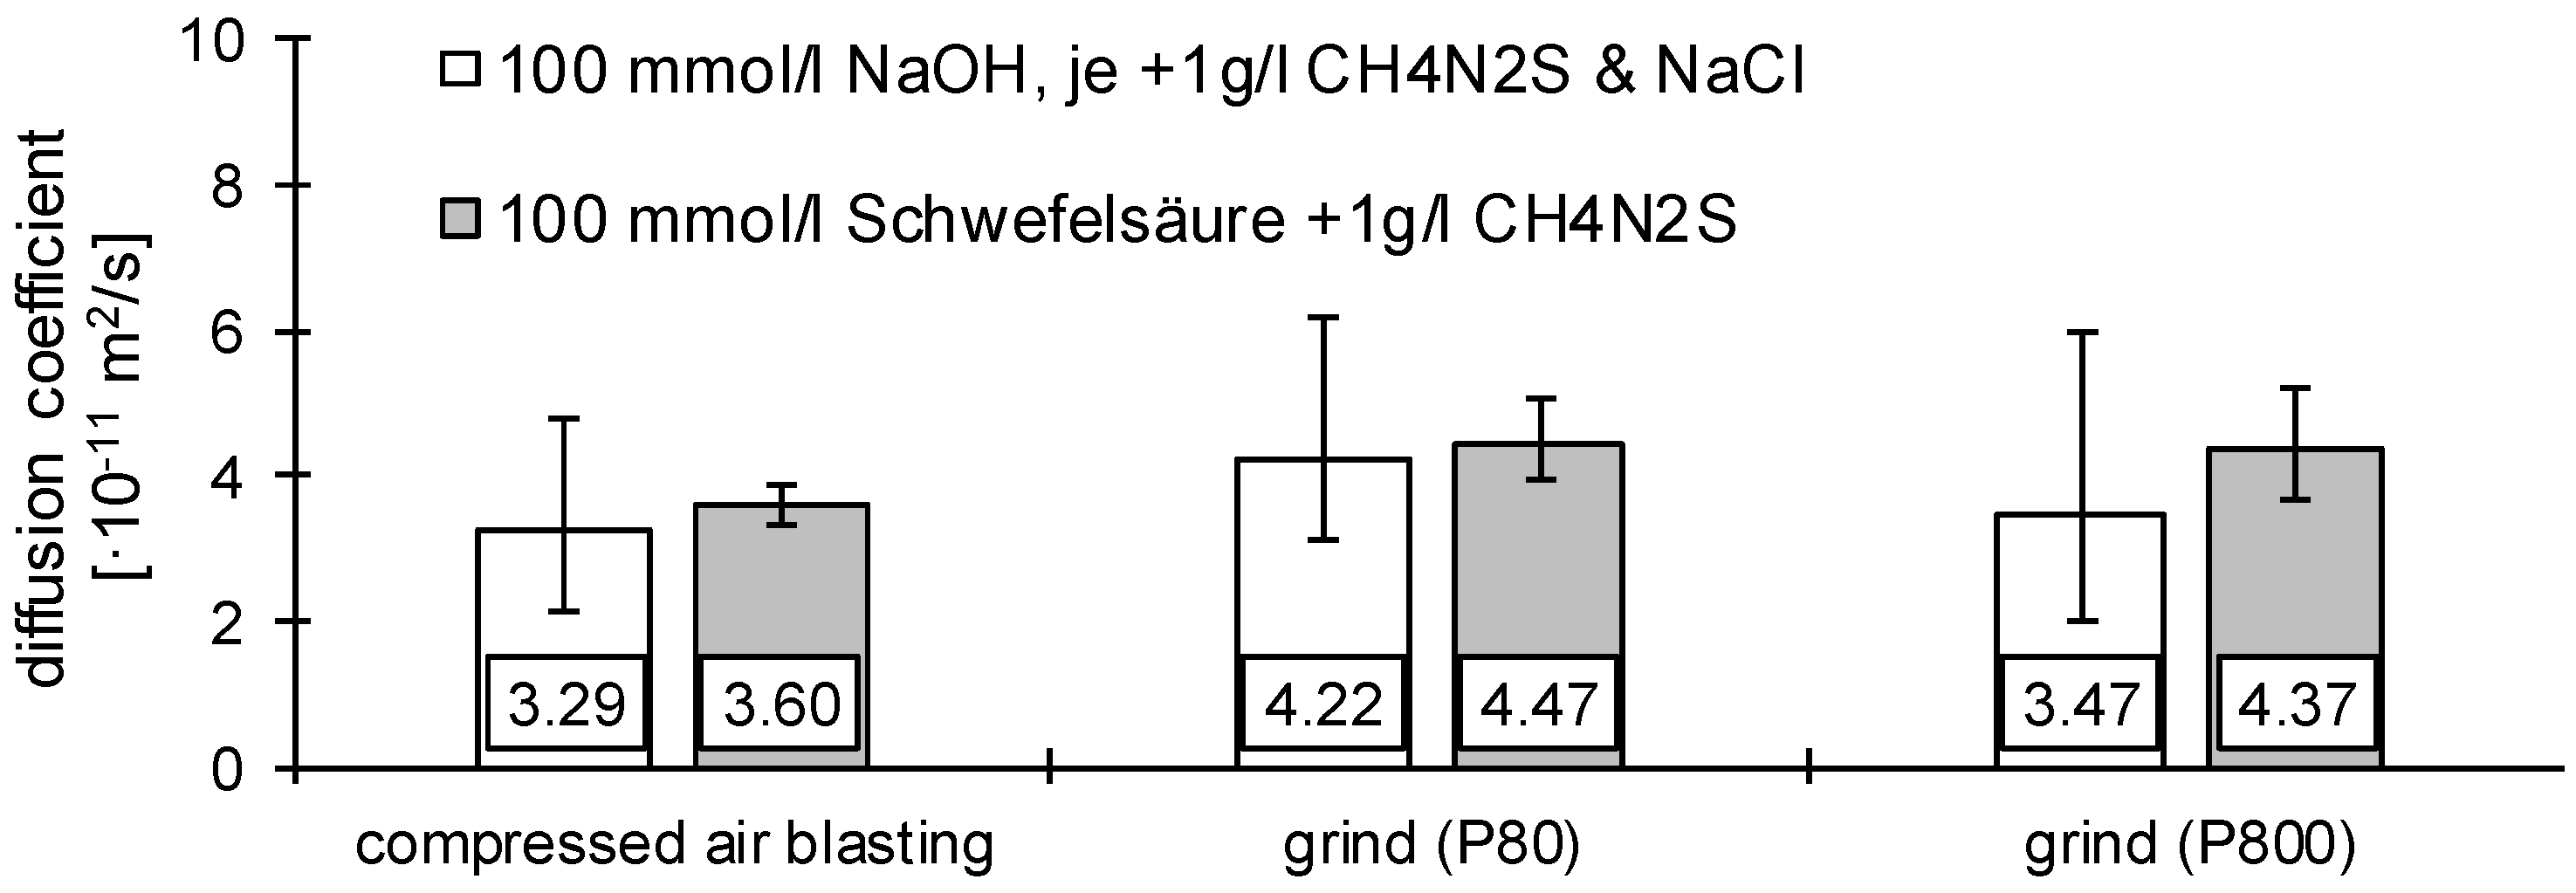
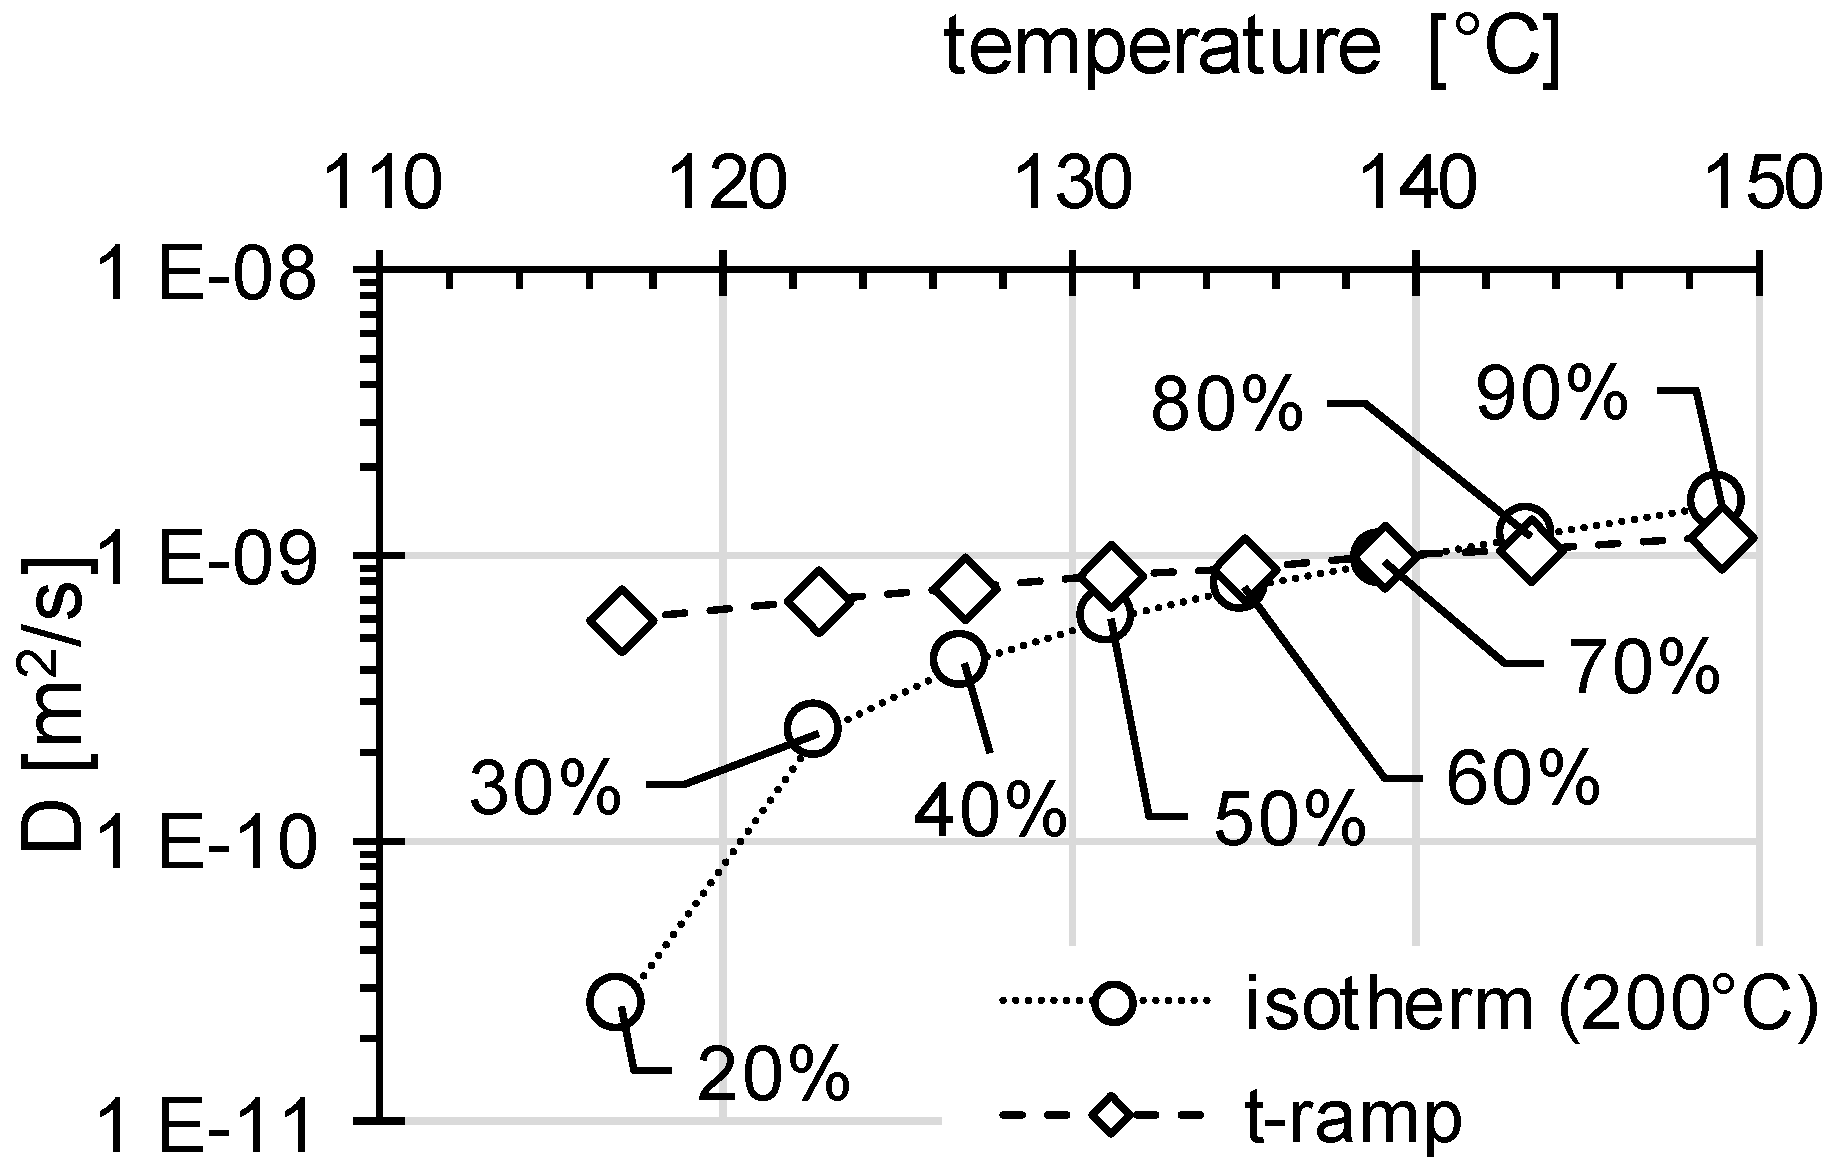
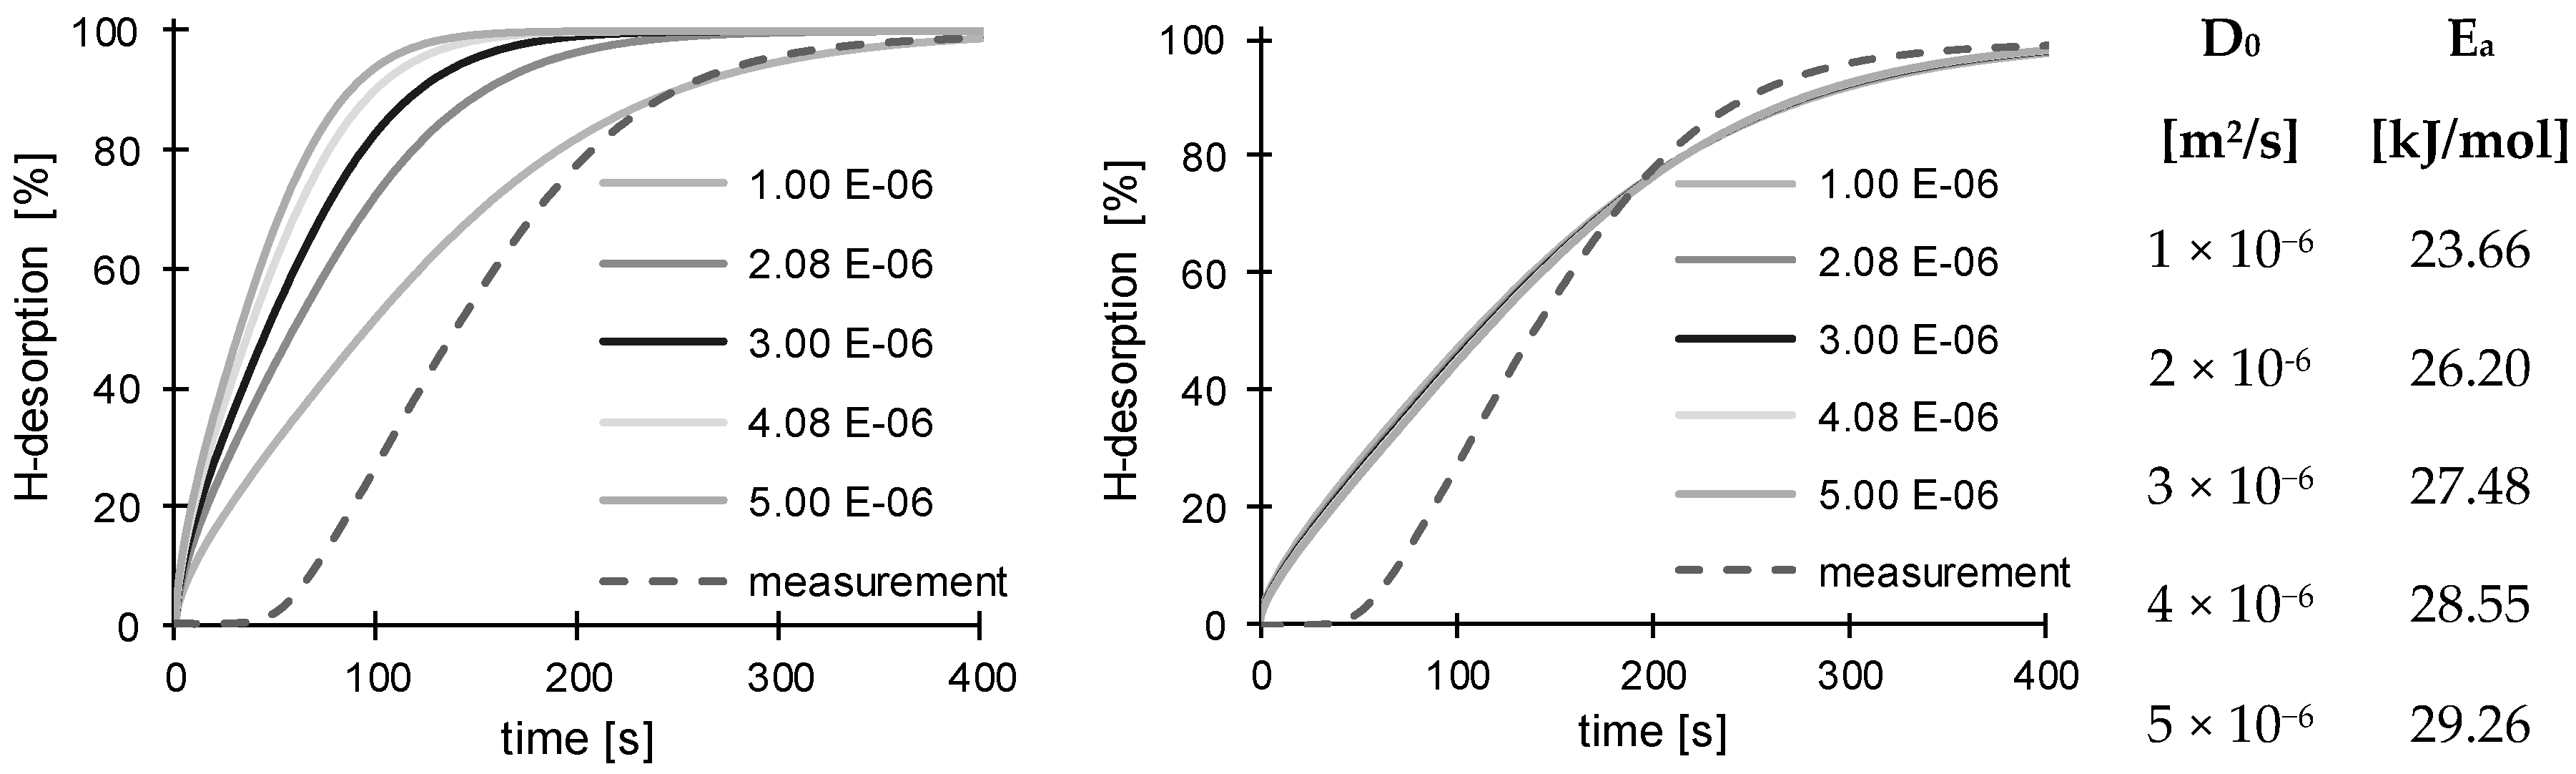
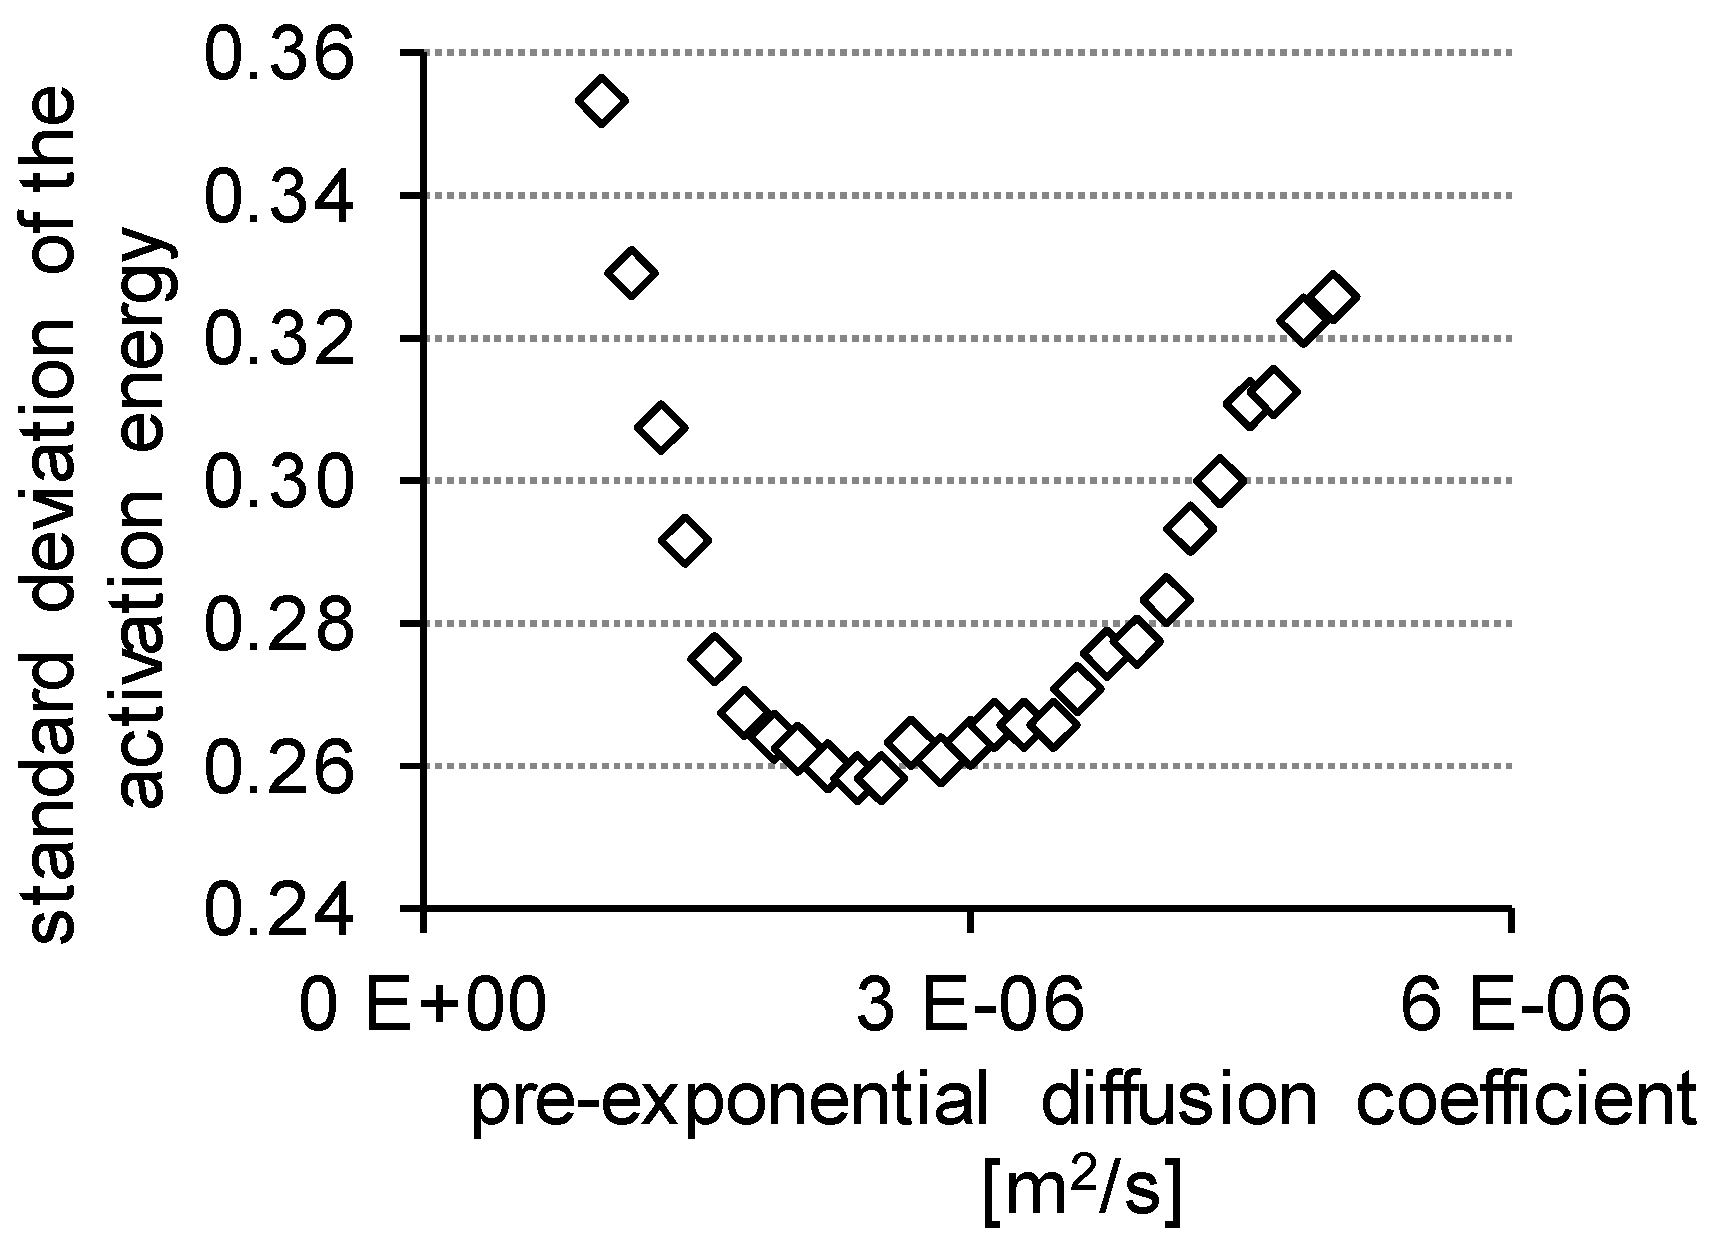
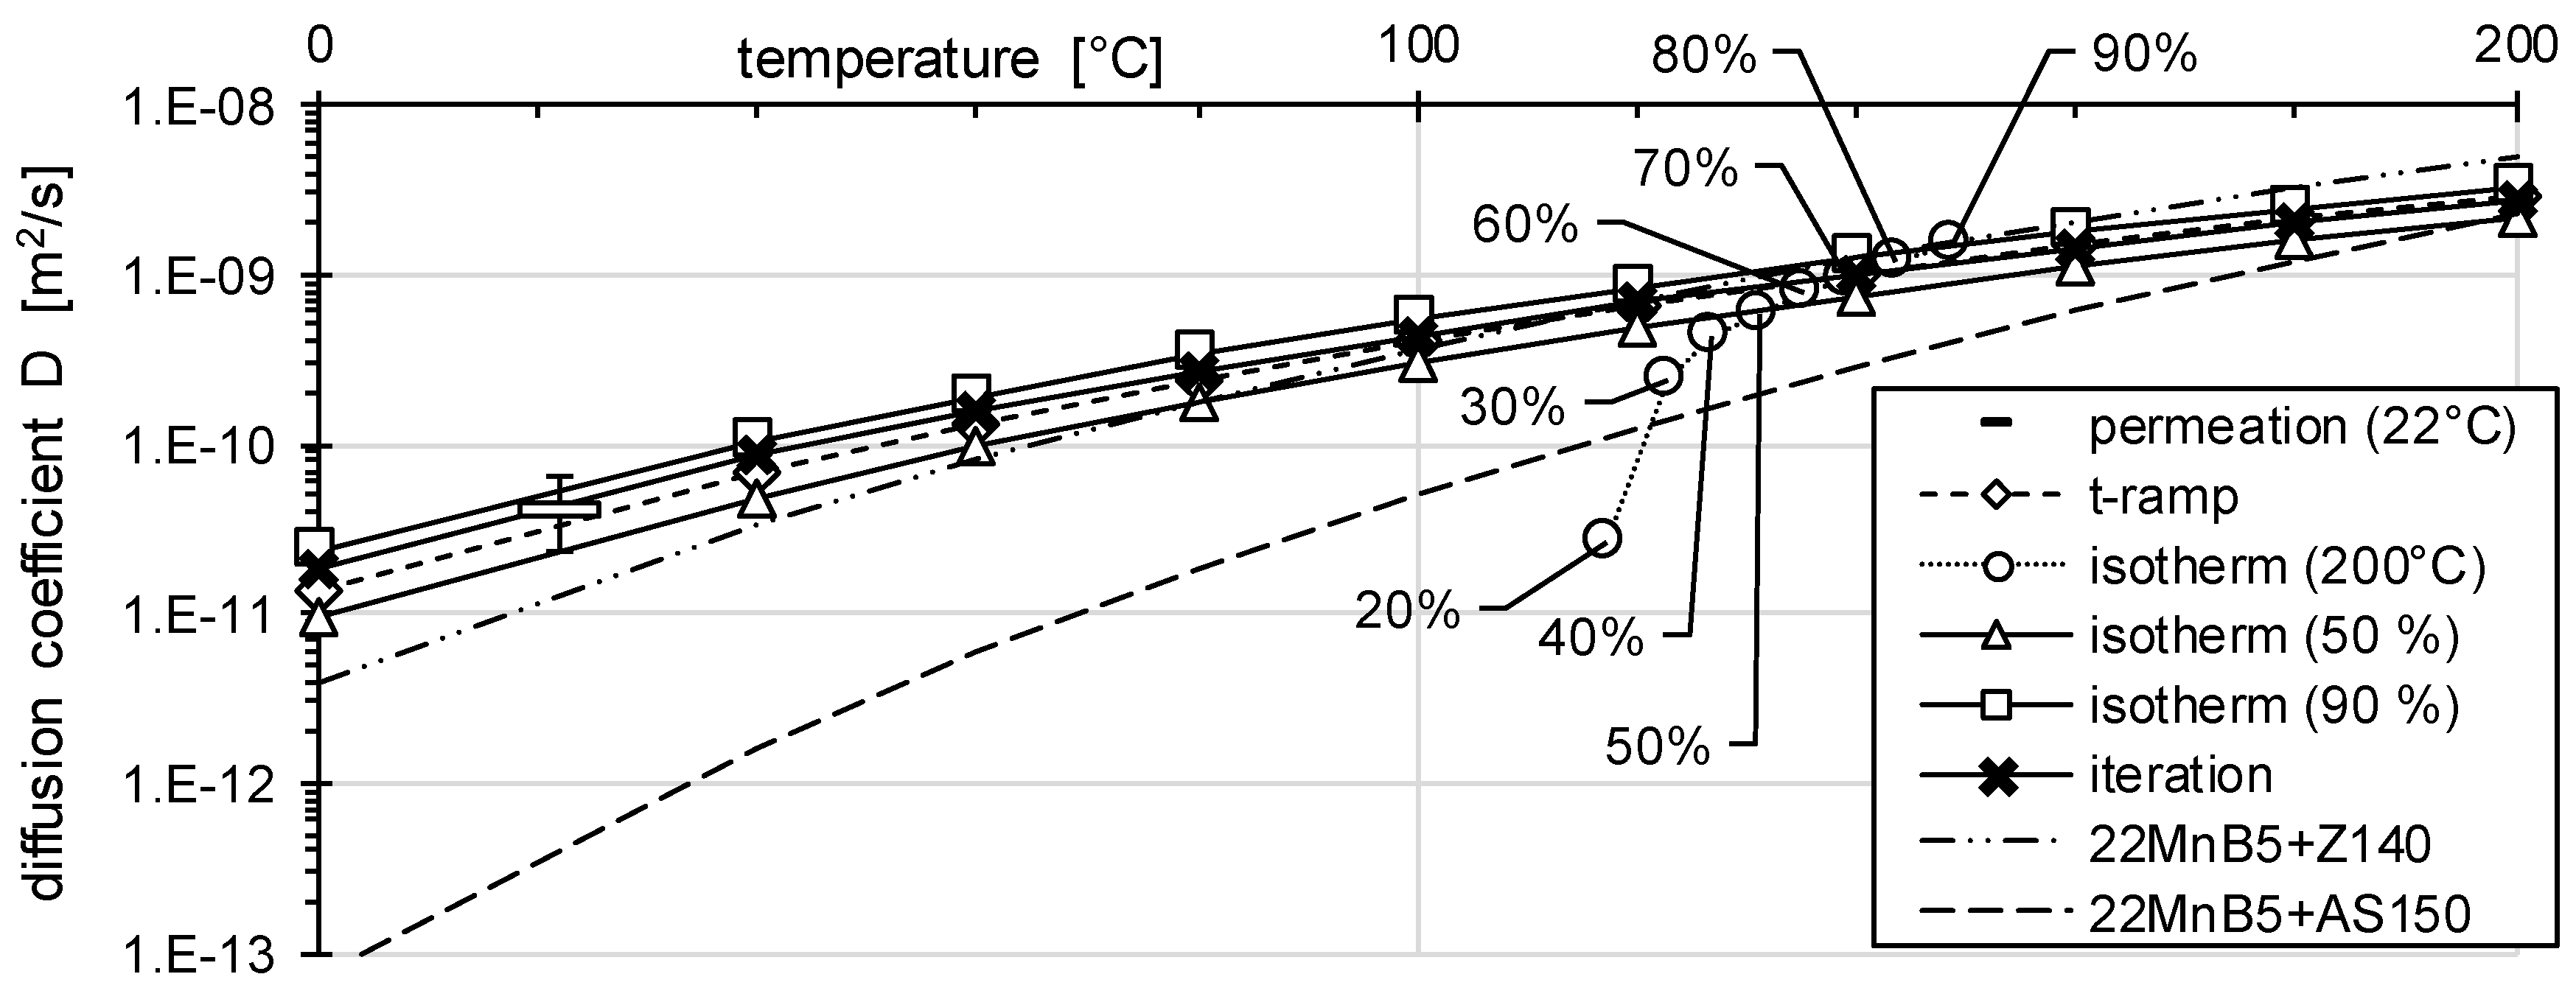
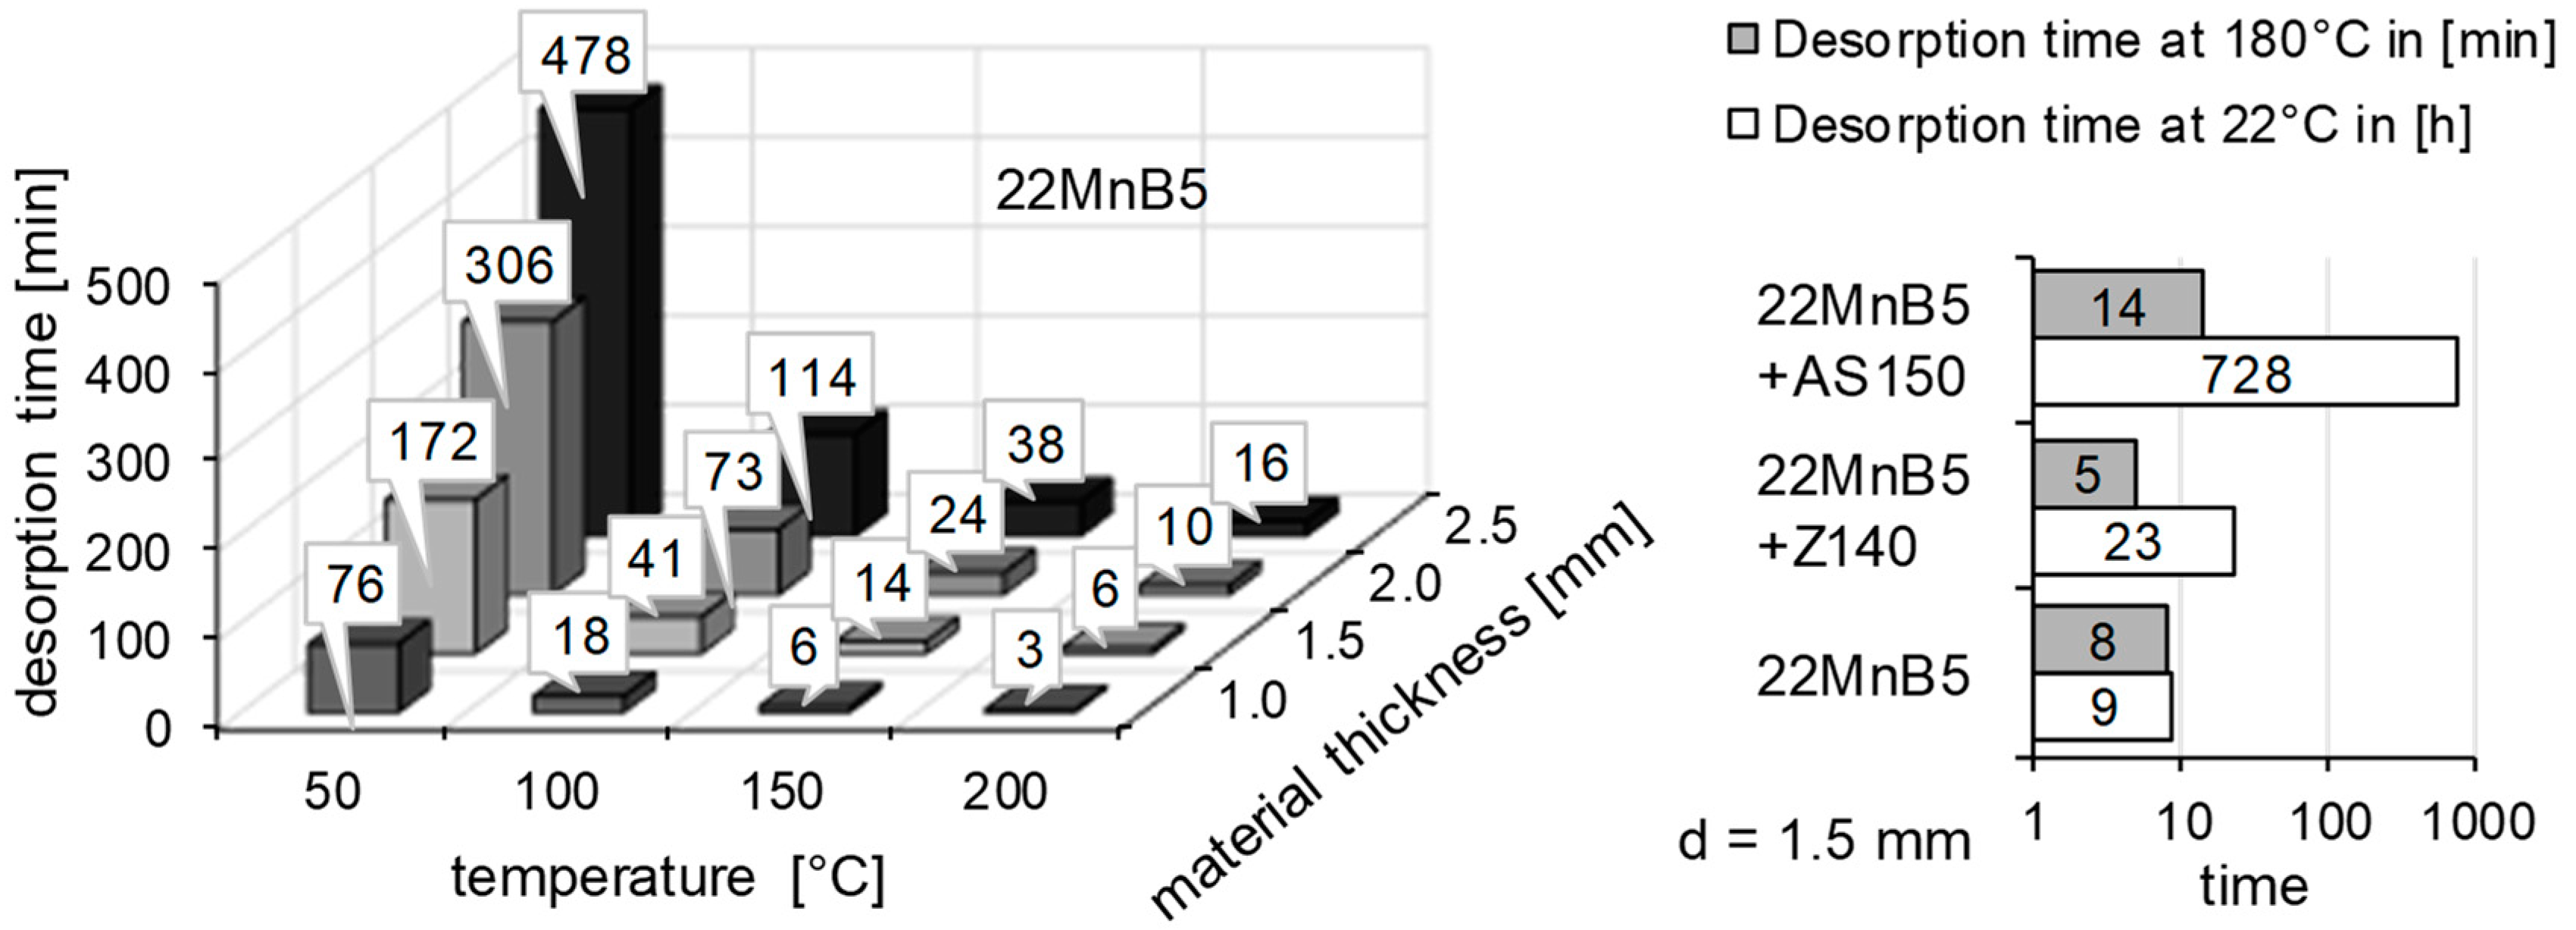
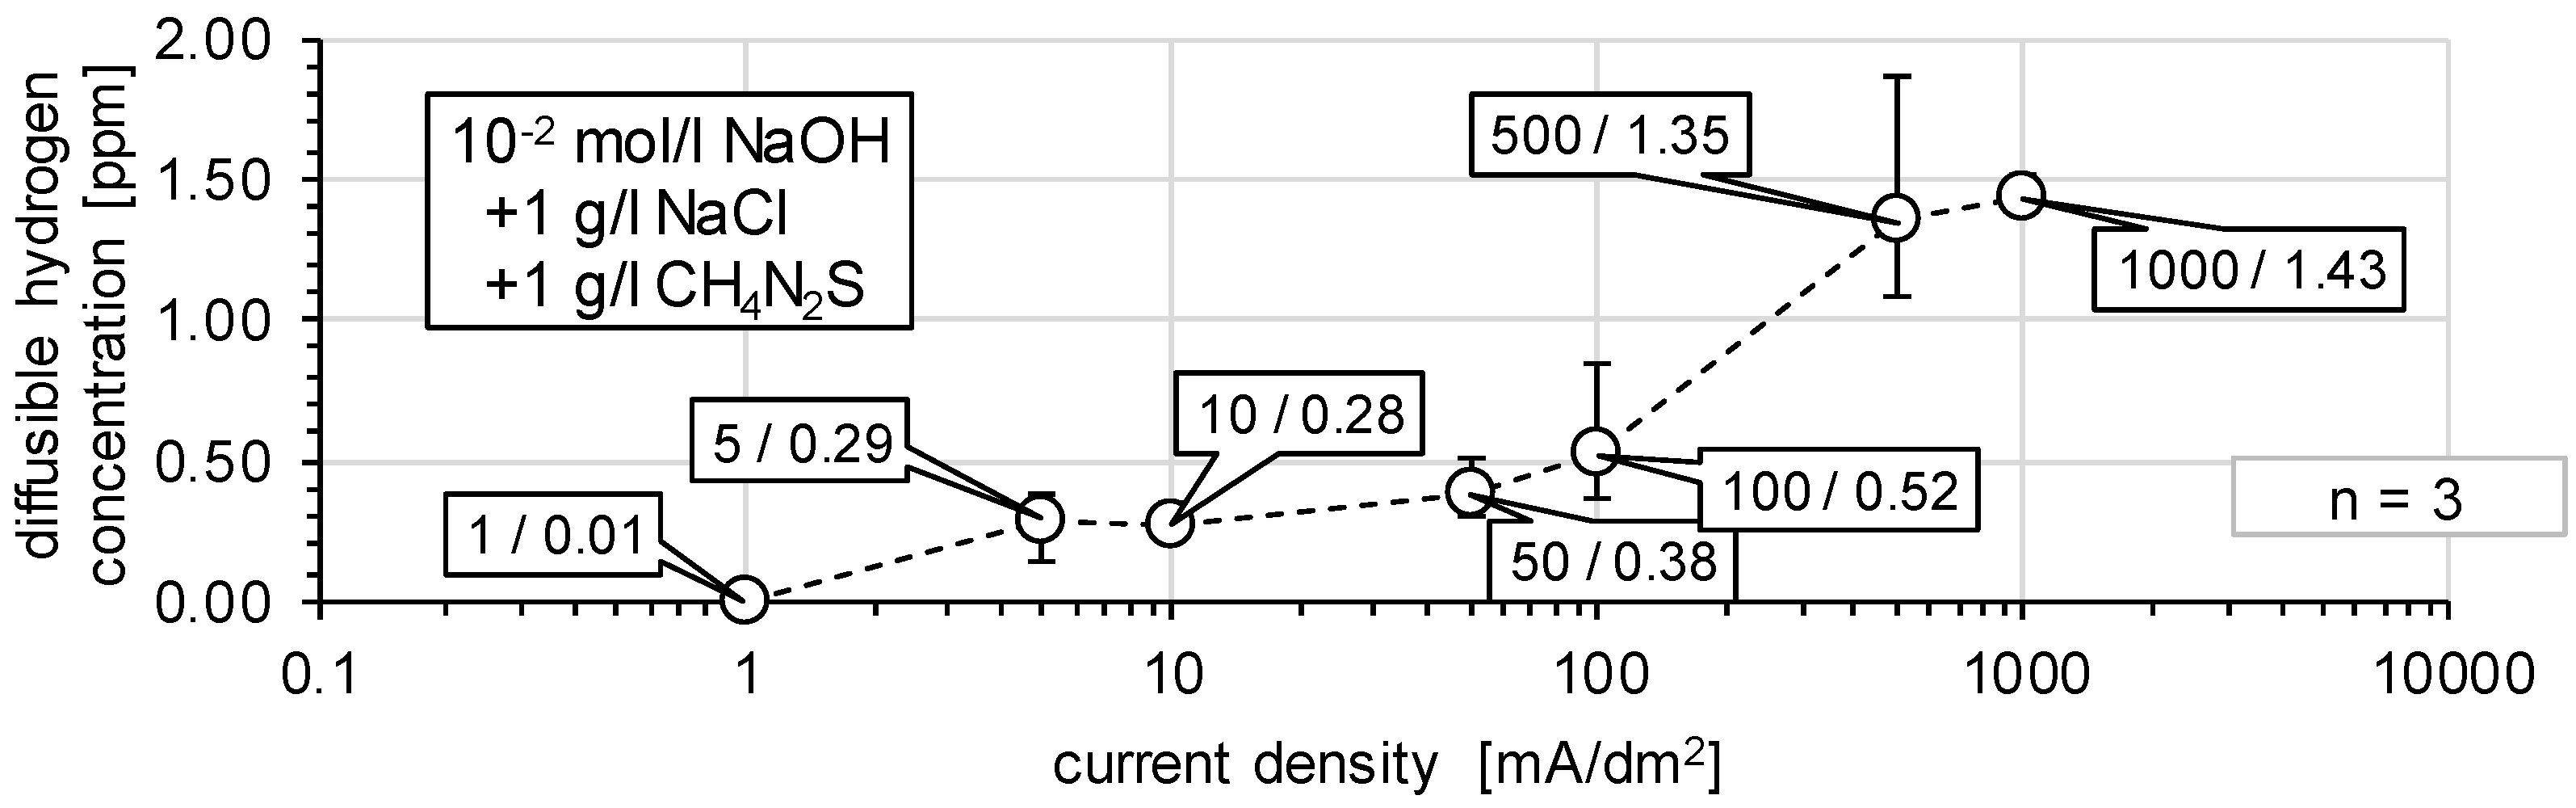
3.1. Determination of H Diffusion by Permeation Measurement
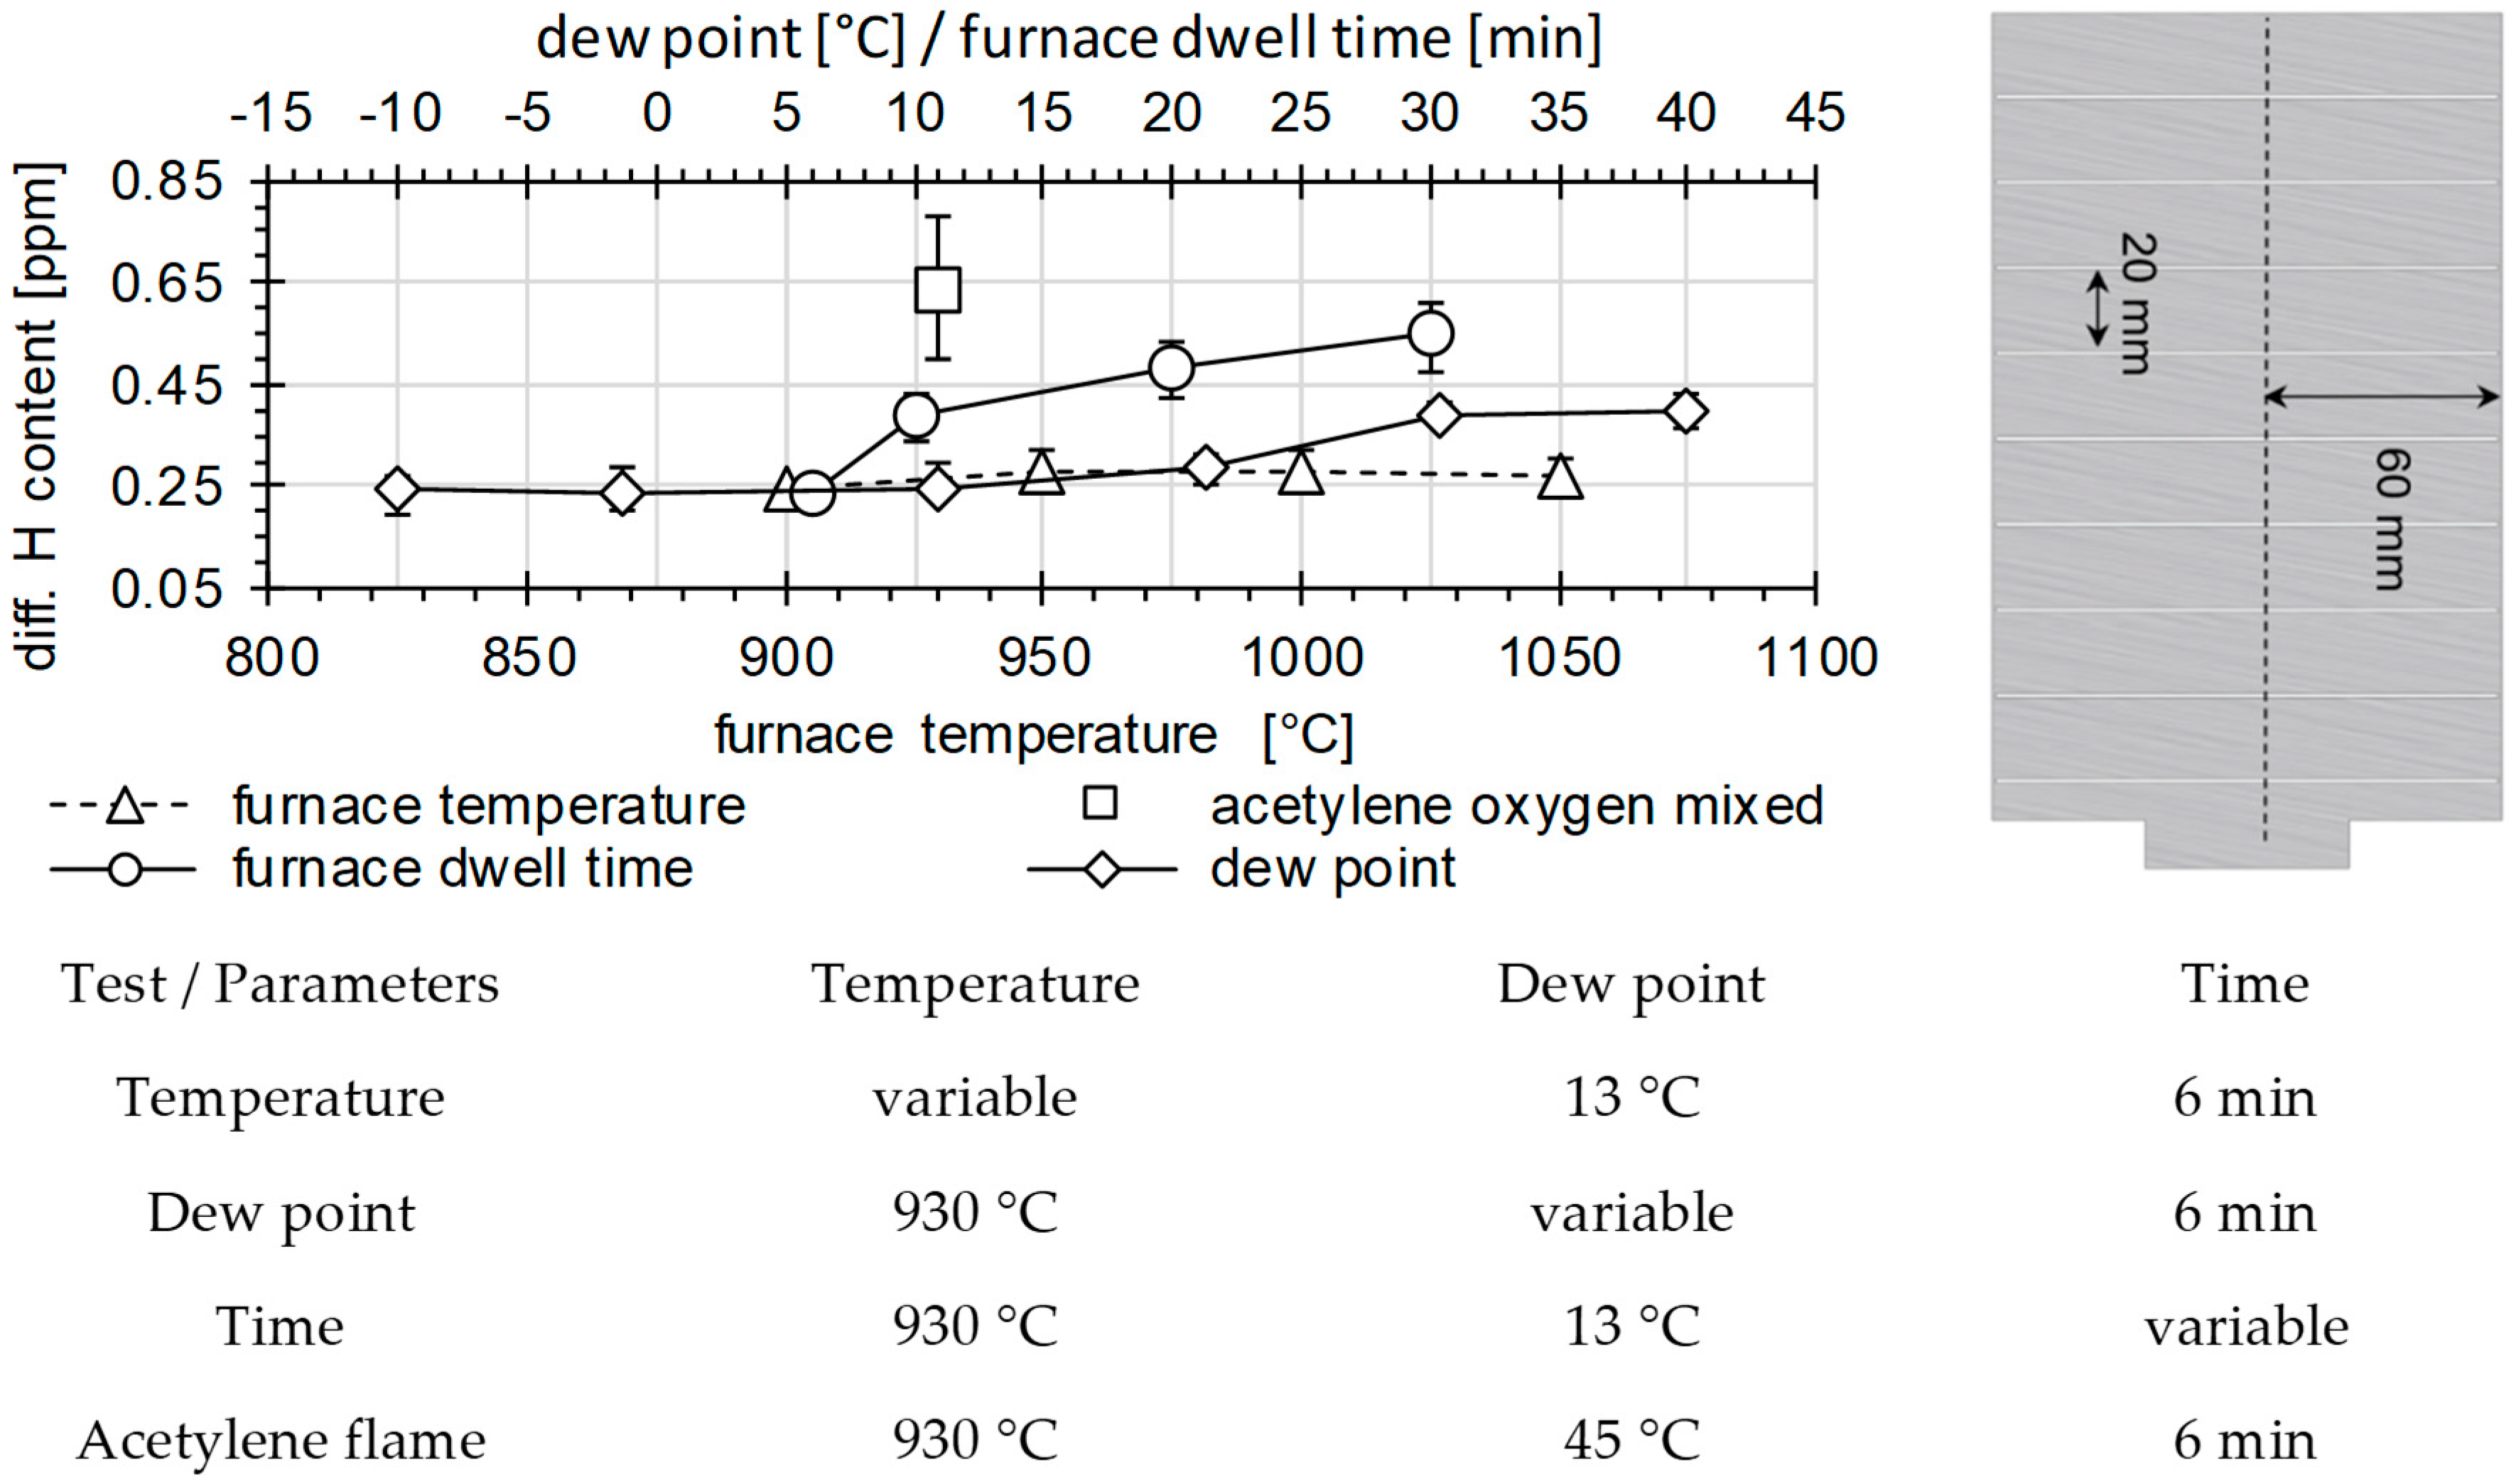
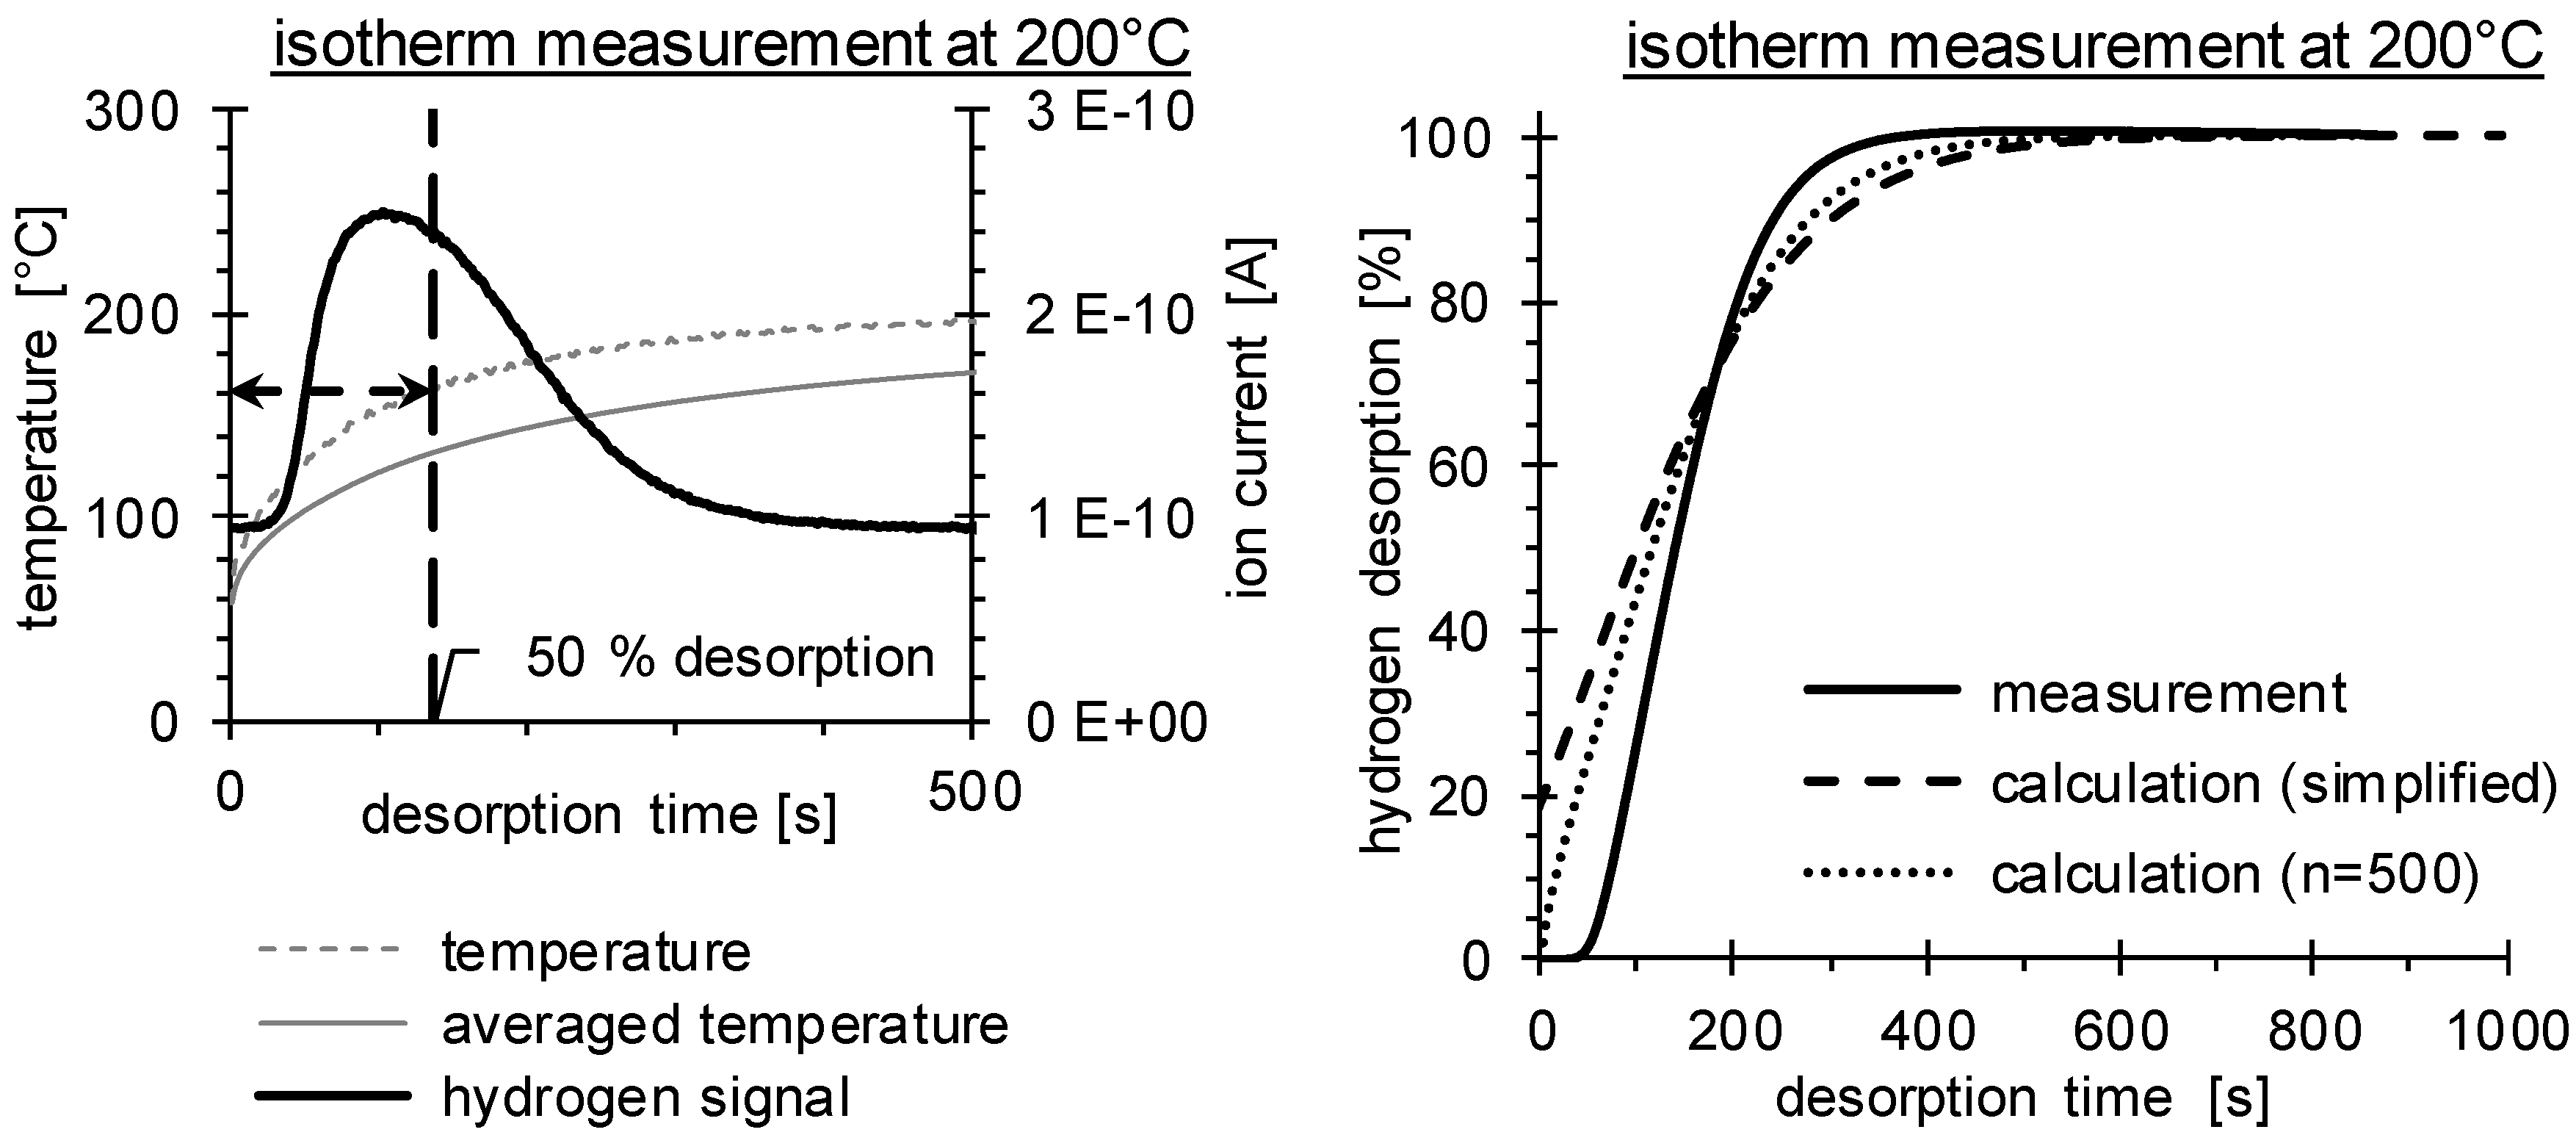
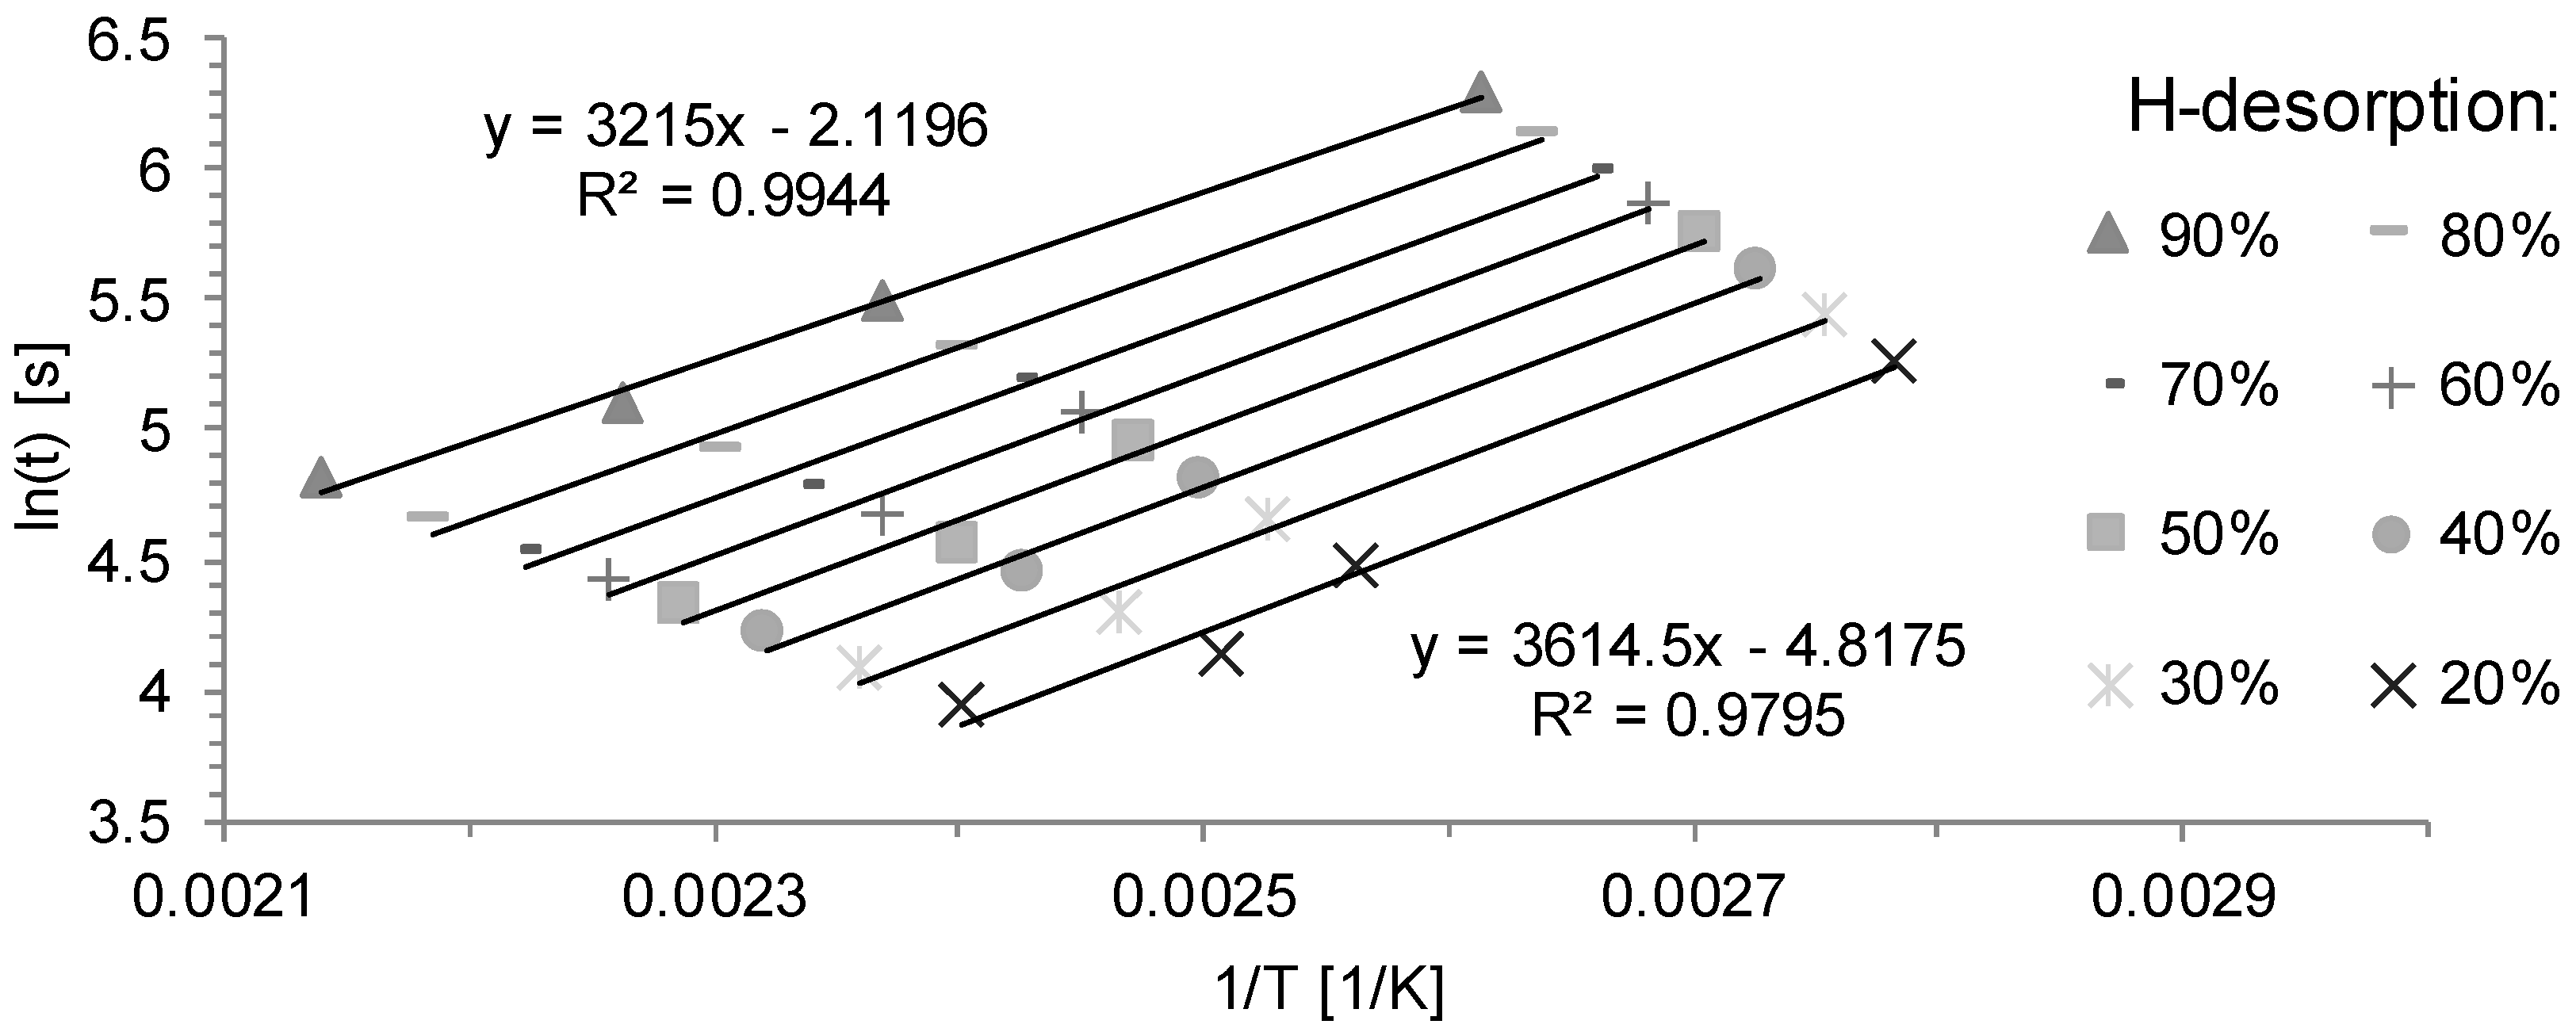
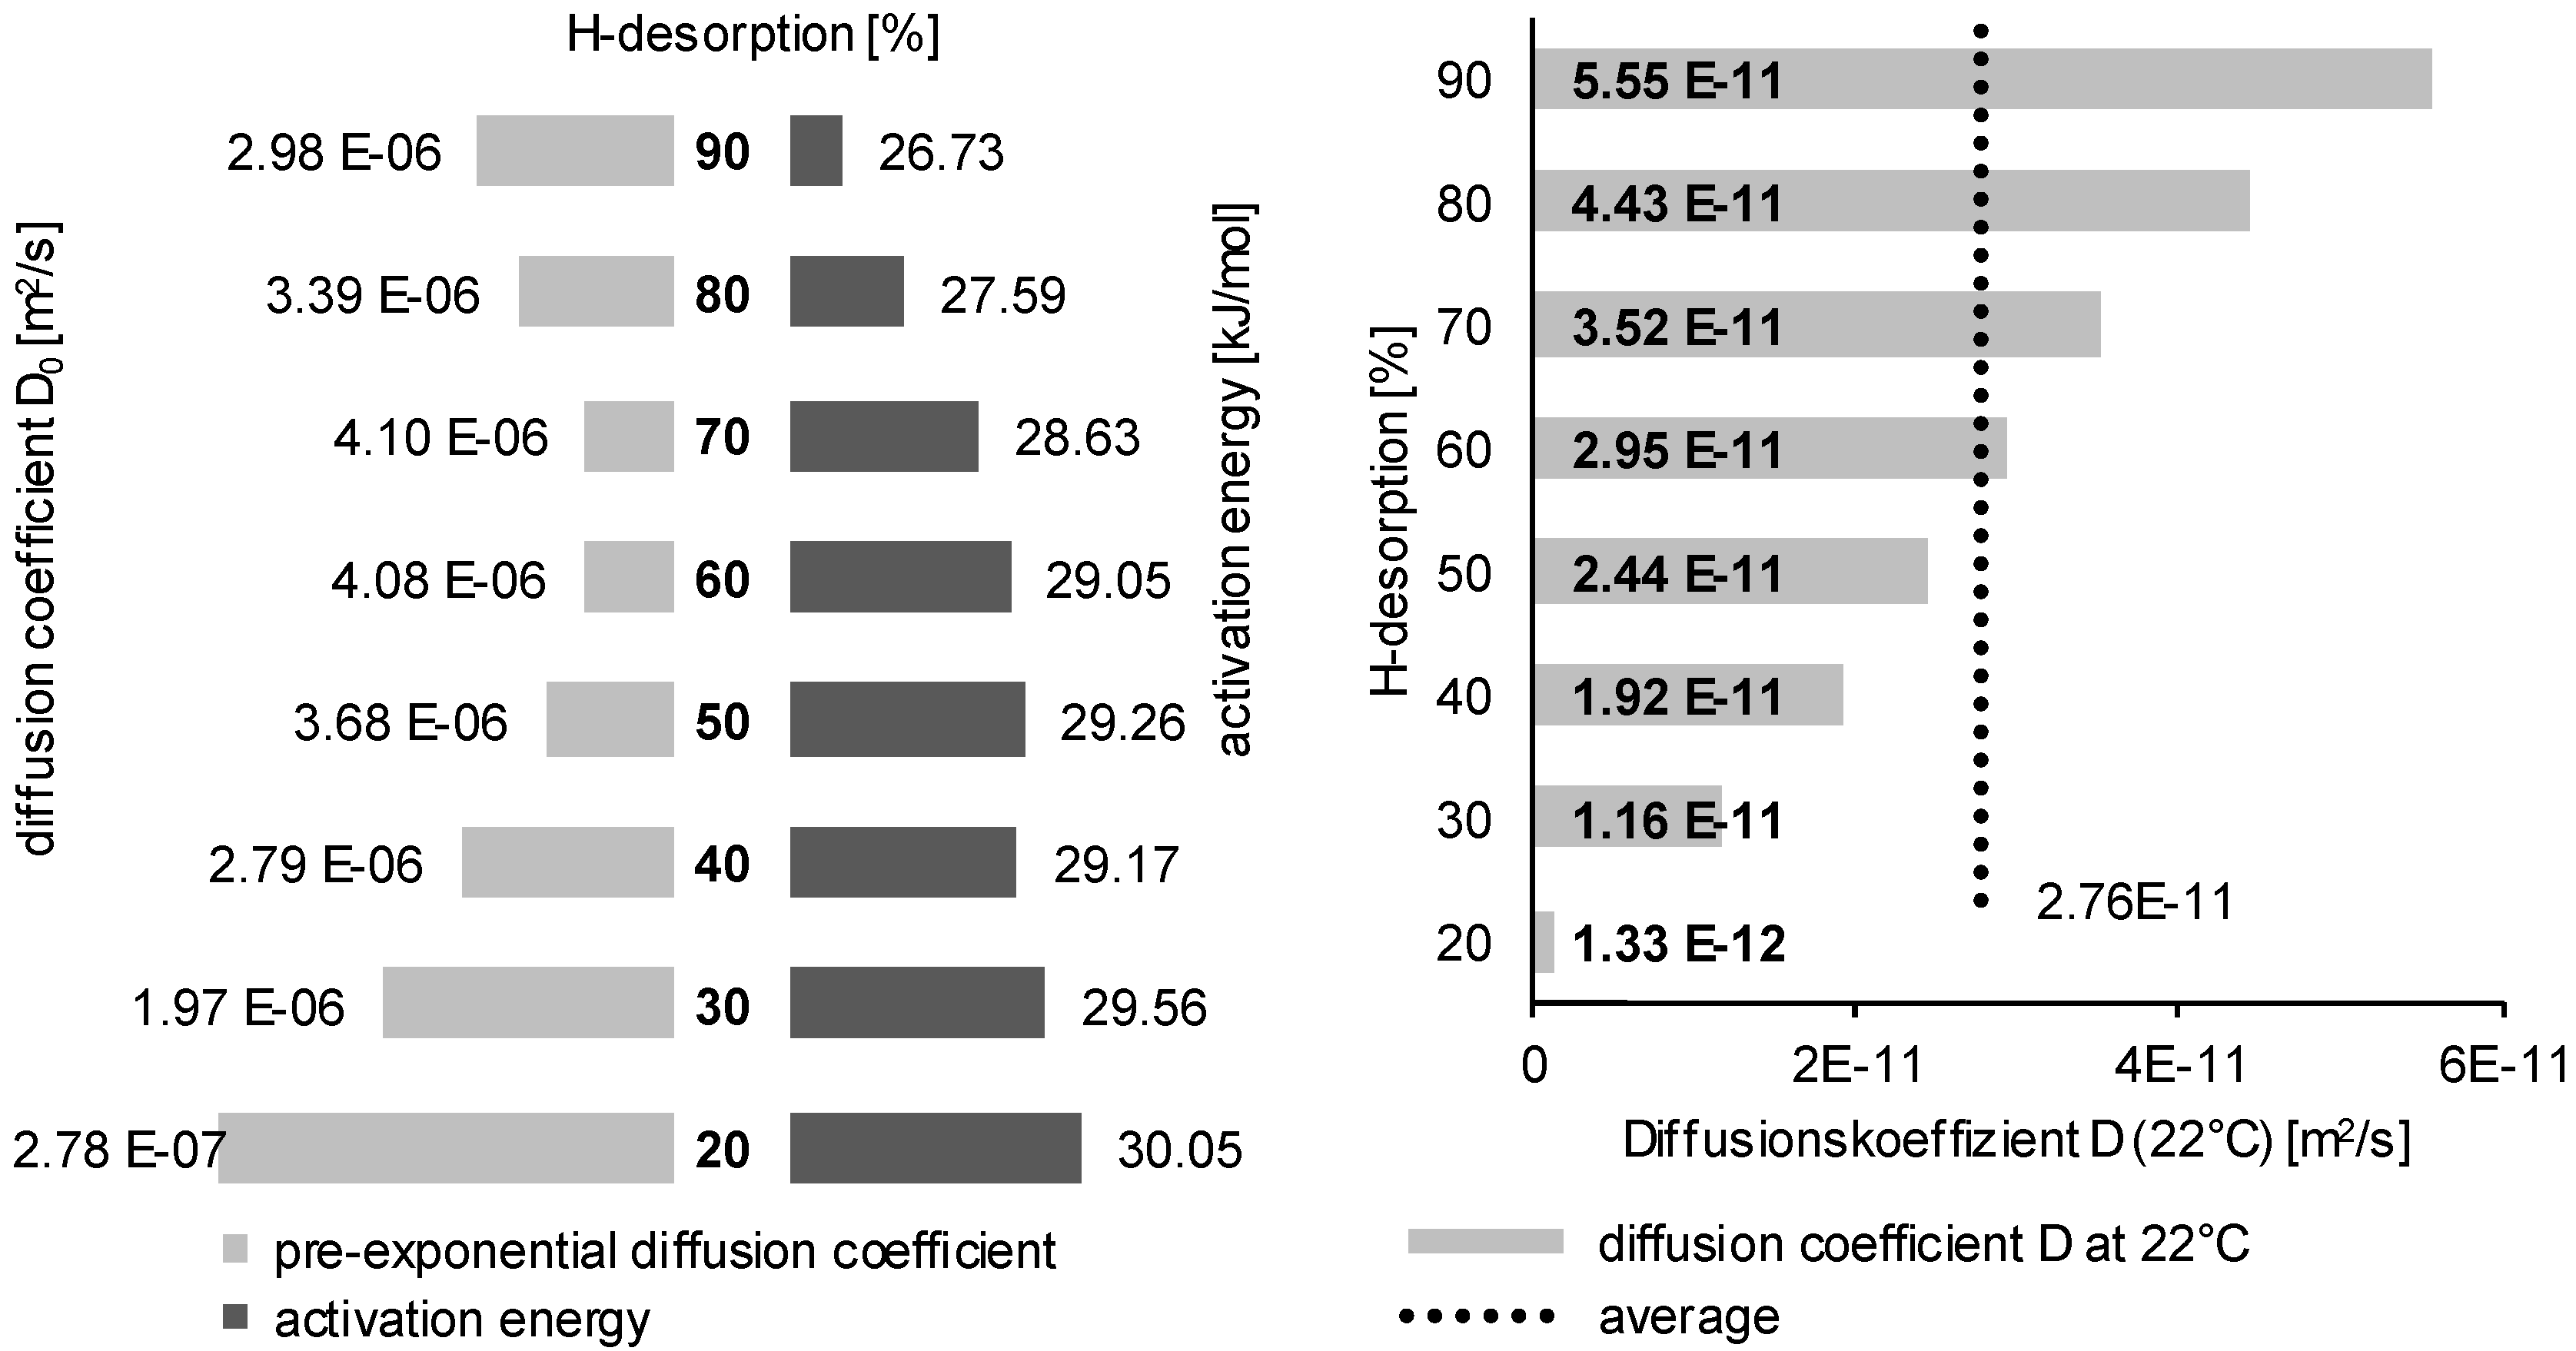
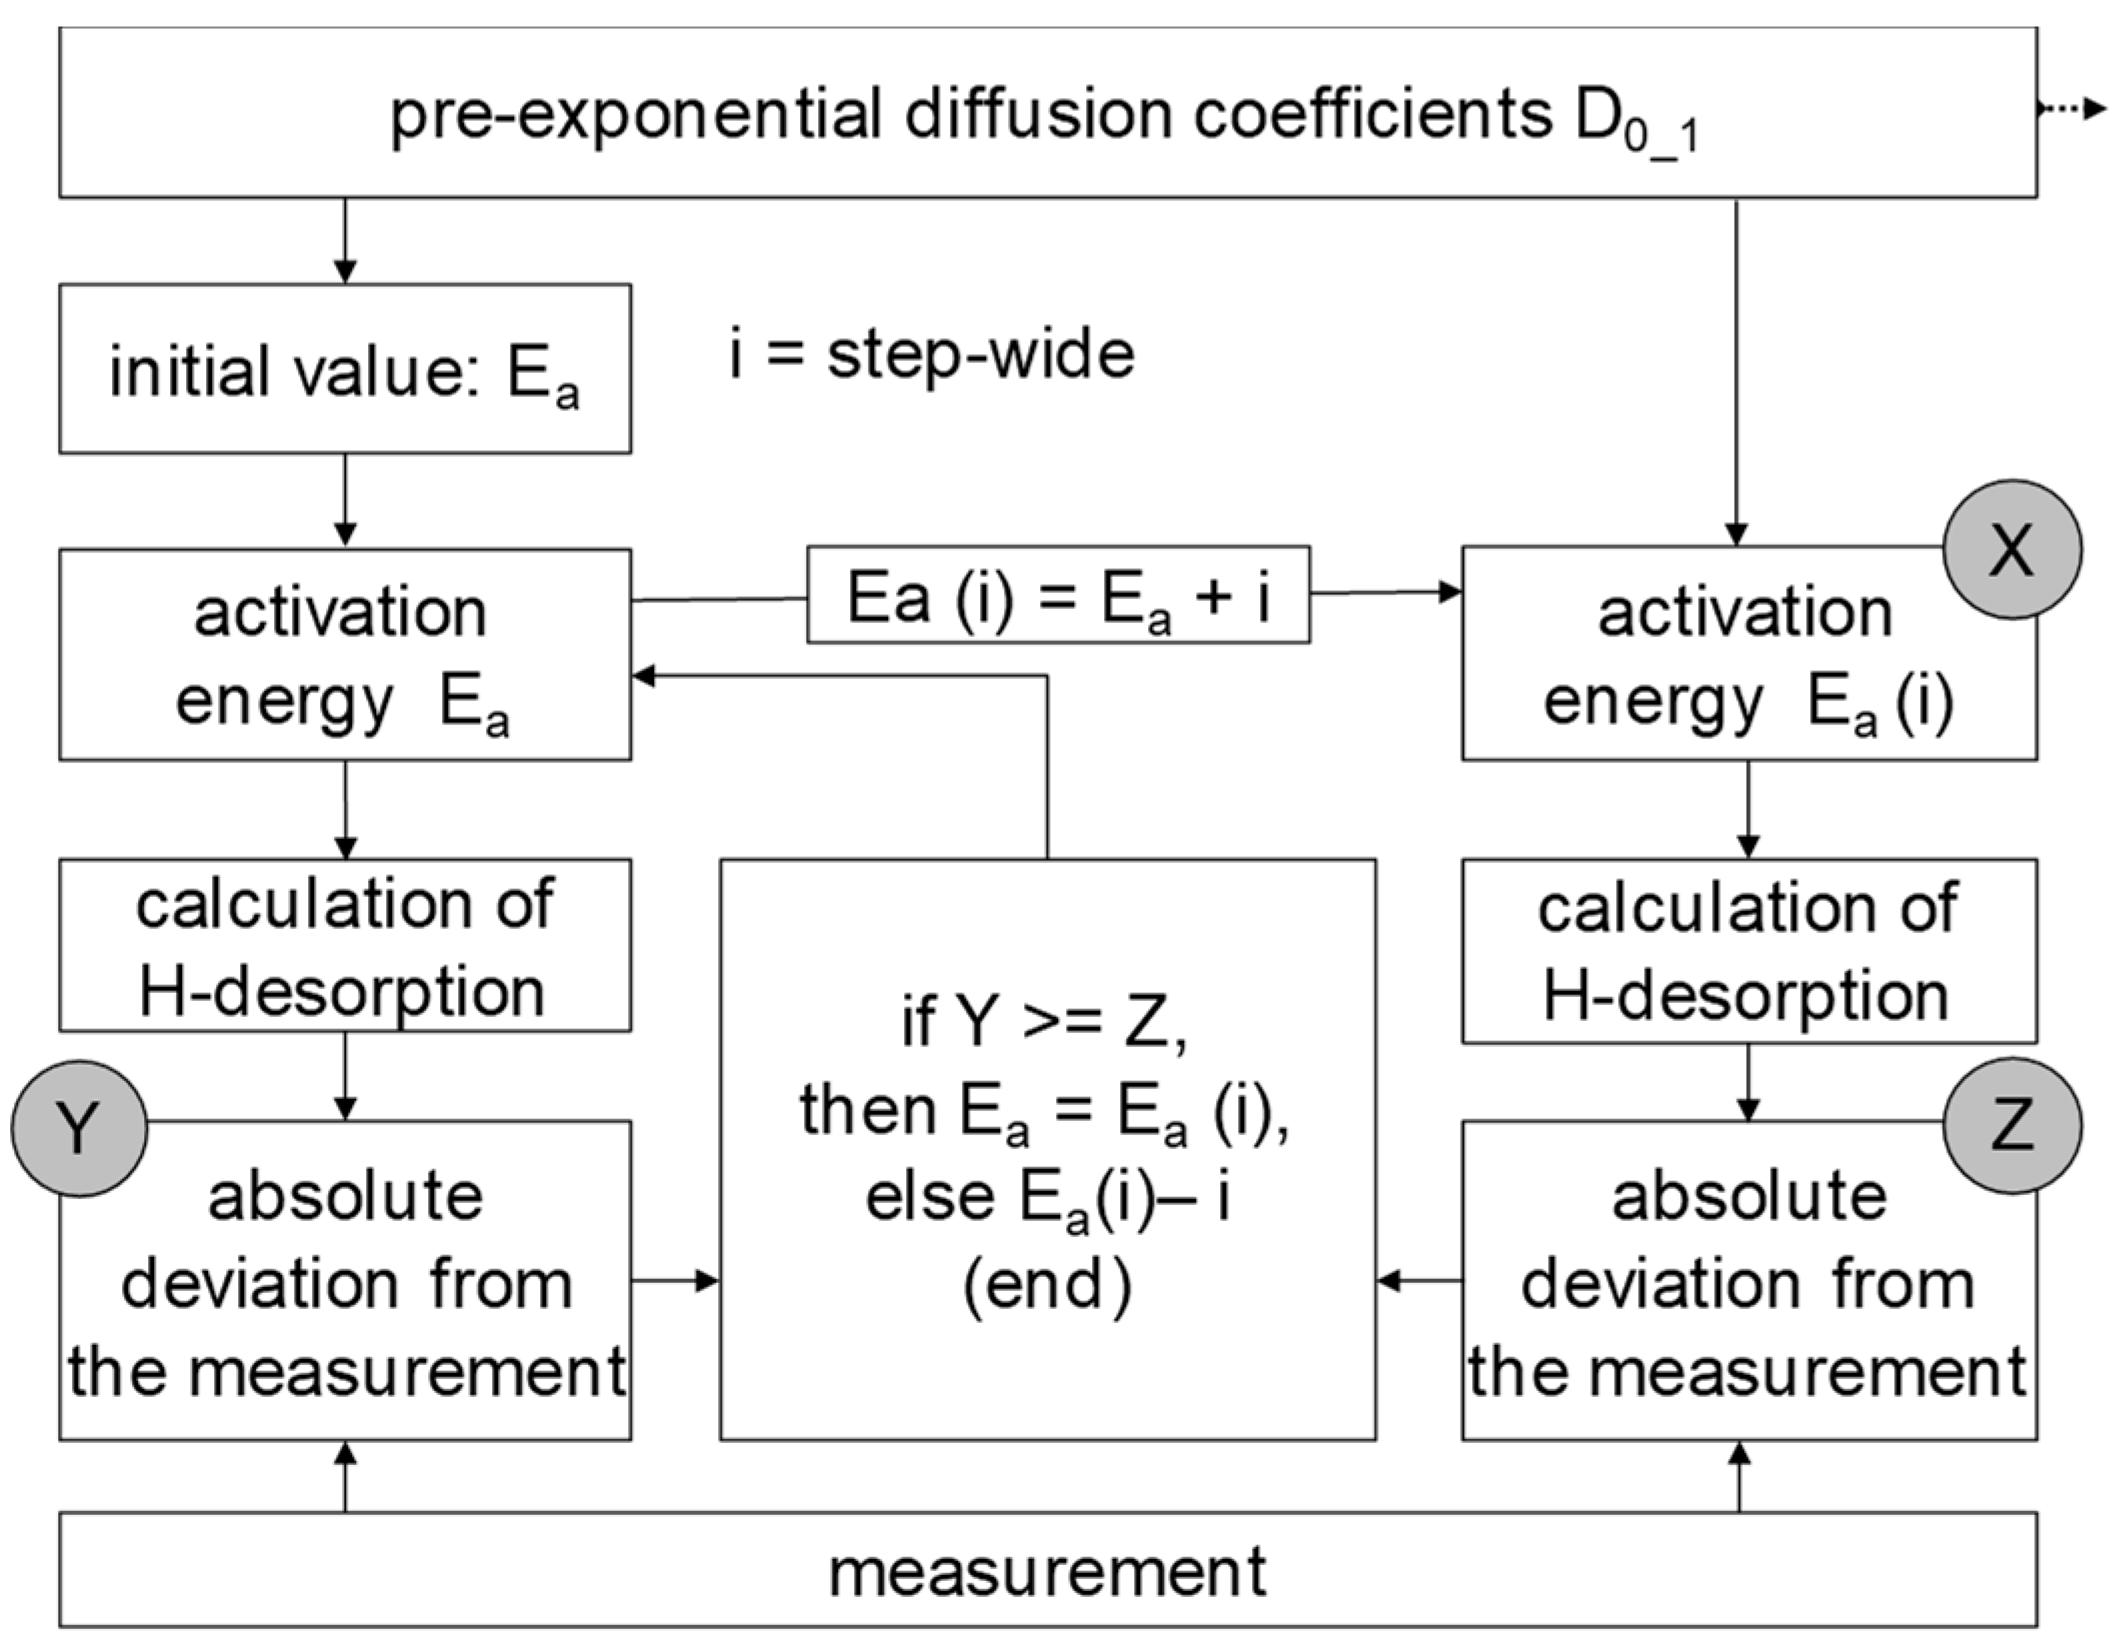
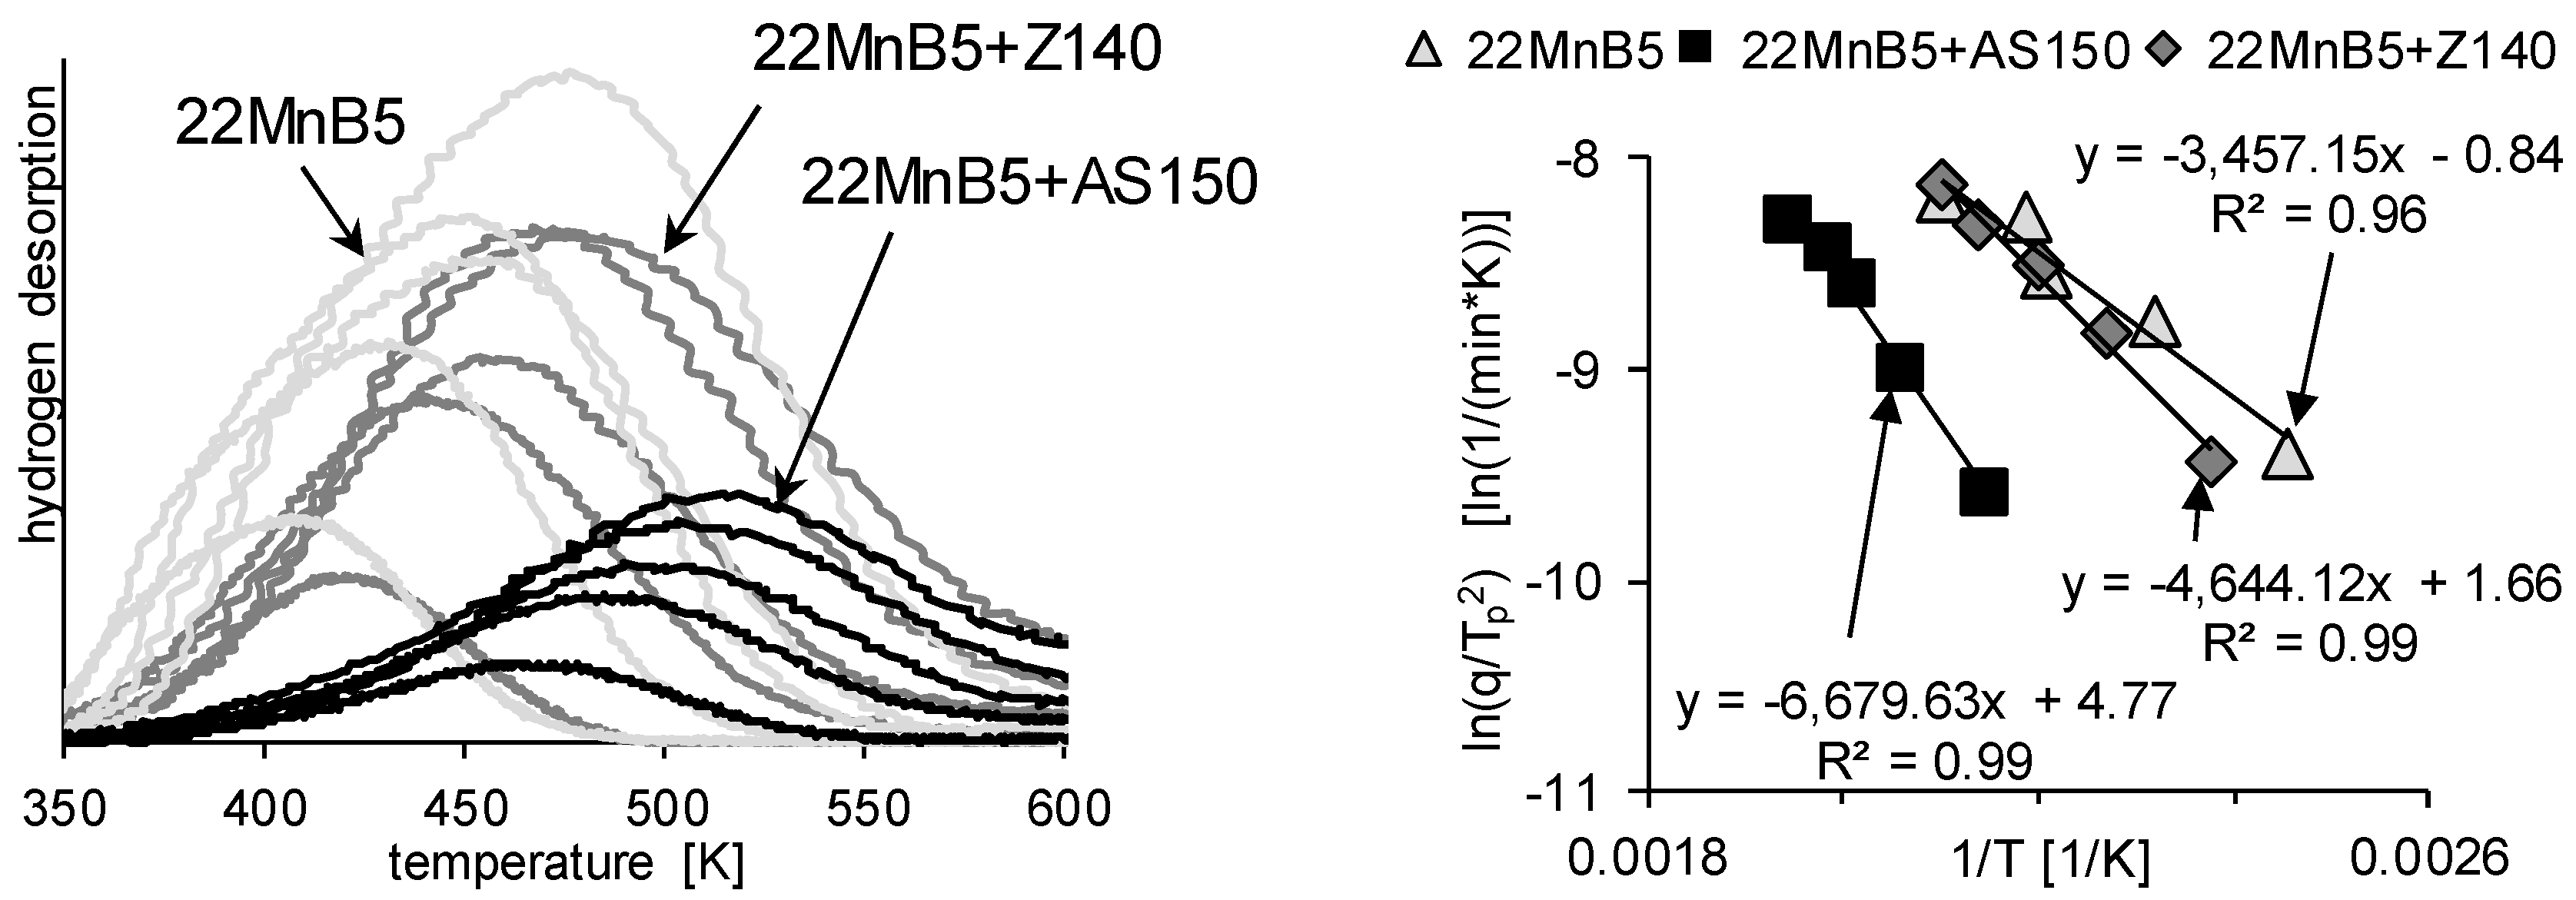
3.2. Determination of H Diffusion by Thermal Desorption Analysis
4. Conclusions
Author Contributions
Funding
Acknowledgments
Conflicts of Interest
References
- Lechler, J. Beschreibung und Modellierung des Werkstoffverhaltens von presshärtbaren Bor-Manganstählen; Meisenbach GmbH: Bamberg, Germany, 2009. [Google Scholar]
- Li, D.; Chrysanthou, A.; Patel, I.; Williams, G. Self-piercing riveting—A review. Int. J. Adv. Manuf. Technol. 2017, 92, 1777–1824. [Google Scholar] [CrossRef]
- Paatsch, W. Wasserstoffbestimmung und Wasserstoffversprödung–Sinn und Nutzen. Galvanotechnik 2011, 102, 48–55. [Google Scholar]
- DIN 50969-1. Vermeidung fertigungsbedingter wasserstoffinduzierter Sprödbrüche bei hochfesten Bauteilen aus Stahl–Teil 1: Vorbeugende Maßnahmen; Deutsches Institut für Normung: Berlin, Germany, 2009. [Google Scholar]
- Wendler-Kalsch, E. Grundlagen und Mechanismen der Wasserstoff-induzierten Korrosion metallischer Werkstoffe. In Wasserstoff und Korrosion; Kuron, D., Ed.; Irene Kuron: Bonn, Germay, 2000; pp. 7–53. [Google Scholar]
- DIN EN ISO 15330. Verbindungselemente Verspannungsversuch zur Entdeckung von Wasserstoffversprödung, Verfahren mit parallelen Auflageflächen; Deutsches Institut für Normung: Berlin, Germany, 1999. [Google Scholar]
- Venezuela, J.; Liu, Q.; Zhang, M.; Zhou, Q.; Atrens, A. A review of hydrogen embrittlement of martensitic advanced high-strength steels. Corros. Rev. 2016, 34, 153–186. [Google Scholar] [CrossRef]
- Kunze, E.H. Korrosion und Korrosionsschutz; Wiley-VCH: Weinheim, Germany, 2001. [Google Scholar]
- Shreir, L.L. Übersicht der elektrochemischen Methoden zur Untersuchung von Wasserstoffversprödung und Spannungsrißkorrosion. Mater. Corros. 1970, 21, 613–629. [Google Scholar] [CrossRef]
- Tostmann, K.H. Ursachen und Vermeidung. In Korrosion; Wiley-VCH: Weinheim, Germany, 2001. [Google Scholar]
- Wranglén, G. Korrosion und Korrosionsschutz: Grundlagen, Vorgänge, Schutzmaßnahmen, Prüfung; Springer: Berlin, Germany, 1985. [Google Scholar]
- Lange, G.; Pohl, M. Systematische Beurteilung Technischer Schadensfälle; Wiley-VCH: Weinheim, Germany, 2014. [Google Scholar]
- Kaesche, H. Die Korrosion der Metalle: Physikalisch-Chemische Prinzipien und aktuelle Probleme, 3rd ed.; Springer: Berlin, Germany, 2011. [Google Scholar]
- Neuhaus, D. Method for measuring chemical diffusion coefficients in solids. Appl. Phys. A 2010, 100, 991–1000. [Google Scholar] [CrossRef]
- Shewmon, P.; Shen, Y.L.; Shen, C.H.; Meshii, M. Analysis of diffusion controlled release of hydrogen from nickel and inconel 600. Acta Metall. 1989, 37, 1913–1921. [Google Scholar] [CrossRef]
- Heumann, T. Diffusion in Metallen. Grundlagen, Theorie, Vorgänge in Reinmetallen und Legierungen; Springer: Berlin, Germany, 1992. [Google Scholar]
- Seeger, D.M. Wasserstoffaufnahme und -diffusion in Schweißnahtgefügen hochfester Stähle. Ph.D. Thesis, Helmut-Schmidt-Univ. der Bundeswehr, Hamburg, Germany, 2005. [Google Scholar]
- DIN EN ISO 17081: Elektrochemisches Verfahren zur Messung der Wasserstoff-Permeation und zur Bestimmung von Wasserstoffaufnahme und-transport in Metallen; Deutsches Institut für Normung: Berlin, Germany, 2014.
- Crank, J. The Mathematics of Diffusion, 2nd ed.; Clarendon Press: Oxford, UK, 1975. [Google Scholar]
- Thyssenkrupp Steel Europe AG: Borlegierter Einsatz: und Vergütungsstahl. Available online: https://www.thyssenkrupp-steel.com/de/produkte/mittelband/produktdetails/borlegierter-sonderbaustahl/ (accessed on 24 July 2019).
- Addach, H.; Berçot, P.; Rezrazi, M.; Takadoum, J. Study of the electrochemical permeation of hydrogen in iron. Corros. Sci. 2009, 51, 263–267. [Google Scholar] [CrossRef]
- Kuhlmann, M.; Schwedler, O.; Holtschke, N.; Jüttner, S. Consideration of hydrogen transport in press-hardened 22MnB5. Mater. Test. 2015, 57, 977–984. [Google Scholar]
- Georges, C.; Machedo, T.; Drillet, P. Measurements and modelling of hydrogen desorption at room temperature in Al-Si-coated boron steel. In Proceedings of the Steely Hydrogen Conference Proceedings, Genth, Belgium, 28–29 September 2011; pp. 77–88. [Google Scholar]
- Weczera, S.; Rhode, M.; Sunderkötter, C. Laboratory experiments on press hardened steels in different delivered states exposed to hydrogen. In Proceedings of the Hot Sheet Metal Forming of high-performance Steel, Luleå, Sweden, 31 May–3 June 2015; Steinhoff, K., Oldenburg, M., Prakash, B., Eds.; Wissenschaftliche Scripten: Toronto, ON, Canada, 2015; pp. 45–53. [Google Scholar]
- Georges, C.; Sturel, T.; Drillet, P. Absorption/desorption of diffusible hydrogen in aluminized boron steel. ISIJ Int. 2013, 53, 1295–1304. [Google Scholar] [CrossRef]
- Kuhlmann, M.; Schwedler, O.; Jüttner, S. Betrachtung des Wasserstoffverhaltens beim Formhärten von 22MnB5 mit Aluminium-Silizium-Überzug. In Proceedings of the 11. Erlanger Workshop Warmblechumformung: Tagungsband zum 11. Erlanger Workshop Warmblechumformung, Erlangen, Bavaria, Germany, 17 November 2016; Meisenbach GmbH: Bavaria, Germany, 2016. [Google Scholar]


| Symbol | Description | Diffusion Direction |
|---|---|---|
| c(x,t) | Hydrogen at location “x” at time “t” |  |
| Average hydrogen concentration at time “t” | ||
| cR | Hydrogen boundary concentration | |
| c0 | Initial hydrogen concentration | |
| X | Position/location of hydrogen in the workpiece | |
| N | Running number of the infinite sum | |
| D | Material thickness | |
| D | Diffusion coefficient |
| 22MnB5 | C | Si | Mn | P | S | Cr | Al | Ti | B |
|---|---|---|---|---|---|---|---|---|---|
| min. | 0.20 | 0.20 | 1.10 | - | - | 0.15 | 0.020 | 0.020 | 0.0008 |
| actual values | 0.23 | 0.24 | 1.21 | 0.012 | 0.002 | 0.22 | 0.035 | 0.037 | 0.0030 |
| max. | 0.25 | 0.40 | 1.40 | 0.025 | 0.010 | 0.35 | 0.060 | 0.050 | 0.0050 |
| 37MnB4 | |||||||||
| min. | 0.34 | - | 0.80 | - | - | 0.15 | 0.02 | 0.02 | 0.001 |
| actual values | 0.36 | 0.06 | 0.77 | 0.011 | 0.007 | 0.26 | 0.05 | 0.04 | 0.004 |
| max. | 0.40 | 0.40 | 1.10 | 0.025 | 0.015 | 0.35 | 0.06 | 0.05 | 0.005 |
| Material | Permeation | Thermal Desorption Analysis |
|---|---|---|
| 22MnB5 | Ø 25 mm, d = 1–1.2 mm | 60 mm × 20 mm × 1.3 mm |
| 37MnB4 | Ø 25 mm, d = 1–1.2 mm | Ø 4.5 mm, l = 100–120 mm |
| Ea/D0 | Desorption Time | |
|---|---|---|
| Analysis temperature and heating rate | 0.2; 0.4; 0.6; 0.8; 1.0 °C/s (ΔT from 50 to 900 °C) | 150–300 °C for the empirical Validation of desorption time |
| Analysis time | ΔT/q | 20–30 min |
| 22MnB5 | 22MnB5 + Z140 | 22MnB5 + AS150 | 37MnB4 | |
|---|---|---|---|---|
| Ea [kJ/mol] | 28.74 | 38.61 | 55.54 | 30.79 |
| D0 [m2/s] | 4.29 × 10⁻⁶ | 9.28 × 10⁻⁵ | 3.01 × 10⁻³ | 1.27 × 10⁻⁵ |
| D (22 °C) [m2/s] | 3.51 × 10⁻¹¹ | 1.36 × 10⁻¹¹ | 4.46 × 10⁻¹³ | 4.54 × 10⁻¹¹ |
| D0 [× 10−6 m2/s] | 1.00 | 2.08 | 2.38 | 3.00 | 4.08 | 4.23 | 5.00 | |
| 150 °C | 24.02 | 26.34 | 26.78 | 27.51 | 28.48 | 28.60 | 29.13 | Ea [kJ/mol] |
| 200 °C | 23.66 | 26.20 | 26.69 | 27.48 | 28.55 | 28.68 | 29.26 | |
| 250 °C | 23.16 | 25.81 | 26.31 | 27.13 | 28.26 | 28.39 | 28.99 | |
| 300 °C | 23.59 | 26.39 | 26.91 | 27.77 | 28.94 | 29.09 | 29.74 | |
| standard deviation | 0.3528 | 0.2626 | 0.2580 | 0.2629 | 0.2834 | 0.2934 | 0.3259 | |
| average | 23.60 | 26.19 | 26.67 | 27.47 | 28.56 | 28.69 | 29.28 | |
| D (22 °C) [× 10−11 m2/s] | 6.64 | 4.82 | 4.54 | 4.12 | 3.60 | 3.54 | 3.29 |
© 2019 by the authors. Licensee MDPI, Basel, Switzerland. This article is an open access article distributed under the terms and conditions of the Creative Commons Attribution (CC BY) license (http://creativecommons.org/licenses/by/4.0/).
Share and Cite
Kuhlmann, M.; Mitzschke, N.; Jüttner, S. Determination of Hydrogen Transport Behaviour in Boron-Manganese Steels Using Different Methods and Boundary Conditions. Metals 2019, 9, 1007. https://doi.org/10.3390/met9091007
Kuhlmann M, Mitzschke N, Jüttner S. Determination of Hydrogen Transport Behaviour in Boron-Manganese Steels Using Different Methods and Boundary Conditions. Metals. 2019; 9(9):1007. https://doi.org/10.3390/met9091007
Chicago/Turabian StyleKuhlmann, Matthias, Niels Mitzschke, and Sven Jüttner. 2019. "Determination of Hydrogen Transport Behaviour in Boron-Manganese Steels Using Different Methods and Boundary Conditions" Metals 9, no. 9: 1007. https://doi.org/10.3390/met9091007
APA StyleKuhlmann, M., Mitzschke, N., & Jüttner, S. (2019). Determination of Hydrogen Transport Behaviour in Boron-Manganese Steels Using Different Methods and Boundary Conditions. Metals, 9(9), 1007. https://doi.org/10.3390/met9091007