Article

Densification, Microstructure and Properties of 90W-7Ni-3Fe Fabricated by Selective Laser Melting

1
State Key Laboratory for Manufacturing System Engineering, School of Mechanical Engineering, Xi’an Jiaotong University, Xi’an 710049, China
2
School of Mechanical Engineering, Dongguan University of Technology, Dongguan 523808, China
*
Author to whom correspondence should be addressed.
Metals 2019, 9(8), 884; https://doi.org/10.3390/met9080884
Submission received: 23 July 2019 / Revised: 7 August 2019 / Accepted: 7 August 2019 / Published: 13 August 2019
(This article belongs to the Special Issue Additive Manufacturing of Metals)

Abstract

:
The preparation of refractory tungsten and tungsten alloys has always been challenging due to their inherent properties. Selective laser melting (SLM) offers a choice for preparing tungsten and tungsten alloys. In this work, 90W-7Ni-3Fe samples were prepared by selective laser melting and investigated. Different process parameter combinations were designed according to the Taguchi method, and volumetric energy density (VED) was defined. Subsequently, the effects of process parameters on densification, phase composition, microstructure, tensile properties, and microhardness were investigated. Nearly a full densification sample (≥99%) was obtained under optimized process parameters, and the value of VED was no less than 300 J/mm3. Laser power had a dominant influence on densification behavior compared with other parameters. The main phases of 90W-7Ni-3Fe are W and γ-(Ni-Fe), dissolved with partial W. In addition, 90W-7Ni-3Fe showed a high tensile strength (UTS = 1121 MPa) with poor elongation (<1%). A high average microhardness (>400 HV0.3) was obtained, but the microhardness presented a fluctuation along building direction due to the inhomogeneous microstructure.

1. Introduction

Tungsten heavy alloys (WHA) have been used in many fields, including aerospace, defense, military, nuclear, electronics, and marine industries, due to their high melting point and density, excellent thermal conductivity, low thermal expansion, good corrosion resistance, and superior comprehensive properties at high temperatures [1,2]. They have also been proven to be ideal facing-plasma materials in the nuclear industry [3,4]. The 90W-7Ni-3Fe allow, a typical tungsten heavy alloy, which consists of tungsten (90 wt.%), Nickel (7 wt.%) and Iron (3 wt.%), possesses good mechanical properties due to the addition of Ni and Fe, while retaining high-density. In addition, Ni and Fe play a key role in the suppression of cracks in the fabrication of tungsten because of the nature of the brittleness of tungsten at room temperature [5]. Traditionally, 90W-7Ni-3Fe is processed by solid and liquid sintering. A mixture of tungsten, nickel, and iron powder was prepared and then sintered at a certain temperature, such as 1400 °C, for a fixed time in a vacuum or inert gas atmosphere [6,7]. Usually, sintered samples need to be treated by isostatic pressing or other heat treatments to reduce their porosity and avoid hydrogen embrittlement [8,9,10]. However, it is difficult, or even impossible, to obtain complex components of a tungsten heavy alloy by conventional processes. Thus, additive manufacturing (AM) may be an alternative manufacturing process for high melting point refractory metals, such as tungsten and its alloys.
Selective laser melting (SLM), as a metal additive manufacturing technology, has been proven to be a promising technology in the high-accuracy and integrated fabrication of metallic components. SLM employs a high-energy laser beam to melt metallic powder layer by layer, according to 2D slice data. SLM is a multidisciplinary cross-technology involving mechanical engineering, material science, optics, software, and has attracted much attention from many fields. Deprez et al. [11] produced a complex high-density tungsten collimator. The produced collimator was geometrically accurate, and the tested values of sensitivity and resolution were close to the expected results of the CAD design. The relative density of the SLM pure tungsten prepared by Zhang et al. [12] reached 82%, who found the formation of nanocrystalline in the tungsten samples fabricated by SLM. Zhou et al. [13] analyzed the balling phenomena in the process of SLM-tungsten and proposed a competitive mechanism of spreading and solidification to explain the balling phenomena. Enneti et al. [14] investigated the effects of scan speed and hatch spacing on the relative density of SLM pure tungsten, but the highest relative density was only 75%. The relative density of the SLM tungsten prepared by Wen et al. [15] reached 98.7%, and they studied the effects of process parameters on the surface morphology, microstructure, and properties of SLM pure tungsten. Similarly, Tan et al. [16] also obtained SLM tungsten with a relative density of 98.5% and analyzed the effects of different laser powers and scan speeds on the SLM’s surface morphology, microstructure, and properties. All the previous studies on SLM tungsten indicated that the crack phenomenon was inevitable due to the inherent brittle nature of tungsten [17,18,19]. Therefore, several measures of crack-suppression for SLM pure tungsten were adopted and reported by Li et al. [20] and Iveković et al. [21]. Their results showed that the addition of secondary-phase nanoparticles or Tantalum could reduce cracks in the process of SLM pure tungsten, but a crack-free sample was still not available. In addition, the addition of low-melting-point metals might be beneficial to the fabrication of crack-free tungsten alloy components. Li et al. [22] investigated the fabrication of W-10Cu by SLM and obtained an optimized combination of laser power and scan speed. Their results showed that the forming mechanism of SLM W-10Cu was liquid phase sintering. Iveković et al. [23] obtained a 90W-7Ni-3Fe sample with a high relative density (>95%). Their results indicated that the high densification of 90W-7Ni-3Fe samples required a high energy density. In addition, they observed three major binding mechanisms: liquid phase sintering, partial melting, and complete melting. Preheating contributes to complete melting. After heat treatment, the tensile strength decreased slightly, but the elongation was significantly improved. Li et al. [24] studied the effect of process parameters on the densification and microstructure of 90W-7Ni-3Fe in SLM. They found that a lower scan speed, narrower scan interval, and thinner layer thickness can improve the densification process. Similar findings were also reported by Zhang et al. [25], who established an effective 3D model based on finite element analysis theory and temperature distributions under different process parameters. As mentioned above, tungsten and its alloys are of interest to researchers, but SLM 90W-7Ni-3Fe has been rarely discussed.
In this work, 90W-7Ni-3Fe samples were formed by SLM. The influences of the process parameters on the densification, phase constitution, and microhardness of the 90W-7Ni-3Fe samples were discussed. In addition, the microstructure and tensile properties of the 90W-7Ni-3Fe samples fabricated by SLM were investigated and discussed.

2. Materials and Methods

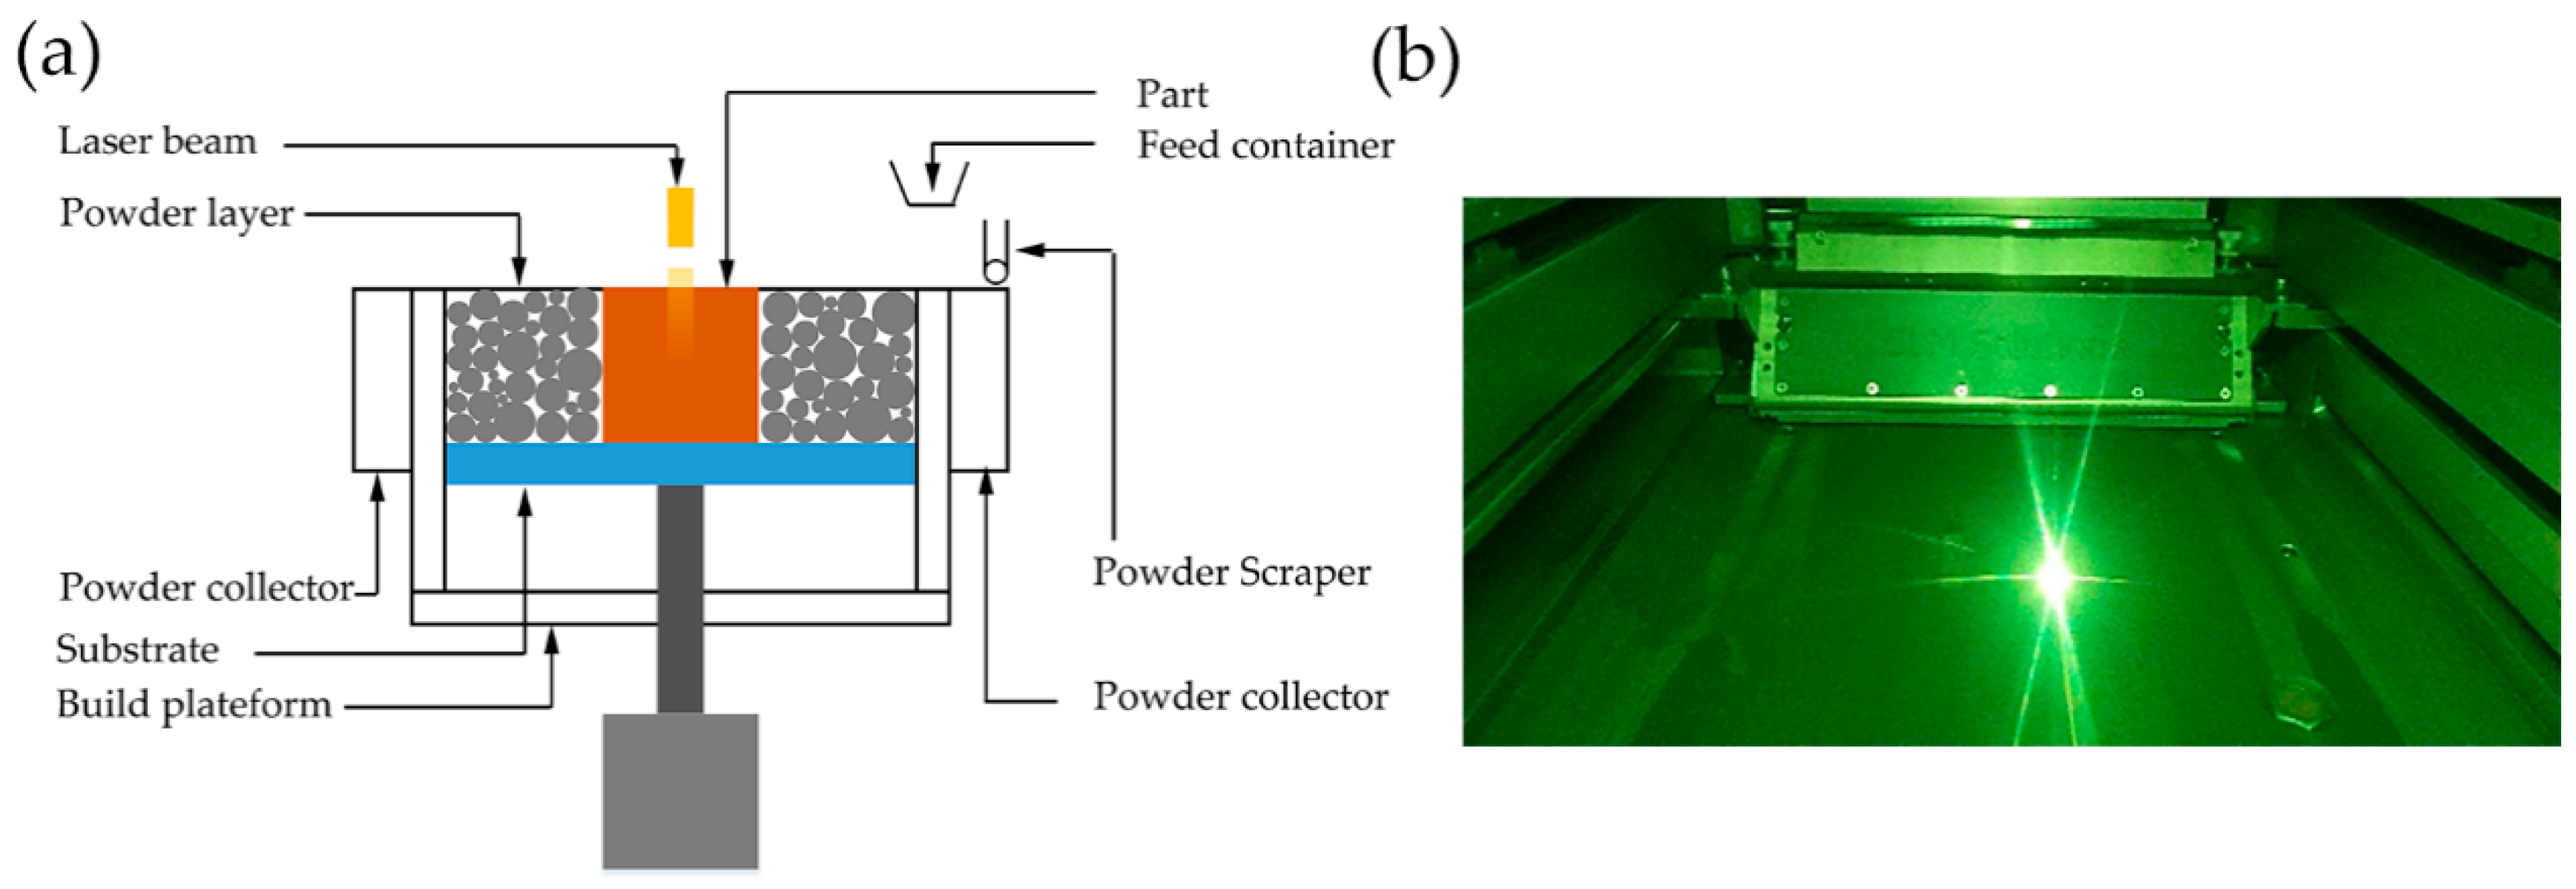
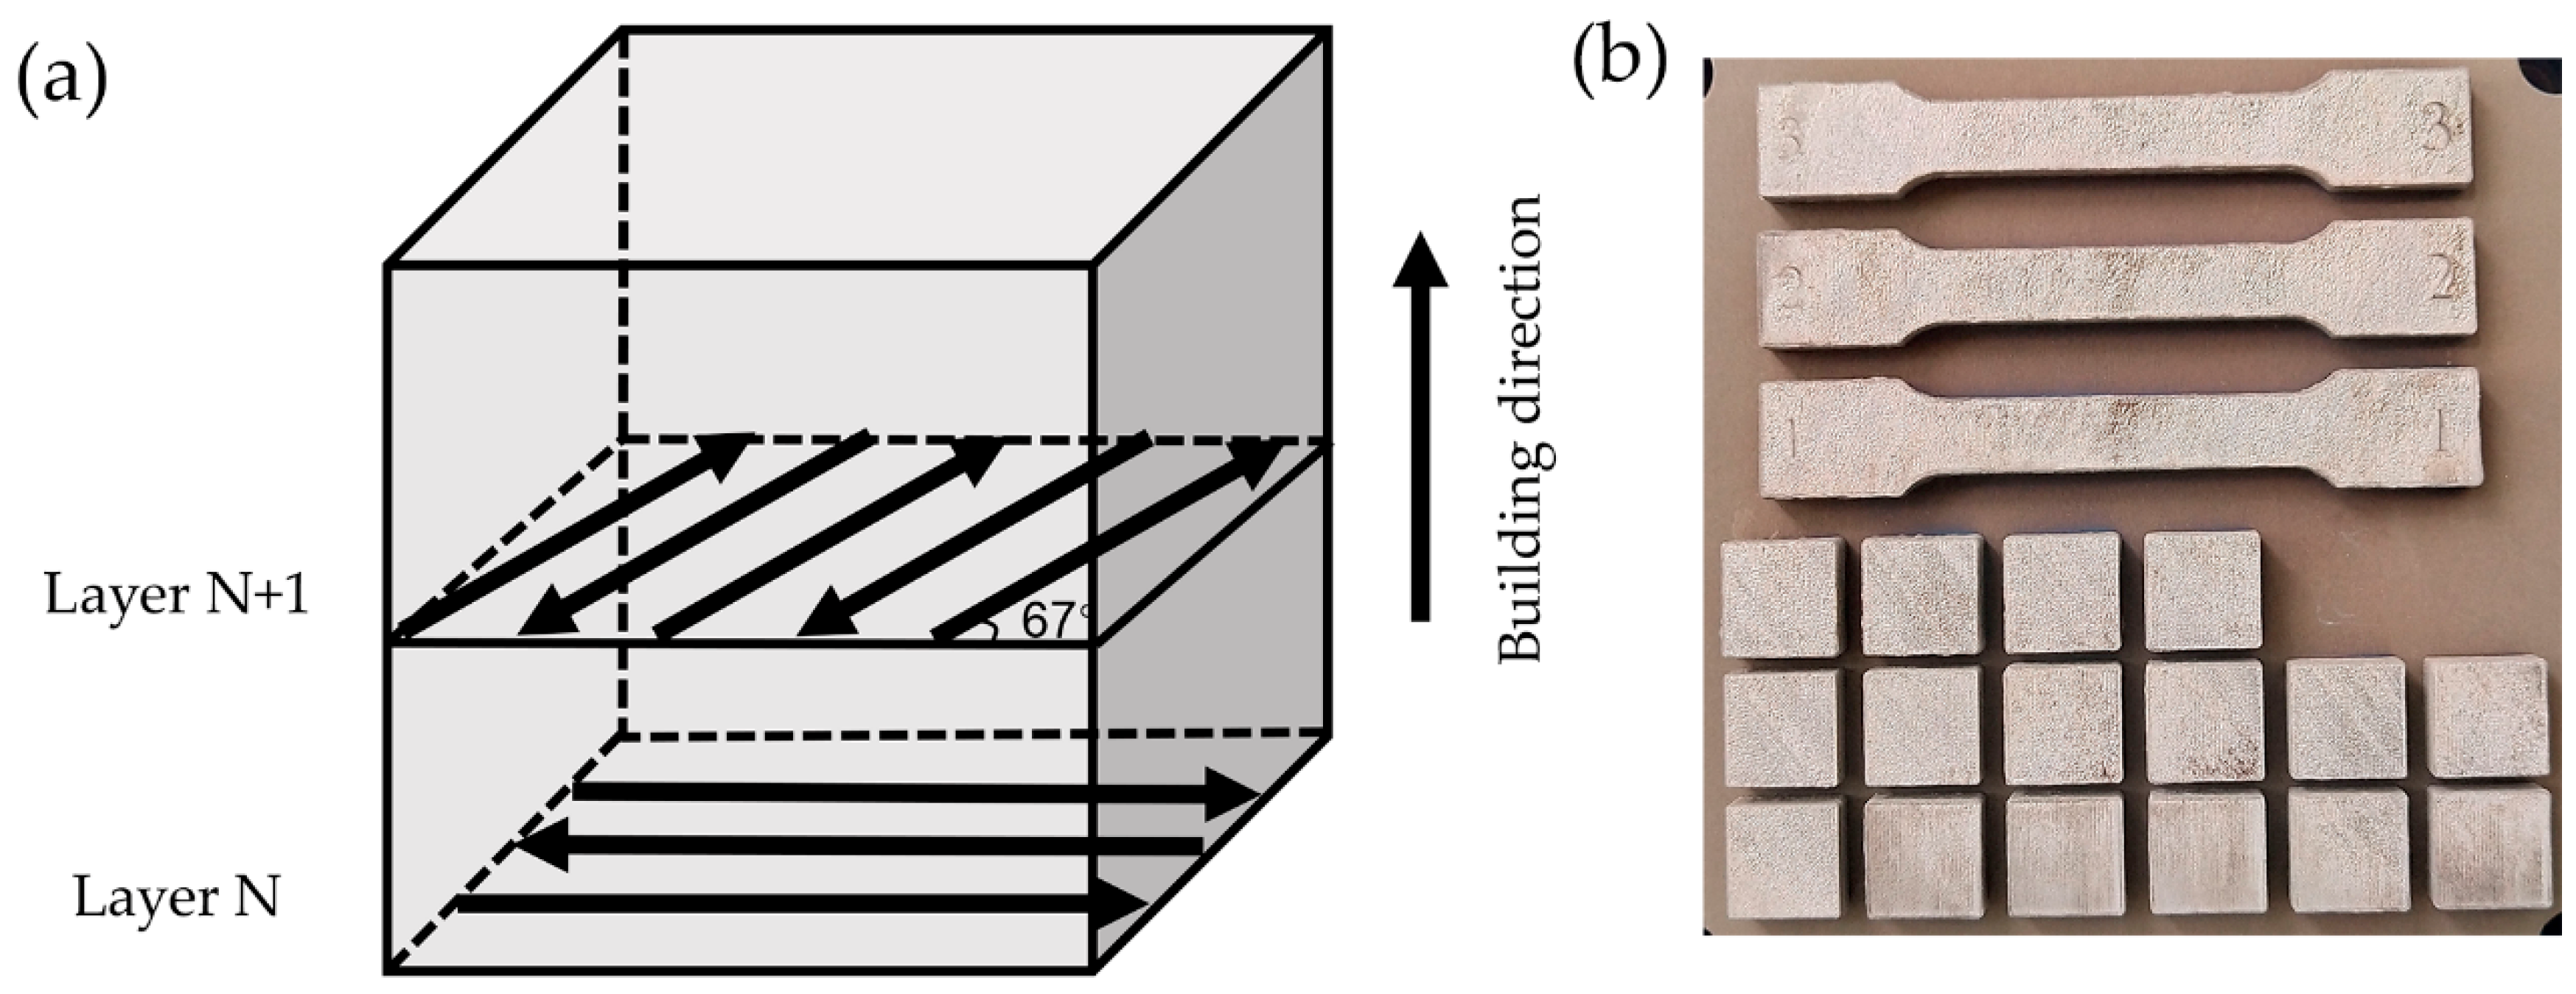
2.1. Experimental Equipment and Preparation

All experiments were carried out with an SLM 280 HL (SLM solutions, Germany), equipped with two 400 W Nd: YAG lasers. Figure 1a depicts the schematic diagram of SLM 280 HL. SLM 280 HL has two kinds of substrates: 250 mm × 250 mm and 100 mm × 100 mm. A small substrate was utilized in this work. During the process of SLM, tungsten heavy alloy powder particles fell from the powder container under gravity, and then the fallen powder particles were evenly spread on the substrate under the action of a powder scraper. The bi-directional movement of the powder scraper was adopted for the sake of enhancing the building efficiency. All samples with a size of 10 mm × 10 mm × 5 mm were prepared on a 304 stainless steel substrate, which was preheated at 150 °C in order to prevent cracking and warping. In the whole SLM process, the chamber was filled with argon in order to avoid oxidation, and the content of oxygen was kept below 400 ppm. Figure 1b illustrates the building process of the SLM tungsten heavy alloy.

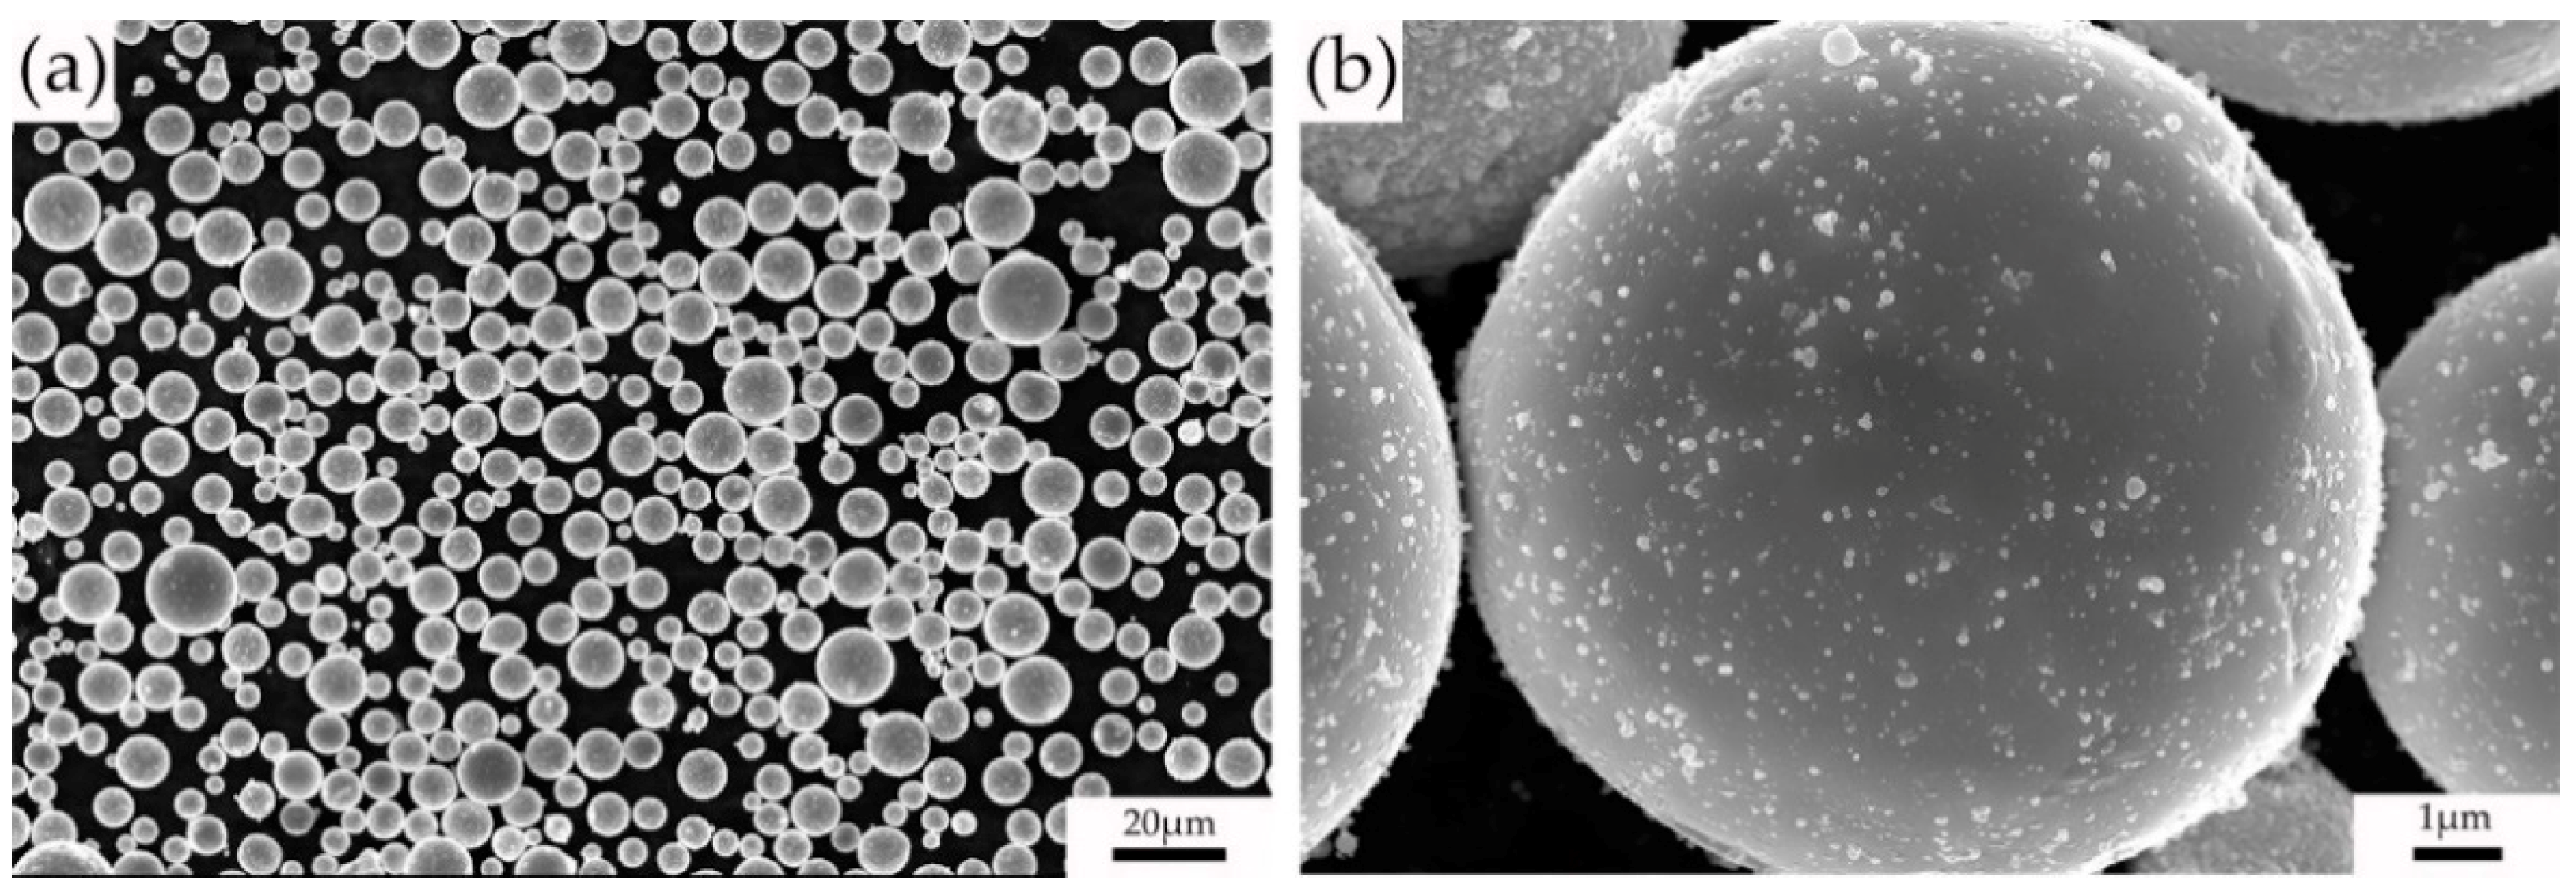
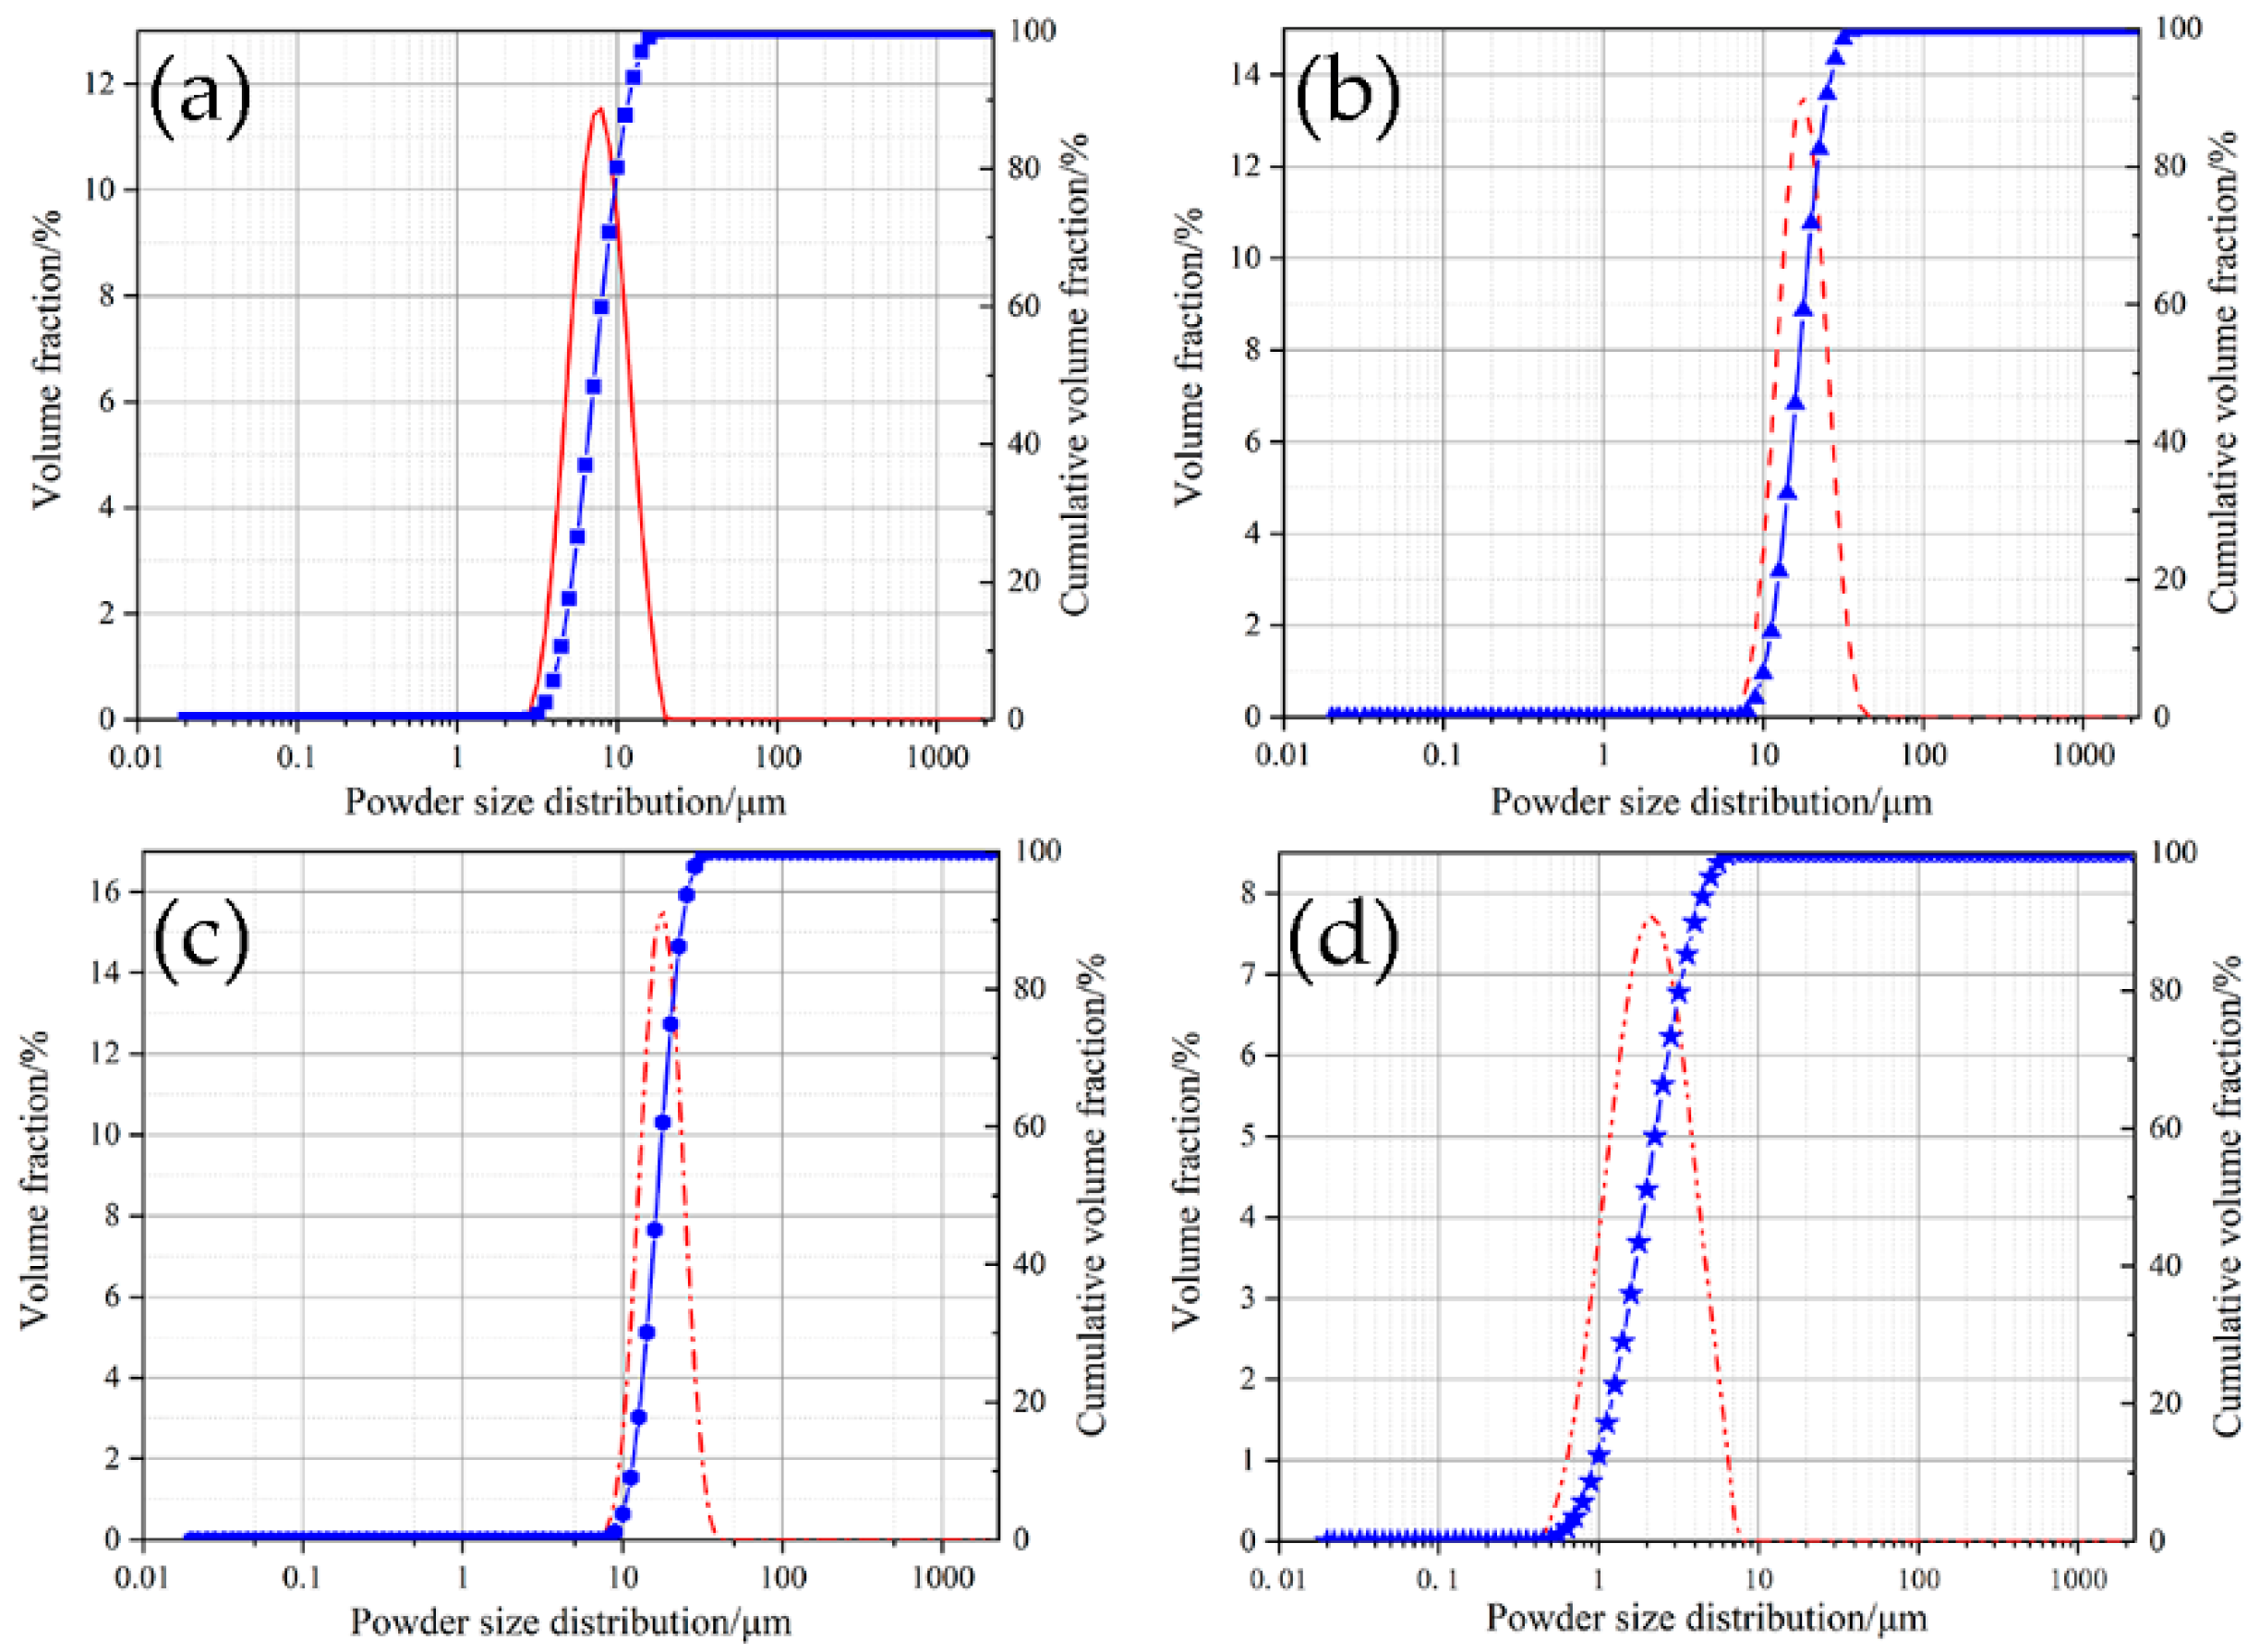
2.2. Powder Material

In this work, four kinds of powders were prepared in the fabrication of the 90W-7Ni-3Fe powder. Figure 2 illustrates the powder size distribution of the different powders used in this work: pure tungsten powder (D10 = 4.425 μm, D50 = 7.211 μm, and D90 = 11.729 μm), Fe–Ni alloy powder (D10 = 11.420 μm, D50 = 16.478 μm, and D90 = 23.620 μm), nickel powder (D10 = 10.794 μm, D50 = 16.492 μm, and D90 = 24.961 μm), and sub-micro nickel powder (D10 = 0.932 μm, D50 = 1.968 μm, and D90 = 4.002 μm). Considering that the powders had different densities, the average particle size of the tungsten powder was smaller than that of the nickel powder and Fe–Ni alloy, so a relatively uniform powder layer distribution could be obtained. Submicron nickel powder was used to adjust the nickel content in the 90W-7Ni-3Fe alloy. Powders were mixed in a general powder mixer (AM300S-H) under an argon atmosphere was used for 0.5 h to obtain 90W-7Ni-3Fe powder. Figure 3 depicts the morphology of the mixed 90W-7Ni-3Fe powder. It can be observed that the shape of the powder particles was not changed and kept good sphericity. Thus, the 90W-7Ni-3Fe powder had good fluidity, and a uniform and suitable a powder layer could be obtained. Furthermore, fine powder particles adhered to larger particles without falling off (Figure 3b), and the adhesion contributed to the powder’s spread and uniformity.

2.3. Process Parameters and Conditions

The process parameters used in this work are listed in Table 1. The parameters included four levels of laser power, scan speed, and hatching distance. The powder layer thickness was kept at 30 μm. Various combinations of process parameters were obtained according to the Taguchi experimental design method (Table 2). The scan strategy used in this experiment and building direction is illustrated in Figure 4a. The scan strategy was rotated by 67° between adjacent layers in order to reduce residual stress during the process of SLM. The 90W-7Ni-3Fe alloy samples with dimensions of 10 mm × 10 mm × 5 mm were prepared (Figure 4b). Based on consideration of the combined effect of the process parameters, the volumetric energy density (VED) is as follows:
V E D = L P S S × H D × L T ,
where L P is laser power, S S is scan speed, H D is hatching distance, and L T is layer thickness.

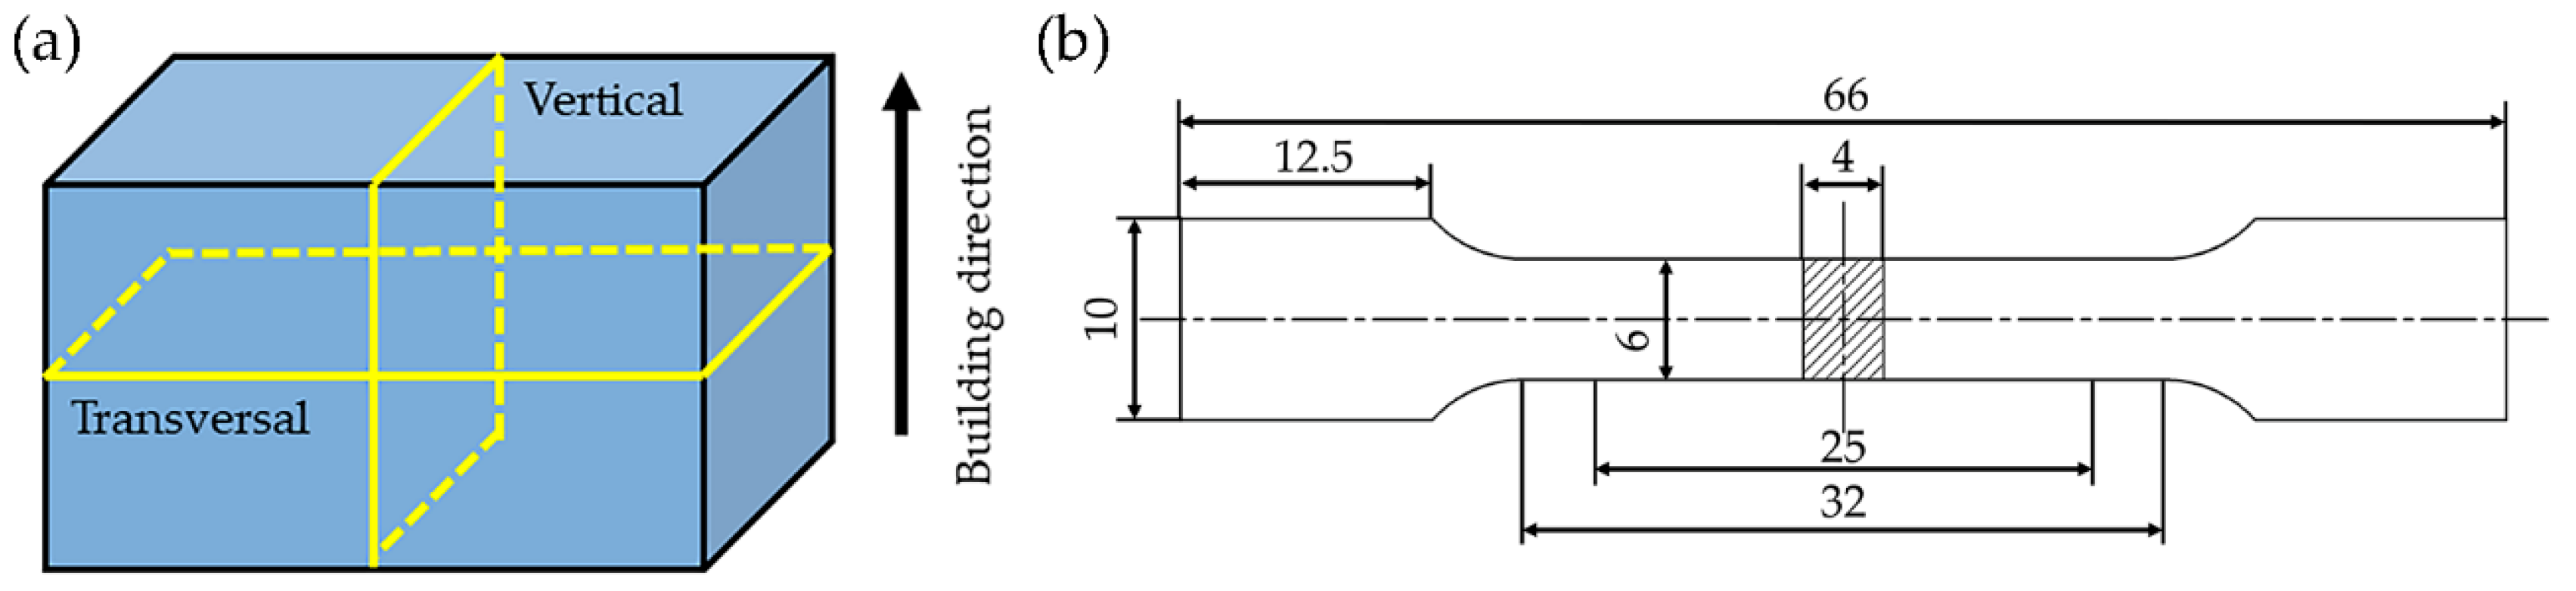
2.4. Characterization and Test

All the samples were removed from the substrate by wire electrical discharge machining (WEDM). Then, the samples were cleaned with an ultrasonic cleaning machine and dried. After that, the dried samples were ground gradually with sandpaper of different grits, 280#, 400#, 600#, 800#, 1000#, 1200#, 1500# and 2000#. Subsequently, the samples were polished using a diamond suspension of 2.5 and 0.5.
In this work, the theoretical density ρ T of 90W-7Ni-3Fe can be calculated as [26]
100 ρ T = W i ρ i ,
where W i and ρ i are the mass fraction and the theoretical density of the i th alloy element, respectively. The theoretical density of W, Ni, and Fe are 19.3 g/cm3, 8.9 g/cm3, and 7.9 g/cm3, respectively [27].
According to the Archimedes method, the actual density can be calculated as follows:
ρ a = M 0 M 2 M 1 × ρ 0 ,
where M 0 is the mass of sample in the air, M 1 and M 2 are the indications of the balance before and after the sample is placed in the beaker containing water, and ρ 0 is the density of water.
Relative density ρ R D is calculated as follows:
ρ RD = ρ a ρ T × 100 % ,
The transverse and vertical morphology of the samples (Figure 5a) were observed under an optical microscope (OM, Nikon MA 200) in order to analyze the defects’ characteristics and distribution. The transverse section of the sample was etched with a mixture solution of 10 g KOH: 10 g K3 [Fe(CN)6]:100 mL H2O to ensure a clear microstructure. The microstructure was also characterized by an optical microscope (OM, Nikon MA 200). For a better analysis of the microstructure, a scanning electron microscope (SEM, S-4800, Hitachi, Tokyo, Japan) was used, and an energy-dispersive spectrometer (EDS) was adopted for analysis of the element distribution. The phase composition of the sample was tested by an X-ray diffractometer (XRD, Advanced D8, Bruker, Billerica, MA, USA) with a Cu Kα radiation at 40 KV and 40 mA in a 2θ range of 30°–90° by using a step size of 0.02°. Tensile property tests were performed at room temperature using an Instron550R at a constant tensile rate of 1 mm/min. The tensile specimen is illustrated in Figure 5b. The microhardness of the transverse morphology was measured by using a digital microhardness measurement system (MH5) with a load of 0.3 kg and a dwell time of 15 s. Five points were taken at an interval of 0.5 mm along the building direction for all selected samples fabricated under different VEDs.

3. Results and Discussion

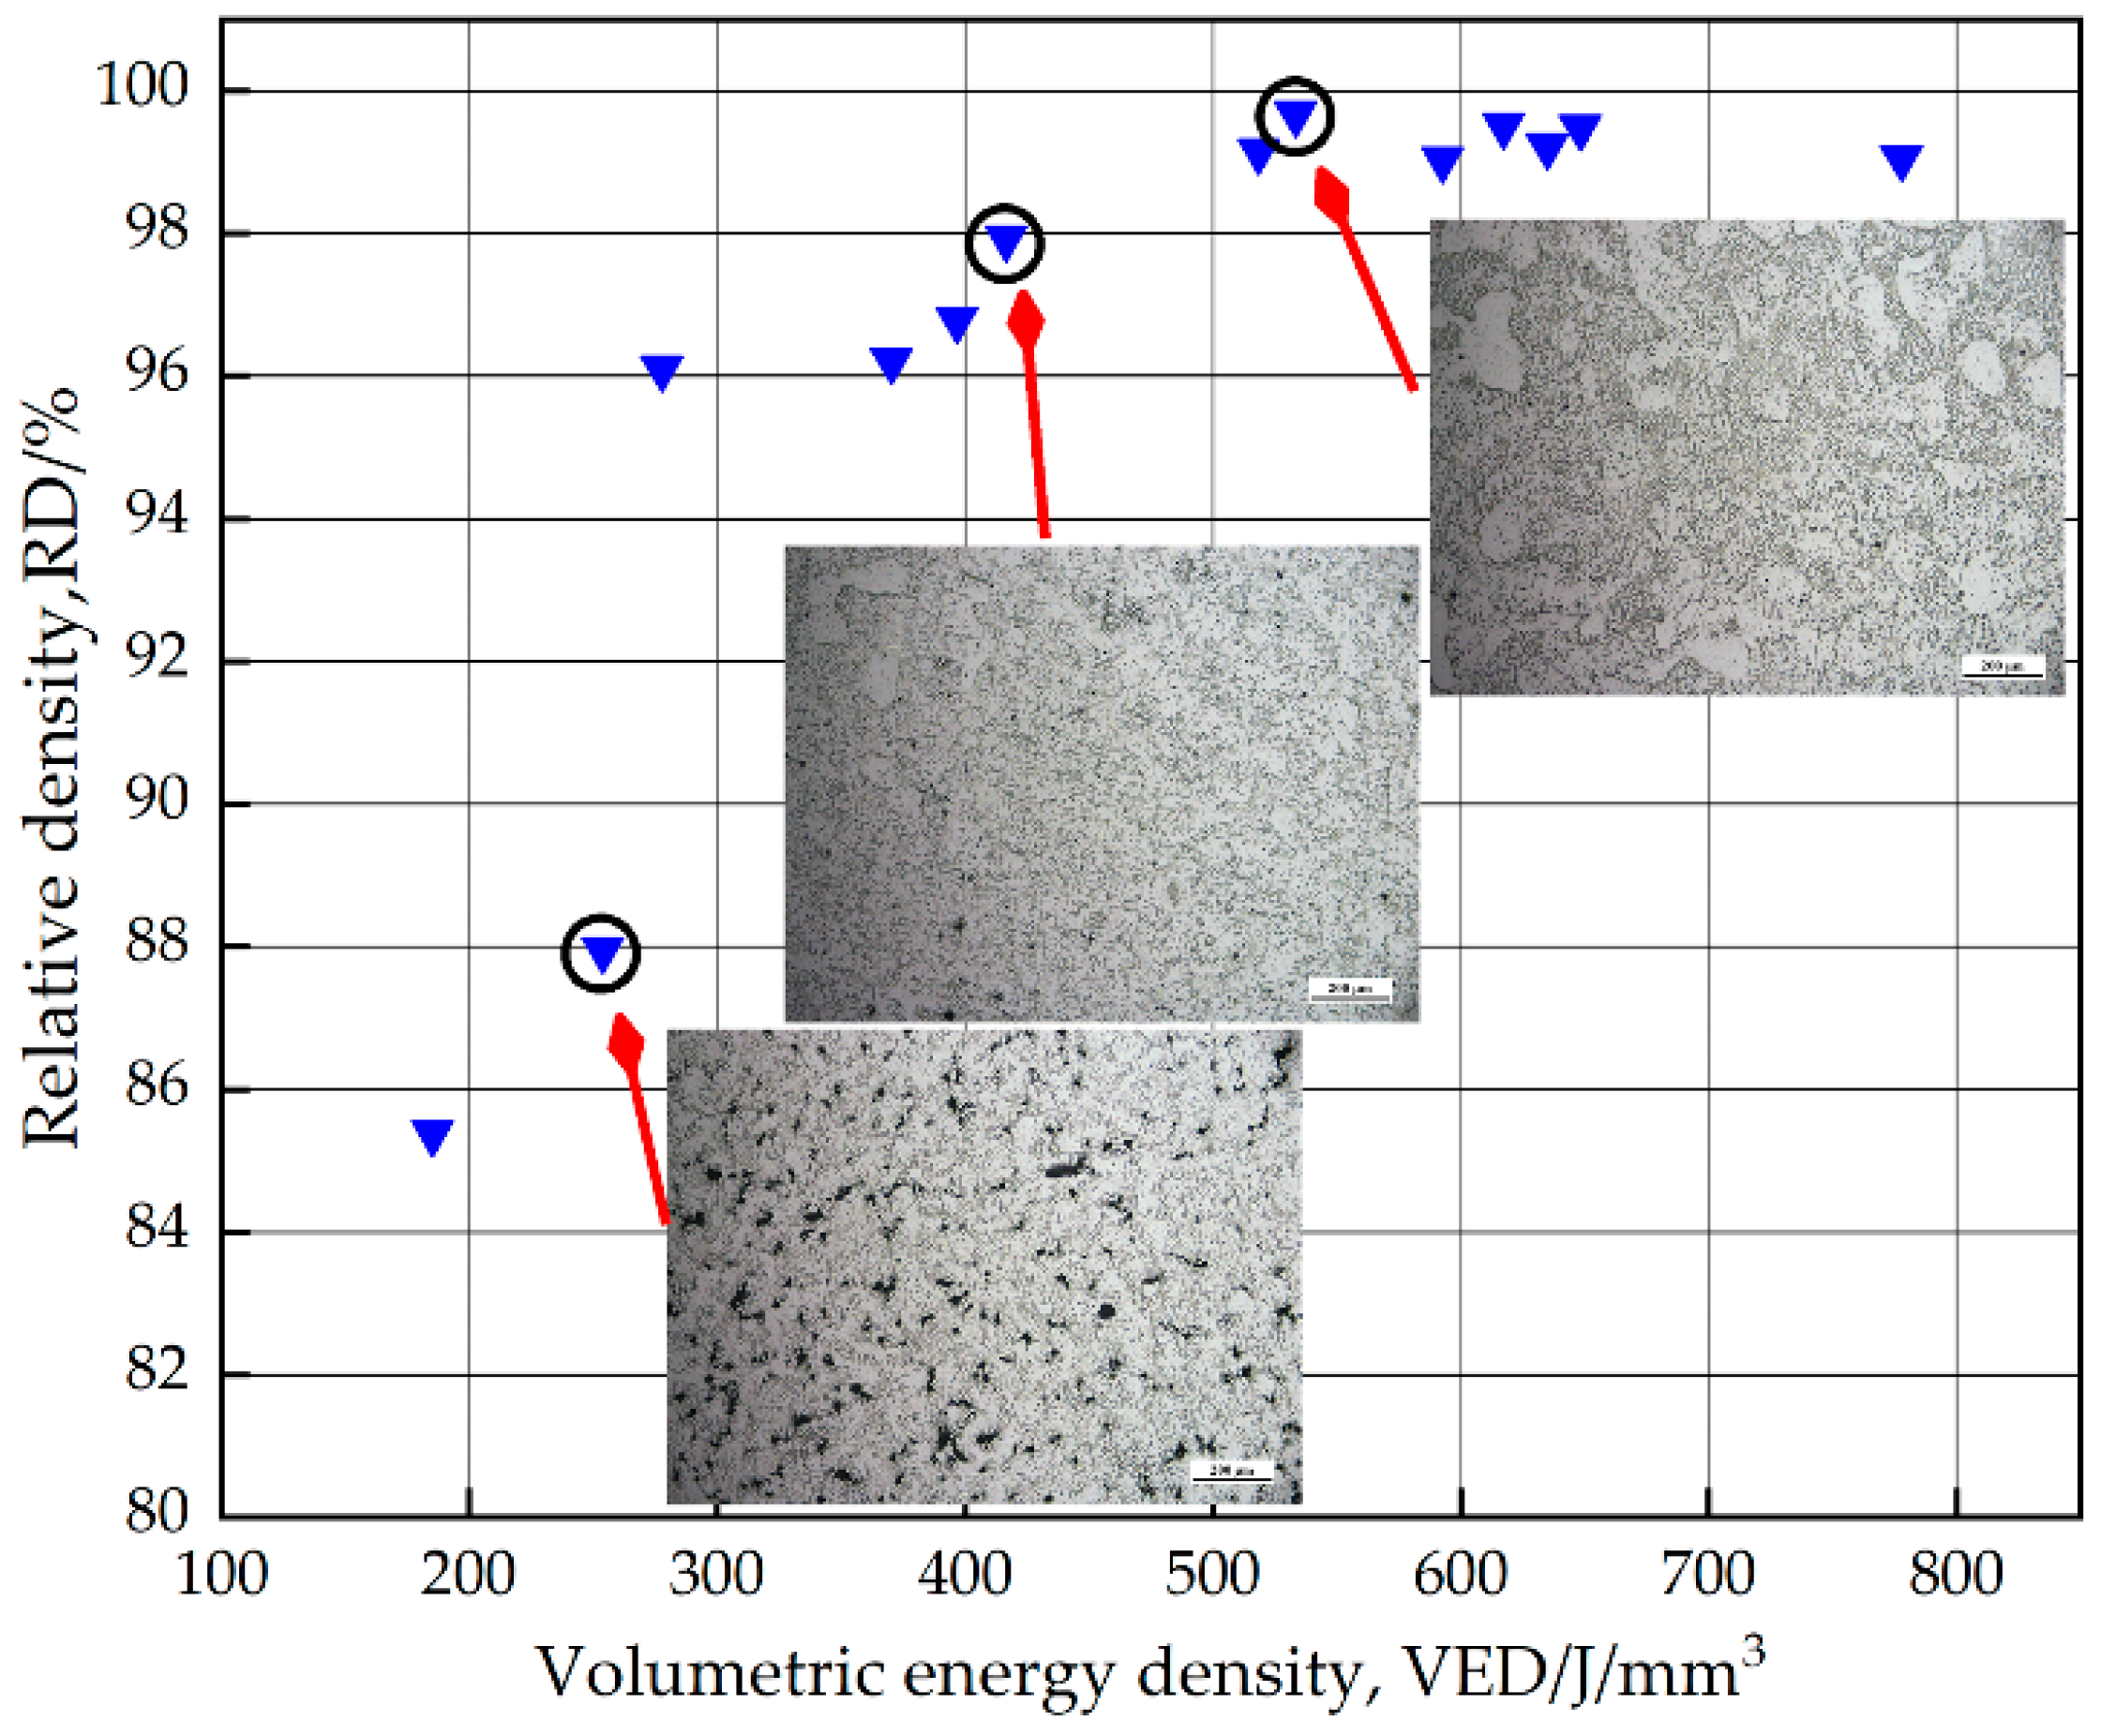
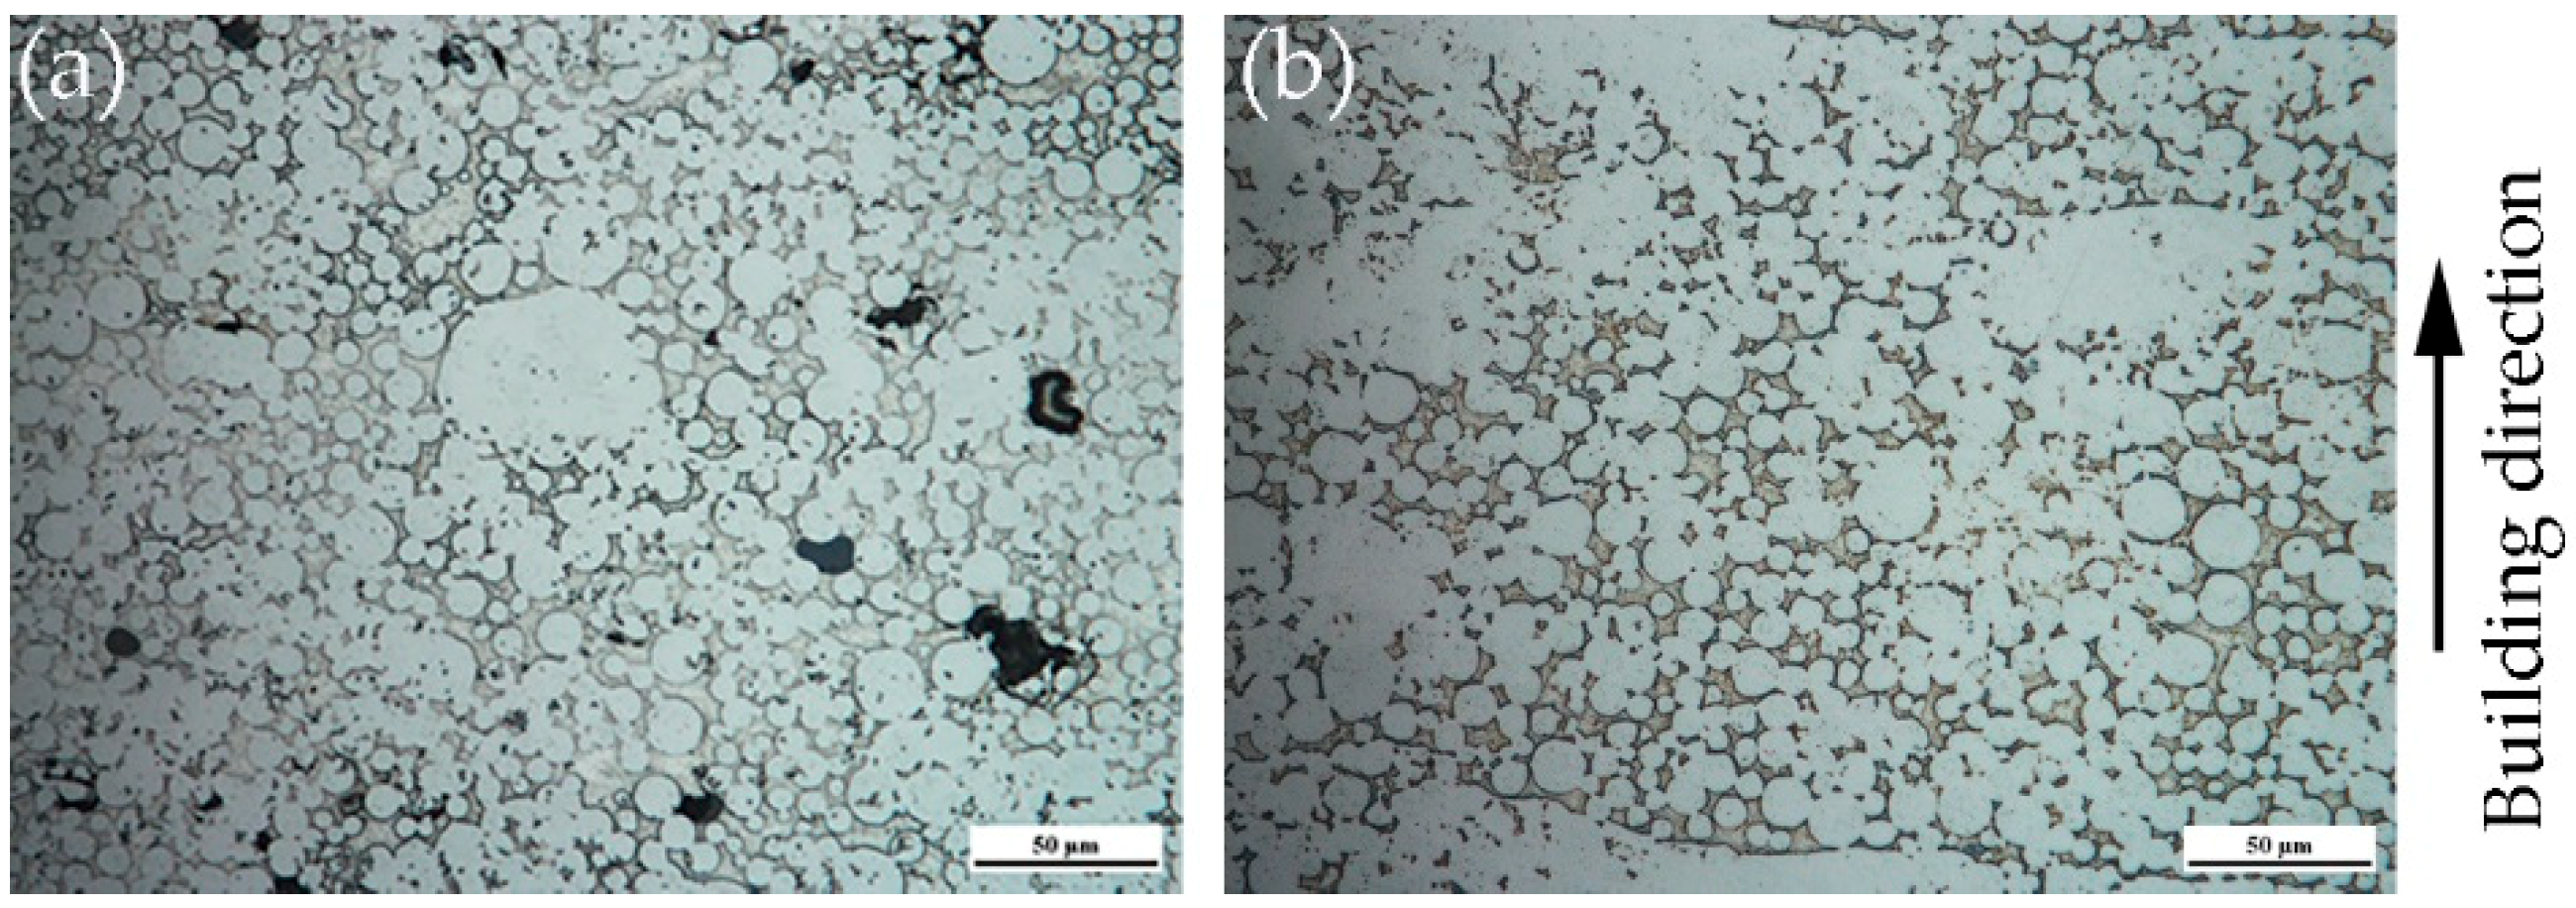
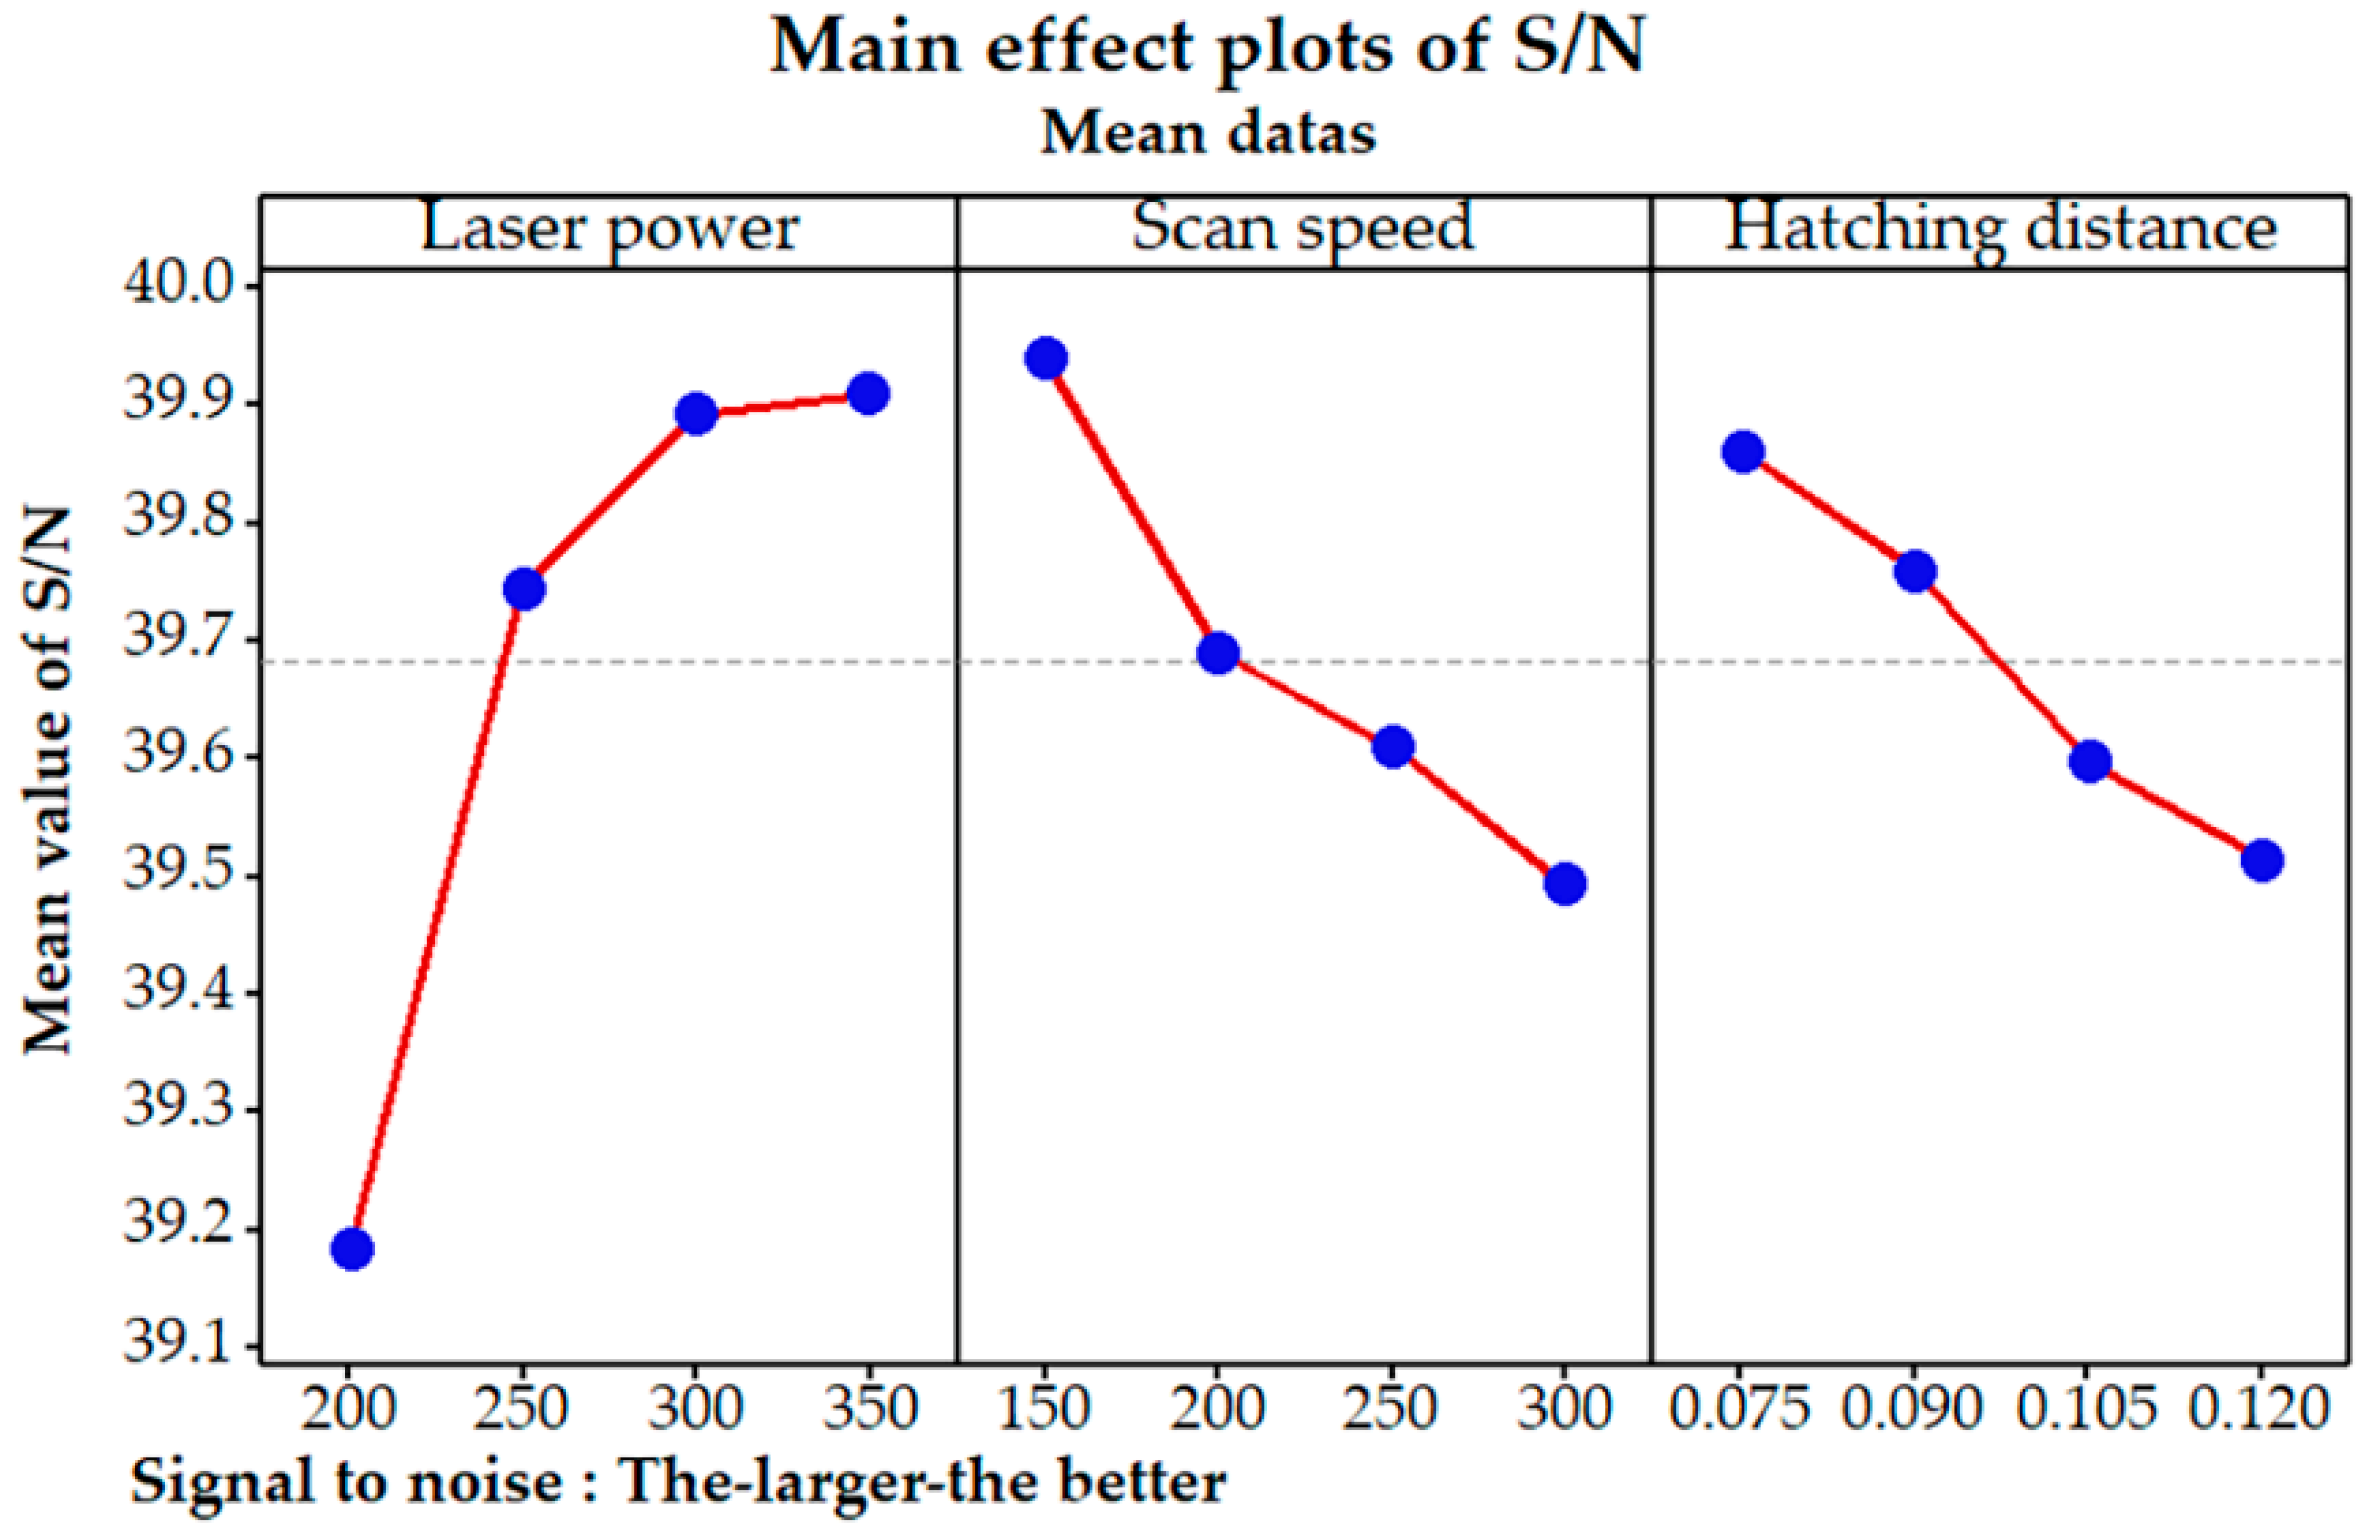
3.1. Densification Analysis

Being porosity-free is of importance to the mechanical properties of the final products. Thus, it is necessary to investigate the effects of the process parameters on the formation of defects in order to obtain high relative density parts. In this section, the relationships between the relative density and process parameters are analyzed. Figure 6 shows the variation of the relative density with different volumetric energy densities. With an increase of VED, the relative density first became higher and tended to be stable. The relative density of the final samples fabricated in this work can were nearly 100% free from cracks. Figure 7 depicts the actual transverse morphology of the samples obtained under different VEDs. With an increase in the value of the VED, the number of defects in the samples gradually decreased. When the input of the VED was insufficient, the low-melting-point metals (Ni/Fe) were melted, and the liquid phase was formed. The un-melted tungsten particle gaps were filled with the liquid phase. However, a low VED indicated a combination of a low laser power (200 W) and a high scan speed (300 mm/s). This result implies that the residence time of the formed liquid phase was too short to fully fill the gaps, so irregular defects were formed, as shown in Figure 8a. Poor densification was caused by inadequate liquid phase content or a short residence time under the processing conditions. Figure 8b presents the high-magnification transverse morphology of the samples fabricated with a high VED. Nearly full densification could be obtained under the process parameters.
The pores were nearly fully filled with the formed liquid phase. A combination of high laser power (350 W) and low scan speed (150 mm/s) produced a longer residence time for the liquid phase. Therefore, the best rearrangement characteristics for the tungsten powder particles were observed under the capillary force of liquid, and the densification of samples was improved. When the laser power was 350 W, the viscosity of the formed molten pool decreased, and partial tungsten powder particles could be melted. In this way, an adequate liquid phase and better fluidity for the molten pool were obtained, and the densification process of the samples could be completed.
It can also be seen that under the same VED, there are different relative densities corresponding to distinct transverse morphologies, as shown in Figure 9. This phenomenon could be ascribed to the varying process parameter combinations and similar results of other materials that have been reported [28,29]. Here, the signal-to-noise (S/N) ratio of Taguchi’s method was used to compare the effect of every process parameter on the relative density, which means the sensitivity of the relative density to the selected process parameters. In general, the signal-to-noise ratio in Taguchi’s method can be classified into three categories: “lower is better”, “nominal is best”, and “higher is better”. In this study, the highest relative density for the sample was expected. Thus, the “higher is better” category was adopted, which can be calculated as follows [30]:
S N = 10 log ( 1 n 1 n 1 y i 2 ) ,
where n is the number of experiments and y i is the tested data of relative density for the i th sample.
With the tested data for the relative density under different combinations of process parameters, the calculated results for the S/N ratios are presented in Figure 10 and Table 3. It can be seen that the laser power was identified as the most important factor influencing the final relative density of the samples. The scan speed had a relatively insignificant effect on relative density, and the hatching distance showed the least significant effects among all the selected process parameters. Therefore, the sensitivity of the relative density to the three process parameters decreased according to the following order: laser power > scan speed > hatching distance. This result is consistent with previous results and could be ascribed to the special thermophysical properties of tungsten and tungsten heavy alloys [31].
In this section, the nearly full densification of the 90W-7Ni-3Fe sample fabricated by SLM was realized. The densification behaviors under different process parameters were analyzed and discussed. Laser power is a dominant factor in the SLM process of the 90W-7Ni-3Fe samples. For the 90W-7Ni-3Fe sample with a high relative density in SLM, a higher laser power (≥250 W) was preferred, and the value of volumetric energy density had to be no less than 300 J/mm3. The morphology of the 90W-7Ni-3Fe sample presented similar sintering, characteristic in traditional powder metallurgy [32]. The microstructure is mainly composed of a refractory tungsten particle skeleton and a liquid phase formed by low-melting-point metals (Ni/Fe).

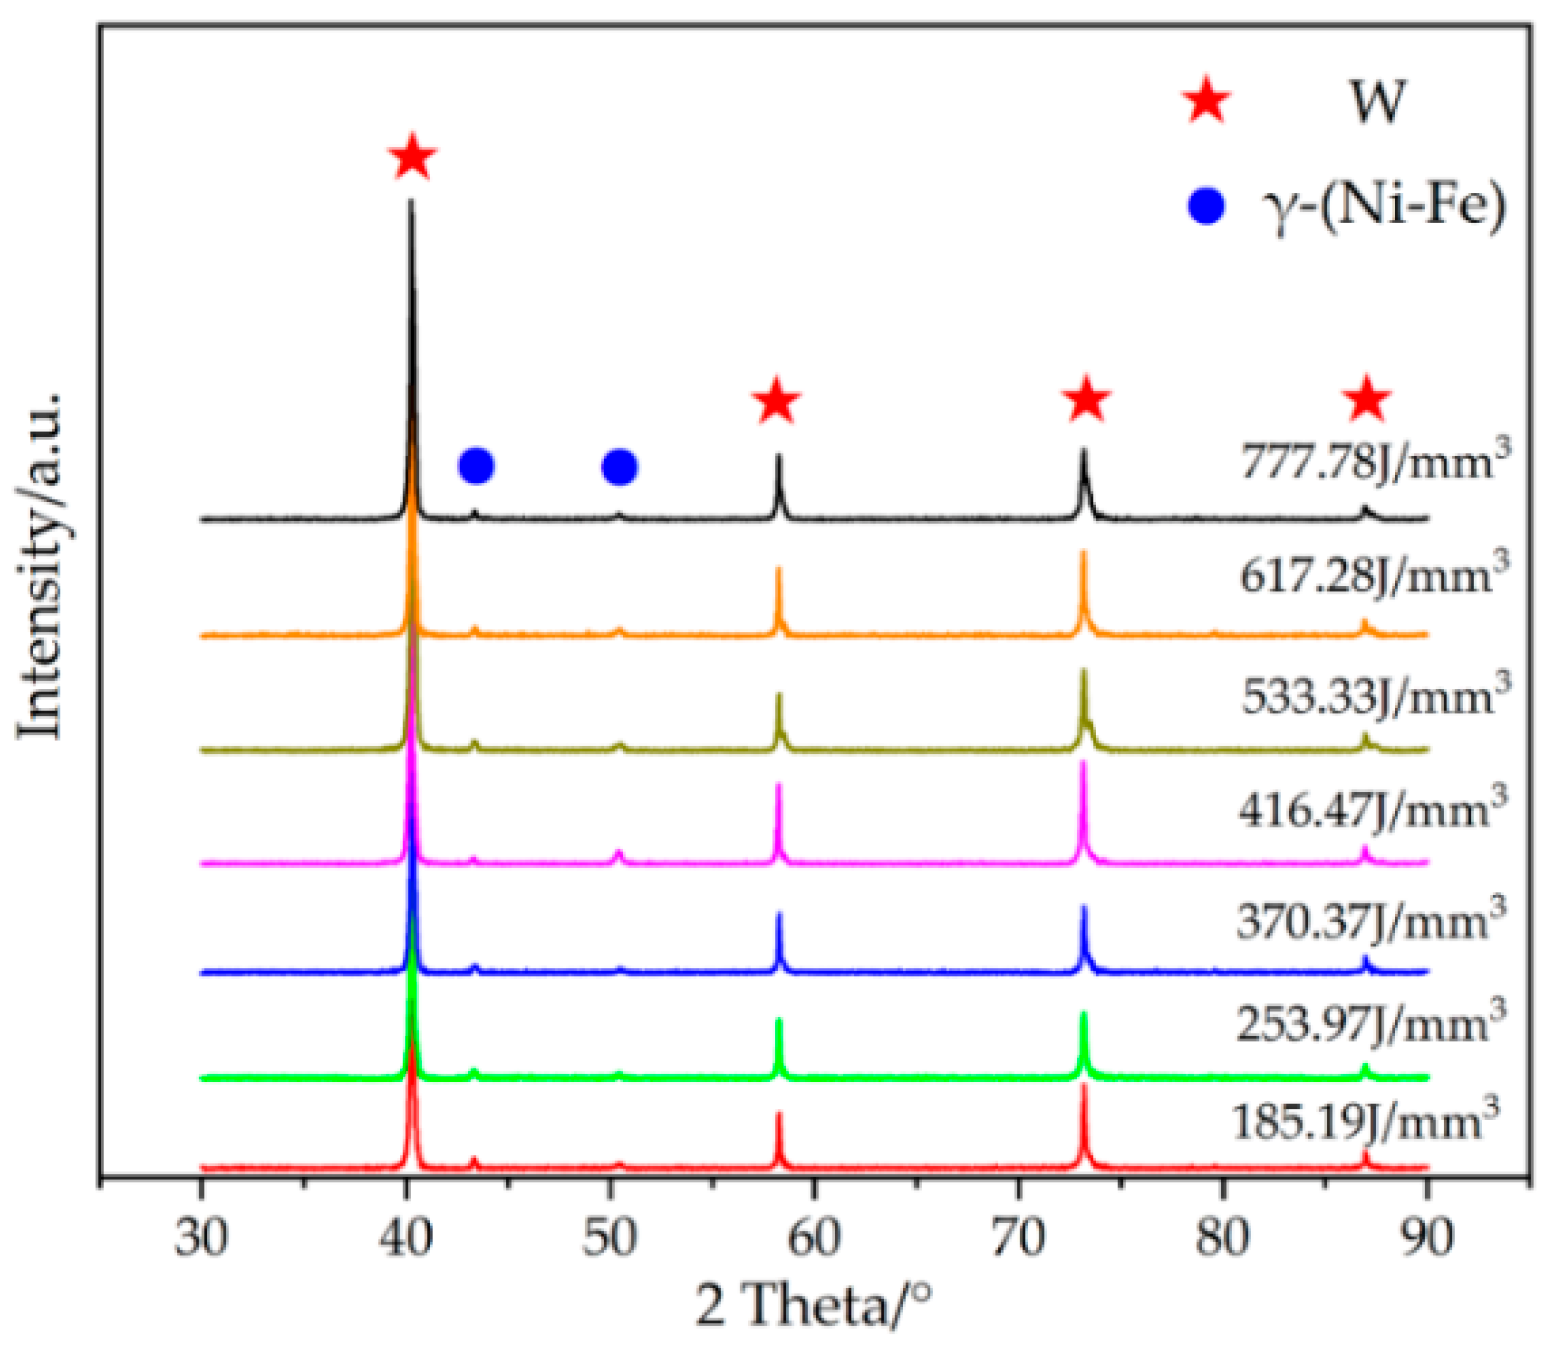
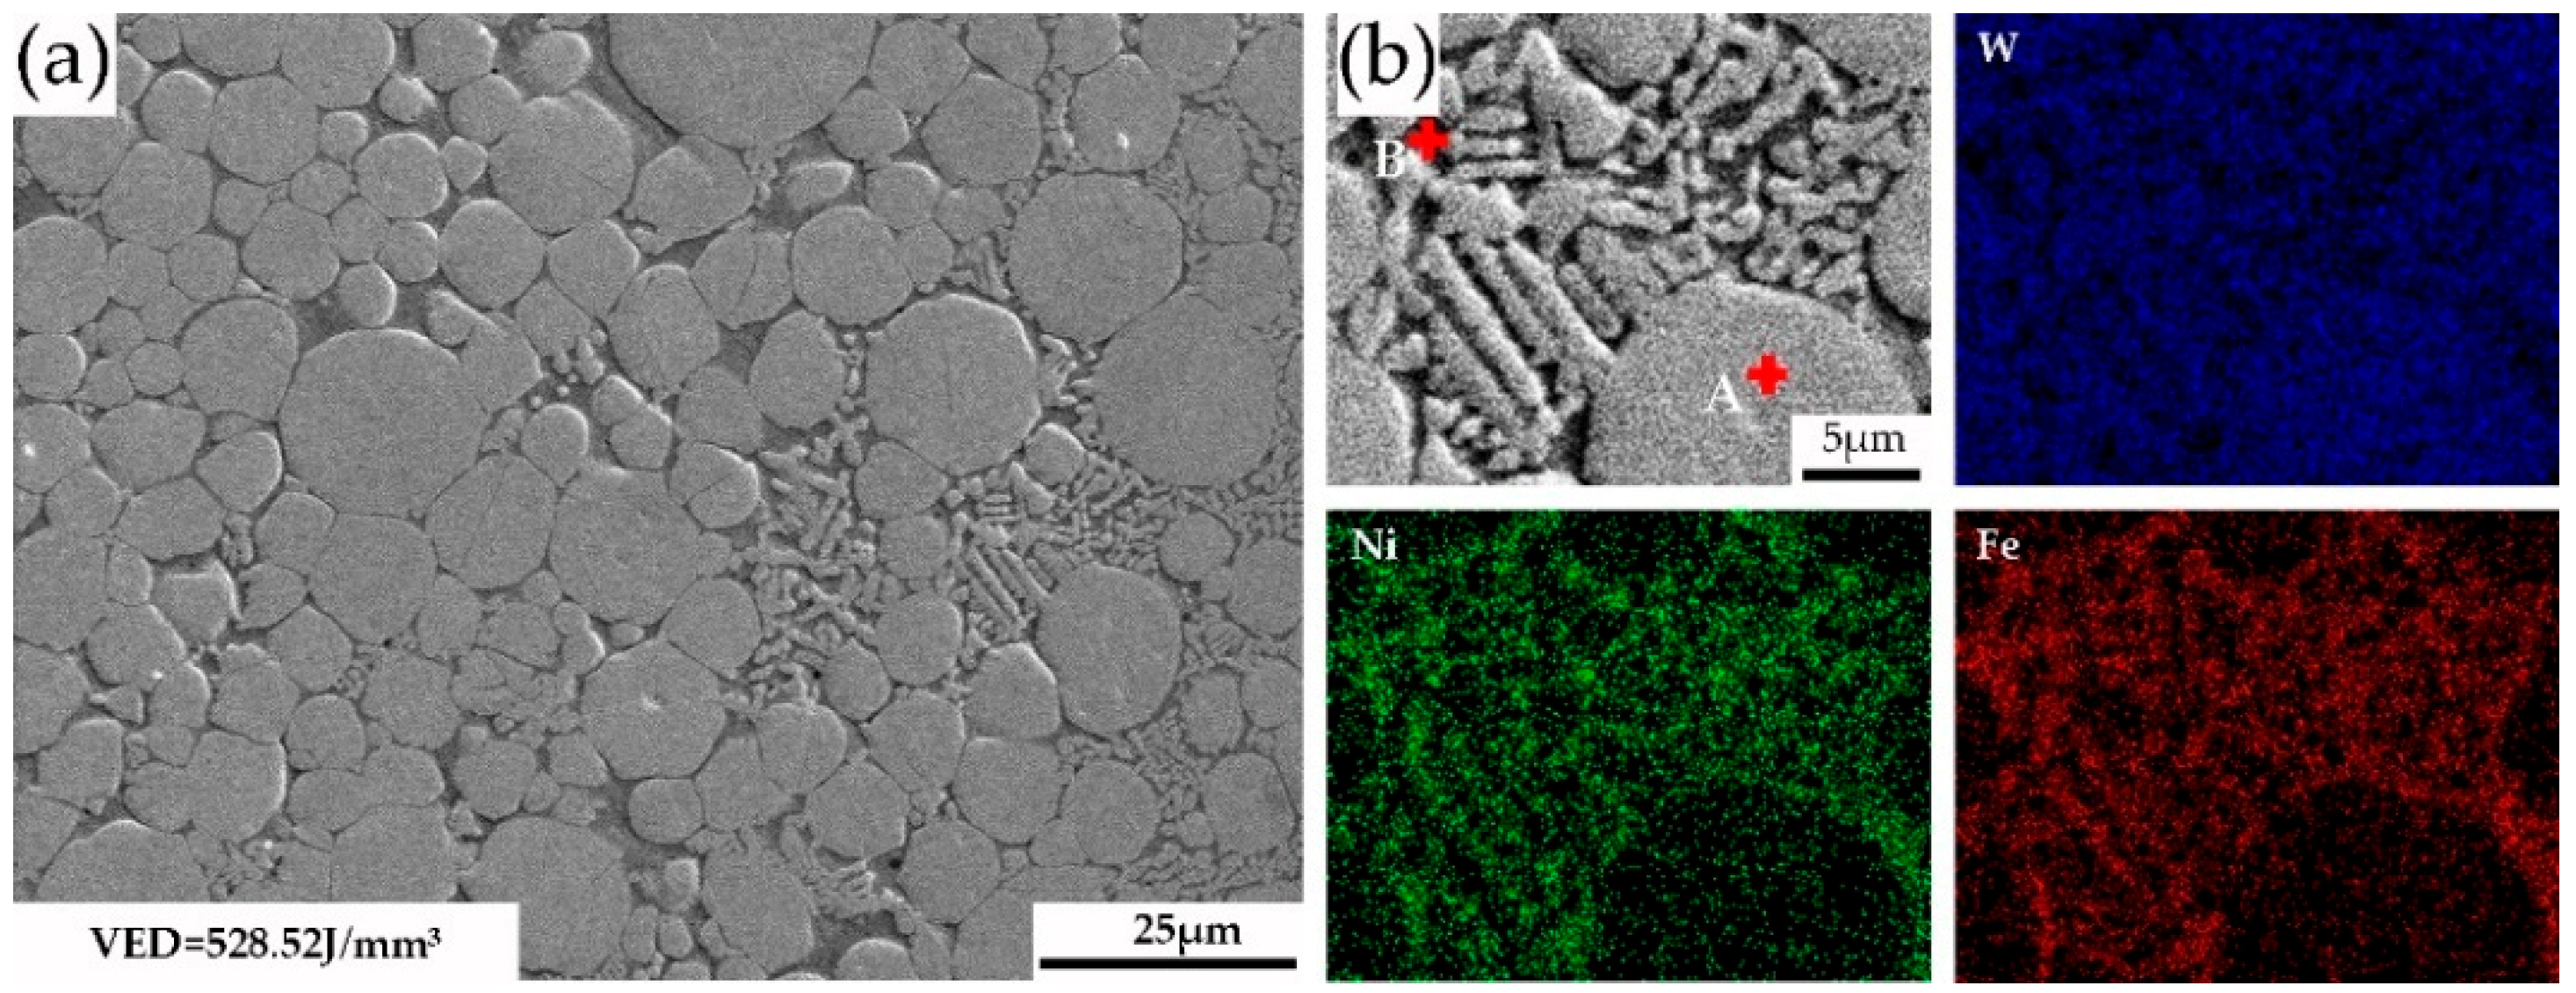
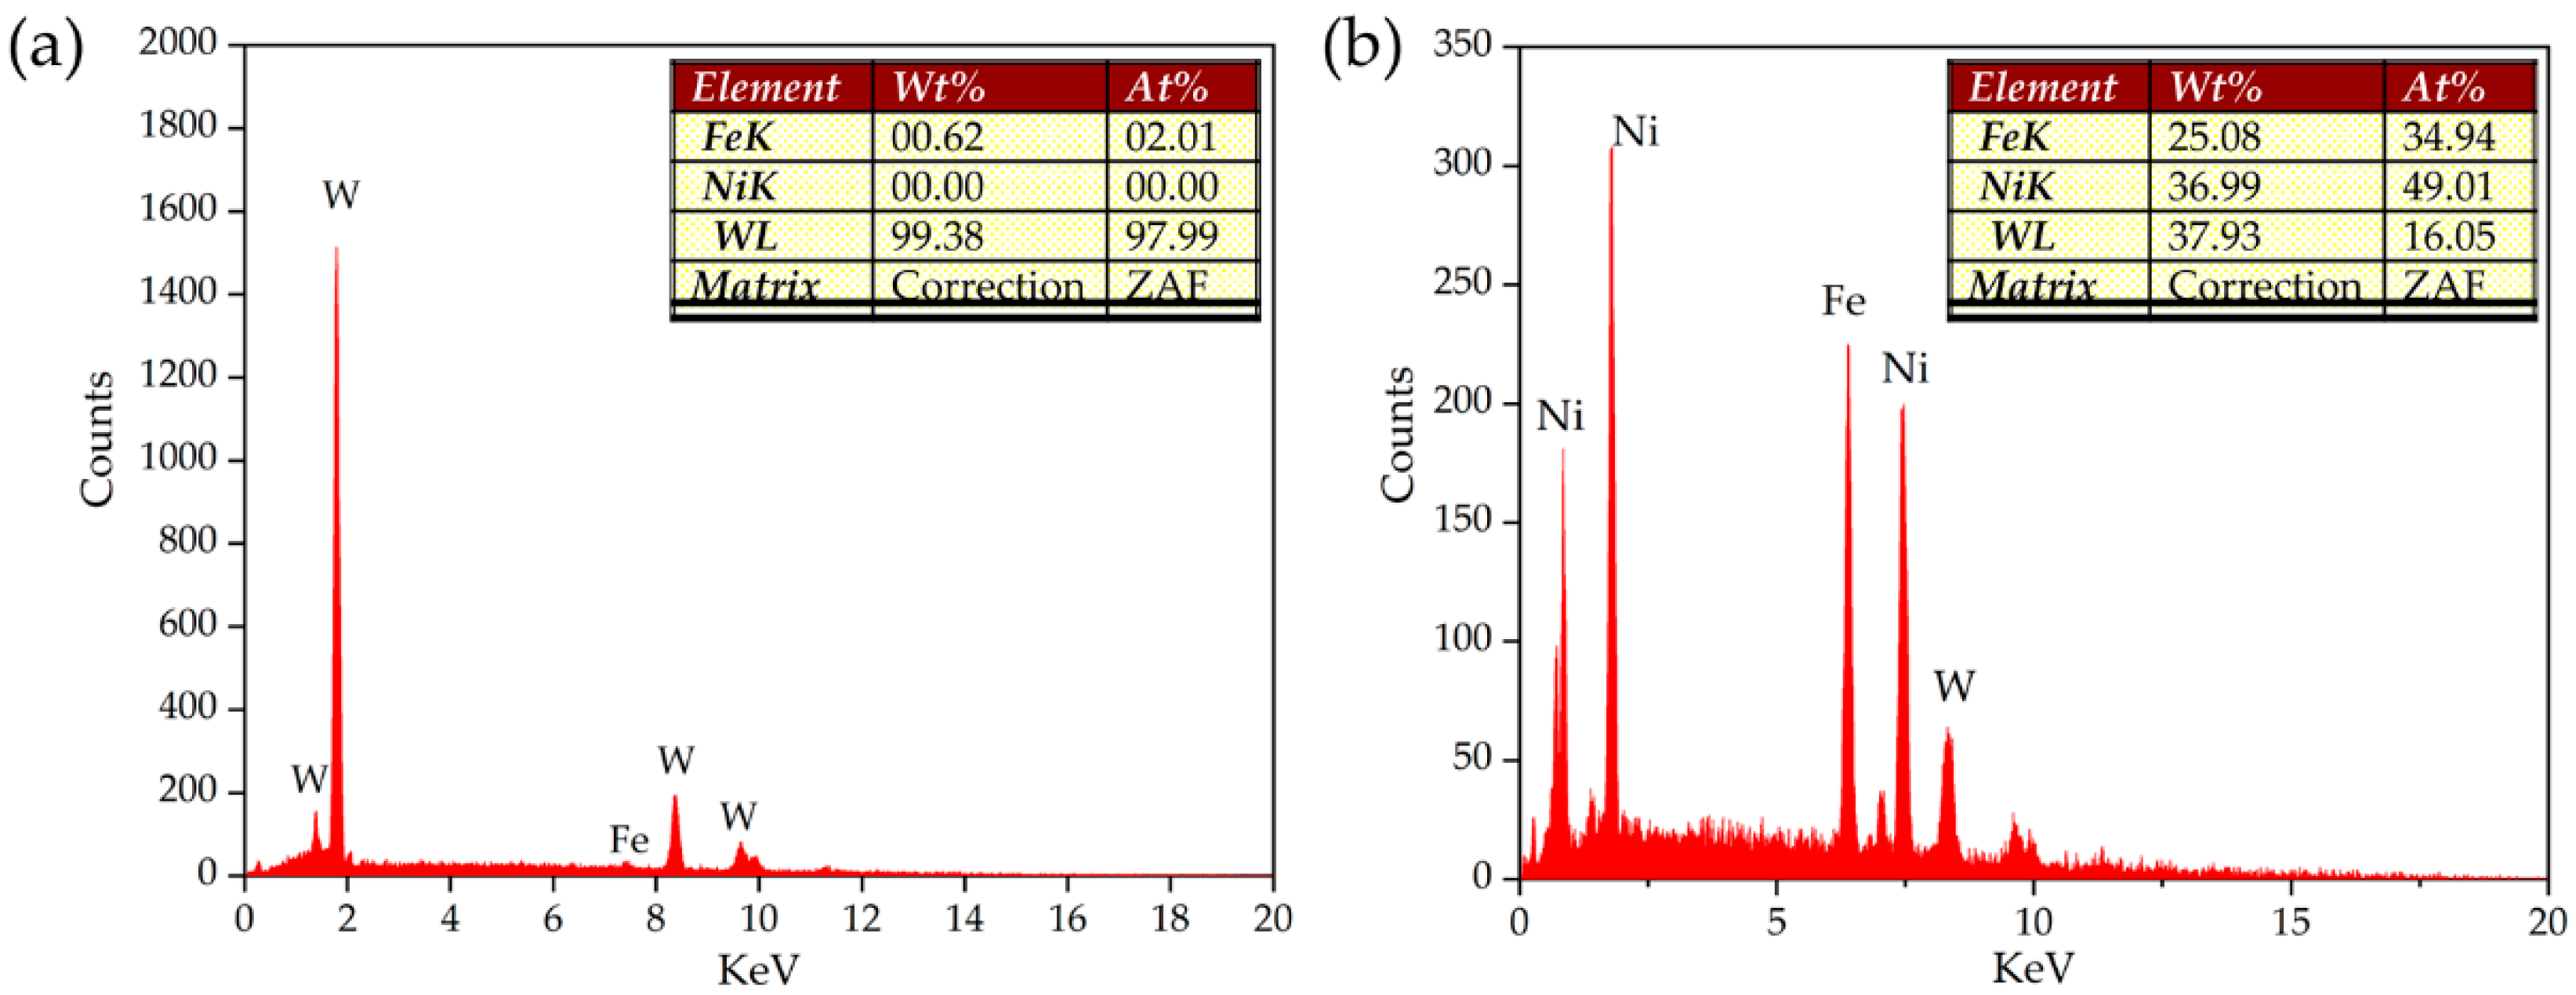
3.2. Phase Identification and Microstructure

The XRD patterns of the 90W-7Ni-3Fe samples processed using different volumetric energy densities are shown in Figure 11. The main phases of the 90W-7Ni-3Fe samples fabricated by SLM were W and Ni-Fe solid solution phases, although the volumetric energy density varied from 185.19 J/mm3 to 777.78 J/mm3. There seems to have been no significant difference in the phase composition among the samples obtained under different volumetric energy densities. This means that low-melting-point metals (Ni/Fe) still melted, even under low volumetric energy densities.
Figure 12a shows the typical SEM morphology of the 90W-7Ni-3Fe sample fabricated by SLM. Many tungsten particles were distributed in the matrix. The gaps between the tungsten particles were filled with liquid phases formed by low-melting-point metals (Ni/Fe). In addition, partial tungsten particles were contacted under the driving force of the liquid phase during the processes of melting and solidification. Fine tungsten grains can also be found in Figure 12a. The microstructural region can be divided into three main regions: the W particle phase, the fine W dendrite region, and the Ni–Fe matrix region with dissolved W. Scanning electron microscope (SEM) and energy-dispersive spectrometer (EDS) analyses were performed in order to further observe the microstructural constitution and confirm whether the tungsten element had been dissolved into the matrix. EDS analysis results (Figure 12b and Figure 13a) confirmed that the particles were nearly composed of 100% W with little Ni and Fe. EDS analysis results of the Ni–Fe matrix indicated that partial tungsten had been dissolved into the matrix (Figure 13b). This phenomenon could be ascribed to the different solubilities of W, Ni, and Fe in W-Ni-Fe systems. Tungsten has a high solubility in the Ni/Fe matrix, but the solubility of Ni and Fe in tungsten is practically negligible. Moreover, fine W dendrites formed in the matrix when W particles were partially melted and W particles acted as heterogenous nucleation sites. Similar tungsten dendrites were also observed in the WHA samples fabricated by SLM [33,34].

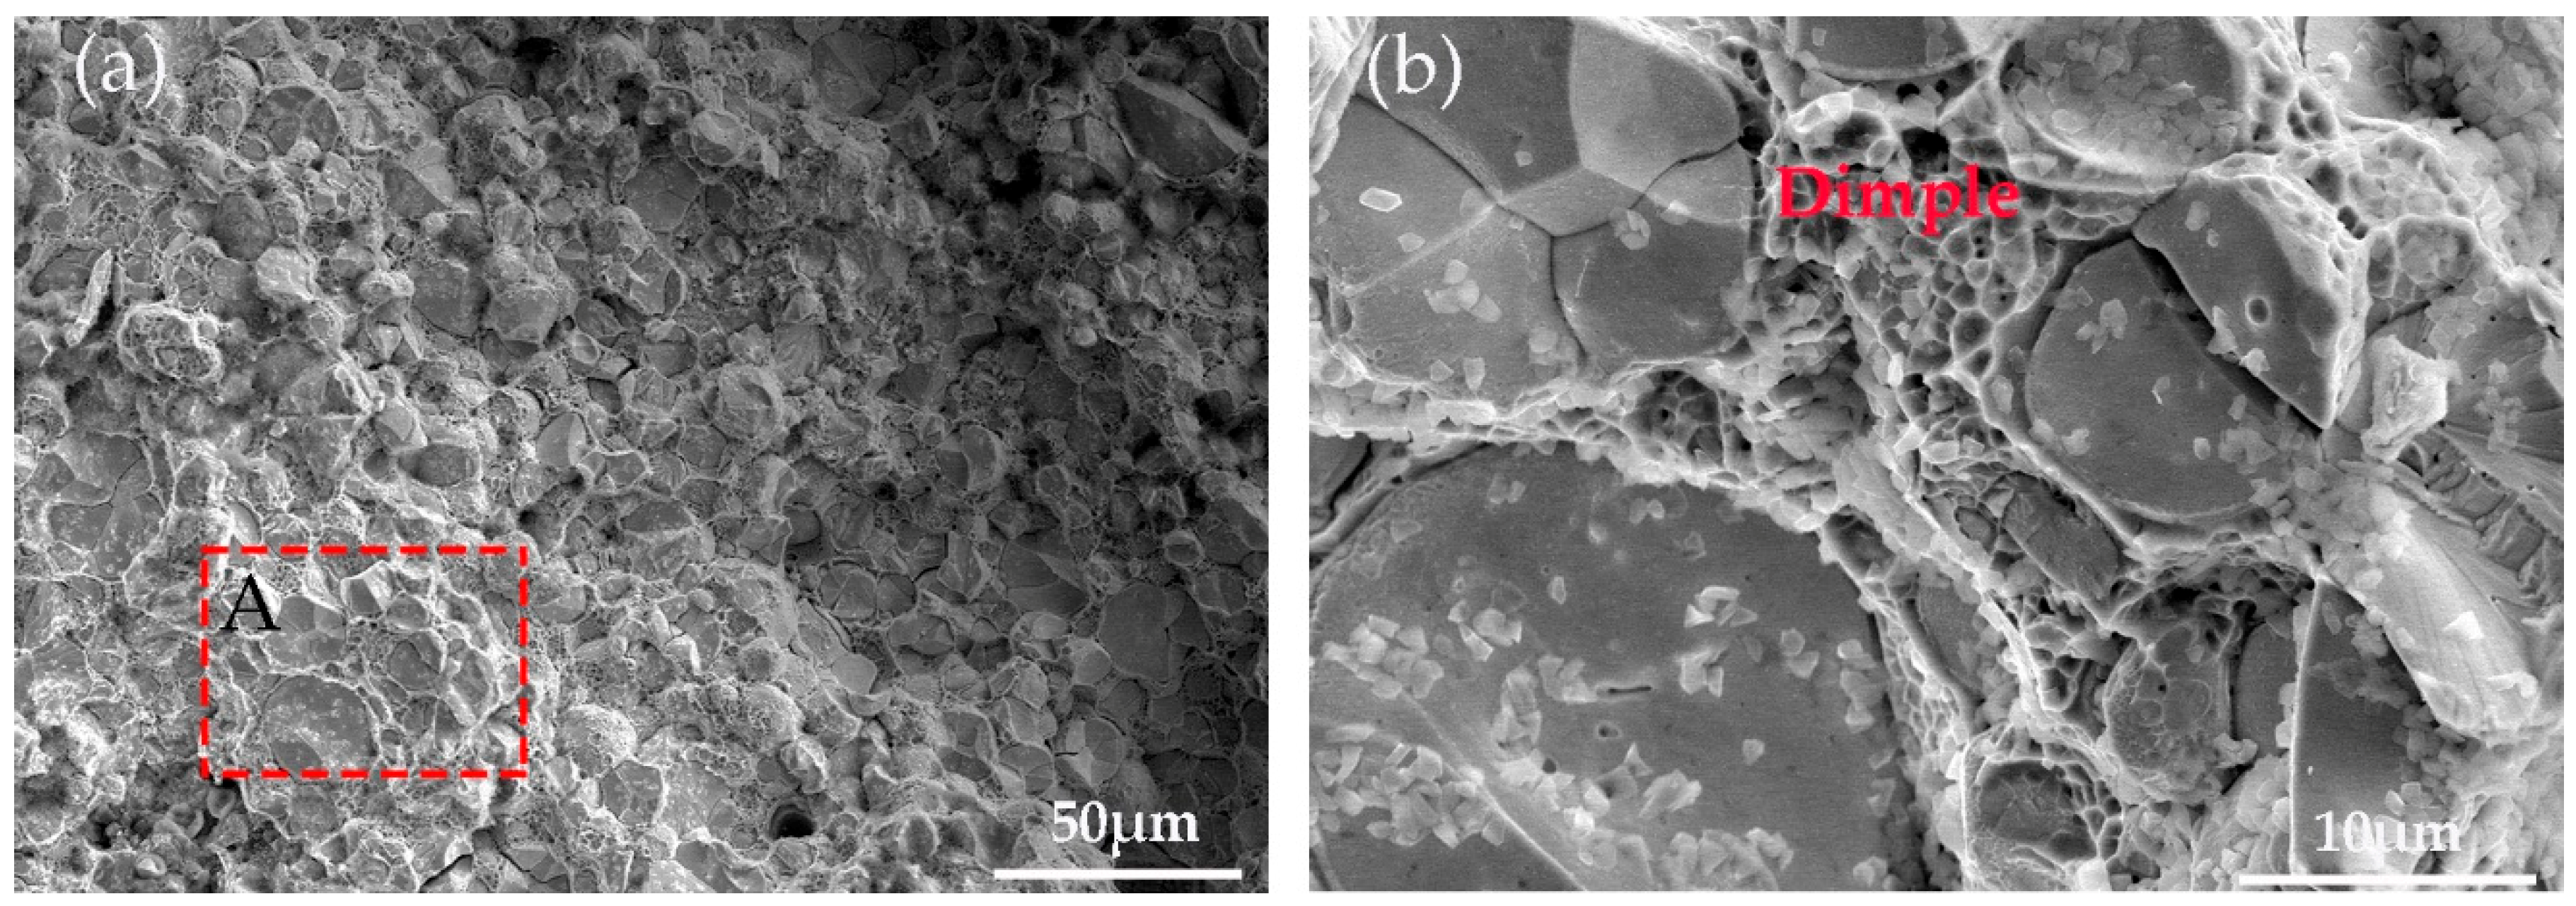
3.3. Mechanical Properties

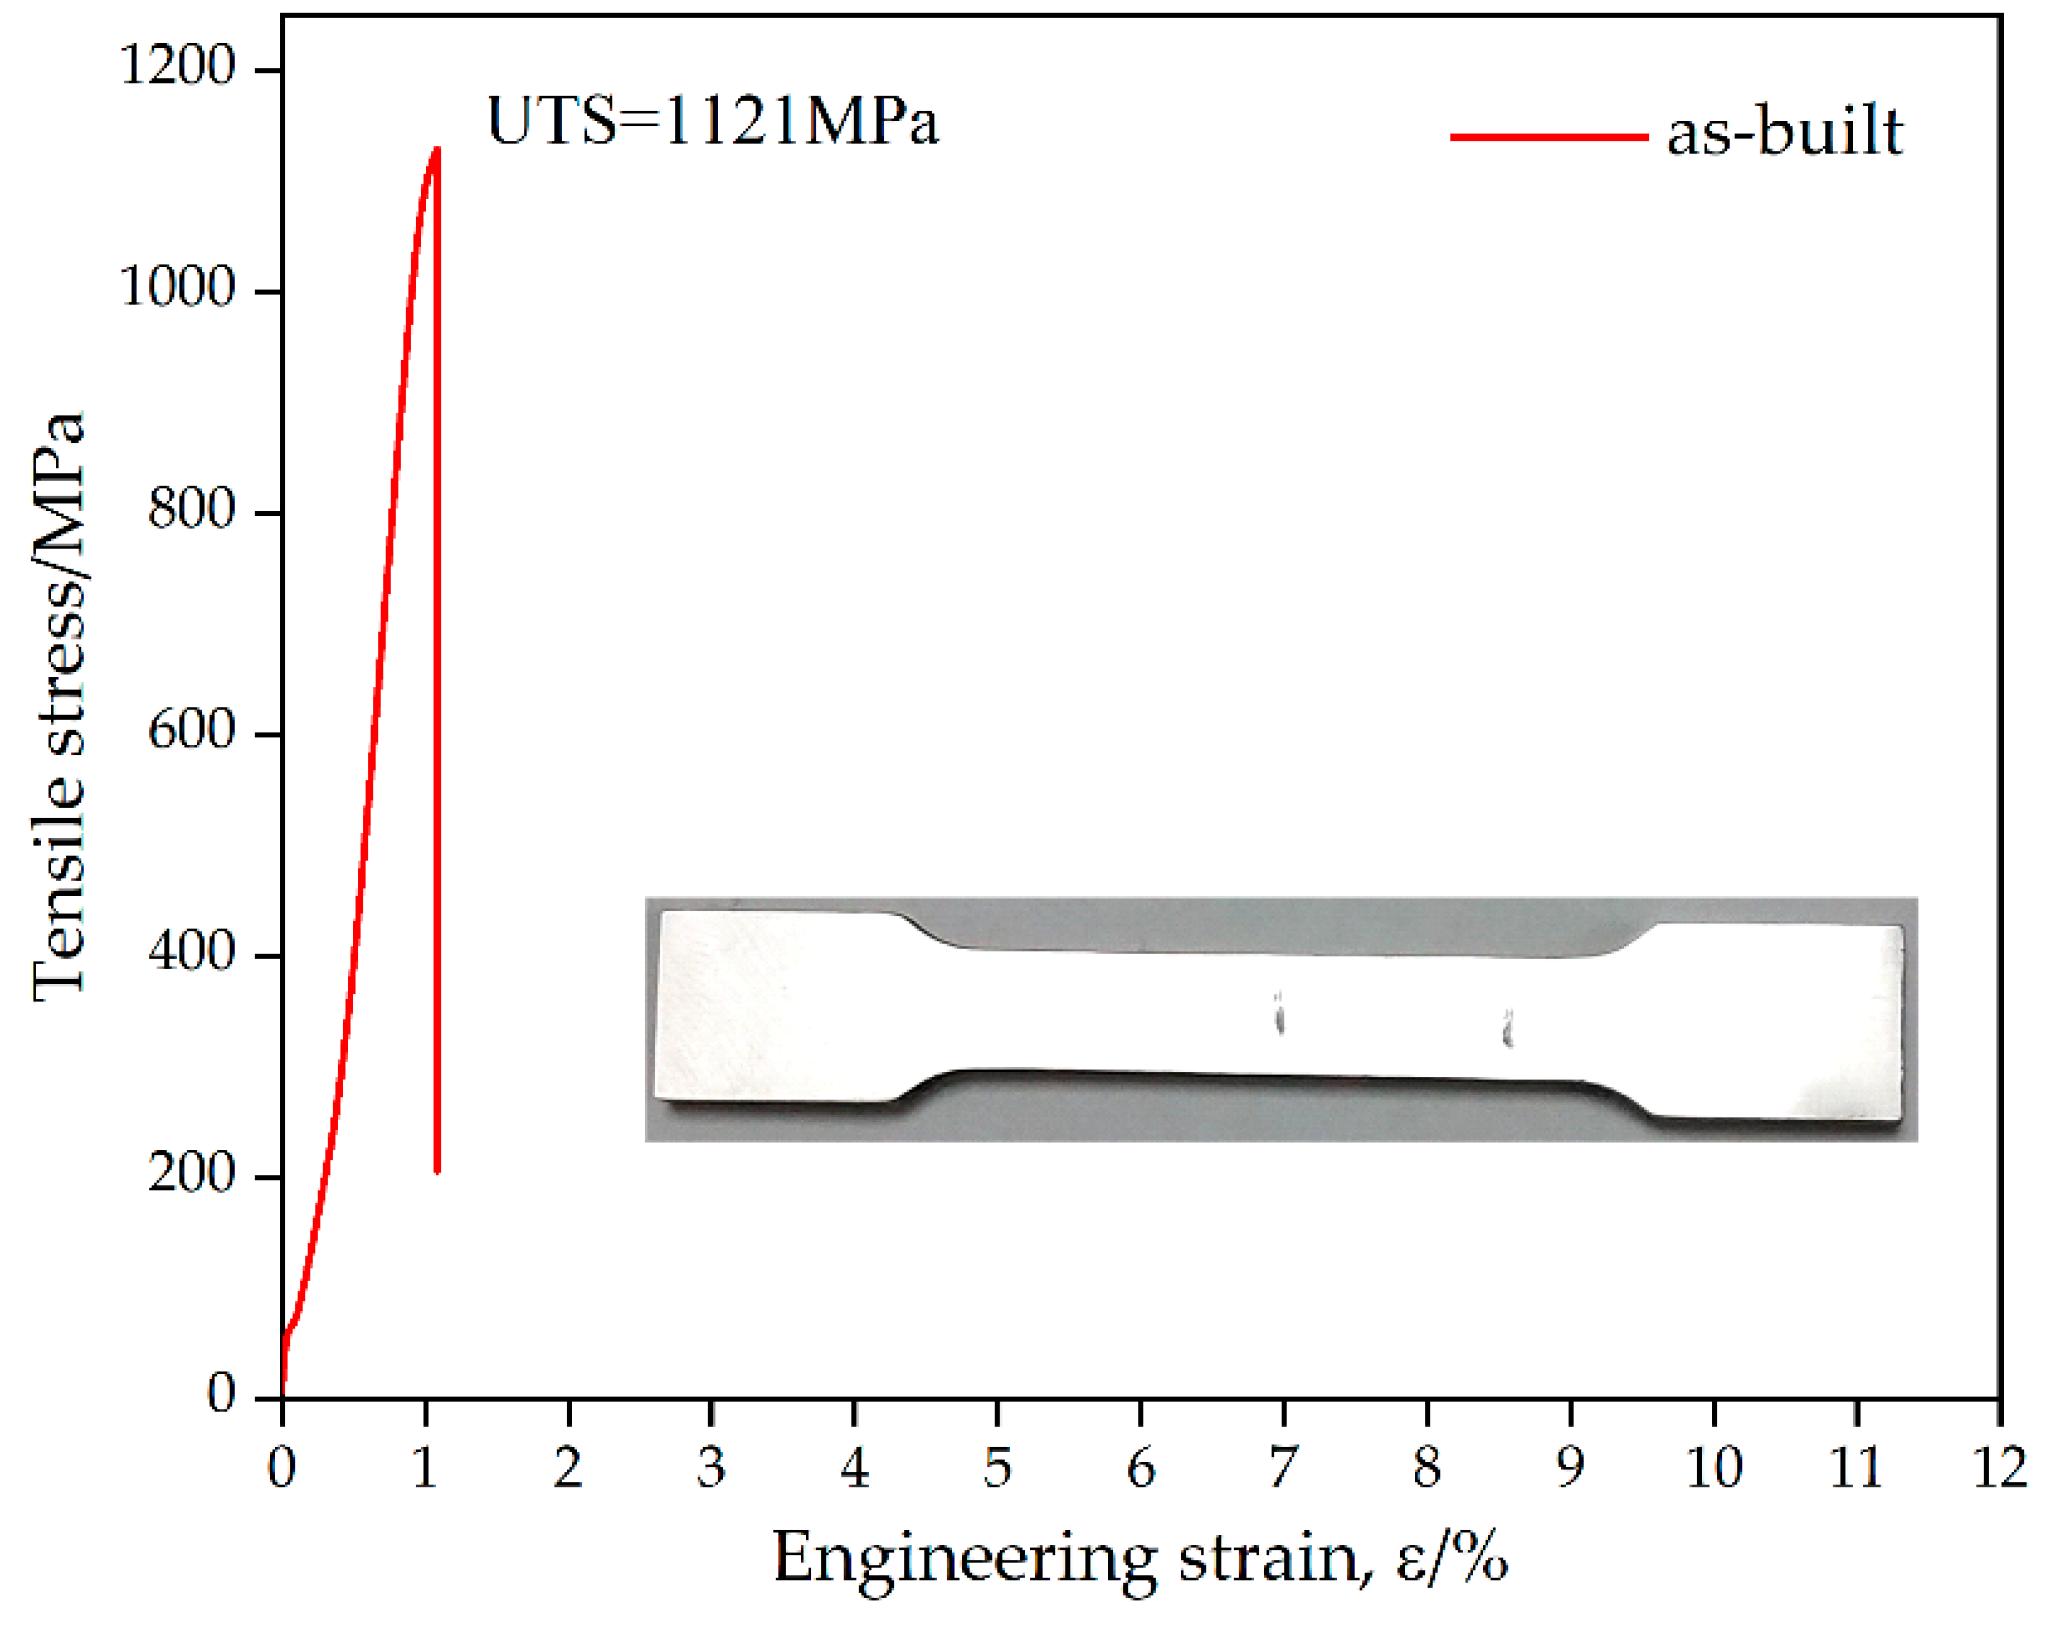
3.3.1. Tensile Properties

The tensile sample was fabricated using the optimized process parameters (RD ≥ 99%) and tensile properties of 90W-7Ni-3Fe were investigated. Figure 14 depicts the tensile stress–strain curve of SLM-built 97W-7Ni-3Fe. The ultimate tensile strength (UTS) was 1121 MPa when there was no significant yield platform. The tensile fracture surface was characterized (Figure 15) and analyzed in order to illustrate the tensile fracture mode. In general, for WHA, there exist four kinds of fracture modes: matrix failure, W cleavage, a W–W inter granular fracture, and W-matrix interfacial separation [35]. The coexistence of these four fracture modes is common in tungsten alloys, and the tensile properties of the WHA are determined by the proportion of four fracture modes. From Figure 15a, the W–W inter granular fracture and W-matrix interfacial separation can be found; few (and shallow) dimples and W cleavage are shown in Figure 15b. Therefore, the 90W-7Ni-3Fe tensile samples fabricated by SLM in this work have the characteristic of brittle fracture. Table 4 lists and compares the tensile properties of the 90W-7Ni-3Fe samples in this study and previous studies. The 90W-7Ni-3Fe fabricated in this work presented a higher tensile strength but a similarly poor elongation. Therefore, in order to obtain the comprehensive mechanical properties, and realize the balance between tensile strength and elongation, subsequent heat treatments might be required. Appropriate heat treatments for these SLM-built WHA samples will be investigated in our future work. In addition, the mechanical behavior of samples could be affected by the building direction in SLM [36]. Thus, the relationship between 90W-7Ni-3Fe mechanical properties and building direction will also be discussed in our future work.

3.3.2. Microhardness

Microhardness along the building direction of the sample was measured under the selected process parameter combinations. Figure 16a shows the microhardness distribution of the samples obtained under different volumetric energy densities at five points. The microhardness of the 90W-7Ni-3Fe samples fabricated by SLM presented an apparent fluctuation at every VED. This phenomenon might be ascribed to the inhomogeneous microstructure in the 90W-7Ni-3Fe samples (Figure 12). The average microhardness values of the 90W-7Ni-3Fe samples under different VEDs are shown in Figure 16b. The average microhardness was 406.83HV0.3 when the VED was 253.97 J/mm3, and the average microhardness increased to 467.46HV0.3 when the VED was 777.78 J/mm3. The average microhardness slightly increased with the increase of VED. This result could be explained by the nearly full density of the sample and the fine grains mentioned above. Compared to the result shown in Figure 17b, pores and irregular defects can be found in Figure 17a, which lead to a slight decrease of the average microhardness.

4. Conclusions

The densification behavior, phase composition, microstructure, tensile properties, and microhardness of 90W-7Ni-3Fe samples fabricated by SLM were investigated in this work. The main conclusions can be drawn as follows:
(1)
Nearly a full densification (≥99%) of the tungsten heavy alloy (WHA) sample was obtained by SLM. With the increase of VED, the relative density of WHA increased significantly. The value of VED should be no less than 300 J/mm3, so that the high relative density of the 90W-7Ni-3Fe components could be obtained. Among the three influencing factors, laser power had the most significant effect on the relative density, and a higher laser power (≥250 W) was preferred. The forming mechanism in this work presented a liquid phase sintering characteristic, which was similar to that in traditional powder metallurgy.
(2)
The typical microstructure of WHA was composed of a tungsten particle phase and a γ-(Ni-Fe) matrix phase with dissolved tungsten. Three main regions can be found, including the tungsten particle phase, the fine tungsten dendrite region, and the Ni-Fe matrix region with dissolved W. The tungsten particle gaps were fully filled with the liquid phase, which contributed to the densification behavior. Fine W dendrites formed due to rapid melting and solidification in the process of SLM, and un-melted tungsten particles acted as a heterogenous nucleation site.
(3)
The high tensile strength (UTS = 1121 MPa) of WHA was obtained in this work. Compared with traditional liquid phase sintering, SLM realized a significant enhancement of tensile strength but poor elongation. In addition, all samples under different VEDs presented a high microhardness, and the microhardness showed a slight increase with an increase of VED. Microhardness fluctuated along the building direction of the samples. This fluctuation was caused by building defects and an uneven microstructure.

Author Contributions

Conceptualization, J.L.; Data curation, Z.W., S.-G.C. and Z.S.; Investigation, B.Z. and Y.W.; Methodology, J.L., B.Z., and Y.W.; Writing—original draft, J.L.; Writing—review & editing, Z.W. and S.-G.C.

Funding

This research was funded by Science Challenge Project (TZ2018006-0301-01), Guangdong Scientific and Technological Project (2017B090911015) and Dongguan University of Technology High-level Talents (Innovation Team) Research Project (KCYCXPT2016003).

Conflicts of Interest

The authors declare no conflict of interest.

References

  1. Jiao, Z.H.; Kang, R.K.; Dong, Z.G.; Guo, J. Microstructure characterization of W-Ni-Fe heavy alloys with optimized metallographic preparation method. Int. J. Refract. Met. Hard Mat. 2019, 80, 114–122. [Google Scholar] [CrossRef]
  2. Deng, S.H.; Yuan, T.C.; Li, R.D.; Zeng, F.H.; Liu, G.H.; Zhou, X. Spark plasma sintering of pure tungsten powder: Densification kinetics and grain growth. Powder Technol. 2017, 310, 264–271. [Google Scholar] [CrossRef]
  3. Roedig, M.; Kuehnlein, W.; Linke, J.; Merola, M.; Rigal, E.; Schedler, B.; Visca, E. Investigation of tungsten alloys as plasma facing materials for the ITER divertor. Fusion Eng. Des. 2002, 61, 135–140. [Google Scholar] [CrossRef]
  4. Philipps, V. Tungsten as material for plasma-facing components in fusion devices. J. Nucl. Mater. 2011, 415, S2–S9. [Google Scholar] [CrossRef]
  5. Gumbsch, P. Brittle fracture and the brittle-to-ductile transition of tungsten. J. Nucl. Mater. 2003, 323, 304–312. [Google Scholar] [CrossRef]
  6. Akhtar, F. An investigation on the solid state sintering of mechanically alloyed nano-structured 90W–Ni–Fe tungsten heavy alloy. Int. J. Refract. Met. Hard Mat. 2008, 26, 145–151. [Google Scholar] [CrossRef]
  7. Senthilnathan, N.; Annamalai, A.R.; Venkatachalam, G. Sintering of tungsten and tungsten heavy alloys of W–Ni–Fe and W–Ni–Cu: A review. Trans. Indian Inst. Met. 2017, 70, 1161–1176. [Google Scholar] [CrossRef]
  8. German, R.M.; Churn, K.S. Sintering atmosphere effects on the ductility of W-Ni-Fe heavy metals. Metall. Trans. A 1984, 15, 747–754. [Google Scholar] [CrossRef]
  9. Durlu, N.; Çalişkan, N.K.; Bor, Ş. Effect of swaging on microstructure and tensile properties of W–Ni–Fe alloys. Int. J. Refract. Met. Hard Mat. 2014, 42, 126–131. [Google Scholar] [CrossRef]
  10. Das, J.; Rao, G.A.; Pabi, S.K. Microstructure and mechanical properties of tungsten heavy alloys. Mater. Sci. Eng. A 2010, 527, 7841–7847. [Google Scholar] [CrossRef]
  11. Deprez, K.; Vandenberghe, S.; Van Audenhaege, K.; Van Vaerenbergh, J.; Van Holen, R. Rapid additive manufacturing of MR compatible multipinhole collimators with selective laser melting of tungsten powder. Med. Phys. 2013, 40, 012501. [Google Scholar] [CrossRef] [PubMed]
  12. Zhang, D.Q.; Cai, Q.Z.; Liu, J.H. Formation of nanocrystalline tungsten by selective laser melting of tungsten powder. Mater. Manuf. Process. 2012, 27, 1267–1270. [Google Scholar] [CrossRef]
  13. Zhou, X.; Liu, X.H.; Zhang, D.Q.; Shen, Z.J.; Liu, W. Balling phenomena in selective laser melted tungsten. J. Mater. Process. Technol. 2015, 222, 33–42. [Google Scholar] [CrossRef]
  14. Enneti, R.K.; Morgan, R.; Atre, S.V. Effect of process parameters on the Selective Laser Melting (SLM) of tungsten. Int. J. Refract. Met. Hard Mat. 2018, 71, 315–319. [Google Scholar] [CrossRef]
  15. Wen, S.F.; Wang, C.; Zhou, Y.; Duan, L.C.; Wei, Q.S.; Yang, S.F.; Shi, Y.F. High-density tungsten fabricated by selective laser melting: Densification, microstructure, mechanical and thermal performance. Opt. Laser Technol. 2019, 116, 128–138. [Google Scholar] [CrossRef]
  16. Tan, C.L.; Zhou, K.S.; Ma, W.Y.; Attard, B.; Zhang, P.P.; Kuang, T.C. Selective laser melting of high-performance pure tungsten: Parameter design, densification behavior and mechanical properties. Sci. Technol. Adv. Mater. 2018, 19, 370–380. [Google Scholar] [CrossRef] [PubMed]
  17. Guo, M.; Gu, D.D.; Xi, L.X.; Du, L.; Zhang, H.M.; Zhang, J.Y. Formation of scanning tracks during Selective Laser Melting (SLM) of pure tungsten powder: Morphology, geometric features and forming mechanisms. Int. J. Refract. Met. Hard Mat. 2019, 79, 37–46. [Google Scholar] [CrossRef]
  18. Wang, D.Z.; Li, K.L.; Yu, C.F.; Ma, J.; Liu, W.; Shen, Z.J. Cracking behavior in additively manufactured pure tungsten. Acta Metall. Sin. 2019, 32, 127–135. [Google Scholar] [CrossRef]
  19. Müller, A.V.; Schlick, G.; Neu, R.; Anstätt, C.; Klimkait, T.; Lee, J.; Seidel, C. Additive manufacturing of pure tungsten by means of selective laser beam melting with substrate preheating temperatures up to 1000 °C. Nucl. Mater. Energy 2019, 19, 184–188. [Google Scholar] [CrossRef]
  20. Li, K.L.; Wang, D.Z.; Xing, L.L.; Wang, Y.F.; Yu, C.F.; Chen, J.H.; Zhang, T.; Ma, J.; Liu, W.; Shen, Z.J. Crack suppression in additively manufactured tungsten by introducing secondary-phase nanoparticles into the matrix. Int. J. Refract. Met. Hard Mat. 2019, 79, 158–163. [Google Scholar] [CrossRef]
  21. Iveković, A.; Omidvari, N.; Vrancken, B.; Lietaert, K.; Thijs, L.; Vanmeensel, K.; Kruth, J.P. Selective laser melting of tungsten and tungsten alloys. Int. J. Refract. Met. Hard Mat. 2018, 72, 27–32. [Google Scholar] [CrossRef]
  22. Li, R.D.; Shi, Y.S.; Liu, J.H.; Xie, Z.; Wang, Z.G. Selective laser melting W–10 wt.% Cu composite powders. Int. J. Adv. Manuf. Technol. 2010, 48, 597–605. [Google Scholar] [CrossRef]
  23. Iveković, A.; Montero-Sistiaga, M.L.; Vanmeensel, K.; Kruth, J.P.; Vleugels, J. Effect of processing parameters on microstructure and properties of tungsten heavy alloys fabricated by SLM. Int. J. Refract. Met. Hard Mat. 2019, 82, 23–30. [Google Scholar] [CrossRef]
  24. Li, R.D.; Liu, J.H.; Shi, Y.S.; Zhang, L.; Du, M.Z. Effects of processing parameters on rapid manufacturing 90W–7Ni–3Fe parts via selective laser melting. Powder Metall. 2010, 53, 310–317. [Google Scholar] [CrossRef]
  25. Zhang, D.Q.; Cai, Q.Z.; Liu, J.H.; Zhang, L.; Li, R.D. Select laser melting of W–Ni–Fe powders: Simulation and experimental study. Int. J. Adv. Manuf. Technol. 2010, 51, 649–658. [Google Scholar] [CrossRef]
  26. Ding, L.; Xiang, D.P.; Li, Y.Y.; Li, C.; Li, J.B. Effects of sintering temperature on fine-grained tungsten heavy alloy produced by high-energy ball milling assisted spark plasma sintering. Int. J. Refract. Met. Hard Mat. 2012, 33, 65–69. [Google Scholar] [CrossRef]
  27. Bollina, R.; German, R.M. Heating rate effects on microstructural properties of liquid phase sintered tungsten heavy alloys. Int. J. Refract. Met. Hard Mat. 2004, 22, 117–127. [Google Scholar] [CrossRef]
  28. Joguet, D.; Costil, S.; Liao, H.; Danlos, Y. Porosity content control of CoCrMo and titanium parts by Taguchi method applied to selective laser melting process parameter. Rapid Prototyp. J. 2016, 22, 20–30. [Google Scholar] [CrossRef]
  29. Sun, J.F.; Yang, Y.Q.; Wang, D. Parametric optimization of selective laser melting for forming Ti6Al4V samples by Taguchi method. Opt. Laser Technol. 2013, 49, 118–124. [Google Scholar] [CrossRef]
  30. Kong, X.; Yang, L.; Zhang, H.; Chi, G.; Wang, Y. Optimization of surface roughness in laser-assisted machining of metal matrix composites using Taguchi method. Int. J. Adv. Manuf. Technol. 2017, 89, 529–542. [Google Scholar] [CrossRef]
  31. Leitz, K.H.; Singer, P.; Plankensteiner, A.; Tabernig, B.; Kestler, H.; Sigl, L.S. Multi-physical simulation of selective laser melting. Metal Powder Rep. 2017, 72, 331–338. [Google Scholar] [CrossRef]
  32. Erol, M.; Erdoğan, M.; Karakaya, İ. Effects of fabrication method on initial powder characteristics and liquid phase sintering behaviour of tungsten. Int. J. Refract. Met. Hard Mat. 2018, 77, 82–89. [Google Scholar] [CrossRef]
  33. Zhang, D.Q.; Liu, Z.H.; Cai, Q.Z.; Liu, J.H.; Chua, C.K. Influence of Ni content on microstructure of W–Ni alloy produced by selective laser melting. Int. J. Refract. Met. Hard Mat. 2014, 45, 15–22. [Google Scholar] [CrossRef]
  34. Wang, M.; Li, R.; Yuan, T.; Chen, C.; Zhang, M.; Weng, Q.; Yuan, J. Selective laser melting of W-Ni-Cu composite powder: Densification, microstructure evolution and nano-crystalline formation. Int. J. Refract. Met. Hard Mat. 2018, 70, 9–18. [Google Scholar] [CrossRef]
  35. Liu, W.; Ma, Y.; Zhang, J. Properties and microstructural evolution of W-Ni-Fe alloy via microwave sintering. Int. J. Refract. Met. Hard Mat. 2012, 35, 138–142. [Google Scholar] [CrossRef]
  36. Hitzler, L.; Janousch, C.; Schanz, J.; Merkel, M.; Heine, B.; Mack, F.; Öchsner, A. Direction and location dependency of selective laser melted AlSi10Mg specimens. J. Mater. Process Tech. 2017, 243, 48–61. [Google Scholar] [CrossRef]
Figure 1. (a) Schematic diagram of selective laser melting (SLM) equipment; (b) the building process of the SLM.
Metals 09 00884 g001
Figure 2. The distribution of Four kinds of powder sizes. (a) Pure tungsten powder; (b) nickel powder; (c) Fe-Ni alloy powder; (d) submicron nickel powder.
Metals 09 00884 g002
Figure 3. Morphology of the 90W-7Ni-3Fe powder. (a) Low magnification; (b) high magnification.
Metals 09 00884 g003
Figure 4. (a) Scan strategy used in this experiment; (b) 90W-7Ni-3Fe samples fabricated by the designed process parameters.
Metals 09 00884 g004
Figure 5. (a) Illustration diagram of sample direction; (b) dimensions of tensile sample.
Metals 09 00884 g005
Figure 6. Variation of the relative density with the volumetric energy density. The inserted figure shows the different transverse morphologies corresponding to the VEDs.
Metals 09 00884 g006
Figure 7. The transverse morphologies of different VEDs. (a) 185.19 J/mm3; (b) 277.78 J/mm3; (c) 396.83 J/mm3; (d) 518.52 J/mm3; (e) 592.60 J/mm3; (f) 617.28 J/mm3; (g) 634.92 J/mm3; (h) 648.15 J/mm3; (i) 777.78 J/mm3.
Metals 09 00884 g007
Figure 8. Transverse morphology with a high magnification. (a) 253.97 J/mm3; (b) 648.15 J/mm3.
Metals 09 00884 g008
Figure 9. Transverse morphology of the same VED (370.37 J/mm3).
Metals 09 00884 g009
Figure 10. Main effect plots of signal-to-noise (S/N).
Metals 09 00884 g010
Figure 11. The XRD pattern of different VED.
Metals 09 00884 g011
Figure 12. (a) The microstructure of 90W-7Ni-3Fe under VED = 518.52 J/mm3; (b) element distribution.
Metals 09 00884 g012
Figure 13. Energy-dispersive spectrometer (EDS) element analysis. (a) Point A; (b) point B.
Metals 09 00884 g013
Figure 14. The tensile properties of 90W-7Ni-3Fe fabricated by SLM.
Metals 09 00884 g014
Figure 15. Tensile fracture morphology of 90W-7Ni-3Fe fabricated by SLM. (a) Low magnification; (b) high magnification of zone A (a).
Metals 09 00884 g015
Figure 16. Microhardness under different VEDs. (a) Microhardness of each point; (b) average microhardness.
Metals 09 00884 g016
Figure 17. Vertical morphology of the 90W-7Ni-3Fe under different VEDs. (a) 253.97 J/mm3; (b) 518.52 J/mm3.
Metals 09 00884 g017
Table 1. Process parameters used in this work.
Process Parameter/UnitValue
Laser power, LP/W200, 250, 300, 350
Scan speed, SS/(mm/s)150, 200, 250, 300
Hatching distance, HD/mm0.075, 0.09, 0.105, 0.12
Layer thickness, LT/mm0.03
Table 2. Process parameter combinations and the value of the volumetric energy density (VED).
NO.LP/WSS/(mm/s)HD/mmVED/(J/mm3)
12001500.075592.59
22002000.09370.37
32002500.105253.97
42003000.12185.19
52501500.09617.28
62502000.105396.83
72502500.12277.78
82503000.075370.37
93001500.105634.92
103002000.12416.47
113002500.09533.33
123003000.075370.37
133501500.12648.15
143502000.09777.78
153502500.075518.52
163503000.105370.37
Table 3. Response for the signal-to-noise (S/N).
Levels1234DeltaRank
Laser power/W39.1839.7539.8939.910.731
Scan speed/(mm/s)39.9439.6939.6139.490.452
Hatch distance/mm39.8639.7639.6039.510.353
Table 4. Comparison of the tensile properties of 90W-7Ni-3Fe between this work and the published results.
Processing MethodsUTS/MPaElongation/%Source
Selective laser melting, SLM1121 MPa<1%This work
Selective laser melting, SLM871 MPa<1%[23]
Liquid phase sintering, LPS~1000 MPa~30%[10]

