Article

Hot Workability of 300M Steel Investigated by In Situ and Ex Situ Compression Tests

1
School of Materials Science and Engineering, Hubei University of Automotive Technology, Shiyan 442002, China
2
School of Materials Science and Engineering, State Key Laboratory of Materials Processing and Die & Mould Technology, Huazhong University of Science and Technology, Wuhan 430074, China
*
Authors to whom correspondence should be addressed.
Metals 2019, 9(8), 880; https://doi.org/10.3390/met9080880
Submission received: 15 July 2019 / Revised: 3 August 2019 / Accepted: 8 August 2019 / Published: 10 August 2019

Abstract

:
In this work, hot compression experiments of 300M steel were performed at 900–1150 °C and 0.01–10 s−1. The relation of flow stress and microstructure evolution was analyzed. The intriguing finding was that at a lower strain rate (0.01 s−1), the flow stress curves were single-peaked, while at a higher strain rate (10 s−1), no peak occurred. Metallographic observation results revealed the phenomenon was because dynamic recrystallization was more complete at a lower strain rate. In situ compression tests were carried out to compare with the results by ex situ compression tests. Hot working maps representing the influences of strains, strain rates, and temperatures were established. It was found that the power dissipation coefficient was not only related to the recrystallized grain size but was also related to the volume fraction of recrystallized grains. The optimal hot working parameters were suggested. This work provides comprehensive understanding of the hot workability of 300M steel in thermal compression.

1. Introduction

The 300M steel, an ultra-high strength steel (the ultimate tensile strength ≥1800 MPa) which is a modification of AISI 4340 steel, is often used in high performance auto parts, aircraft landing gear, airframe parts, and many other high strength applications because of the outstanding mechanical properties. To ensure the best service performance, these parts usually undergo hot forging. The selection of hot working parameters has been a major concern in isothermal compression of 300M steel, because it not only affects the microstructure at high temperatures, but also affects the microstructures after cooling and service performance. However, the hot workability of the 300M steel was not well understood, resulting in grain coarsening or even cracking in practical forging of large parts [1,2,3]. Therefore, a comprehensive understanding of the hot workability of 300M steel in thermal compression is still needed.
The hot working maps of 300M steel or similar steels have been investigated by many researchers in recent years. A physically based flow stress model and the processing maps of a medium-carbon low-alloy steel, 34CrNiMo6, was proposed by Gong et al. [4], and it was pointed out that two optimal processing parameter domains existed, one at 1050–1130 °C and 0.005–0.03 s−1, and the other at 1130–1200 °C and 0.03–0.36 s-1. The constitutive model and processing maps of 4340 steel were constructed by Sanrutsadakorn et al. [5], and an optimal hot working condition was suggested at 1050–1200 °C and 0.01–0.1 s−1. Also, for 4340 steel, the hot working maps were established by Łukaszek-Sołek et al. [6], and explained via microstructure observations, but a different workability parameter, at 1050–1200 °C and 3–57 s−1, was suggested. The processing maps of 300M steel were formed by Luo et al. [7], and an optimal hot working parameter range was recommended at 1100–1140 °C and 0.1–0.16 s-1 via microstructure observations. Based on a constitutive model coupling average grain size, a processing map of 300M steel was calibrated by Sun et al. [8], and a broader hot working parameter range was determined at 900–1140 °C and 0.1–1.91 s−1. These researches have laid a solid foundation for the present investigation.
Up to date, it is generally accepted that the grain evolution is the intrinsic reason for flow stress evolution [9], and the grain morphology is able to interpret the deformation mechanisms of different domains in the processing maps. The microstructure evolution of 300M steel has been studied by Chen et al. [10,11,12,13], Liu et al. [14], and Zeng et al. [15]. However, the influence of the dynamic recrystallization volume fraction on the processing map of 300M steel has not been systematically investigated. Besides, the optimal strain rate should not be too narrow to avoid difficulty in practical application [7], and an undesirable mixed grain defect was found under current suggested hot working conditions [8]. Therefore, problems about the processing map of 300M steel still exist, and systematic research on the microstructure evolution and hot workability in thermal compression of 300M steel is in need.
Accordingly, in situ and ex situ compression tests will be carried out. The hot working maps will be established. Based on the analysis of the experiment results, the optimal hot working parameters will be suggested. This work provides comprehensive understanding of the hot workability of 300M steel in thermal compression.

2. Materials and Experiments

2.1. Materials

The as-received material was annealed. The diameter of the as-received 300M steel rod was 300 mm, and height 1000 mm. The chemical composition was quantitatively characterized by X-ray fluorescence (XRF) as 0.39C-0.808Mn-0.086V-0.824Ni-0.435Mo-2.562Si-0.896Cr-0.017S with balanced Fe (weight %).

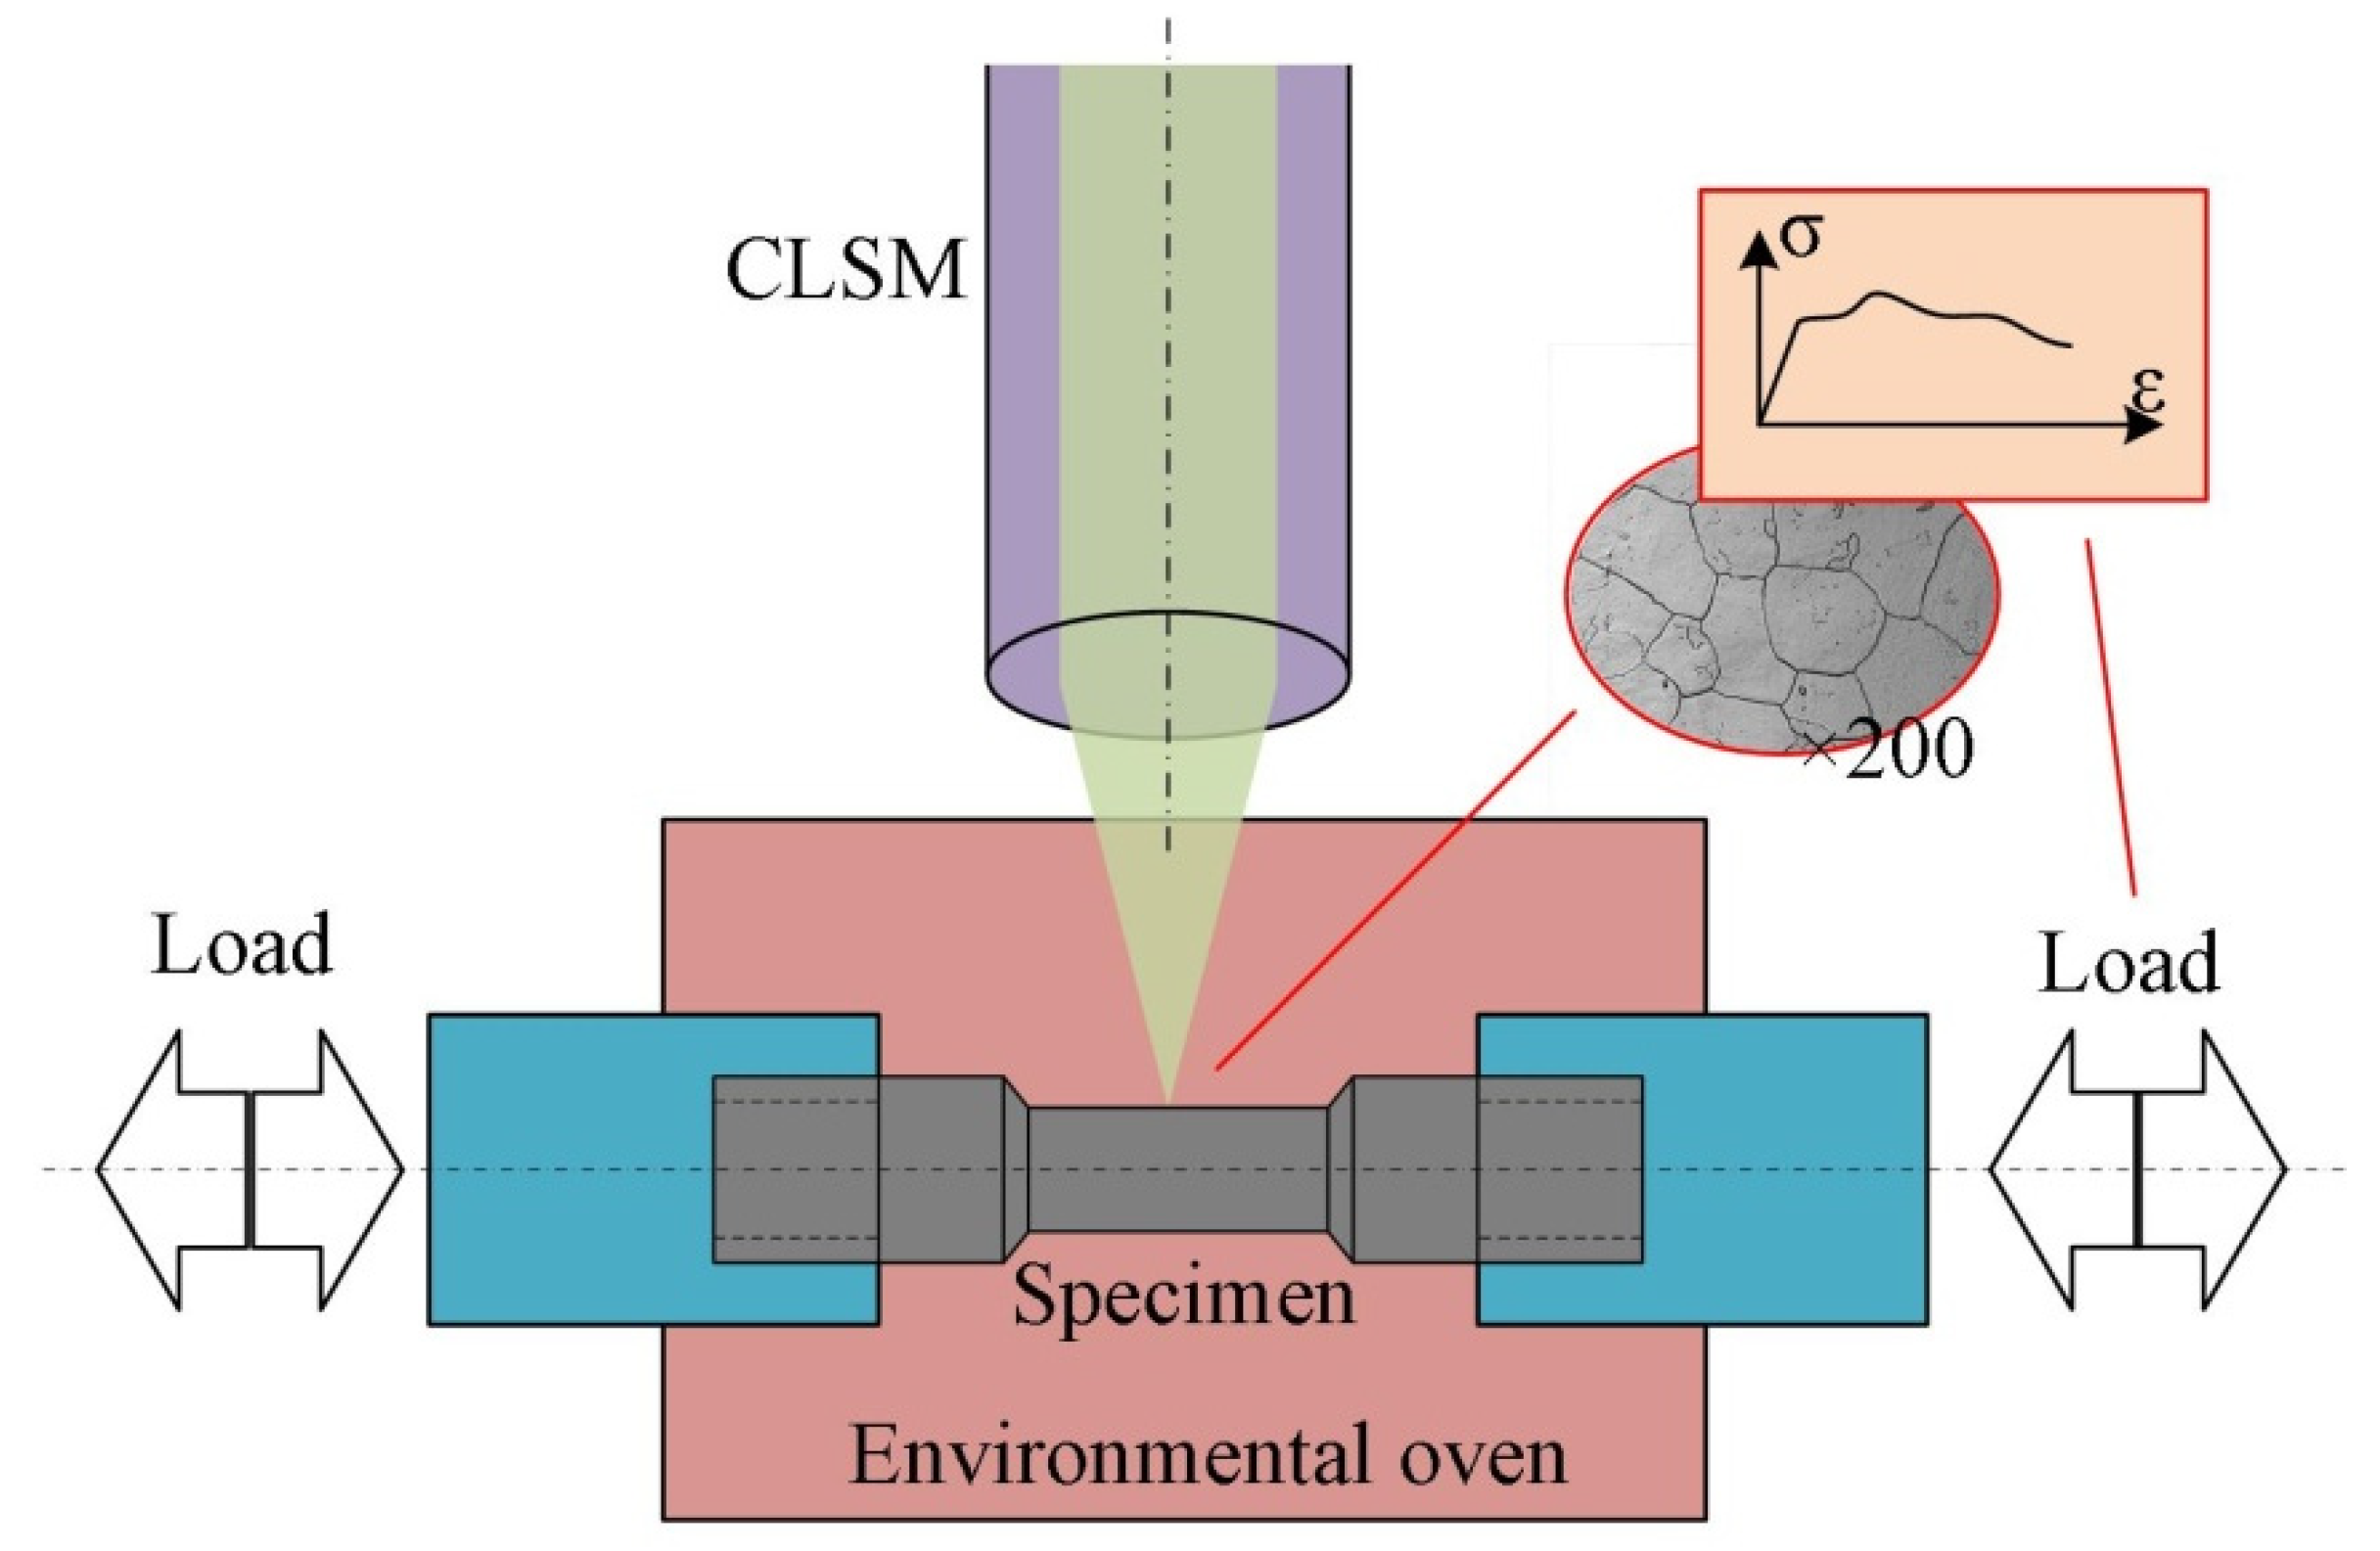
2.2. Hot Compression Tests

Traditional ex situ metallographic observation was implemented to investigate the microstructure evolution of 300M steel in thermal compression. Specimens for the hot compression tests were wire-electrode cut from the ingot, and they were turned into cylinders whose diameter was 8 mm, the height 12 mm. The hot compression tests were performed on a Gleeble 3500 machine (Dynamic Systems Inc., Austin, TX, USA). The specimens were heated at 3.3 °C/s to 1200 °C. After holding for 240 s, the specimens were cooled to deformation temperatures, compressed at different strain rates to the strain of 0.95, and quenched thereafter. The compression temperatures were 900 °C, 950 °C, 1000 °C, 1050 °C, 1100 °C, and 1150 °C, which were chosen to cover the typical forging temperature range of this material [16]. The selection of strain rates (0.01, 0.1, 1, and 10 s−1) has considered the usual strain rate range in the die forging process [17]. The temperatures were measured via a thermal-couple welded on the half height of the specimen surface, and automatically controlled during heating, holding, compression, and cooling by a computer to obtain specified temperatures. Punch positions were also automatically monitored to get constant strain rates. The true stress was calculated by the punch force and instant cross-section area of the specimen. The logarithmic strain was calculated according to the height reduction of the specimen. Friction was reduced by placing tantalum sheets between the punch and specimen end. The stress–strain curves underwent noise reduction.
The microstructures of deformed specimens were characterized by metallographic observations on an optical microscope (VHX-1000C, Keyence Co., Osaka, Japan). The specimens were cut via the symmetry faces which passed the axis. Specimens were grinded, polished, and etched using etchant of saturated picrate, carbon tetrachloride, and concentrated hydrochloric acid with a volume ratio of 6:1:1:3. The temperature for etching was ~40 °C. The middle regions of the specimens were observed. At least five photos with square areas of 0.4 mm × 0.4 mm were taken for each specimen.

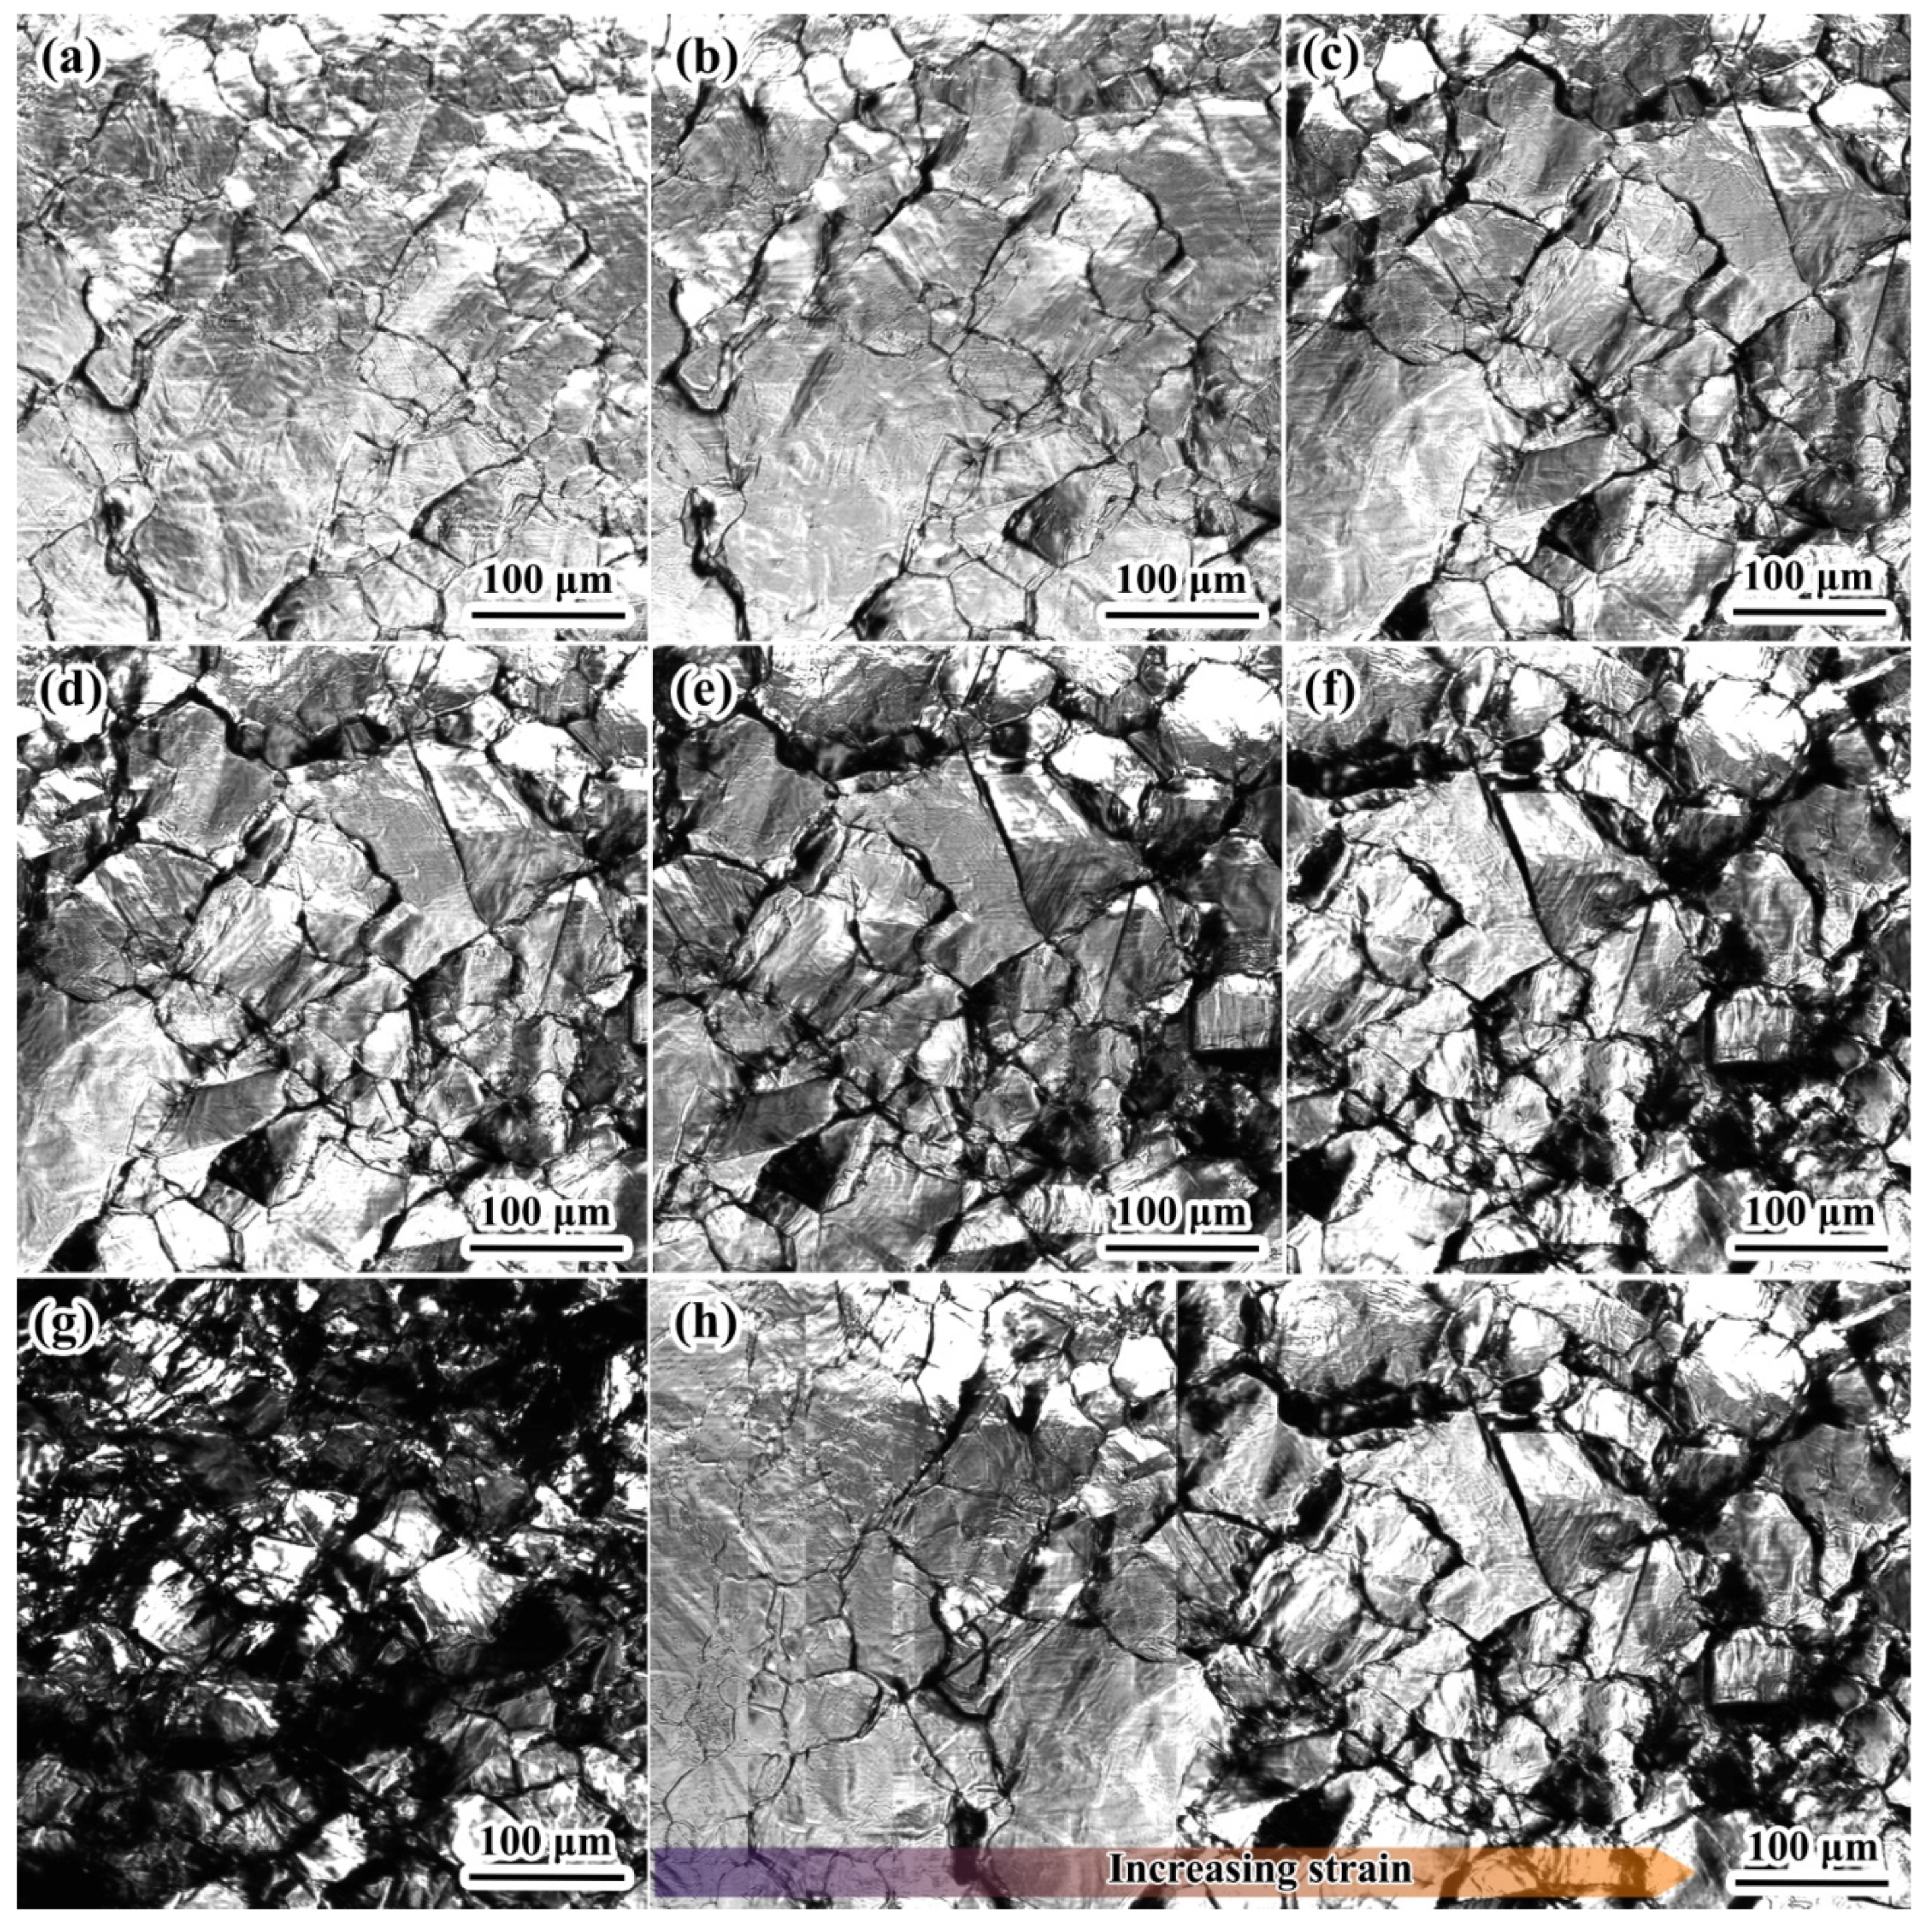
2.3. In Situ Compression Tests

To investigate continuously the influence of strain on microstructure evolution of 300M steel, in situ compression tests were performed on a confocal laser scanning microscope (CLSM, VL2000DX-SVF15FTC, Yonekura MFG Co, Osaka, Japan). The experimental setup is schematically shown in Figure 1. A square area of 6 mm × 6 mm on the dumbbell-shaped specimen surface was mechanically polished for in situ observation. The specimen was calibrated to avoid compression instability. The marking length was 15 mm, and the cross-section shape was a rectangle with the size of 4 mm × 6 mm [18], the design of which has considered the installation room size and punch force limitations. The test specimens were gripped at both ends by screw threads on the punches. During the in situ compression test, the microstructure evolutions of the specimen could be visualized on the polished surface because of the volatilization of alloy elements at grain boundaries. Further technique details can be referred to in the literature [11]. The compression temperature, strain rate, and strain were 1100 °C, 0.01 s−1, and 0.9, respectively.

3. Results and Discussion
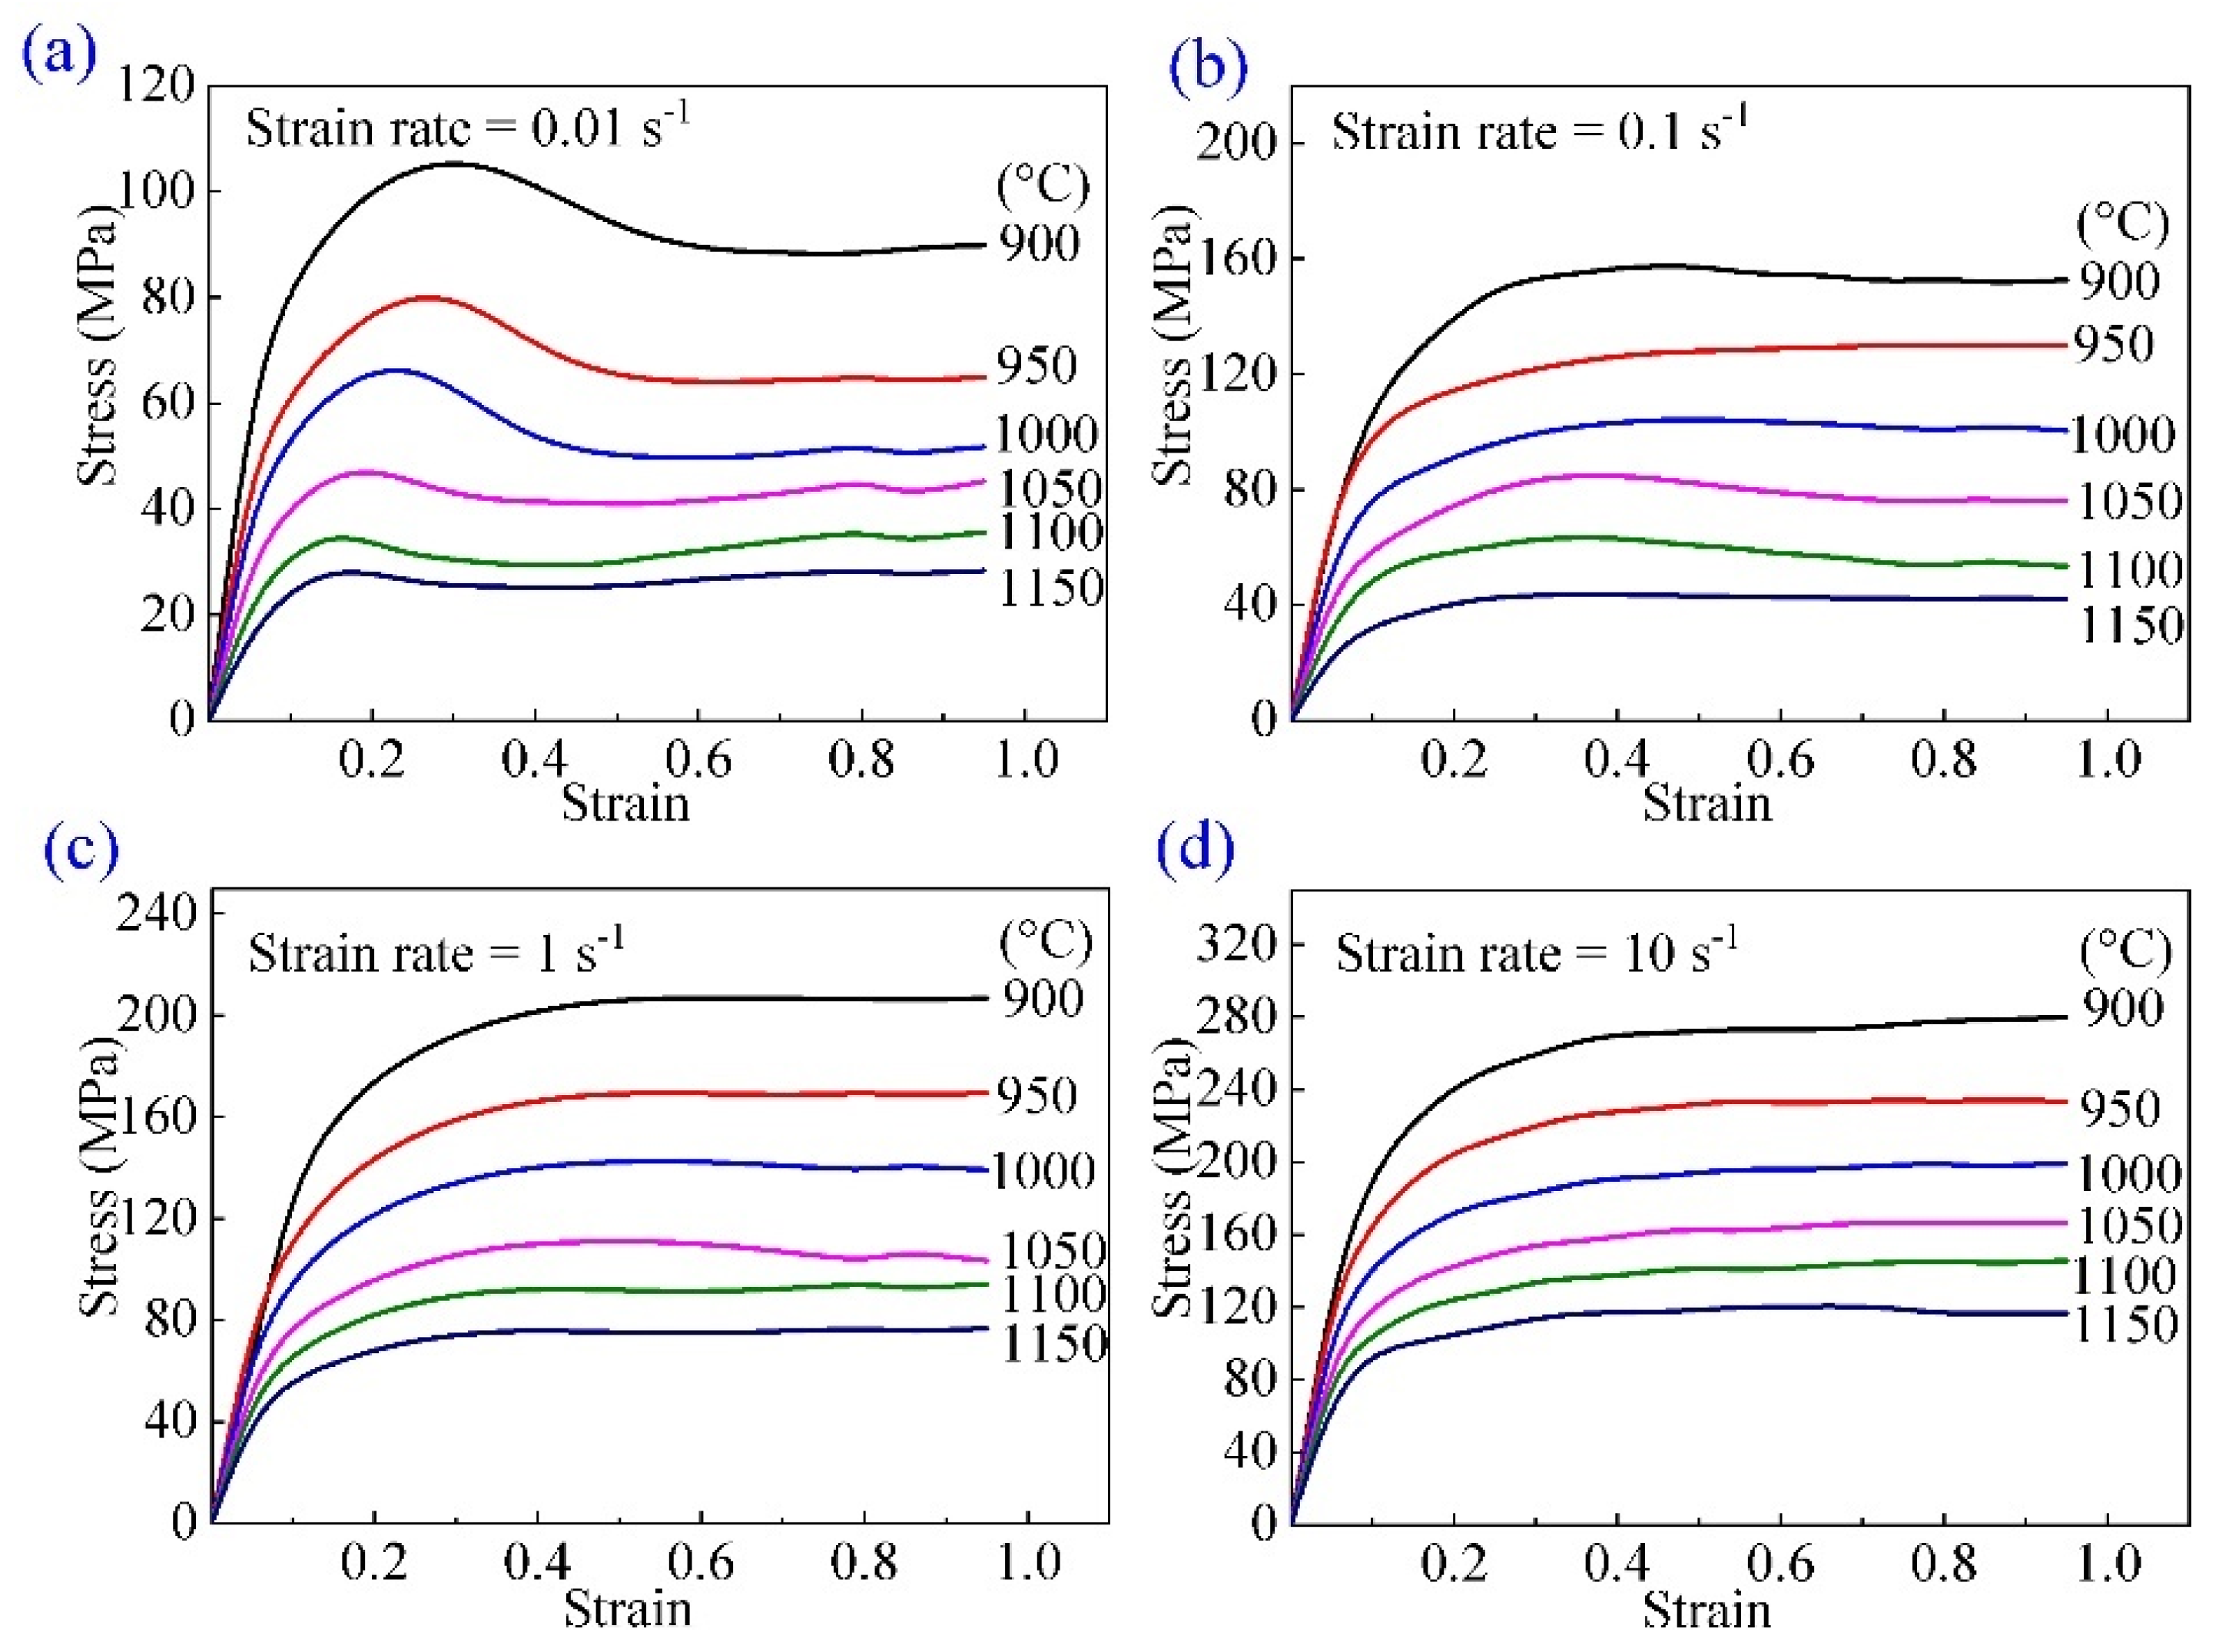
3.1. Flow Behavior

The flow stress curves of 300M steel are shown in Figure 2. The contradicting effect of work hardening and dynamic recovery softening led to an increase of flow stress in the initial stage of compression, after which the dynamic recrystallization was triggered because the dislocation density reached a critical value, and an intensive softening due to dynamic recrystallization took place, resulting in a gradual drop of flow stress near the strain of ~0.3. When the dynamic recrystallization was completed, the work hardening and softening were balanced, and the flow stresses were almost stable. It should be noted that different flow behaviors were shown at different strain rates. At 0.01 s−1, as shown in Figure 2a, the flow stress curves were single-peaked, while at 10 s−1, as shown in Figure 2d, no peak occurred. This was probably because dynamic recrystallization was more complete at a lower strain rate, so the dynamic recrystallization softening was more intensive, thereby resulting in a typical single-peaked discontinuous dynamic recrystallization flow stress curve according to Sakai et al. [9]. Further metallographic observations were carried out in Section 3.2 to confirm the metallurgy reason.

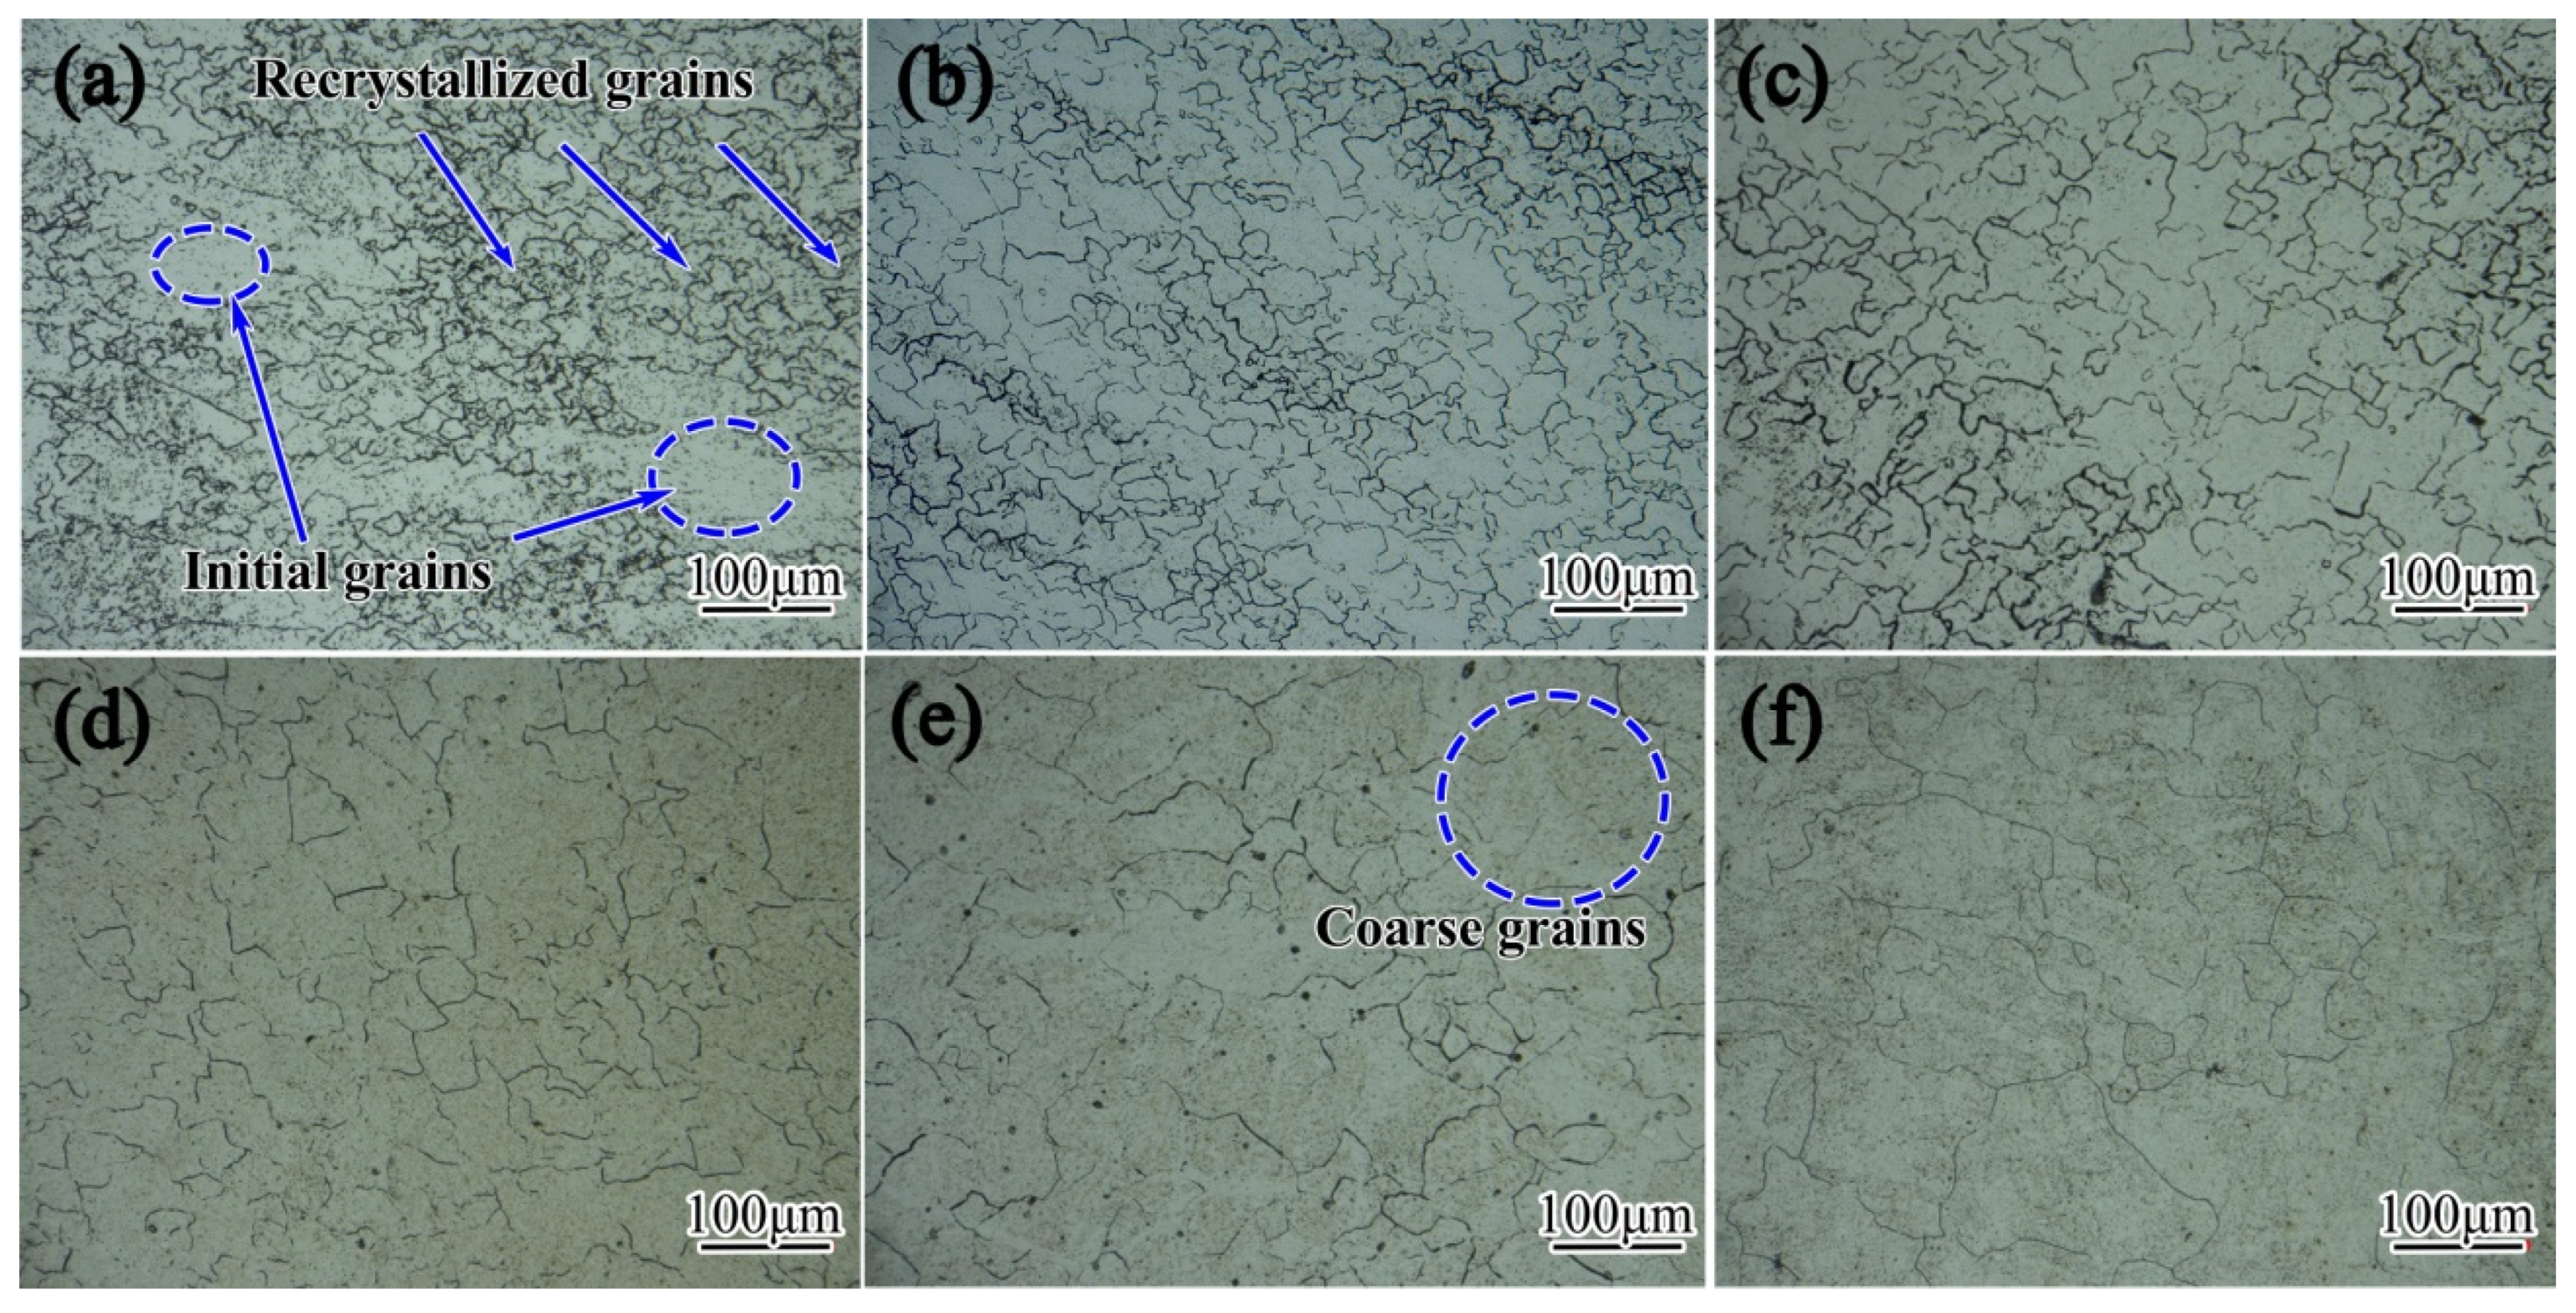
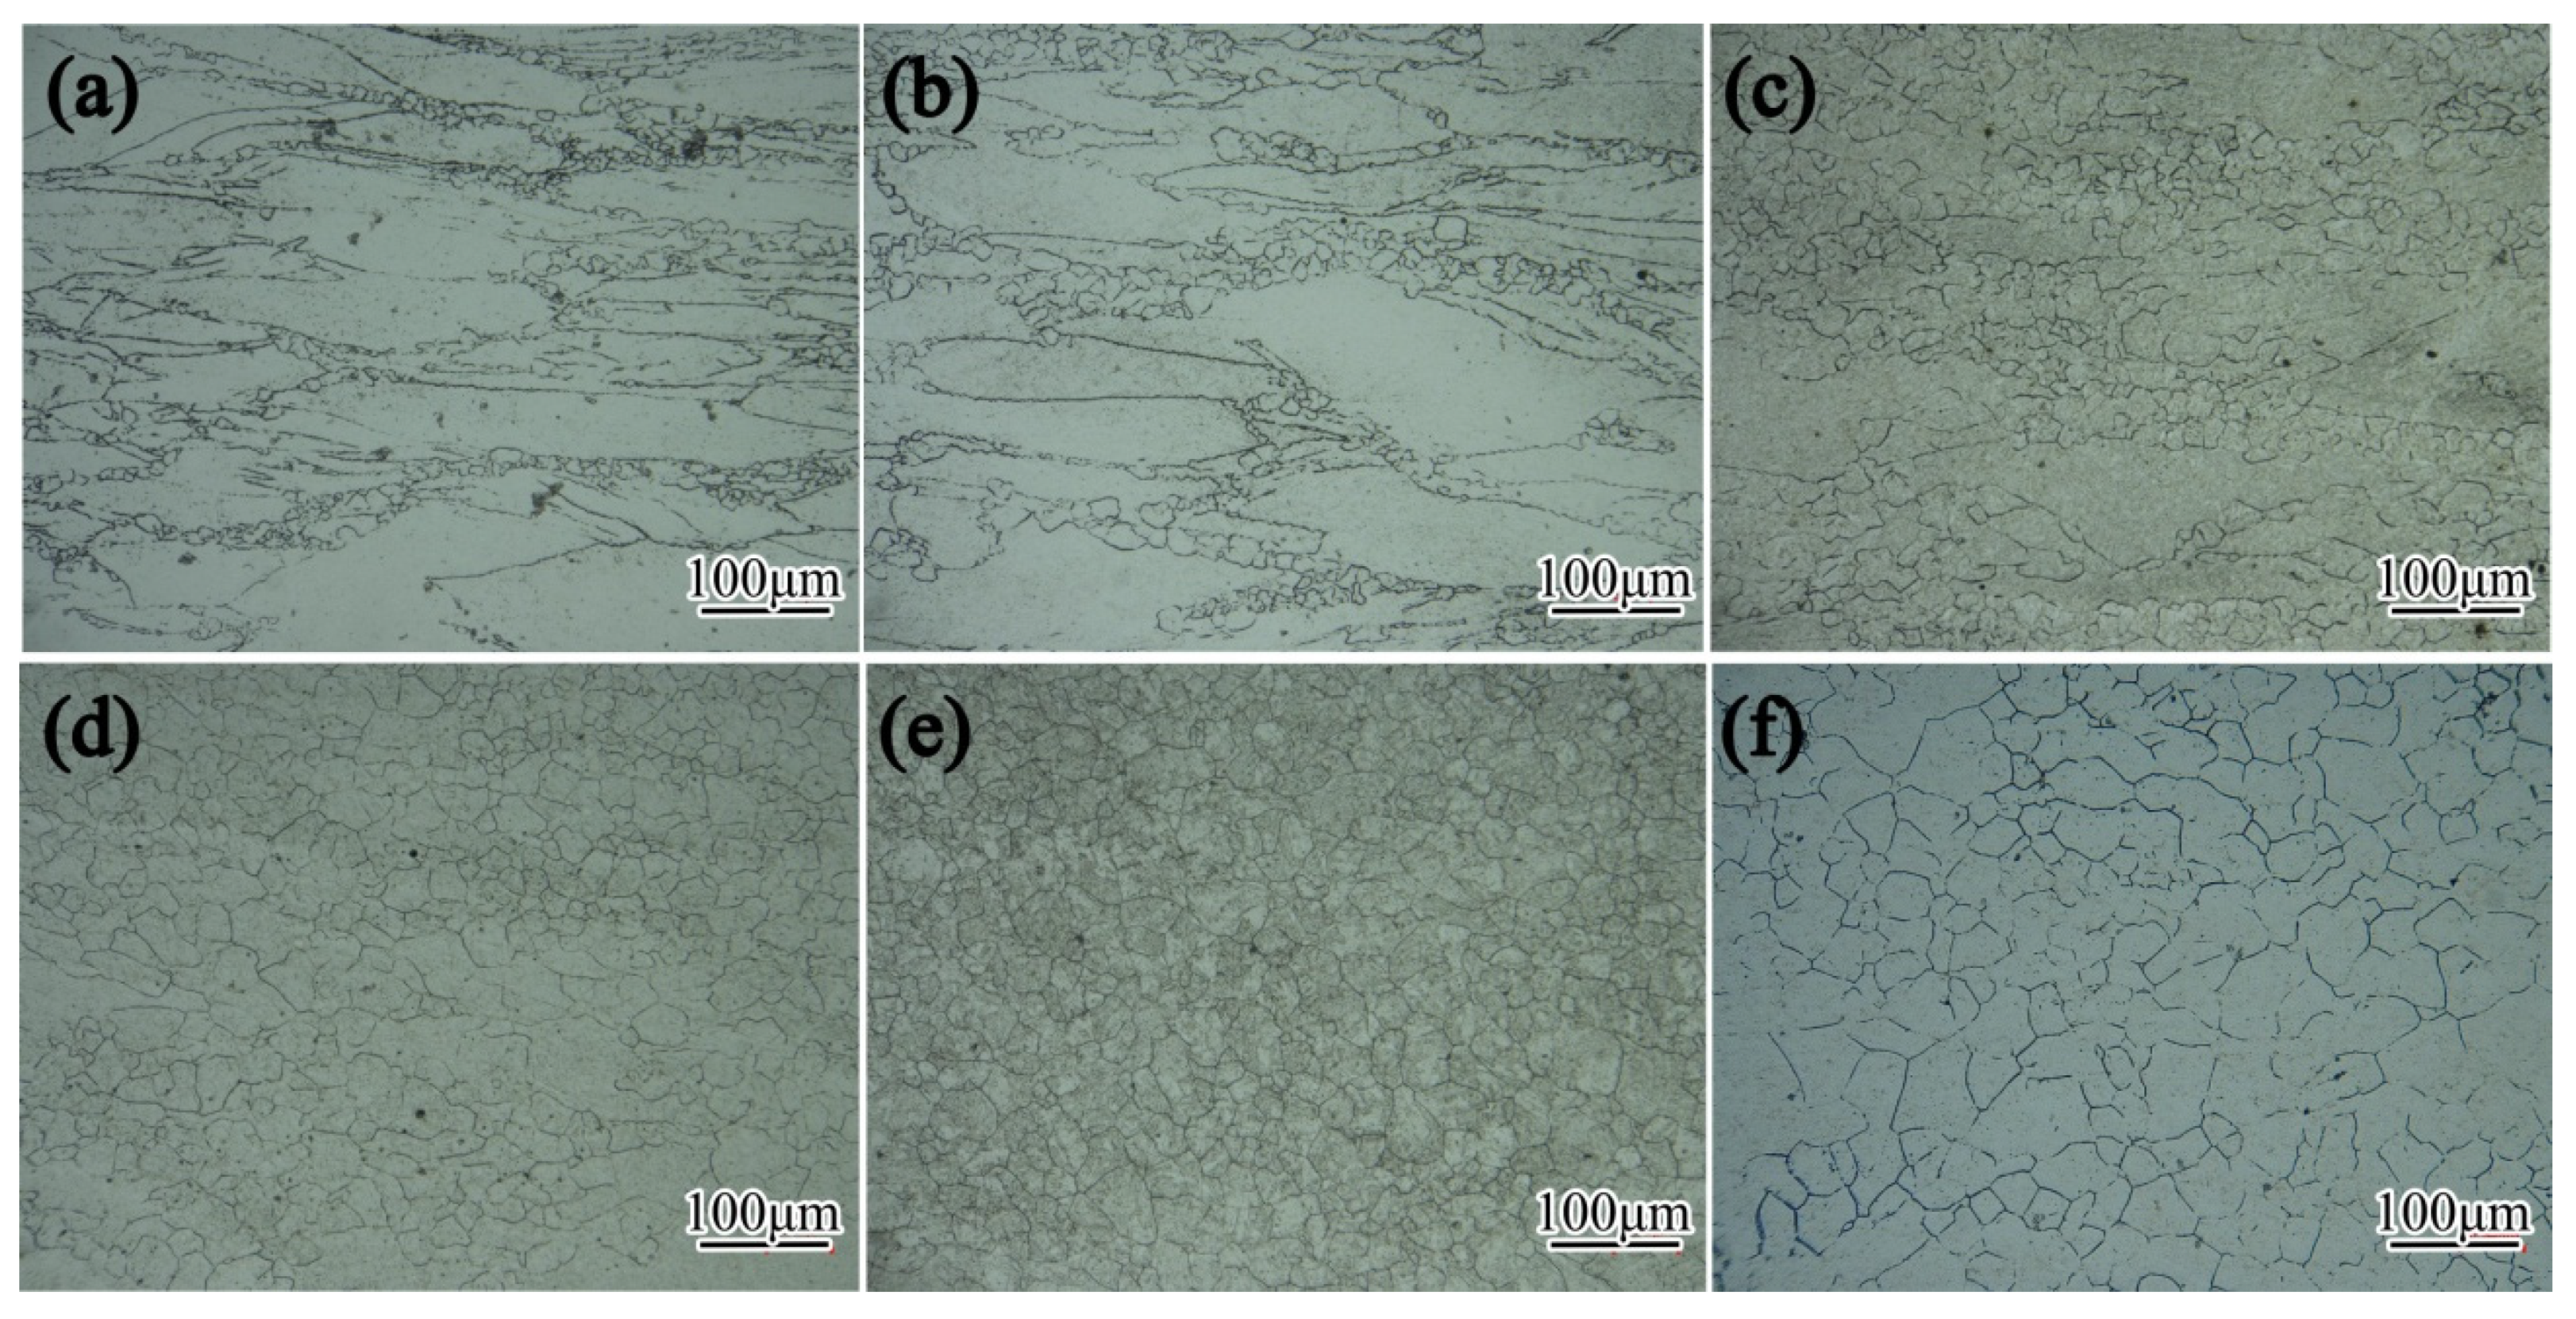
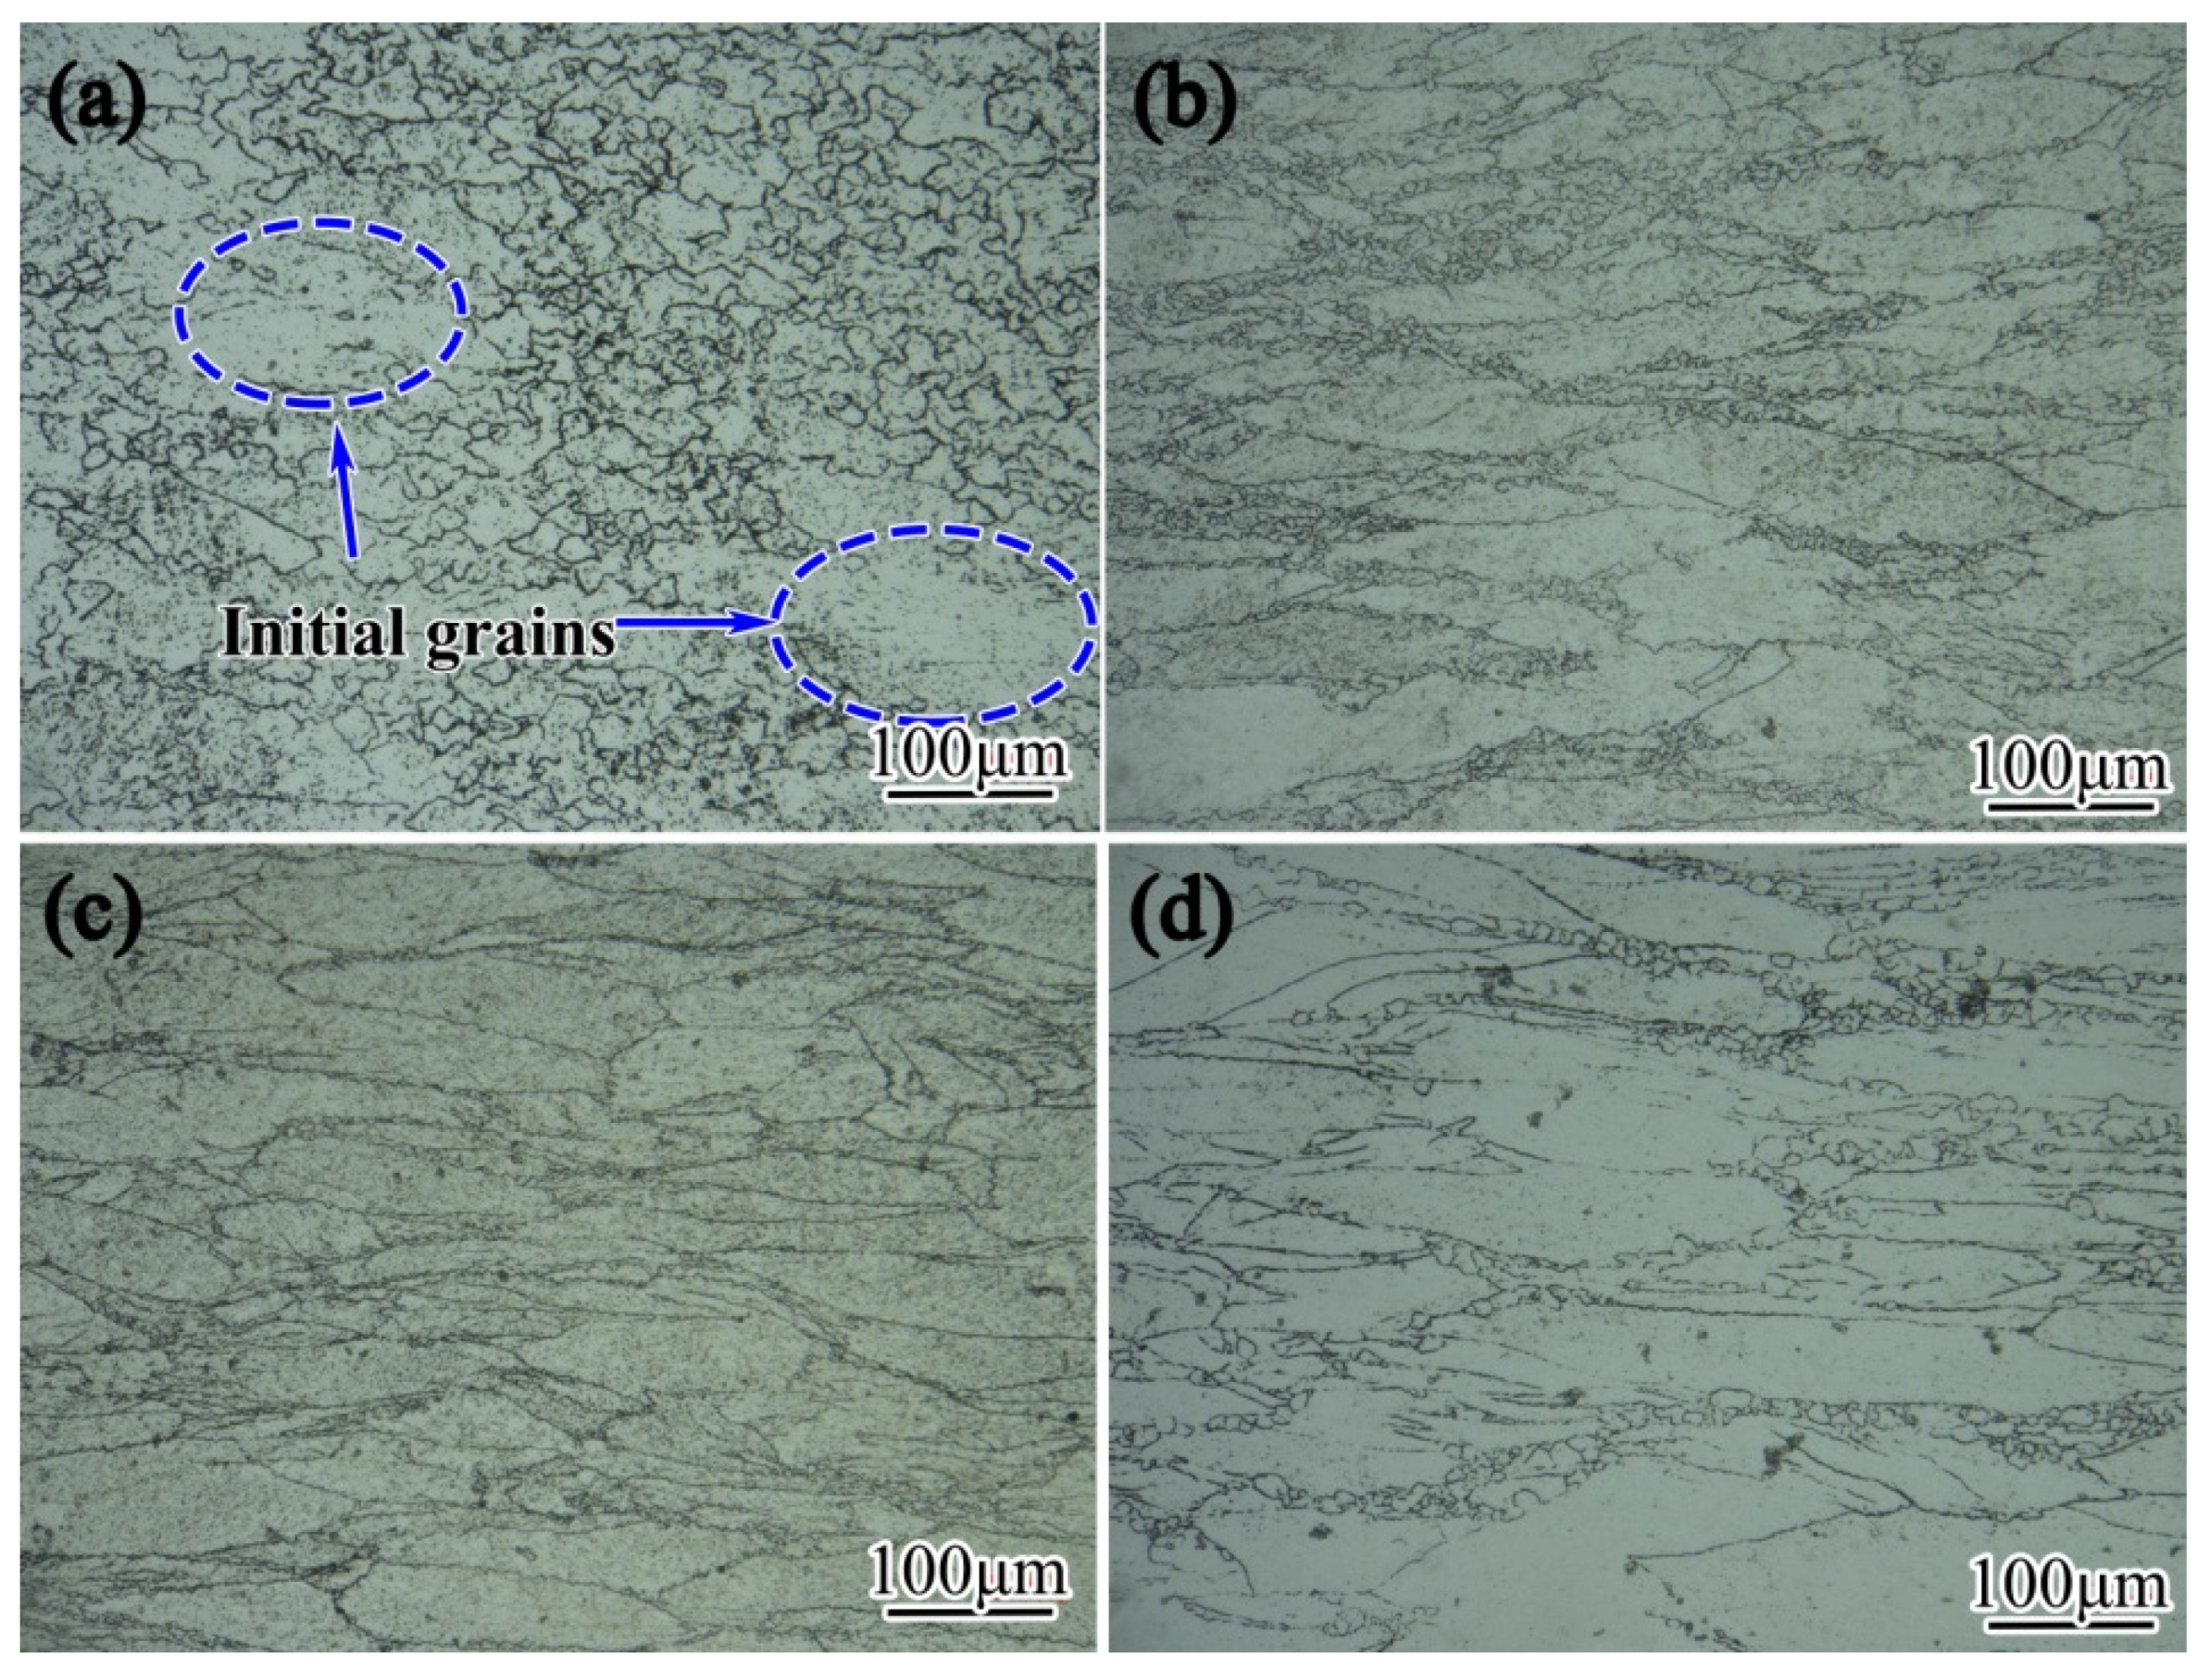
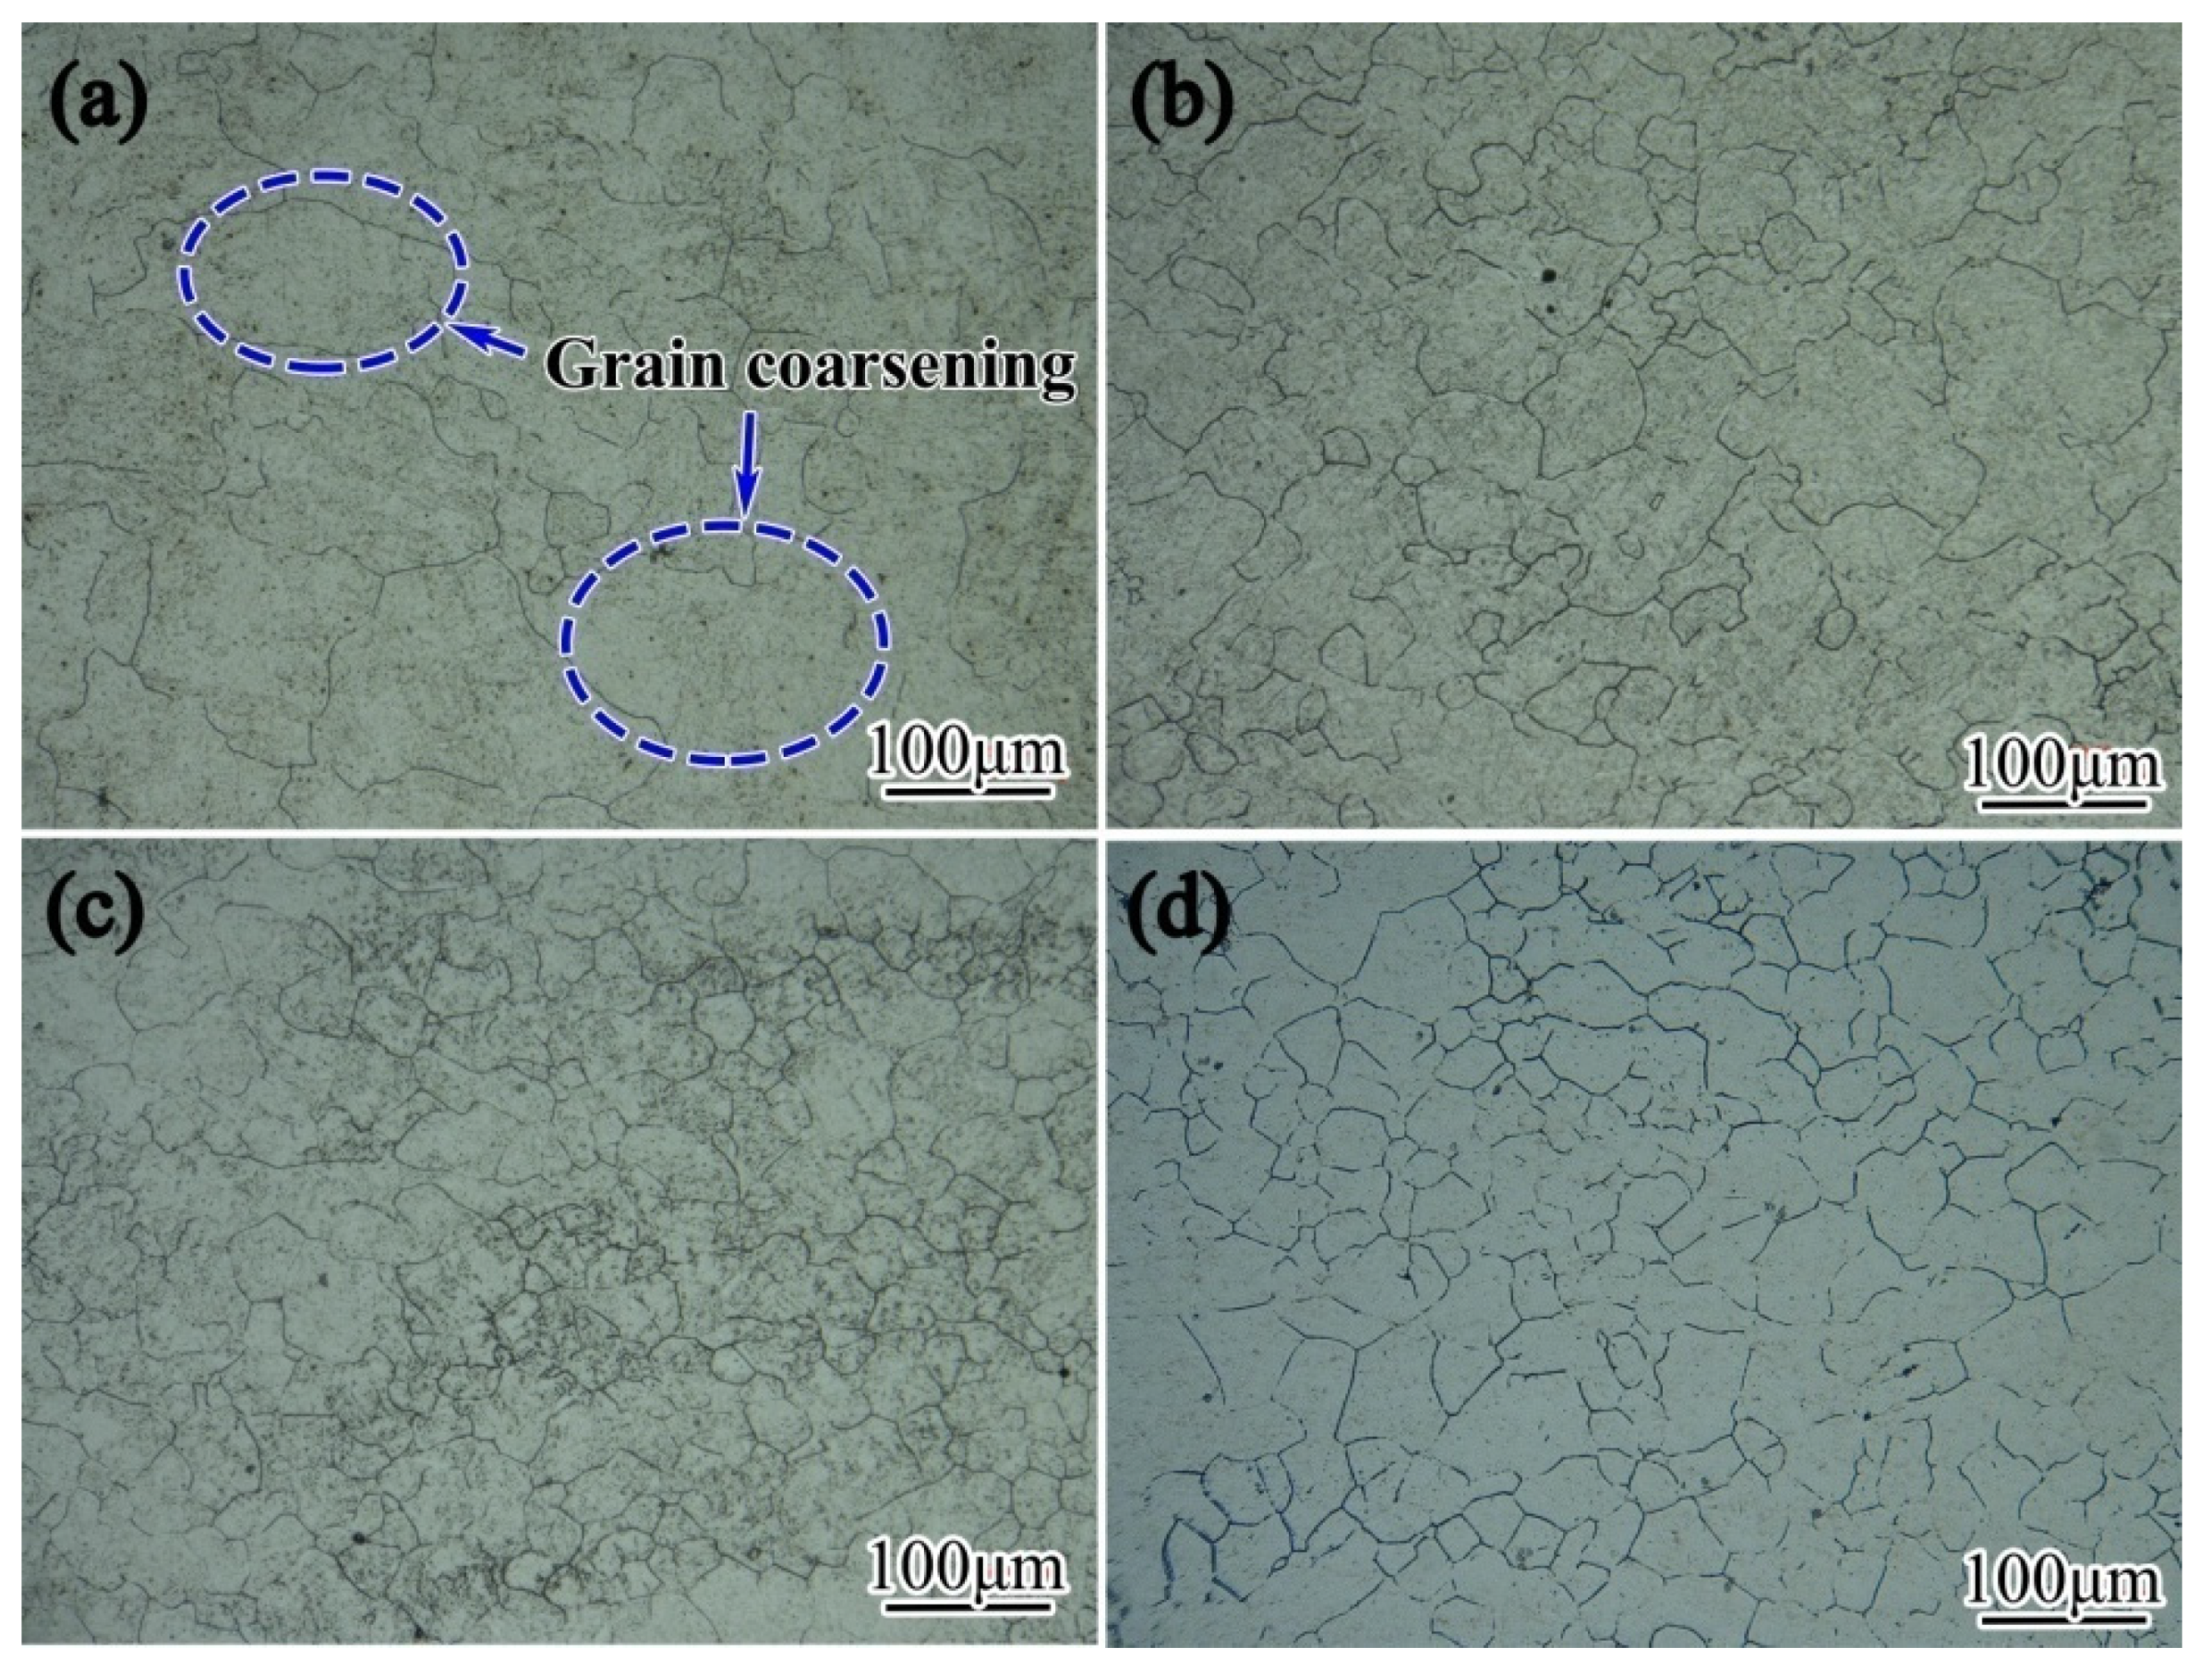
3.2. Microstructure Evolution

In order to investigate the effect of temperature on microstructure evolutions of 300M steel, the microstructures of deformed specimens at various temperatures (900–1150 °C), at two strain rates (0.01 s−1, 10 s−1), and at the strain of 0.95 were observed on the optical microscope, shown in Figure 3 and Figure 4. At 0.01 s−1, a great number of fine grains nucleated at curved boundaries of the coarse initial grains at 900 °C, as shown in Figure 3a, because the high dislocation densities at the grain boundaries were beneficial for recrystallization. However, the dislocation density inside the initial grains was comparatively lower, resulting in incomplete recrystallization microstructures. The coarse initial grains disappeared when the temperature increased to 1000 °C, as shown in Figure 3b,c, due to full recrystallization. Moreover, grains were gradually coarsened with increasing temperature, as shown in Figure 3a–f, which were also shown in the literature [10,14,15]. Under lower temperatures and higher strain rates, grain coarsening was inhibited, and the effect of grain refinement caused by dynamic recrystallization was more obvious. However, under higher temperatures and lower strain rates, the recrystallized grains grow rapidly once generated, and grain coarsening due to grain boundary curvature was dominant, resulting in coarse grains.
The microstructures of 300M steel compressed at 10 s−1 are shown in Figure 4. A mixed microstructure of fine recrystallized grains and coarse initial grains was obtained at 900–1000 °C, as shown in Figure 4a–c. With increasing temperature, a full recrystallized microstructure was formed at 1050–1150 °C, as shown in Figure 4d–f, and with increasing temperature, the average grain size increased. The mean grain boundary migration rate was less than 0.2 μm/s at 900–1150 °C according to a previous study [12], and under the strain rate of 10 s−1, the average grain size grew by 0.02 μm at most during the compression process, which was negligible compared with the average grain size (≥5 μm). Thus, the effect of grain coarsening due to grain boundary curvature could be neglected. The newly generated recrystallization grain size was not only temperature dependent, but also strain rate dependent. The lower the strain rate, the longer it needed to reach the same strain and therefore the coarser the recrystallized grains. Moreover, it can be seen in Figure 4 that with the increase of temperature, the volume fraction of recrystallized grains increased gradually. That was due to the fact that at lower temperatures the deformation stored energy in the material was insufficient to overcome the energy barrier for recrystallization, and at higher temperatures, the recrystallization more easily occurred, resulting in a higher recrystallization volume fraction.
To investigate the influence of strain rate, the microstructures of deformed specimens at various strain rates (0.01, 0.1, 1, and 10 s−1), at two temperatures (900 and 1150 °C), and at the strain of 0.95 were observed on the optical microscope, shown in Figure 5 and Figure 6. At 900 °C, as shown in Figure 5, coarse initial grains were squashed, around which many fine recrystallized grains emerged, thus obtaining a mixture of fine recrystallized grains and coarse initial grains. It can also be seen that with increasing strain rate, the percentage of recrystallized grains and the average grain size decreased. This was because the nuclei formed near the grain boundaries due to high dislocation density, and when the strain rate was low, as shown in Figure 5a, the nuclei had enough time to grow, thus consuming the coarse initial grains, resulting in a higher volume fraction of the recrystallized grains and a larger average grain size. However, when the strain rate was high, as shown in Figure 5b–d, the nuclei did not have enough time to grow, and the nuclei continuously formed near grain boundaries, leading to the “package” of many small nuclei near grain boundaries.
The microstructures of 300M steel compressed at 900 °C are shown in Figure 6. At the temperature of 1150 °C, the recrystallization was completed. With increasing strain rate, the grain size gradually became smaller, because the recrystallized grains had less time to grow, which was also found in the literature [19,20,21]. The results in Figure 5 and Figure 6 could explain the different flow behaviors of 300M steel at 0.01 s−1 and 10 s−1 in Figure 2. At 10 s−1, the overall volume fraction of recrystallized grains was not high. Dynamic recovery dominated, and therefore, it showed monotonically increasing type stress–strain curves. While at 0.01 s−1, the dynamic recrystallization was completed, as shown in Figure 6, and dynamic recrystallization dominated. Thus, it showed single-peaked type stress–strain curves. The dynamic recrystallization kinetic model and the average grain size model have been established by the authors previously [10]. The incomplete recrystallization was due to insufficient thermal activation at lower temperatures. By increasing the deformation temperature, reducing the strain rate, or increasing the strain, the recrystallization volume fraction can be increased.
Since almost all austenite grains transformed to small martensite laths during quenching, reconstructing the orientation relationship of austenite before quenching by ex situ characterizations on electron backscattered diffraction (EBSD) or transmission electron microscope (TEM) is very hard, although the orientation relationship of austenite and transformed martensite laths has been studied in several research works [22,23,24]. Traditional ex situ metallographic observation on the optical microscope, or in situ observation on the high temperature confocal laser scanning microscope, is still the most effective way to study the microstructure evolutions of 300M steel during compression. To compare with the results of traditional metallographic observation on the optical microscope, in situ compression tests were carried out at 1100 °C and 0.01 s−1. The photos taken by the microscope at the strain of 0, 0.1, 0.2, 0.3, 0.4, 0.5, and 0.9 are shown in Figure 7a–g. It can be seen in Figure 7a that equiaxed grains were obtained after four minutes’ holding at 1200 °C. When the deformation started, the dark areas at grain boundaries became larger and larger, as shown in Figure 7b–g. That was because the observed surface of the specimen became rough, resulting in a decreased light reflectivity. The merged graph of Figure 7a–f is shown in Figure 7h to represent the microstructures at various strains. With increasing strain, the grains became finer and finer due to the crush of initial grains and dynamic recrystallization. Although the in situ observation results in this research only provide qualitative information about the recrystallized grain size or recrystallization kinetics, it is still very important to observe the grain evolution process of 300M steel in thermal compression, and this is one of the few attempts that have succeeded in observing the grain evolution of steel during high temperature compression in recent years.

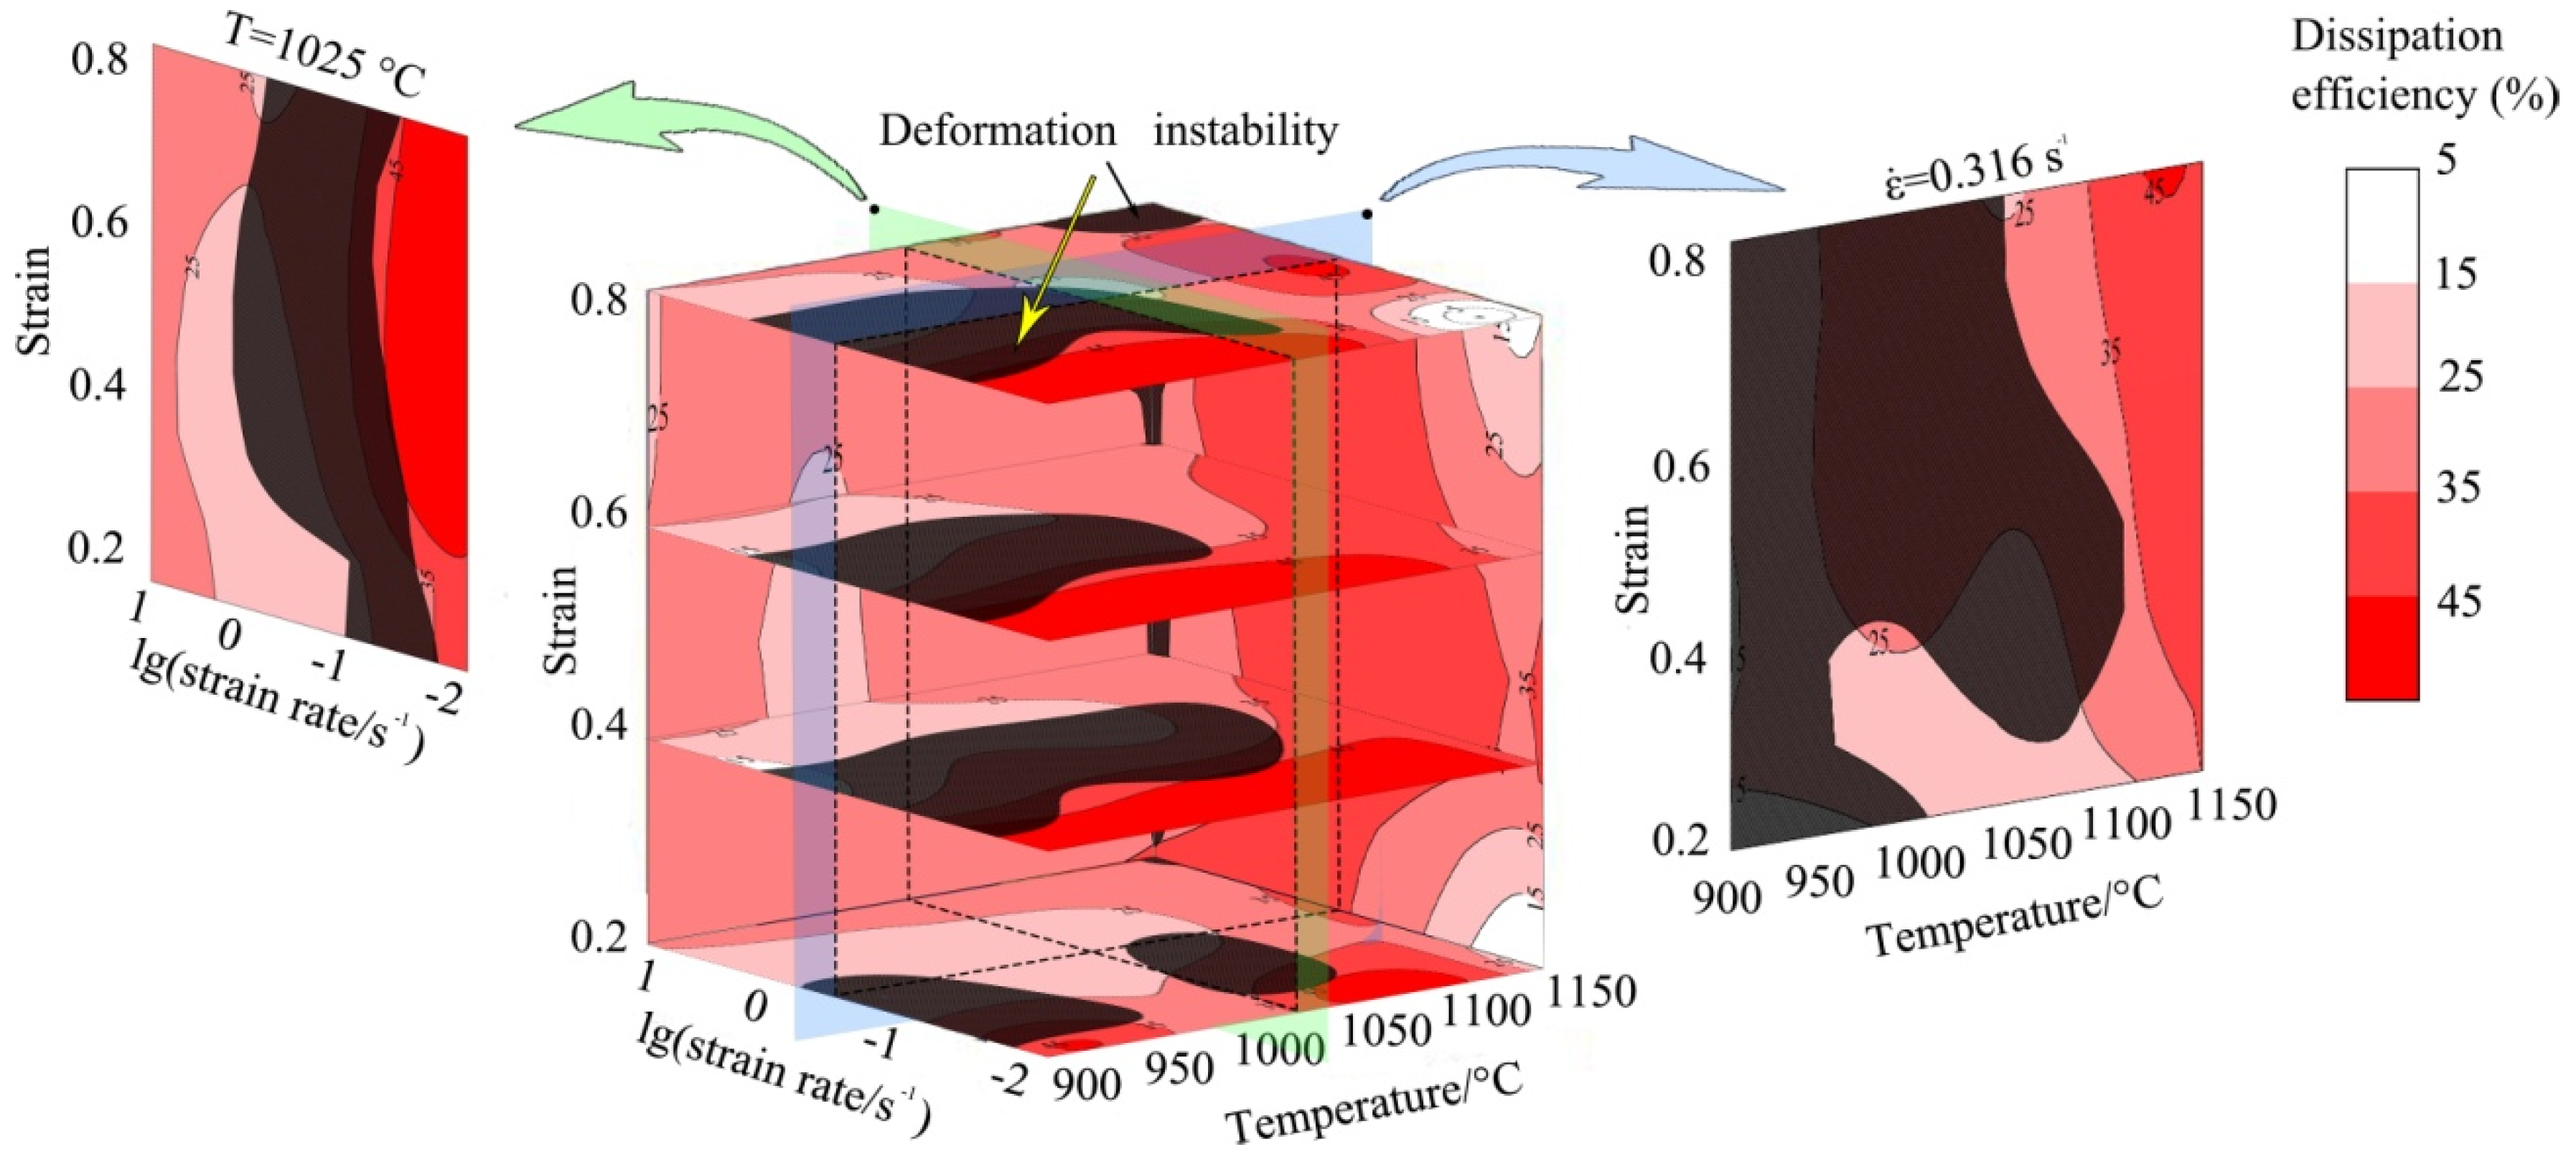
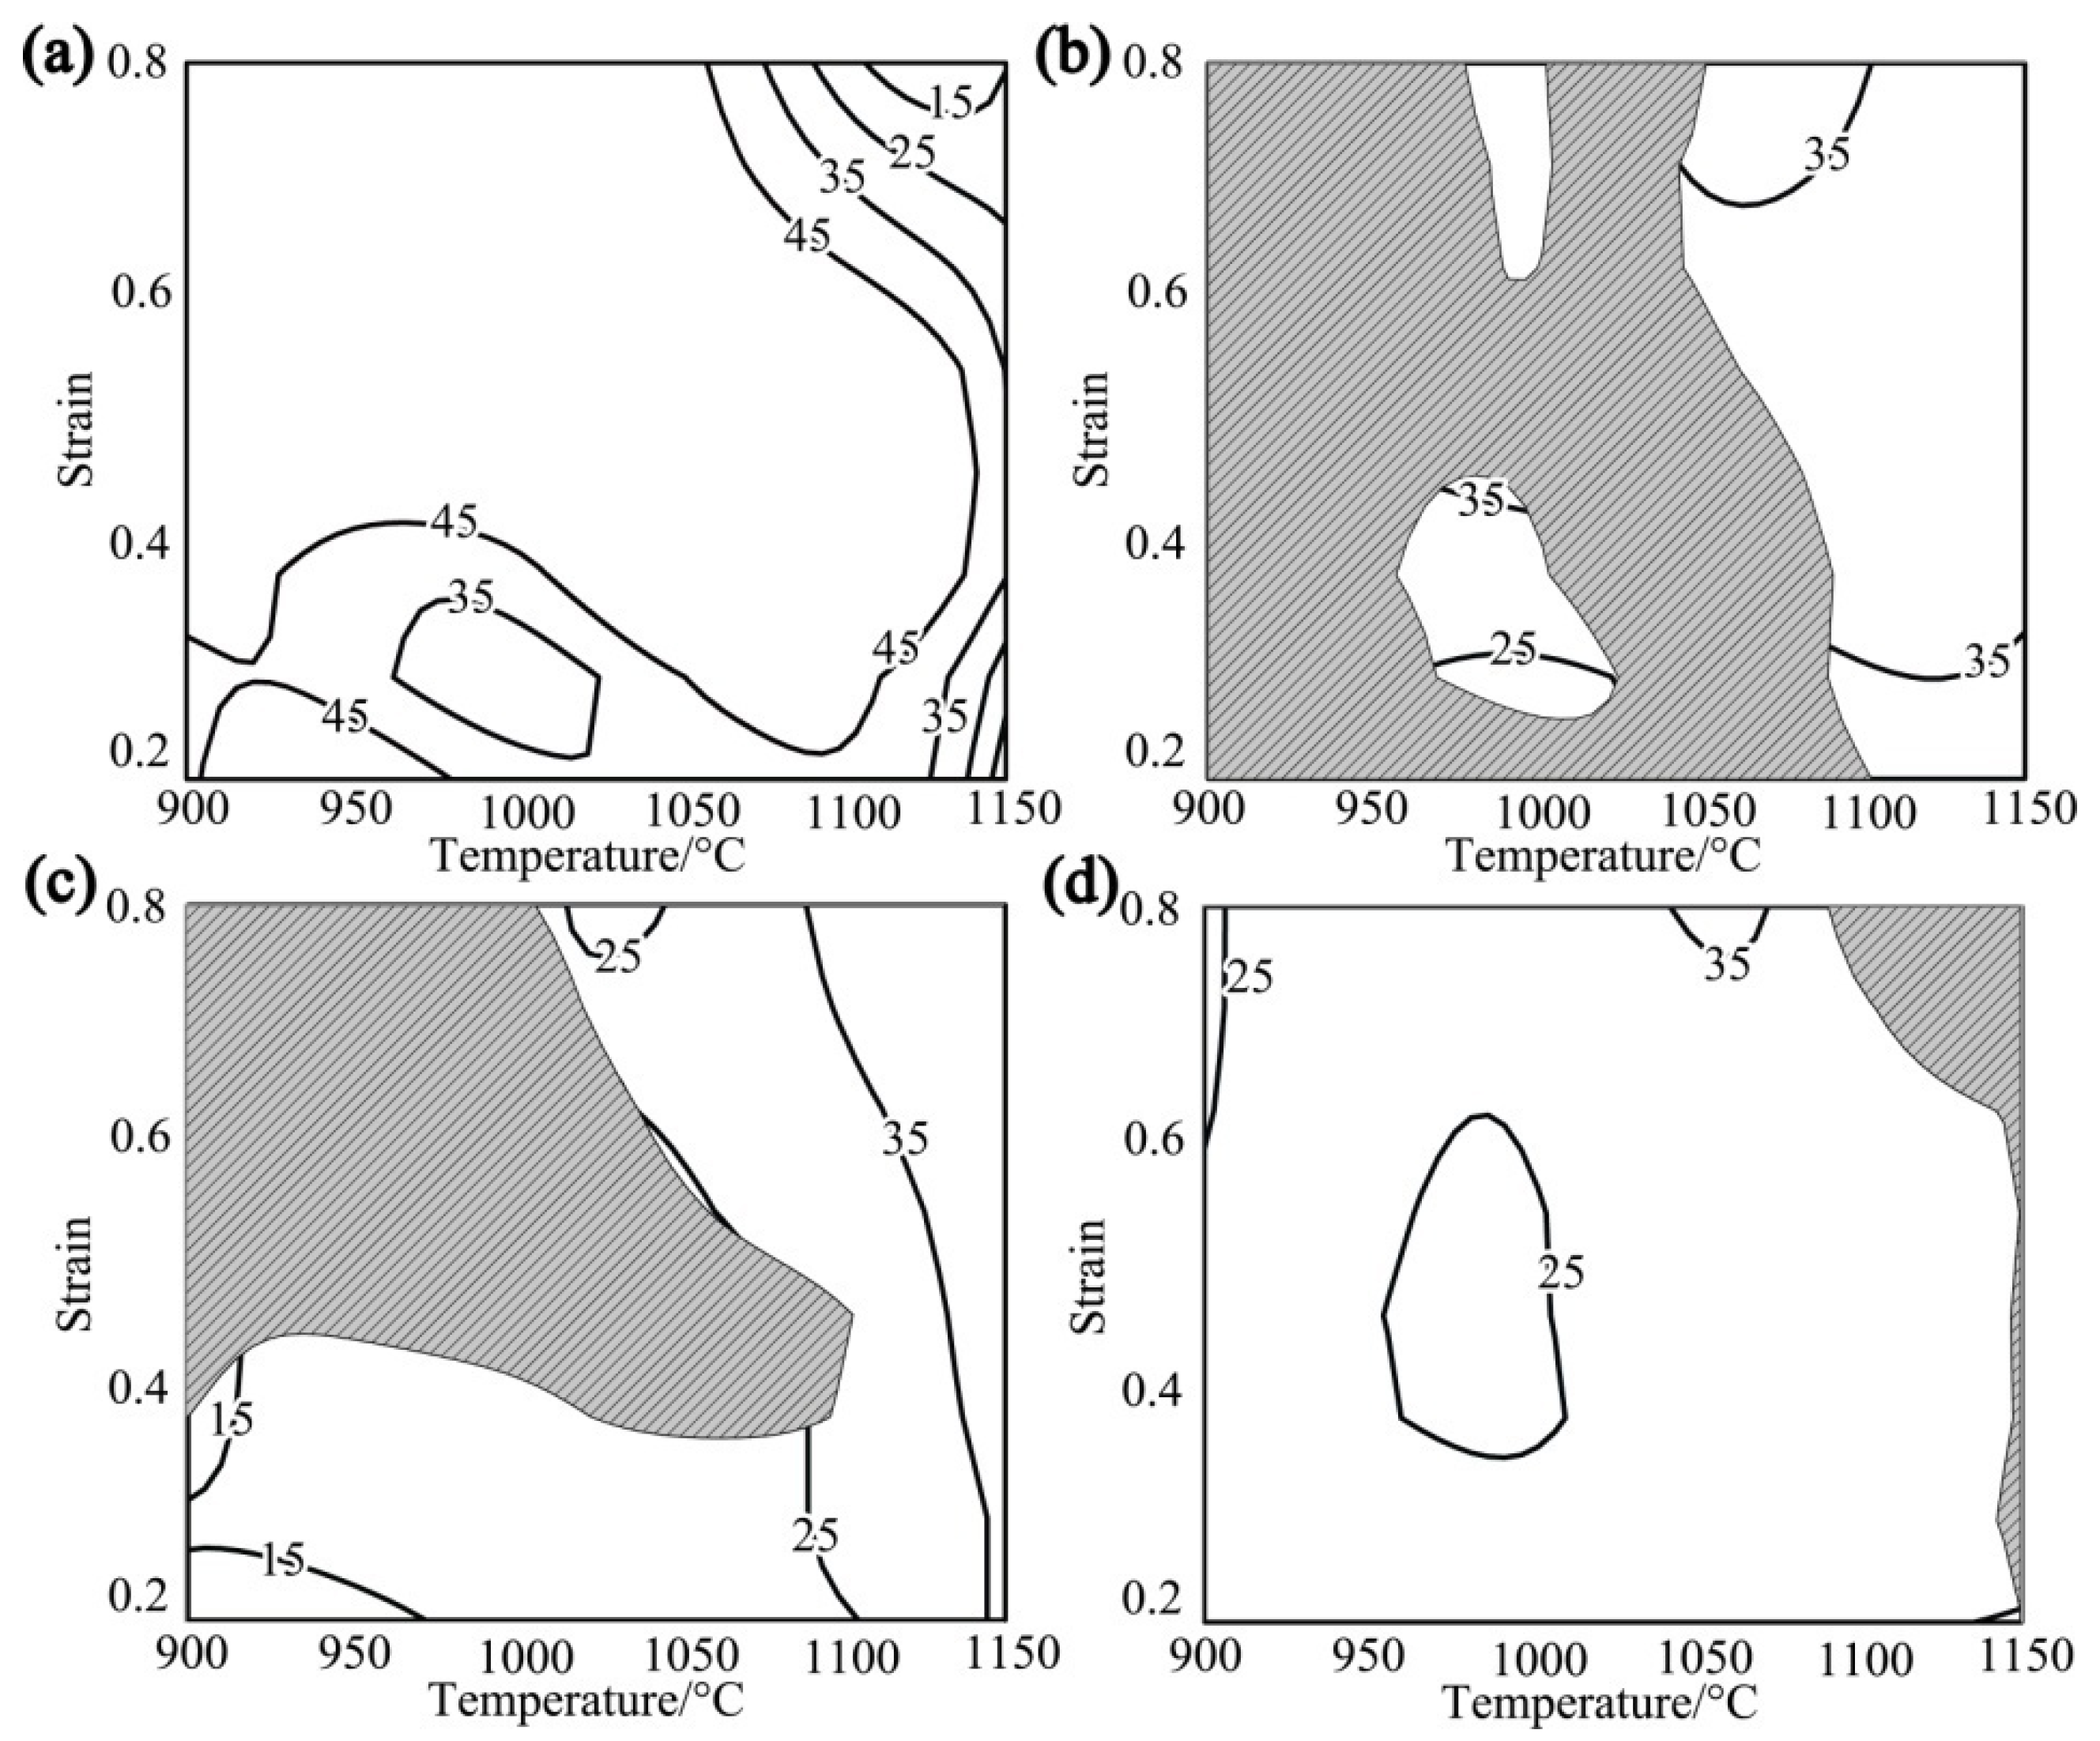
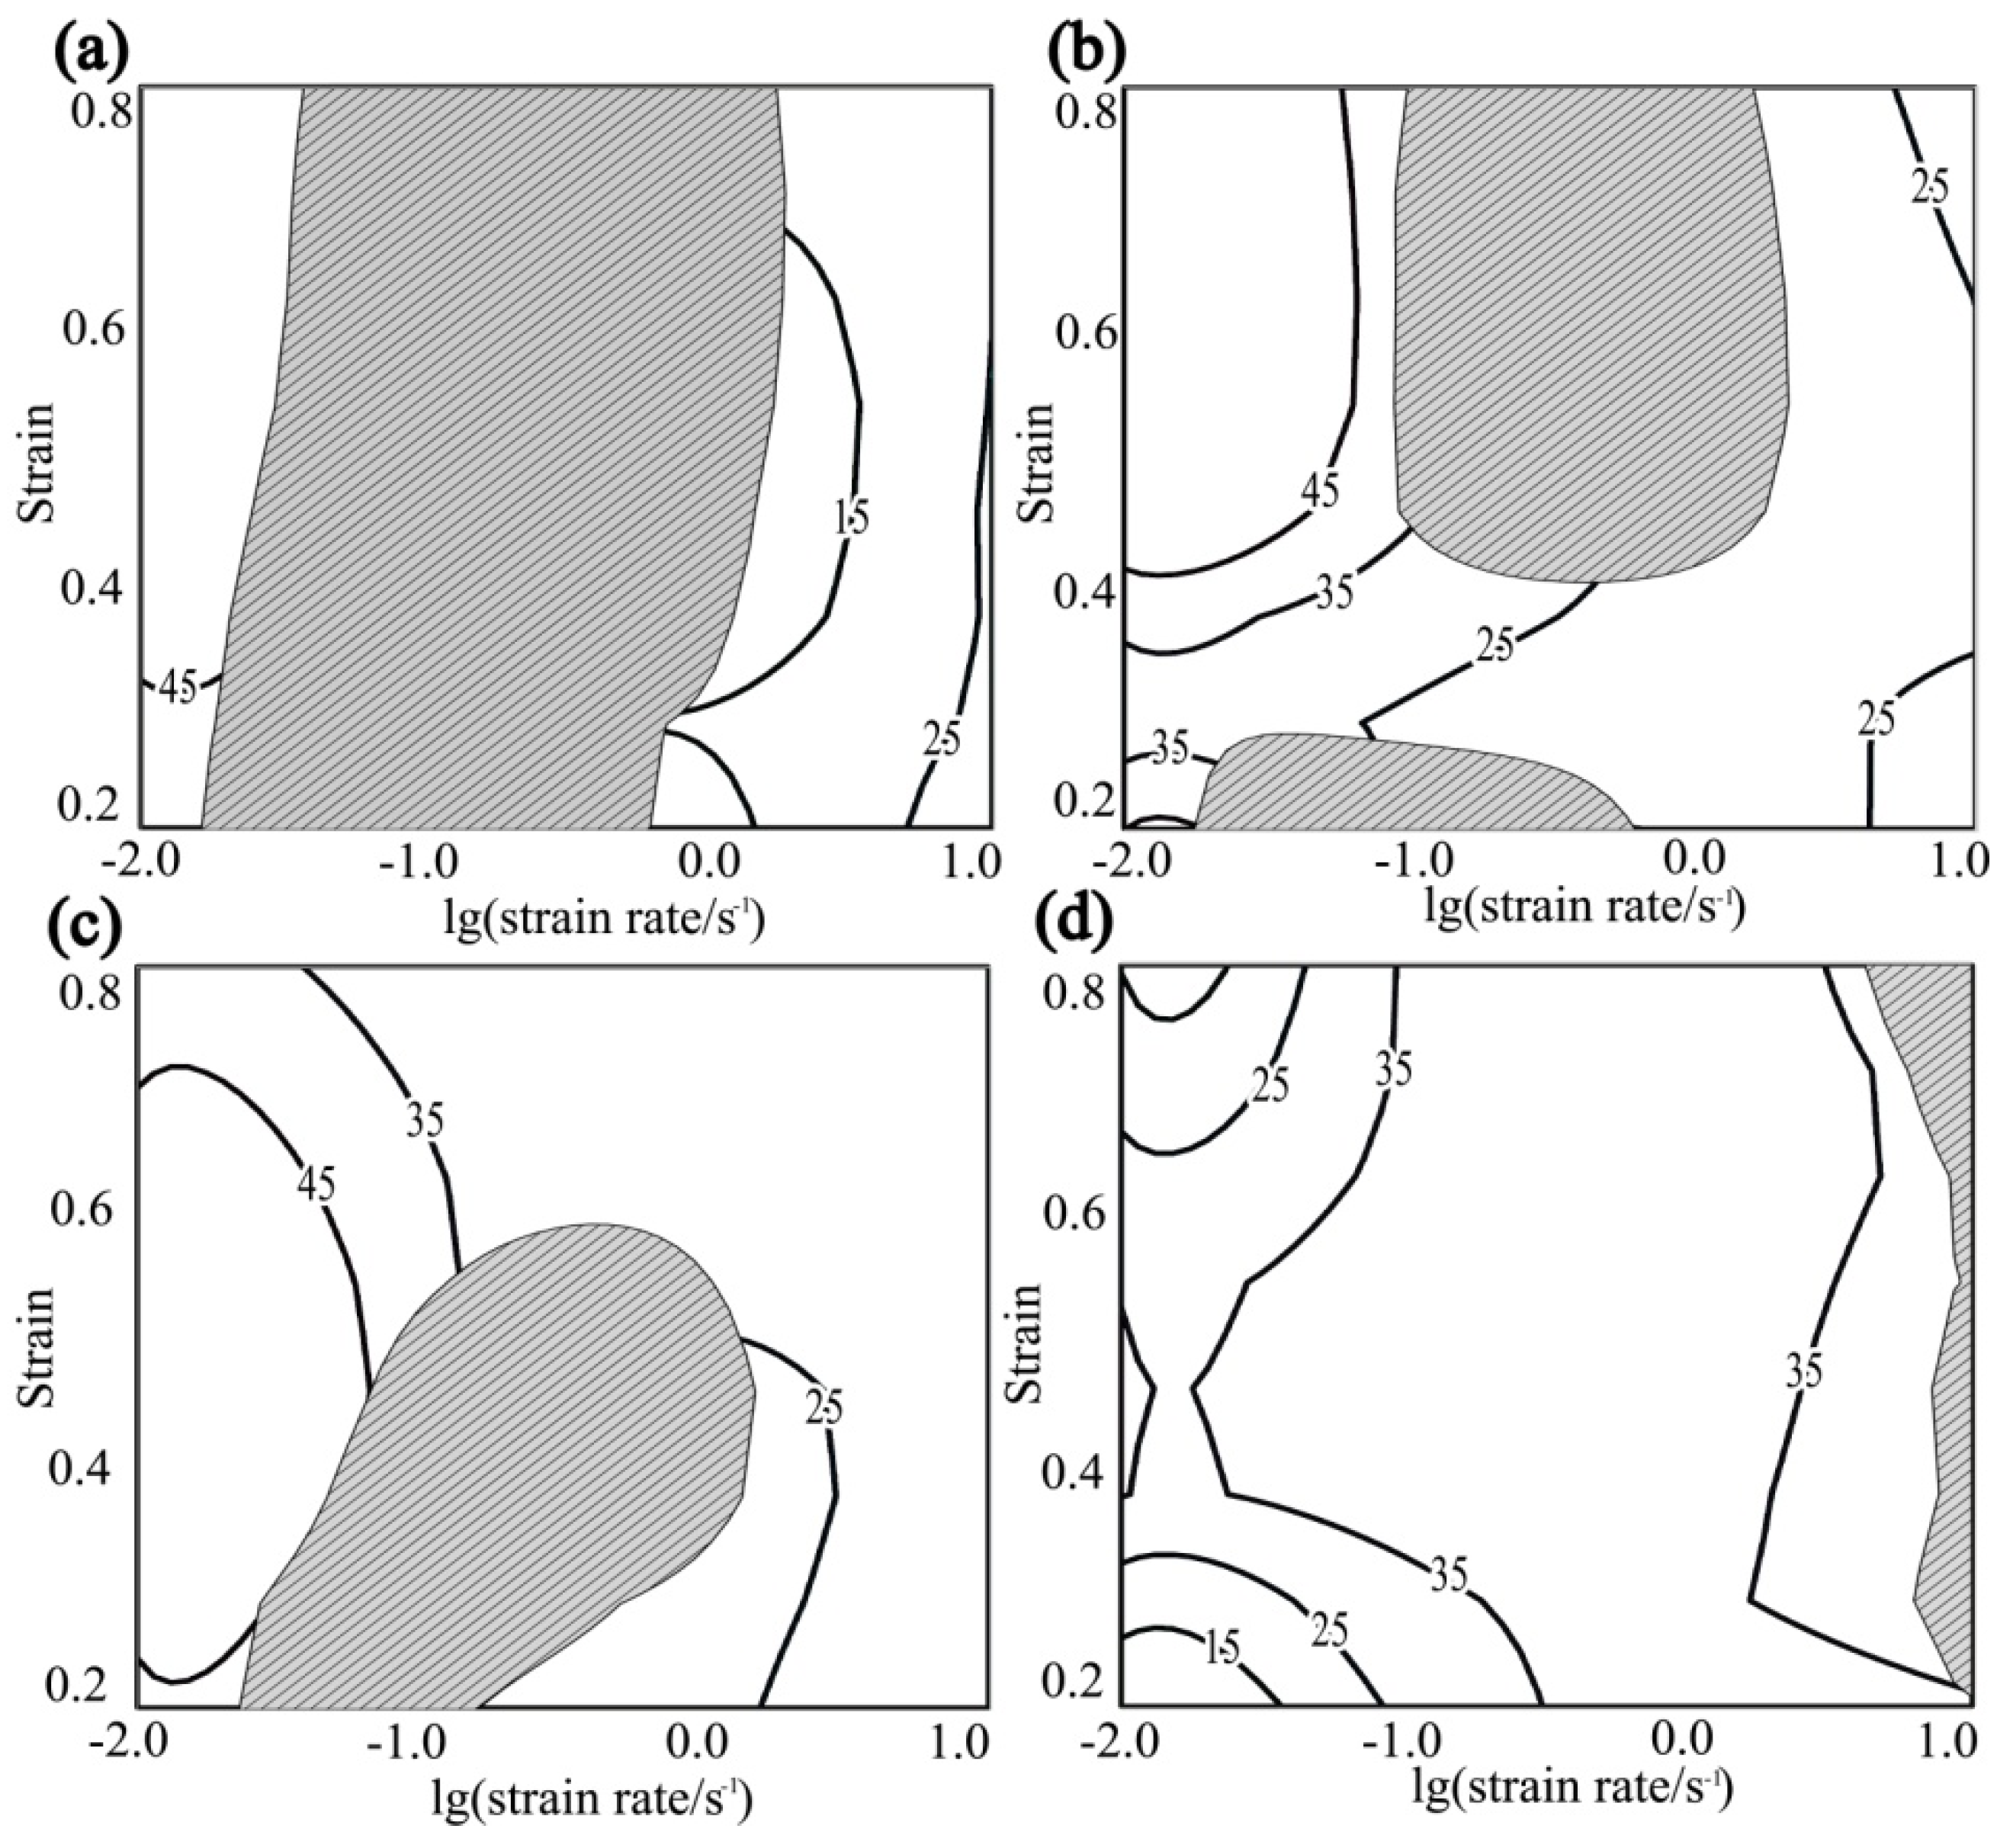
3.3. Hot Working Map

The metallographic results showed that under higher temperatures or lower strain rates, recrystallization was more likely to complete, which was very beneficial to obtain uniform microstructures, but meanwhile, grain coarsening was also likely to more easily to occur, which was undesirable for industrial applications. Thus, a thermal processing map may facilitate the selection of process parameters to obtain uniform, small recrystallization microstructures. Previous studies have focused only on the relationship between average grain size and thermal processing map, but the influence of the dynamic recrystallization volume fraction on processing maps of 300M steel has not been systematically investigated. Besides, the optimal strain rate should not be too narrow to avoid difficulty in practical application [7], and an undesirable mixed grain defect was found under current suggested hot working conditions [8], as shown in Figure 5b,c. Therefore, the processing maps at different temperatures, strain rates, and strains were established. The influences of average grain size and dynamic recrystallization volume fraction were systematically investigated.
Seeing forgings as isolated systems whose input energy was the deformation work, and output energy was the consumption by temperature rising and microstructure evolution, the input energy (P) was calculated by [25]
P = G + J = 0 ε ˙ σ   d ε ˙ + 0 σ ε ˙ d σ
where G was the energy consumption by temperature rising, and J by microstructure evolution. The variables of σ , ε , and ε ˙ denoted stress (MPa), strain (1), and strain rate (s−1), respectively. The power dissipation coefficient (η) representative of the fraction of energy consumption by microstructure evolution was expressed as
η = 2 l n σ l n ε ˙ l n σ l n ε ˙ + 1 .
The instability coefficient (ζ) evaluating the deformation instability was calculated by
ζ = log ( η / 2 ) log ( ε ˙ ) + l n σ l n ε ˙ .
The stresses at various strains could be obtained via thermal compressions, and the processing maps of 300M steel were established according to Equations (2) and (3) and are shown in Figure 8. The processing maps at various strains are shown in Figure 9. The contours show the value of the power dissipation coefficient, and the shaded areas show the parameters under which deformation instability occurred. It can be seen that two deformation instability domains existed. One located at 0.03–0.7 s−1, 900–1100 °C, and 0.2–0.8 (strain). The other located at 3.2–10 s−1, 1100–1150 °C, and 0.2–0.8. Representative microstructure of the two instability domains are shown in Figure 5b and Figure 6a. It can be seen that incomplete recrystallization and grain coarsening occurred, respectively. The average dissipation coefficient of these two instability domains were in the range of 15–25%, indicating that a comparatively large part of deformation work was converted to heat, while a small part was consumed by microstructure evolution. It can also be seen from Figure 8 and Figure 9 that two high dissipation coefficient domains existed. One located at 0.1–3 s−1, 1100–1150 °C, and 0.4–0.8. The other located at 0.01–0.06 s−1, 900–1100 °C, and 0.2–0.6. Representative microstructure of the two high dissipation coefficient domains are shown in Figure 6c and Figure 3c. It can be seen from the microstructure photos that recrystallization was completed. The average dissipation coefficient of these two high coefficient domains were in the range of 35–45%, which was ideal for a uniform recrystallization microstructure.
Processing maps at specific temperatures and strain rates could be obtained by slicing and interpolating the 3D processing maps at specific temperatures and strain rates, shown in Figure 10 and Figure 11. It can be seen from Figure 10a that at 0.01 s−1, a stable deformation domain with the dissipation coefficient of 35–45% could be obtained. Typical microstructures of this domain are shown in Figure 3a–f. However, the instability domain occupied most parts of the hot working maps at 900–1100 °C when the strain rate increased from 0.1 to 1 s−1, as shown in Figure 10b,c, indicating that incomplete recrystallization and localized material flow may be the reason. The instability domain at 900–1100 °C disappeared when the strain rate further increased to 10 s−1, as shown in Figure 10d, and the dissipation coefficient was around 25%, meaning that incomplete dynamic recrystallization took place, as shown in Figure 4a–e. Metallographic observation results in Figure 5b,c proved that incomplete recrystallization and mixed grain defect occurred. Thus, for the 300M steel, it is easier to obtain a full recrystallization microstructure at 0.01 s−1, while at 10 s−1 incomplete recrystallization was obtained. At a moderate strain rate (0.1–1 s−1), the deformation temperature should be above 1100 °C.
The processing maps at various temperatures are shown in Figure 11. As shown in Figure 11a, a deformation instability domain at 0.016–1.3 s−1 was found at 900 °C. Representative microstructures are shown in Figure 5a–c. It could be explained that at a lower temperature (~900°C), it was difficult to overcome the energy barrier of dynamic recrystallization, and the material mainly underwent incomplete recrystallization and localized flow, so most energy was converted to heat, resulting in a low dissipation coefficient of ~15%. It is shown in Figure 11b that the deformation instability domain was separated into two parts. One part located at the strain rate range of 0.016–0.71 s−1 and strain range of 0.2–0.3, and the other at 0.08–0.5 s−1 and 0.4–0.8. The size of deformation instability domain shrank in the strain rate range of 0.02–1 s−1 and strain range of 0.2–0.6 at the temperature of 1100 °C, as shown in Figure 11c.
It was worth noting that at 1000–1100 °C, as shown in Figure 11b,c, a high dissipation coefficient domain (≥35%) existed in the strain rate range of 0.01–0.063 s−1 and in the strain range of 0.4–0.8, indicating that an optimal microstructure (similar to Figure 11c–e) could be obtained due to dynamic recrystallization. When the deformation temperature further increased to 1150 °C, as shown in Figure 11d that the deformation instability domain located in the high strain rates region (~10 s−1), and the dissipation coefficient was around 35% in the strain rate range of 0.01–3.2 s−1 and strain range of 0.2–0.8. Comparing the results of Figure 11a–d, it was found that a smaller deformation instability domain was obtained at a higher deformation temperature. Therefore, in order to obtain a fine and uniform microstructure, the hot working parameters were suggested at 0.1–3 s−1 and 1100–1150 °C.
The suggested hot working parameters in the present research is compared with the optimal parameters of 300M steel and 4340 steel in the literature, shown in Figure 12. It is worth mentioning that the optimal strain rate was not proposed in reference [1], thus the upper and lower boundaries of the strain rate were left empty. The optimal hot working parameter range in the present research was much smaller than the existing commercial recommendation by Speich et al. [1], and it has covered the parameter range by Luo et al. [7]. Besides, the 300M steel showed a different optimal hot working parameter range from 4340 steel due to the addition of silicon and vanadium, which on one hand has increased the thermal strength of steel, on the other, decreased the hot workability. In practical production of 300M steel forgings the optimal hot working parameters could be implemented by the deformation temperature selection, punch speed selection, and pre-forging shape designing. The optimal dissipation coefficient was between 35% and 40% according to previous research [26]. When the deformation temperature and the pre-forging shape was restrained, the punch speed curves could be continuously adjusted to ensure that the average dissipation coefficient was between 35% and 40%, and under such circumstances, the finite element simulation was beneficial for the optimization of punch speed curves.

4. Conclusions

The following conclusions can be drawn based on the present investigation.
(1)
Different shapes of flow stress curves were obtained at different strain rates, and the shape change was explained by microstructure observations. At 10 s−1, the overall volume fraction of recrystallized grains was not high. Dynamic recovery dominated, and therefore, it showed monotonically increasing dynamic recovery type stress–strain curves. While at 0.01 s−1, the dynamic recrystallization was completed, and dynamic recrystallization dominated. Thus, it showed single-peaked dynamic recrystallization type stress–strain curves.
(2)
In situ compression results showed with increasing strain, the grains became finer and finer due to crushing of initial grains and dynamic recrystallization. This investigation is one of the few attempts that has succeeded in observing the grain evolution of steel during high temperature compression in recent years.
(3)
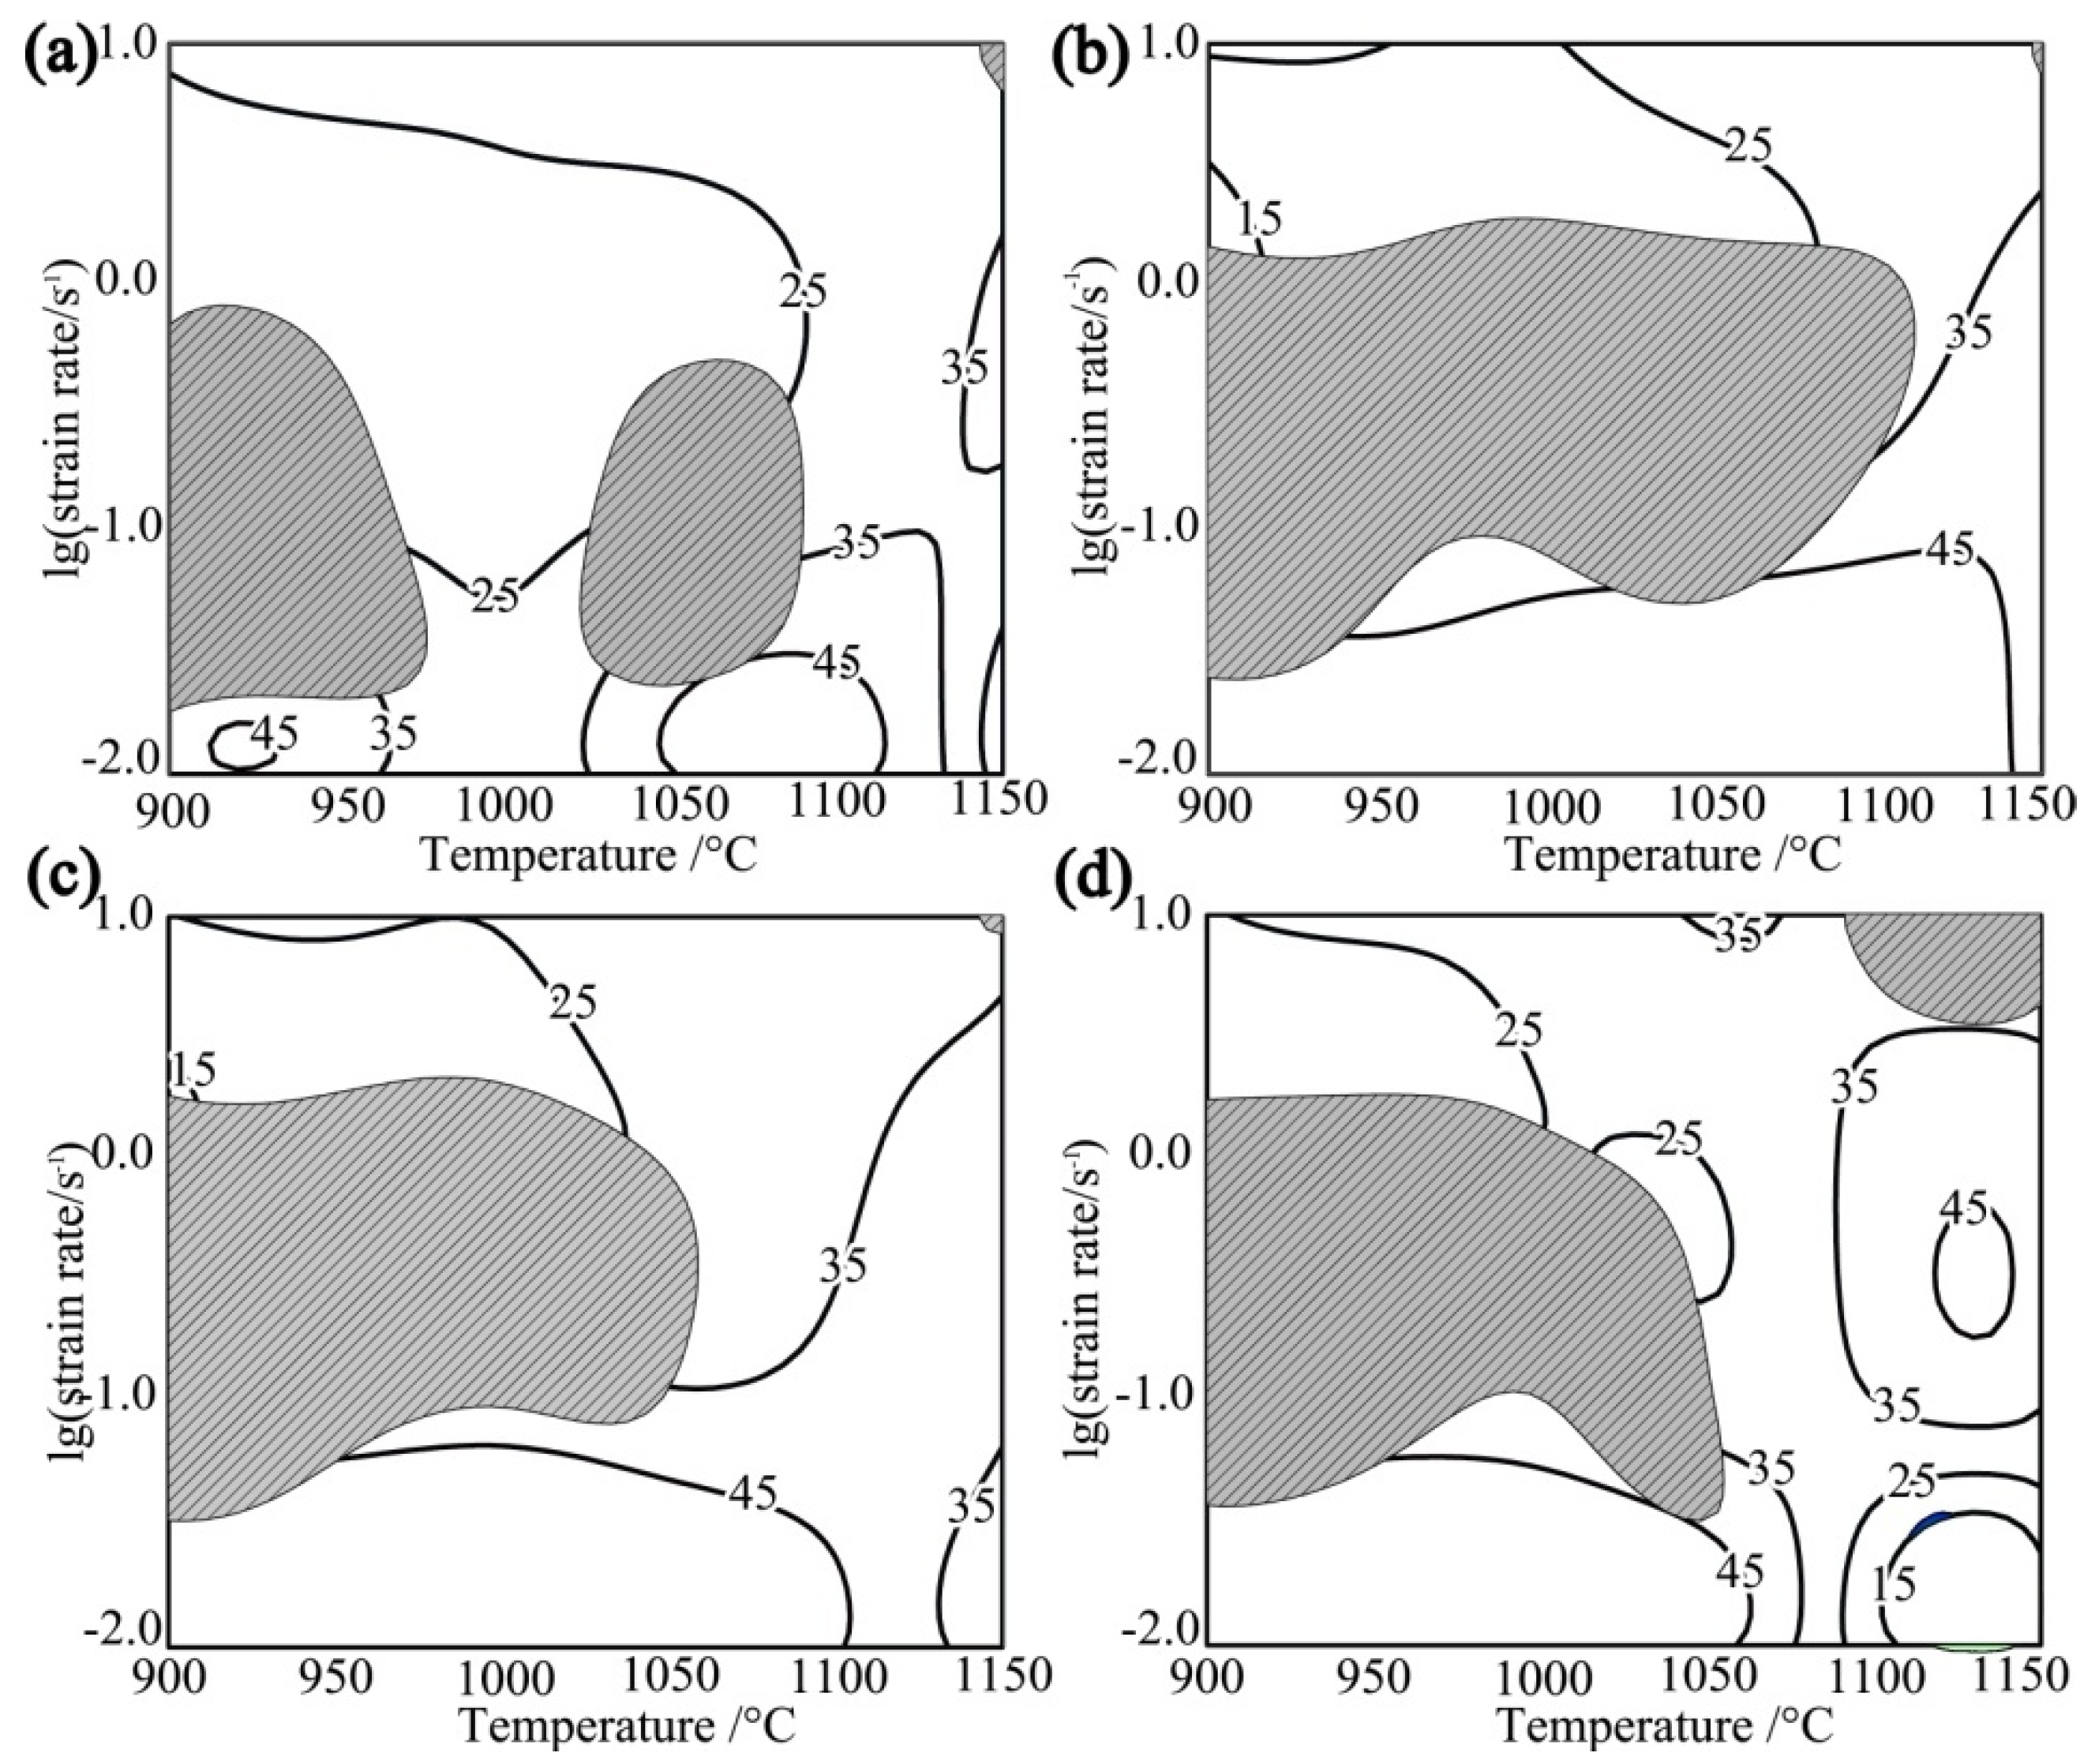
The hot processing maps were not only related to the recrystallized grain size, but also related to the volume fraction of recrystallized grains. The dissipation coefficients were comparatively higher at higher temperatures and slower strain rates, which was usually due to complete dynamic recrystallization and severe grain growth. While at lower temperatures and higher strain rates, the dissipation coefficients were low, incomplete recrystallization and mixed grain defect occurred.
(4)
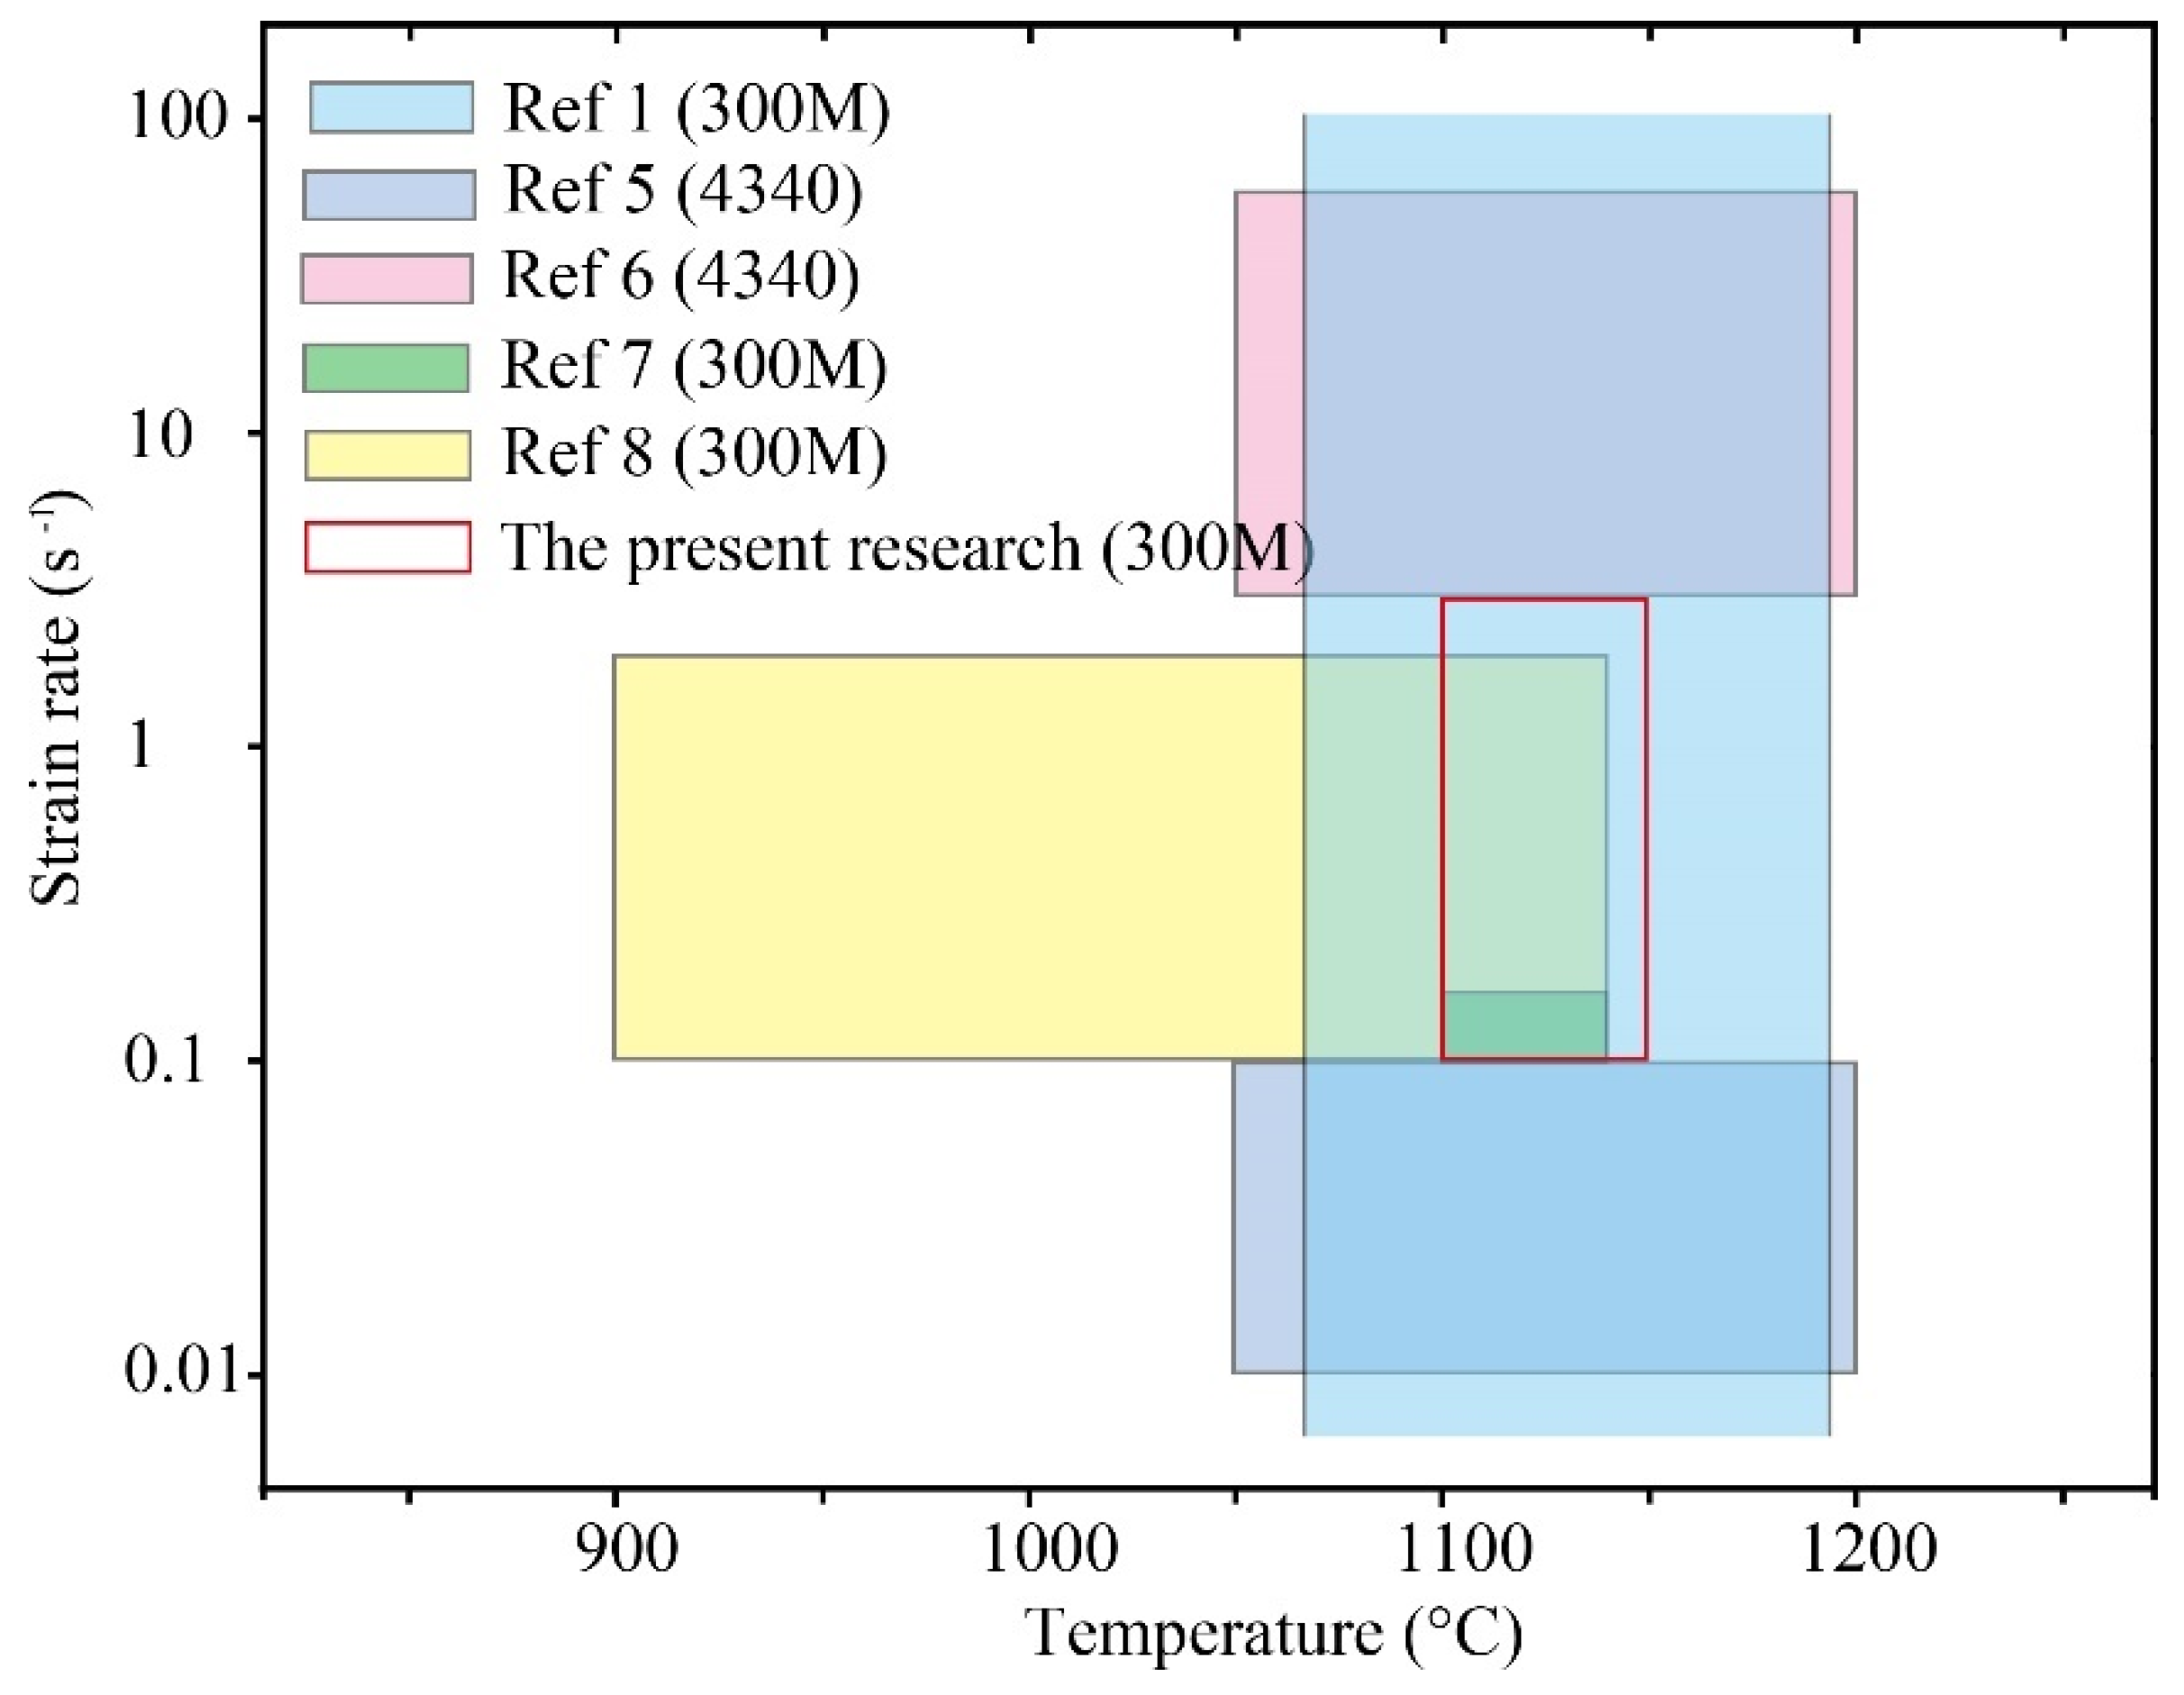
The optimal working parameters were suggested at 0.1–3 s−1 and 1100–1150 °C. When the deformation temperature and the pre-forging shape were restrained, the punch speed curves could be continuously adjusted to ensure that the average dissipation coefficient was between 35% and 40%.

Author Contributions

Writing-original draft preparation, R.C.; writing-review & editing, H.X.; funding acquisition, M.W. and J.L.

Funding

This study was funded by the National Natural Science Foundation of China (51435007), the Natural Science Foundation of Hubei province (2017CFB587), the State Key Laboratory of Materials Processing and Die & Mould Technology in Huazhong University of Science and Technology (P2020-015), the Outstanding Young Scientific &Technological Innovation Team Plan of Colleges and Universities in Hubei Province (T201518), the Hubei Key Laboratory of Automotive Power Train and Electronic Control in Hubei University of Automotive Technology (ZDK1201601), and the Doctoral Scientific Research Fund of Hubei University of Automotive Technology (BK201901).

Conflicts of Interest

The authors declare that they have no conflict of interest.

References

  1. Speich, G.R. Properties and Selection Irons and Steels, Ultrahigh-Strength Steels section. In Metals Handbook; ASM International: Materials Park, OH, USA, 2005; Volume 1, pp. 1118–1170. [Google Scholar]
  2. Dong, H.; Zhang, S.H.; Yong, Q.L. Steel and iron materials engineering. In China Materials Engineering Canon; Chemical Industry Press: Beijing, China, 2006; Volume 3, pp. 1048–1049. [Google Scholar]
  3. Skubisz, P.; Sinczak, J. Properties of direct-quenched aircraft forged component made of ultrahigh-strength steel 300M. Aircr. Eng. Aerosp. Technol. 2018, 90, 713–719. [Google Scholar] [CrossRef]
  4. Gong, B.; Duan, X.W.; Liu, J.S.; Liu, J.J. A physically based constitutive model of as-forged 34CrNiMo6 steel and processing maps for hot working. Vacuum 2018, 155, 345–357. [Google Scholar] [CrossRef]
  5. Sanrutsadakorn, A.; Uthaisangsuk, V.; Suranuntchai, S.; Thossatheppitak, B. Investigation of hot deformation characteristics of AISI 4340 steel using processing maps. Adv. Mater. Res. 2013, 683, 301–306. [Google Scholar] [CrossRef]
  6. Łukaszek-Sołek, A.; Krawczyk, J.; Sleboda, T.; Grelowski, J. Optimization of the hot forging parameters for 4340 steel by processing maps. J. Mater. Res. Technol. 2019, 8, 3281–3290. [Google Scholar] [CrossRef]
  7. Luo, J.; Li, M.Q.; Liu, Y.G.; Sun, H.M. The deformation behavior in isothermal compression of 300M ultrahigh-strength steel. Mater. Sci. Eng. A 2012, 534, 314–322. [Google Scholar] [CrossRef]
  8. Sun, H.M.; Li, M.Q.; Liu, Y.G. Development of processing map coupling grain size for the isothermal compression of 300M steel. Mater. Sci. Eng. A 2014, 595, 77–85. [Google Scholar] [CrossRef]
  9. Sakai, T.; Belyakov, A.; Kaibyshev, R.; Miura, H.; Jonas, J.J. Dynamic and post-dynamic recrystallization under hot, cold and severe plastic deformation conditions. Prog. Mater. Sci. 2014, 60, 130–207. [Google Scholar] [CrossRef]
  10. Chen, R.; Guo, P.; Zheng, Z.; Li, J.; Feng, F. Dislocation Based Flow Stress Model of 300M Steel in Isothermal Compression Process. Materials 2018, 11, 972. [Google Scholar] [CrossRef]
  11. Chen, R.; Zheng, Z.; Li, N.; Li, J.; Feng, F. In-situ investigation of phase transformation behaviors of 300M steel in continuous cooling process. Mater. Charact. 2018, 144, 400–410. [Google Scholar] [CrossRef]
  12. Chen, R.; Zheng, Z.; Li, J.; Li, N.; Feng, F. In Situ Investigation of Grain Evolution of 300M Steel in Isothermal Holding Process. Materials 2018, 11, 1862. [Google Scholar] [CrossRef]
  13. Chen, R.; Hong, C.; Li, J.; Zheng, Z.; Li, P.C. Austenite grain growth and grain size distribution in isothermal heat-treatment of 300M steel. Procedia Eng. 2017, 207, 663–668. [Google Scholar] [CrossRef]
  14. Liu, Y.G.; Li, M.Q.; Luo, J. The modelling of dynamic recrystallization in the isothermal compression of 300M steel. Mater. Sci. Eng. A 2013, 574, 1–8. [Google Scholar] [CrossRef]
  15. Zeng, R.; Huang, L.; Li, J.; Li, H.; Zhu, H.; Zhang, X. Quantification of multiple softening processes occurring during multi-stage thermoforming of high-strength steel. Int. J. Plast. 2019, 120, 64–87. [Google Scholar] [CrossRef]
  16. Semiatin, S.L. Forming and Forging. In ASM Handbook; ASM International: Almere, The Netherlands, 2005; Volume 14, pp. 584–585. [Google Scholar]
  17. Xi, T.; Yang, C.; Shahzad, M.; Yang, K. Study of the processing map and hot deformation behavior of a Cu-bearing 317LN austenitic stainless steel. Mater. Des. 2015, 87, 303–312. [Google Scholar] [CrossRef]
  18. Chen, R. A Specimen for the in situ Compression Test on the High Temperature Confocal Laser Scanning Microscope. Chinese Patent 201910327549.4, 23 April 2019. [Google Scholar]
  19. Babu, K.A.; Mandal, S.; Athreya, C.N.; Shakthipriya, B.; Sarma, V.S. Hot deformation characteristics and processing map of a phosphorous modified super austenitic stainless steel. Mater. Des. 2017, 115, 262–275. [Google Scholar] [CrossRef]
  20. Mohamadizadeh, A.; Zarei-Hanzaki, A.; Abedi, H.R.; Mehtonen, S.; Porter, D. Hot deformation characterization of duplex low-density steel through 3D processing map development. Mater. Charact. 2015, 107, 293–301. [Google Scholar] [CrossRef]
  21. Chen, L.; Ma, X.; Liu, X.; Wang, L. Processing map for hot working characteristics of a wrought 2205 duplex stainless steel. Mater. Des. 2011, 32, 1292–1297. [Google Scholar] [CrossRef]
  22. Kitahara, H.; Ueji, R.; Tsuji, N.; Minamino, Y. Crystallographic features of lath martensite in low-carbon steel. Acta Mater. 2006, 54, 1279–1288. [Google Scholar] [CrossRef]
  23. Nolze, G. Irrational orientation relationship derived from rational orientation relationships using EBSD data. Cryst. Res. Technol. 2010, 43, 61–73. [Google Scholar] [CrossRef]
  24. Kitahara, H.; Ueji, R.; Ueda, M.; Tsuji, N.; Minamino, Y. Crystallographic analysis of plate martensite in Fe–28.5 at.% Ni by FE-SEM/EBSD. Mater. Charact. 2005, 54, 378–386. [Google Scholar] [CrossRef]
  25. Chen, G.; Fu, G.; Cheng, C.; Yan, W.; Zou, Z.; Lin, S. Effects of strain rate on dynamic recrystallization microstructure of 3003 aluminum alloy in process of hot deformation. Trans. Mater. Heat. Treat. 2012, 33, 26–31. [Google Scholar]
  26. Chen, R.; Zheng, Z.; Li, J.; Fei, F. Constitutive Modeling and Hot Workability Analysis by Microstructure Examination of GH4169 Alloy. Crystals 2018, 8, 282. [Google Scholar] [CrossRef]
Figure 1. Illustration of the experimental setup.
Metals 09 00880 g001
Figure 2. Flow stress curves of 300M steel compressed at (a) 0.01 s−1, (b) 0.1 s−1, (c) 1 s−1, and (d) 10 s−1.
Metals 09 00880 g002
Figure 3. Microstructures of 300M steel compressed at 0.01 s−1 and at (a) 900 °C, (b) 950 °C, (c) 1000 °C, (d) 1050 °C, (e) 1100 °C, and (f) 1150 °C.
Metals 09 00880 g003
Figure 4. Microstructures of 300M steel compressed at 10 s−1 and at (a) 900 °C, (b) 950 °C, (c) 1000 °C, (d) 1050 °C, (e) 1100 °C, and (f) 1150 °C.
Metals 09 00880 g004
Figure 5. Microstructures of 300M steel compressed at 900 °C and at (a) 0.01 s−1, (b) 0.1 s−1, (c) 1 s−1, and (d) 10 s−1.
Metals 09 00880 g005
Figure 6. Microstructures of 300M steel compressed at 1150 °C and at (a) 0.01 s−1, (b) 0.1 s−1, (c) 1 s−1, and (d) 10 s−1.
Metals 09 00880 g006
Figure 7. In situ observation results of the microstructure evolutions of 300M steel compressed at the temperature of 1100 °C, at the strain rate of 0.01 s−1, and at the strain of (a) 0.1, (b) 0.2, (c) 0.3, (d) 0.4, (e) 0.5, (f) 0.6, and (g) 0.9. The merged graph of (af) was shown in (h) to represent the microstructures at various strains.
Metals 09 00880 g007
Figure 8. The three dimensional hot working maps of 300M steel.
Metals 09 00880 g008
Figure 9. Hot working maps of 300M steel at the strain of (a) 0.2, (b) 0.4, (c) 0.6, and (d) 0.8.
Metals 09 00880 g009
Figure 10. Hot working maps of 300M steel at the strain rate of (a) 0.01 s−1, (b) 0.1 s−1, (c) 1 s−1, and (d) 10 s−1.
Metals 09 00880 g010
Figure 11. Hot working maps of 300M steel at the temperature of (a) 900 °C, (b) 1000 °C, (c) 1100 °C, and (d) 1150 °C.
Metals 09 00880 g011
Figure 12. Comparison of the optimal hot working parameters in the present research with the optimal parameters in the literature.
Metals 09 00880 g012

