Article

Relationship between Al-Ni intermetallic Phases and Bond Strength in Roll Bonded Steel-Aluminum Composites with Nickel Interlayers

1
Department of Materials Science and Engineering, Norwegian University of Science and Technology (NTNU), NO-7491 Trondheim, Norway
2
Department of Physics, Norwegian University of Science and Technology (NTNU), NO-7491 Trondheim, Norway
*
Author to whom correspondence should be addressed.
Metals 2019, 9(8), 827; https://doi.org/10.3390/met9080827
Submission received: 7 July 2019 / Revised: 22 July 2019 / Accepted: 23 July 2019 / Published: 25 July 2019

Abstract

:
In this work, the interface characteristics and resulting bond strength were investigated for roll bonded steel-aluminum composites with nickel interlayers, both after rolling and after post-rolling heat treatments at 400 °C–550 °C. After rolling, only mechanical interlocking was achieved between the steel and nickel layers, which resulted in delamination. Post-rolling heat treatments resulted in sufficient metallurgical bonding between the steel and nickel layers, and a significant increase in the bond strength. An intermetallic phase layer formed during the heat treatments, which below 500 °C consisted of Al3Ni and above, Al3Ni and Al3Ni2. With increasing temperature and time, the Al3Ni2 phase consumed the Al3Ni layer, voids developed along the Al3Ni2-aluminum interface, and a duplex morphology developed inside the Al3Ni2 layer, in accordance with the Kirkendall effect. The highest bond strength was obtained for the composites that only had an Al3Ni layer along the interface, and the optimal thickness was found to be 3–5 µm. The bond strength decreased with increasing temperature and time, due to increasing Al-Ni layer thickness, an increase in the fraction of Al3Ni2 relative to Al3Ni, and the development of voids. The results show that nickel can be used as an interlayer in steel-aluminum joints, and a high bond strength can be obtained through post-rolling heat treatments.

Graphical Abstract

1. Introduction

Joining of dissimilar metals in order to produce a multi-material, where the properties of both dissimilar metals are jointly utilized, is of high interest in the automotive industry [1]. However, when joining dissimilar metals, such as steel and aluminum, challenges arise due to the differences in melting point, thermal expansion and corrosion potential, as well as due to the formation of intermetallic phases (IMPs), e.g., Fe-Al IMPs, along the joined interface. Which phases that form and their growth rates are strongly influenced by the chemical composition of the base metals, and the temperatures reached either during the joining process or during post-joining heat treatments [2,3,4]. Most commonly, Fe2Al5 and Fe4Al13 (FeAl3) are reported to form in steel-aluminum joints. These phases are brittle and are reported to have a strong negative effect on the strength of the joints [5,6].
One way of reducing the risk of IMP formation when joining dissimilar metals is by reducing the heat input and keeping all metals at solid-state conditions during the joining process. One solid-state joining technique used to join steel and aluminum is cold roll bonding (CRB). In CRB, as shown by Bay [7], plastic deformation and high pressure are the main process parameters utilized in order to obtain a bond between two metals, and the film theory is generally considered to explain the main bonding mechanism between the metals [8]. According to the film theory, the surface layer on the metals will crack due to the large surface expansion occurring during the rolling process. This, combined with the high pressure experienced when entering the rolling mill, allows fresh metal to be extruded locally through the surface cracks. Then, bonds can form where fresh metal from the opposing surfaces meet [7,9]. Bay [7,9] showed that during CRB, a minimum degree of surface expansion is required in order to achieve a bond, referred to as the threshold thickness reduction. Above the threshold thickness reduction, the bond strength in CRB composites is reported to increase with increasing thickness reduction. A larger thickness reduction entails a larger surface expansion, which can increase the number of cracks in the surface layer, promoting a higher bond strength [5,6,7,9].
Performing post-rolling heat treatments on CRB composites can increase the bond strength, as long as the IMP layer growth is kept to a minimum [5,10]. Atomic diffusion and short-range movement of atoms across the bonded interface promoted by the heat treatment can explain the observed increase in bond strength, as it can help improve the metallurgical bonding between the layers [10]. In addition, post-rolling heat treatment can reduce the hardness and the residual stresses in the metals [10]. However, the diffusion of atoms across the interface will eventually result in the formation of IMPs along the interface. Hence, the post-rolling heat treatment options are limited. In addition to the IMP formation, another phenomenon that can occur during solid-state diffusion between two dissimilar metals is the Kirkendall effect [11]. The Kirkendall effect states that the diffusion of atoms across an interface between two dissimilar metals is unequal, i.e., more atoms diffuse from one side to the other [11]. This can lead to the formation of pores and voids during the diffusion process, due to the agglomeration of vacancies on the side of the interface of the fastest diffusing element [12,13]. The formation of such voids will strongly influence the mechanical properties in dissimilar metal joints, as they create easy paths where a fracture can propagate [12,13].
Another way of reducing the risk of the IMP formation is by adding a metal interlayer between the steel and aluminum base metals. This interlayer will prevent the interactions between the Fe- and Al-atoms, inhibit the formation of Fe-Al IMPs. Other than the work performed by Meshram and Reddy [14], on the influence of using a silver-interlayer in friction welded steel-aluminum joints, not much literature could be found on this topic at this time. On the other hand, the effect of adding a metal interlayer has been studied for various other dissimilar metal combinations, for which the formation of brittle IMPs is also a challenge during joining, i.e., for stainless steel-titanium joints [15,16,17] and for aluminum-magnesium joints [18,19].
When choosing a metal interlayer, the metallurgical compatibility between the interlayer and the base metals is very important [20]. Since the interlayer is in contact with both base metals, new IMPs will be formed between the interlayer and either one or both of the base metals [16,17,18,19,21]. Thus, the use of metal interlayers has been reported to increase the bond strength, since the formation of the brittle and unwanted IMPs is eliminated. In the literature, silver [16,17,19,21] and nickel [15,18,21,22] are the two most commonly investigated metal interlayers. Zhang et al. [18] studied the effect of adding a nickel interlayer in aluminum-magnesium joints. In the study, IMPs were observed to form between aluminum and nickel, as well as between magnesium and nickel. However, in the study by Wang et al. [19] who studied the effect of using a silver interlayer in aluminum-magnesium joints, IMPs were only observed to form between magnesium and silver. In both studies, the bond strength increased in the joints were a metal interlayer was added between the base metals, showing that both metals are suitable interlayer metals in aluminum-magnesium joints. Xiong et al. [21] compared the microstructure and mechanical properties in aluminum-copper joints produced with both silver- and nickel-interlayers. In their study, the highest bond strength was obtained when using nickel as interlayer, while the joints produced with silver as interlayer were observed to crack. The cracking was suggested to be due to the formation of Al-Ag IMPs, which were found to grow faster (at 520 °C) and have a higher hardness compared to the formed Al-Ni IMPs. Thus, the results suggest that for this metal combination, nickel is the better option.
Based on the findings in the literature, nickel has the potential of being a suitable metal to use as an interlayer in steel-aluminum joints. However, nickel interlayers in steel-aluminum joints have not been studied to the author’s knowledge, despite the promising findings in the literature. The Al-Ni system and the formation and growth of Al-Ni IMPs have been thoroughly studied, and it has been shown that the two phases, Al3Ni2 and Al3Ni are most commonly formed in the temperature range of 450 °C–610 °C [23,24,25,26]. A rigorous analysis of the growth kinetics of the two Al-Ni IMPs can be found in these articles. However, still more research can be conducted in order to investigate the relationship between the Al-Ni IMPs and the bond strength. Therefore, the aim of this paper is to present the effect of adding nickel as an interlayer in CRB composites consisting of steel and aluminum, subjected to various post-rolling heat treatments. The goal was to study the formation and growth of Al-Ni IMP and corresponding influence on the bond strength.

2. Materials and Methods

The metals chosen for this study were a rolled AA1080 aluminum alloy sheet (commercially pure aluminum; 99.8 wt% Al, 0.4 mm thick), and a warm rolled 355 MC E steel plate (low-carbon, low-alloyed steel: 0.07wt% C, 0.01 wt% Si, 0.62 wt% Mn, 0.05 wt% Al, 0.03 wt% Cr, 0.03 wt% Ni, 5 mm thick). The steel plate was cold rolled to 1 mm thickness, followed by annealing at 750 °C for 4 hours in a furnace with an argon atmosphere to soften the steel and to prevent oxidation. For the metal interlayer, a 0.1 mm thick nickel-foil (99.95% Ni, ASTM B162) was chosen. The metal sheets were all cut into specimens for rolling, measuring 15 × 120 mm.
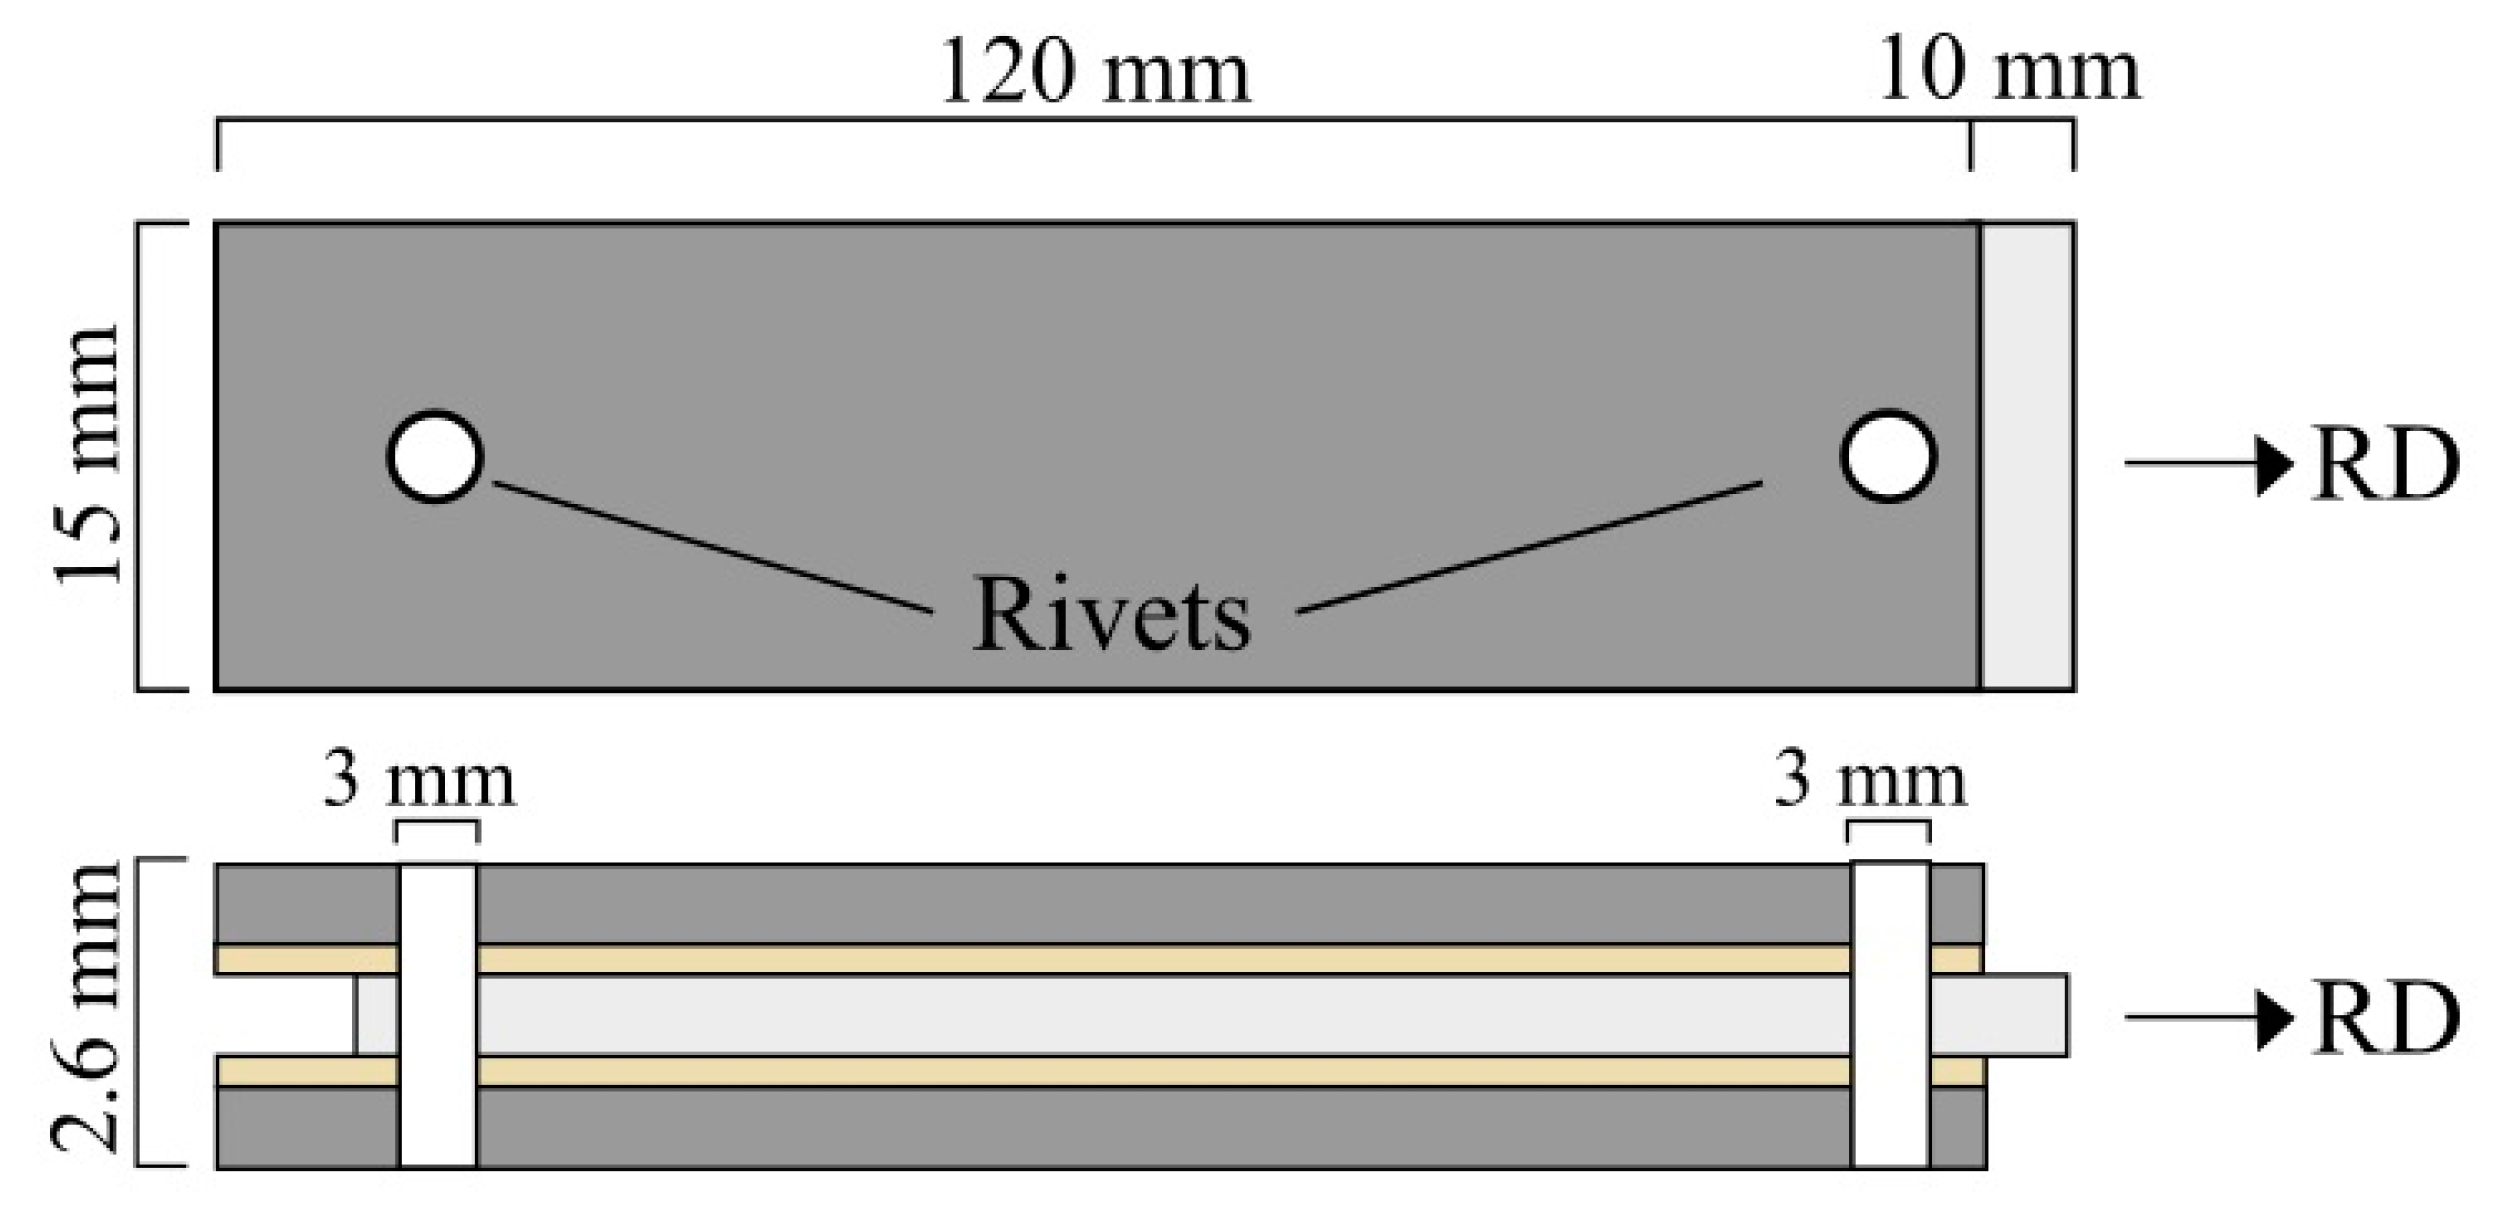
The specimens were first cleaned with acetone in order to remove any grease on the specimen surfaces. Then, the steel and aluminum surfaces were brushed with a rotating conical steel-wire brush (wire diameter 0.3 mm and rotation speed 3800 rpm), with the brushing direction being transverse to the rolling direction. The nickel-foil was brushed manually in the transverse direction using a steel-wire brush (wire diameter 0.3 mm), as it required a more careful brushing due to its low thickness. Afterwards, pressurized air was used to remove any loose particles from the surfaces after brushing. The specimens were then stacked on top of each other, creating a laminated composite with five layers in the stacking sequence; steel/nickel/aluminum/nickel/steel. The specimens were fastened using aluminum rivets in the front and rear end of the composite, as illustrated in Figure 1. This was done in order to prevent any movement between the layers during rolling. The composite was then placed in an air furnace (pre-heated to 185 °C) for 10 min in order to achieve the desired rolling temperature of 150 °C. The selected time was based on initial measurements. The composite was rolled in a single pass directly after being taken out of the furnace, achieving a thickness reduction between 55% and 70%.
Selected composites were subjected to post-rolling heat treatments at 400 °C–550 °C for various time periods ranging from 5 min to four hours, in order to study the development of the IMP layer. The heat treatments were conducted using a salt-bath followed by quenching in water. The rolled and heat-treated composites were subjected to both microscopy analysis and mechanical testing. Cross-sections of the composites were ground and polished using standard metallographic procedures. Thickness measurements were obtained using optical microscopy, and the interface characteristics were analyzed using scanning electron microscopy (SEM), an electron microprobe analyzer and transmission electron microscopy (TEM). For the SEM analysis, a Zeiss Gemini Ultra 55 Limited Edition (Carl Zeiss Microscopy GmbH, Oberkochen, Germany) was used. Images were taken with secondary electrons at 10 kV acceleration voltage and 10.5 mm working distance. A JEOL JXA-8500F electron microprobe analyzer with a field-emission electron gun (JEOL Ltd., Tokyo, Japan), equipped with high resolution wavelength dispersive X-ray spectrometers, was used to study the interfaces of the heat-treated composites by performing semi-quantitative distribution line scans of elements at submicron scale. TEM lamellas were prepared by focused ion beam lift-out with a dual-beam FEI Helios G4 UX. Coarse milling was done with an acceleration voltage of 30 kV, and final milling was done at 5 kV to minimize ion-beam surface damage. TEM characterization was done with a JEOL JEM-2100F and a double spherical aberration (Cs) corrected cold FEG JEOL JEM-ARM200F (JEOL Ltd., Tokyo, Japan), both operated at 200 kV. The ARM200F was used for scanning TEM (STEM) imaging and energy dispersive X-ray spectroscopy (EDS) mapping. EDS maps were denoised and analyzed with the Python library HyperSpy [27].
Vickers hardness measurements were obtained in the aluminum and steel layers after rolling and after the different heat treatment procedures. A load of 100 g was used for the aluminum and 2.5 kg for the steel. The bond strengths of the composites were evaluated by performing a 180° peel-test (ASTM1876) using the Zwick Roell Zwickiline Z2.5 tensile testing machine controlled with Testexpert II software (Zwick GmbH & Co. KG, Ulm, Germany). The peel-testing speed was set to 25 mm/min. To create the peel-testing specimens, the edges of the rolled composites were trimmed using a water-jet cutter, producing peel-testing specimens with a width of 10 mm. This was done in order to produce comparable specimens with accurate widths, having no edge defects from the rolling procedure that could influence the measurements. The length of the peel-testing specimens varied depending on the obtained thickness reduction. The fracture surfaces after peel-testing were studied using SEM combined with EDS, in order to analyze the bonding mechanism and fracture characteristics, using the same parameters as previously mentioned. The average bond strength was calculated from Equation (1).
Average bond strength [N/mm] = Peeling force [N]/Width of specimen [mm]

3. Results and Discussion

3.1. Characteristics after Rolling

Composites with total thickness reductions varying from 55% to 70% were produced. However, either after exiting the rolling mill or when preparing the composites for peel-testing (trimming of edges), some of the produced composites delaminated. It was observed that these composites all had a total thickness reduction below 58%. In the composites, which did not delaminate, the individual thickness reductions achieved in each layer were measured and compared to the total thickness reduction. The obtained measurements are presented in Table 1 for some representative composites (named composite 1–4), which achieved various total thickness reductions.
The results presented in Table 1 show that the aluminum, in general, obtained a larger reduction in thickness compared to the steel and nickel layers, which deformed equally. Hwang et al. [28] stated that differences in flow stresses between dissimilar metals during rolling can result in differences in the final thickness reductions. This has previously been reported in CRB steel-aluminum composites [29,30]. Similar to the results obtained in the current study, the aluminum layer was reported to achieve the highest thickness reduction in the produced composites.
SEM images of the cross-section in a composite after rolling are shown in Figure 2a,b. Large steel fragments were observed along the steel-nickel interface, highlighted in Figure 2b. Similar fragments were not observed along the aluminum-nickel interface. Steel fragments similar to the ones observed in the current study have been previously reported in the literature [31,32]. Both Wang et al. [31] and Gao et al. [32] studied the influence of various surface preparation techniques on the bond strength in CRB steel-aluminum composites, and in both studies, steel fragments were observed along the interface in the composites subjected to steel-wire brushing. Wang et al. [31] concluded that these fragments originate from the work-hardened surface layer produced during surface preparation and is a result of the large differences in the mechanical properties between the work-hardened surface layer and the unmodified bulk metal. Based on the location of the fragments observed in the current study, the fragments have most likely originated from the work-hardened layer on the steel surface and not from the steel wire-brush used during the surface preparation, supporting the observations found in the literature.
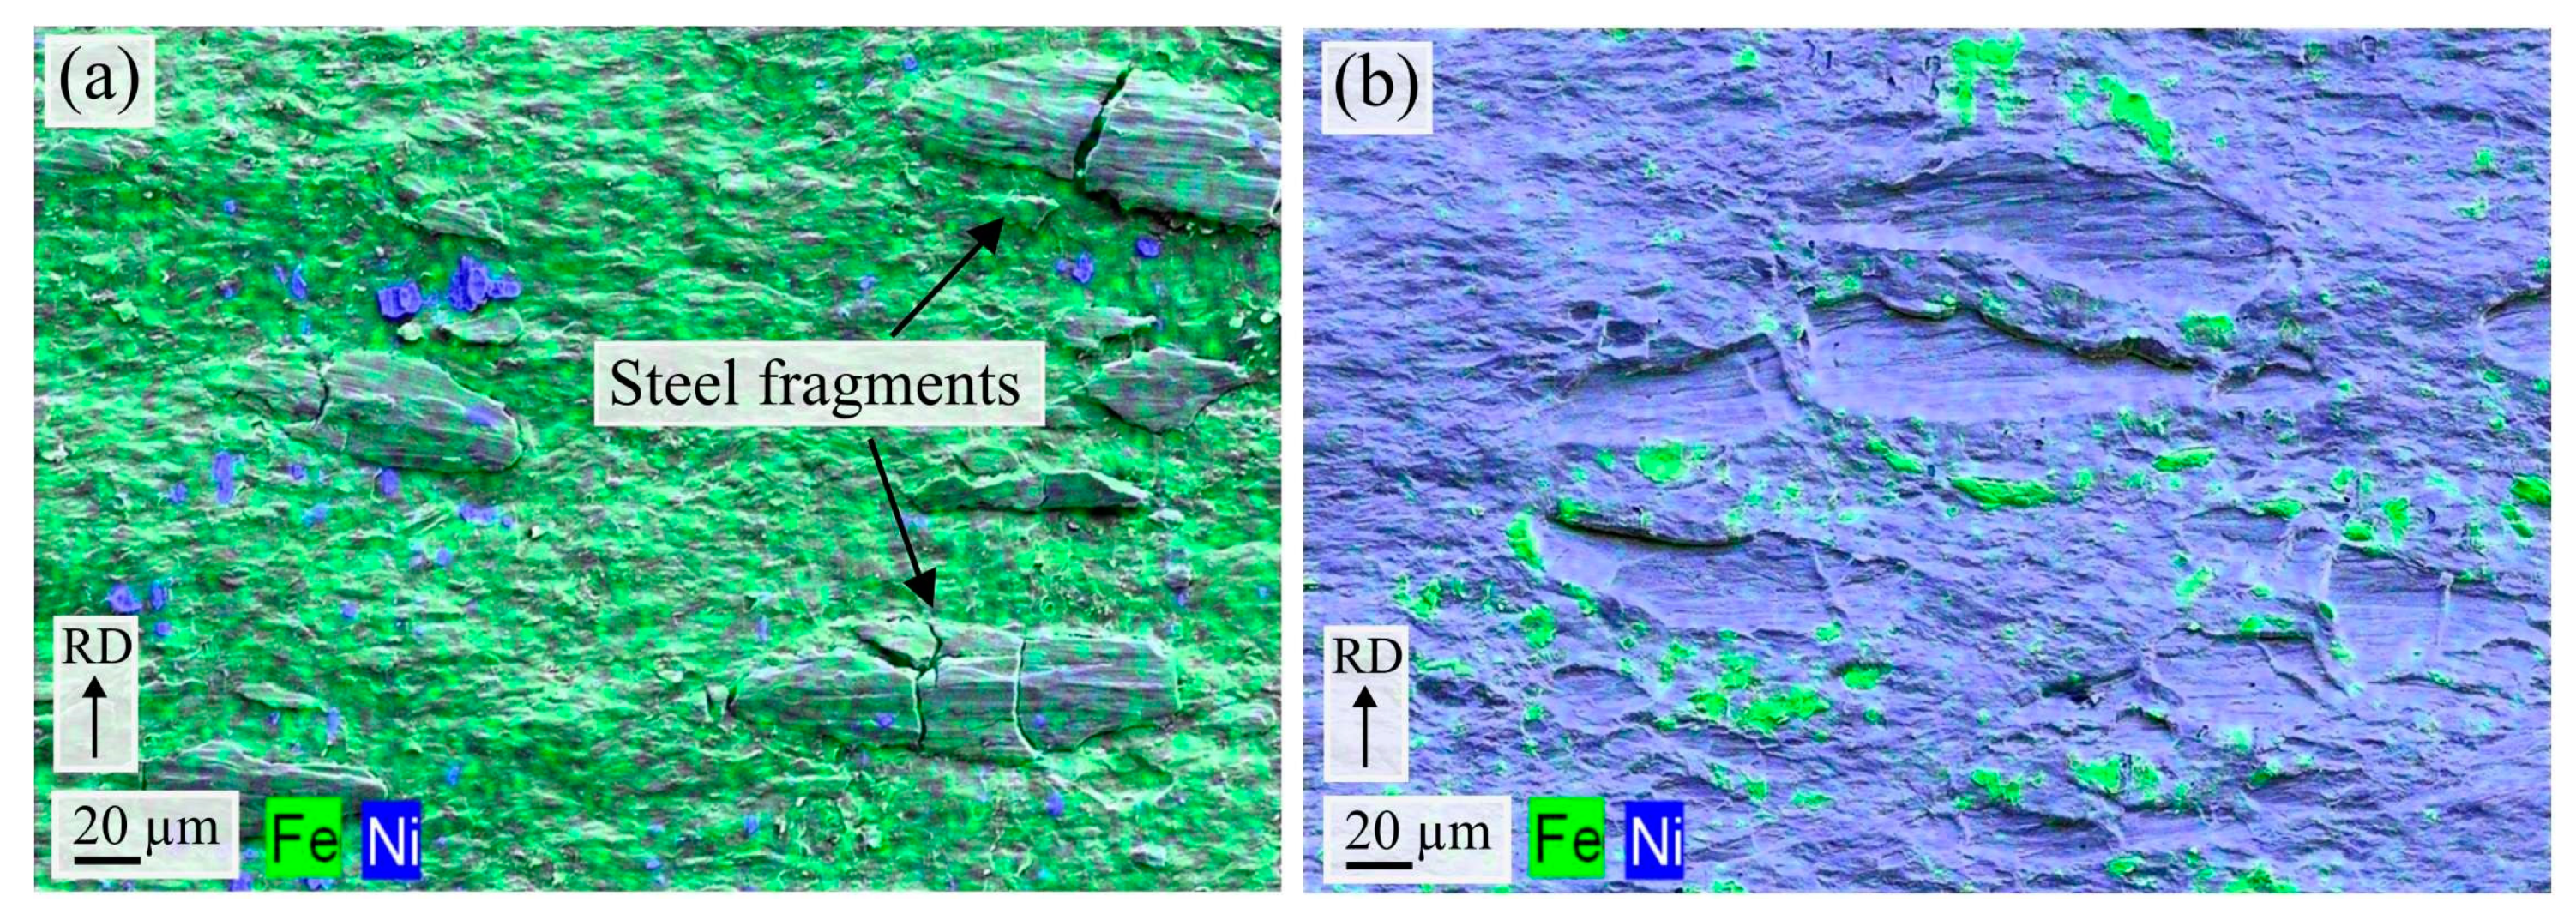
The composites were peel-tested, in order to study the obtained bond strength after rolling. As previously mentioned, peel-testing specimens could only be machined out of the composites which achieved a total thickness reduction above 58%. However, during peel-testing, the peel-testing specimens delaminated very easily, independent of the total thickness reduction. Hence, no accurate bond strength measurements could be obtained. The delamination occurred between the steel and nickel layers, as for the composites with thickness reductions below 58%. No delamination was observed between the aluminum and nickel layers in the composite. These observations indicate that the threshold thickness reduction for obtaining a sound joint is lower for aluminum and nickel compared to nickel and steel. Figure 3a,b shows the steel and nickel fracture surfaces after peel-testing, which both appear to be flat. There are hardly any signs of residual metal on either fracture surface, indicating that after rolling, the steel and nickel layers were only joined by mechanical interlocking.

3.2. Characteritics of the Post-Rolling Heat Treated Composites

In order to investigate the interaction and IMP formation between the metals, post-rolling heat treatments were performed at 400 °C–550 °C for various times. Afterwards, cross-sections of the composites were studied in the SEM and TEM, in order to analyze the interface characteristics. In all the heat-treated composites, no IMP formation could be observed along the steel-nickel interface, consistent with findings in the literature [15,22]. The lack of IMPs between steel and nickel was expected based on the substantial solid solubility between iron and nickel, which can be observed from the binary Fe-Ni phase diagram [33]. However, the phase, FeNi3 could potentially have formed within the studied temperature range.
Along the aluminum-nickel interface, IMPs from the Al-Ni system were detected. SEM images of the aluminum-nickel interface are presented in Figure 4a–d, showing the development of the formed Al-Ni IMP layer with increasing heat treatment temperature and time. In the composites heat treated at 400 °C and 450 °C, the IMP layer consisted mainly of one phase, shown in Figure 4a. The results from the electron microprobe analyzer showed that the phase had a composition of 75 at% aluminum and 25 at% nickel, consistent with the Al3Ni phase composition. The layer grew discontinuously along the interface, but was observed to become continuous with increasing heat treatment time, consistent with the observation made in other studies [23,24].
In the composites heat treated at 500 °C and 550 °C, two phases were observed along the aluminum-nickel interface, as shown in Figure 4b,c. Both phases were observed even after short heat treatment times. The electron microprobe analysis showed that the second phase, growing between the Al3Ni and the nickel layer, had a composition of 60 at% aluminum and 40 at% nickel, consistent with the phase Al3Ni2. The sequence across the interface was found to be: aluminum- Al3Ni-Al3Ni2-nickel in all the heat-treated composites. Eventually, as shown in Figure 4b–d, the Al3Ni2 phase became the dominating phase in the layer, growing at the expense of the Al3Ni phase. In some areas along the interface, the Al3Ni layer was found to be completely consumed by the Al3Ni2 phase, as shown in Figure 4d. This was mainly the case in the composites subjected to heat treatment at 550 °C for long periods (two hours and more). This formation and growth sequence is consistent with findings in other studies focusing on the formation and growth of the Al-Ni IMP during heat treatment at 450 °C–620 °C [24,25,26,34].
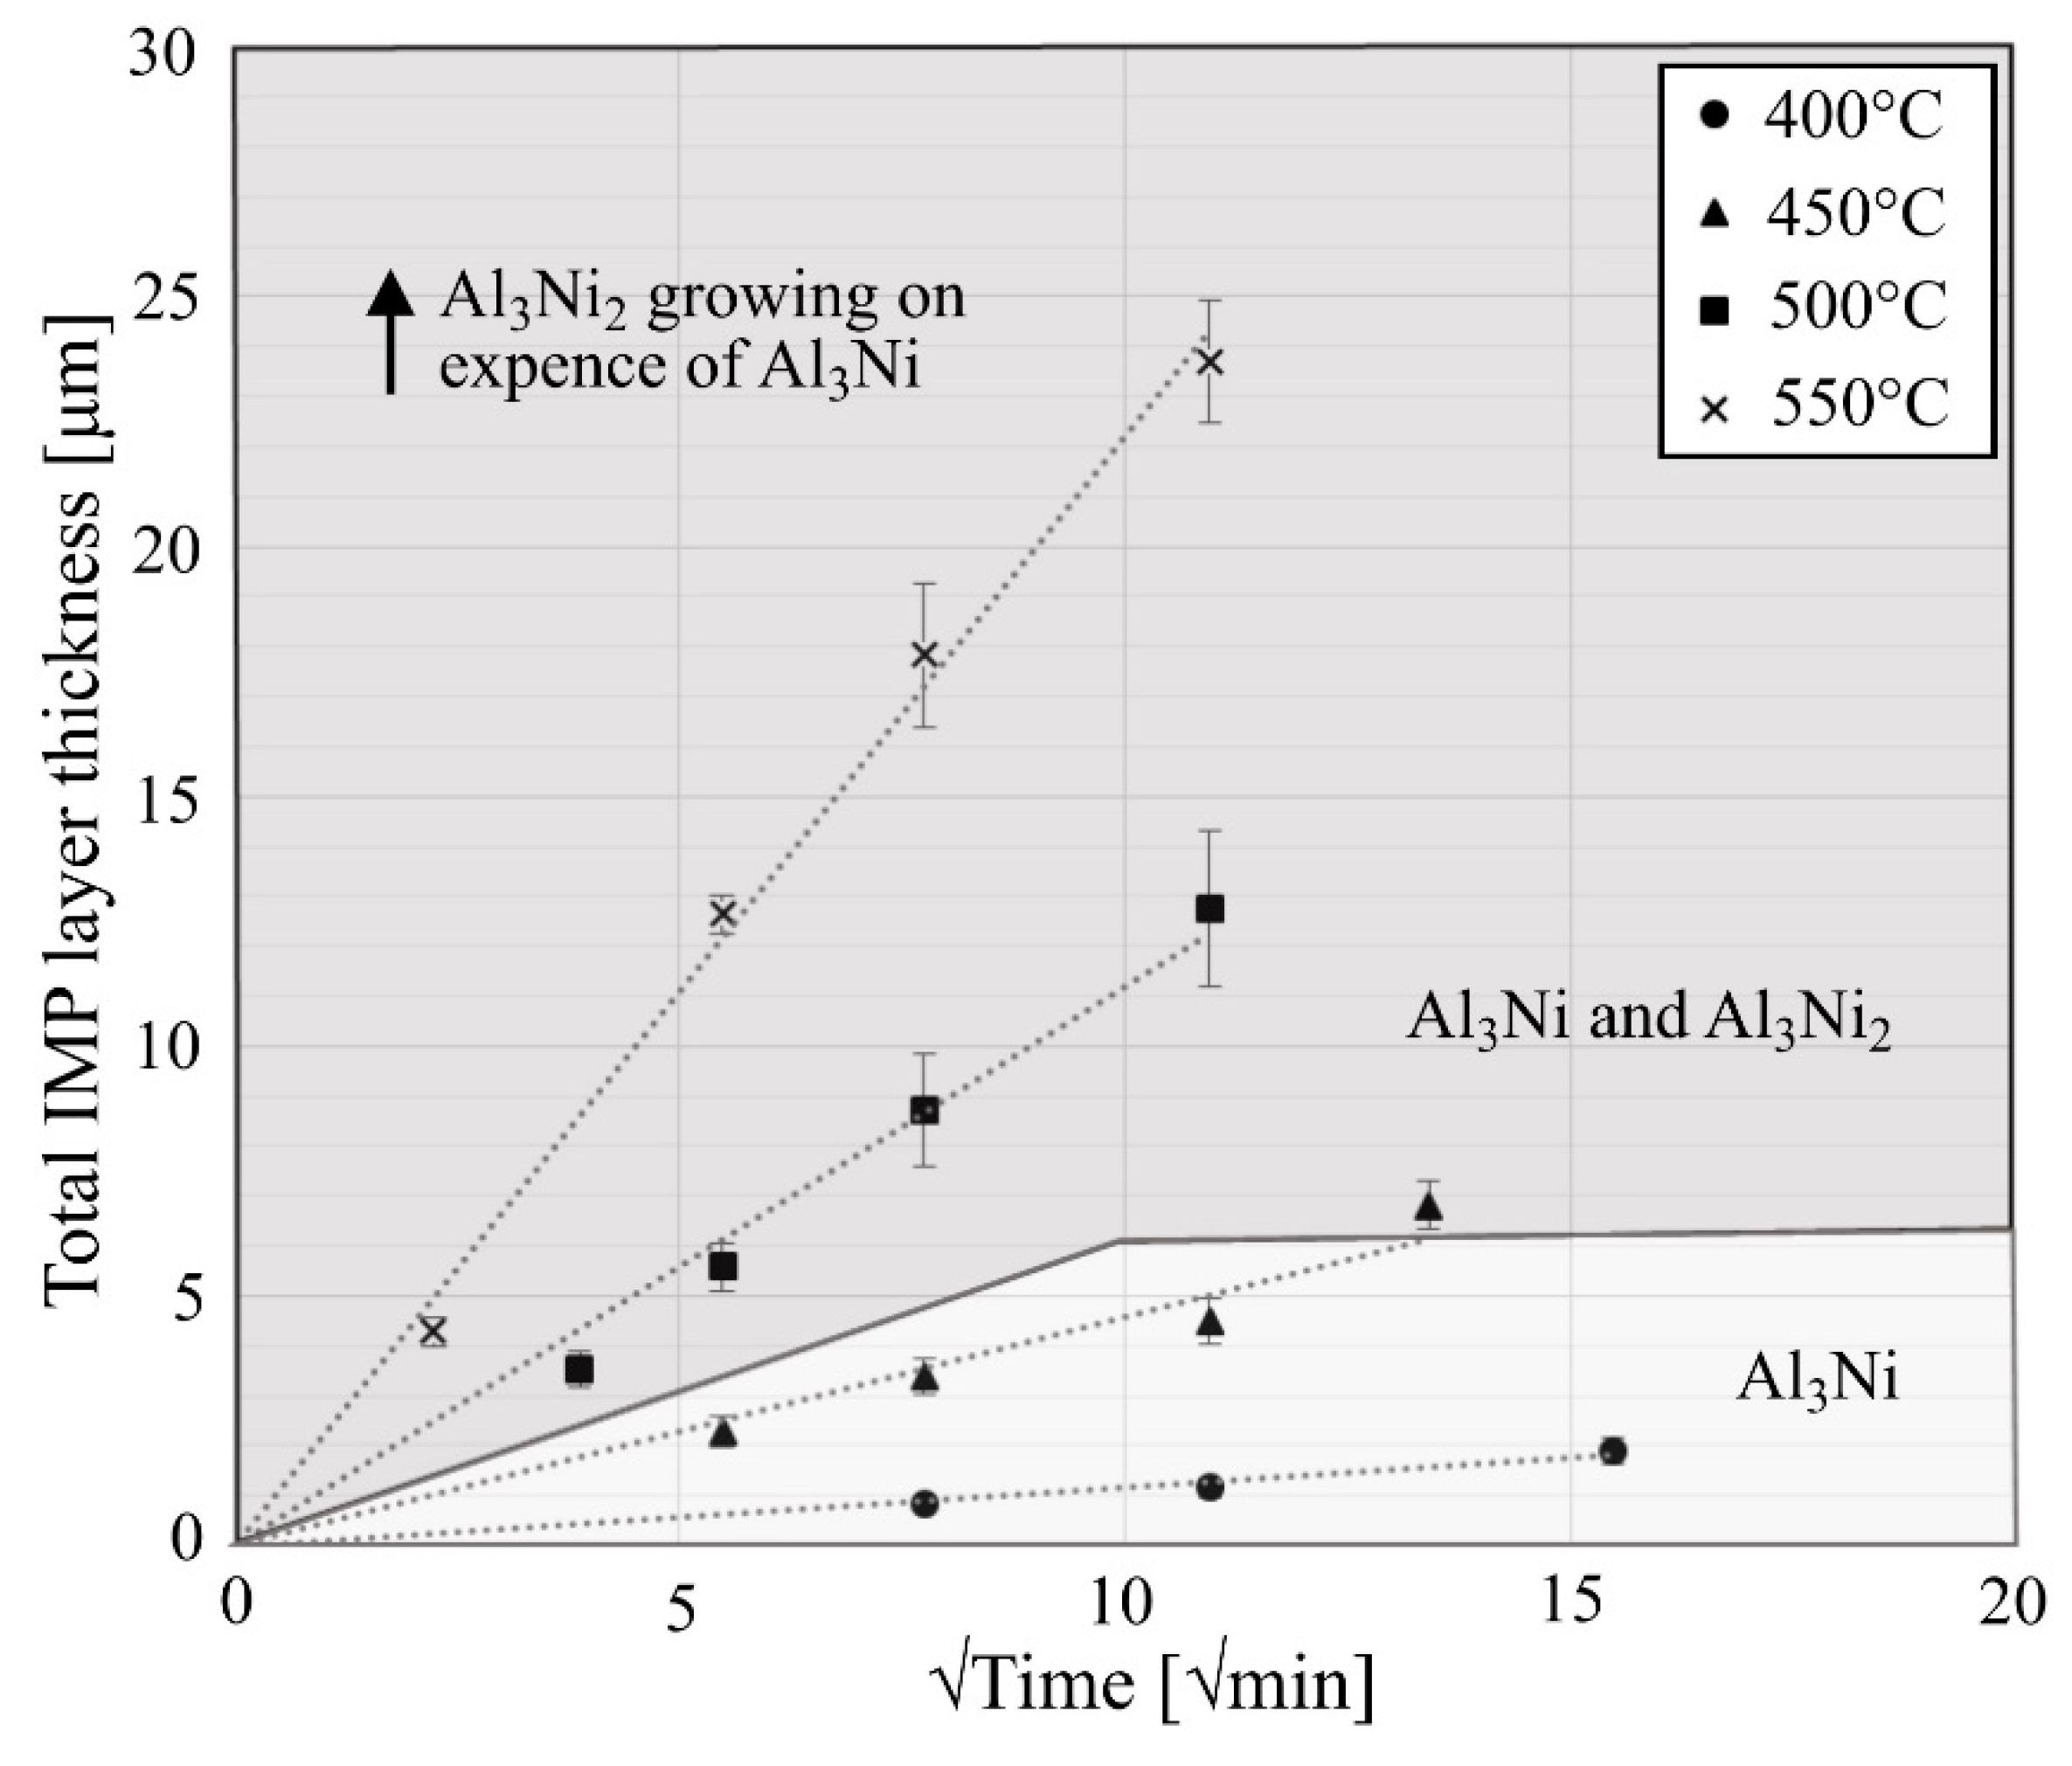
Figure 5 shows the average thickness of the total Al-Ni IMP layer as a function of the square root of heat treatment time for the different temperatures. The presented values are based on the average of twenty measurements (obtained at two different locations) from minimum two and maximum five different heat-treated composites. Figure 5 is divided into two grey-scale colored areas, indicating which phases that were observed to grow at the different temperature-time combinations. Either only Al3Ni (light grey) or both Al3Ni and Al3Ni2 (dark grey) were observed to form. The thickness of the total Al-Ni IMP layer is observed to increase with increasing heat treatment temperature and time.
At 400 °C and 450 °C, only Al3Ni was observed to grow along the interface, and it can be observed in Figure 5 that the growth of Al3Ni follows a linear relationship with the square root of time. At these temperatures, the growth of Al3Ni2 was negligible, and therefore, it can be concluded that below 500 °C, the growth rate of Al3Ni is larger than the growth rate of Al3Ni2. During heat treatment above 500 °C, both Al3Ni and Al3Ni2 was observed to grow along the interface, even for short heat treatment times, as indicated in Figure 5. As already mentioned, at these temperatures the Al3Ni layer was observed to be consumed by the growing Al3Ni2 phase. Thus, the increase in thickness of the IMP layer at these temperatures is assumed to be due to the growth of the Al3Ni2 phase. From Figure 5 it can be observed that the growth of Al3Ni2 also follows a linear relationship with the square root of heat treatment time. Based on the observed growth characteristics at these temperatures it can be argued that above 500 °C, the growth rate of Al3Ni2 is larger than the growth rate of Al3Ni.
Based on the observed growth rates from Figure 5, the thickness (Δx) of the IMP layer can be expressed by the parabolic rate law, given in Equation (2):
Δ x   [ μ m ] = k t
where t is the heat treatment time, and k is the rate constant, which is temperature dependent. This means that the growth of the two phases, Al3Ni and Al3Ni2 is volume diffusion controlled [24,25,26,34,35].

3.2.1. Characteristics of the Al3Ni Layer

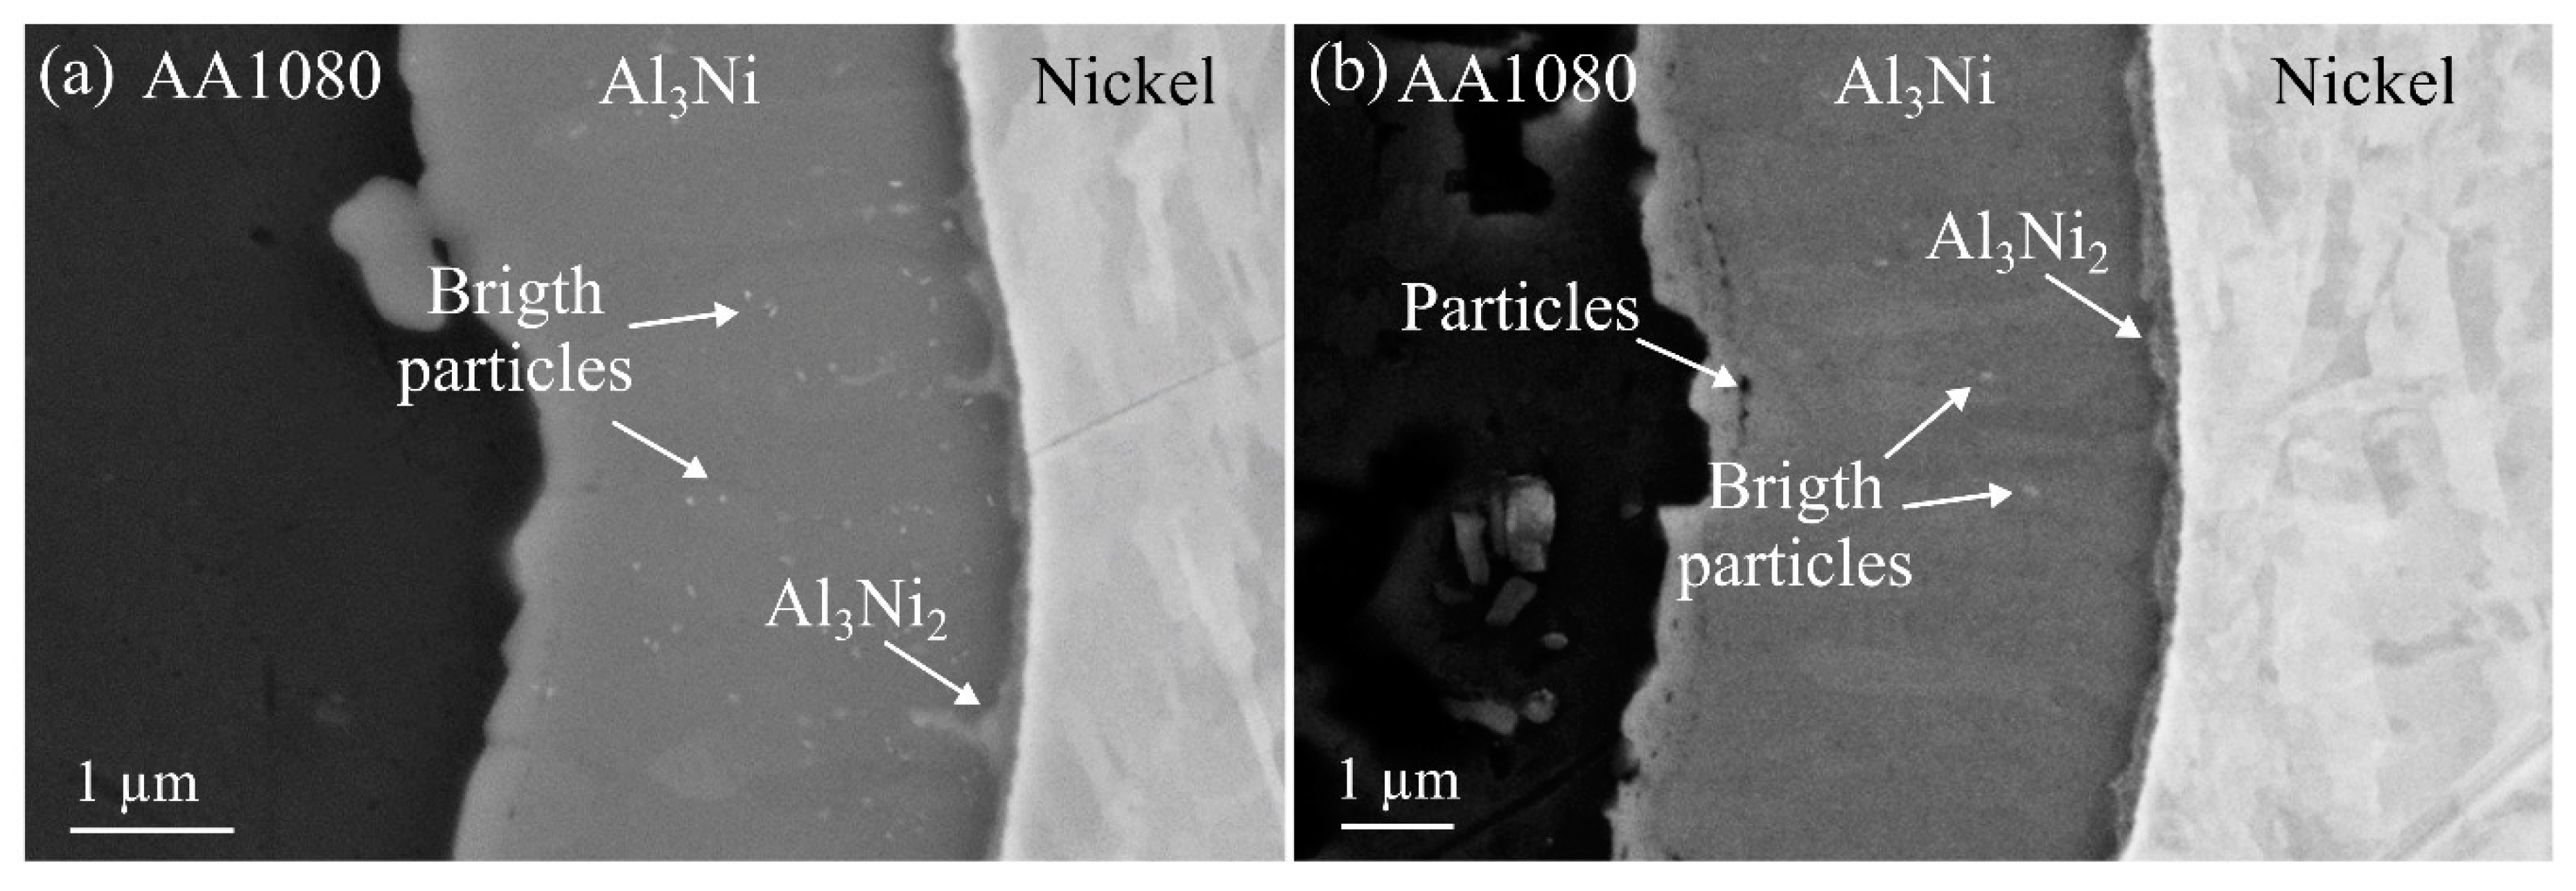
Figure 6a,b show the main observations made during SEM analysis of the Al3Ni layer, which formed after heat treatment at 400 °C and 450 °C. In Figure 6a, many small bright particles can be observed inside the Al3Ni layer. However, as seen in Figure 6b, with increasing heat treatment time, fewer particles could be observed inside the layer. Similar bright particles inside the Al3Ni layer have not been reported in other studies where the Al3Ni phase have been closely analyzed [23,24]. The bright particles were not subjected to any further analysis in the current study, since the work is focusing on the relationship between the Al-Ni IMP layers and the bond strength. The bright particles were assumed not to have any influence on the bond strength, as the fracture was observed not to occur inside the Al3Ni layer where the particles were present.
In some areas, highlighted in Figure 6a,b, the initial formation of the second phase, Al3Ni2 can be observed along the Al3Ni-nickel interface. The images are taken from composites heat treated at 450 °C for one and two hours, respectively. The initial formation is already visible after one hour and the phase is observed to grow thicker as the heat treatment time increases. In the study by Adabi and Amadeh [24], the formation of Al3Ni2 was first reported after heat treatment at 450 °C for 150 min, which is significantly longer than in the current study. However, their observation was reported after heat treatments performed between a nickel-coating and an AA6061 aluminum alloy. The AA6061 alloy contains silicon and magnesium, and silicon has been reported to influence and delay the Fe-Al IMP formation in steel-aluminum joints [2,36]. These alloying elements might be the reason for the slightly delayed formation of the Al3Ni2 phase reported in the study by Adabi and Amadeh [24], compared to the observations made in the current study, where the commercially pure aluminum alloy AA1080 is used.
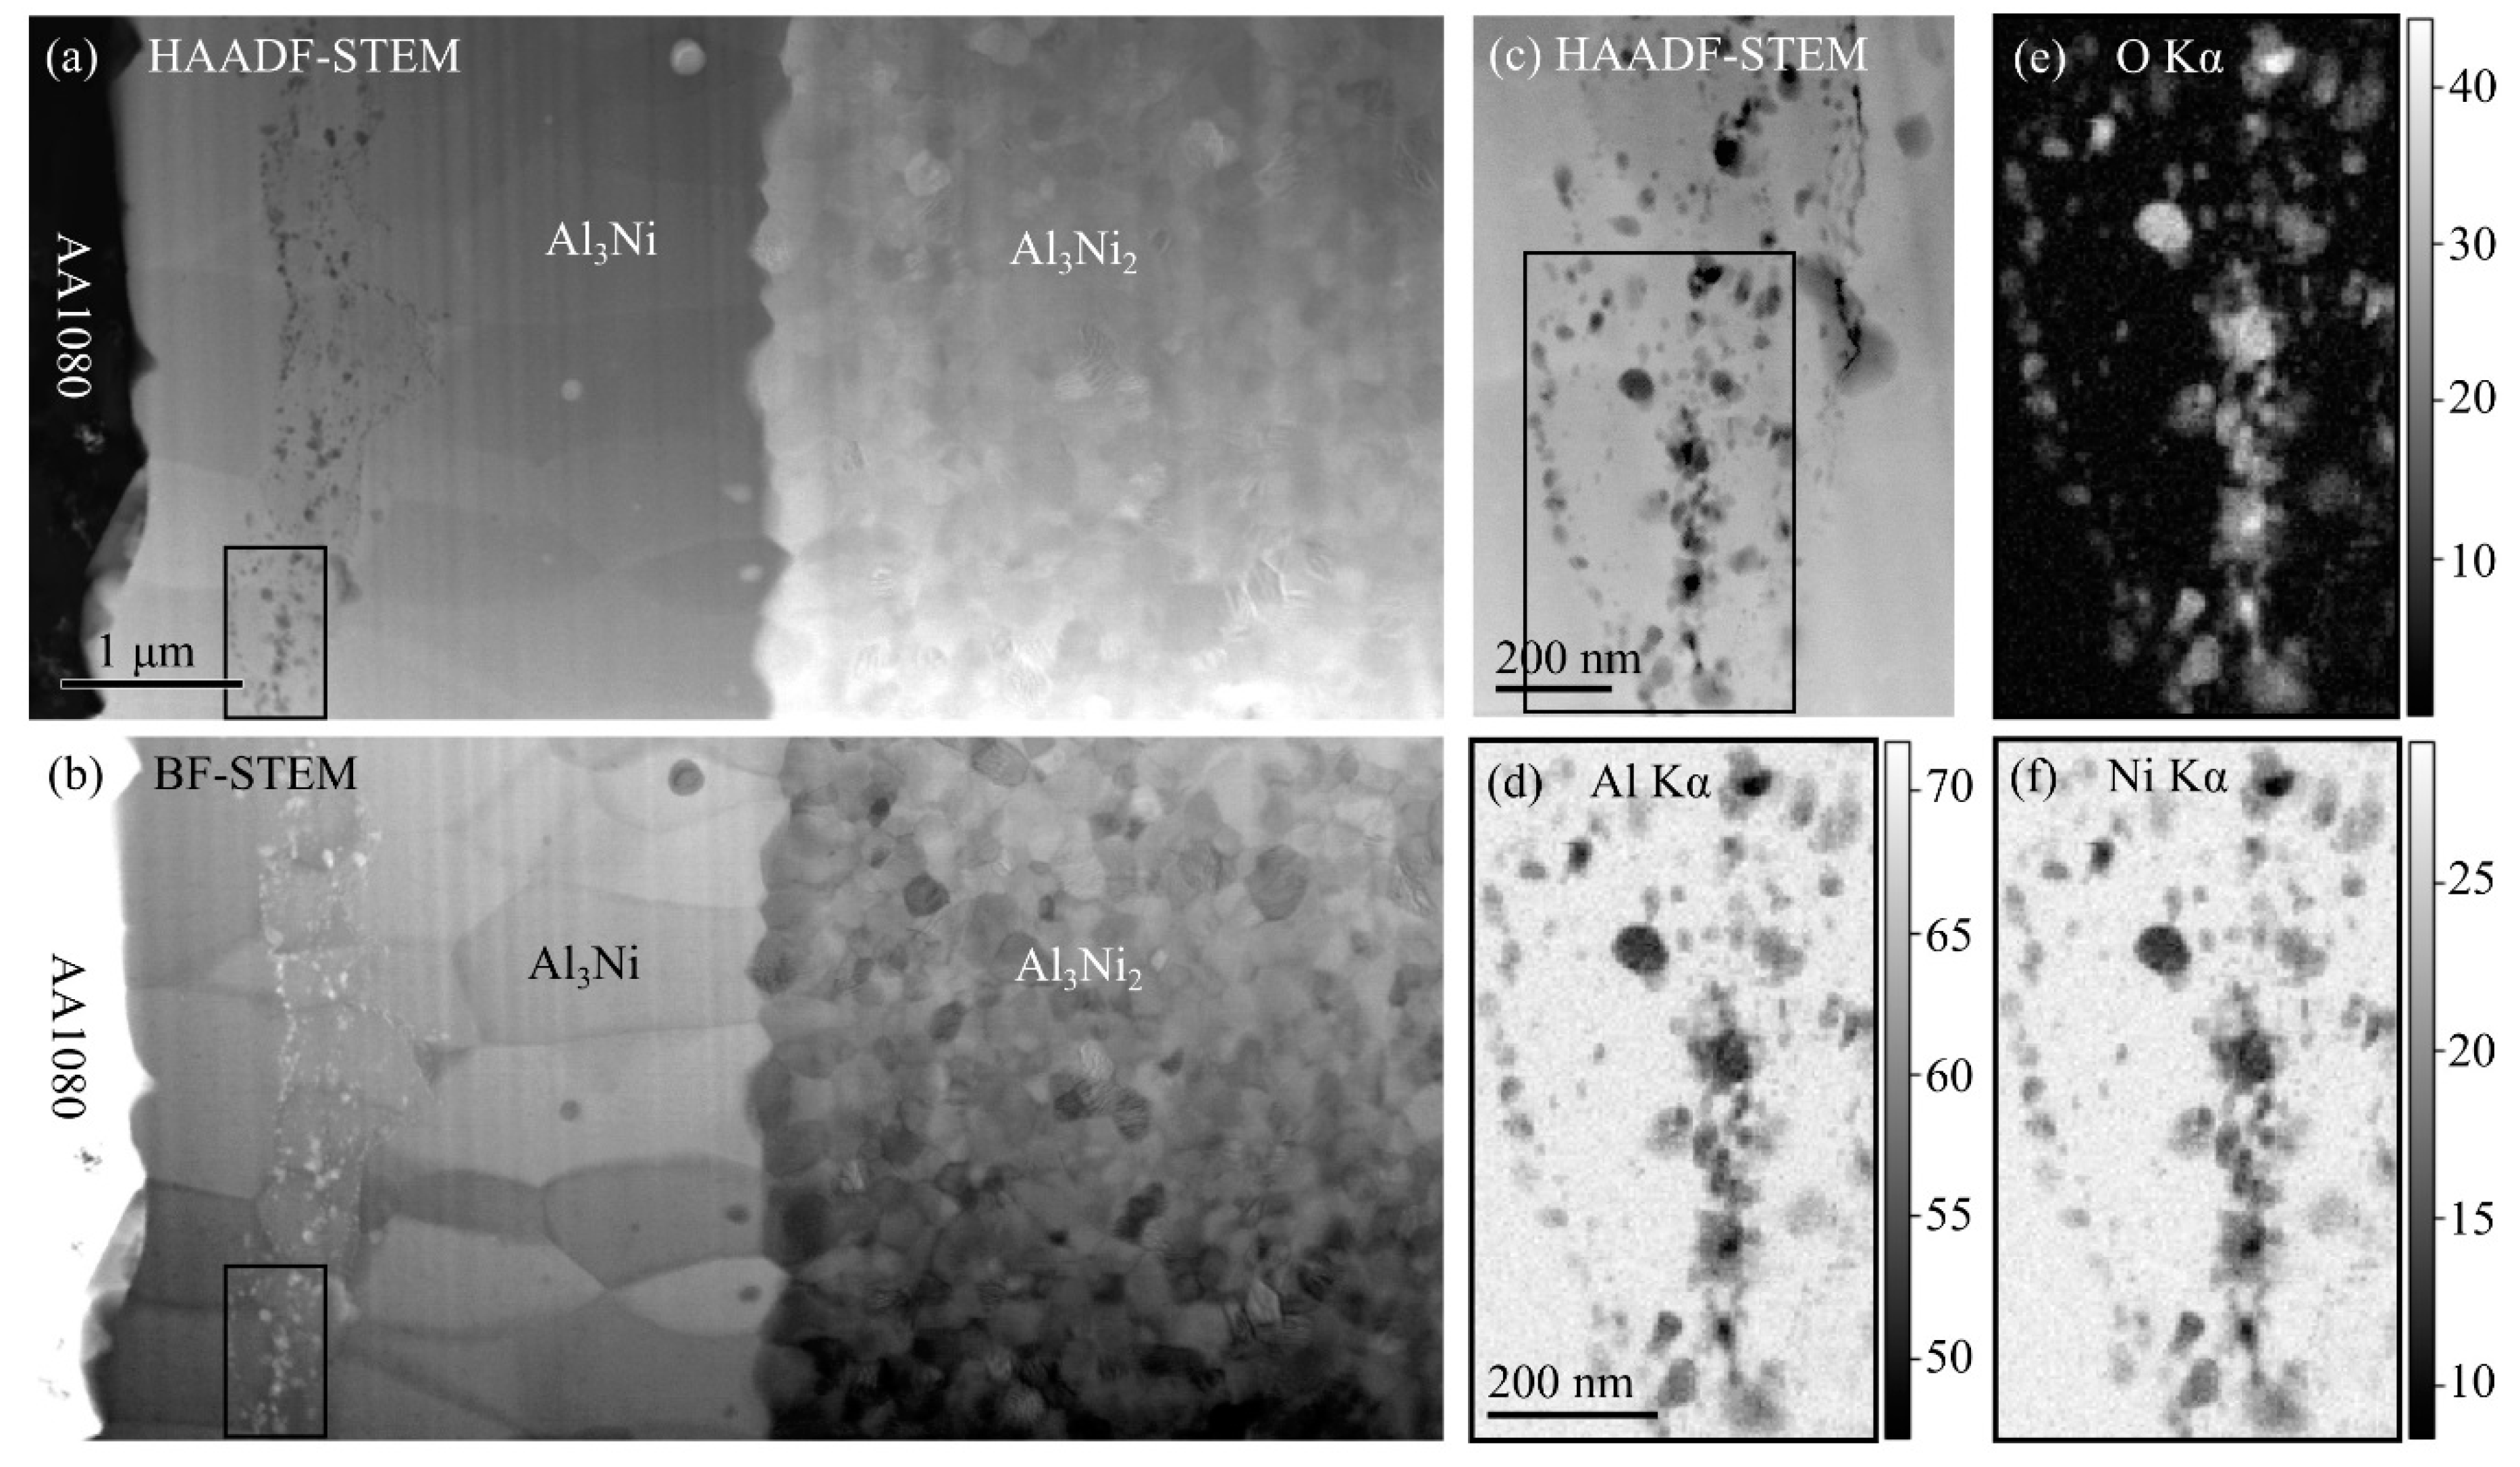
In Figure 6b, a line, consisting of what appears to be many small particles can be observed inside the Al3Ni layer, ~1 µm away from the interface towards the aluminum. Such particles were observed inside the Al3Ni layer in all the studied composites, independent of heat treatment procedure. The particles were therefore further studied with TEM, which verified the SEM observations. The composite studied with TEM was heat treated at 550 °C for one hour and had an IMP layer consisting of both Al3Ni and Al3Ni2. Figure 7a,b show an HAADF-STEM and a corresponding bright field (BF)-STEM image, while (c) shows a higher magnification HAADF-STEM image. HAADF-STEM images are often called Z-contrast images, where Z refers to atomic number, since the intensity scales as ~Z2. Hence, phases with heavy elements appear bright and phases with light elements appear dark in typical HAADF-STEM images. Thus, Al3Ni and Al3Ni2 are clearly distinguishable in (a), where the most nickel-rich phase, Al3Ni2, has the strongest contrast. In BF-STEM images, both diffraction contrast and mass-thickness contrast contribute, and the intensities of different grains depend on their crystal orientations. Thus, different grains are easier to distinguish in (b) than in (a).
In Figure 7a,b, it can be observed that the Al3Ni layer consists of several grains with a width in the order of ~1 µm, which are slightly elongated, growing perpendicular to the interface. Inside the Al3Ni layer, the previously mentioned line of particles is again observed, and as can be observed in Figure 7a,b, the line actually consists of many small particles, which lies on an approximate line. Denoised EDS maps for aluminum, oxygen and nickel are shown in Figure 7d,e,f, respectively, obtained from the area highlighted in Figure 7c. From the EDS maps, it is observed that the particles mainly consist of aluminum (~50–60 at%) and oxygen (~40–45 at%). Although the overlap of the particles with the Al3Ni phase makes quantification challenging, Al2O3 is assumed to be the most likely phase. These particles probably originated from the Al2O3 layer that formed on the aluminum surface after brushing prior to the rolling process, as well as oxygen gas which was trapped between the layers due to mechanical interlocking during the rolling process.
The Al2O3 layer on the aluminum surface is assumed to break up together with the work-hardened surface layer during the rolling process, due to the large surface expansion. Thus, after rolling, the interface between aluminum and nickel is expected to consist of separated Al2O3 fragments, with gaps where fresh aluminum has come into contact with nickel (assuming that the film theory is the main bonding mechanism). If the Al2O3 particles were inert during the subsequent heat treatment process, they could have behaved like the inert markers used during the Kirkendall experiment [11]. In the experiment, inert markers were placed along the interface between two dissimilar metals, and the movement of the markers during heat treatment was used to visualize the unequal diffusion of atoms and vacancies across the interface. The position of the inert markers was referred to as the Kirkendall marker plane. Based on the position of the Kirkendall marker plane and the growth mechanism of the IMPs between the two metals, the diffusivities of the atoms from each metal can be compared [12,13,37]. Assuming that the Al2O3 particles behaved like similar inert markers, their apparent movement could be viewed as a result of the Kirkendall effect, and the location of the particles as a Kirkendall marker plane. If that were the case, the position of the oxide particles found here would indicate that aluminum diffuses faster than nickel through the Al3Ni layer, based on the description found in [37]. This assumption is in accordance with the suggestion made in other studies [24,25,26]. However, Paul et al. [13] stated that particles with a size less than 0.1 µm might be dragged by grain boundaries during the diffusion process, as their size is below typical inert marker size (1–5 µm, depending on the studied system), which is the case in the current study. Then, the position of the particles would not represent the position of a Kirkendall marker plane. However, it is outside the scope of the current work to study in detail if the observed Al2O3 particles behaved like stable inert markers or not. Further studies are required to understand the dynamical behavior of this system and the movement of these oxide fragments during the diffusion process.

3.2.2. Characteristics of the Al3Ni2 Layer

As previously introduced, in the composites heat treated at 500 °C and 550 °C (or for more than 2–3 h at 450 °C), the Al-Ni IMP layer consisted of both Al3Ni and Al3Ni2. While the Al3Ni layer consisted of slightly elongated grains, the Al3Ni2 layer was observed to consist of small equiaxed grains with sizes below ~0.5 µm (Figure 7a,b). With increasing temperature and time, the Al3Ni2 layer was observed to become the dominating phase in the IMP layer, as previously shown in Figure 4. Konieczny et al. [34] also reported that the Al3Ni2 phase is the dominating phase after heat treatment of nickel-aluminum composites at 620 °C for one hour, fitting well with the observations in the current study and the reported findings in other studies [24,25].
In the composites heat treated at 550 °C for two hours or more, areas, where only the Al3Ni2 phase was present along the interface between aluminum and nickel, were observed. This change in the interface characteristics is shown in Figure 8a,b. Figure 8a shows an area of the aluminum-nickel interface where the IMP layer goes from consisting of both Al3Ni and Al3Ni2 to only consisting of a layer of Al3Ni2.
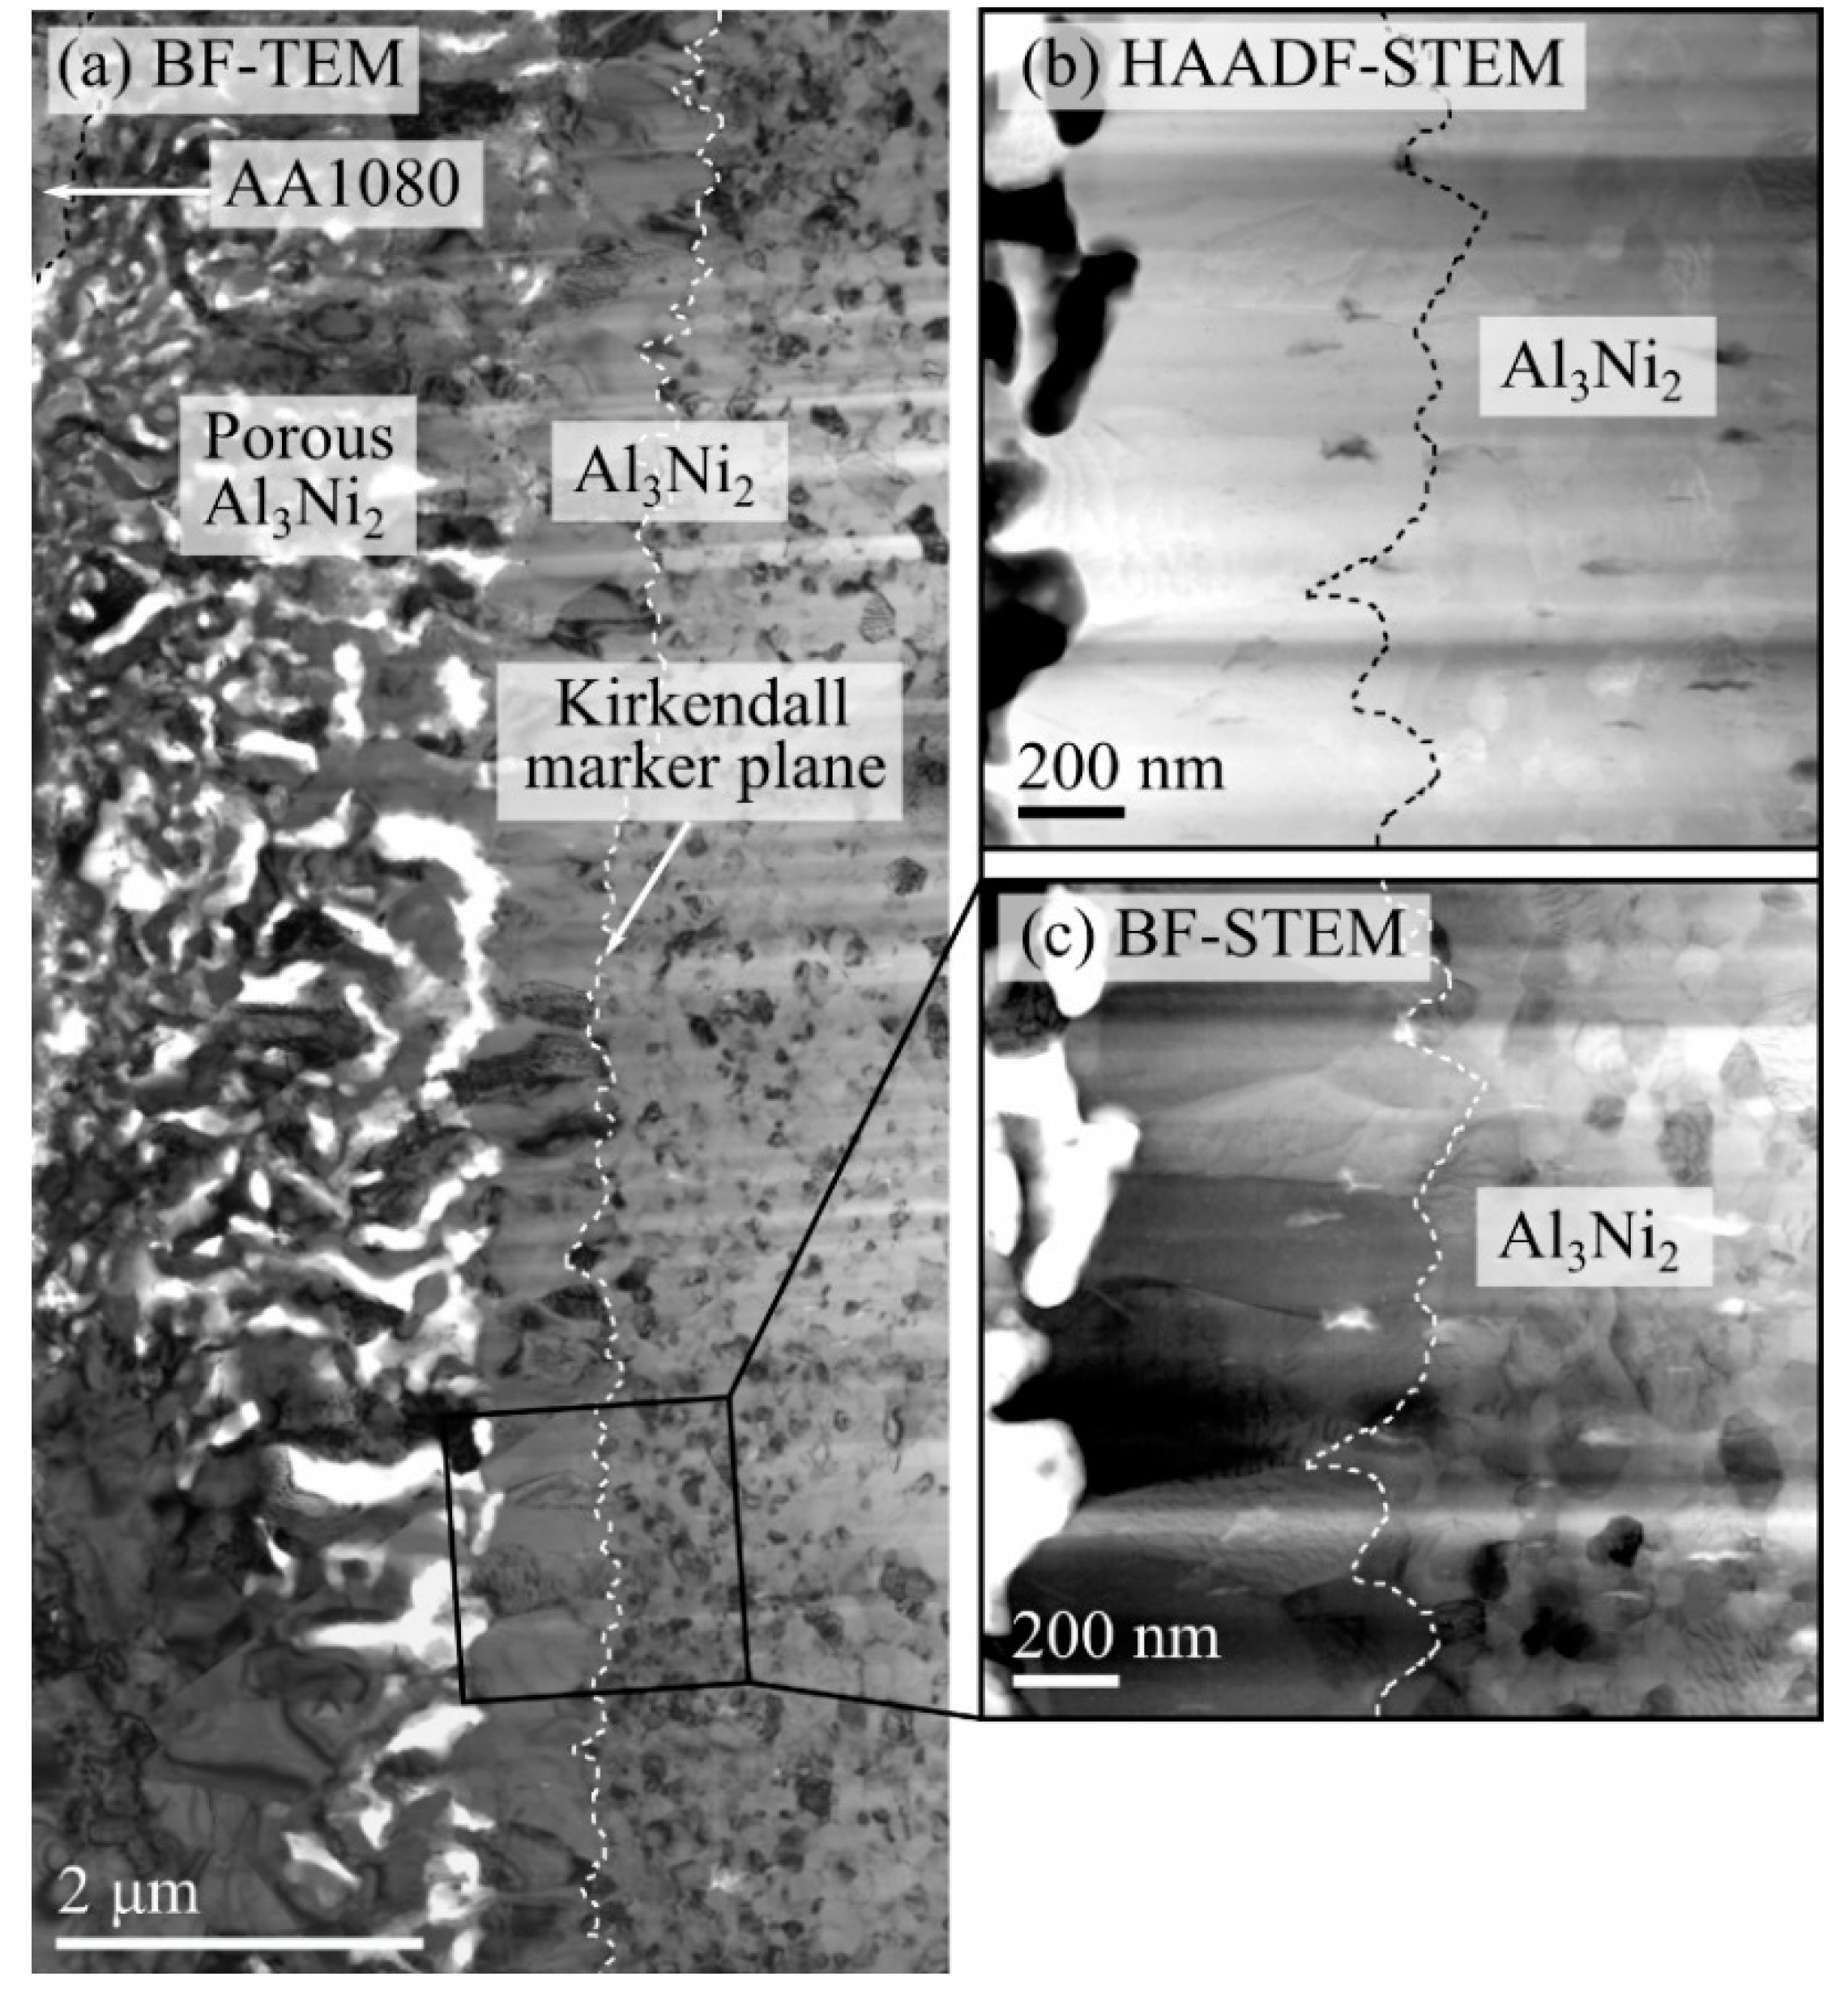
The extent of these areas, where only Al3Ni2 were present along the aluminum-nickel interface, increased with increasing heat treatment time. The growth rate of the Al3Ni2 layer is thus assumed to be much larger than for the Al3Ni layer at 500 °C and 550 °C, as already discussed. Combined with the observations made by SEM and the thickness measurements of the two phases with increasing heat treatment time, it appears that the Al3Ni2 layer grows on behalf of the Al3Ni layer, and that the Al3Ni phase is transformed into Al3Ni2. As stated by Alimadadi et al. [25], since the total thickness of the Al-Ni IMP layer still increases, the direct formation of Al3Ni2 along the interface is assumed to occur. Adabi and Amadeh [24] observed the same trend and stated that the Al3Ni2 layer thickness increased due to the diffusion of Ni-atoms through the Al3Ni2 layer until the entire Al3Ni layer was consumed. Where both phases were present along the interface, the Al3Ni2 layer consisted of small equiaxed grains. However, once the Al3Ni layer was fully consumed by Al3Ni2, a duplex morphology was observed to develop inside the Al3Ni2 layer. As shown in Figure 8b, and more clearly in Figure 8c, the fine Al3Ni2 grains change into larger elongated grains, with the longest axes in the growth direction (perpendicular to the interface). The line where the change in morphology is observed lies approximately parallel to the Al3Ni2-aluminum interface. The duplex morphology was studied more closely by TEM. An overview BF-TEM and a higher magnification HAADF-STEM image with a corresponding BF-STEM image are shown in Figure 9a–c, respectively.
The presence of a Kirkendall marker plane in the reaction zone during diffusion between two metals can not only be revealed by inert markers, but also by the presence of a duplex morphology [13,38]. The change in morphology then marks the location of the Kirkendall marker plane. Paul et al. [38] stated that the presence of a Kirkendall plane indicates that the grains grow in two different ways from the two interfaces, due to different nucleation types. Alimadadi et al. [25] also observed such a change in morphology inside the Al3Ni2 layer in their study. They stated that there is an increase in the availability of aluminum after the Al3Ni layer is fully consumed. This changes the growth speed of the Al3Ni2 phase, resulting in the duplex morphology. As observed from Figure 8c and Figure 9, the Kirkendall marker plane is located closer to the aluminum layer than the nickel layer. Following the description found in the work by Paul [37], the diffusivity of aluminum in Al3Ni2 is therefore assumed to be larger than the diffusivity of nickel. This assumption is in accordance with the discussion and observations made by Alimadadi et al. [25] and Liu et al. [26]. Adabi and Amadeh [24] on the other hand argued that nickel is the dominating diffusing element during the growth of the Al3Ni2 layer.
In addition to the Kirkendall marker plane, a region inside the Al3Ni2 layer along the interface towards the aluminum became porous once the Al3Ni layer was fully consumed, as shown in Figure 8c and Figure 9a. The formation of voids as a result of the Kirkendall effect is a known phenomenon occurring during diffusion [12,13], especially if there are large differences in the diffusivities of the different elements in a certain phase layer [37]. Based on the location of the voids, the relative diffusivities of the elements in the phase can be compared, using the examples and descriptions found in [13,37]. Since the voids lie inside the Al3Ni2 layer, close to the aluminum, it indicates that aluminum diffuses faster than nickel in the Al3Ni2 layer. The voids are formed due to the necessary vacancy flux towards the aluminum side, to compensate for the slower diffusion of nickel. This corresponds well with the previous assumption regarding the diffusivity of the elements based on the observed position of the Kirkendall marker plane. Alimadadi et al. [25] reported a porous layer inside the Al3Ni2 and found that small pores had sharp interfaces, while the rim of larger pores (>50 nm in diameter) contained a layer of Al2O3. Thus, they attributed that the pore formation was due to oxidation of Al3Ni2 layer. However, in the current study, the areas where the voids formed were not exposed to any source of oxygen during the void formation. Thus, the observed voids cannot be a result of oxidation and are assumed to be Kirkendall voids.
The heat treatments at 500 °C and 550 °C involve several different stages of growth, i.e., formation and growth of Al3Ni, followed by the formation and growth of Al3Ni2, the transformation of Al3Ni into Al3Ni2 and the development of Kirkendall voids along the Al3Ni2-aluminum interface. However, still, the thickness of the total IMP layer follows a linear relationship with the square root of time for all the conduced heat treatments, as shown in Figure 5. This is similar to the findings reported in other studies [24,25,26,35]. Changes in the slope of the curve might be expected if the growth rate controlling mechanism changes during these different growth stages. However, from the measurements presented in Figure 5, this cannot be concluded within the calculated error-bars. Further studies would be required in order to fully understand the kinetics regarding the formation and growth of the two Al-Ni IMPs and how the formation of the Kirkendall voids along the Al3Ni2-aluminum interface eventually influence the growth process.

3.3. Relationship between the Intermetallic Layer and Bond Strength

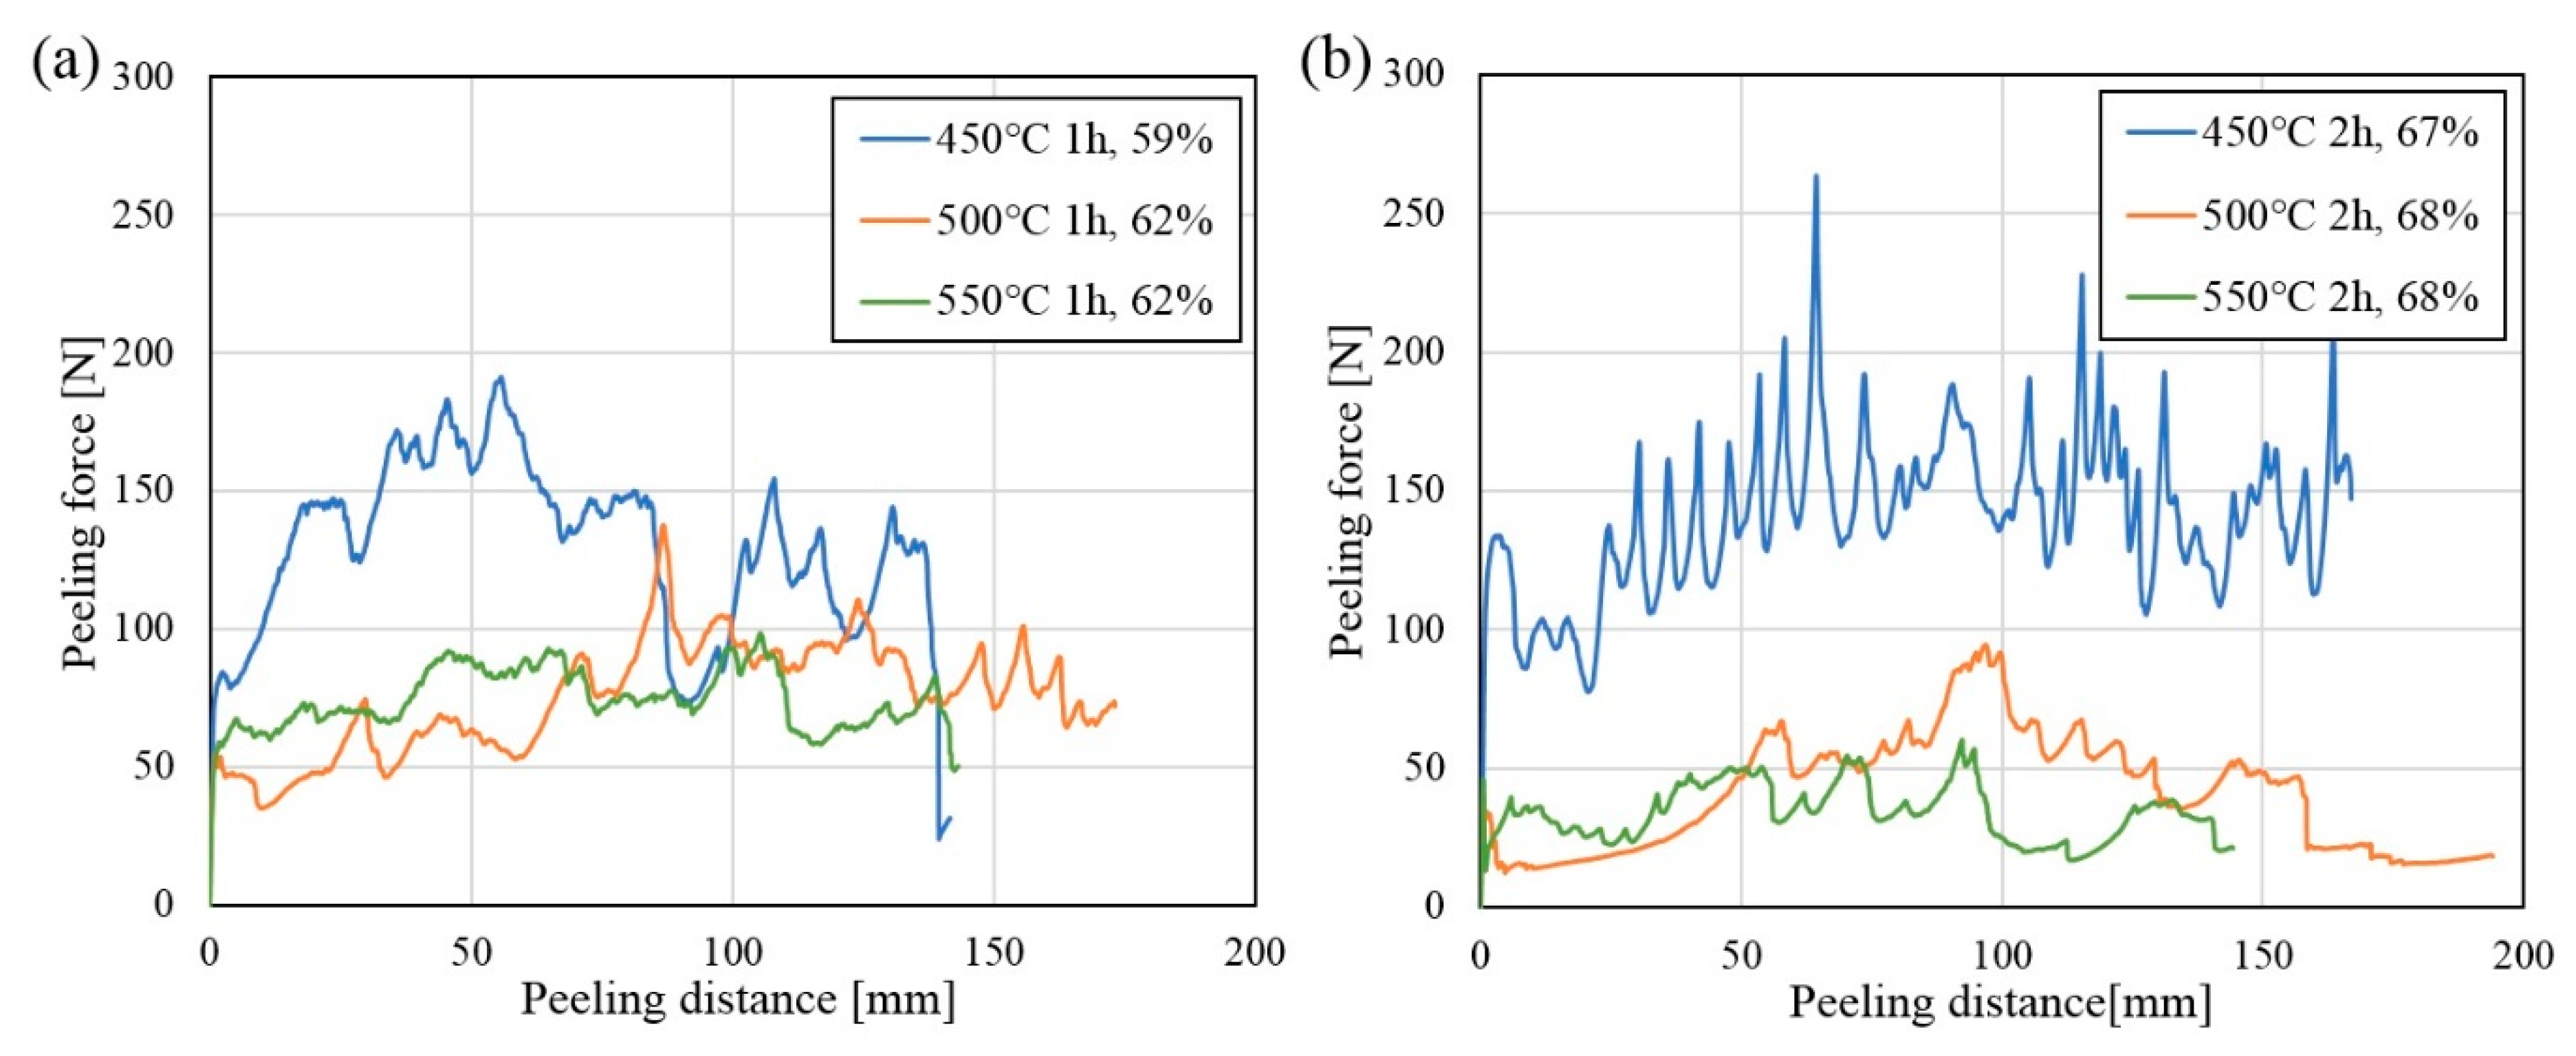
Selected composites with similar thickness reductions were chosen to be heat treated for the same period at 450 °C, 500 °C and 550 °C followed be peel-testing, in order to get an initial overview of the effect of the Al-Ni IMP layer on the bond strength. The results from the peel-tests are presented in Figure 10a,b, after heat treatment at the three temperatures for one and two hours, respectively. The graphs show the force necessary to delaminate the peel-testing specimens (peeling force) as a function of specimen length (peeling distance). A high peeling force indicates a high bond strength between the layers that are delaminated, as given by Equation (1).
In Figure 10a,b it is observed that a high peeling force is required in order to delaminate the composites. This means that the conducted post-rolling heat treatments have resulted in an increase in bond strength. The highest bond strengths are observed for the composites heat treated for one and two hours at 450 °C (blue curves, Figure 10a,b). A decrease in bond strength with increasing heat treatment temperature and time is observed for the composites heat treated at 500 °C and 550 °C (orange and green curves, Figure 10a,b).
In some of the presented peel-testing curves, large fluctuations can be observed. The produced composites were symmetrically stacked, with nickel on both sides of the aluminum in the middle and steel as the outer layers, as showed in Figure 1. It was observed that the fracture changed location during the peel-test, occurring between the same metal layers, but alternating between the two similar locations in the composite, which resulted in these fluctuations.
After rolling and after the different heat treatments, hardness measurements were taken in the steel and aluminum layers. The nickel layers were too thin to obtain any valid hardness measurements. No differences in the hardness were observed in any of the layers after heat treatment for one and two hours, and therefore, the average hardness values presented in Table 2 are based on measurements from both cases.
The measured hardness values were observed to be independent of the total thickness reduction. From Table 2, it can be observed that the hardness of the aluminum is similar after heat treatment at the different temperatures, while the hardness of the steel decreases slightly with increasing heat treatment temperature. The decrease in hardness in the steel layers might influence the peel-testing results, as the peel-test requires the metal layers to be bent 90°, and less force is required to bend metals with a lower hardness. However, it is assumed that this effect has little influence on the measured bond strengths in the current study. When comparing the peel-testing curves for the composites heat treated at 450 °C and 500 °C in Figure 10, a clear difference in the measured peeling force can be observed between the composites, even though the steel layers in the composites have a similar hardness after the two heat treatments.
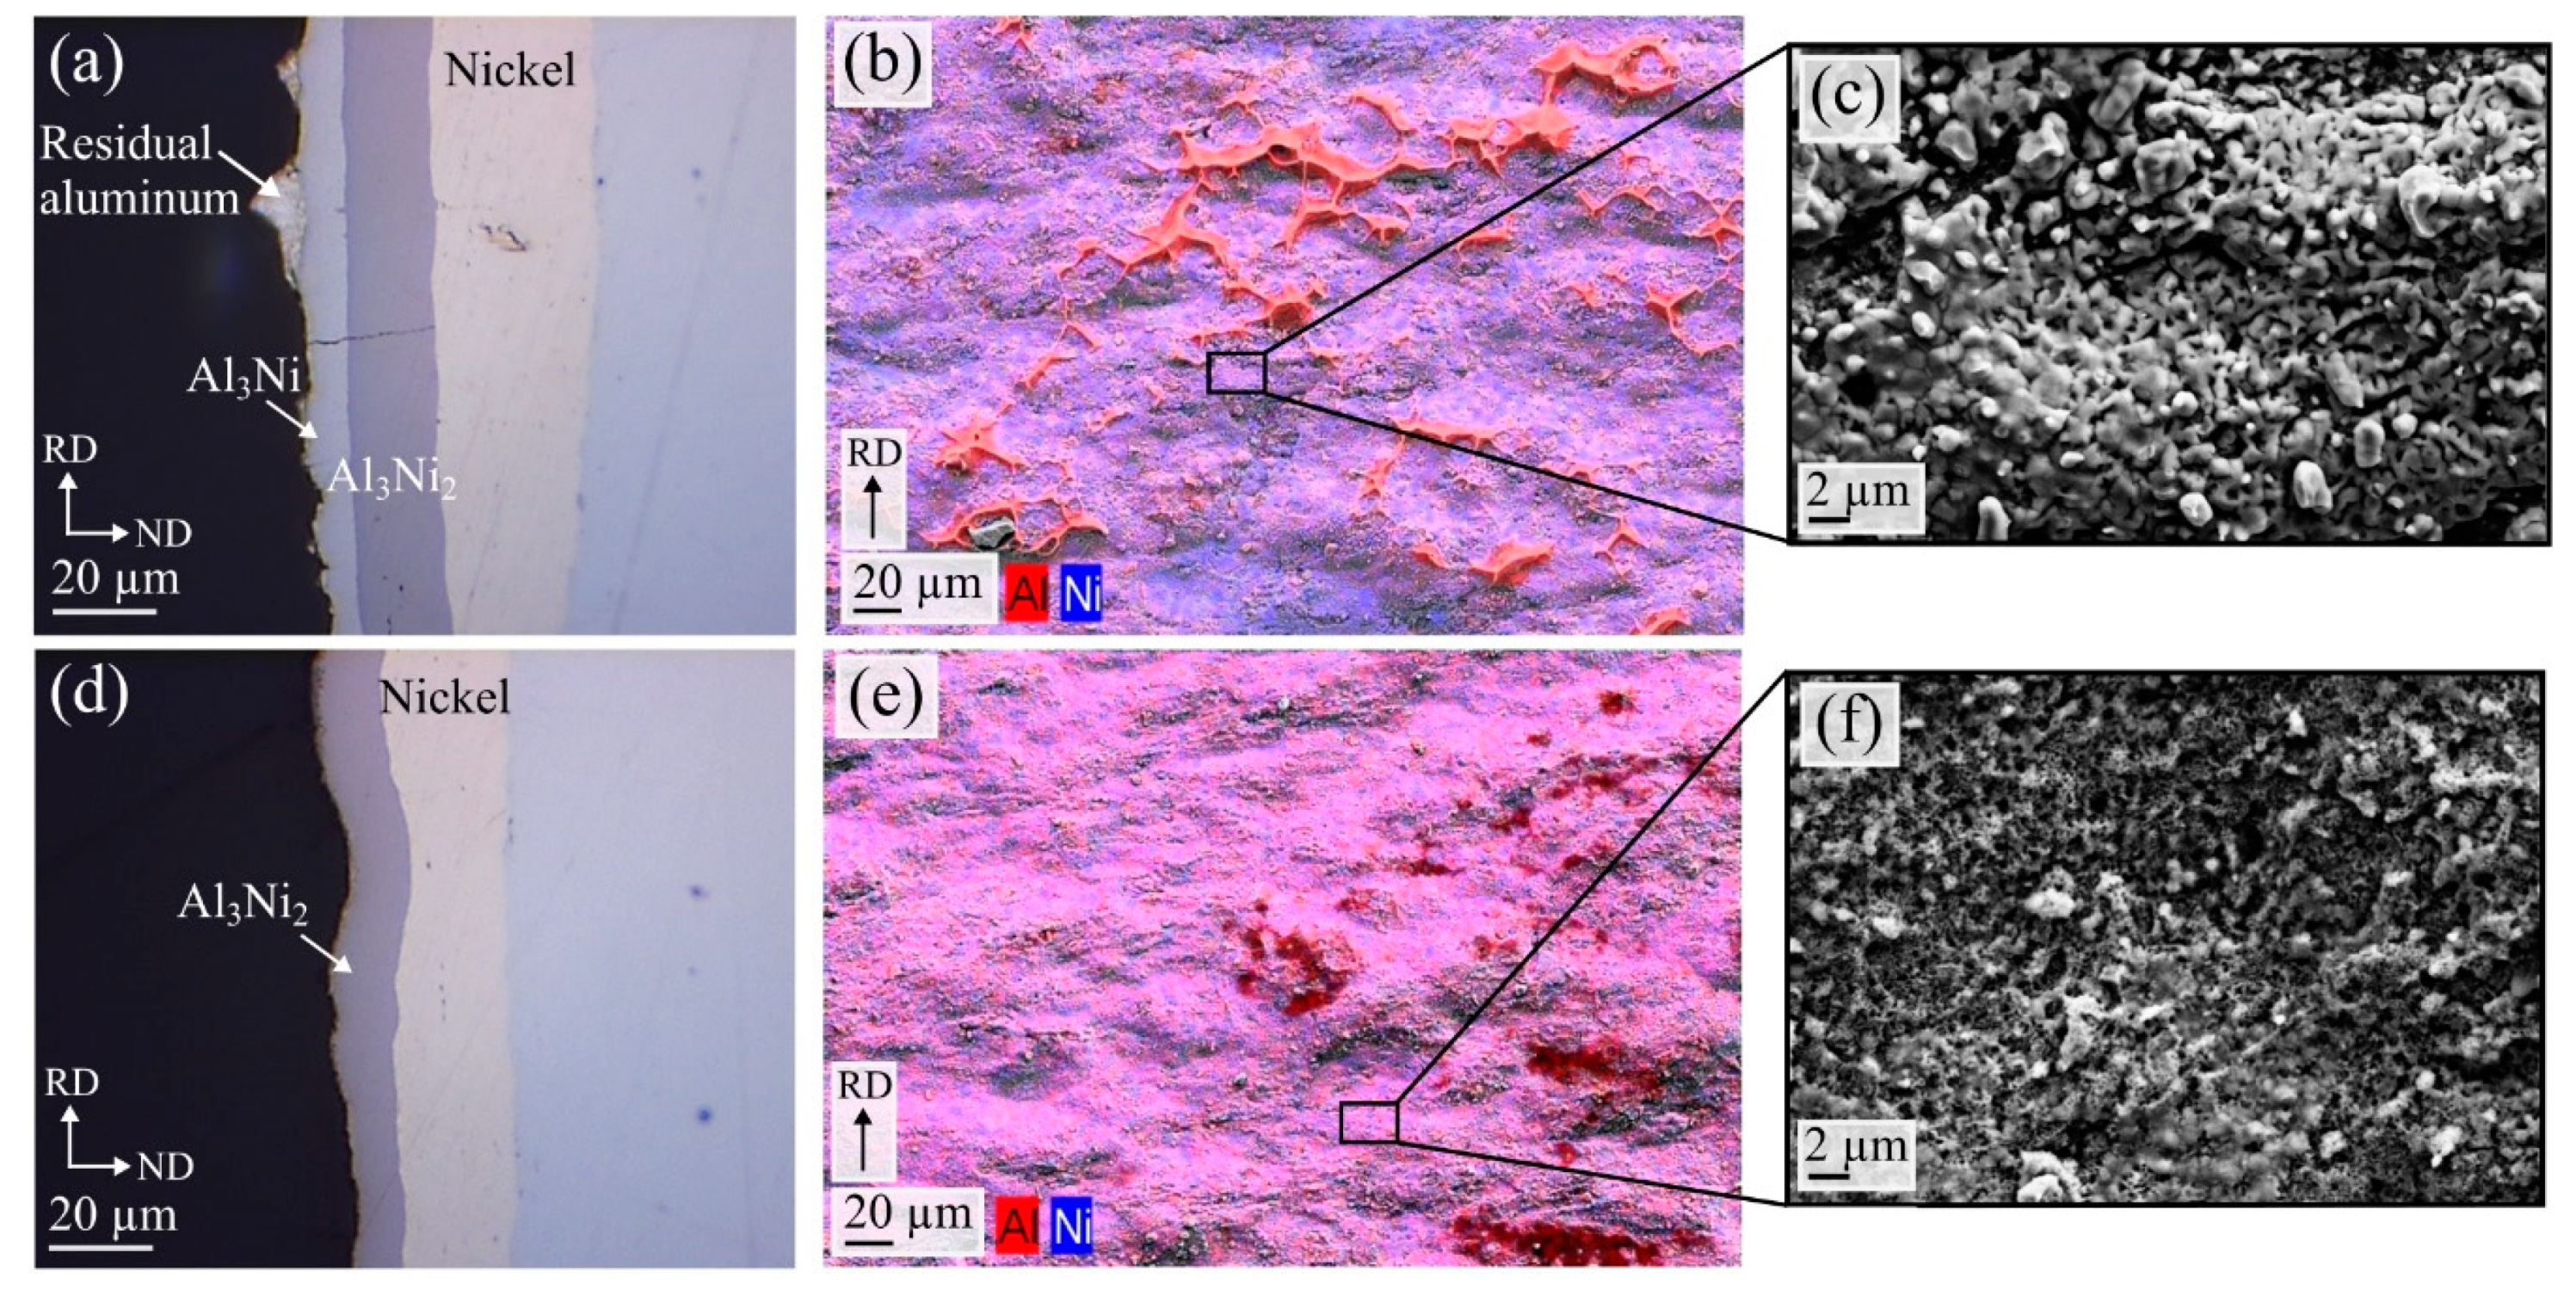
The composites heat treated at 500 °C and 550 °C had the lowest bond strengths, which decreased with increasing heat treatment time, as shown in Figure 10a,b. Afterwards, the cross-section and the fracture surfaces were studied in order to investigate the fracture mechanism. The obtained images are shown in Figure 11a–f, comparing the fracture mechanisms occurring after heat treatments at 500 °C and 550 °C. For the composites heat treated at 500 °C, the fracture occurred along the Al3Ni-aluminum interface, as shown in Figure 11a, showing the cross-section of the fracture surface. Figure 11b shows an SEM image of the corresponding fracture surface combined with EDS color mapping. Residual aluminum on the Al3Ni fracture surface can be observed in both the cross-section image, Figure 11a, and on the fracture surface, Figure 11b, where the detected aluminum is colored red. The residual aluminum has a dimpled characteristic, consistent with a ductile fracture. The rest of the fracture surface appears flat, indicating a brittle fracture. Thus, a thick Al-Ni IMP layer consisting of both Al3Ni and Al3Ni2 was found to decrease the bond strength.
As previously shown for the composites heat treated at 550 °C, the Al3Ni layer was in some areas completely consumed by the growing Al3Ni2 layer. The interface between the Al3Ni2 layer and the aluminum developed a porous structure (Figure 8c), due to the Kirkendall effect. In the areas where only Al3Ni2 was present along the aluminum-nickel interface, the fracture characteristics shown in Figure 11d–f were observed. From the cross-section image in Figure 11d, a clear fracture between the aluminum and the Al3Ni2 layer can be observed. On the Al3Ni2 fracture surface, Figure 11e, no dimpled residual aluminum can be seen, and the surface appears flat, consistent with a brittle fracture. Figure 11c,f show high magnification images of the fracture surfaces with the two fracture mechanisms. The Kirkendall voids found along the Al3Ni2-aluminum interface resulted in the surface seen in Figure 11f, with many small grooves on the fracture surface. This characteristic was only observed in the composites which obtained the lowest bond strength values. Due to the Kirkendall voids, the fracture has easily propagated along the Al3Ni2-aluminum interface [12]. Thus, post-rolling heat treatments resulting in only an Al3Ni2 layer along the interface should be avoided, when a high bond strength is desired.
As shown by Shi et al. [39] studying the Al-Ni IMP using density functional theory, the Al3Ni phase was found to be ductile, while the Al3Ni2 phase was found to be brittle. In the current study, the fractures only occurred along the interfaces between the Al-Ni IMP layer and aluminum, and not inside the Al-Ni IMP layers themselves. As shown in Figure 11a, the fracture runs along the Al3Ni-aluminum interface, indicating that the Al3Ni2 layer bonds stronger to both Al3Ni and nickel, than Al3Ni bonds to aluminum. Hence, the fracture surfaces presented in Figure 11 demonstrate that the Al3Ni2 phase is not what causes the fracture even though this phase was assumed to be the most brittle based on the work by Shi et al. [39].
As observed in Figure 10, the composites heat treated at 450 °C obtained the highest bond strength during the initial tests. In these composites, the IMP layer only consisted of a layer of Al3Ni, as previously introduced, and the fracture characteristics observed in these composites are presented in Figure 12a–c. Figure 12a shows an optical microscopy image of the cross-section of the Al3Ni fracture surface. A thin layer of Al3Ni can be seen together with residual aluminum. No signs of fracture between the Al3Ni layer and nickel is observed. Individual high magnification SEM images combined with EDS color mapping of the Al3Ni and aluminum fracture surfaces are presented in Figure 12b,c.
Large amounts of residual aluminum can be observed on the Al3Ni fracture surface, Figure 12b, which have a band like structure, lying perpendicular to the rolling direction. The residual aluminum has a clear dimple-like characteristic, indicating that a ductile fracture has occurred in the aluminum. The dimple-like characteristic is also clearly observed on the aluminum fracture surface, Figure 12c. These images suggest that the main part of the fracture has occurred in the aluminum and also partially along the Al3Ni-aluminum interface. Separation occurring between the Al3Ni layer and the aluminum has been previously reported, similar to the current study [24,25]. However, in the study by Adabi and Amadeh [24] the formation of Kirkendall voids along the Al3Ni-aluminum interface was assumed to be the reason for the separation after heat treatment at 450 °C for 240 min. This was not observed in the current study.
When comparing the two Al3Ni fracture surfaces in Figure 11b and Figure 12b, a large difference in the amount of residual aluminum can be observed. The observed decrease in the amount of residual aluminum on the Al3Ni fracture surface in the composite heat treated at 500 °C can be related to the decrease in the measured bond strength for those composites.
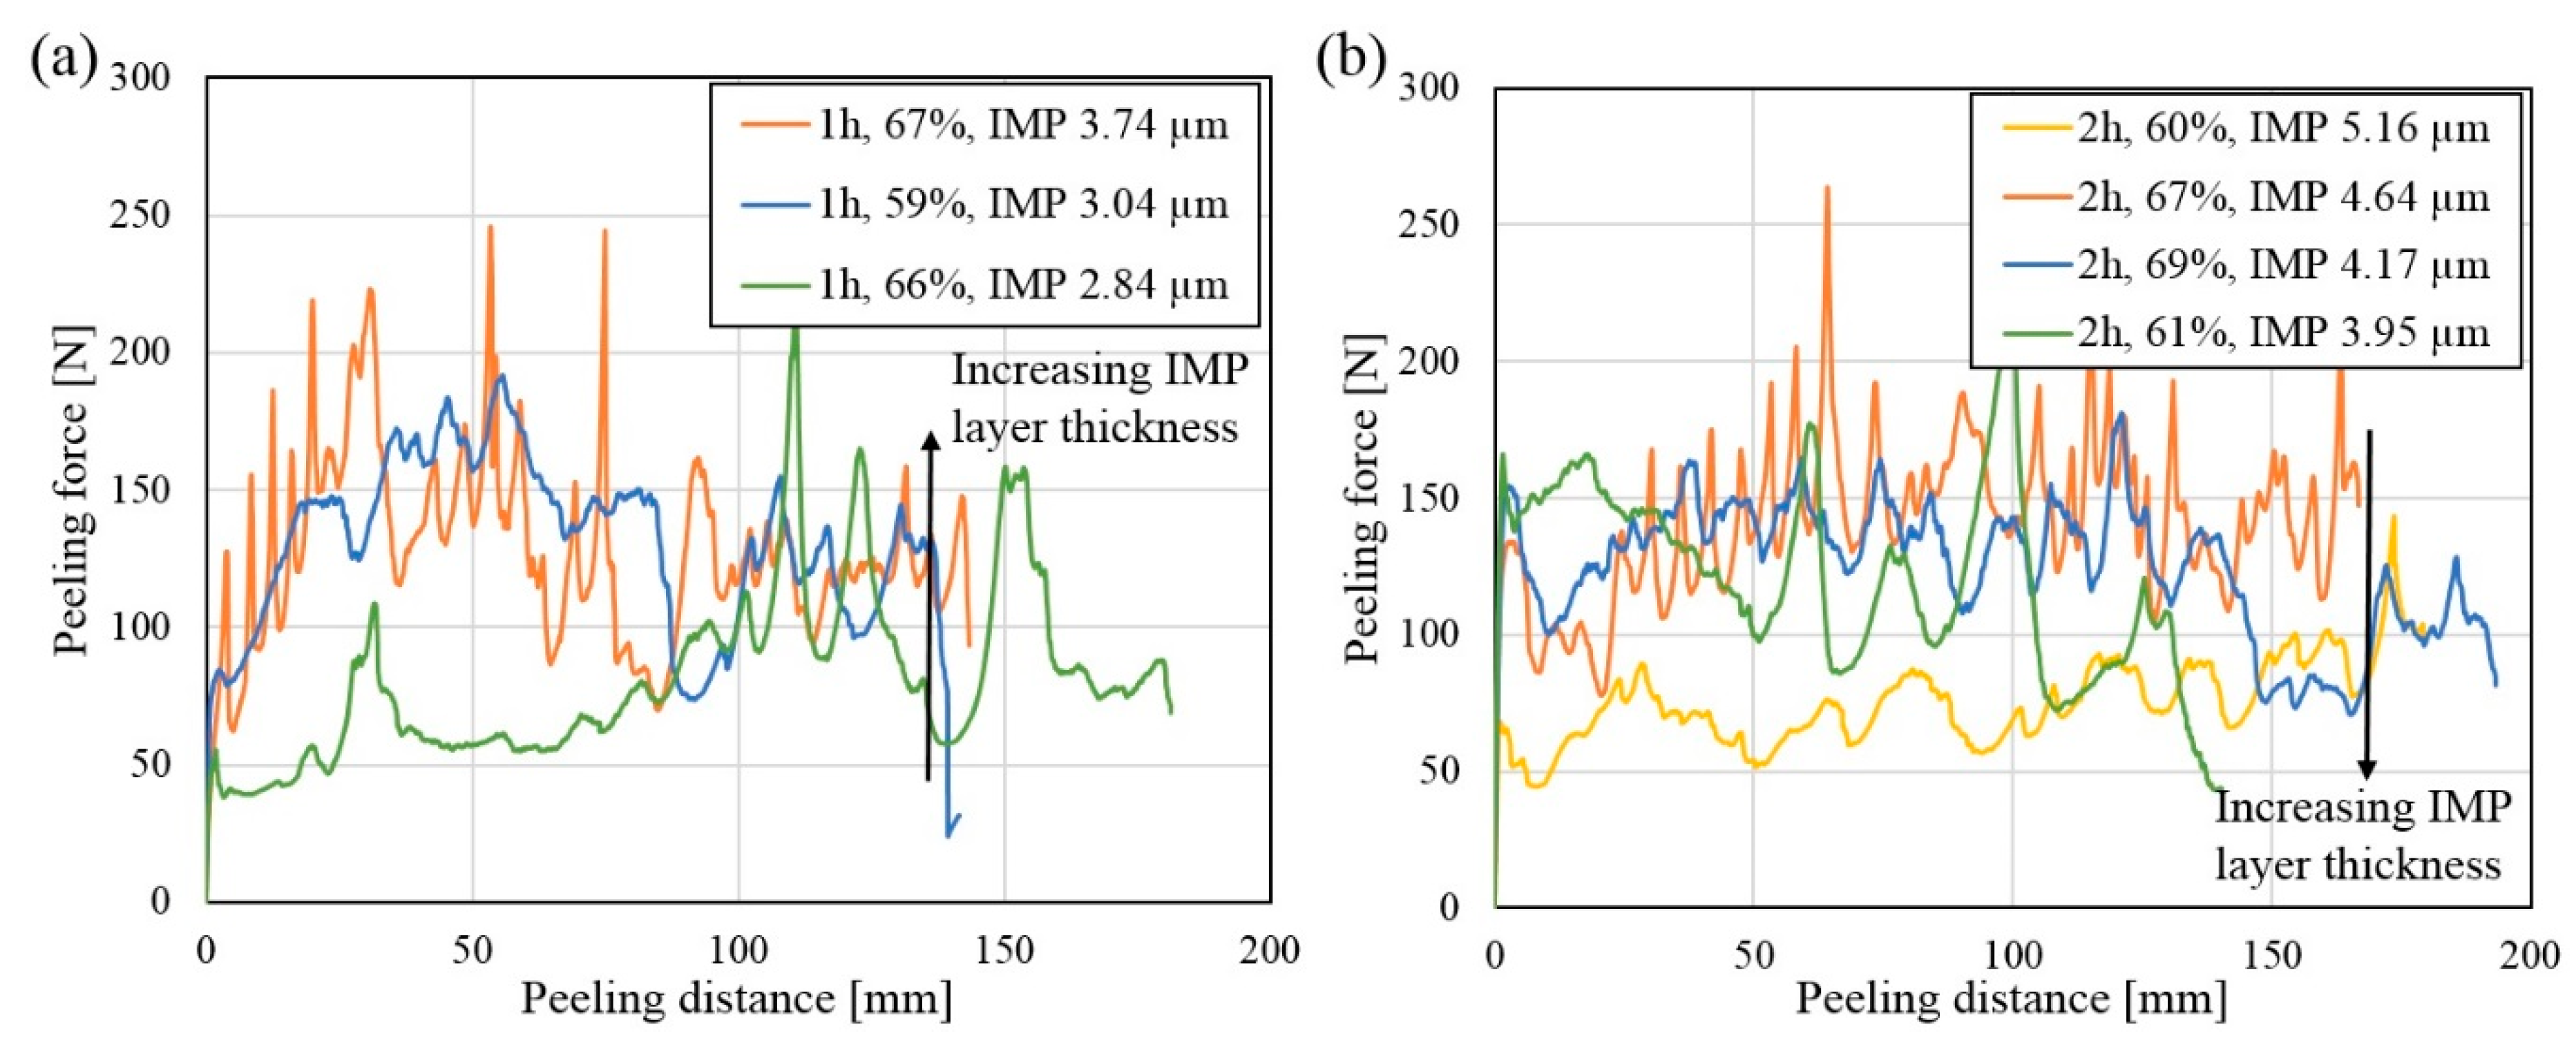
Based on the initial peel-testing results (Figure 10), the main focus was placed on the composites heat treated at 450 °C, which obtained the highest bond strengths, in order to better understand the relationship between the Al3Ni layer thickness and the bond strength. Additional composites were heat treated, and composites with different thickness reductions were selected for heat treatment at one and two hours. The results from these peel-tests are shown in Figure 13a,b. The total thickness reduction and average Al3Ni layer thickness are given in the legends in the two graphs. Again, as observed in the peel-testing curves in Figure 10, there are large fluctuations in the measured values.
Figure 13a shows the peel-testing curves for the composites heat treated for one hour. The green curve is observed to lie slightly below the other two curves for the majority of the peeling distance. In these composites, the bond strength (given by the measured peeling force) is observed to increase with increasing Al3Ni layer thickness, as indicated by the arrow. Figure 13b shows the peel-testing curves for the composites heat treated for two hours. For the majority of these composites, the peeling force is observed to be similar, lying between ~100–160 N. However, for one composite, the peeling force is observed to be lower, lying around 60–70 N (yellow curve, Figure 13b). Hence, this composite has a lower bond strength compared to the other composites. As can be seen in the legends in Figure 13b, the composite that had the lowest measured peeling force is also the composite which has the thickest Al3Ni layer. This shows that the bond strength decreases with increasing Al3Ni layer thickness. For all the peel-tested composites, no clear influence of the total thickness reduction on the bond strength was observed.
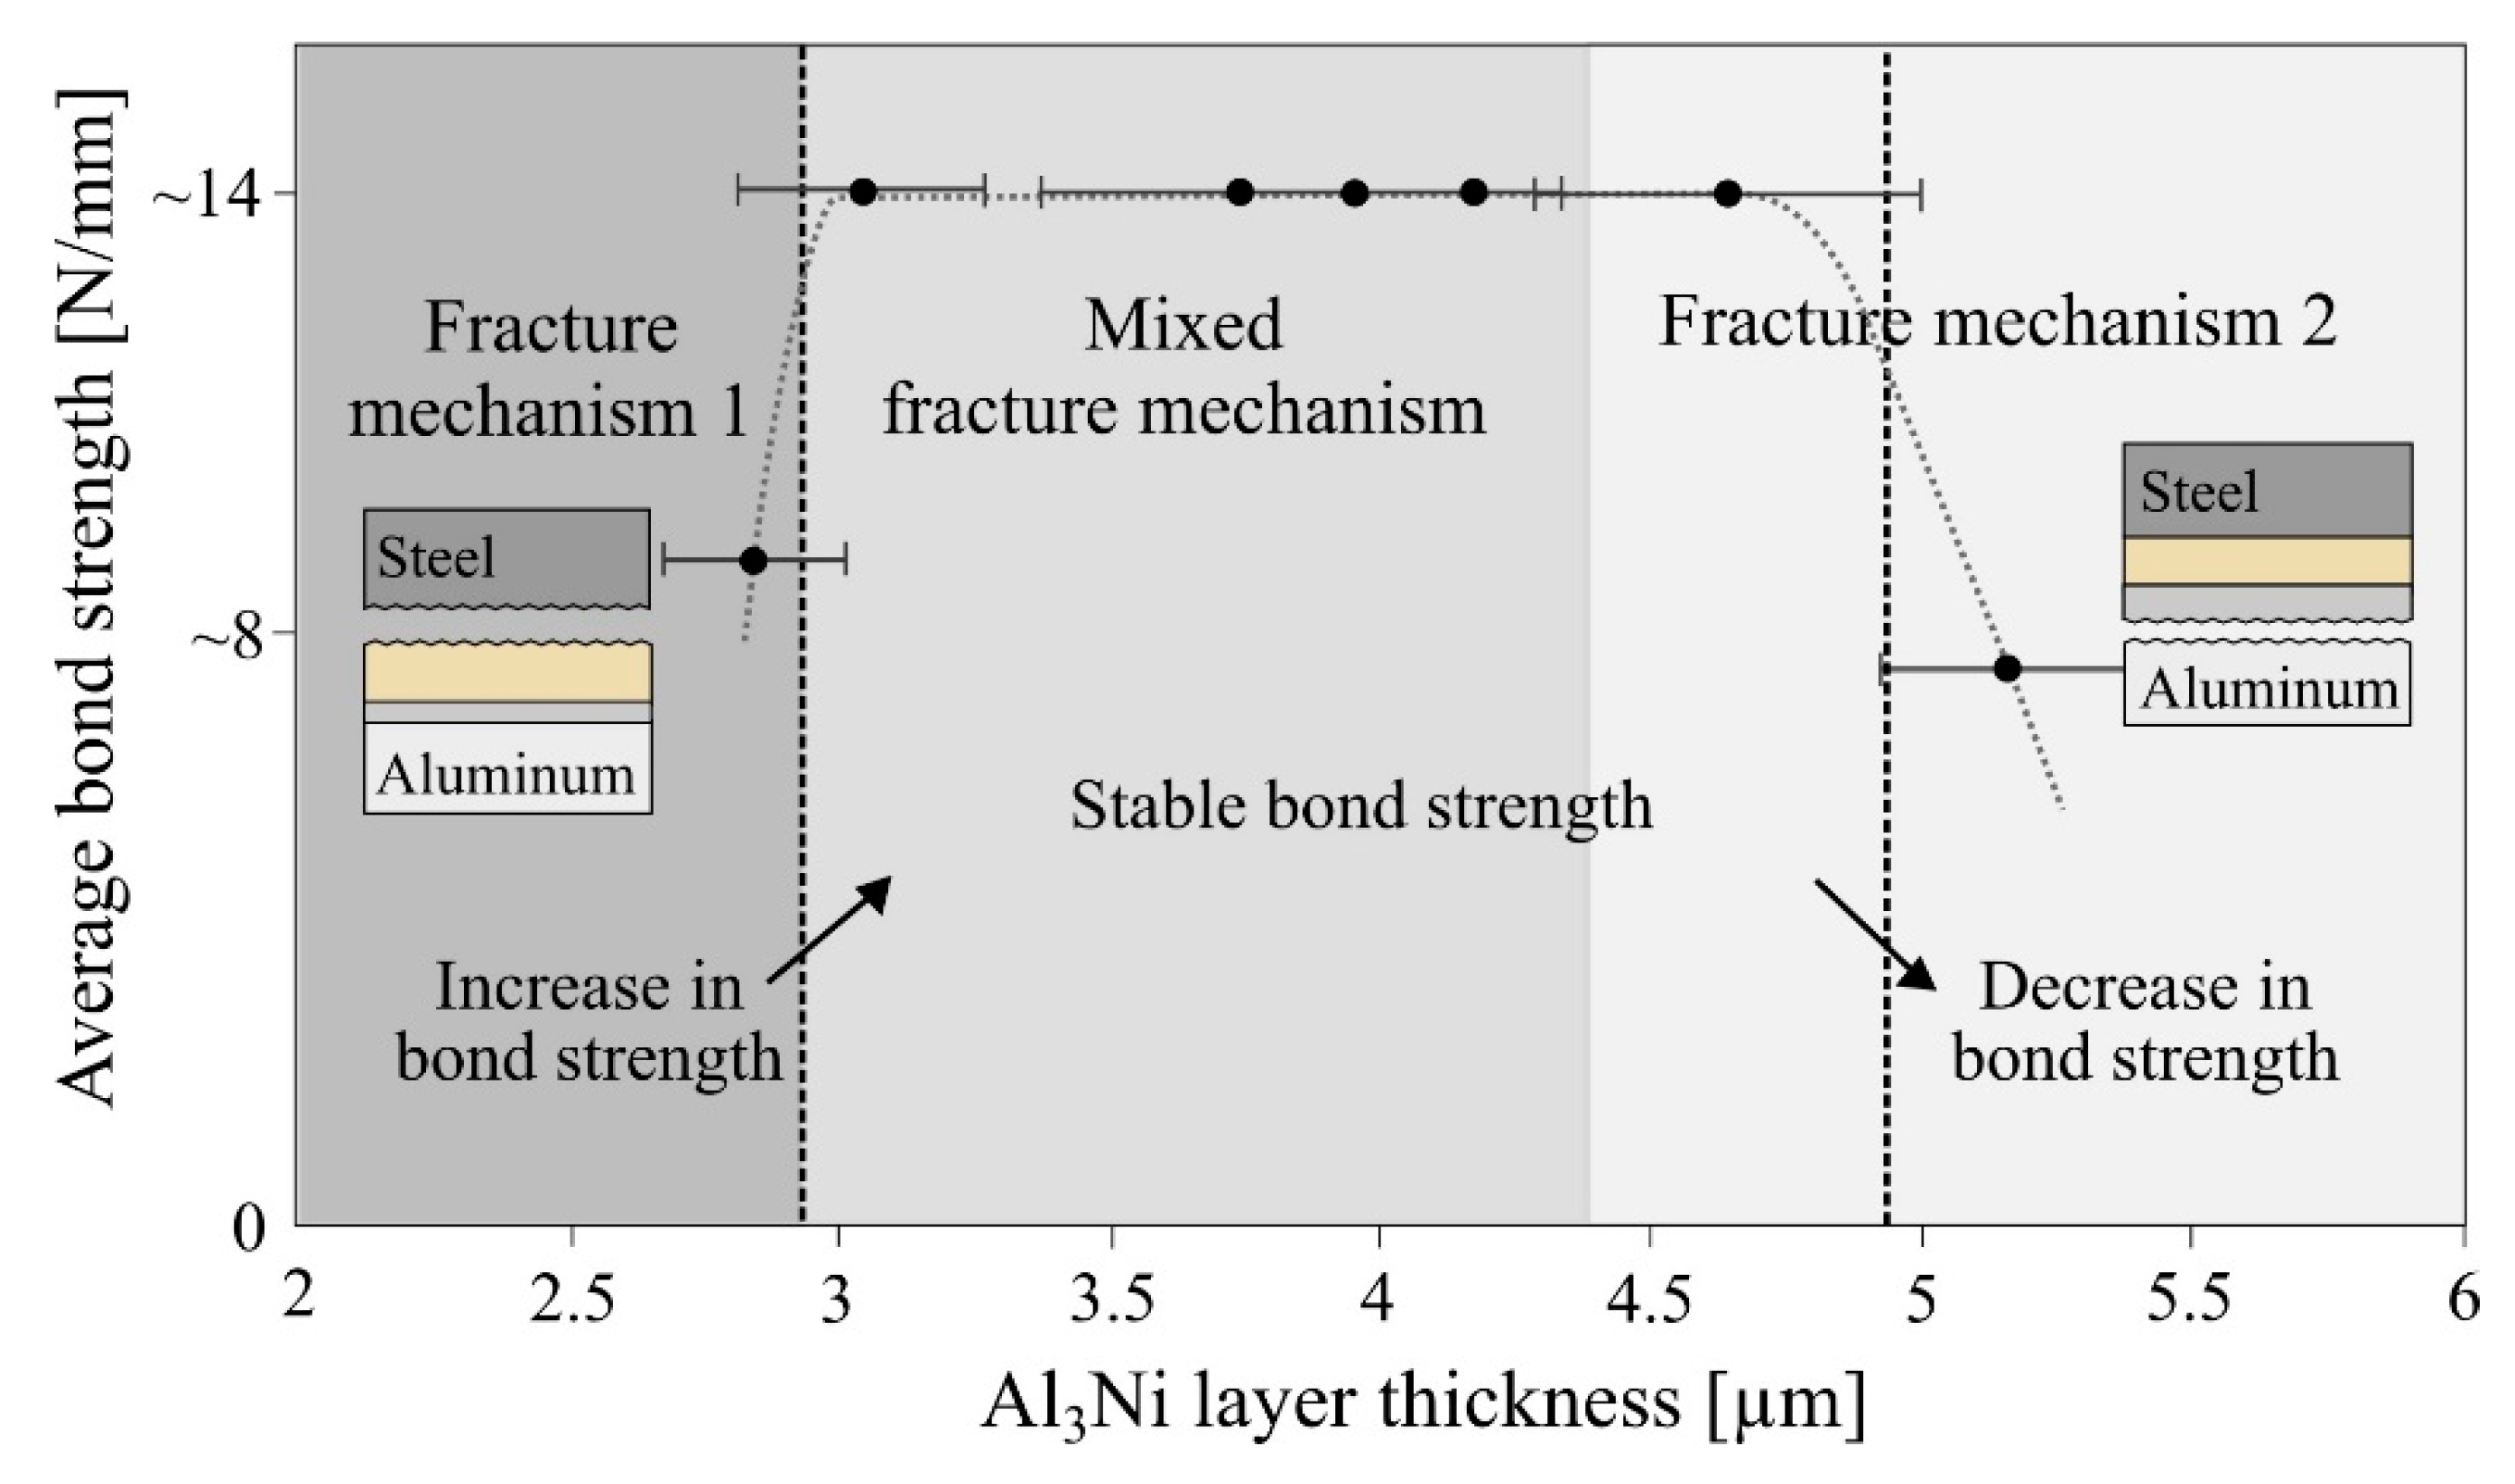
When comparing the Al3Ni layer thickness and the obtained peel-testing curves for each of the composites heat treated at 450 °C, it is observed that bond strength is strongly influenced by the Al3Ni layer thickness. The graphical illustration presented in Figure 14 summarizes the relationship between the achieved average bond strength (calculated by Equation 1) and the Al3Ni layer thickness. The different grey-scaled areas indicate the three different fracture mechanisms observed in the composites. The fracture in the peel-tested composites heat treated at 450 °C was observed to either occur between the steel and nickel layers (fracture mechanism 1), between the aluminum and the Al3Ni layer (fracture mechanism 2) or a mix of both fracture mechanisms. Due to the large fluctuations in the peel-testing curves shown in Figure 13a,b, it was difficult to calculate an accurate average bond strength for the composites, thus a rough estimate based on the peel-testing curves are used in Figure 14.
In the composite which obtained the lowest bond strength after one hour heat treatment (green curve, Figure 13a), the fracture occurred along the steel-nickel interface (fracture mechanism 1) and this composite was observed to have the lowest Al3Ni layer thickness (<3 µm). For the rest of the composites, which had an Al3Ni layer thickness between 3.0–4.5 µm, the fracture changed from mechanism 1 into the mixed fracture mechanism, and a clear increase in bond strength was observed. This indicates that for Al3Ni layers between ~3–4.5 µm, neither the steel-nickel nor the Al3Ni-aluminum interface is the weakest. With increasing heat treatment time and Al3Ni layer thickness (>4.5 µm), the fracture changed into mechanism 2 and only occurred along the Al3Ni-aluminum interface.
Typically, steel and nickel are diffusion bonded at temperatures between 800–950 °C [15,22]. From the observations made in the current study, it was found that a certain heat treatment time, at least one hour at 450 °C was necessary for the steel-nickel bonding to become sufficiently strong. Eventually, the Al3Ni-aluminum interface became the weakest part of the joint. This indicates that a high bond strength is achieved by a combination of obtaining a sound joint between steel and nickel due to diffusion, and the growth of the Al3Ni layer along the aluminum-nickel interface. Peel-tests of composites heat treated for shorter times at 450 °C were therefore not conducted.
An approximately similar bond strength could be observed in the composites which had an Al3Ni layer thickness between ~3–5 µm, as shown in Figure 14. This indicates that a certain Al3Ni layer thickness promotes a high bond strength. Then, when the critical thickness is reached, the bond strength decreases. Based on the presented results in Figure 14 it is suggested that an Al3Ni layer with a thickness between ~3–5 µm is one of the main criteria for obtaining a high bond strength for the studied material combination. This observation corresponds well with the results reported in the study by Xiong et al. [21] on diffusion bonded aluminum-copper composites with a nickel-interlayer. They reported that the thickness of the Al3Ni layer was below 3.8 µm and that this resulted in a high bond strength.
From the IMP layer thickness measurements presented in Figure 5, it can be observed that a total IMP layer thickness in the range of 3–5 μm can be obtained through heat treatments at all the investigated temperatures for very different heat treatment times. After heat treatment at 500 °C for 15 min, and 550 °C for 5 min, IMP layers had formed along the aluminum-nickel interfaces, which consisted of Al3Ni and Al3Ni2 with a thickness of 3.9 μm and 4.2 μm, respectively. With such short heat treatment times, the IMP layers were observed to be slightly discontinuous along the interfaces, and the thickness was found to be very sensitive to small changes in heat treatment time. Thus, these temperature-time combinations were not subjected to any further studies, as they were argued to be unfit and non-applicable in industrial applications. During heat treatment at 400 °C, the IMP layer had only reached a thickness of 2.5 μm after four hours. Based on the obtained measurements, a heat treatment time of at least eight hours would have been necessary in order to reach a layer thickness in the optimal range of 3–5 μm. At 400 °C, the IMP layer consisted only of Al3Ni, and since the relationship between the Al3Ni layer thickness and the bond strength had already been thoroughly investigated through the conducted tests at 450 °C, additional experiments were not performed at 400 °C.
4. Conclusions

In this paper, the influence of using nickel-foil as an interlayer in steel-aluminum laminated composites roll bonded at 150 °C was studied. The results show that the addition of a nickel-foil can eliminate the formation of brittle Fe-Al IMPs during post-rolling heat treatments and that performing post-rolling heat treatments were necessary in order to achieve a considerable increase in the bond strength.
  • Adding a nickel-interlayer resulted in low bond strengths in the composites after rolling, due to the lack of metallurgical bonding between steel and nickel. The threshold thickness reduction for obtaining a composite which did not delaminate was 58% for this material combination and stacking sequence, with rolling temperature 150 °C.
  • After post-rolling heat treatment at 400 °C and 450 °C, an IMP layer formed along the aluminum-nickel interface, which consisted mainly of Al3Ni. At 500 °C and 550 °C the IMP layer consisted of two phases in the sequence; aluminum-Al3Ni-Al3Ni2-nickel.
  • With increasing heat treatment time and temperature, the Al3Ni2 layer consumed the entire Al3Ni layer, and a duplex morphology was observed inside the Al3Ni2 layer. In these areas, the Al3Ni2 layer also developed a porous structure towards the aluminum layer. Both observations were concluded to be in accordance with the Kirkendall effect.
  • The bond strength in the composites increased after post-rolling heat treatments. The fracture mainly occurred along the interface between the Al-Ni IMPs and the aluminum layer. The bond strength decreased with increasing temperature and heat treatment time, due to a combination of an increasing Al-Ni IMP layer thickness, an increase in the fraction of Al3Ni2 relative to Al3Ni, and the development of Kirkendall voids along the aluminum-Al3Ni2 interface.
  • The optimal Al3Ni layer thickness was found to be ~3-5 µm, which resulted in the highest bond strength.

Author Contributions

Conceptualization, S.M.A.; methodology, S.M.A., B.H. and I.W.; formal analysis, S.M.A. and T.B.; investigation, S.M.A. and T.B.; writing—original draft preparation, S.M.A. and T.B.; writing—review and editing, S.M.A., T.B., P.E.V., B.H., I.W.; visualization, S.M.A. and T.B.; supervision, B.H., P.E.V. and I.W.

Funding

This research is based on the research activities within the center for research-based innovation, SFI Manufacturing in Norway and is partially funded by the Research Council of Norway under contract number 237900. We are grateful for the financial support from the Research Council of Norway to the NORTEM project, contract number 197405, and for the support to the NorFab project under contract number 245963/F50.

Acknowledgments

Morten Raanes is acknowledged for performing the electron microprobe analysis.

Conflicts of Interest

The authors declare no conflict of interest.

References

  1. European Aluminium Association. The Aluminium Automotive Manual-Joining; European Aluminium Association: Municipality, Belgium, 2015. [Google Scholar]
  2. Springer, H.; Kostka, A.; dos Santos, J.F.; Raabe, D. Influence of intermetallic phases and Kirkendall-porosity on the mechanical properties of joints between steel and aluminium alloys. Mater. Sci. Eng. A 2011, 528, 4630–4642. [Google Scholar] [CrossRef]
  3. Springer, H.; Kostka, A.; Payton, E.J.; Raabe, D.; Kaysser-Pyzalla, A.; Eggeler, G. On the formation and growth of intermetallic phases during interdiffusion between low-carbon steel and aluminum alloys. Acta Mater. 2011, 59, 1586–1600. [Google Scholar] [CrossRef]
  4. Kobayashi, S.; Yakou, T. Control of intermetallic compound layers at interface between steel and aluminum by diffusion-treatment. Mater. Sci. Eng. A 2002, 338, 44–53. [Google Scholar] [CrossRef]
  5. Manesh, H.D.; Karimi Taheri, A. The effect of annealing treatment on mechanical properties of aluminum clad steel sheet. Mater. Des. 2003, 24, 617–622. [Google Scholar] [CrossRef]
  6. Akramifard, H.R.; Mirzadeh, H.; Parsa, M.H. Cladding of aluminum on AISI 304L stainless steel by cold roll bonding: Mechanism, microstructure, and mechanical properties. Mater. Sci. Eng. A 2014, 613, 232–239. [Google Scholar] [CrossRef]
  7. Bay, N. Cold Pressure Welding—The Mechanisms Governing Bonding. J. Eng. Ind. 1979, 101, 121–127. [Google Scholar] [CrossRef]
  8. Vaidyanath, L.R.N.; Milner, D.R. Pressure Welding by Rolling. Br. Weld. J. 1959, 6, 13–28. [Google Scholar]
  9. Bay, N. Cold Welding 1 Characteristics, Bonding Mechanisms, Bond Strength. Met. Constr. 1986, 18, 369–372. [Google Scholar]
  10. Li, L.; Nagai, K.; Yin, F. Progress in cold roll bonding of metals. Sci. Technol. Adv. Mater. 2008, 9, 23001. [Google Scholar] [CrossRef]
  11. Smigelkas, A.D.; Kirkendall, E.O. Zinc Diffusion in Alpha Brass. Trans. AIME 1947, 171, 130–142. [Google Scholar]
  12. Hermans, M.J.M.; Biglari, M.H. Void Formation by Kirkendall Effect in Solder Joints. In The ELFNET Book on Failure Mechanisms, Testing Methods, and Quality Issues of Lead-Free Solder Interconnects; Grossmann, G., Zardini, C., Eds.; Springer London: London, UK, 2011; pp. 105–122. [Google Scholar]
  13. Paul, A.; Laurila, T.; Vuorinen, V.; Divinski, S.V. Interdiffusion and the Kirkendall Effect in Binary Systems. In Thermodynamics, Diffusion and the Kirkendall Effect in Solids; Springer International Publishing: Cham, Switzerland, 2014; pp. 239–298. [Google Scholar]
  14. Meshram, S.D.; Madhusudhan Reddy, G. Friction welding of AA6061 to AISI 4340 using silver interlayer. Def. Technol. 2015, 11, 292–298. [Google Scholar] [CrossRef] [Green Version]
  15. Kundu, S.; Chatterjee, S. Characterization of diffusion bonded joint between titanium and 304 stainless steel using a Ni interlayer. Mater. Charact. 2008, 59, 631–637. [Google Scholar] [CrossRef]
  16. Lee, J.G.; Hong, S.J.; Lee, M.K.; Rhee, C.K. High strength bonding of titanium to stainless steel using an Ag interlayer. J. Nucl. Mater. 2009, 395, 145–149. [Google Scholar] [CrossRef]
  17. Deng, Y.; Sheng, G.; Xu, C. Evaluation of the microstructure and mechanical properties of diffusion bonded joints of titanium to stainless steel with a pure silver interlayer. Mater. Des. 2013, 46, 84–87. [Google Scholar] [CrossRef]
  18. Zhang, J.; Luo, G.Q.; Shen, Q.; Zhang, L.M.; Huang, Z.J. Characterization of diffusion-bonded joint between Al and Mg using a Ni interlayer. Rare Met. 2016, 35, 537–542. [Google Scholar] [CrossRef]
  19. Wang, Y.; Luo, G.; Zhang, J.; Shen, Q.; Zhang, L. Microstructure and mechanical properties of diffusion-bonded Mg—Al joints using silver film as interlayer. Mater. Sci. Eng. A 2013, 559, 868–874. [Google Scholar] [CrossRef]
  20. Lyushinskii, A.V. Criteria for selecting interlayers in diffusion bonding dissimilar metals. Weld. Int. 2001, 15, 830–832. [Google Scholar] [CrossRef]
  21. Xiong, J.; Peng, Y.; Zhang, H.; Li, J.; Zhang, F. Microstructure and mechanical properties of Al-Cu joints diffusion-bonded with Ni or Ag interlayer. Vacuum 2018, 147, 187–193. [Google Scholar] [CrossRef]
  22. Reddy, G.M.; Venkata Ramana, P. Role of nickel as an interlayer in dissimilar metal friction welding of maraging steel to low alloy steel. J. Mater. Process. Technol. 2012, 212, 66–77. [Google Scholar] [CrossRef]
  23. Azimi, M.; Toroghinejad, M.R.; Shamanian, M.; Kestens, L. The Effect of Strain on the Formation of an Intermetallic Layer in an Al-Ni Laminated Composite. Metals 2017, 7, 445. [Google Scholar] [CrossRef]
  24. Adabi, M.; Amadeh, A.A. Formation mechanisms of Ni–Al intermetallics during heat treatment of Ni coating on 6061 Al substrate. Trans. Nonferrous Met. Soc. China 2015, 25, 3959–3966. [Google Scholar] [CrossRef]
  25. Alimadadi, H.; Kjartansdóttir, C.; Burrows, A.; Kasama, T.; Møller, P. Nickel-aluminum diffusion: A study of evolution of microstructure and phase. Mater. Charact. 2017, 130, 105–112. [Google Scholar] [CrossRef] [Green Version]
  26. Liu, J.C.; Mayer, J.W.; Barbour, J.C. Kinetics of NiAl3 and Ni2Al3 phase growth on lateral diffusion couples. J. Appl. Phys. 1988, 64, 656–662. [Google Scholar] [CrossRef]
  27. De la Peña, F.; Fauske, V.T.; Burdet, P.; Prestat, E.; Jokubauskas, P.; Nord, M.; Ostasevicius, T.; MacArthur, K.E.; Sarahan, M.; Johnstone, D.N.; et al. Hyperspy/hyperspy v1.4.1 (Version v1.4.1); Zenodo: Meyrin, Switzerland, 2018. [Google Scholar]
  28. Hwang, Y.M.; Hsu, H.H.; Lee, H.J. Analysis of sandwich sheet rolling by stream function method. Int. J. Mech. Sci. 1995, 37, 297–315. [Google Scholar] [CrossRef]
  29. Manesh, H.D.; Taheri, A.K. Theoretical and experimental investigation of cold rolling of tri-layer strip. J. Mater. Process. Technol. 2005, 166, 163–172. [Google Scholar] [CrossRef]
  30. Maleki, H.; Bagherzadeh, S.; Mollaei-Dariani, B.; Abrinia, K. Analysis of Bonding Behavior and Critical Reduction of Two-Layer Strips in Clad Cold Rolling Process. J. Mater. Eng. Perform. 2013, 22, 917–925. [Google Scholar] [CrossRef]
  31. Wang, C.; Jiang, Y.; Xie, J.; Zhou, D.; Zhang, X. Effect of the steel sheet surface hardening state on interfacial bonding strength of embedded aluminum–steel composite sheet produced by cold roll bonding process. Mater. Sci. Eng. A 2016, 652, 51–58. [Google Scholar] [CrossRef]
  32. Gao, C.; Li, L.; Chen, X.; Zhou, D.; Tang, C. The effect of surface preparation on the bond strength of Al-St strips in CRB process. Mater. Des. 2016, 107, 205–211. [Google Scholar] [CrossRef]
  33. Von Goldbeck, O.K. Iron—Nickel Fe—Ni. In IRON—Binary Phase Diagrams; Springer: Berlin, Germany, 1982; pp. 73–78. [Google Scholar]
  34. Konieczny, M.; Mola, R.; Thomas, P.; Kopciał, M. Processing, Microstructure and Properties of Laminated Ni-Intermetallic Composites Synthesised Using Ni Sheets and Al Foils. Arch. Metall. Mater. 2011, 56, 693. [Google Scholar] [CrossRef]
  35. Jung, S.B.; Minamino, Y.; Yamane, T.; Saji, S. Reaction diffusion and formation of Al3Ni and Al3Ni2 phases in the Al-Ni system. J. Mater. Sci. Lett. 1993, 12, 1684–1686. [Google Scholar] [CrossRef]
  36. Kurakin, A.K. Mechanism of the influence of silicon on the process of the reaction diffusion of iron in aluminum. Phys. Met. Metall. 1970, 30, 108–114. [Google Scholar]
  37. Paul, A. Growth mechanism of phases, Kirkendall voids, marker plane position, and indication of the relative mobilities of the species in the interdiffusion zone. J. Mater. Sci. Mater. Electron. 2011, 22, 833–837. [Google Scholar] [CrossRef]
  38. Paul, A.; van Dal, M.J.H.; Kodentsov, A.A.; van Loo, F.J.J. The Kirkendall effect in multiphase diffusion. Acta Mater. 2004, 52, 623–630. [Google Scholar] [CrossRef]
  39. Shi, D.; Wen, B.; Melnik, R.; Yao, S.; Li, T. First-principles studies of Al–Ni intermetallic compounds. J. Solid State Chem. 2009, 182, 2664–2669. [Google Scholar] [CrossRef]
Figure 1. Illustration showing the initial measurements of one composite consisting of five layers in the stacking sequence; steel/nickel/aluminum/nickel/steel. Aluminum rivets (diameter 3 mm) were placed in the front and rear end of the composite. RD indicates the rolling direction.
Metals 09 00827 g001
Figure 2. Scanning electron microscopy (SEM) images of the cross-section of a composite after rolling. (a) shows the whole composite with aluminum (dark grey) in the center, nickel (light grey) on each side of the aluminum, and steel (grey) as the outer layers. In (b), examples of the steel fragments that could be observed along the steel-nickel interface are highlighted.
Metals 09 00827 g002
Figure 3. SEM images overlaid with corresponding energy dispersive X-ray spectroscopy (EDS) color maps of the steel and nickel fracture surfaces after peel-testing of a rolled composite. Detected nickel is colored blue and iron is colored green. (a) shows the steel fracture surface where steel fragments and small areas with residual nickel can be observed. (b) shows the nickel fracture surface, with small areas of residual iron. RD indicates the rolling direction.
Metals 09 00827 g003
Figure 4. SEM images showing the growth of the IMP layer formed along the aluminum-nickel interface with increasing heat treatment temperature and time. (a) 450 °C one hour, (b) 500 °C one hour, (c) 550 °C one hour and (d) 550 °C two hours. Note the different scale bar in (d).
Metals 09 00827 g004
Figure 5. Thickness of the formed intermetallic phases (IMP) layer as a function of the square root of heat treatment time. The different grey-scale colored areas highlights where the IMP layer only consisted of one phase Al3Ni, and where two phases were clearly observed, Al3Ni and Al3Ni2. The error-bars show ± one standard deviation based on the obtained measurements.
Metals 09 00827 g005
Figure 6. High magnification SEM images of Al3Ni phase along the aluminum-nickel interface after post-rolling heat treatment at 450 °C for (a) one hour and (b) two hours. The initial growth of the second phase, Al3Ni2 can be observed along the Al3Ni-nickel interface, and small bright particles can be observed inside the Al3Ni layer in (a). In (b) a line consisting of many particles can be observed inside the Al3Ni layer close to the interface towards the aluminum layer.
Metals 09 00827 g006
Figure 7. (a) HAADF-STEM and (b) corresponding BF-STEM image of the interface after post-rolling heat treatment at 550 °C for one hour. Elongated Al3Ni and equiaxed Al3Ni2 grains can be seen, in addition to fine particles inside the Al3Ni layer that compose a line that runs approximately parallel to the interface. (c) HAADF-STEM image showing an enlargement of a part of the line of fine particles. (d) Al Kα, (e) O Kα and (f) Ni Kα denoised EDS maps from the region marked by black squares in (a), (b) and (c), showing the relative composition in at%. Note the differences in the compositional range for each element, as shown by the color bars to the right of each EDS map.
Metals 09 00827 g007
Figure 8. SEM images of the cross-section of a composite heat treated at 550 °C for two hours. (a) shows an area where the IMP layer goes from consisting of both Al3Ni and Al3Ni2, to only Al3Ni2. (b,c) shows an area where only Al3Ni2 is present along the aluminum-nickel interface, where the change in the morphology inside the Al3Ni2 layer (the Kirkendall marker plane) is highlighted by dashed lines. A porous structure in the Al3Ni2 along the interface towards aluminum can be observed.
Metals 09 00827 g008
Figure 9. (a) BF-TEM image of the interface after post-rolling heat treatment at 550 °C for one hour. Voids in the Al3Ni2 layer close to aluminum (top left) can be seen, together with a change in morphology from elongated grains to fine equiaxed grains. The border between the two morphologies reveals a Kirkendall marker plane that runs approximately parallel to the interface, and this plane is marked by a dashed white line. (b) HAADF-STEM and (c) corresponding BF-STEM image showing an enlarged view of the region marked in (a).
Metals 09 00827 g009
Figure 10. Effect of temperature on the peeling force necessary to delaminate the composites after heat treatment for (a) one hour and (b) two hours at 450 °C, 500 °C and 550 °C. One representative curve for each heat treatment is presented. The total thickness reductions of the composites are given in the legends.
Metals 09 00827 g010
Figure 11. Comparisons of the fracture mechanisms observed in the composites after heat treatment at (ac); 500 °C and (df); 550 °C. (a) and (d) shows the cross-sections of the fractured composite taken by optical microscopy, (b) and (e) shows the SEM images combined with EDS color mapping of the fracture surface corresponding to (a) and (d), where the detected aluminum is colored red and nickel colored blue. (c) and (f) show high magnification SEM images of the areas highlighted in (b) and (e).
Metals 09 00827 g011
Figure 12. Images showing the fracture mechanism observed in the composites heat treated at 450 °C where only a layer of Al3Ni was present along the interface. (a) shows a low magnification optical microscopy image of the cross-section of the fracture surface, where residual aluminum is clearly observed on the Al3Ni layer and no sign of fracturing can be seen along the Al3Ni-nickel interface. (b) shows an SEM image combined with EDS color map of the Al3Ni fracture surface and (c) shows the corresponding aluminum fracture surface. The detected aluminum is colored red and nickel blue.
Metals 09 00827 g012
Figure 13. The measured peeling force necessary to delaminate the composites heat treated at 450 °C for (a) one hour and (b) two hours, as a function of peeling distance. The total thickness reduction of the composite together with the measured IMP layer thickness in the composites are given in the legends.
Metals 09 00827 g013
Figure 14. Graphical illustration showing the average bond strength as a function of Al3Ni phase layer thickness, based on the measurements obtained in the composites heat treated for one and two hours at 450 °C. The three different grey-colored areas indicate the different fracture mechanisms that were observed for the different Al3Ni layer thicknesses. Fracture mechanism 1; the fracture occurred along the steel-nickel interface and fracture mechanism 2; the fracture occurred along the Al3Ni-aluminum interface, as shown with the two small illustrations.
Metals 09 00827 g014
Table 1. The achieved total thickness reduction and the thickness reduction achieved in the individual metal layers for some selected composites. For the steel and the nickel layers in the composites, the average thickness reduction obtained in one layer is given. All thickness reductions are given in [%].
CompositeTotal ReductionAluminumSteelNickel
159655859
261675958
366726566
468716766
Table 2. Vickers hardness measurements of the steel and aluminum layers, after rolling and after the different heat treatments. The values are based on measurements taken in the composites subjected to both heat treatment times.
Heat TreatmentAluminum [HV]Steel [HV]
After rolling46 ± 2226 ± 20
400 °C23 ± 0200 ± 6
450 °C24 ± 1215 ± 14
500 °C24 ± 1216 ± 14
550 °C25 ± 1177 ± 24