Article

Effect of Hydrogen Content and Strain Rate on Hydrogen-induced Delay Cracking for Hot-stamped Steel

1
Corrosion and Protection Center, Advanced Materials and Technology Institute, University of Science and Technology Beijing, Beijing 100083, China
2
PHS&D Center, Ling Yun GNS Technology Co., Ltd, Yantai 265602, China
*
Author to whom correspondence should be addressed.
Metals 2019, 9(7), 798; https://doi.org/10.3390/met9070798
Submission received: 11 June 2019 / Revised: 8 July 2019 / Accepted: 12 July 2019 / Published: 18 July 2019

Abstract

:
Hot-stamped steel has been widely used in automobile bumper and other safety components due to its high strength. Therefore, this paper investigates the effect of hydrogen content and strain rate on hydrogen-induced delay cracking (HIDC) behavior. The results showed that the plasticity of the steel significantly decreased with an increase in hydrogen content or a decrease in the strain rate. Fractography was analyzed after tensile tests. It was found that all of the pre-charged specimens cracked at large-sized inclusions when stretched at a strain rate of 1 × 10⁻³ s−1, which indicates that, in this case, the defect itself in the material had great influence on the extend properties. No inclusions were found at the main fracture origin area for hydrogen steady-state specimens, when stretched at a strain rate of 1 × 10⁻⁶ s−1, which demonstrated that a slower strain rate causes greater influence by hydrogen. However, for the non-pre-charged samples, the fractures surface showed that cracking originated from the defect near the sample surface, which was independent of strain rates.

1. Introduction

Light weight, low pollution, and high safety are the main goals for the new generation of cars, which make use of advanced, high-strength steel an inevitable trend [1,2,3,4,5]. Hot-stamped steel, due to its high wear resistance, high hardness, and ultra-high strength, among other qualities, has been widely used in the production of automobile parts [6,7]; for example, in automobile A–B columns, front and rear bumpers, side door anti-collision beams, and so on. However, the high strength also brings some problems. When the strength of the material is greater than 1000 MPa, the material will undergo hydrogen-induced fractures in service environments, and the sensitivity of hydrogen-induced delayed cracking generally increases as the strength of the material increases, as is well-known; thus, for ultra-high strength steel, hydrogen-induced delayed cracking is more likely to occur [8]. There are many factors that influence hydrogen delay cracking, which range from the material composition design and heat treatment process to the service environment of the material in later periods. Among these factors, the material composition and micro-structure are the key factors that determine the properties of the material. As for specific materials, their compositions are usually fixed, so the influence of the material micro-structure on hydrogen-induced delayed cracking is particularly important [9].
Inclusions, which are present as non-metallic phases, not only have adverse effects on mechanical properties and workability in the downstream process of sheet metal production, but they also have some effects on the late-service process of materials. A large number of studies have shown that the presence of inclusions in steel has great impact on the hydrogen-induced delay cracking behavior. Inclusions were shown to induce crack initiation after hydrogen-charging [10,11,12,13,14,15]. Inclusions that are harder than the matrix lead to the formation of cavities around themselves, whereas softer inclusions become elongated during rolling [16]. Hydrogen can become trapped in these cavities and hydrogen-enhanced stress concentration results in crack initiation. Once the cracks are initiated, the accumulated hydrogen atoms can contribute to crack propagation by increasing the local dissolution rate at the crack tip [12]. Inclusions in hydrogen-containing materials can also lead to fish-eye, and thus accelerate the occurrence of hydrogen embrittlement during stretching [17,18,19,20]. In summary, the later service process of ultra-high strength steel auto parts containing inclusions can be very dangerous.
On the other hand, we know that hydrogen induced delayed cracking of steel is usually caused by the accumulation of diffusible hydrogen atoms, to a certain extent. The diffusion and enrichment of hydrogen atom are time dependent. Accordingly, it obviously depends on the strain rate. That is, the slower the strain rate, the more time there is, and the hydrogen atoms have enough time to diffuse and enrich. Bal et al. [21] found that hydrogen charging could change the fracture mode of samples from ductile to quasi-cleavage at a low strain rate, while less cleavage was observed at high strain rates. Wu et al. [22] revealed that the hydrogen effects were closely dependent on the strain rate. Momotani et al. [23] also found that the deformation at a lower strain rate facilitated hydrogen to mainly accumulate on prior austenite grain boundaries, which led to the formation of micro-cracks along prior austenite grain boundaries. The previous work of our research group also studied this phenomenon. Kan et al. [24] found that the brittle region size increased with the strain rate slowing down.
This work mainly studies the role of inclusions in the hydrogen-induced delay cracking (HIDC) behavior of hot-stamped steel by investigating the effects of changing the strain rate and the hydrogen content.

2. Materials and Methods

2.1. Materials

The samples that were studied in this paper were cut from a hot stamped anti-collision beam of a branded automobile. The thickness of the steel used is about 1.5 mm. Table 1 shows the chemical composition (wt%). The hydrogen apparent diffusion coefficients value, i.e. Dapp, was 1.66 × 10⁻⁷ cm2·s−1. The material was ground to 5000 grit and then mechanically polished and etched in order to characterize it. A 4% nital solution was used as an etchant and samples were immediately cleaned with de-ionized water and alcohol, in order to observe the micro-structure by optical microscopy (OM) and scanning electron microscopy (SEM).
SEM and energy spectrum analysis (EDS) were performed on cross-sections containing the rolling direction (RD) and the plate normal direction (ND) to analyze the size distribution and types of inclusions in experimental materials. The statistics of inclusions were carried out under an 8000 times visual field of the scanning electron microscope Zeiss Auriga (ZEISS, Oberkochen, Germany). Only the inclusions with diameter greater than 1 μm were counted due to the large number of small-sized inclusions and, as studies [25] have shown that small-sized inclusions have little influence on the material damage. It must be mentioned that the diameter of an elongated inclusion was defined as the longest length in any direction [26].

2.2. Hydrogen Measurements

The sample size for measuring the change of hydrogen content with hydrogen filling time was 20 × 5 × 1.2 mm3. The sample surface was polished with water sandpaper (from 60# to 2000#), and then cleaned and dried with alcohol before hydrogen filling. Hydrogen was introduced into the material in two ways: by either electrically charging in a 3.5% NaCl solution with 2 mA·cm−2 current density, or by soaking in the same solution at room temperature. The hydrogen charging time was changed, depending on the purpose. At least three parallel specimens were used for each group.
A hydrogen measuring instrument measures hydrogen concentration (G4 PHOENLX, Bruker, Billerica, MA, USA). The G4 collects hydrogen in samples by a heat extraction method. The gas to be analyzed is carried by carrier gas (N2) to the thermal conductivity detector for detection. The carrier gas flows through the detector in two ways, as a pure carrier gas or as a carrier gas with hydrogen gas. The thermal conductivity of the detector changes when a hydrogen-carrying airstream passes through the detector. Hydrogen gas can be quantitatively analyzed by the thermal conductivity difference of the two-way gas when compared to the carrier gas. In the process of hydrogen content measurement, the G4 was set to a temperature of 800 °C and the duration was 15 min. As the G4 hydrogen measuring equipment adopted infrared heating, it only took about 10 s for the device to rise from room temperature to 800 °C at a constant heating rate of 70 °C·s−1. The heating process of the instrument was very short.

2.3. Slow Strain Rate Tests

The plate specimens were used in slow strain rate tensile tests (SSRT) and the dimension of the gauge part was 20 × 5 × 1.2 mm3. The sample surface was wet-ground with SiC paper (from 60# to 2000#), cleaned with acetone, washed with alcohol, and then blown dry to remove the surface oxidation layer and machining defects before the experiments. Two different tests of hydrogen-introducing methods were conducted: a pre-charged method and an in-situ immersion method. The former was electrically charged in a 3.5% NaCl solution with 2 mA·cm−2 current density before the tensile tests, while the latter was soaked in the same solution during SSRT. It must be mentioned that the pre-charged samples were immediately treated with a cadmium plating after pre-charging, in order to avoid hydrogen desorption into the environment during the SSRT [24].
The effect of the initial hydrogen content on the HIDC was studied by tensile tests, which were performed at a strain rate of 1 × 10⁻³ s−1, after different pre-charging times. Four pre-charging times (1 h, 2 h, 20 h, and 24 h) were mainly studied in this work, based on the evolution in the amount of hydrogen with charging time.
Two different experimental procedures evaluated the influence of the strain rate. On the one hand, tests were performed on hydrogen steady-state samples while using two different strain rates; namely, 1 × 10⁻³ s−1 and 1 × 10⁻⁶ s−1. This allowed for analysis of the re-distribution of initial hydrogen and the role of inclusions in HIDC at high hydrogen levels. On the other hand, when the SSRT was executed while in-situ continuous soaking in 3.5% NaCl solution took place, the range of strain rate was 1 × 10⁻⁴–1 × 10⁻⁶ s−1. A relatively mild service environment was chosen, as ultra-high strength steel has high sensitivity to the hydrogen-induced delayed cracking and the material will fracture within the elastic deformation range if the service environment is harsh. This is to study the effect of strain rate on the HIDC of ultra-high strength steel at low hydrogen levels. All of the tests were carried out at room temperature.
The sensitivity factor of HIDC was calculated by the elongation loss rate and strength loss rate of the material, as shown in formula 1:
IHIDC(δ) = (δ0 − δH)/δ0 × 100%, and IHIDC(σ) = (σ0 − σH)/σ0 × 100%
where δ0 and δH are the elongations of the sample in the air and charging hydrogen, while σ0 and σH are the tensile strengths of the sample in the air and charging hydrogen, respectively.
The fracture morphology and origin were carefully examined, while using a Zeiss Auriga scanning electron microscope (SEM).

2.4. Scanning Kelvin Probe Force Microscope (SKPFM) Measurements

In-situ SKPFM evaluated hydrogen accumulation behavior during the charged hydrogen process. Hydrogen charging could result in a variation of the sample surface potential or the work function [27]. The hydrogen enrichment at the crack tip in maraging steel was studied by SKPFM in our laboratory [28]. SKPFM measurements were performed to further characterize the effect of hydrogen on the morphology and potential around inclusions, in this work. SEM and EDS were used to analyze the morphology and composition of the inclusions. The hydrogen content of the sample was not controlled before and after sample preparation, and hydrogen was introduced before SKPFM at room temperature. Single-side electrolytic hydrogen charging was used to prevent the test surface from contacting the solution, in order to avoid influencing the results due to corrosion, as shown in Figure 1. Hydrogen charging was performed in a 3.5% NaCl solution with 2 mA·cm−2 charging current density for 84 h at room temperature (approximately 25 °C). The SKPFM experiment was conducted immediately after hydrogen charging.

3. Results

3.1. Microstructure and Inclusions

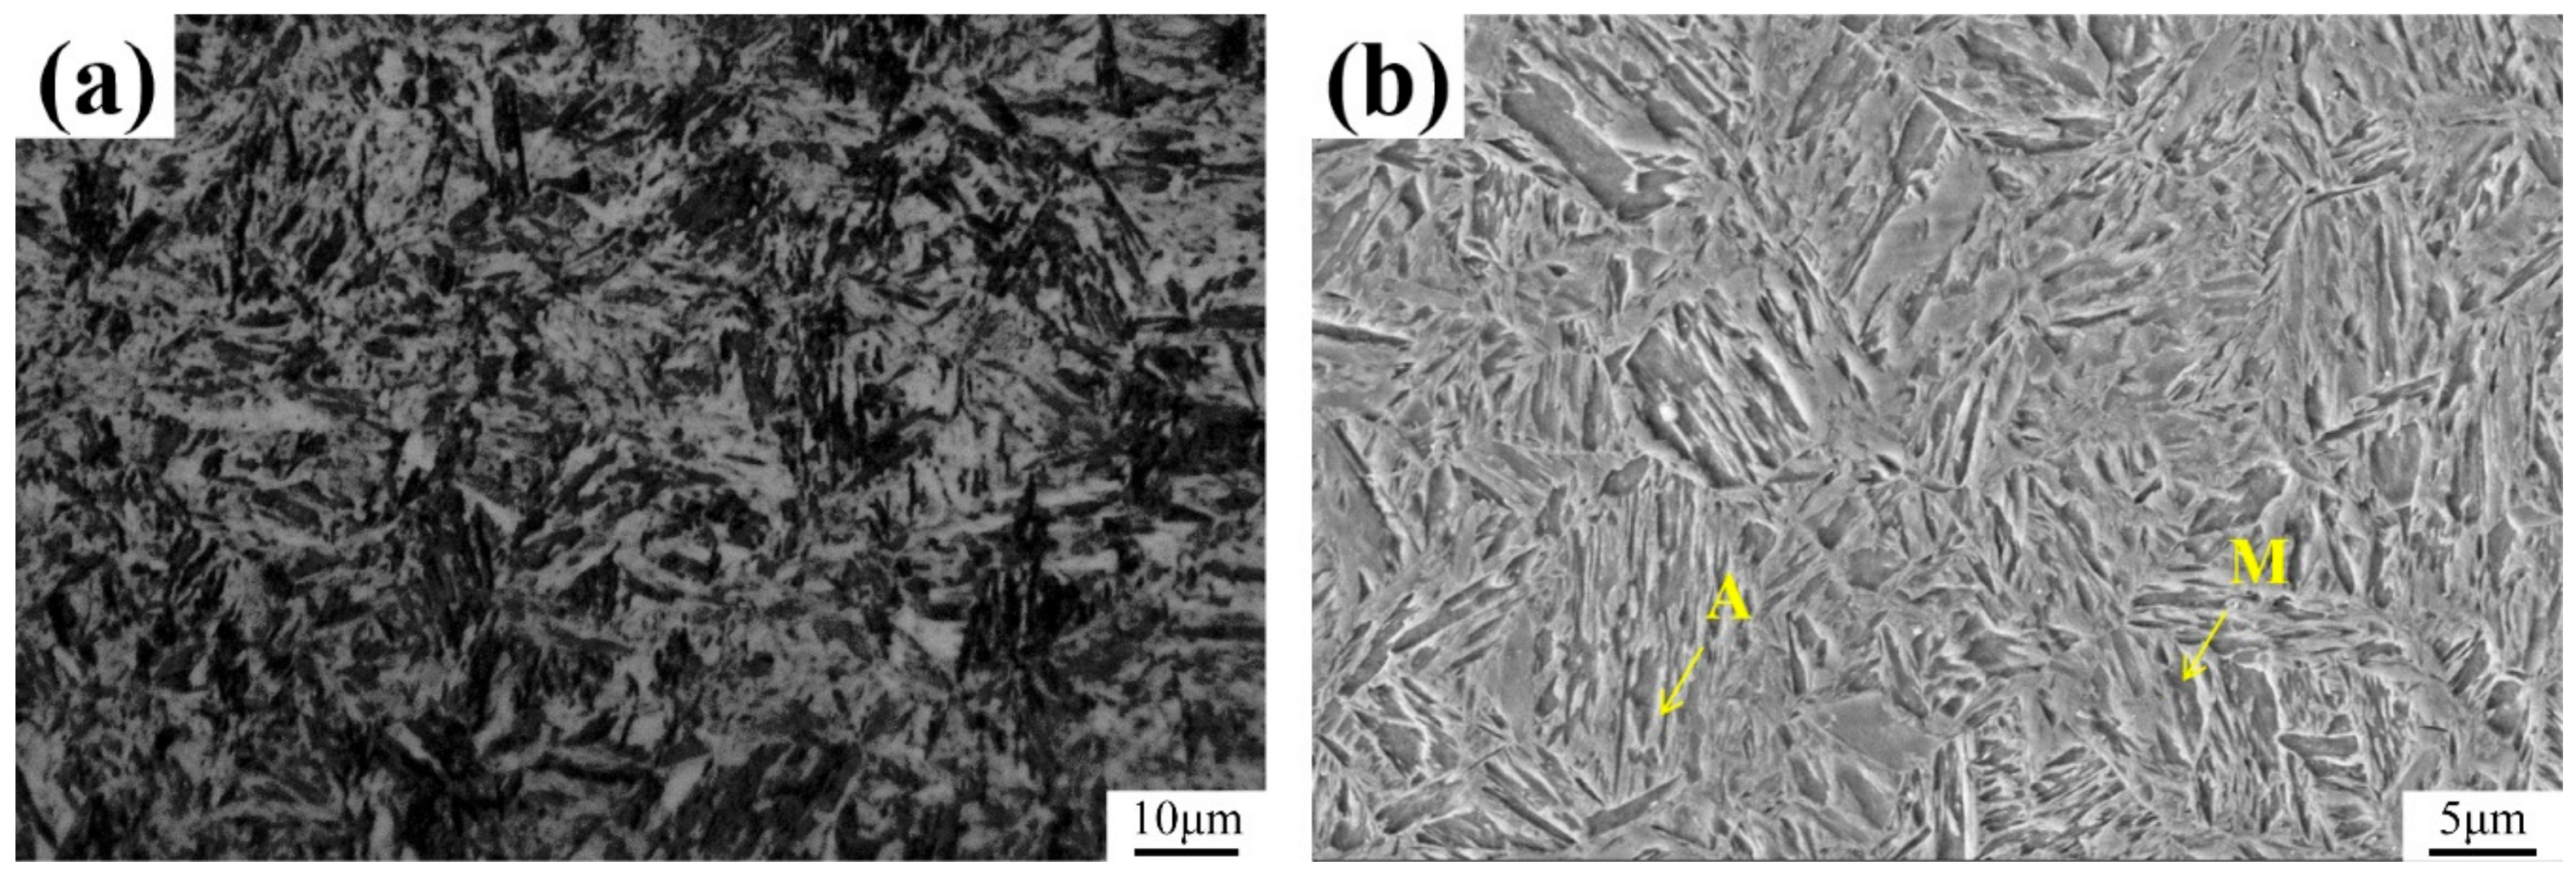
The microstructure of the material was comprised of lath martensite and a small amount of retained austenite, as shown in Figure 2.
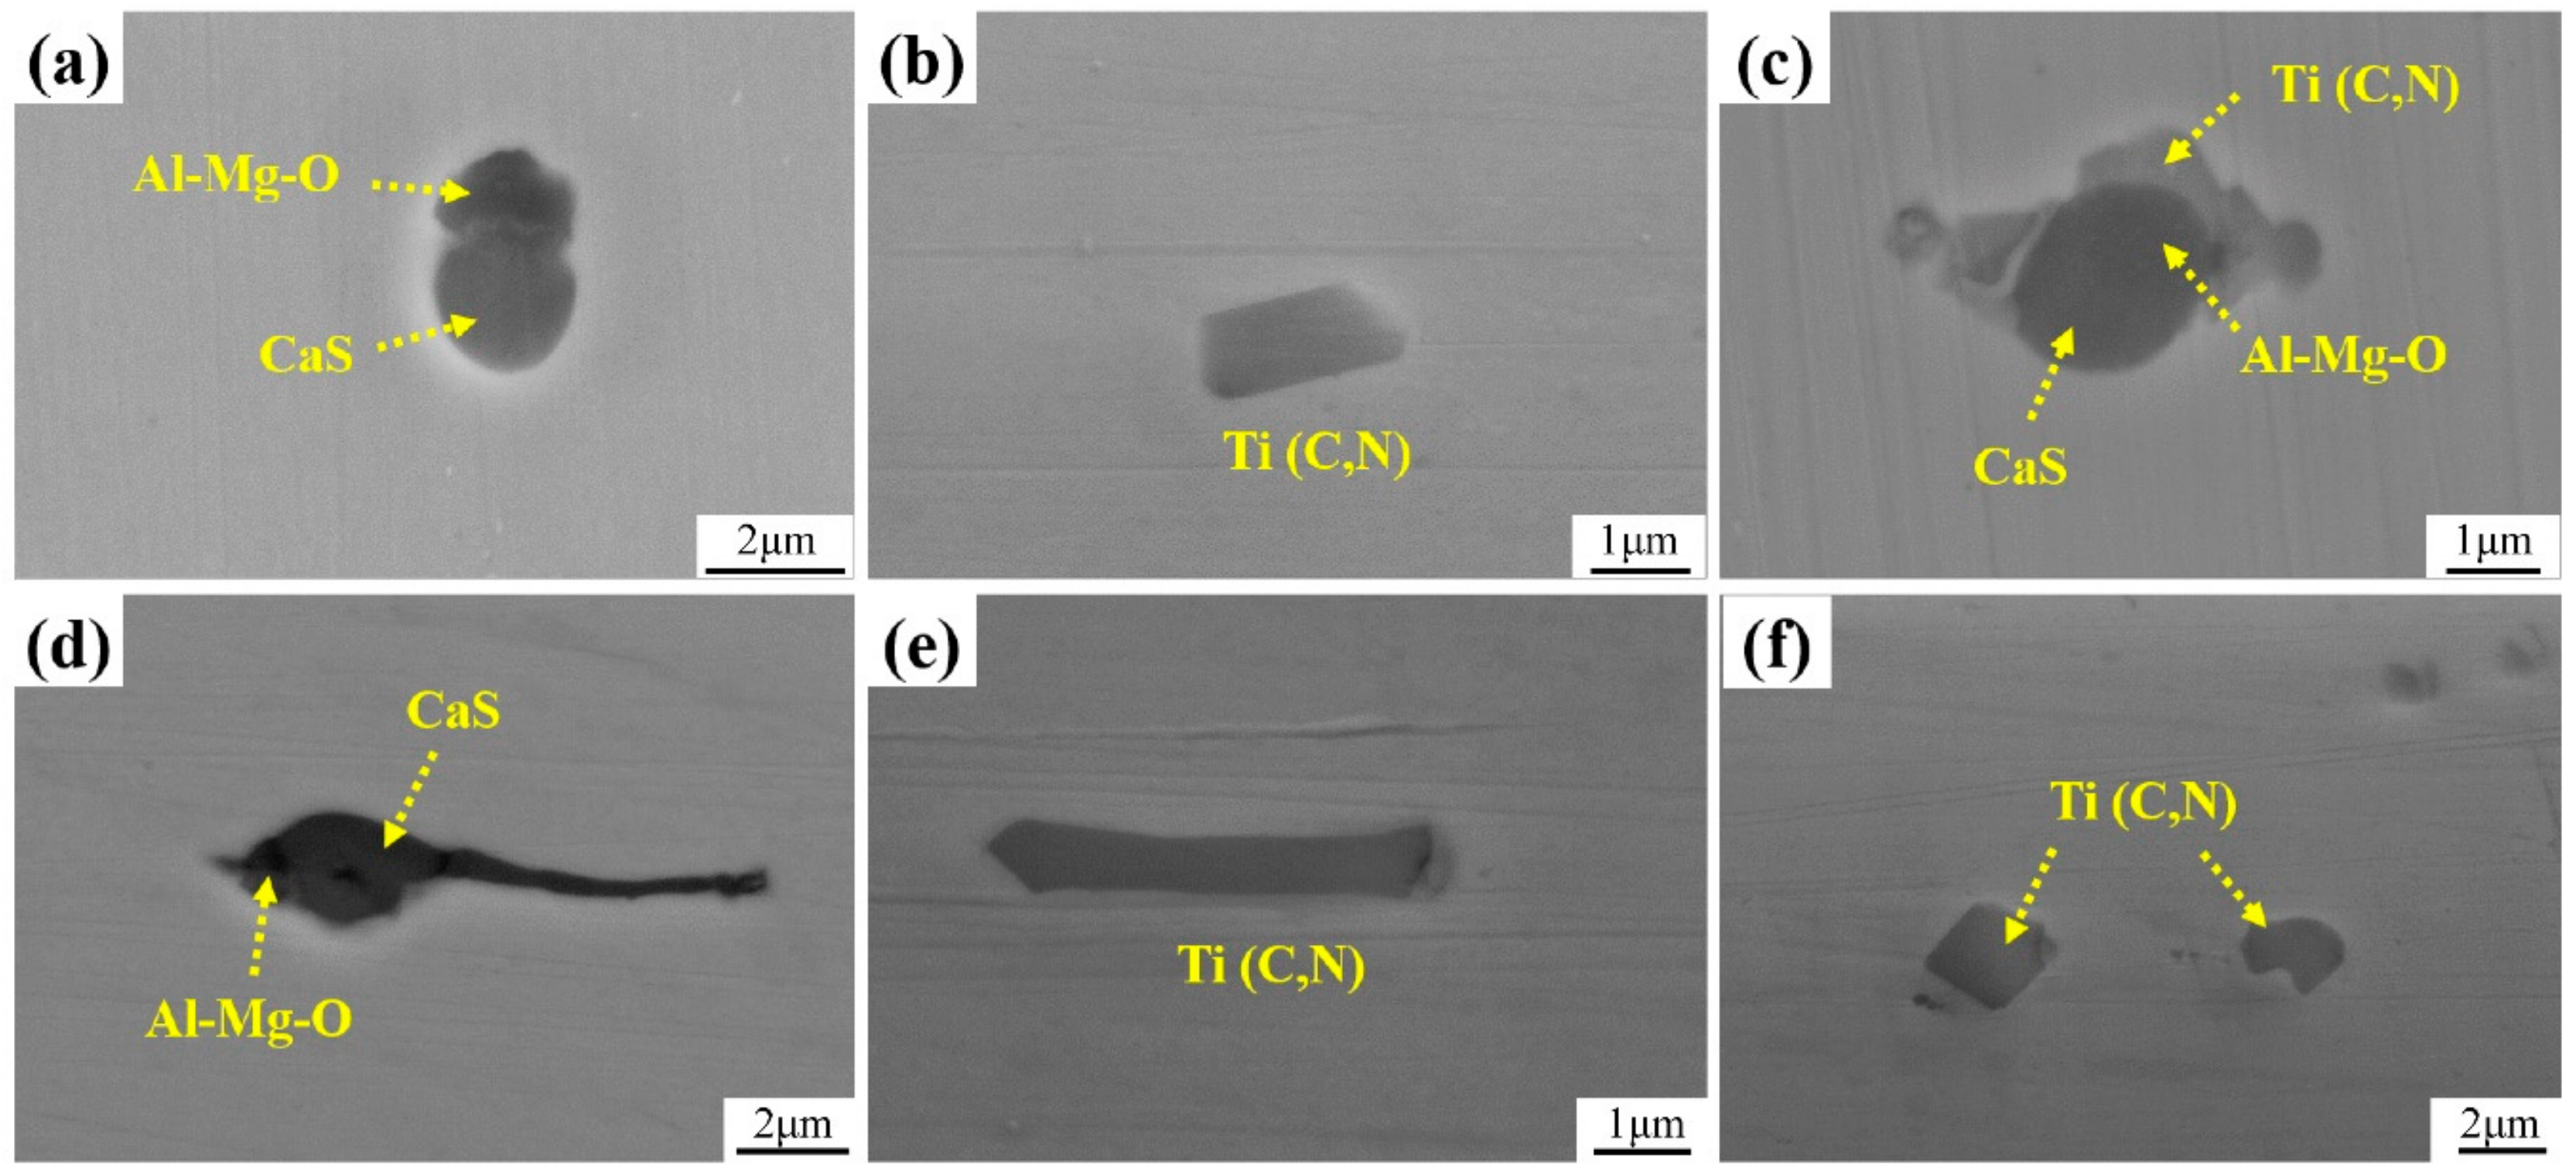
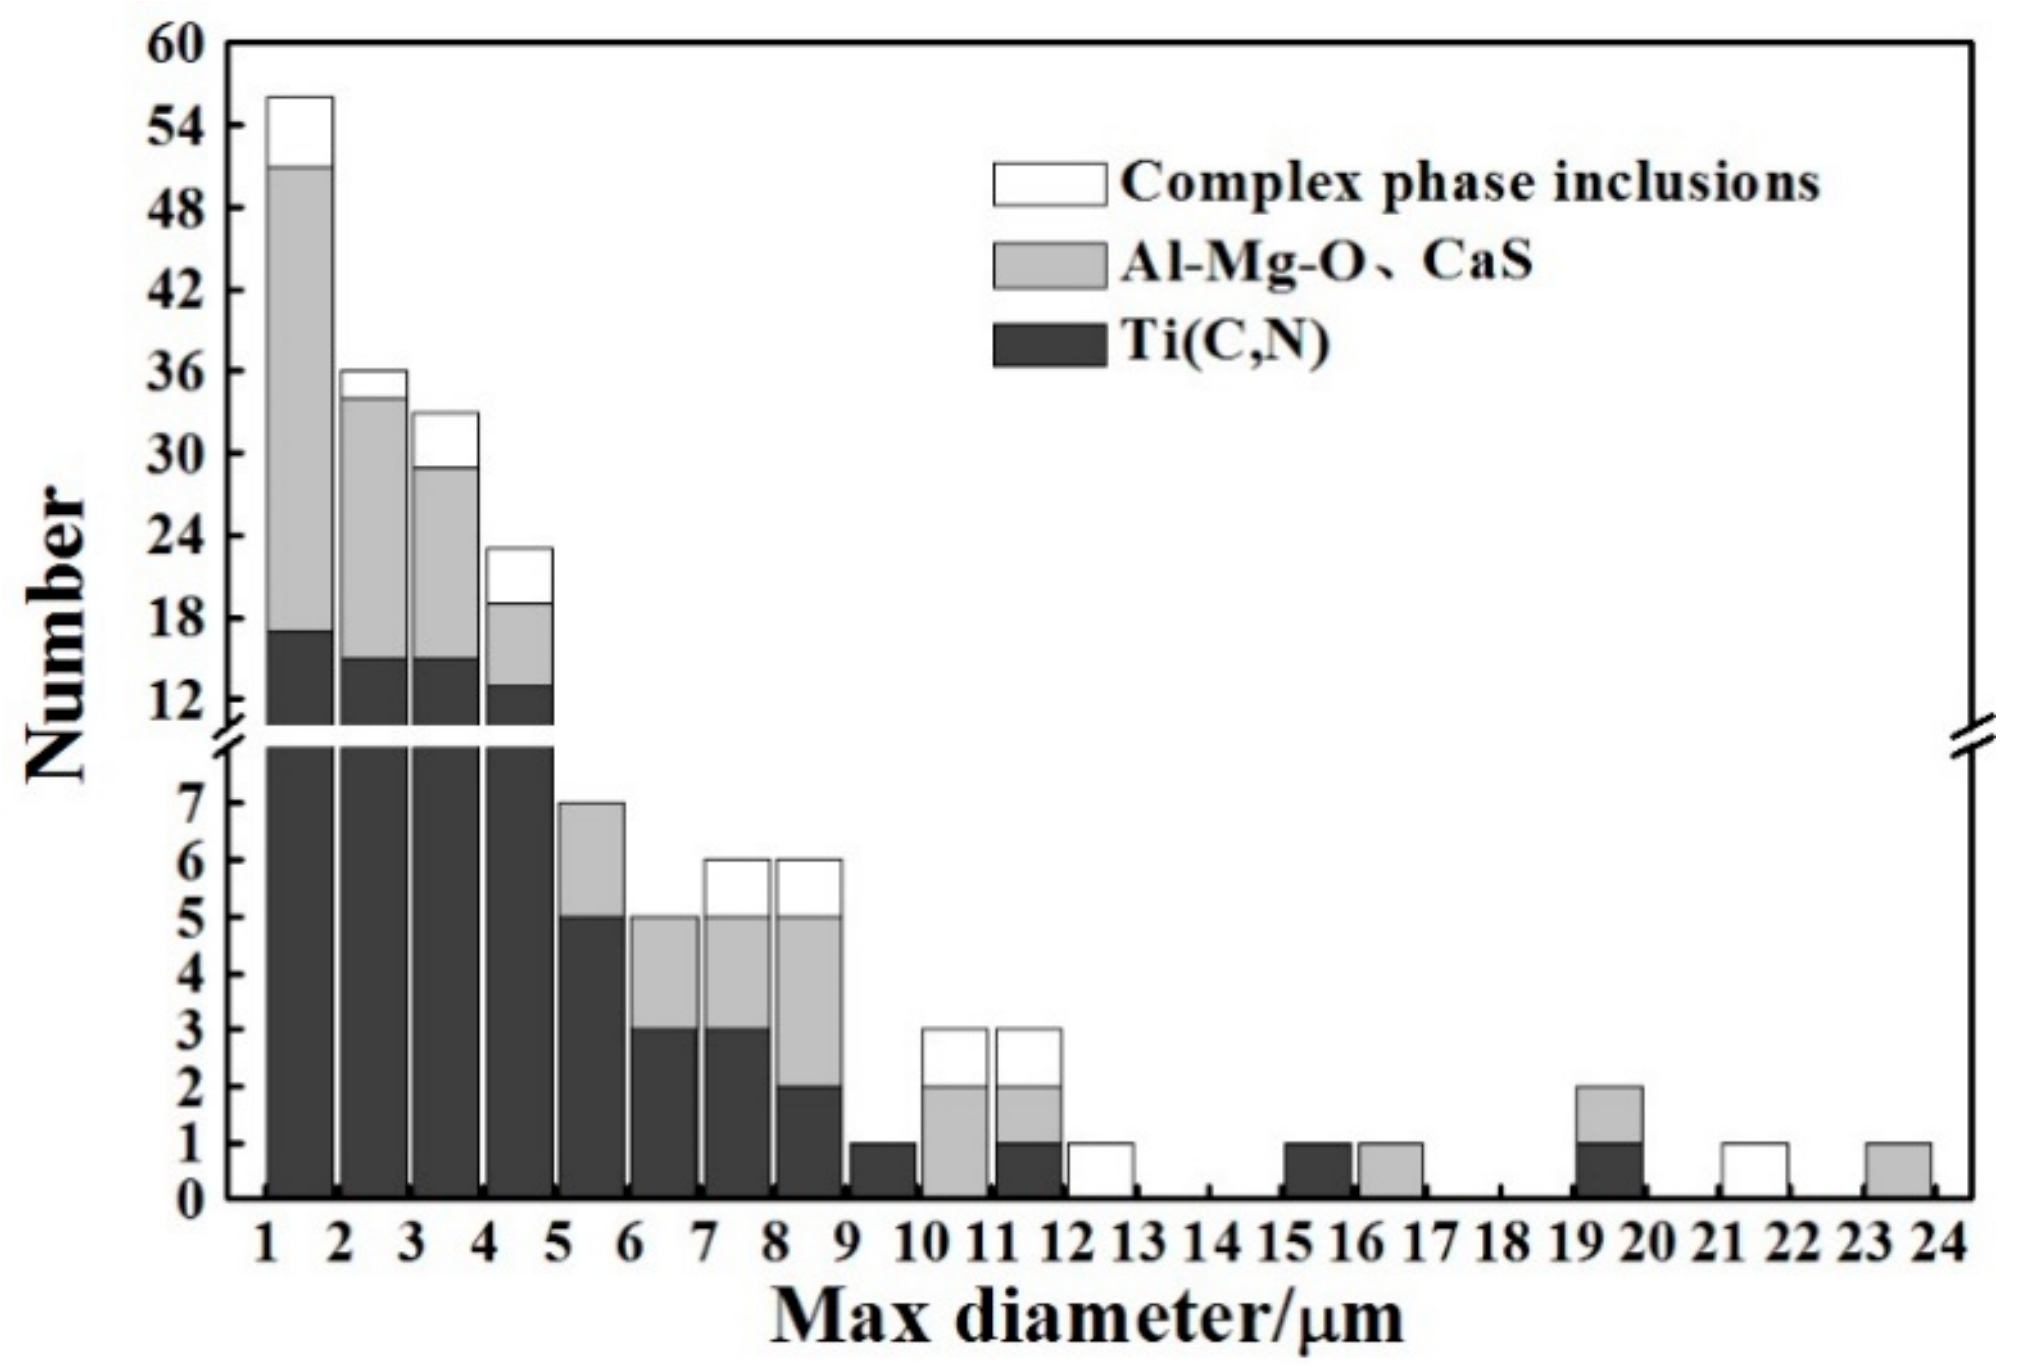
Figure 3 shows the SEM morphology of the common inclusions in experimental materials, among which Figure 3a–c show types of small-sized inclusions, while Figure 3d–f shows types of abnormally large-sized inclusions. It can be seen that the small-sized inclusions were mainly roundish Al-Mg-O-CaS, individually cubic Ti(C, N), and compound inclusions of both; while, the large-sized inclusions mainly consisted of long strip inclusions and aggregates of small-sized inclusions. Those inclusion clusters were regarded as single inclusion, as in a previous study [29]. Figure 4 shows the type and size distribution of inclusions in the test materials. From the figure, it can be seen that the inclusions mainly included three types, namely Al-Mg-O-CaS, Ti(C, N), and compound inclusions. These inclusions most likely originated from the steel-making process. The average size of the inclusions was 4 μm, the 95th percentile size [25] was 10 μm, and the largest was 23 μm, among the (approximately) 200 inclusions that were examined. An average of 106 inclusions were present per mm2 area and the majority (~80%) of those inclusions were less than 4 μm in size.

3.2. Hydrogen Measurements

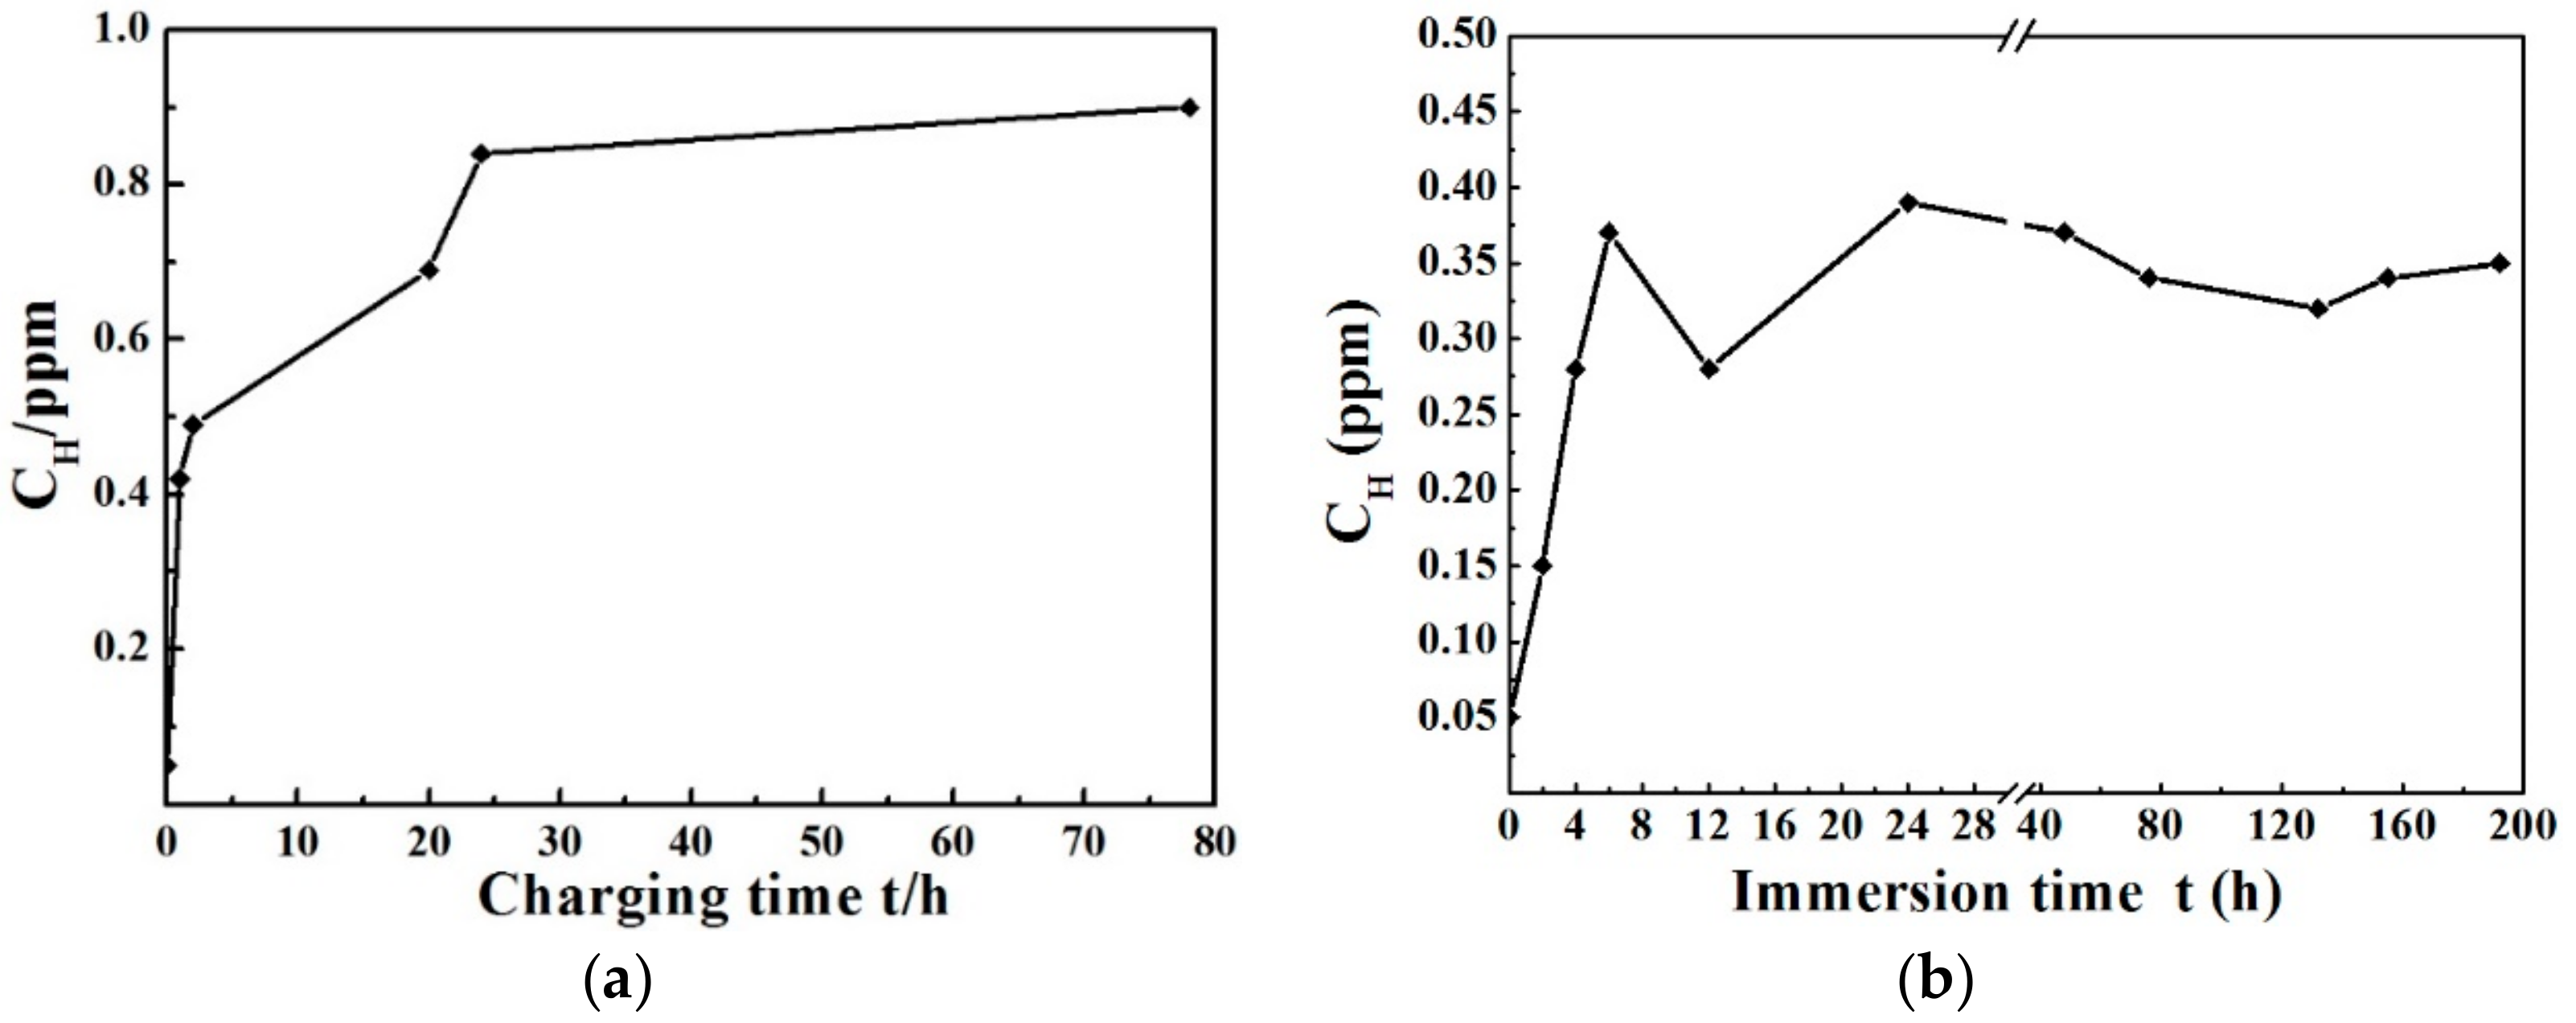
Figure 5 presents the change of hydrogen content with hydrogen charging time or immersion time. The hydrogen content increased gradually with the extension of hydrogen charging time and a total hydrogen steady-state level of about 0.85 ppm was obtained after 24 h of hydrogen pre-charging (as can be seen in Figure 5a), which seems to be the time that is needed for reaching a steady state. When the samples were immersed in the 3.5% NaCl solution, the change of hydrogen content is shown, as in Figure 5b. It can be seen that the hydrogen content rapidly increased with an extension of soaking time after the initial stage of soaking. After soaking for 6 h, the hydrogen content was basically stable at 0.35 ppm.

3.3. Mechanical Properties

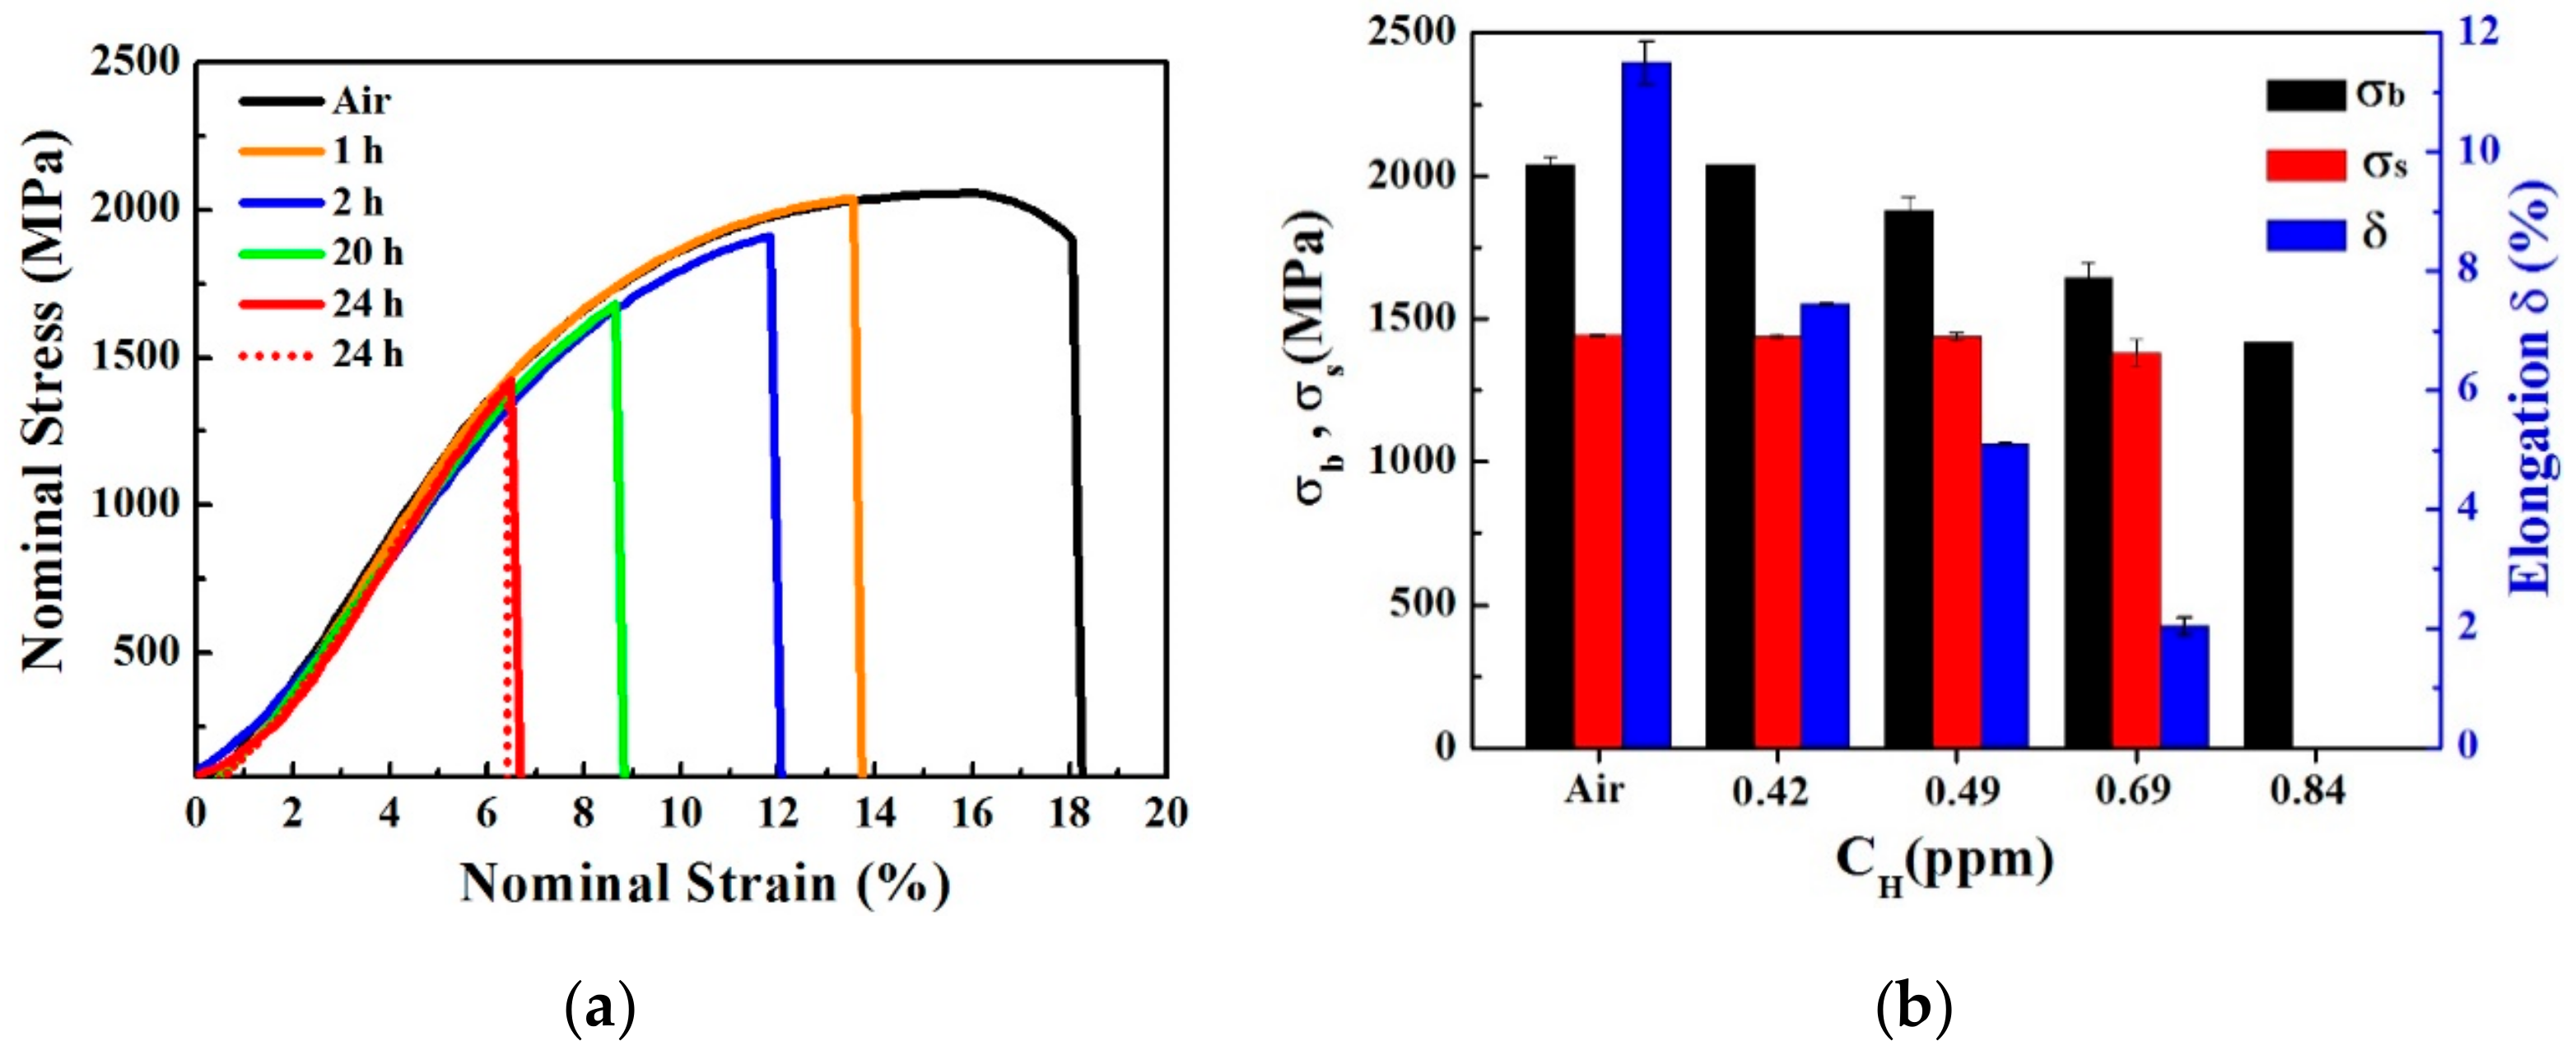
Figure 6a shows the nominal stress–nominal strain curves of the tensile tests for different pre-charging times, where the solid curves represent the nominal stress-nominal strain curves of the steel for different hydrogen pre-charging times at a strain rate of 1 × 10⁻³ s−1, and the dotted curve represents a strain rate of 1 × 10⁻⁶ s−1. It can be seen that the uncharged samples exhibited relatively high ultimate tensile strength and plastic elongation; about 2100 MPa and 11%, respectively. The mechanical properties may be over-estimated, due to the use of non-standard tensile specimens. The linear part of the slope of the curves cannot be regarded as the elastic modulus of the steel, as the strain was not obtained through a local extensometer, but instead was determined by recording the cross-head displacement of the tensile machine. This rapid speed minimized the hydrogen diffusion during the test at a strain rate of 1 × 10⁻³ s−1. When considering the hydrogen measurement results in Figure 5a, the hydrogen content of uncharged and electrolytic hydrogen charged for 1 h, 2 h, 20 h, and 24 h were 0.05 ppm, 0.42 ppm, 0.49 ppm, 0.69 ppm, and 0.84 ppm, respectively. Figure 6b summarizes the ultimate tensile strength, yield strength, and elongation of the uncharged specimens and the hydrogen-charged specimens with different hydrogen content at a strain rate of 1 × 10⁻³ s−1. It can be seen that, with an increase of hydrogen content, the tensile strength and elongation gradually decreased. In addition, the elongation loss rate was significantly higher than the strength loss rate, which indicated that an increase of hydrogen content had greater impact on the plasticity of the material. It must be mentioned that the yield strength was basically free from the influence of hydrogen content, as the hydrogen-charged specimens did not fracture within the elastic deformation range.
The 24 h pre-charged samples that were fractured at the elastic deformation range and a similar ductility loss (of about 100%) was obtained under strain rates of 1 × 10⁻³ s−1 and 1 × 10⁻⁶ s−1, as shown by the red lines in Figure 6a. The hydrogen content of the sample that was pre-charged for 24 h had reached a stable state, according to the change of hydrogen content with respect to hydrogen-charge time.
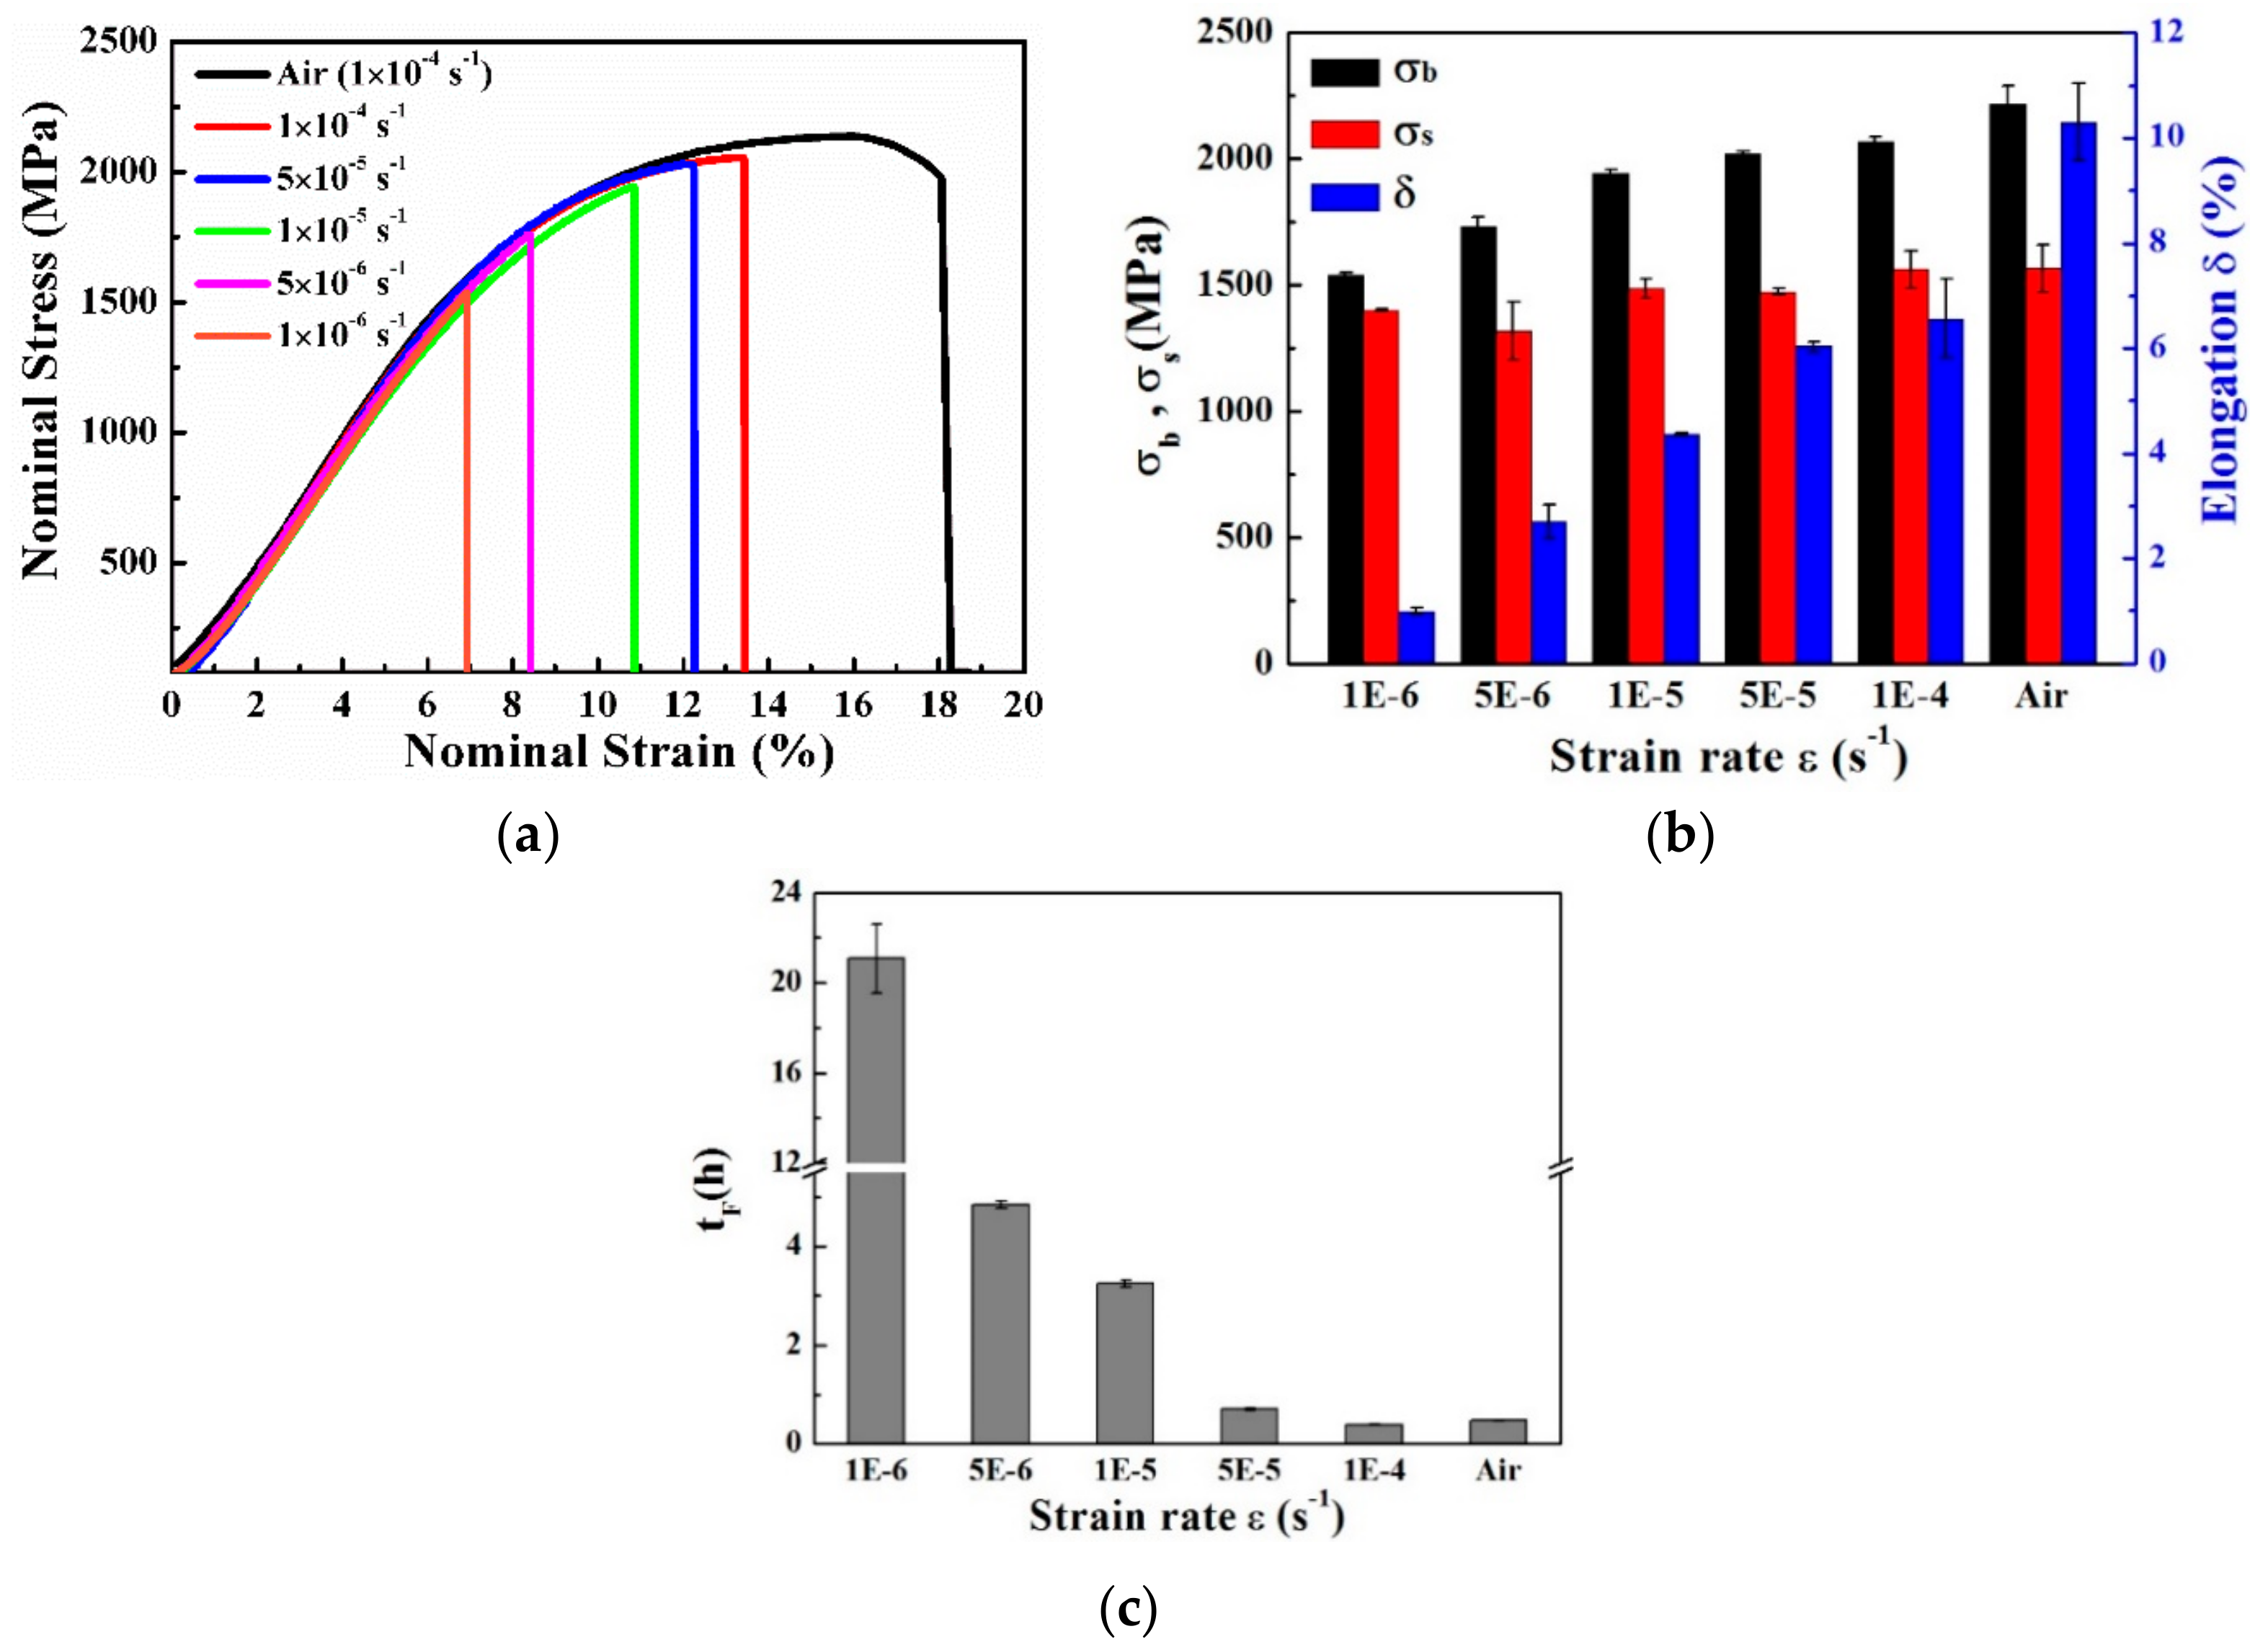
Figure 7a shows the nominal stress-nominal strain curves of the uncharged specimens, which were performed by in-situ immersing SSRT at varying strain rates. Figure 7b presents the ultimate tensile strength, yield strength, and elongation of the steel at different strain rates. It can be seen that the strain rate had an obvious influence on HIDC. As the strain rate decreased, the tensile strength and elongation gradually decreased, while the yield strength was almost unaffected by the strain rate. The elongation decreased faster than the tensile strength. These results were similar to the effects of hydrogen content on the HIDC. Figure 7c illustrates the fracture time of the sample under different strain rates. The hydrogen content in the samples with different fracture times can be roughly estimated, based on the change of hydrogen content with the soaking time in Section 3.2.

3.4. Fracture Surface Observation

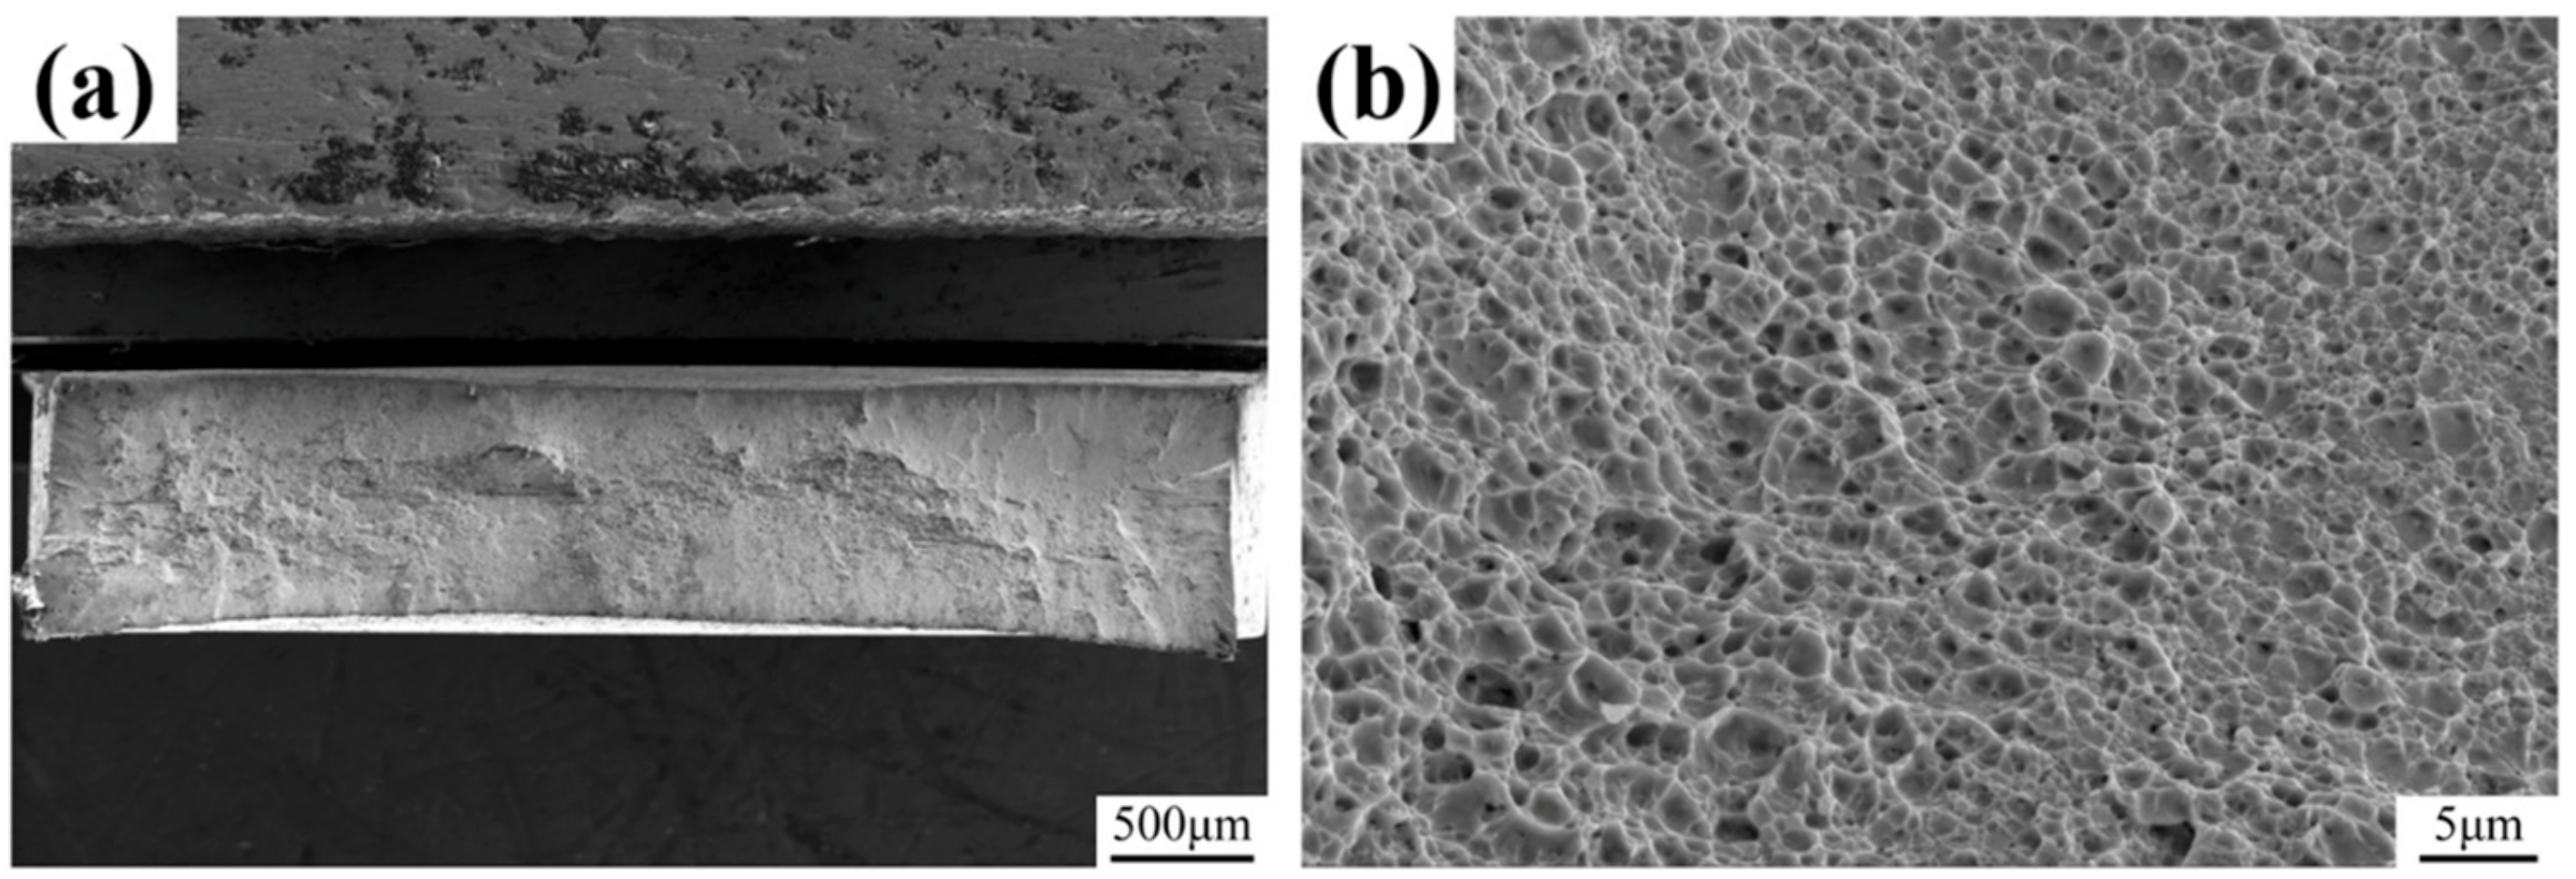
Figure 8 shows the SEM images of the fracture surface of the uncharged specimens, which were tensile tested in air. The fracture surface exhibited a ductile mode of failure by dimples, as shown in Figure 8b.
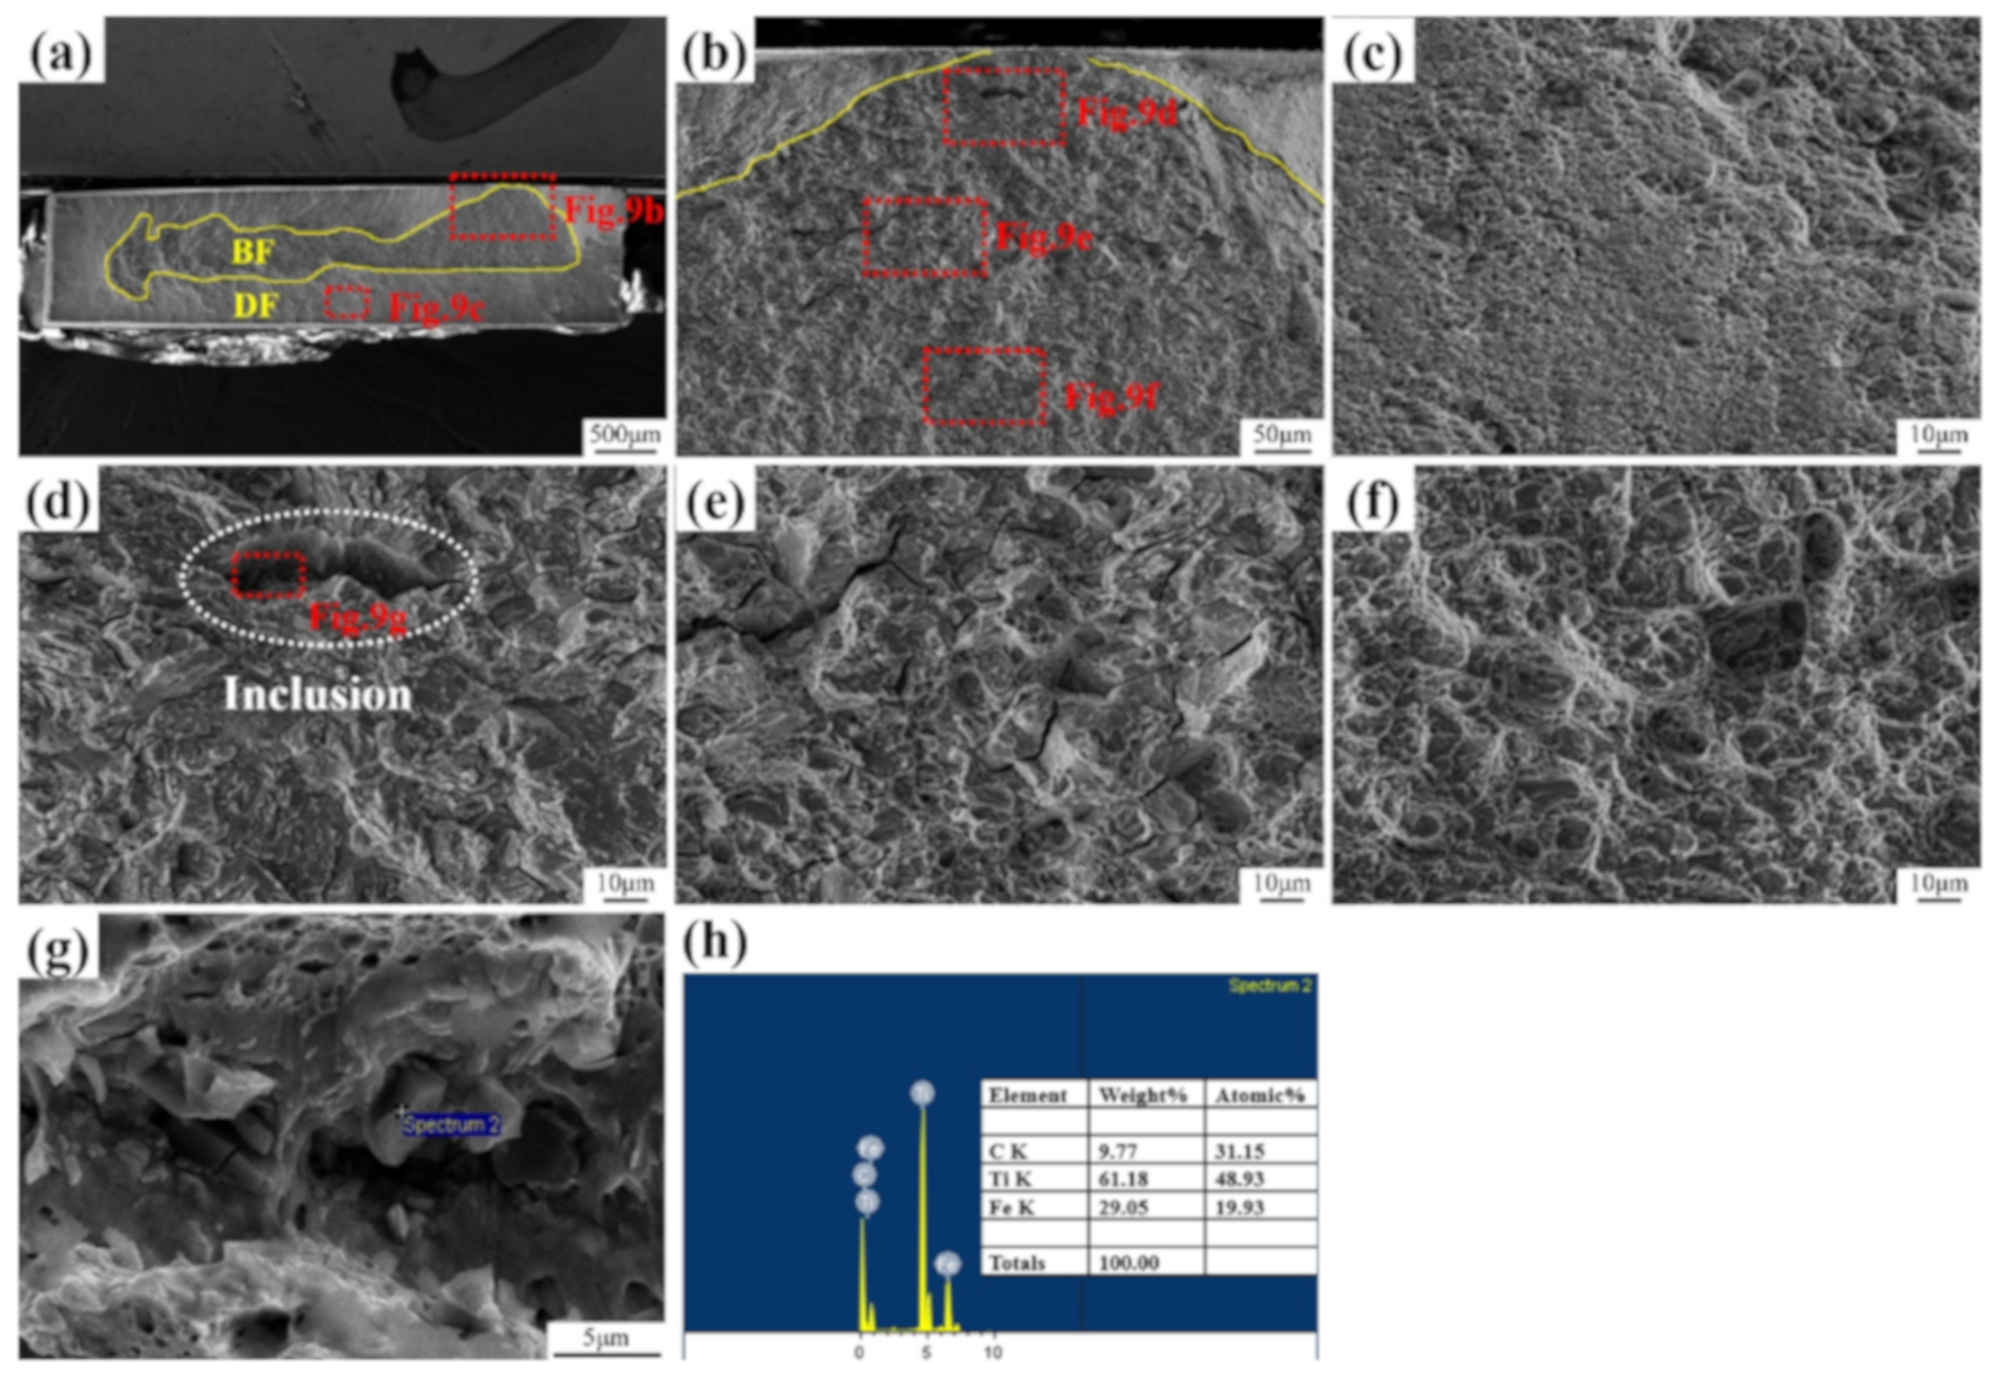
Figure 9 shows the SEM images of the fracture surface of the specimens with a 1 h pre-charging time and a strain rate of 1 × 10⁻³ s−1. A large brittle region appeared on the fracture surface, as shown in Figure 9a. The main fracture origin of the sample arose from inclusions and a hole left by the detached inclusions, as seen in Figure 9b. The fracture morphology around the inclusions was quasi-cleavage, as shown in Figure 9d, and the regions that were far from the inclusions in the brittle region presented the dimple morphology shown in Figure 9f. The intermediate transition region was a mixed morphology of cleavage, dimples, and secondary cracks, as shown in Figure 9e, which could be attributed to the fact that the brittle fracture competed with the ductile fracture during the final fracture process. Figure 9c shows the area outside the brittle area was the dimple morphology.
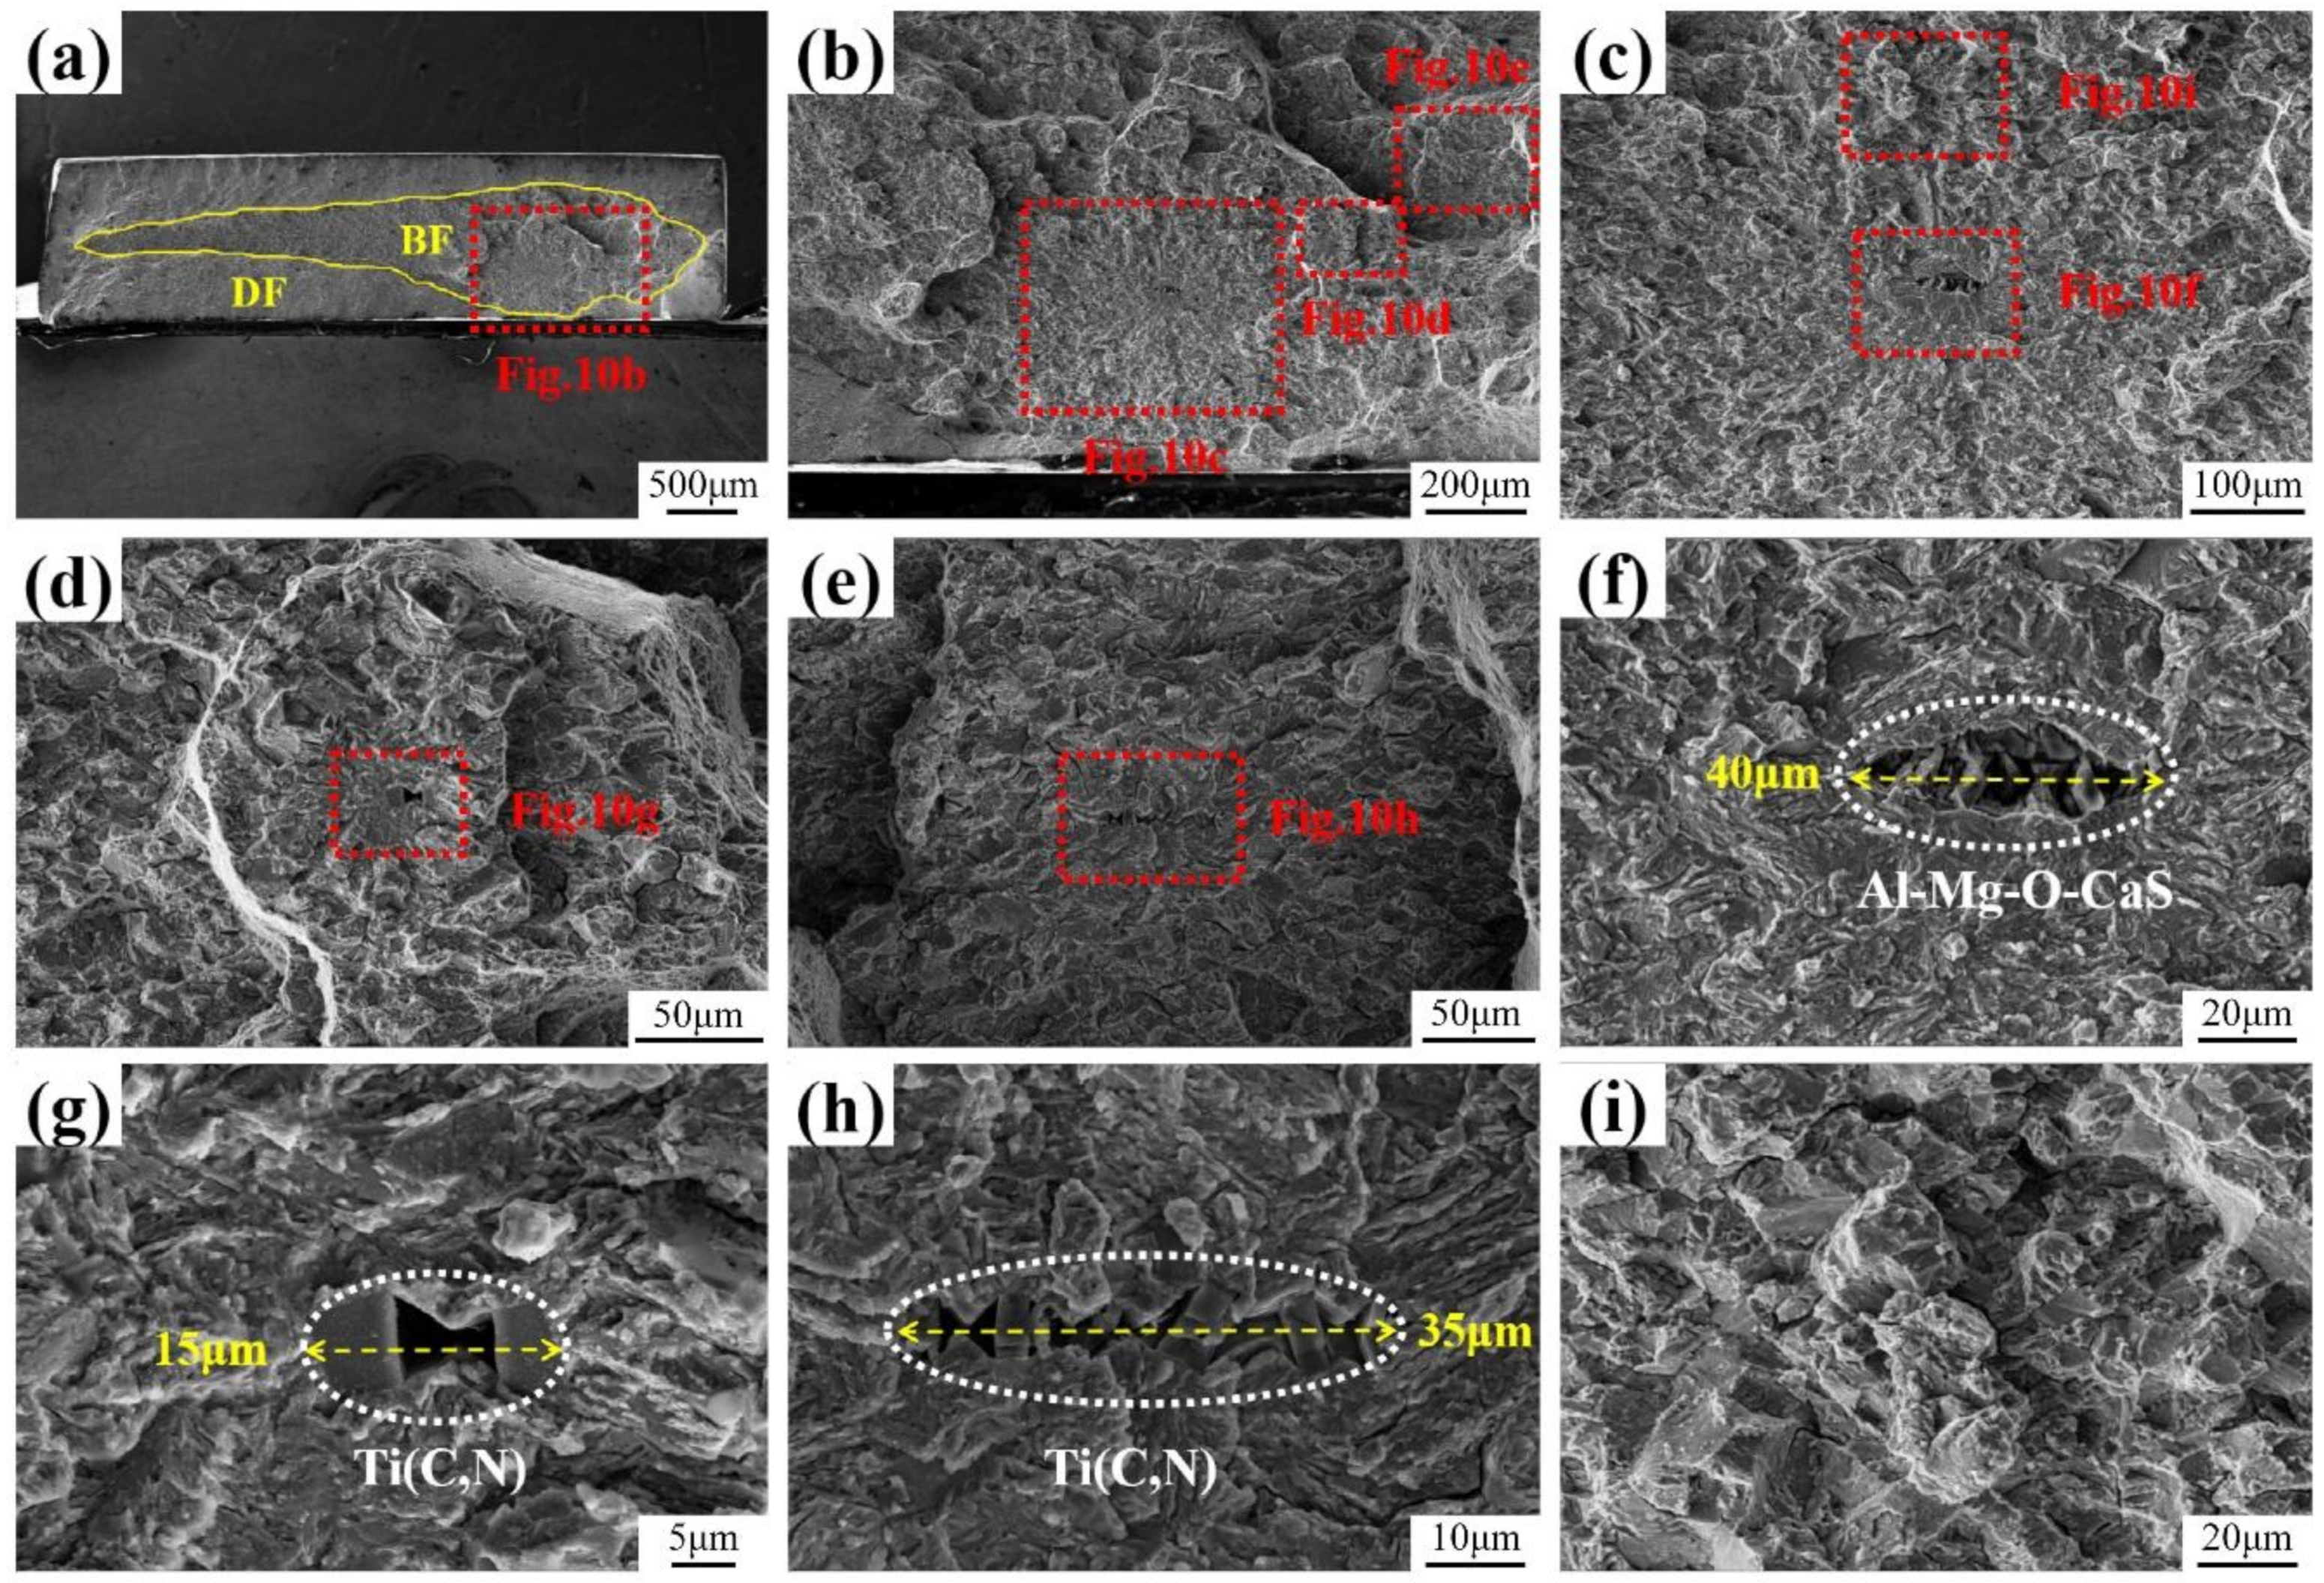
Figure 10 shows the SEM images of fracture surface of specimens with a 24 h pre-charging time and strain rate of 1 × 10⁻³ s−1. Figure 10a indicates the brittle area and the number of fish-eyes that are induced by inclusions, which obviously increased when compared with the fracture morphology of the 1 h pre-charged specimen. The main fracture origin of the specimens was still induced by large-sized inclusions, as indicated by Figure 10c,f. Figure 10d,e show fish-eye-like structures, induced by inclusions near the main fracture origin. Energy spectrum analysis (EDS) analysis found that the inclusions that induced fractures were Al-Mg-O-CaS and Ti(C, N) inclusions, as shown in Figure 10f,g, and h, and were abnormal large-sized inclusions in the experimental materials, according to Section 3.1. The fracture morphology around the inclusion-induced fractures was distinct quasi-cleavage and the area of quasi-cleavage features increased with the size of the inclusions. This result is in accordance with previous studies [22].
Ideally, the brittle fracture zone of the pre-charged sample with unsteady-state hydrogen content (the sample pre-charged for 1 h) should be on the surface of the sample due to the presence of hydrogen concentration gradient, while the ductile fracture zone should be in the center of the sample. However, the actual fracture morphology of the tensile sample of this experimental material showed the characteristics that are shown in Figure 9. We speculated that this phenomenon was mainly caused by the presence of large size inclusions in the material. The inclusion firstly accumulated a higher hydrogen concentration after the electrolysis pre-charge of hydrogen. When the samples were stretched at a faster strain rate, i.e. 1 × 10⁻³ s−1, the hydrogen had no time to be redistributed, and the crack would initiate and expand at the matrix/inclusion interfaces, which presented the state of high stress concentration, thus forming a brittle zone. In addition, for the sample with 24 h pre-charging, the hydrogen content in the material basically reached a steady state, as shown in Figure 5a, so there was no hydrogen concentration gradient from the edge to center in the sample. Therefore, under the condition of rapid strain rate, i.e. 1 × 10⁻³ s−1, the defect itself in the material had great influence on the extend properties.
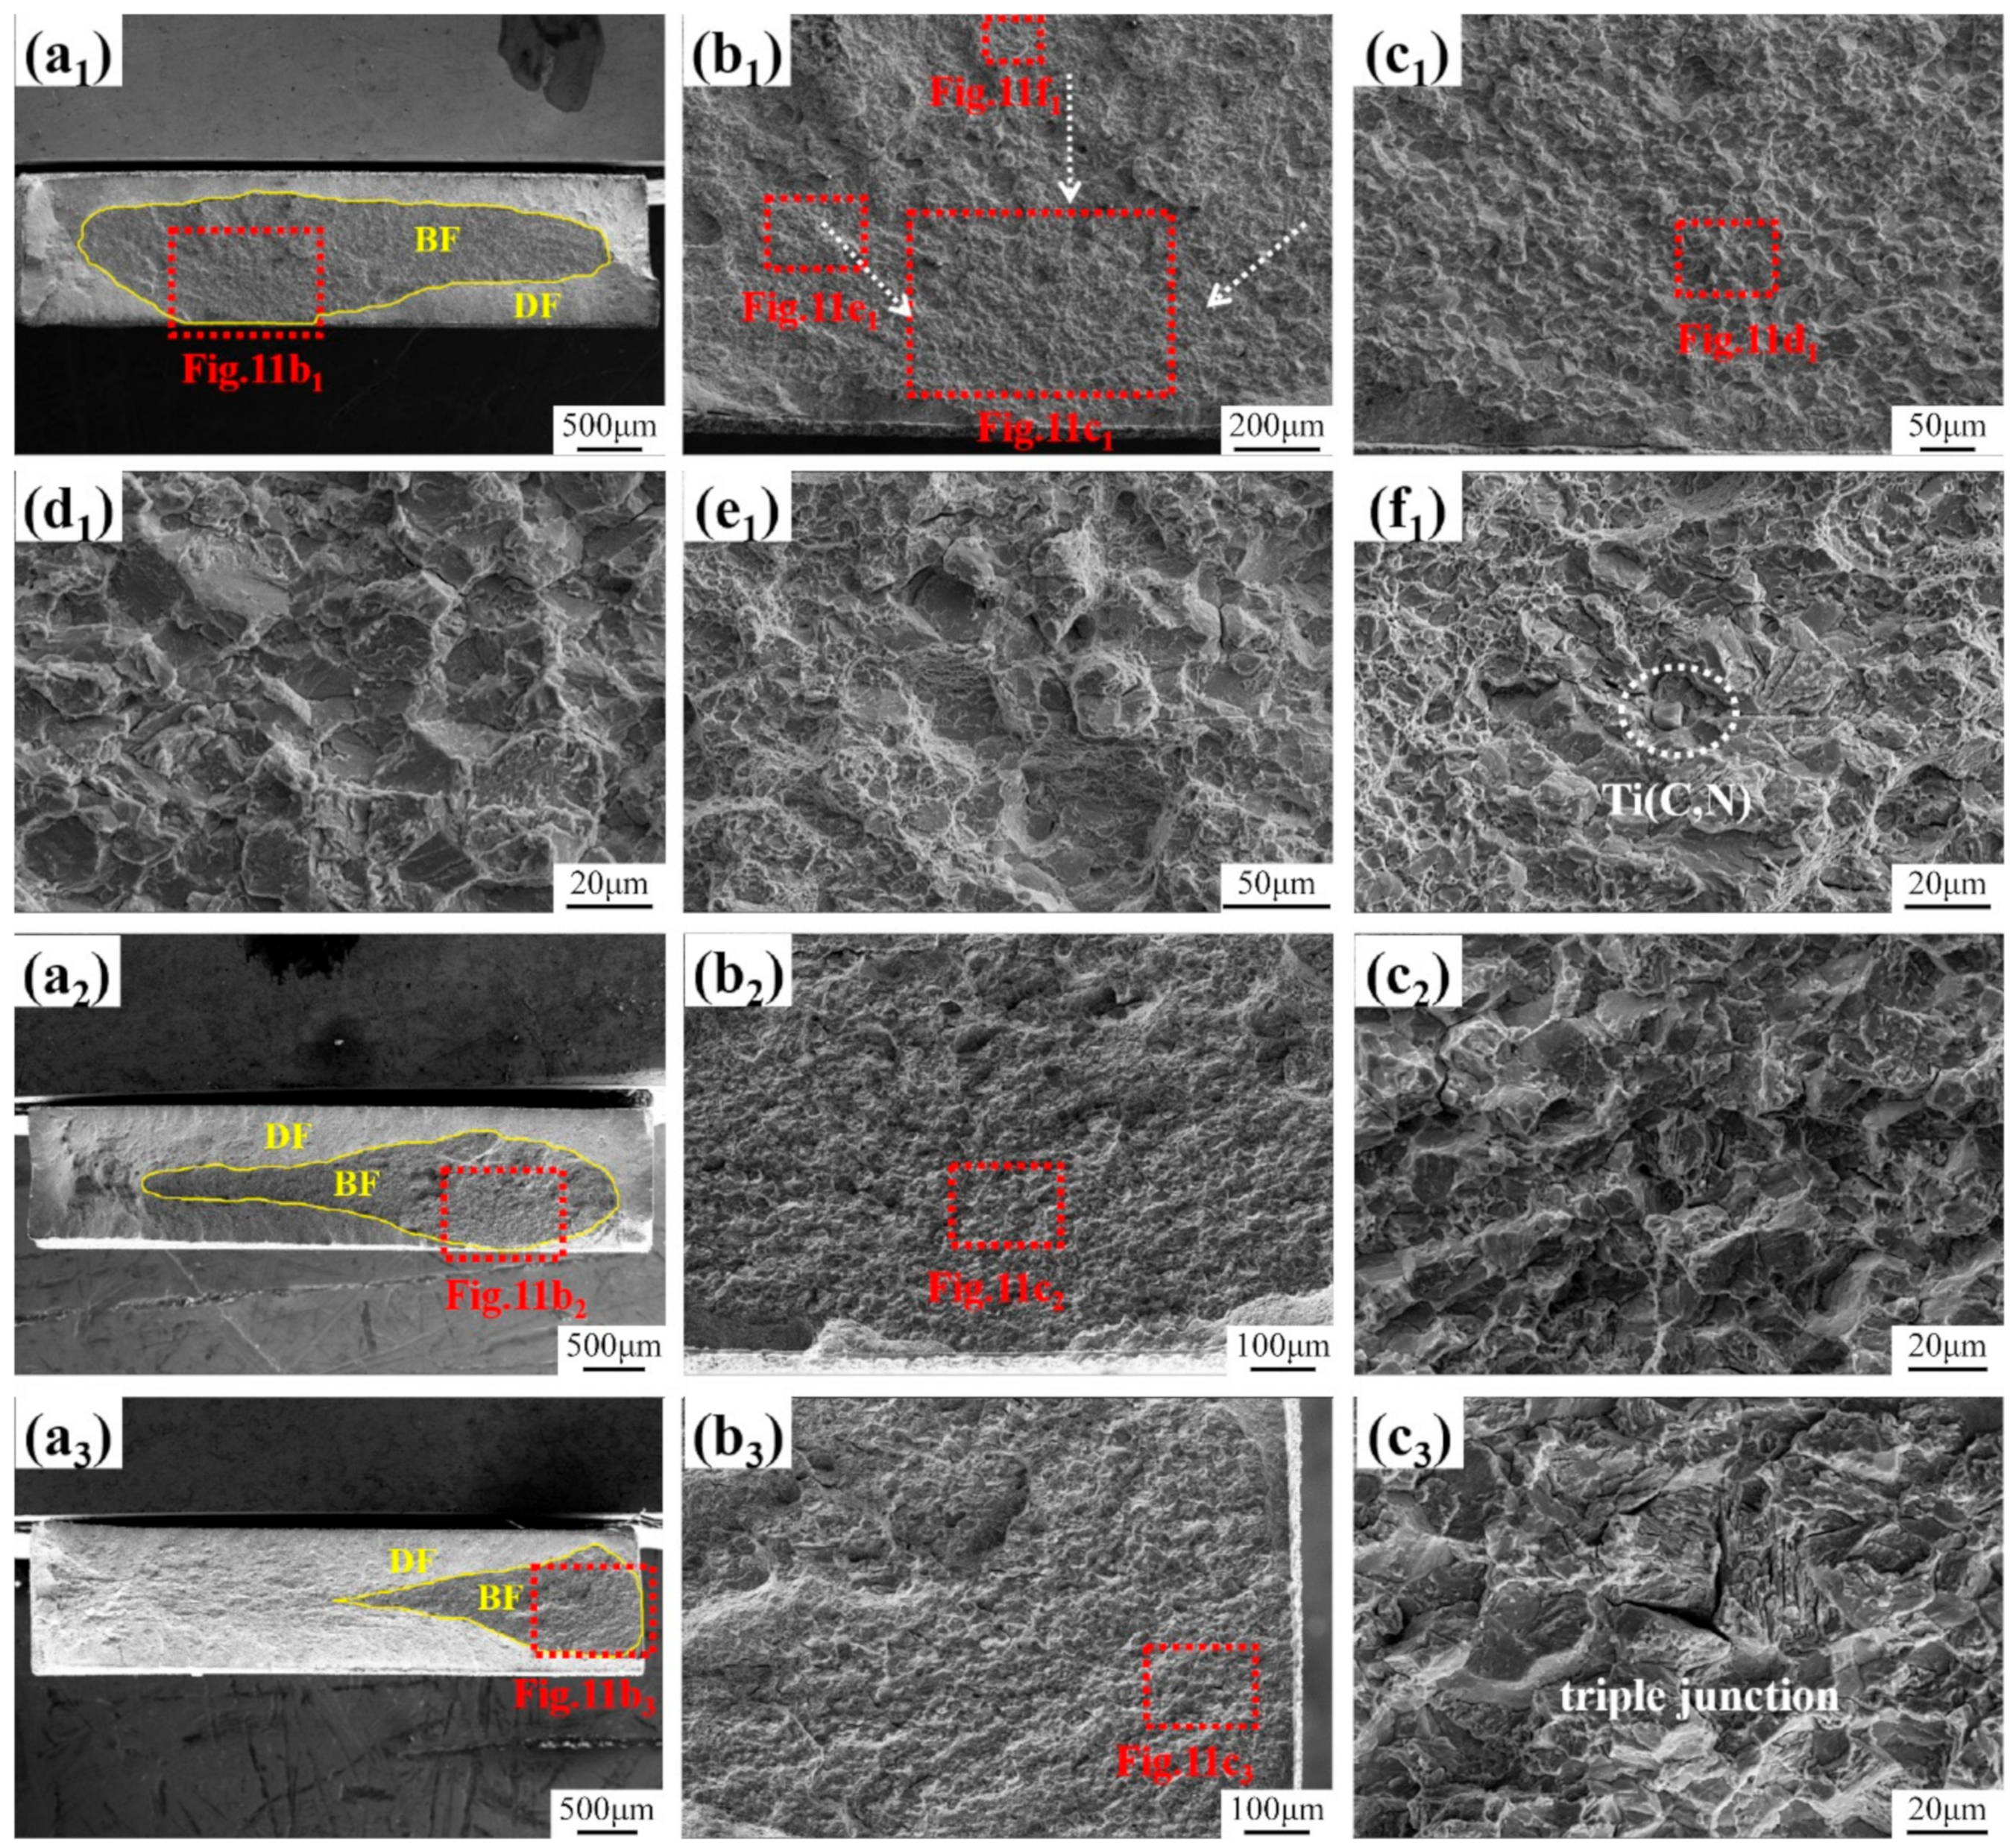
Figure 11 shows SEM images of fracture surface of specimens with a 24 h pre-charging time and strain rate of 1 × 10⁻⁶ s−1. The main fracture origin was not induced by inclusions, when compared with the fracture morphology of the specimens under a strain rate of 1 × 10⁻³ s−1, and distinct inter-granular fractures were observed, as shown in Figure 11a1–d1, Figure 11a2–c2, and Figure 11a3–c3. Fish-eye-like structures that were induced by inclusions were observed near the main fracture origin, as shown in Figure 11f1 and inter-granular features appeared around the Ti(C, N) inclusions. Figure 11e1 shows the transitional region from the inter-granular fracture to dimple, and the fracture morphology was a mixed morphology of inter-granular fractures and dimples.
Figure 12 shows the corresponding fracture surface morphologies of the non-pre-charged specimens, with in-situ immersed SSRT at different strain rates. The fracture morphology obviously changed and the brittle zone size increased with the decrease of strain rate, as shown in Figure 12a1,a2,a3. The fracture origin, under all strain rates, was at the edge of the samples, as indicated by Figure 12b1,b2,b3. When the strain rate was 1 × 10⁻⁴ s−1, a mixed morphology of cleavage and dimple was observed in the fracture origin, as shown in Figure 12c1. The fracture origin of the samples appeared to have inter-granular-like features when the strain rate was 5 × 10⁻⁵ s−1, as in Figure 12c2, and it presented obvious inter-granular fractures when the strain rate reduced to 1 × 10⁻⁶ s−1, as shown in Figure 12c3.

3.5. Hydrogen Enrichment Measurement by in-situ SKPFM

Figure 13a and b show the morphology and composition of the observed inclusions, where it can be seen that the inclusion is a Ti(C, N) inclusion (commonly seen in the test materials). The surface morphology of the inclusions and the surrounding matrix did not change due to single-side electrolytic hydrogen. Figure 13c,d show the potentials of inclusion, as measured by SKPFM before and after hydrogen charging. The results showed that the potential significantly increased after hydrogen charging. In addition, the potential of the matrix adjacent to the inclusions increased more than the matrix away from the inclusions; that is, the work function decreased. The potential of the matrix around the inclusions was analyzed at two selected lines in order to obtain a quantitative view of the H distribution (as shown in Figure 13c,d), as can be seen in Figure 13e. The result clearly revealed that more hydrogen was accumulated around the inclusions after hydrogen charging, with an obvious potential peak around the inclusion.

4. Discussion

4.1. Role of Inclusions in Steels

Inclusions in materials play an important role in hydrogen-induced delayed cracking. On one hand, they can act as irreversible hydrogen traps, which can lower the amount of diffusible hydrogen in the matrix to reduce the sensitivity of hydrogen embrittlement. On the other hand, inclusions can induce crack initiation and, thus, increase the risk of hydrogen embrittlement. The size of the inclusions is one of the main factors. If the inclusion size is less than a critical value, it only serves as a hydrogen trap; while, if the inclusion size is larger than the critical value, the inclusion/matrix interface not only enriches with hydrogen, but it can act as the initiation site for a hydrogen-induced crack [30]. Madelen et al. [20] found that the hydrogen atoms were trapped by small TiC/TiN particles, enhancing the resistance to HIDC, but the cracks were probably initiated at large TiC/TiN inclusions, increasing the risk of HIDC. Jin et al. [31] reported that the initiation of hydrogen-induced cracking was associated with Al- and Si-enriched inclusions. Tiegel et al. [10] also found that cracks originated at the inclusion–matrix interfaces.
In this work, the indirect observation of hydrogen enrichment contributes to a better understanding of the role of inclusions in hydrogen-induced cracking in hot-stamped steel. The in-situ SKPFM observation results (Figure 8) showed preferential hydrogen enrichment around the inclusions. This result has been supported by previous works. Oriani R.A. et.al. [32] found that the charged hydrogen atoms tended to diffuse and accumulate at local irregularities with a high stress concentration, such as the matrix/inclusion interfaces. Otsuka et al. [33] also found that hydrogen atoms tend to accumulate around the inclusions and provided direct evidence by tritium autoradiography. This is mainly due to the high trapping energy of the inclusions and the stress field around the inclusions, which force the hydrogen atoms to accumulate [30,34].
An analysis of the role of inclusions in HIDC in hot-stamped steel by changing the hydrogen content or strain rate follows.

4.2. Effect of the Hydrogen Content on the HIDC

Generally, hydrogen atoms enter materials during the manufacturing and processing phases and they become internal hydrogen, which can lead to hydrogen-induced cracking of the material in the later service process, especially for ultra-high strength steel containing defects, such as inclusions. This work simulated this situation by introducing different amounts of hydrogen into the materials, by changing the hydrogen pre-charging time. The experimental results indicate that the influence of hydrogen content on the plasticity was significant and on strength was slight, relatively. These results are consistent with various works [35].
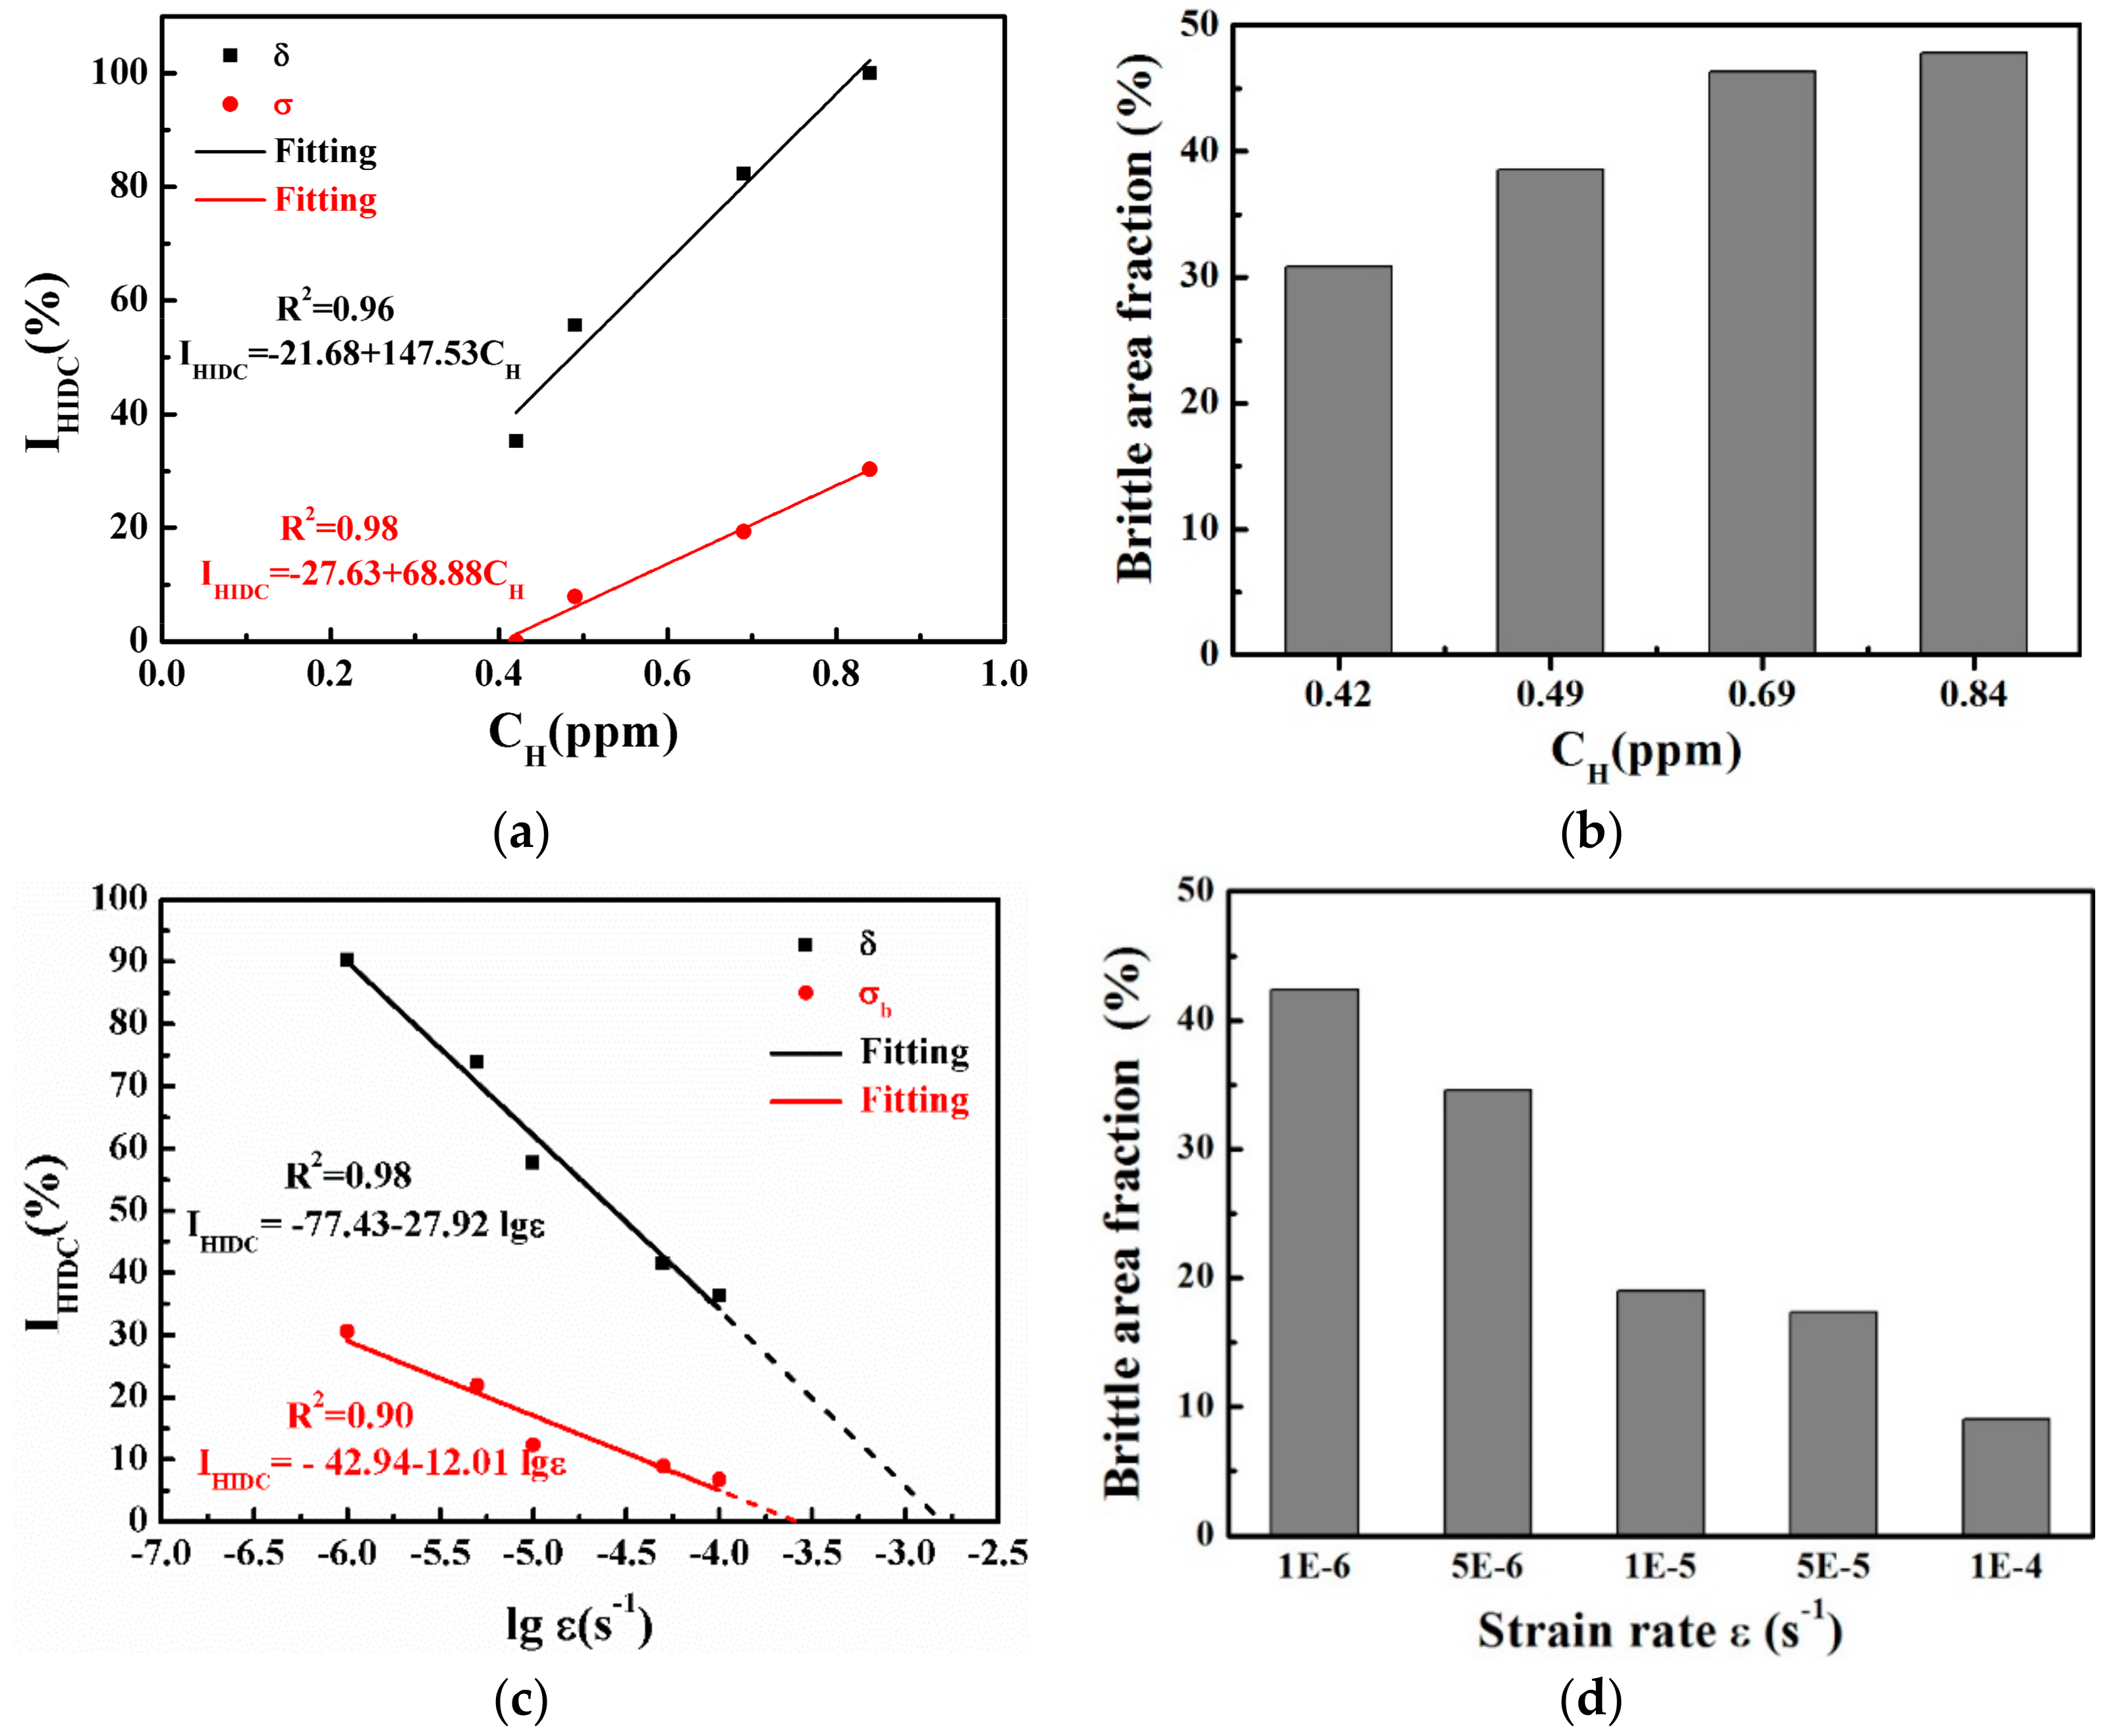
Figure 14a shows the linear relationship between the HIDC sensitivity index and the hydrogen content, which the loss rates of elongation and of strength characterize. It can be seen that the HIDC sensitivity index increases with an increase of hydrogen content, and that the influence of hydrogen was embodied in the loss of plasticity, rather than by the decreased strength of the material.
In terms of fracture morphology, it was a common feature that the fractures of samples with different pre-charging times under a strain rate of 1 × 10⁻³ s−1 originated from inclusions. The main source of fractures that were induced by the inclusions can be seen in all tensile fractures. The size of the inclusions that observed in the hydrogen-charged samples that could induce the fracture origin and fish-eyes, as can be seen in Figure 10, were much larger than the average size (4 μm) of the inclusions, as counted in Figure 4. The reason for this phenomenon may be that these large inclusions are more likely to “appear” in the presence of hydrogen, because the larger inclusions, as hydrogen traps, capture more hydrogen, and a more serious enrichment of hydrogen is more likely to cause HIDC. Therefore, more abnormal large-sized inclusions were seen in the fractures of the hydrogen-charged sample.
The findings [20,36] that small inclusions might not lead to brittle fish-eyes supported this phenomenon. In addition, the shapes of the inclusions were squares or rhombuses, which can cause higher stress values than round-shaped inclusions, as they have sharp edges, which can lead to stress concentration [37]. The main reason for fractures induced by large inclusions can be explained, as follows: There is a critical size for an inclusion to cause crack initiation [30]. When the inclusion size is smaller than the critical value, the inclusion–matrix interfaces cannot provide sufficient space for crack initiation and the crack cannot form at the interface. On the contrary, when the size of the inclusion is larger than the critical value, there can be enough crack initiation space. Moreover, the larger the size of the inclusions, especially the longer in the length, the higher the dislocation density around it, and the higher the hydrogen concentration induced by the surrounding stress field is and, therefore, the easier it is for cracks to initiate in large-sized inclusions, and a larger quasi-cleavage area is formed around the inclusions. In addition, there are gaps in broken inclusions, which further promotes the formation of cracks. It was also found that the number of fish-eyes that were induced by inclusions increased when the hydrogen content in the sample increased. This may be because a long hydrogen pre-charging time helps hydrogen atoms to accumulate around a larger number of inclusions; then, the crack can initiate when the binding strength reaches a critical value, according to the HEDE mechanism. Figure 14b shows the relationship between the brittle area fraction of pre-charged specimens under a strain rate of 1 × 10⁻³ s−1 and the hydrogen content (i.e., the hydrogen charging time). The area fraction of the brittle fracture increased as hydrogen content enhanced.

4.3. Effect of the Strain Rate on the HIDC

4.3.1. High hydrogen Content in Materials

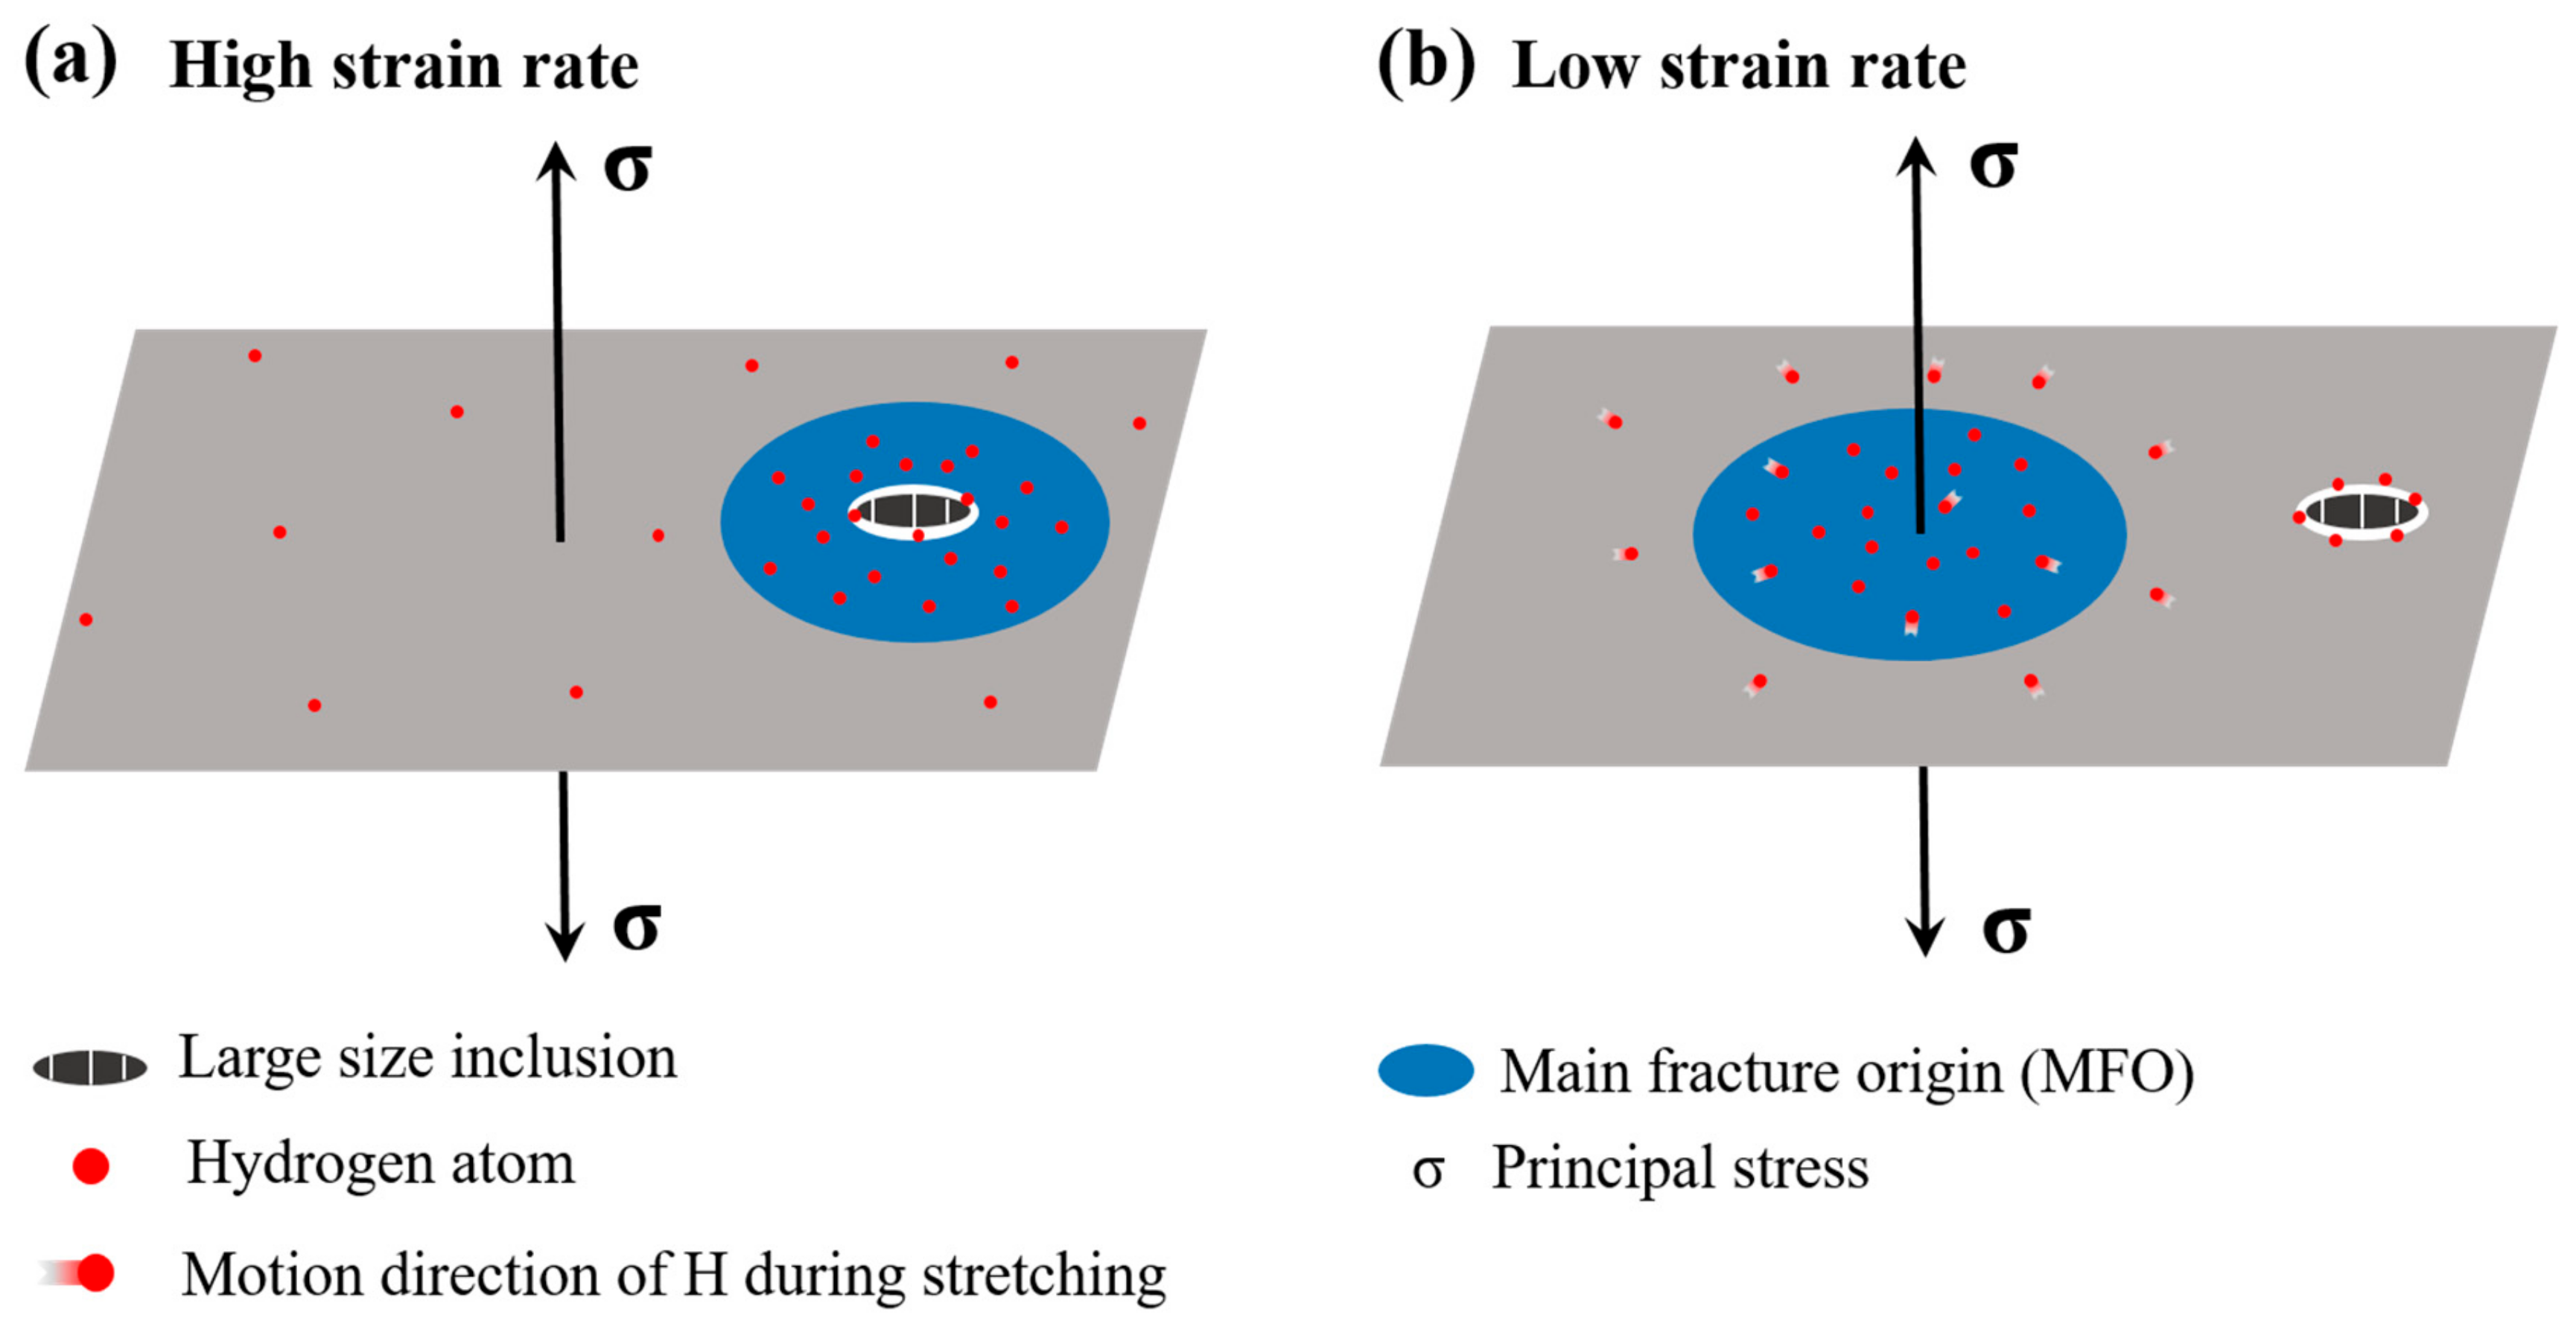
When the hydrogen content in the tensile specimens reached a steady state (i.e., 0.84 ppm), the strain rate had little effect on the mechanical properties of ultra-high strength steel, while different features appeared on the fracture surface, where the main fracture origin was not induced by inclusions and it appeared as a distinct inter-granular fracture, when stretched at a slower strain rate (i.e., 1 × 10⁻⁶ s−1). Combining the results of in-situ SKPFM to analyze the causes of this phenomenon: Hydrogen atoms preferentially enriched around the inclusions after hydrogen pre-charging; especially, when there were gaps in the inclusions or in the inclusion-matrix interface, the hydrogen accumulation was promoted and hydrogen concentration was high at the broken inclusions or matrix/inclusions interfaces. When the strain rate was fast (i.e., 1 × 10⁻³ s−1), the specimens fractured quickly (in about one minute) and the hydrogen that was enriched in the inclusions did not have enough time to redistribute, which gave the characteristics of high hydrogen concentrations and high stress concentrations around the inclusions. As a result, the specimens were easy to crack and they formed a main fracture source of trans-granular quasi-cleavage morphology in the large-sized inclusions, as shown in Figure 15a. When the strain rate was slow (i.e., 1 × 10⁻⁶ s−1), the fracture time of the samples was about 18 h, and the hydrogen atoms around the inclusions had enough time to re-distribute and diffuse under stress induction. Grain boundaries were also preferential hydrogen trap sites, due to their possible role as short-circuit for hydrogen diffusion and high stress [13]. In addition, martensitic steels have a high density of movable dislocation [24]. Therefore, hydrogen could be transported to the prior austenite grain boundary by movable dislocations during the stretching process and, consequently, the cohesion of grain boundary would be reduced, due to hydrogen segregation (i.e., a HEDE-type mechanism) [9,23,38,39,40]. When the cohesion was less than the critical stress, it would lead to inter-granular fracture, as shown in Figure 15b. Of course, the main fracture origin of the sample may also be formed at the large-size inclusions if there happened to be large-sized inclusions at area of the principal stress. However, we did not observe this phenomenon in multiple parallel samples.

4.3.2. Low Hydrogen Content in Materials

A certain amount of hydrogen will still enter in the service process, even if the material prevents the introduction of hydrogen in the processing: What can we say about the behavior of a material containing inclusions, in this case?
According to Formula (1), the HIDC sensitivity index of ultra-high strength steel at different strain rates was calculated, as shown in Figure 14c. It can be seen that the HIDC sensitivity index increased with a decrease in strain rate. In addition, the strength loss rate was lower than the elongation loss rate, which indicated that the strain rate had a greater impact on plasticity when ultra-high strength steels were used in an environment containing hydrogen. The logarithm of strain rate and HIDC sensitivity index, as characterized by strength loss rate and plasticity loss rate, were fitted, as shown in Figure 14c; the relation between IHIDC and lgε in the present situation were linearly fitted, as follows:
IHIDC(δ) = −77.43 − 27.92lgε, IHIDC(σ) = −42.94 − 12.01lgε
According to Equations (2), when IHIDC(δ) = 0 and IHIDC(σ) = 0, the corresponding critical strain rates are 1.69 × 10⁻³ s−1 and 2.66 × 10⁻⁴ s−1, respectively. This means that there is no hydrogen-induced plastic loss when ultra-high strength steel is stretched at a strain rate that is larger than 1.69 × 10⁻³ s−1 in 3.5% NaCl solution, and no strength loss when the strain rate is greater than 2.66 × 10⁻⁴ s−1.
Ideally, for the materials with uniform composition and microstructure, the brittle zone of the dynamic hydrogen-charged SSRT should be uniformly distributed around the specimen, but all of the fracture sources of the samples in this experiment were in marginal sites, which may be related to the existence of many inclusions with a large size in the experimental materials. Wang et al. [41] found both complex oxide inclusions and Si-enriched inclusions can induce the initiation of micro-cracks. When the experimental material was stretched in a 3.5% NaCl solution, local corrosion would be first generated at the inclusions on the surface of the sample, as shown in Figure 12 (indicated by yellow arrows), and the corrosion products could be clearly seen. The existence of corrosion pits was equivalent to a gap for the smooth sample, following which stress concentration will be formed when stretching; therefore, hydrogen will accumulate in the inclusion under stress induction [42,43,44,45]. At the same time, hydrogen is also produced during corrosion. The local hydrogen concentration increases under the combined action of these two sources of hydrogen. The crack will expand when the hydrogen concentration exceeds the critical value where the fracture can occur. Previous work [46,47] has indicated that the maximum strain occurs at the center of the plate tensile specimen, due to the multiplication of dislocations and vacancies after plastic deformation. Hydrogen will diffuse to the center of the sample until a fracture occurs, due to the presence of a stress gradient.
Fish-eyes that are induced by inclusions were rarely observed on the fracture surface, which can be attributed to the low hydrogen content of the specimens. The fracture time of the samples was about 20 h under the slowest strain rate (i.e., 1 × 10⁻⁶ s−1). The hydrogen content in the sample was roughly estimated to be 0.35 ppm, according to the variation curve of hydrogen content with immersing time in Figure 5b. Figure 14d shows the relationship between the brittle area fraction of the uncharged specimens with in-situ continuous soaking SSRT and strain rates. The area fraction of the brittle fracture increased as the strain rate decreased.

5. Conclusions

In present work, the role of inclusions in hot-stamped steel on HIDC was studied by changing the hydrogen content or strain rate and by using tensile tests. The main results that were obtained are as follows:
(1)
As the hydrogen content increased, the plasticity and strength decreased for the pre-charged hydrogen unsteady-state specimens. All of the fractures originated from large-sized inclusions and the brittle fracture area increased as the hydrogen content increased. The in-situ SKPFM results indicated that more hydrogen was accumulated around the inclusions after hydrogen charging.
(2)
For pre-charged hydrogen steady-state samples, the surroundings of large-sized inclusions induced the main fracture origin and fish-eyes were presented as quasi-cleavage features at a higher strain rate (of 1 × 10⁻³ s−1). At a lower strain rate (of 1 × 10⁻⁶ s−1), in contrast, the main fracture origin was not induced by the inclusions and appeared, instead, as a distinct inter-granular fracture. The above results mean that, when the sample was deformed at a relatively high strain rate, the micro-cracks originated from the vicinity of the inclusions, and the fracture surface showed more large-sized inclusions; therefore, the defect itself in the material had great influence on the tensile properties, in this case. The hydrogen in the material had enough time to diffuse and re-enrich when the sample was deformed at a slower strain rate; thus, the slower the strain rate, the greater the influence of hydrogen, so that the final fracture exhibited inter-granular characteristics.
(3)
For non-pre-charged specimens, on which in-situ continuous soaking SSRT was performed, as the strain rate decreased, the tensile strength and elongation gradually decreased. The fracture origin under all strain rates were corrosion pits at the edge of the samples, due to the presence of large inclusions near the sample surface, and the brittle fracture zone increased with a decrease of strain rate.
Based on the above tensile test results and a large number of statistics on the number and size of inclusions in the experimental materials, it can be seen that, the size of inclusions observed at the fracture surface of the hydrogen-charged samples were very large although there were a large number of inclusions in the steel (the average size was about 4 μm, and 95% of inclusions were below 10 μm). It can be found that the existence of large-sized inclusions aggravates the occurrence of hydrogen-induced delay cracking of hot-stamped steel. Therefore, large-sized inclusions should be avoided during material manufacturing and processing, especially those inclusions that were larger than 15 μm (i.e., the minimum size of inclusions that could induce the fracture origin in the fracture surface of hydrogen-charged samples).

Author Contributions

Conceptualization, H.J. and J.L.; Data curation, H.J. and Y.S.; Formal analysis, H.J.; Investigation, H.J.; Methodology, H.J.; Project administration, H.J., X.Z. and J.X.; Software, H.J.; Writing—original draft, H.J.; Writing—review & editing, H.J. and J.L.

Funding

This research was funded by the National Nature Science Foundation of China under grant Nos. U1760203 and 51571029, as well as National Key Research and Development Program of China 2017YFB0304401.

Acknowledgments

The authors are grateful to the PHS&D Center, Ling Yun GNS Technology Co., Ltd for the offering of the materials used for experiments.

Conflicts of Interest

The authors declare no conflict of interest. The funders had no role in the design of the study; in the collection, analyses, or interpretation of data; in the writing of the manuscript, or in the decision to publish the results.

References

  1. Liu, Q.L.; Zhou, Q.J.; Venezuela, J.; Zhang, M.X.; Wang, J.Q.; Atrens, A. A review of the influence of hydrogen on the mechanical properties of DP, TRIP, and TWIP advanced high-strength steels for auto construction. Corros. Rev. 2016, 34, 127–152. [Google Scholar] [CrossRef]
  2. Laureys, A.; Depover, T.; Petrov, R.; Verbeken, K. Characterization of hydrogen induced cracking in TRIP-assisted steels. Int. J. Hydrogen Energy 2015, 40, 16901–16912. [Google Scholar] [CrossRef]
  3. Wang, Y.J.; Sun, J.J.; Jiang, T.; Sun, Y.; Guo, S.W.; Liu, Y.N. A low-alloy high-carbon martensite steel with 2.6 GPa tensile strength and good ductility. Acta Mater. 2018, 158, 247–256. [Google Scholar] [CrossRef]
  4. Schaffner, T.; Hartmaier, A.; Kokotin, V.; Pohl, M. Analysis of hydrogen diffusion and trapping in ultra-high strength steel grades. J. Alloy Compd. 2018, 746, 557–566. [Google Scholar] [CrossRef]
  5. Matsumoto, Y.; Miyashita, T.; Takai, K. Hydrogen behavior in high strength steels during various stress applications corresponding to different hydrogen embrittlement testing methods. Mater. Sci. Eng. A 2018, 735, 61–72. [Google Scholar] [CrossRef]
  6. Kim, H.J.; Park, H.K.; Lee, C.W.; Yoo, B.G.; Jung, H.Y. Baking Effect on Desorption of Diffusible Hydrogen and Hydrogen Embrittlement on Hot-Stamped Boron Martensitic Steel. Metals 2019, 9, 636. [Google Scholar] [CrossRef]
  7. Kim, H.J.; Jeon, S.H.; Yang, W.S.; Yoo, B.G.; Chung, Y.D.; Ha, H.Y.; Chung, H.Y. Effects of titanium content on hydrogen embrittlement susceptibility of hot-stamped boron steels. J. Alloy Compd. 2018, 735, 2067–2080. [Google Scholar] [CrossRef]
  8. Barrera, O.; Bombac, D.; Chen, Y.; Daff, T.D.; Galindo-Nava, E.; Gong, P.; Haley, D.; Horton, R.; Katzarov, I.; Kermode, J.R.; et al. Understanding and mitigating hydrogen embrittlement of steels: A review of experimental, modelling and design progress from atomistic to continuum. J. Mater. Sci. 2018, 53, 6251–6290. [Google Scholar] [CrossRef]
  9. Koyama, M.; Tasan, C.C.; Akiyama, E.; Tsuzaki, K.; Raabe, D. Hydrogen-assisted decohesion and localized plasticity in dual-phase steel. Acta Mater. 2014, 70, 174–187. [Google Scholar] [CrossRef]
  10. Tiegel, M.C.; Martin, M.L.; Lehmberg, A.K.; Deutges, M.; Borchers, C.; Kirchheim, R. Crack and blister initiation and growth in purified iron due to hydrogen loading. Acta Mater. 2016, 115, 24–34. [Google Scholar] [CrossRef]
  11. Dong, C.F.; Liu, Z.Y.; Li, X.G.; Cheng, Y.F. Effects of hydrogen-charging on the susceptibility of X100 pipeline steel to hydrogen-induced cracking. Int. J. Hydrogen Energy 2009, 34, 9879–9884. [Google Scholar] [CrossRef]
  12. Zhang, G.A.; Cheng, Y.F. Micro-electrochemical characterization of corrosion of welded X70 pipeline steel in near-neutral pH solution. Corros. Sci. 2009, 51, 1714–1724. [Google Scholar] [CrossRef]
  13. Koyama, M.; Springer, H.; Merzlikin, S.V.; Tsuzaki, K.; Akiyama, E.; Raabe, D. Hydrogen embrittlement associated with strain localization in a precipitation-hardened Fe-Mn-Al-C light weight austenitic steel. Int. J. Hydrogen Energy 2014, 39, 4634–4646. [Google Scholar] [CrossRef]
  14. Fujita, S.; Murakami, Y. A New Nonmetallic Inclusion Rating Method by Positive Use of Hydrogen Embrittlement Phenomenon. Metall. Mater. Trans. A 2013, 44, 303–322. [Google Scholar] [CrossRef]
  15. Dunne, D.P.; Hejazi, D.; Saleh, A.A.; Haq, A.J.; Calka, A.; Pereloma, E.V. Investigation of the effect of electrolytic hydrogen charging of X70 steel: I. The effect of microstructure on hydrogen-induced cold cracking and blistering. Int. J. Hydrogen Energy 2016, 41, 12411–12423. [Google Scholar] [CrossRef]
  16. Ervasti, E.; Stahlberg, U. Void initiation close to a macro-inclusion during single pass reductions in the hot rolling of steel slabs: A numerical study. J. Mater. Process. Technol. 2005, 170, 142–150. [Google Scholar] [CrossRef]
  17. Liu, Q.L.; Zhou, Q.J.; Venezuela, J.; Zhang, M.X.; Atrens, A. The role of the microstructure on the influence of hydrogen on some advanced high-strength steels. Mat. Sci. Eng. A 2018, 715, 370–378. [Google Scholar] [CrossRef] [Green Version]
  18. Lovicu, G.; Bagliani, E.P.; De Sanctis, M.; Dimatteo, A.; Ishak, R.; Valentini, R. Hydrogen embrittlement of a medium carbon Q&P steel. Metall. Ital. 2013, 105, 3–10. [Google Scholar]
  19. Sojka, J.; Vodarek, V.; Schindler, I.; Ly, C.; Jerome, M.; Vanova, P.; Ruscassier, N.; Wenglorzova, A. Effect of hydrogen on the properties and fracture characteristics of TRIP 800 steels. Corros. Sci. 2011, 53, 2575–2581. [Google Scholar] [CrossRef]
  20. Madelen, O.; Todoshchenko, I.; Yagodzinskyy, Y.; Saukkonen, T.; Hanninen, H. Role of Nonmetallic Inclusions in Hydrogen Embrittlement of High-Strength Carbon Steels with Different Microalloying. Metall. Mater. Trans. A 2014, 45, 4742–4747. [Google Scholar] [CrossRef]
  21. Bal, B.; Koyama, M.; Gerstein, G.; Maier, H.J.; Tsuzaki, K. Effect of strain rate on hydrogen embrittlement susceptibility of twinning-induced plasticity steel pre-charged with high-pressure hydrogen gas. Int. J. Hydrogen Energy 2016, 41, 15362–15372. [Google Scholar] [CrossRef] [Green Version]
  22. Wu, X.Q.; Kim, I.S. Effects of strain rate and temperature on tensile behavior of hydrogen-charged SA508 Cl.3 pressure vessel steel. Mater. Sci. Eng. A 2003, 348, 309–318. [Google Scholar] [CrossRef]
  23. Momotani, Y.; Shibata, A.; Terada, D.; Tsuji, N. Effect of strain rate on hydrogen embrittlement in low-carbon martensitic steel. Int. J. Hydrogen Energy 2017, 42, 3371–3379. [Google Scholar] [CrossRef]
  24. Kan, B.; Yang, Z.X.; Wang, Z.; Li, J.X.; Zhou, Q.J.; Su, Y.J.; Qiao, L.J.; Volinsky, A.A. Hydrogen redistribution under stress-induced diffusion and corresponding fracture behaviour of a structural steel. Mater. Sci. Technol. 2017, 33, 1539–1547. [Google Scholar] [CrossRef]
  25. Ghosh, A.; Ray, A.; Chakrabarti, D.; Davis, C.L. Cleavage initiation in steel: Competition between large grains and large particles. Mater. Sci. Eng. A 2013, 561, 126–135. [Google Scholar] [CrossRef]
  26. Tervo, H.; Kaijalainen, A.; Pikkarainen, T.; Mehtonen, S.; Porter, D. Effect of impurity level and inclusions on the ductility and toughness of an ultra-high-strength steel. Mater. Sci. Eng. A 2017, 697, 184–193. [Google Scholar] [CrossRef]
  27. Senoz, C.; Evers, S.; Stratmann, M.; Rohwerder, M. Scanning Kelvin Probe as a highly sensitive tool for detecting hydrogen permeation with high local resolution. Electrochem. Commun. 2011, 13, 1542–1545. [Google Scholar] [CrossRef]
  28. Wang, G.; Yan, Y.; Yang, X.N.; Li, J.X.; Qiao, L.J. Investigation of hydrogen evolution and enrichment by scanning Kelvin probe force microscopy. Electrochem. Commun. 2013, 35, 100–103. [Google Scholar] [CrossRef]
  29. Kim, W.K.; Koh, S.U.; Yang, B.Y.; Kim, K.Y. Effect of environmental and metallurgical factors on hydrogen induced cracking of HSLA steels. Corros. Sci. 2008, 50, 3336–3342. [Google Scholar] [CrossRef]
  30. Qin, W.; Szpunar, J.A. A general model for hydrogen trapping at the inclusion-matrix interface and its relation to crack initiation. Philos. Mag. 2017, 97, 3296–3316. [Google Scholar] [CrossRef]
  31. Jin, T.Y.; Liu, Z.Y.; Cheng, Y.F. Effect of non-metallic inclusions on hydrogen-induced cracking of API5L X100 steel. Int. J. Hydrogen Energy 2010, 35, 8014–8021. [Google Scholar] [CrossRef]
  32. Oriani, R.A.; Hirth, J.P.; Smialowski, M. Hydrogen Degradation of Ferrous Alloys; Knovel Academic Civil Engineering & Construction Materials; Knovel Academic Metals & Metallurgy; Knovel Academic Oil & Gas Engineering; Noyes Publications: Park Ridge, NJ, USA, 1985; p. 886. [Google Scholar]
  33. Otsuka, T.; Tanabe, T. Hydrogen diffusion and trapping process around MnS precipitates in alpha Fe examined by tritium autoradiography. J. Alloy Compd. 2007, 446, 655–659. [Google Scholar] [CrossRef]
  34. Hanada, H.; Otsuka, T.; Nakashima, H.; Sasaki, S.; Hayakawa, M.; Sugisaki, M. Profiling of hydrogen accumulation in a tempered martensite microstructure by means of tritium autoradiography. Scr. Mater. 2005, 53, 1279–1284. [Google Scholar] [CrossRef]
  35. Liu, Q.L.; Zhou, Q.J.; Venezuela, J.; Zhang, M.X.; Atrens, A. Hydrogen influence on some advanced high-strength steels. Corros. Sci. 2017, 125, 114–138. [Google Scholar] [CrossRef]
  36. Liu, Q.; Irwanto, B.; Atrens, A. Influence of hydrogen on the mechanical properties of some medium-strength Ni-Cr-Mo steels. Mater. Sci. Eng. A 2014, 617, 200–210. [Google Scholar] [CrossRef]
  37. Gupta, A.; Goyal, S.; Padmanabhan, K.A.; Singh, A.K. Inclusions in steel: Micro-macro modelling approach to analyse the effects of inclusions on the properties of steel. Int. J. Adv. Manuf. Technol. 2015, 77, 565–572. [Google Scholar] [CrossRef]
  38. Laureys, A.; Depover, T.; Petrov, R.; Verbeken, K. Microstructural characterization of hydrogen induced cracking in TRIP-assisted steel by EBSD. Mater. Charact. 2016, 112, 169–179. [Google Scholar] [CrossRef]
  39. Kim, Y.S.; Kim, S.S.; Choe, B.H. The Role of Hydrogen in Hydrogen Embrittlement of Metals: The Case of Stainless Steel. Metals 2019, 9, 406. [Google Scholar] [CrossRef]
  40. Bruck, S.; Schippl, V.; Schwarz, M.; Christ, H.J.; Fritzen, C.P.; Weihe, S. Hydrogen Embrittlement Mechanism in Fatigue Behavior of Austenitic and Martensitic Stainless Steels. Metals 2018, 8, 339. [Google Scholar] [CrossRef]
  41. Wang, L.W.; Xin, J.C.; Cheng, L.J.; Zhao, K.; Sun, B.Z.; Li, J.R.; Wang, X.; Cui, Z.Y. Influence of inclusions on initiation of pitting corrosion and stress corrosion cracking of X70 steel in near-neutral pH environment. Corros. Sci. 2019, 147, 108–127. [Google Scholar] [CrossRef]
  42. Zhu, L.K.; Qiao, L.J.; Li, X.Y.; Xu, B.Z.; Pan, W.; Wang, L.; Volinsky, A.A. Analysis of the tube-sheet cracking in slurry oil steam generators. Eng. Fail. Anal. 2013, 34, 379–386. [Google Scholar] [CrossRef]
  43. Zhu, L.K.K.; Yan, Y.; Qiao, L.J.J.; Volinsky, A.A. Stainless steel pitting and early-stage stress corrosion cracking under ultra-low elastic load. Corros. Sci. 2013, 77, 360–368. [Google Scholar] [CrossRef]
  44. Zhu, L.K.; Yan, Y.; Li, J.X.; Qiao, L.J.; Li, Z.C.; Volinsky, A.A. Stress corrosion cracking at low loads: Surface slip and crystallographic analysis. Corros. Sci. 2015, 100, 619–626. [Google Scholar] [CrossRef] [Green Version]
  45. Zhu, L.K.K.; Yan, Y.; Li, J.X.X.; Qiao, L.J.J.; Volinsky, A.A. Stress corrosion cracking under low stress: Continuous or discontinuous cracks? Corros. Sci. 2014, 80, 350–358. [Google Scholar] [CrossRef]
  46. Abbassi, F.; Mistou, S.; Zghal, A. Failure analysis based on microvoid growth for sheet metal during uniaxial and biaxial tensile tests. Mater. Des. 2013, 49, 638–646. [Google Scholar] [CrossRef] [Green Version]
  47. Bao, Y.B. Dependence of ductile crack formation in tensile tests on stress triaxiality, stress and strain ratios. Eng. Fract. Mech. 2005, 72, 505–522. [Google Scholar] [CrossRef]
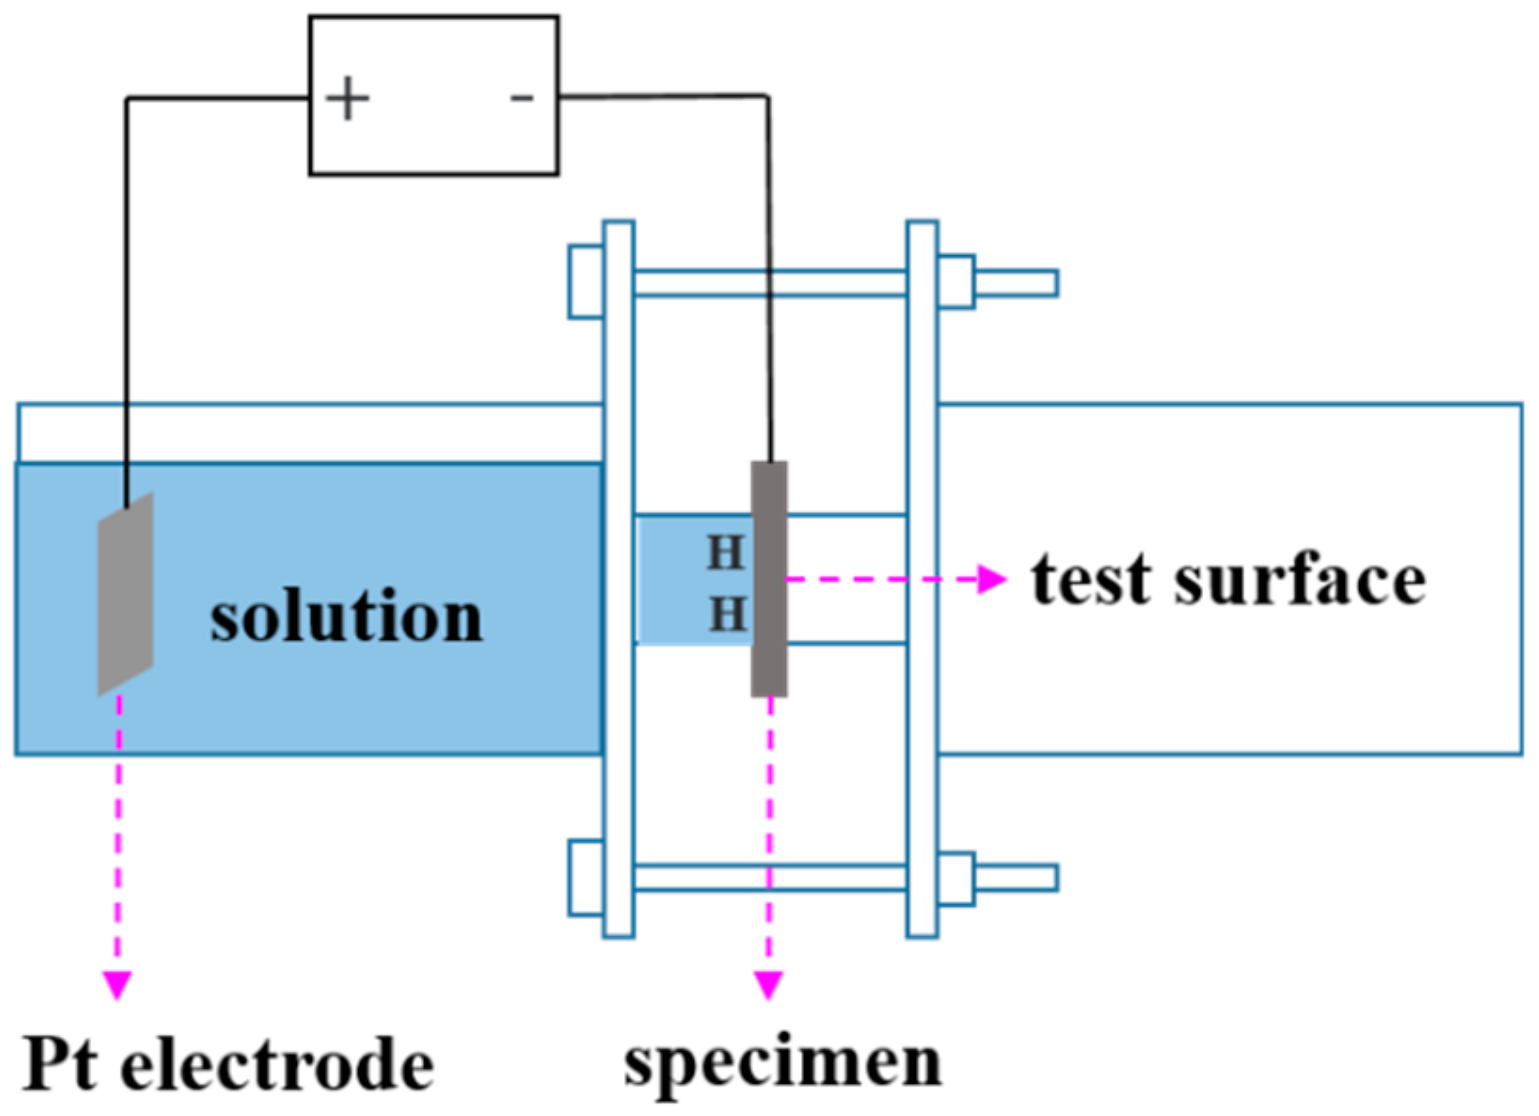
Figure 1. Diagram of single-sided electrolytic hydrogen device in Scanning Kelvin Probe Force Microscope (SKPFM).
Metals 09 00798 g001
Figure 2. Microstructure of the hot-stamped steel: (a) optical microscopy (OM) image and (b) scanning electron microscopy (SEM) micrograph. A represents the residual austenite, M represents the lath martensite.
Metals 09 00798 g002
Figure 3. Scanning electron microscopy (SEM) morphology of inclusions in experimental materials: (ac) small-sized inclusions; and, (df) abnormally large-sized inclusions.
Metals 09 00798 g003
Figure 4. Statistical diagram of type and size distribution of inclusions (Dmax ≥ 1μm).
Metals 09 00798 g004
Figure 5. The evolution of hydrogen content with respect to (a) charging time and (b) immersion time.
Metals 09 00798 g005
Figure 6. (a) The nominal stress-nominal strain curves with varying hydrogen pre-charge times, performed at two strain rates (solid curves represent a strain rate of 1 × 10⁻³ s−1; the dotted curve represents a strain rate of 1 × 10⁻⁶ s−1); and, (b) Ultimate tensile strength σb, yield strength σs, and elongation δ of the steel with different hydrogen content at a strain rate of 1 × 10⁻³ s−1.
Metals 09 00798 g006
Figure 7. (a) The nominal stress–nominal strain curves of in-situ continuous soaking SSRT at varying strain rates (1 × 10⁻⁴–1 × 10⁻⁶ s−1); (b) Ultimate tensile strength σb, yield strength σs, and elongation δ of the steel at different strain rates; and, (c) Fracture time at different strain rates.
Metals 09 00798 g007
Figure 8. SEM images of the uncharged specimens: (a) overview of fracture surface, and (b) dimple morphology.
Metals 09 00798 g008
Figure 9. SEM images of fracture surface of specimens with 1 h pre-charging time and strain rate 1 × 10⁻³ s−1. (a) Entire image of the fracture surface; Magnified images of the parts surrounded by red dotted lines in (b) and (c), and further magnified, in (d), (e), and (f), from (b). The yellow solid lines indicate the boundaries between the brittle fractured region (BF) and the ductile fractured region (DF). The white dotted line in (d) indicates the hole left by the shedding of inclusions, (g) Magnified images of the part surrounded by red dotted line in (d). (h) Energy spectrum analysis (EDS) analysis result of inclusions at the bottom of the hole shown in (g).
Metals 09 00798 g009
Figure 10. SEM images of fracture surface of specimens with 24 h pre-charging and a strain rate of 1 × 10⁻³ s−1. (a) Entire image of the fracture surface. Magnified images of the parts surrounded by the red dotted lines in (b); in (c), (d), and (e) from (b); in (f) and (i) from (c); in (g) from (d); and, in (h) from (e). The yellow solid line indicates the boundary between the brittle fractured region (BF) and the ductile fractured region (DF). The white dotted line in (f), (g), and (h) indicates the inclusions that induced fractures.
Metals 09 00798 g010
Figure 11. SEM images of fracture surface of specimens with 24 h pre-charging and a strain rate of 1 × 10⁻⁶ s−1. The yellow solid lines indicate the boundaries between the brittle fractured region (BF) and the ductile fractured region (DF). The white dashed arrows in (b1) indicate the possible direction of hydrogen diffusion while the specimen was being stretched. The white dotted circle in (f1) marks the inclusion Ti(C, N). The numbers 1, 2, and 3 represent three parallel samples, respectively.
Metals 09 00798 g011
Figure 12. SEM images of fracture surface of specimens with in-situ immersed SSRT under varying strain rates: (a1c1) 1 × 10⁻⁴ s−1, (a2c2) 5 × 10⁻⁵ s−1, and (a3c3) 1 × 10⁻⁶ s−1. The yellow solid lines indicate the boundaries between the brittle fractured region (BF) and the ductile fractured region (DF). The yellow arrows indicate the fracture origin sites of the samples.
Metals 09 00798 g012
Figure 13. In-situ SKPFM. (a) and (b) SEM image and EDS mapping of the inclusions observed, potential images of uncharged (c) and 84 h charged (d) samples, and (e) potential curves of lines 1 and 2. A represents the inclusion, B represents the matrix adjacent to the inclusions, and C represents the matrix away from the inclusion.
Metals 09 00798 g013
Figure 14. Relationships between (a) the hydrogen-induced delay cracking (HIDC) sensitivity index and hydrogen content, (b) the brittle area fraction and hydrogen content, (c) the HIDC sensitivity index and strain rate, and (d) the brittle area fraction and the strain rate.
Metals 09 00798 g014
Figure 15. Schematic diagram of the fracture mechanism with different characteristics under a (a) high and (b) low strain rate of a pre-charged sample.
Metals 09 00798 g015
Table 1. Chemical composition of the material (wt%).
CSiMnSPAlTiCrNiNbB
0.390.211.230.00220.0140.0330.030.120.015<0.010.0026