Study on the Corrosion Fatigue Properties of 12Cr1MoV Steel at High Temperature in Different Salt Environments

Abstract
:1. Introduction
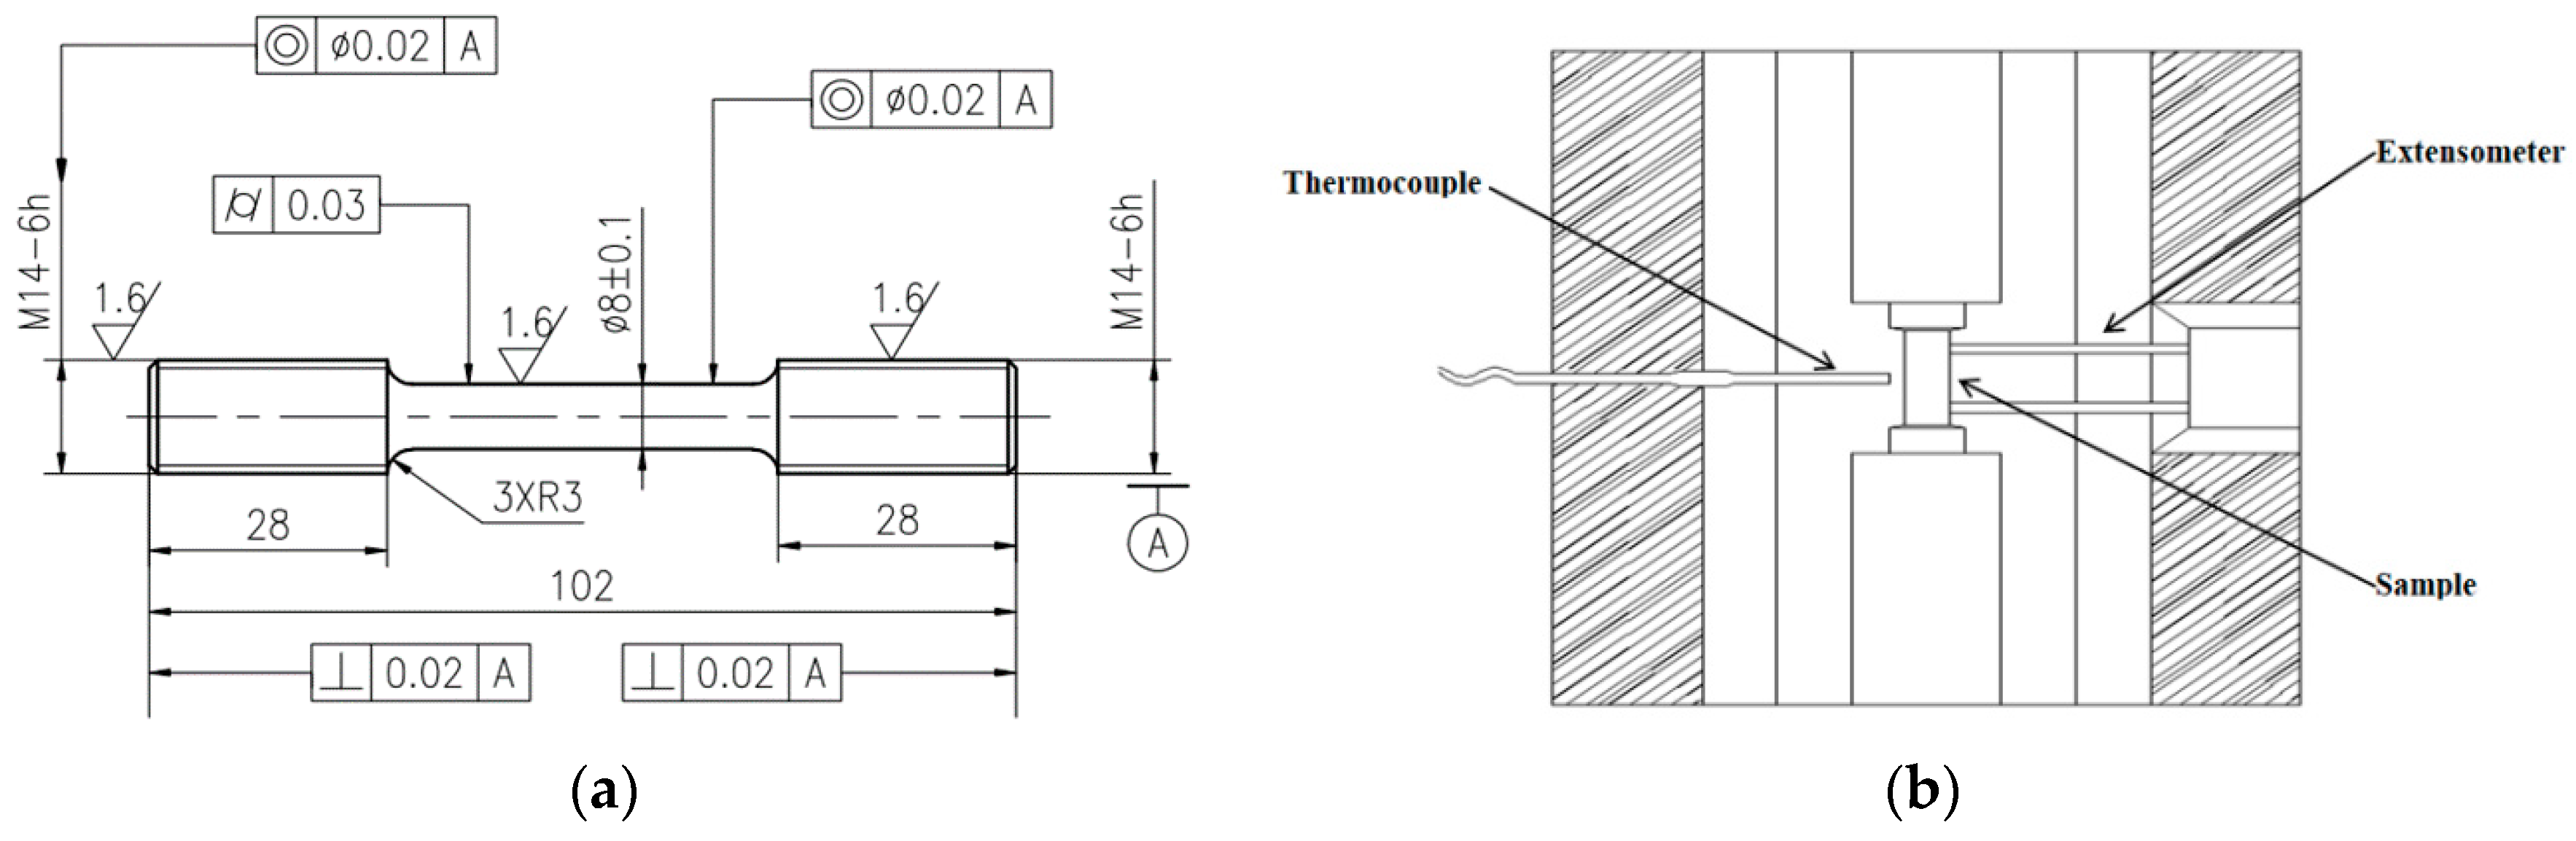
2. Materials and Methods
3. Results and Discussion
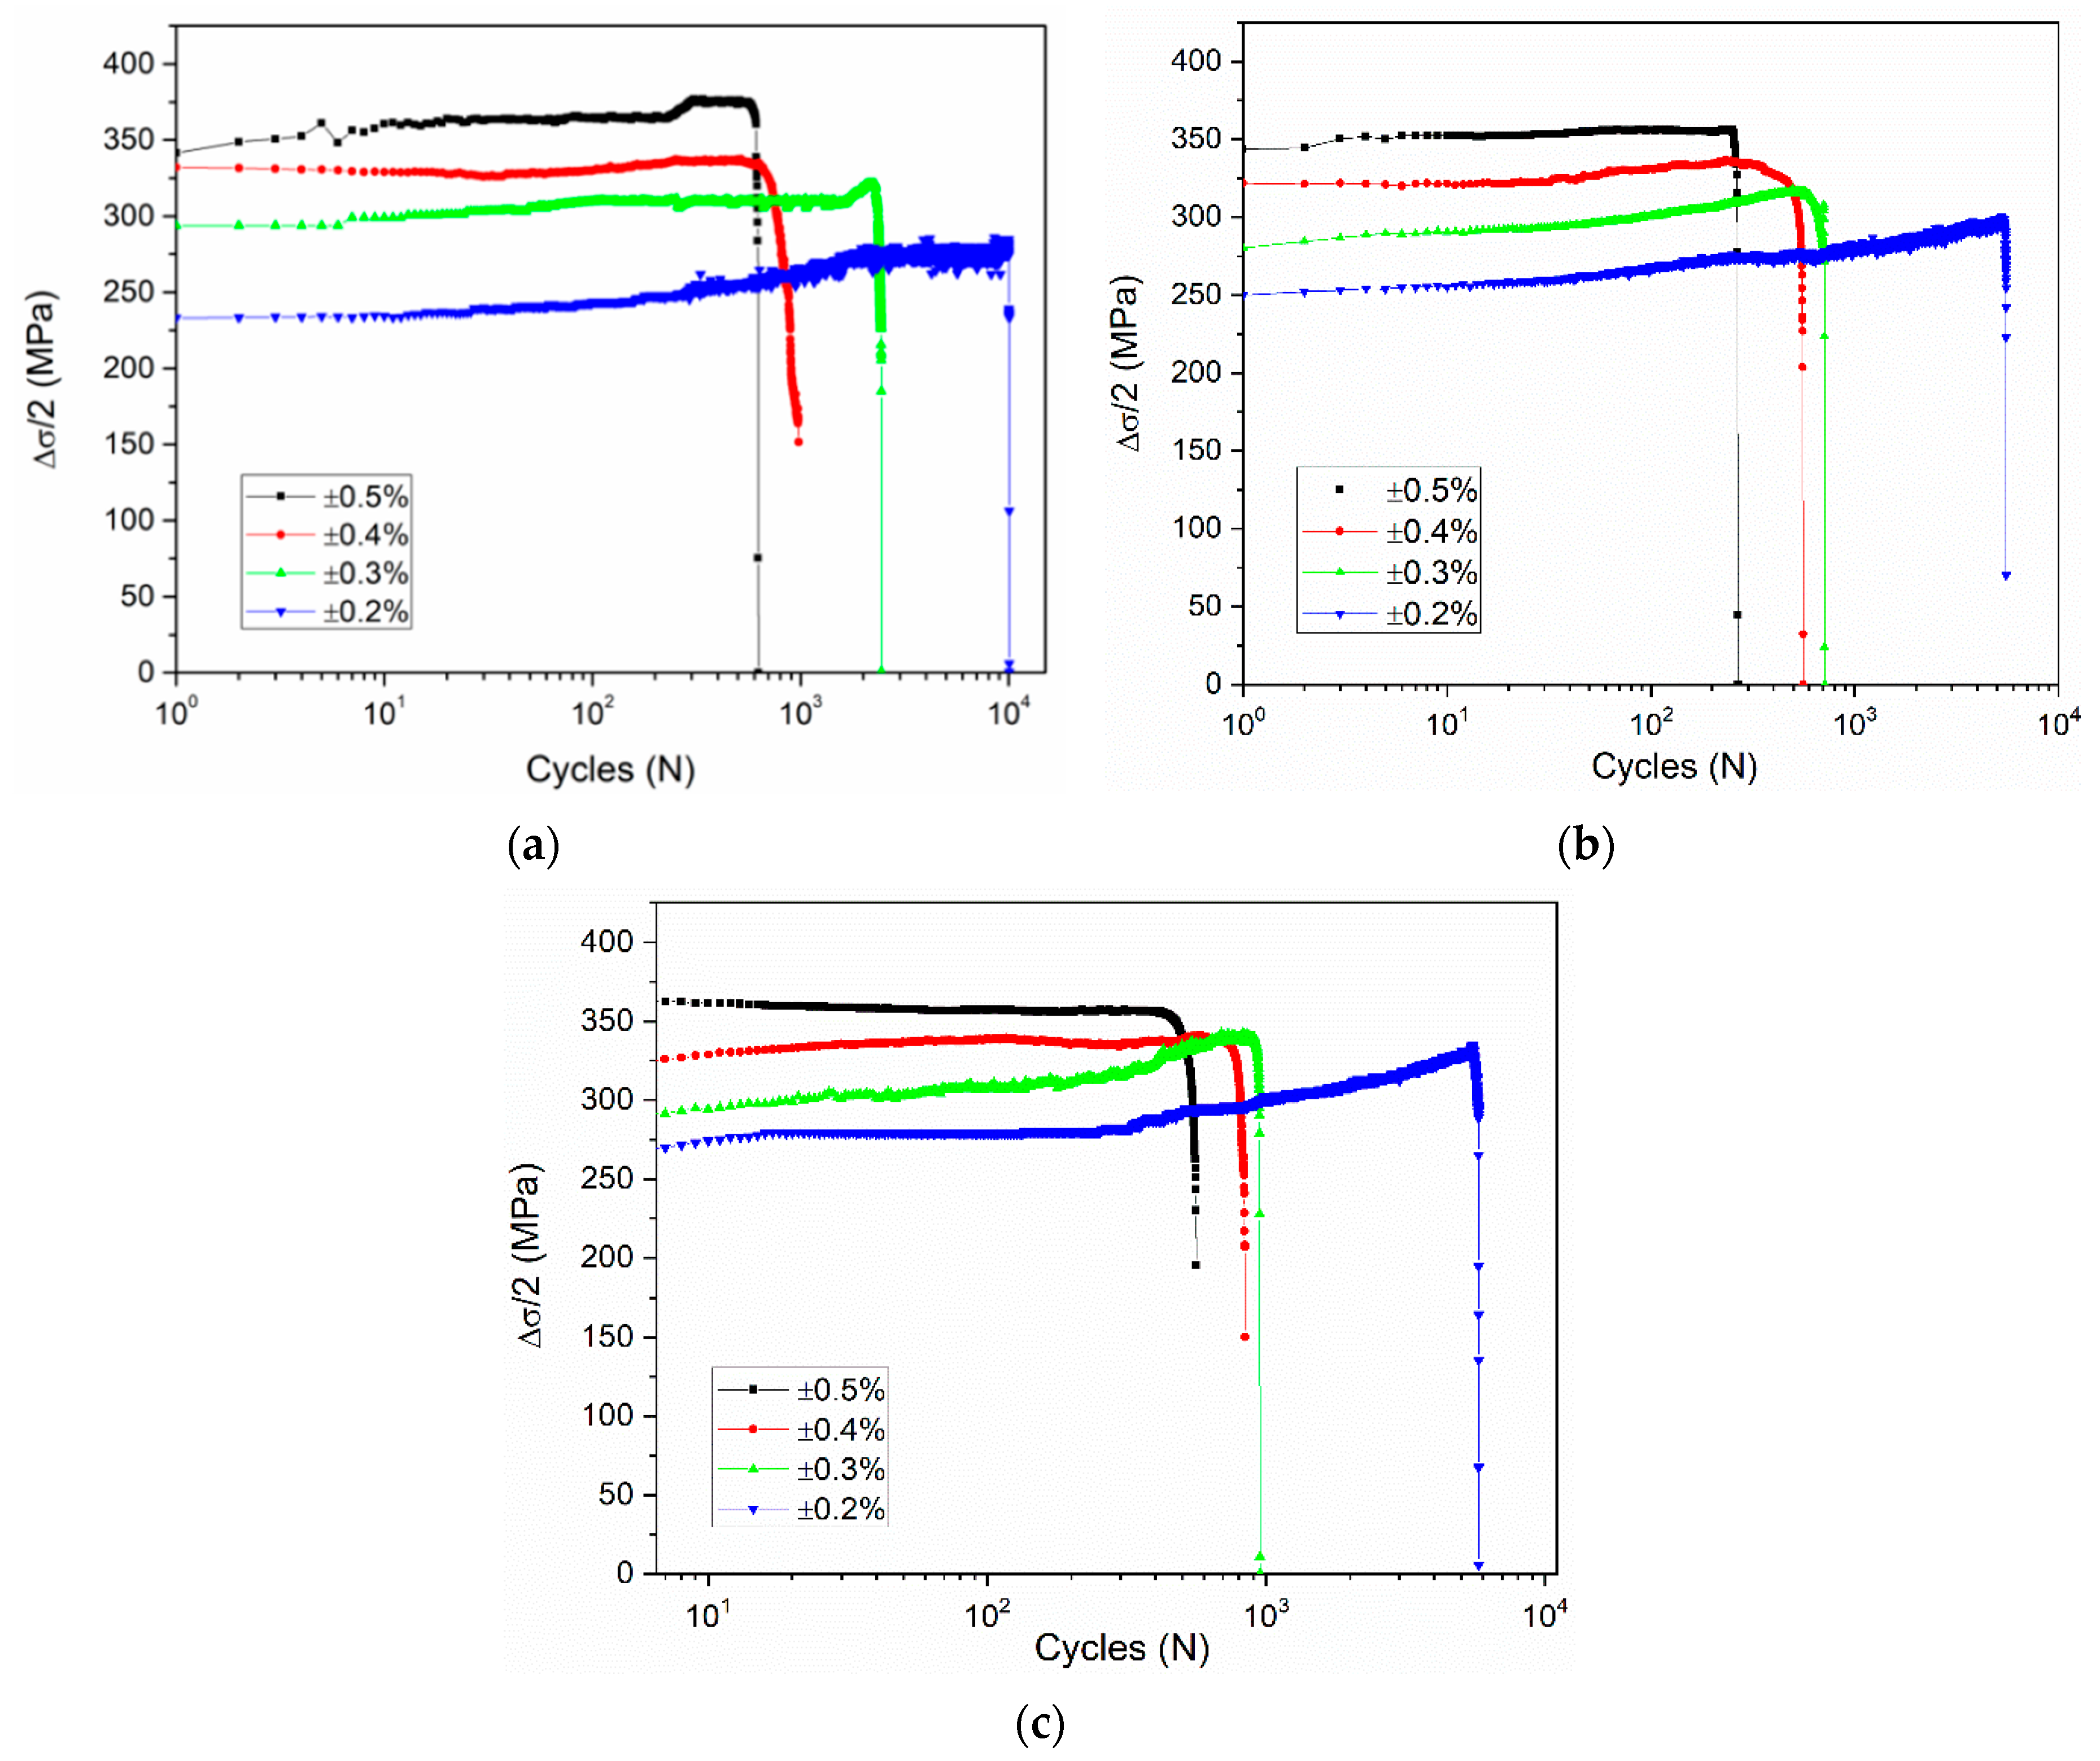
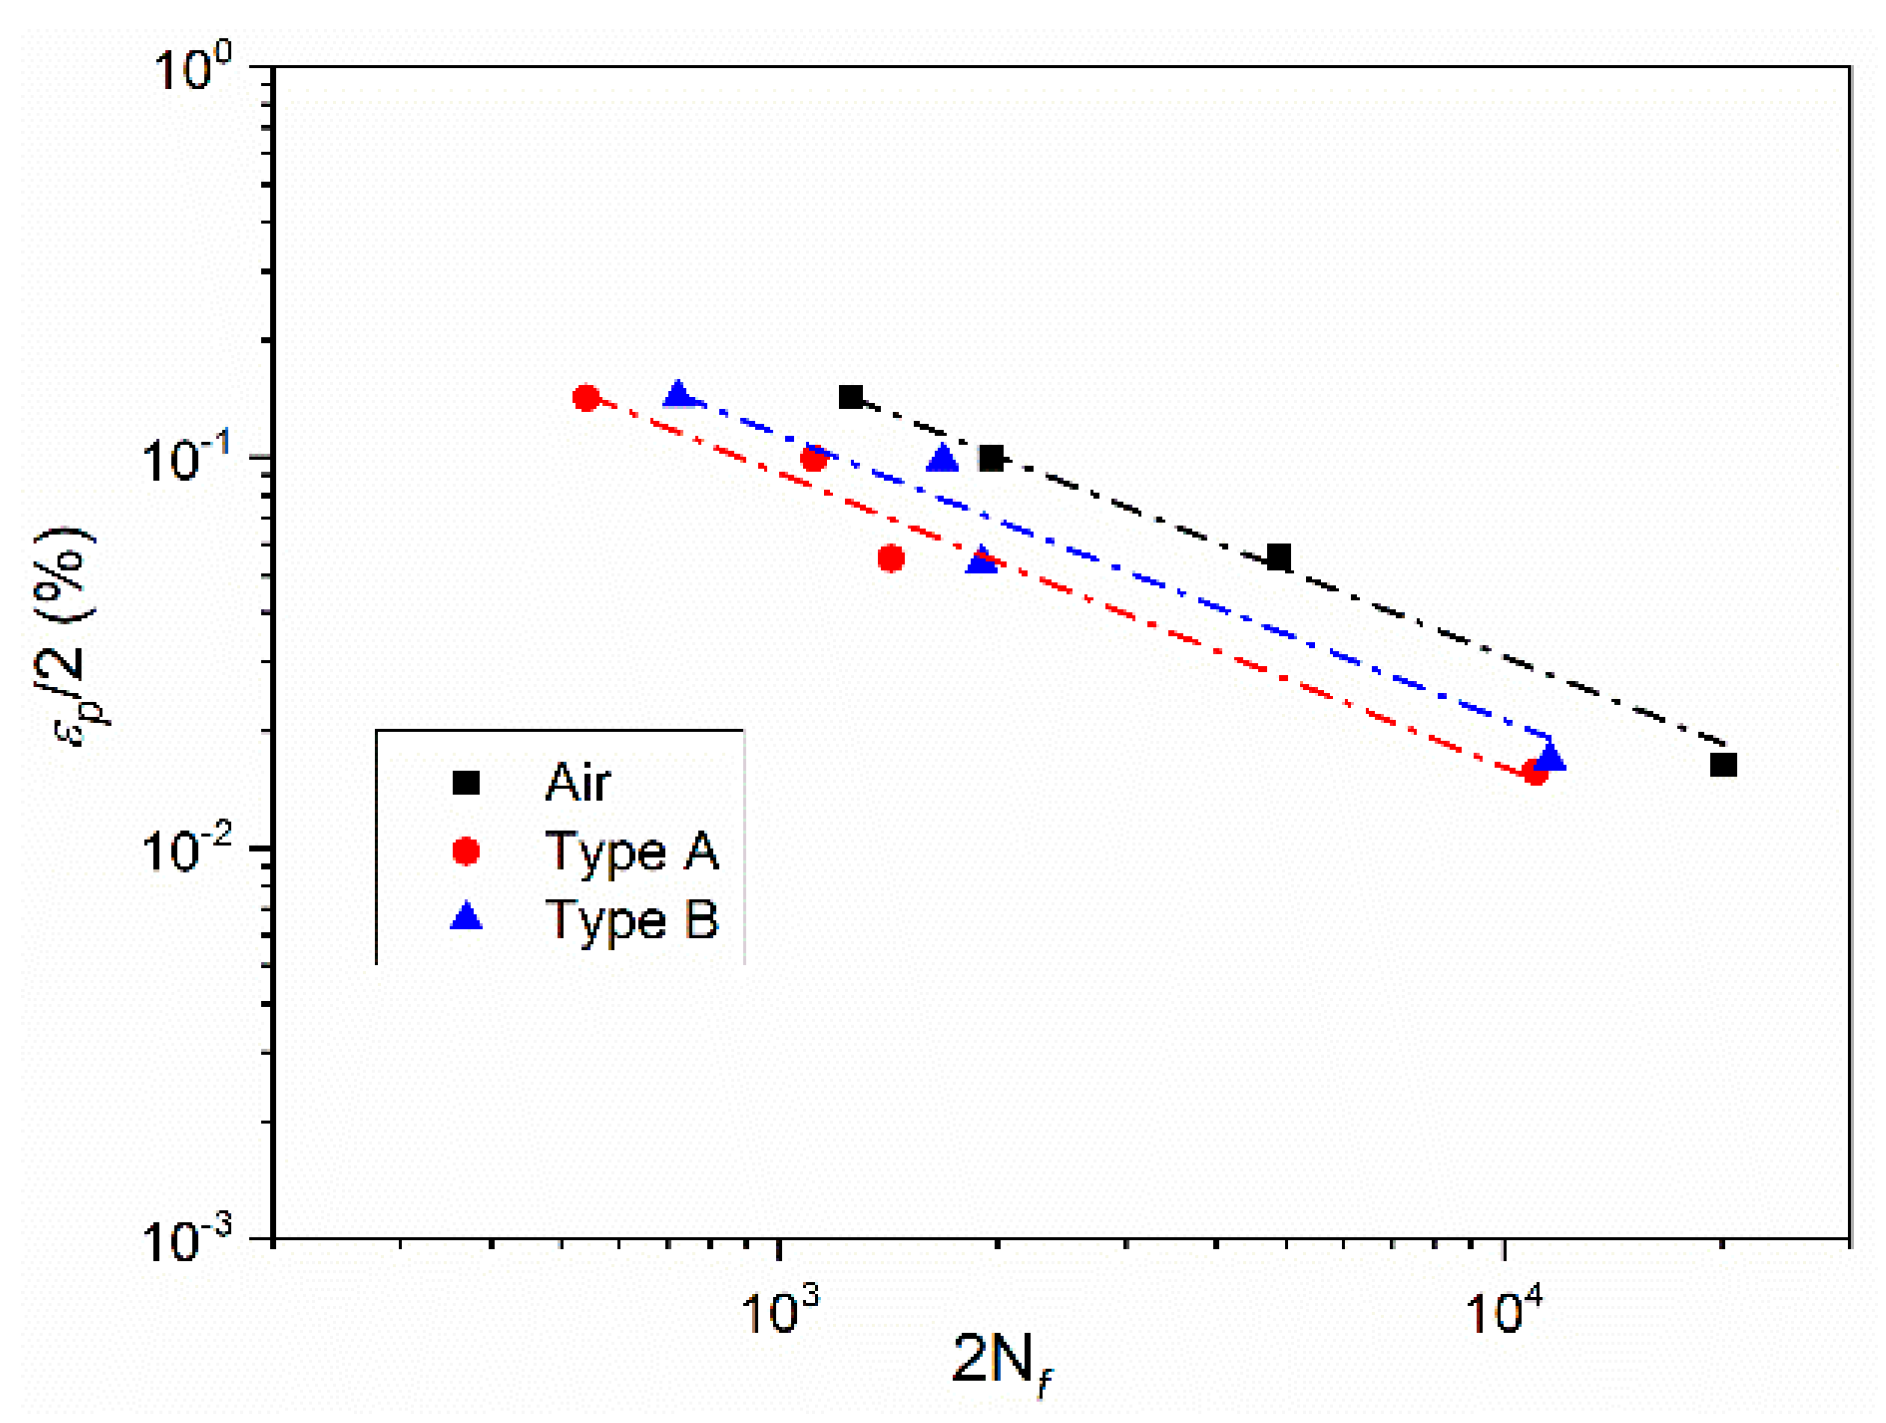
3.1. Effect of Total Strain Amplitudes
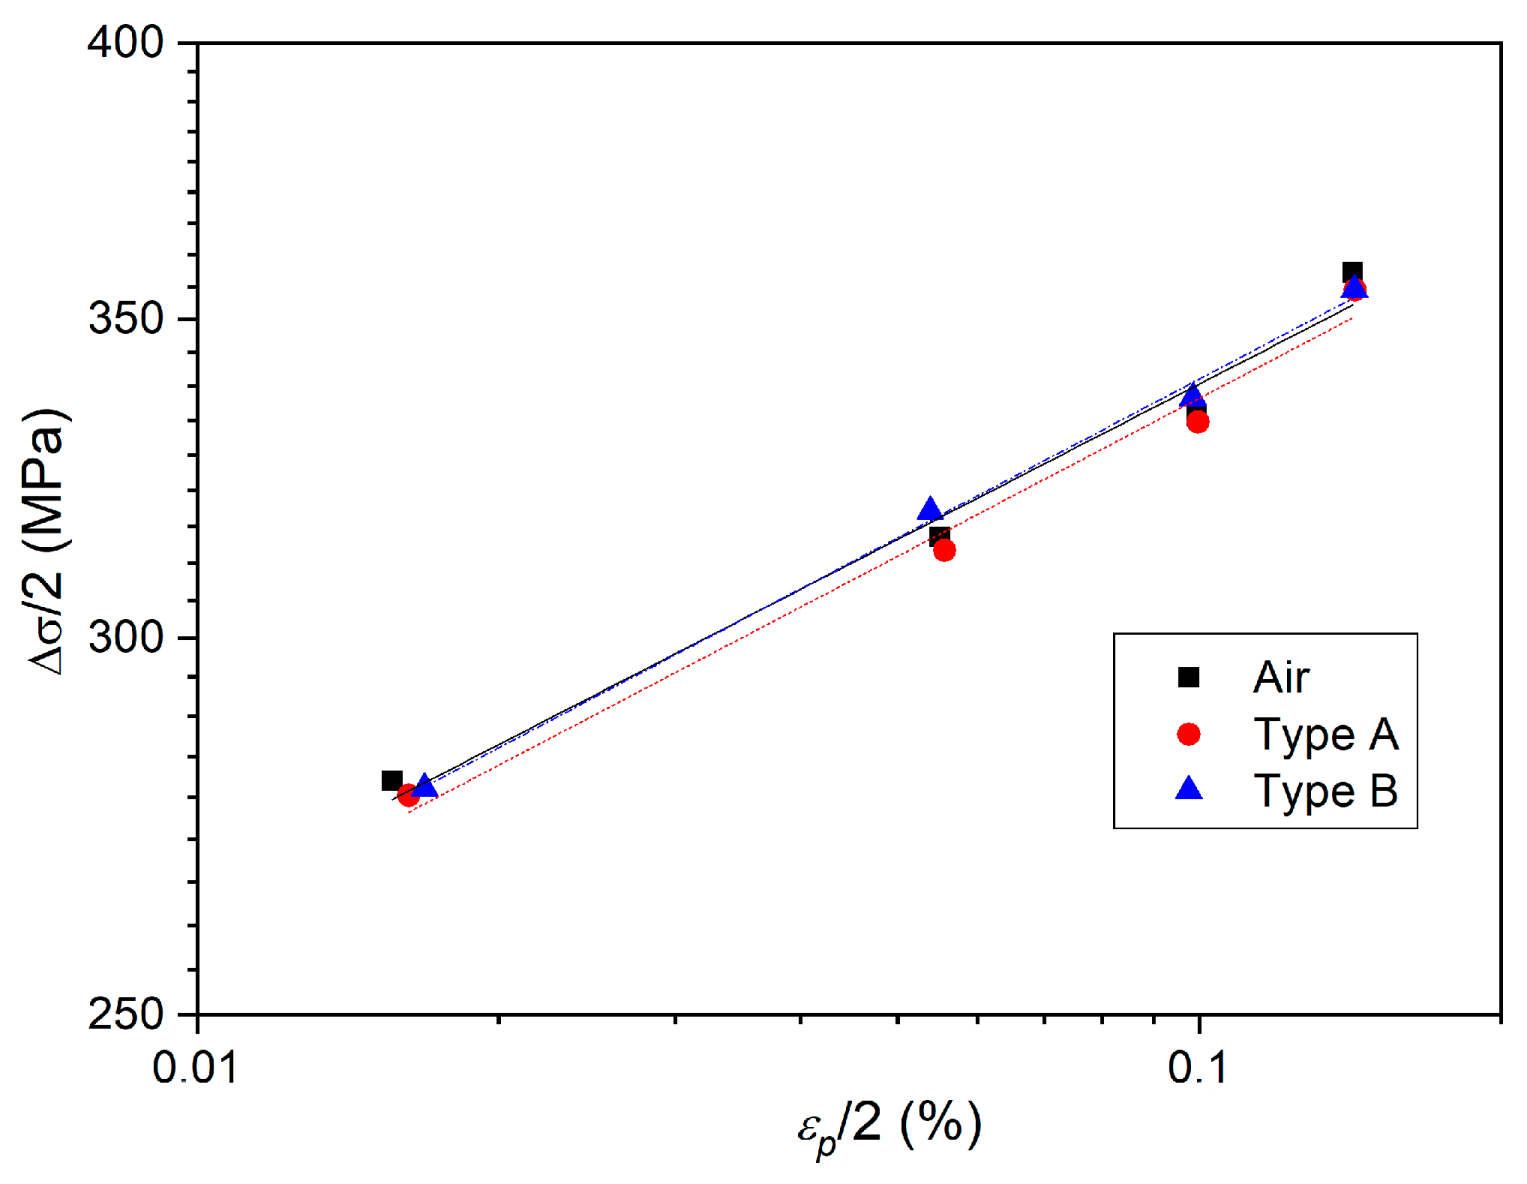
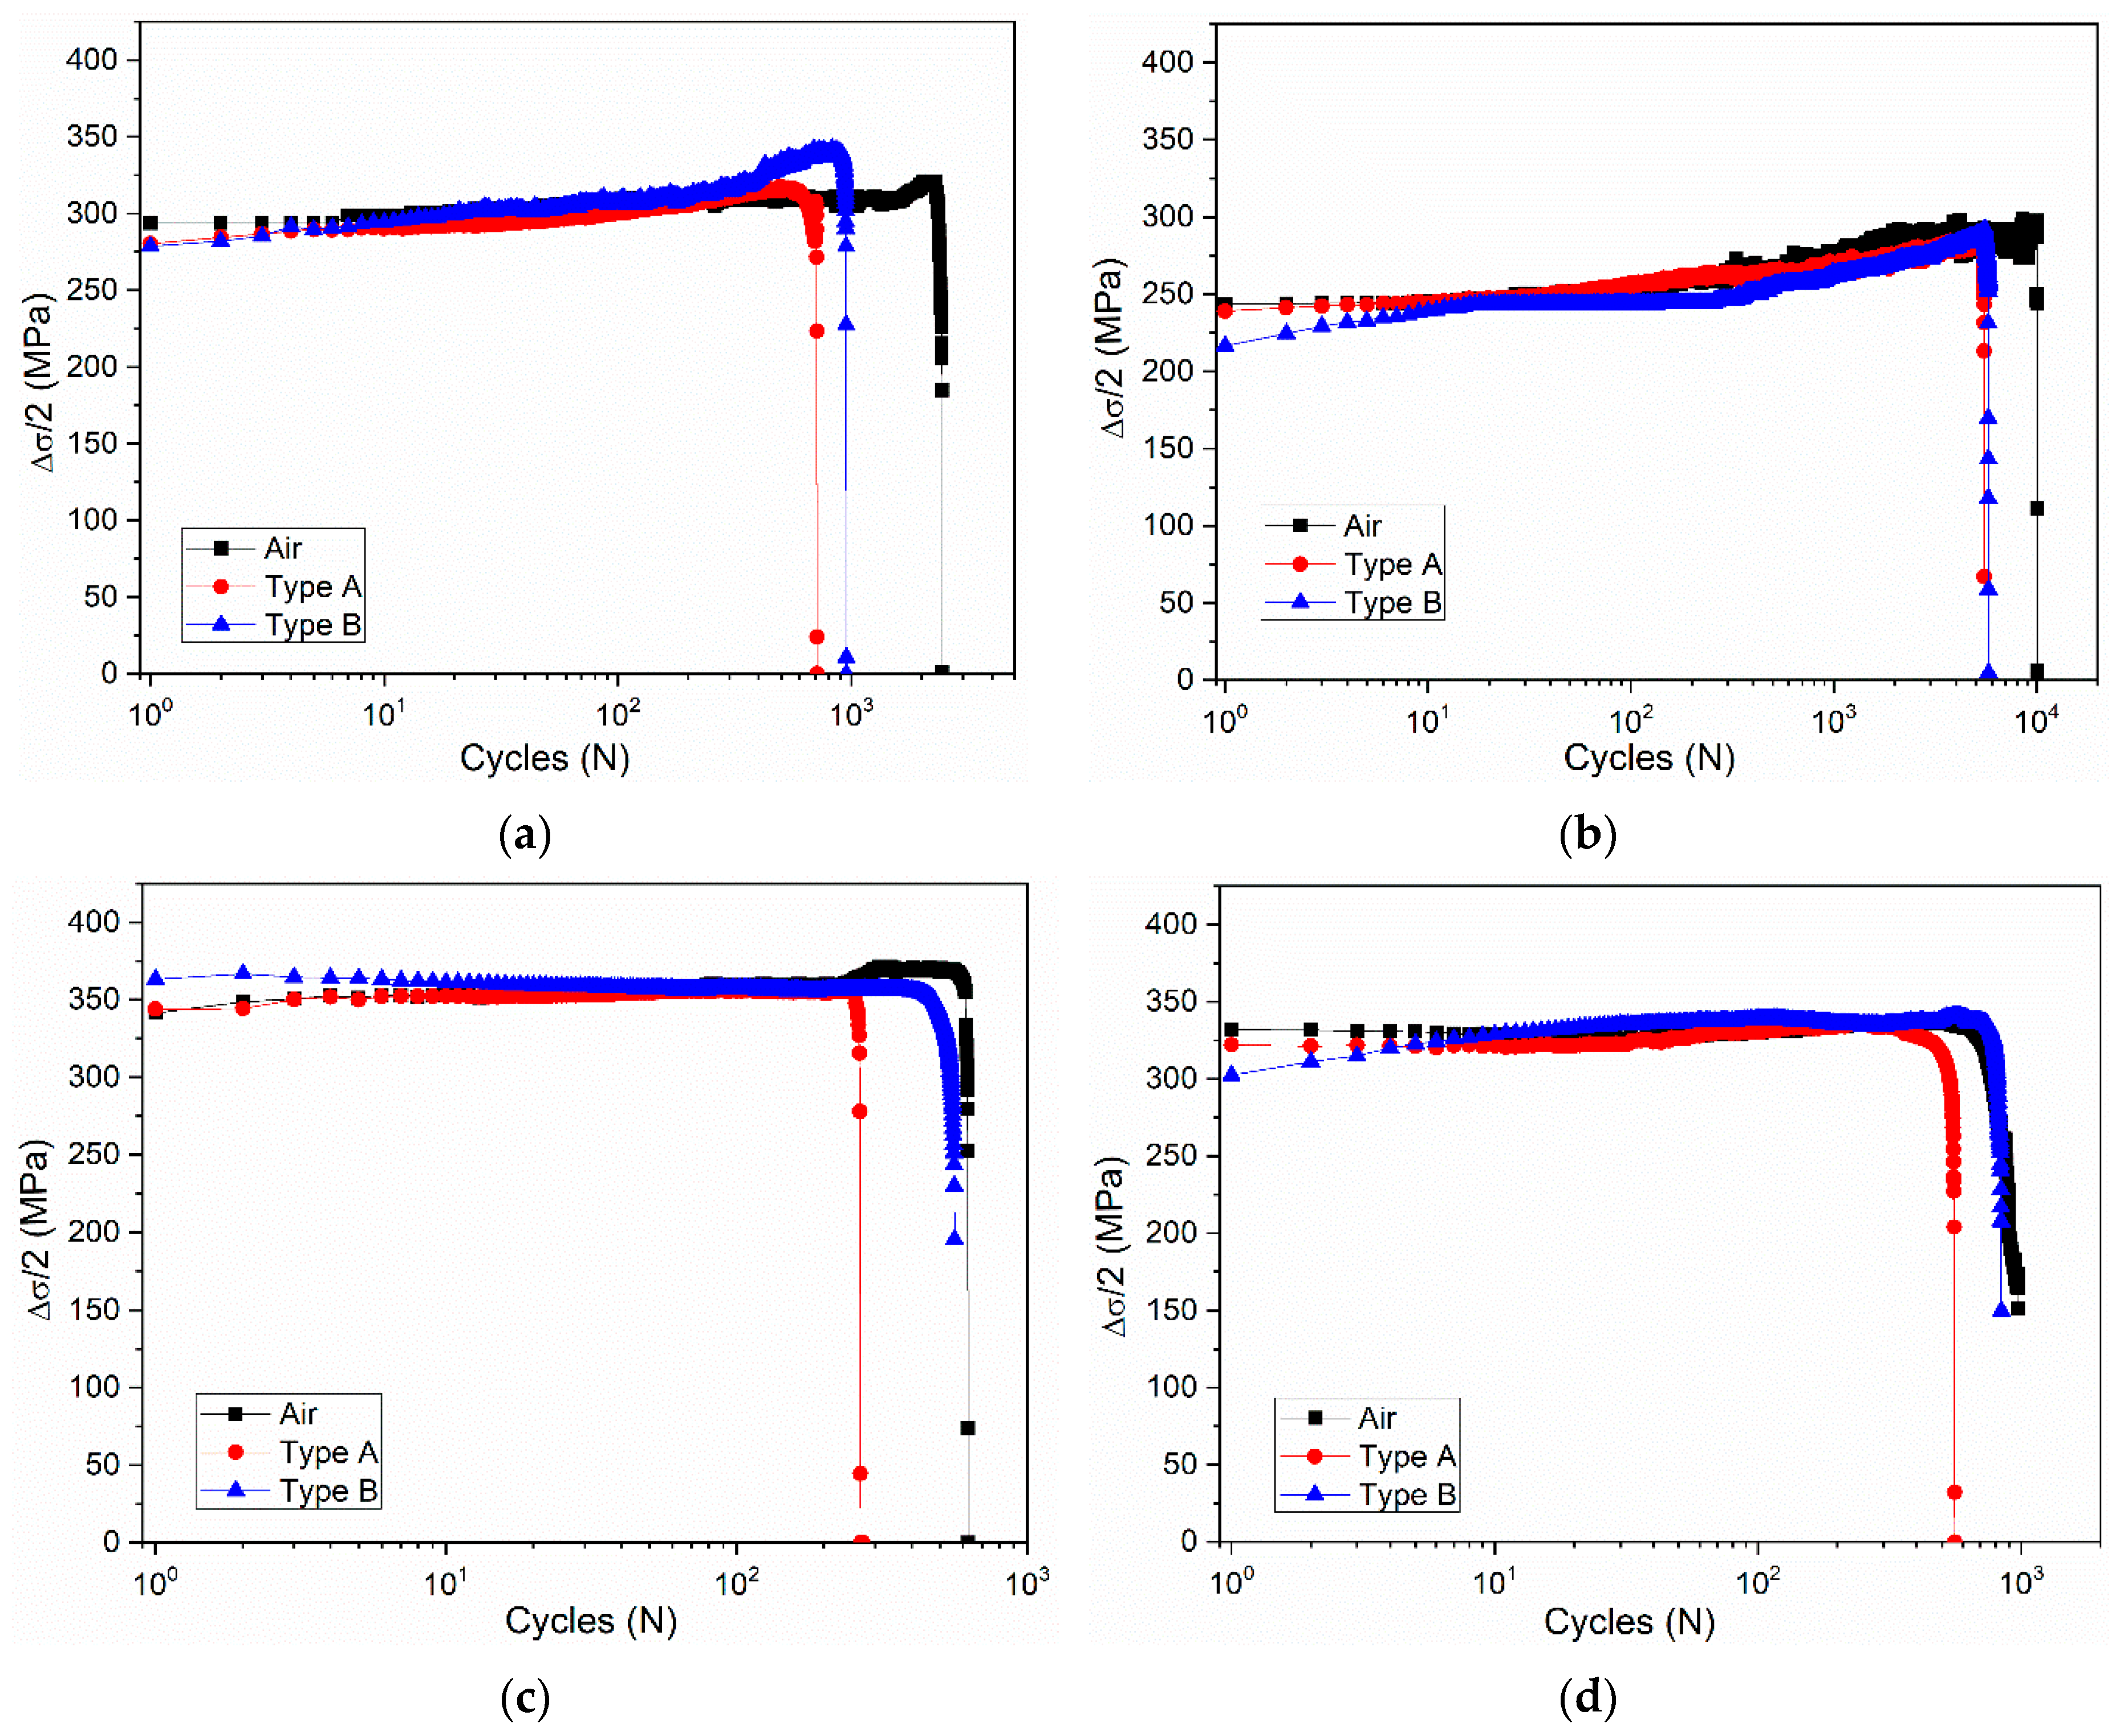
3.2. Effect of Deformation Environments
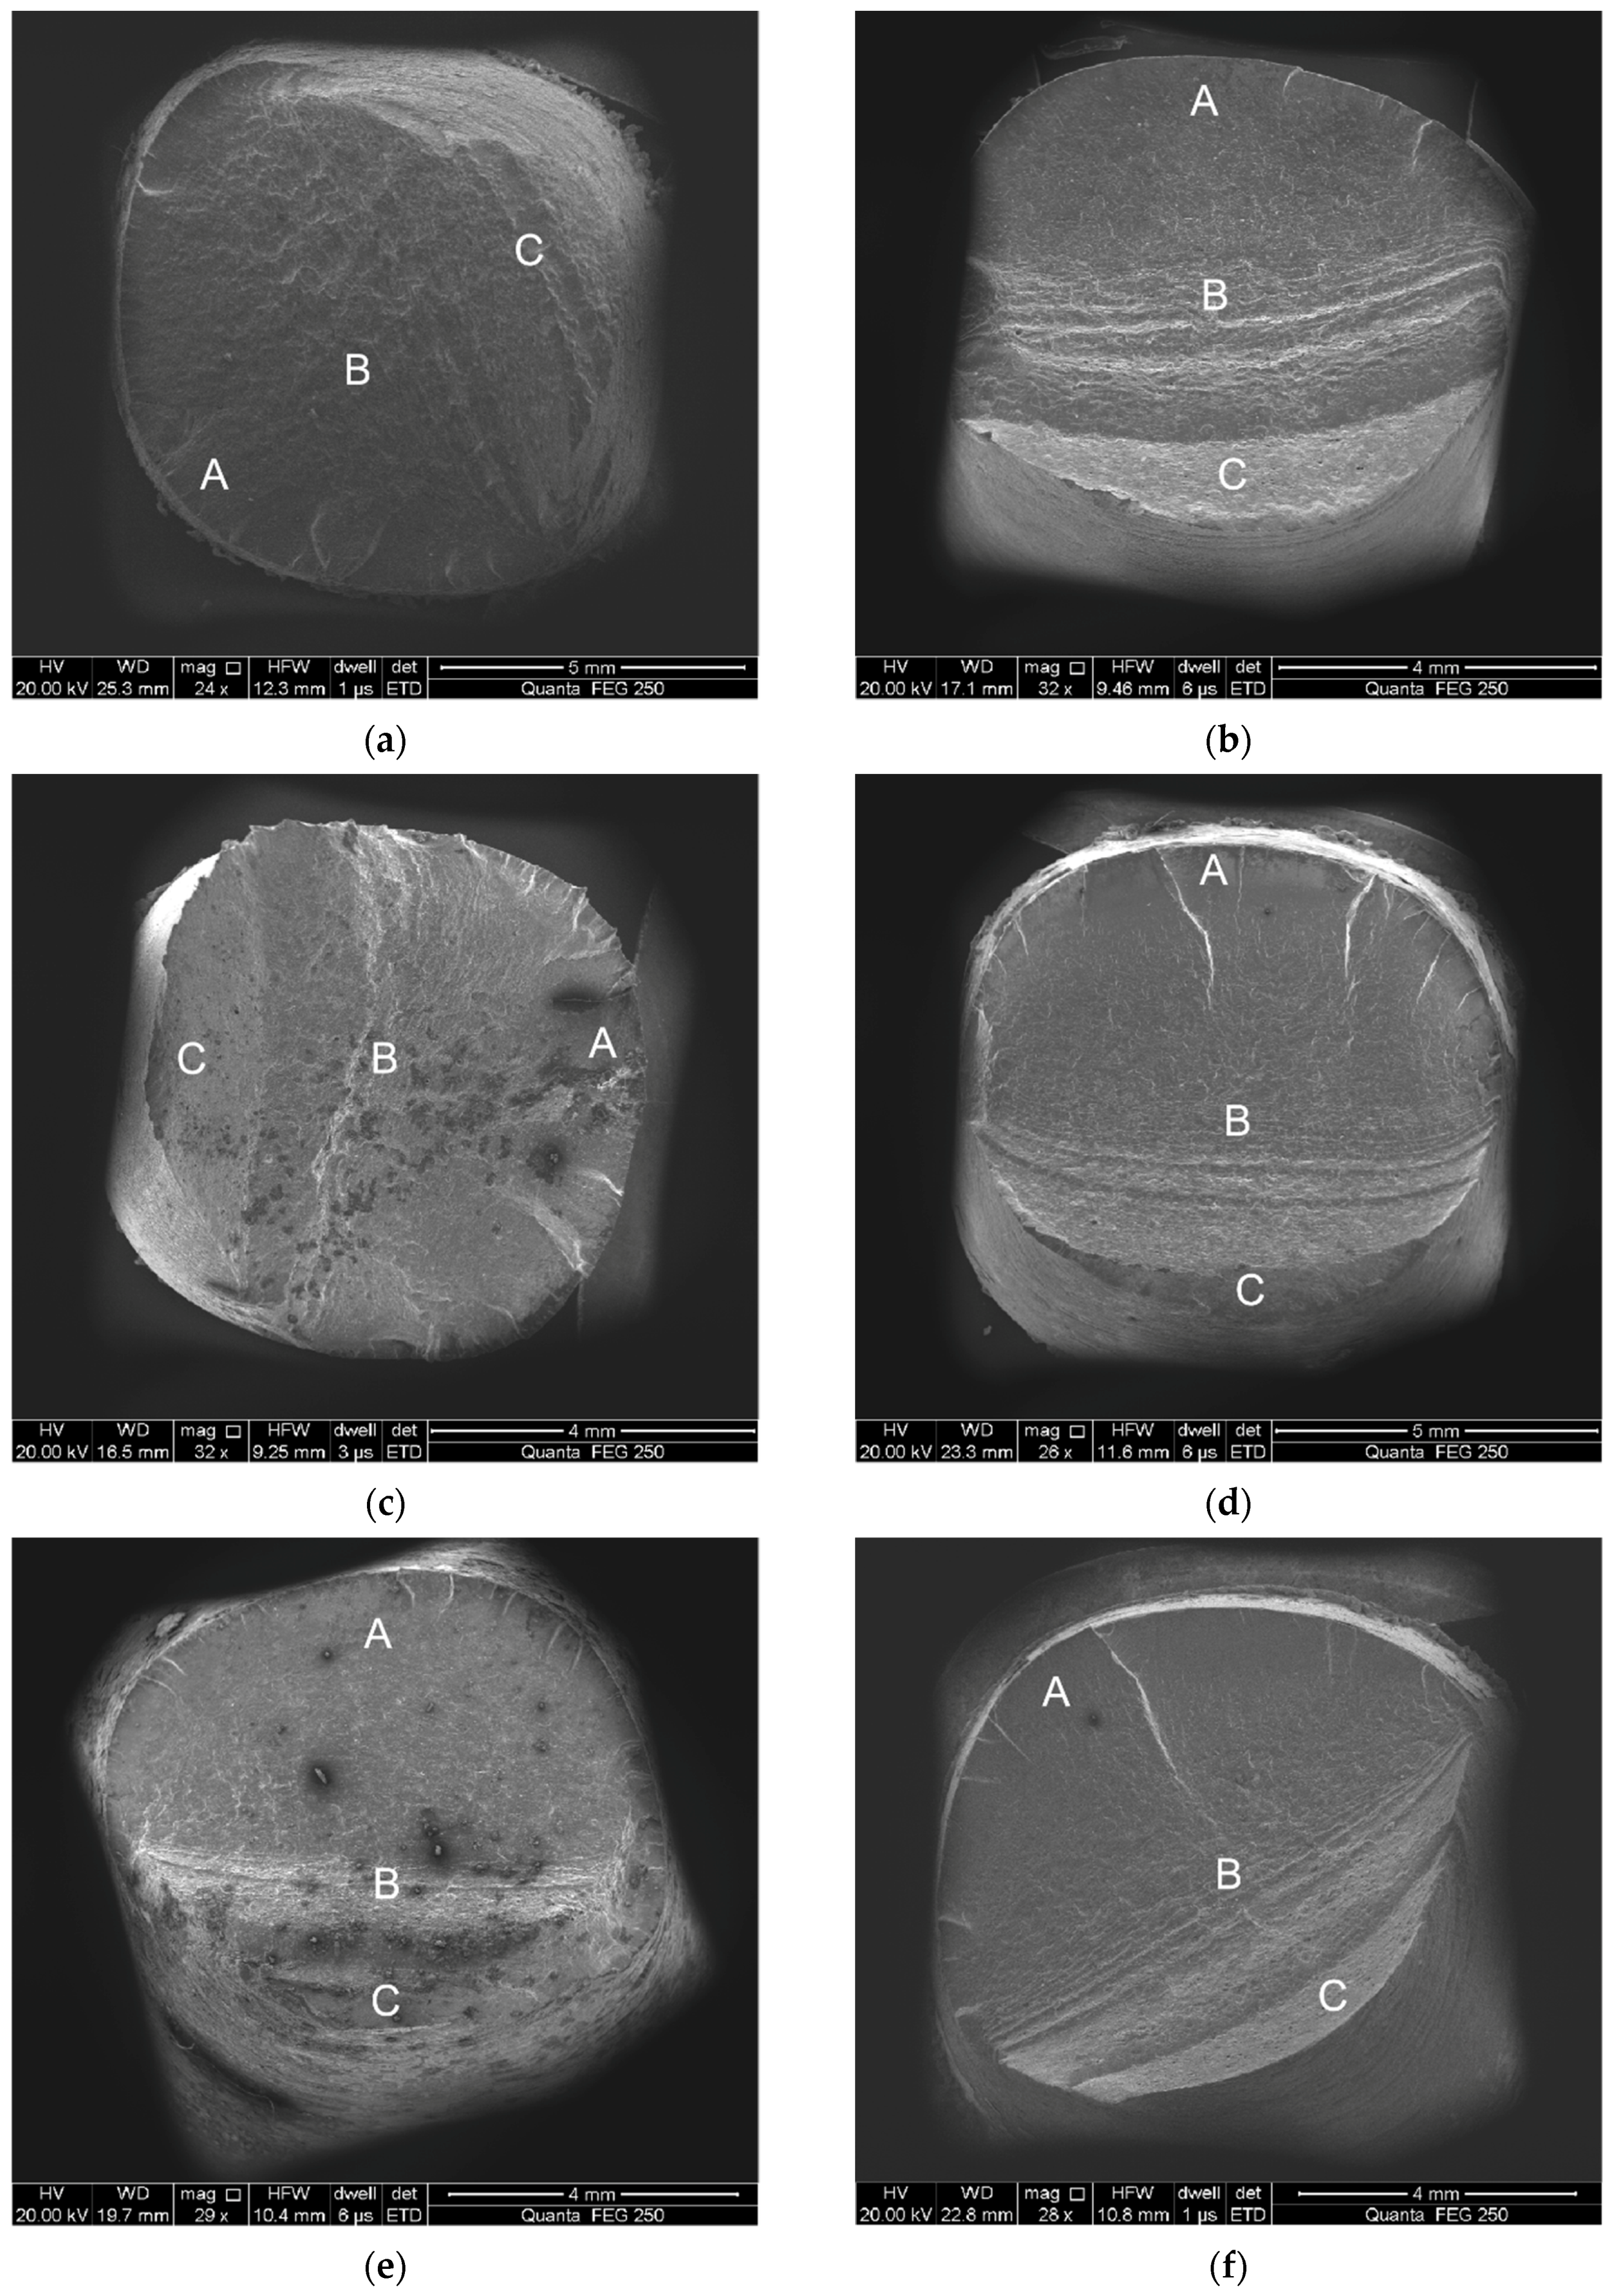
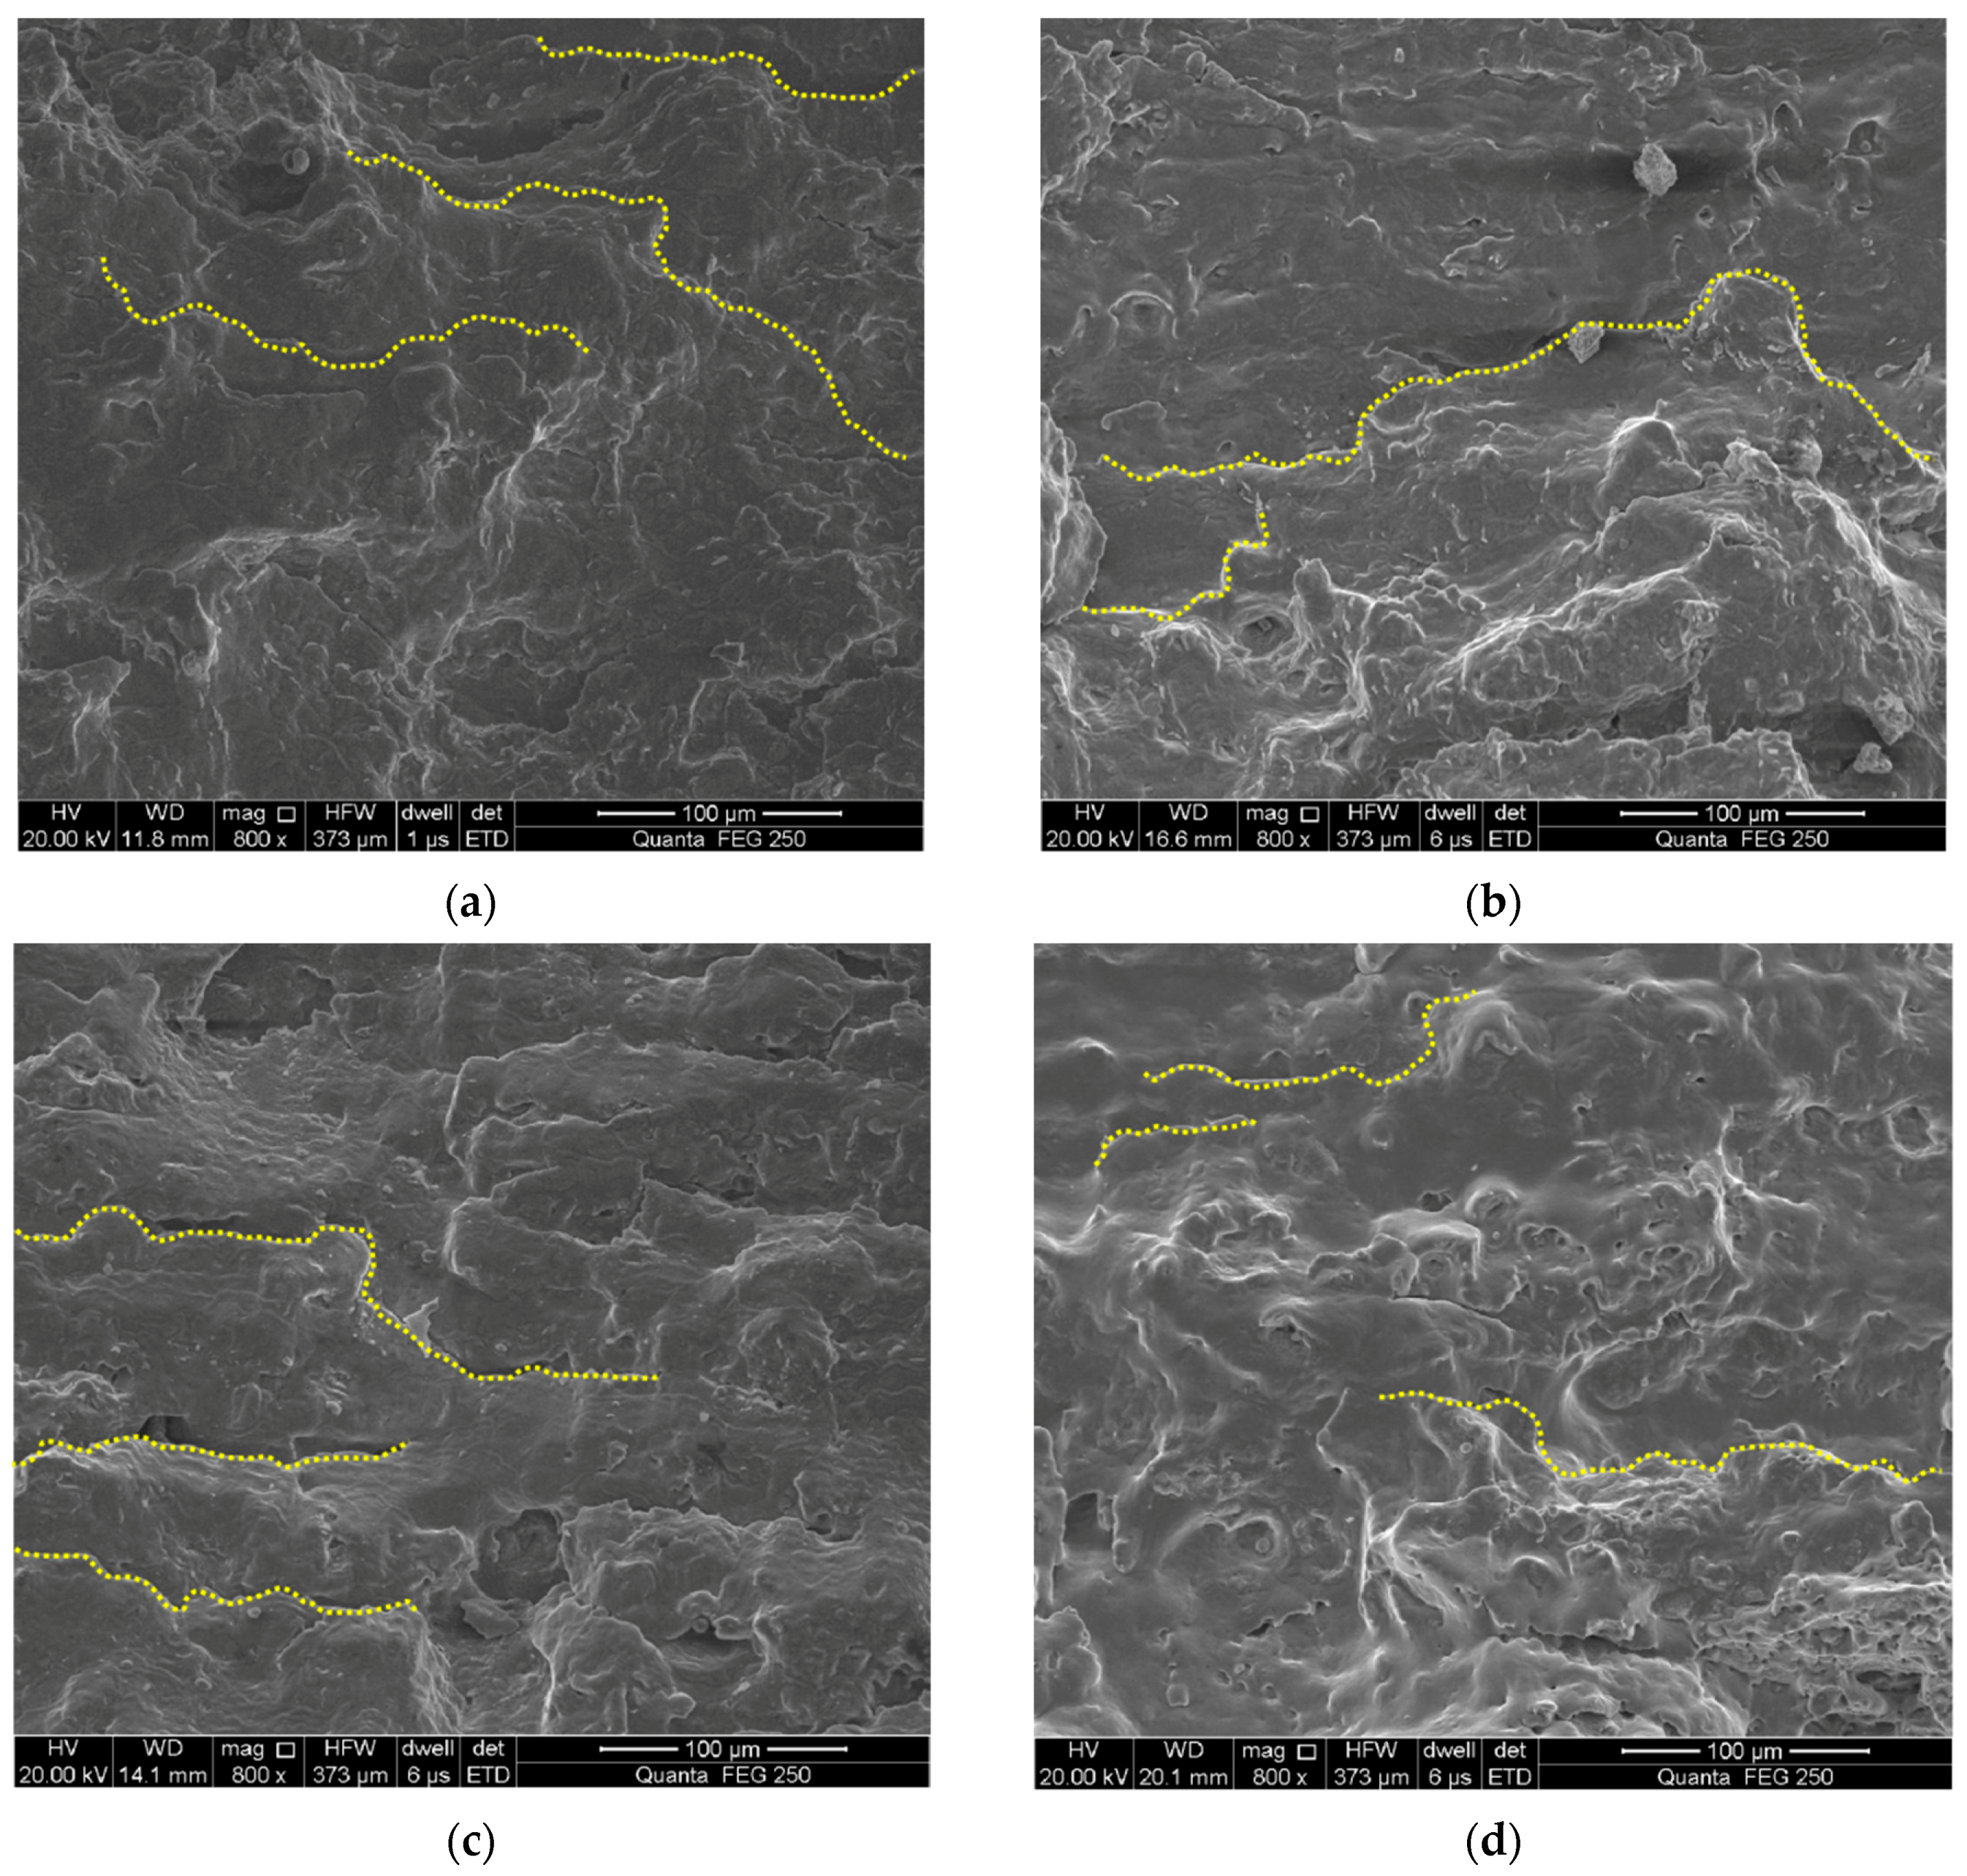
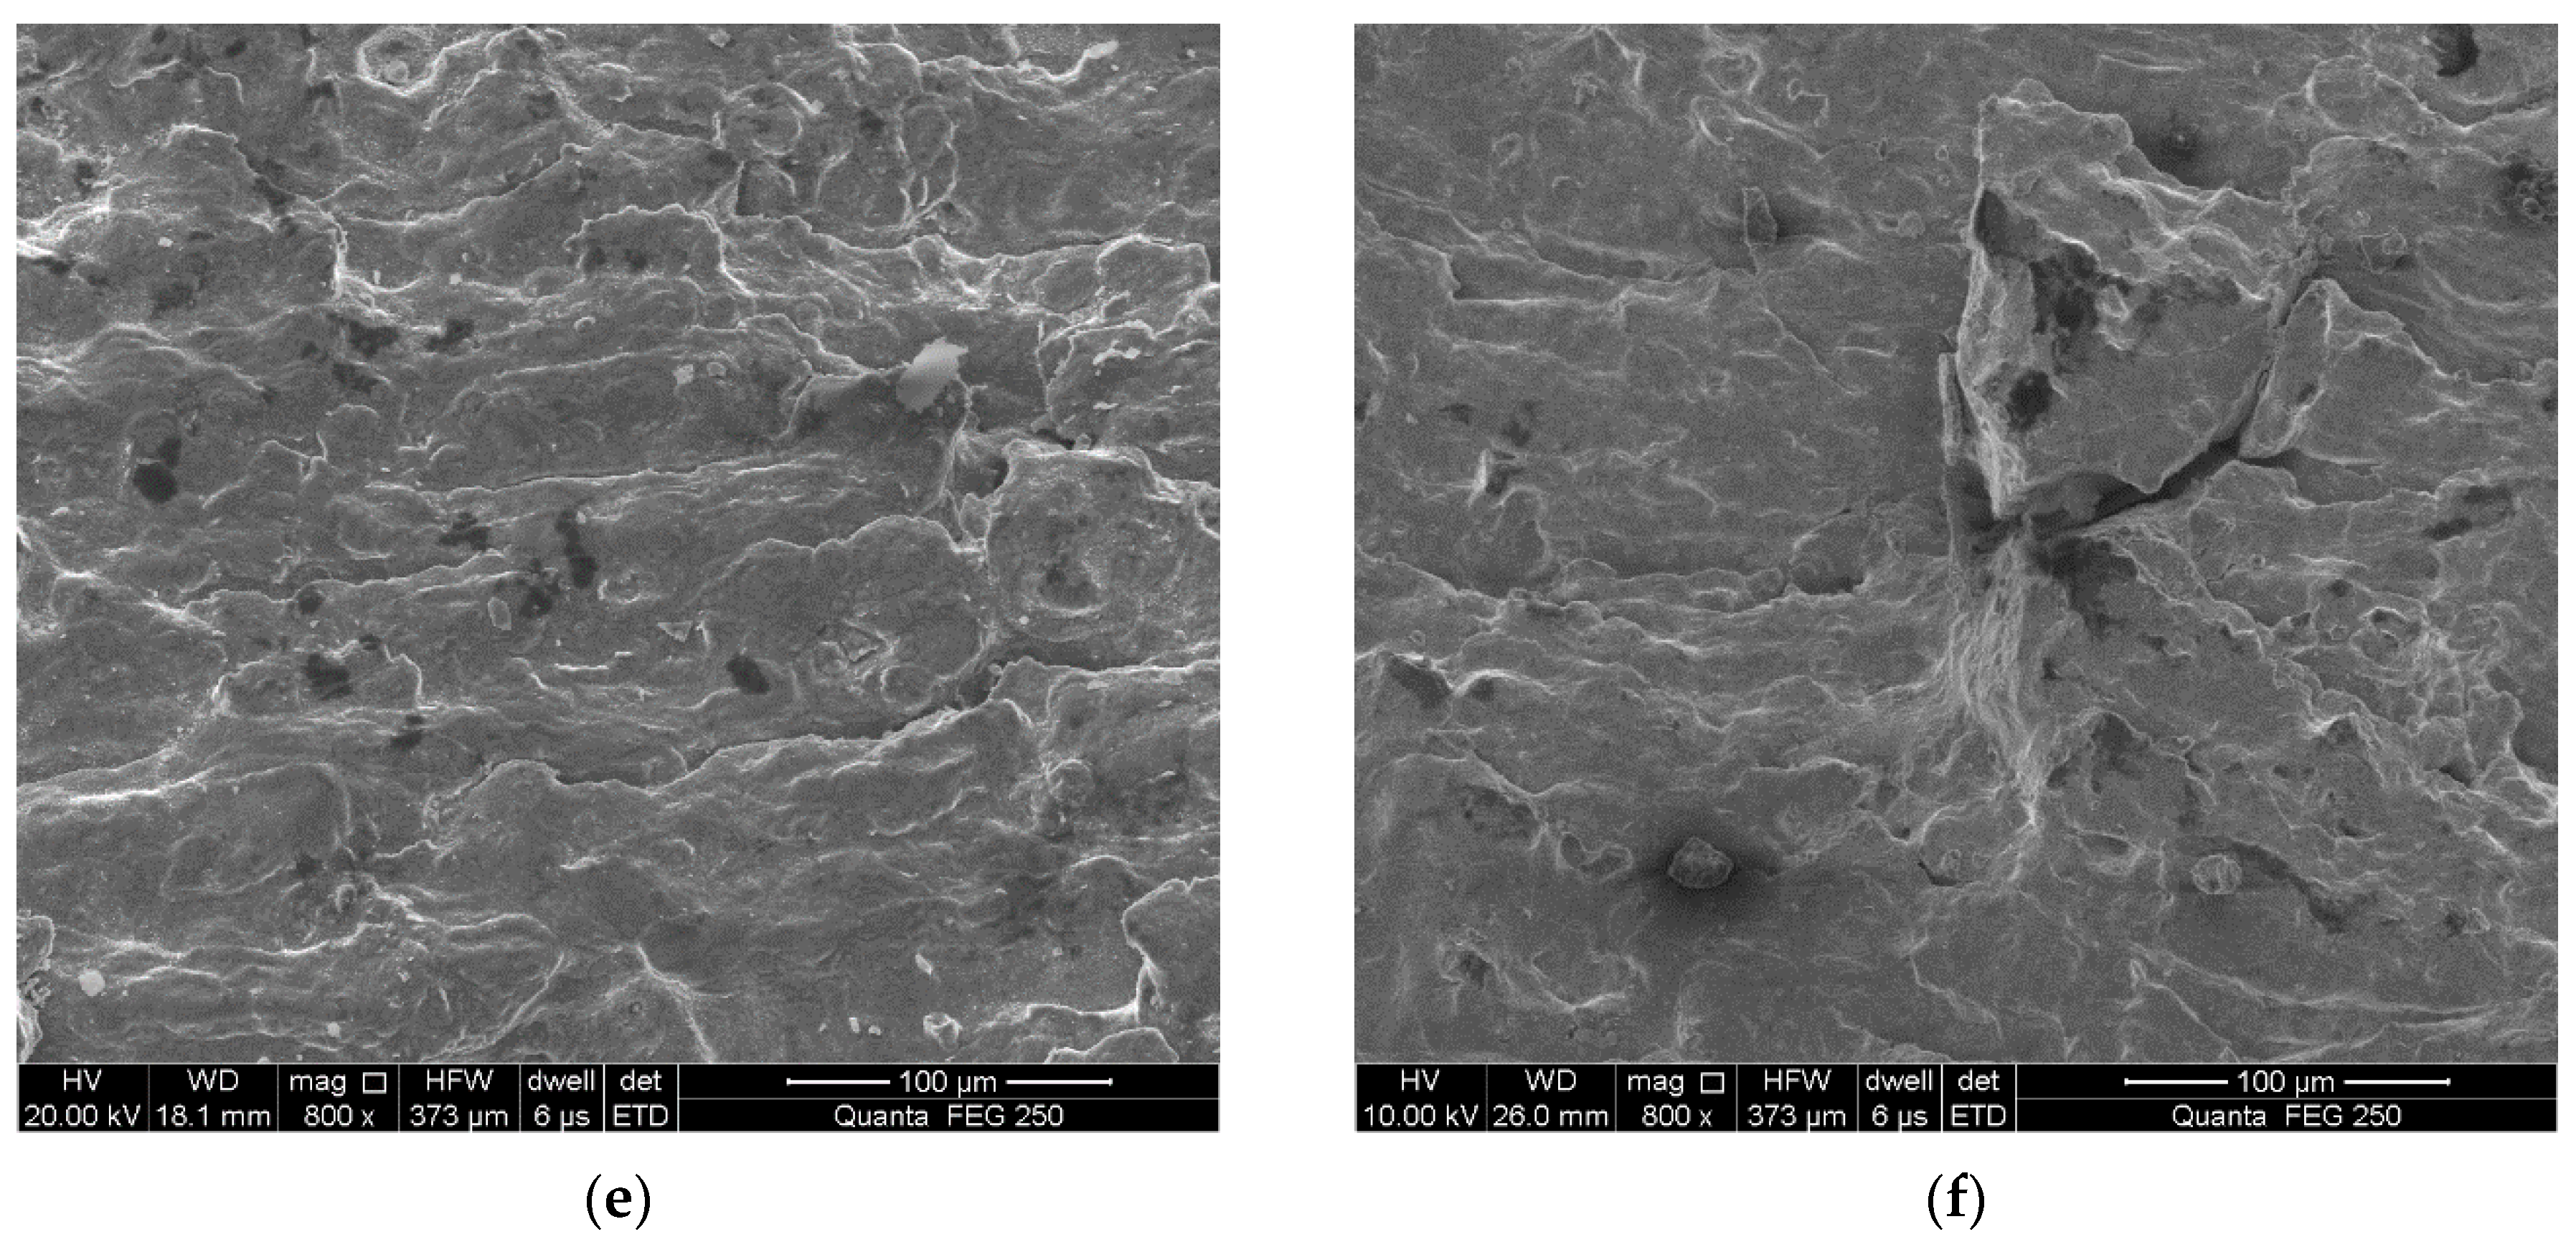
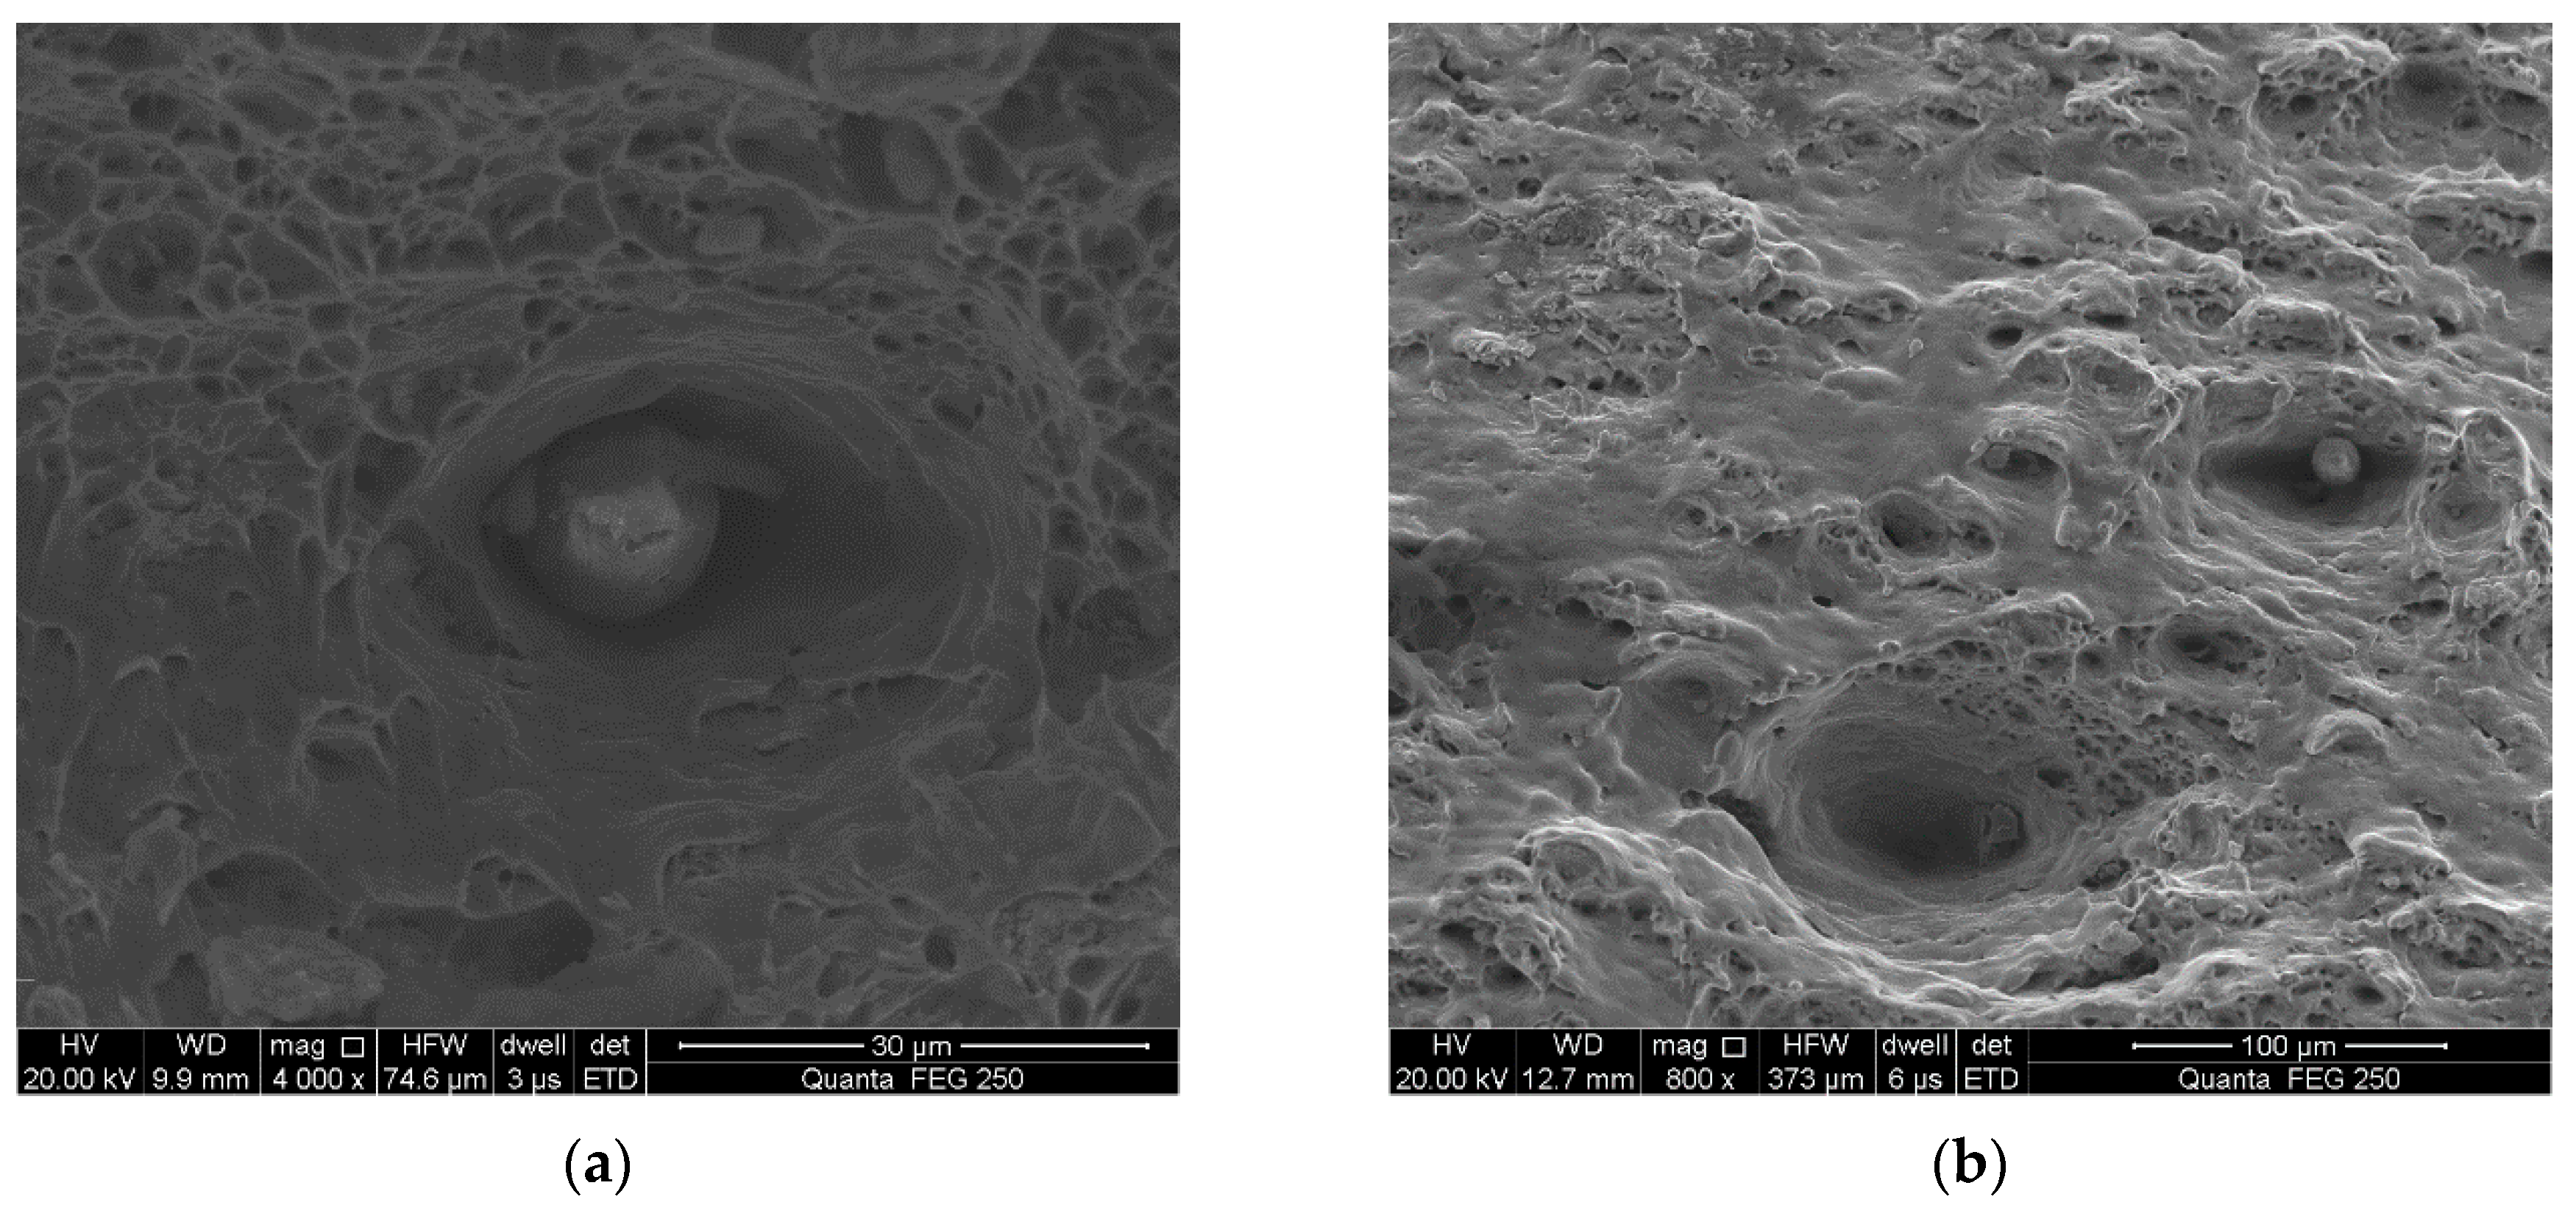
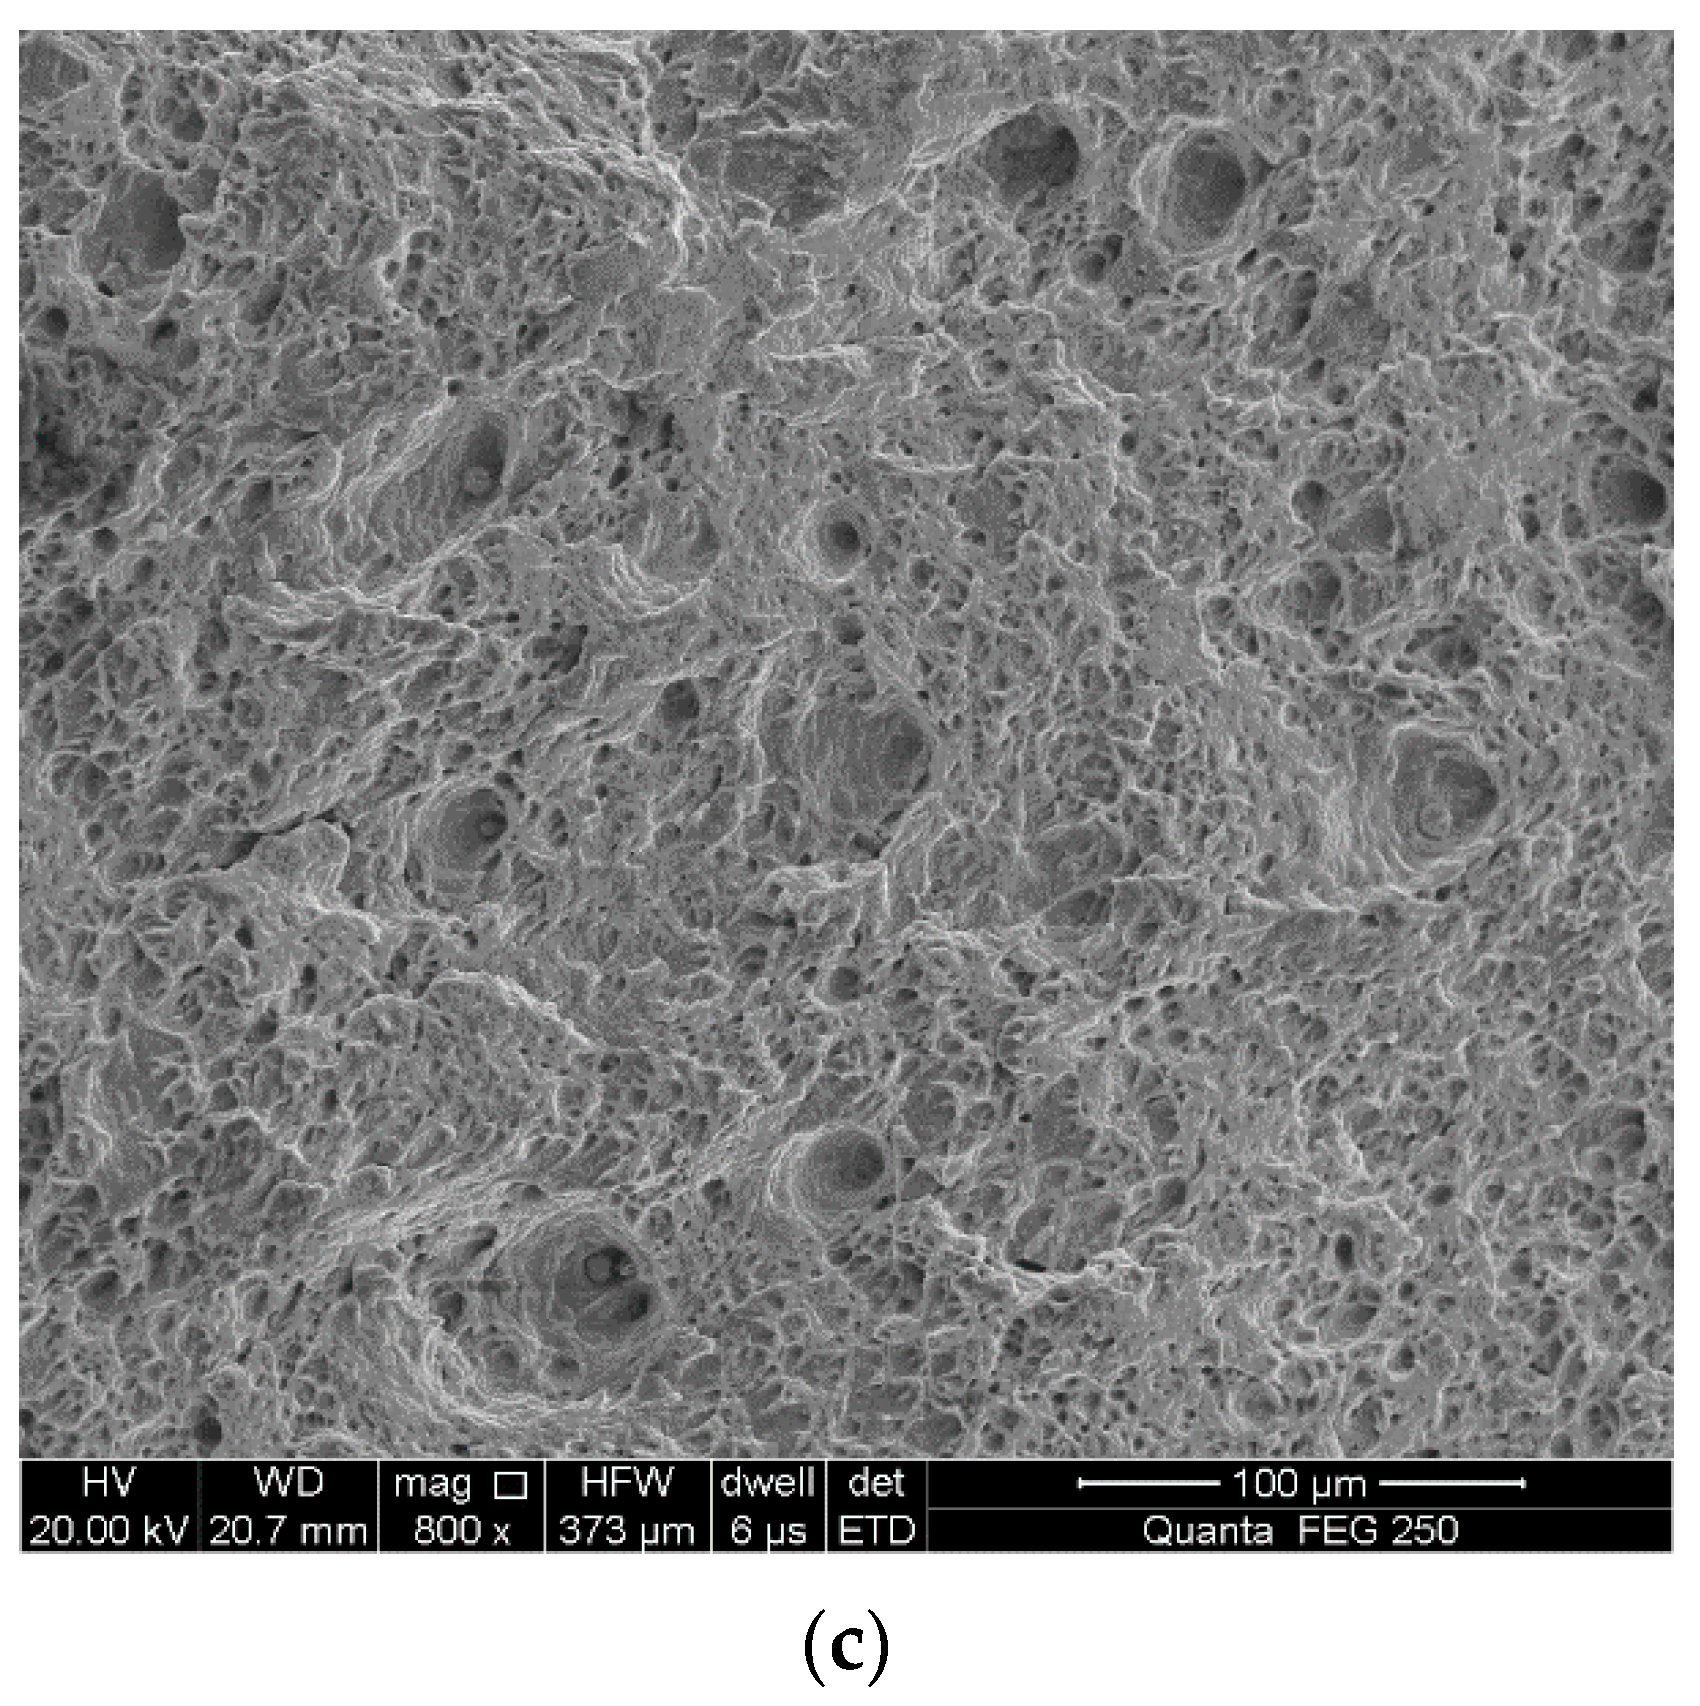
3.3. Fracture Surface Observation
4. Conclusions
- The effect of total strain amplitude on the cyclic stress response of the alloy is approximately the same under three different deformation conditions. For all samples, with an increase of total strain amplitude, the cyclic stress values of alloyed steel increased and the fatigue life decreased significantly.
- With the increase of the cyclic number, all of the samples presented an increment of the cyclic stress, especially at the strain amplitudes of ±0.3% and ±0.2%. The alloyed steel mainly exhibited cyclic hardening during the loading.
- The fatigue properties of samples in an air environment are the best, which is most obvious when the total strain amplitude is ±0.3%. The fatigue life of samples in a mixed alkali metal salts is the shortest.
- Total strain amplitudes and loading environments have great influence on the fatigue fracture morphology of the alloyed steel.
Author Contributions
Funding
Conflicts of Interest
References
- Zhang, H.; Zhang, F.; Su, W.; Jiang, Y.; Li, Y. Research and evaluation of T91 superheater material for high temperature corrosion in biomass power plants. Anti-Corros. Methods Mater. 2015, 62, 133–135. [Google Scholar] [CrossRef]
- He, J.; Xiong, W.; Zhang, W.; Li, W.; Long, K. Study on the high temperature corrosion behaivor of superheater steels of biomass fired boiler in molten alkali salts’ mixtures. Adv. Mech. Eng. 2016, 8. [Google Scholar] [CrossRef]
- Retschitzegger, S.; Gruber, T.; Brunner, T.; Obernberger, I. Short term online corrosion measurements in biomass fired boilers. Part 2: Investigation of the corrosion behaivor of three selected superheater steels for two biomass fuels. Fuel Process. Technol. 2016, 142, 59–70. [Google Scholar] [CrossRef]
- He, J.; Xiong, W. Effect of high temperature hot corrosion on the compression ceep behabvior of 12Cr1MoV alloys. High Temp. Mater. Process. 2017, 36, 1011–1023. [Google Scholar] [CrossRef]
- Zhu, M.L.; Xuan, F.Z.; Chen, J. Influence of microstructure and microdefects on long term fatigue behavior of a Cr-Mo-V steel. Mater. Sci. Eng. A 2012, 546, 90–96. [Google Scholar] [CrossRef]
- Zhu, Z.; Jiao, X.; Tang, X.; Lu, H. Effect of SO42− concentration on corrosion behavior of carbon steel. Anti-Corros. Methods Mater. 2015, 62, 322–326. [Google Scholar] [CrossRef]
- Chauhan, A.; Hoffmann, J.; Litvinov, D.; Aktaa, J. Hight-temperatuer low cycle fatigue behavior of a 9Cr-ODS steel: Part 2-hold time influence, microstructural evolution and damage characteristics. Mater. Sci. Eng. A 2018, 730, 197–206. [Google Scholar] [CrossRef]
- Xiong, S.; Zhu, Z.; Jing, L. Influence of Cl-ions on the pitting corrosion of bolier water wall tube and its principle. Anti-Corros. Methods Mater. 2012, 59, 3–9. [Google Scholar] [CrossRef]
- Liu, S.; Liu, Z.; Wang, Y.; Tang, J. A comparative study on the high temperature corrosion of TP347H stainless steel, C22 alloy and laser-cladding C22 coating in molten chloride salts. Corros. Sci. 2014, 83, 396. [Google Scholar] [CrossRef]
- Zhang, T.B.; Dong, R.F.; Rui, H.; Kou, H.C.; Li, J.S. Hot corrosion characteristics of Ni-20Cr-18W superalloy in molten salt. Trans. Nonferr. Met. Soc. China 2015, 25, 3840–3846. [Google Scholar] [CrossRef]
- Tsaur, C.C.; Rock, J.C.; Wang, C.J.; Su, Y.H. The hot corrosion of 310 stainless steel with precoated NaCl/Na2SO4 mixtures at 750 °C. Mater. Chem. Phys. 2005, 89, 445–453. [Google Scholar] [CrossRef]
- Halford, G.; Hirschberg, M.; Manson, S. Creep-Fatigue Analysis by Strain Range Partitioning; NASA Lewis Research Center: Cleveland, OH, USA, 1971. [Google Scholar]
- Zenr, C.; Holloman, J. Effect of strain rate upon the plastic flow of steel. J. Appl. Phys. 1944, 15, 22. [Google Scholar] [CrossRef]
- Seifert, T.; Riedel, H. Mechanism-based thermomechanical fatigue life prediction of cast iron. Part 1: Models. Int. J. Fatigue 2010, 32, 1358–1367. [Google Scholar] [CrossRef]

| Element | C | Cr | Mn | Mo | Si | V | Fe |
|---|---|---|---|---|---|---|---|
| Content | 0.1 | 1.03 | 0.54 | 0.3 | 0.24 | 0.2 | Balance |
| Temperature (°C) | Strain Amplitude | Waveform | Frequency (HZ) | Environment |
|---|---|---|---|---|
| 600 | ±0.4% | Cosine wave | 0.2 | Air/Mixed Alkali metal chloride salt (Type A)/Mixed sulfate salt (Type B) |
| ±0.5% | ||||
| ±0.3% | ||||
| ±0.2% |
| Temperature (°C) | σb (MPa) | σ0.2 (MPa) | A (%) |
|---|---|---|---|
| Room temperature | 715 ± 32 | 521 ± 24 | 21.5 ± 1.1 |
| 600 | 544 ± 22 | 311 ± 17 | 42.7 ± 2.3 |
| Parameter | Air | Mixed Chloride Salt | Mixed Sulfate Salt |
|---|---|---|---|
| K′ | 435 | 434 | 438 |
| n′ | 0.1083 | 0.1102 | 0.1107 |
| Strain Amplitudes | Air | Mixed Alkali Metal Chloride Salt | Mixed Sulfate Salt |
|---|---|---|---|
| ±0.5% | 627 ± 33 | 271 ± 15 | 562 ± 22 |
| ±0.4% | 978 ± 46 | 559 ± 21 | 840 ± 39 |
| ±0.3% | 2444 ± 128 | 713 ± 37 | 951 ± 47 |
| ±0.2% | 10,053 ± 484 | 5524 ± 278 | 5778 ± 282 |
| Parameter | Air | Mixed Chloride Salt | Mixed Sulfate Salt |
|---|---|---|---|
| 26.72 | 16.43 | 17.76 | |
| c | −0.73413 | −0.75219 | −0.73448 |
© 2019 by the authors. Licensee MDPI, Basel, Switzerland. This article is an open access article distributed under the terms and conditions of the Creative Commons Attribution (CC BY) license (http://creativecommons.org/licenses/by/4.0/).
Share and Cite
He, J.; Bao, J.; Long, K.; Li, C.; Wang, G. Study on the Corrosion Fatigue Properties of 12Cr1MoV Steel at High Temperature in Different Salt Environments. Metals 2019, 9, 774. https://doi.org/10.3390/met9070774
He J, Bao J, Long K, Li C, Wang G. Study on the Corrosion Fatigue Properties of 12Cr1MoV Steel at High Temperature in Different Salt Environments. Metals. 2019; 9(7):774. https://doi.org/10.3390/met9070774
Chicago/Turabian StyleHe, Jianjun, Jiangyong Bao, Kailiang Long, Cong Li, and Gang Wang. 2019. "Study on the Corrosion Fatigue Properties of 12Cr1MoV Steel at High Temperature in Different Salt Environments" Metals 9, no. 7: 774. https://doi.org/10.3390/met9070774
APA StyleHe, J., Bao, J., Long, K., Li, C., & Wang, G. (2019). Study on the Corrosion Fatigue Properties of 12Cr1MoV Steel at High Temperature in Different Salt Environments. Metals, 9(7), 774. https://doi.org/10.3390/met9070774