Abstract
Al-xFe-La alloys (x = 0.07, 0.1, 0.2) for aluminum current collectors of lithium-ion batteries were prepared and the microstructure of Al-0.07Fe-0.07La, Al-0.1Fe-0.07La and Al-0.2Fe-0.07La aluminum alloys were observed by scanning electron microscopy (SEM), energy dispersive spectroscopy (EDS). The experimental results showed that with the increase of Fe content, the size of the second phases in Al-xFe-0.07La alloys became finer and more dispersed and that the microstructure of the alloy had improved. The strength and corrosion resistance of Al-xFe-La alloys were studied by tensile tests and electrochemical tests and the morphological investigations of samples were also conducted by SEM and EDS. With the increase of Fe content, the strength and corrosion resistance of Al-xFe-La alloys became better. Compared to Al-0.07Fe-0.07La alloy, the yield strength and tensile strength of the Al-0.2Fe-0.07La alloy increased by 51.19% and 58.48% respectively, and the elongation increased by 88.41%. Moreover, Al-0.2Fe-0.07La alloy had much more positive corrosion potential and much smaller corrosion current than those of Al-0.07Fe-0.07La alloy.
1. Introduction
The lithium-ion battery has become one of the most ideal energy storage devices in the 21st century because of its high energy density, high charge-discharge efficiency, good cycling stability, wide operating temperature range, high working voltage, low self-discharge, no memory effect, its safety, and its environmentally-friendly properties. Aluminum alloy foils for current collectors of lithium-ion batteries are mainly used to support the coating of active materials on cathode of lithium-ion batteries. The metallic foil is not directly helpful to the capacity of lithium-ion batteries. Therefore, tensile strength and corrosion resistance are the two main performance indexes of aluminum alloy foils for current collectors. Aluminum alloy foils with good tensile strength and corrosion resistance are the required current collector material of lithium-ion batteries [1,2,3,4]. At present, pure aluminum foils of 1080, 1085 and 1090 grades are commonly used for the aluminum current collector materials of lithium ion batteries, but these pure aluminum foils generally have the problem of complex alloy composition [4]. Al-Fe alloy foils are often used as cathode collectors of lithium-ion batteries due to their excellent mechanical properties, electrical conductivity and corrosion resistance. However, the coarse grain size of Al-Fe alloy will make the tensile strength and corrosion resistance of Al-Fe alloy worse. The rare earth element La has good modifying, refining, purifying and alloying effects on Al-Fe alloy, which can improve the microstructure and comprehensive properties of Al-Fe alloy [5,6,7]. The effect of La content on the grain size of Al-Fe alloy is also quite different. The grain size of Al-Fe alloy can be uniformly refined and the coarsening of Al3Fe phase can be inhibited by appropriate La addition [8].
A significant proportion of the literature has conducted studies on the Al-Fe-La alloy system, but the content of Fe or La elements in the Al-Fe-La system studied in a lot of the literature is very large. A large content of Fe element may bring about some side effects such as worsening electrical conductivity according to previous work [9,10,11,12,13,14,15]. Therefore, in this work, only the effects of trace Fe content on the strength and corrosion resistance of Al-xFe-0.07La alloy have been studied, so as to determine the effects of different Fe content on Al-xFe-0.07La alloy when the Fe content is very small.
2. Materials and Methods
Cold-rolling Al-0.07Fe-0.07La (wt.%), Al-0.1Fe-0.07La (wt.%) and Al-0.2Fe-0.07La (wt.%) aluminum alloys were studied in this paper. All aluminum foils were fabricated by casting, homogenizing annealing, hot rolling and cold rolling. The foils with a thickness of 0.07-0.09 mm were annealed at 160 °C for 5 h. The microstructure and second phases of aluminum foil samples were observed with scanning electron microscope (MIRA3, TESCAN, Brno, Czech Republic). The SEM samples were polished by standard mechanical polishing procedures and corroded by Keller reagent (95 mL H2O, 2.5 mL HNO3, 1.5 mL HCl, 1.0 mL HF). The second phases of aluminum foil samples were characterized by energy dispersive spectroscopy (Aztec X-MaxN80, TESCAN, Brno, Czech Republic). Tensile tests of aluminum alloy foils were conducted on a universal tensile machine (Zwick/Roell Z020, Ulm, Germany). Tensile tests were carried out at room temperature at the speed of 1 mm/min according to ASTM E8/E8M-13a (Standard Test Methods for Tension Testing of Metallic Materials, USA) and each alloy had five parallel samples to ensure the accuracy. The tensile fracture morphology of aluminum alloy foils were observed with scanning electron microscopy (SIRION 200, FEI, Hillsborough, OR, USA).
The electrochemical tests of aluminum alloy foils were completed in CHI 660E electrochemical system (Chenhua, Shanghai, China). The aluminum alloy foil samples were cleaned by acetone, absolute ethanol and deionized water respectively. Each alloy had three parallel samples to ensure the accuracy of the results. All electrochemical tests were performed in 3.5% NaCl solution at room temperature with a scanning speed of 1 mV/s. The Tafel curve was measured using a three-electrode system. The working electrode, the reference electrode and the auxiliary electrode were the sample, the saturated calomel electrode and the platinum plate, respectively. All potential was relative to the reference electrode. And the corrosion morphologies of aluminum foils were observed with SEM (VEGA 3, TESCAN, Brno, Czech Republic) and SEM (NOVA NANOSEM 230, FEI, Hillsborough, OR, USA).
3. Results and Discussions
3.1. Microstructure
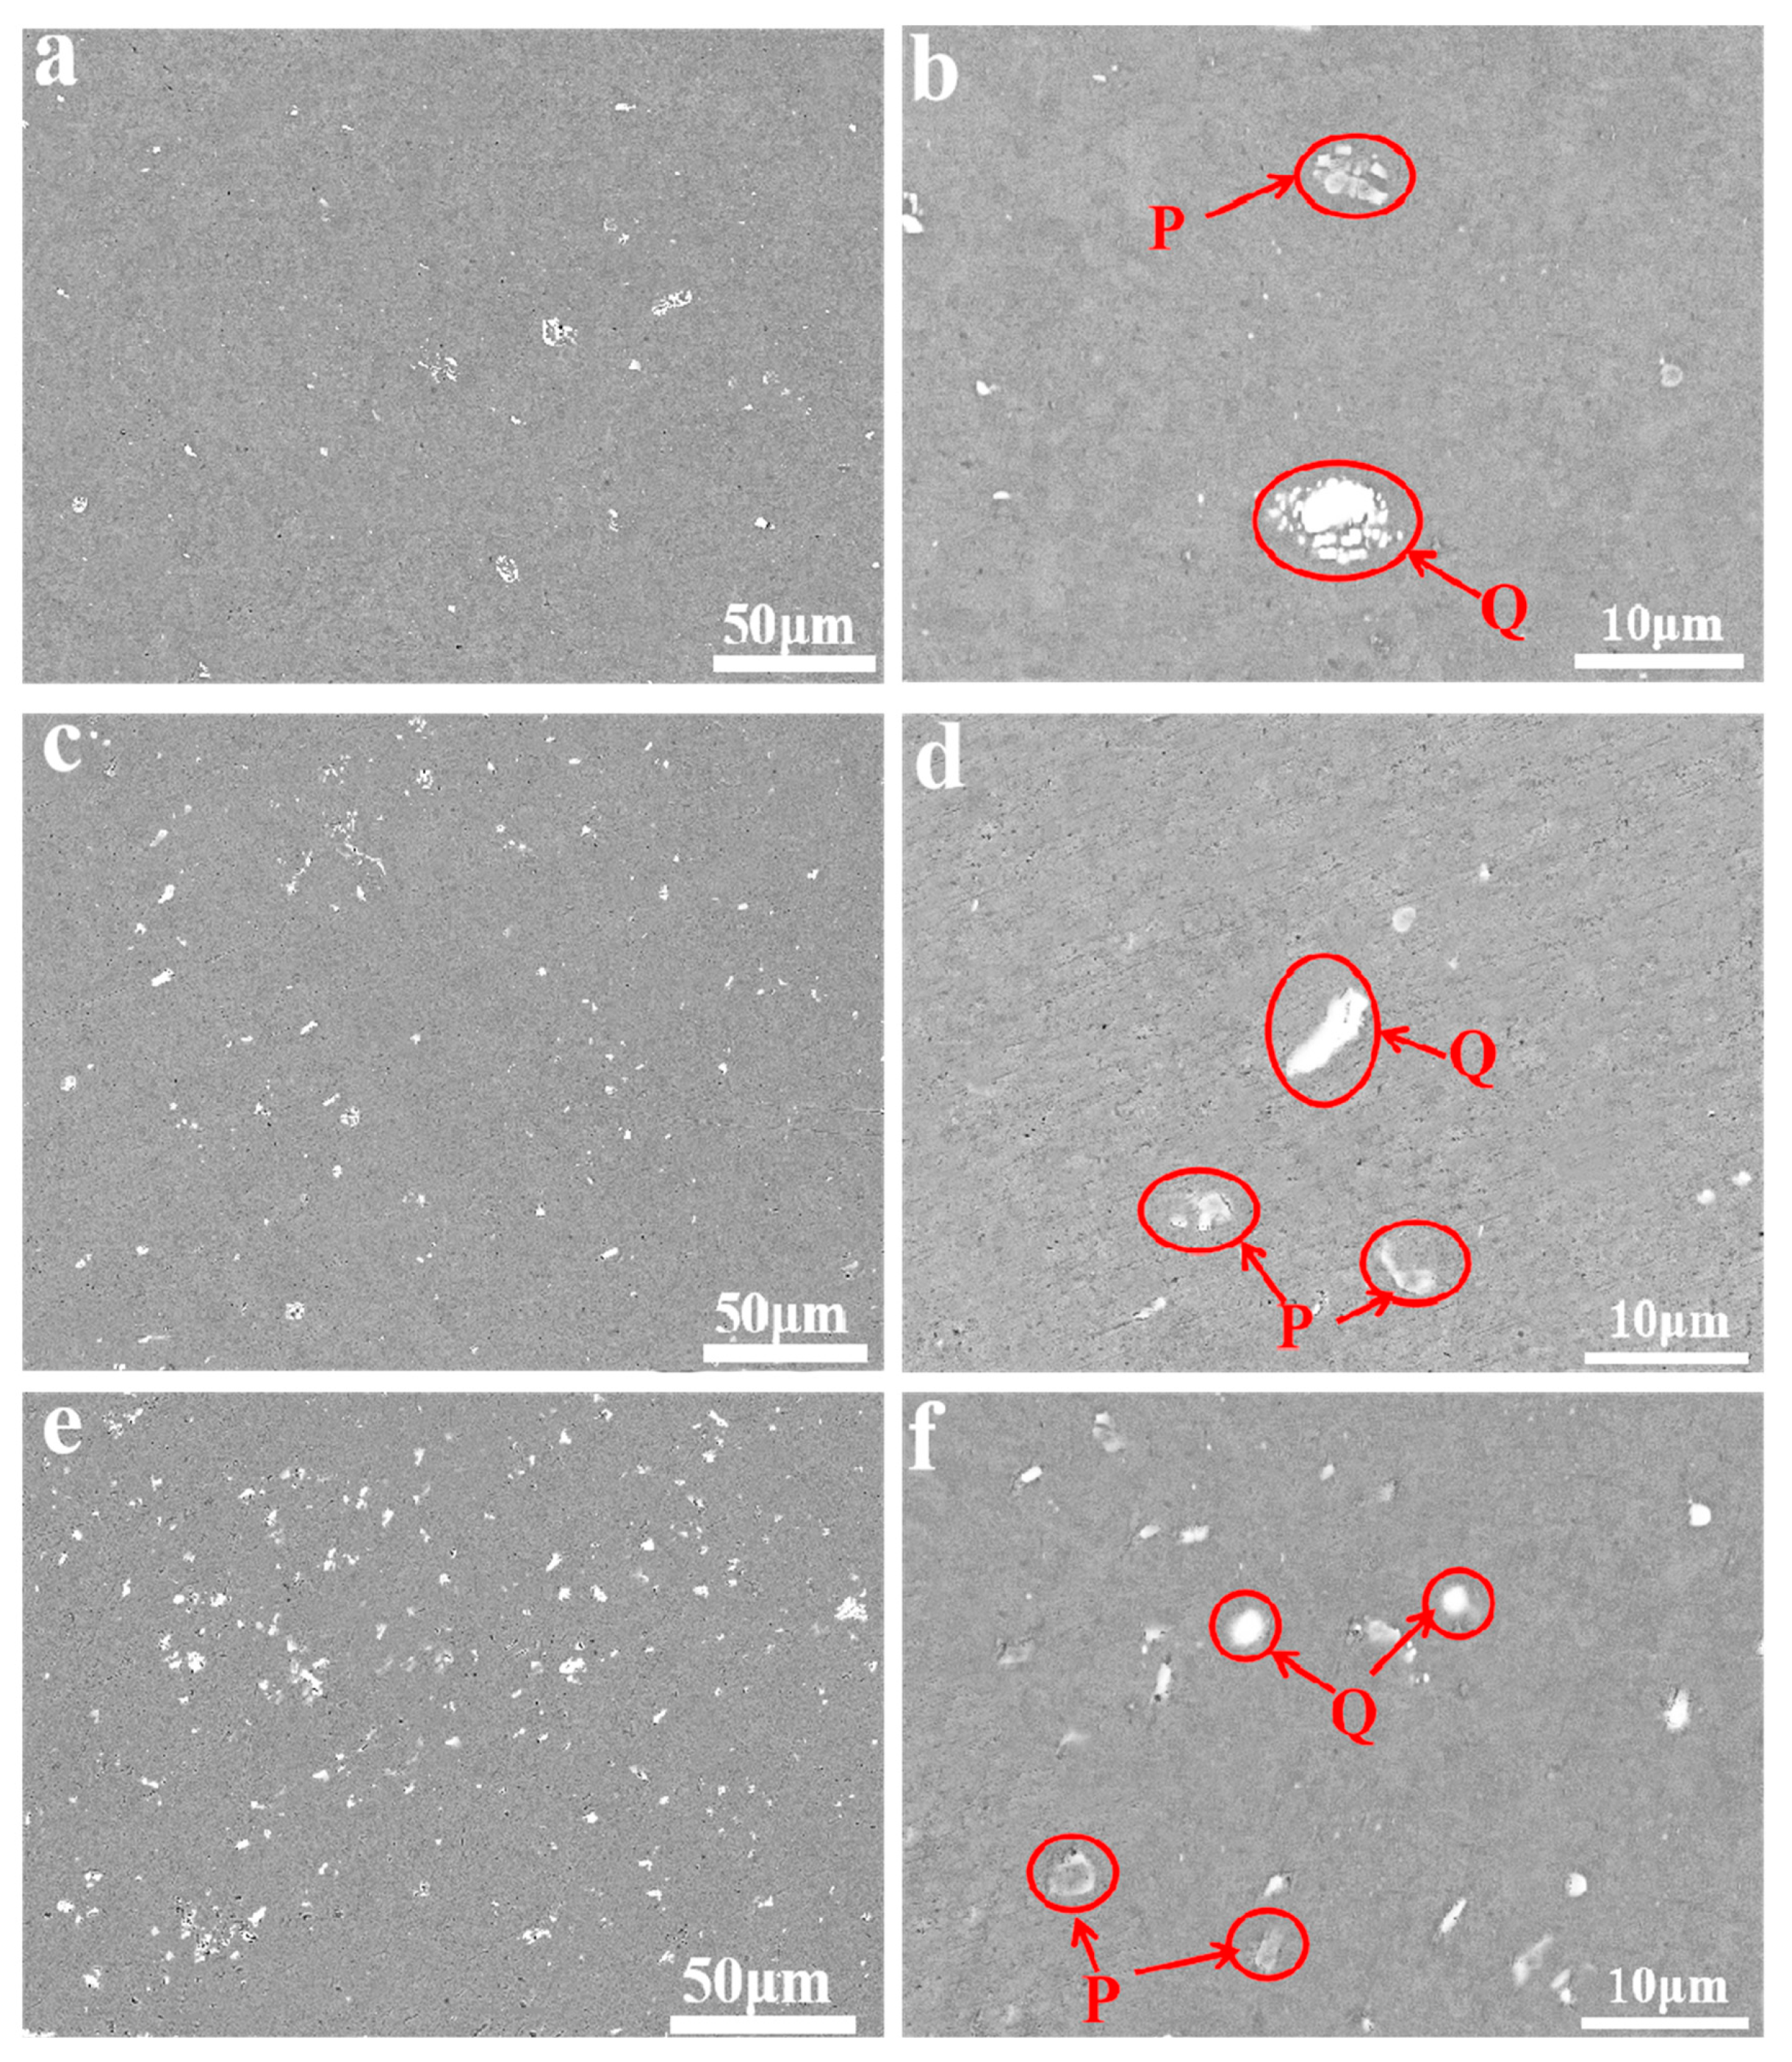
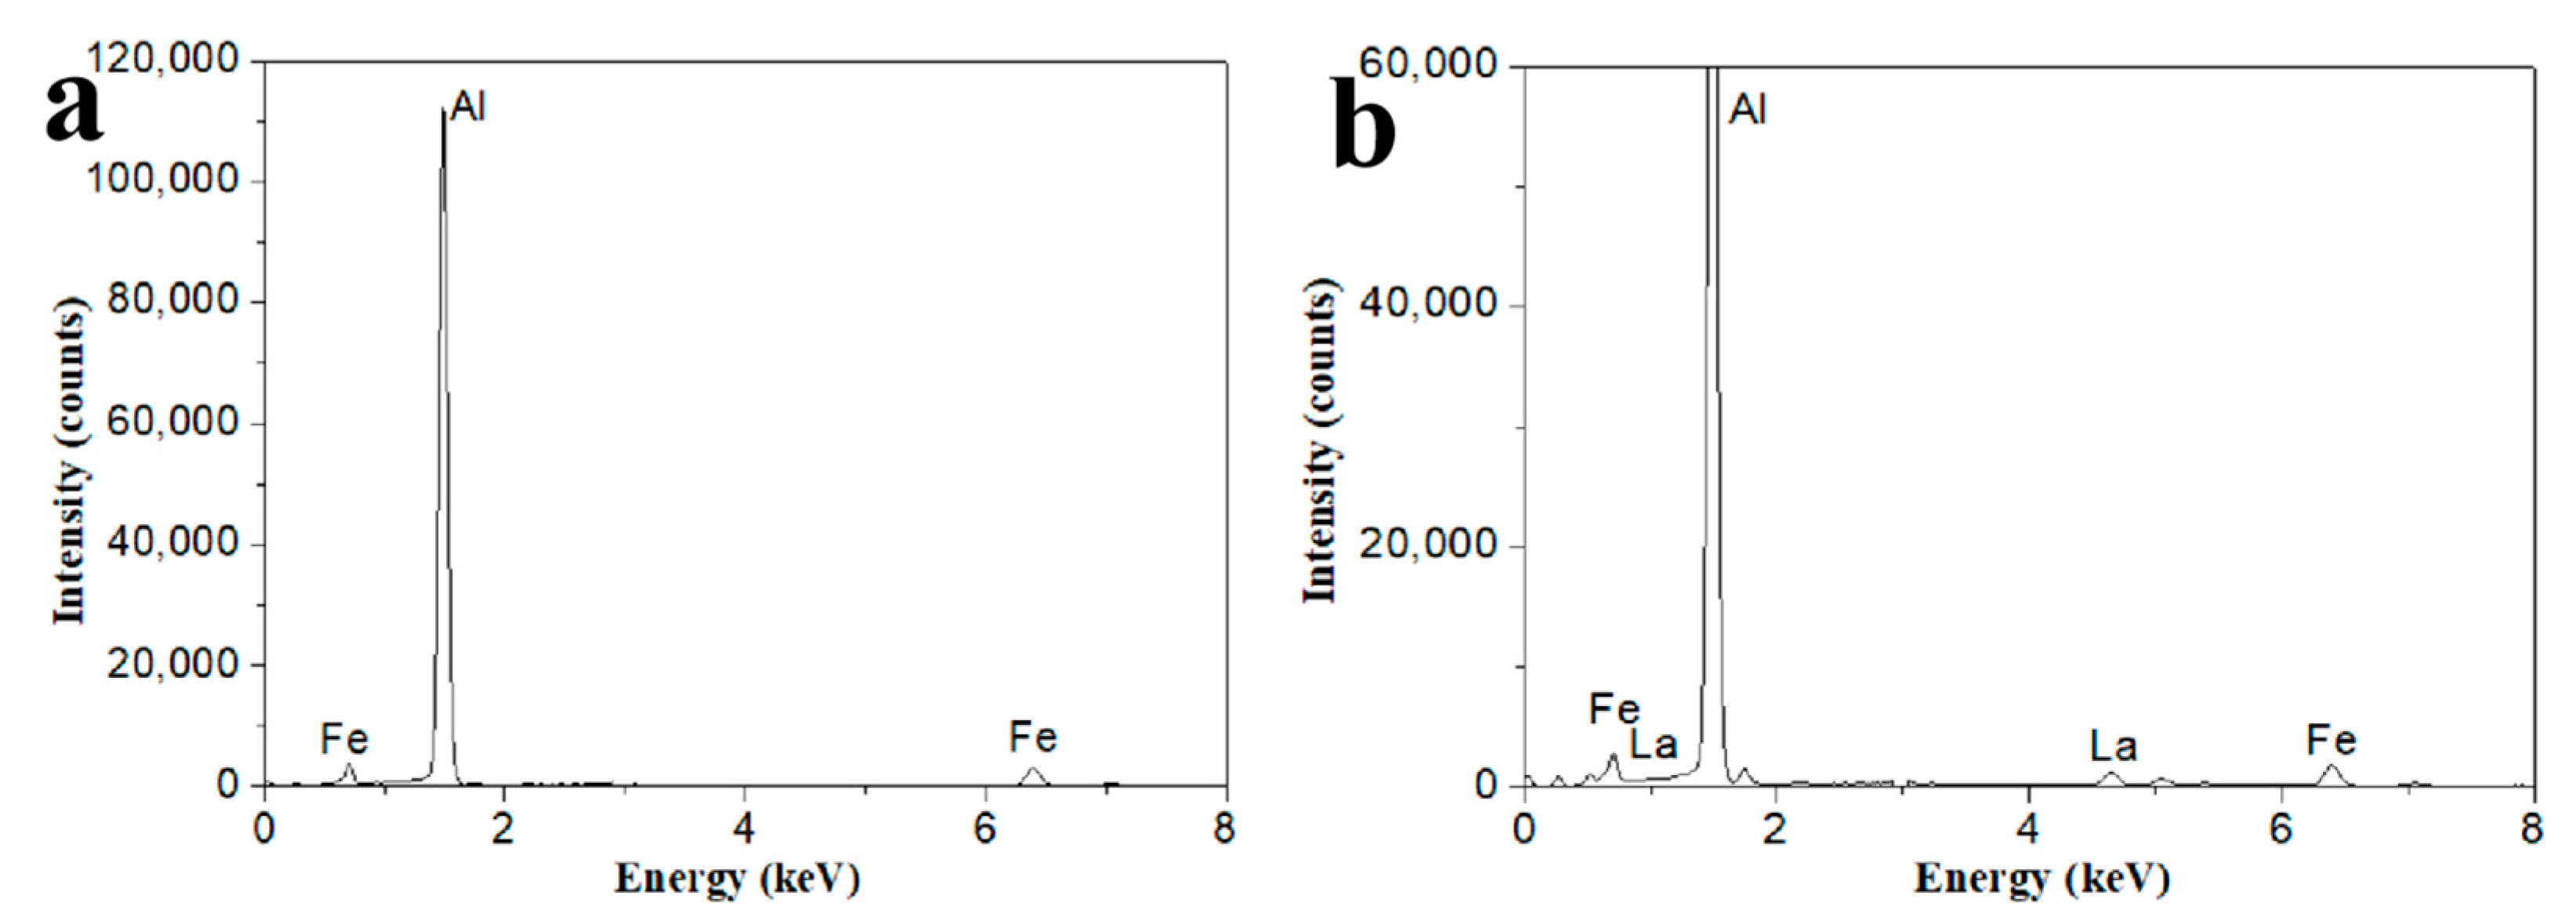
Figure 1 shows SEM/BSE (Backscattered Electron) images of three kinds of aluminum alloy foils annealed at 160 °C for 5 h. Through Figure 1a,c,e, the second phases in Al-xFe-0.07La alloy became more abundant and more dispersive with the increase of Fe content. The number of second phases in Al-0.07Fe-0.07La alloy was the lowest. The Al-0.2Fe-0.07La alloy had the most second phases. The finely dispersed second phase can help to improve the microstructure, mechanical and electrochemical performance of the alloy [16,17,18,19]. According to Figure 1b,d,f, there were white phases (Q) and gray phases (P) in all the three kinds of alloys. In order to further determine the composition of Q and P in Al-xFe-0.07La alloy foils, EDS analyses of Q and P in Al-xFe-0.07La alloy foils were conducted. Finally, it was found that AlFe phases were gray (P) and AlFeLa phases were white (Q). Figure 2 shows typical EDS analyses of phase P and phase Q in the alloy foils annealed at 160 °C for 5 h.
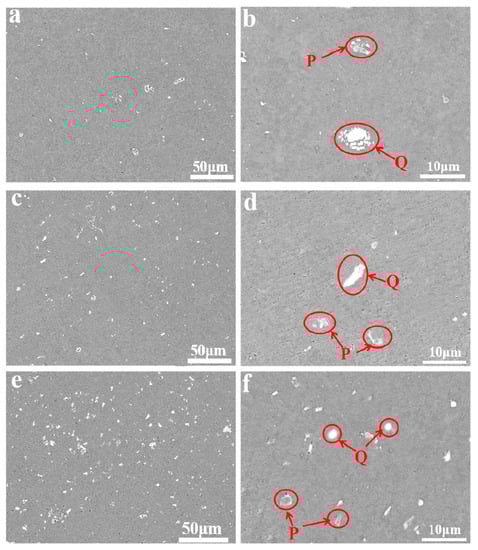
Figure 1.
SEM/BSE images of aluminum alloy foils: (a,b) Al-0.07Fe-0.07La; (c,d) Al-0.1Fe-0.07La; (e,f) Al-0.2Fe-0.07La.
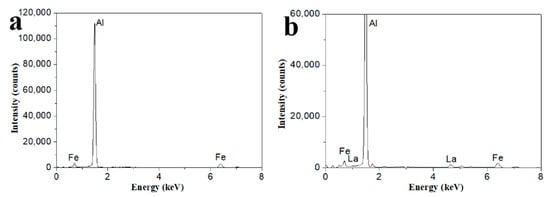
Figure 2.
Typical energy dispersive spectroscopy (EDS) analyses of (a) phase P; (b) phase Q.
Therefore, as the content of Fe element increased, the size of AlFe (P) and AlFeLa (Q) phases became smaller and more uniform, and the number of AlFe (P) and AlFeLa (Q) phases increased. Compared to the Al-0.07Fe-0.07La alloy and Al-0.1Fe-0.07La alloy, there were no large AlFe and AlFeLa phases in the Al-0.2Fe-0.07La alloy. This was because the rare earth element La could easily adsorbed on the AlFe phases and promote the spheroidization of the AlFe phases when the content of Fe element increased [20]. Thus, the second phases in the Al-0.2Fe-0.07La alloy were abundant and dispersed.
3.2. Tensile Properties
Table 1 shows the tensile test results of three kinds of alloy foils annealed at 160 °C for 5 h. With the increase of Fe content, the yield strength and tensile strength of Al-xFe-0.07La alloys increased greatly and the elongation of Al-xFe-0.07La alloy also increased. The yield strength and tensile strength of Al-0.2Fe-0.07La alloy respectively increased by 51.19% and 58.48%, and the elongation also increased by 88.41% compared to Al-0.07Fe-0.07La alloy.

Table 1.
Tensile strength of the aluminum alloy foils.
In order to determine the reasons for the difference of tensile strength between the three kinds of aluminum alloys, the tensile fracture morphologies of the three kinds of alloy foils were observed. Figure 3 shows the SEM images of fracture morphology of Al-xFe-0.07La alloy foils after heat treatment for 5 h at 160 °C. According to Figure 3a,c,e, the fracture morphology of the three alloys were similar and they all presented ductile fracture under tensile tests. There were slip patterns on both sides and dimples in the middle in the fracture morphology of the three alloys. It was implied from Figure 3 that with the increase of Fe content, the number of dimples in Al-xFe-0.07La alloys increased. Dimples often occurred where the second phases were located. The result confirmed that with the increase of Fe element, the number of second phases in Al-xFe-0.07La alloys also increased. Therefore, the effect of second-phase strengthening was relatively weak in Al-0.07Fe-0.07La alloy, resulting in low yield strength and low tensile strength. However, there were many dimples in Al-0.2Fe-0.07La alloy and large dimples surrounded the small dimples. This also reflected that there were a large number of second phases in the Al-0.2Fe-0.07La alloy, which hindered the breaking of aluminum foil during tension, so that the yield strength and tensile strength of Al-0.2Fe-0.07La alloy were much higher than those of Al-0.07Fe-0.07La and Al-0.1Fe-0.07La alloy [21,22,23]. EDS analyses of dimples showed that the second phase in dimples of the three kinds of alloys was Fe-rich phase. Therefore, with the increase of Fe content, the number of Fe-rich phases increased (Figure 1). Thus, the yield strength and tensile strength of Al-xFe-0.07La aluminum alloy foils increased.
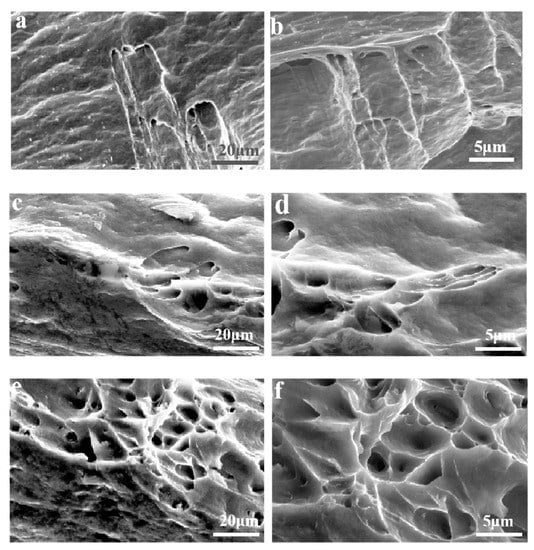
Figure 3.
Fracture morphology of the Al-xFe-0.07La alloys: (a,b) Al-0.07Fe-0.07La; (c,d) Al-0.1Fe-0.07La; (e,f) Al-0.2Fe-0.07La.
3.3. Electrochemical Performance
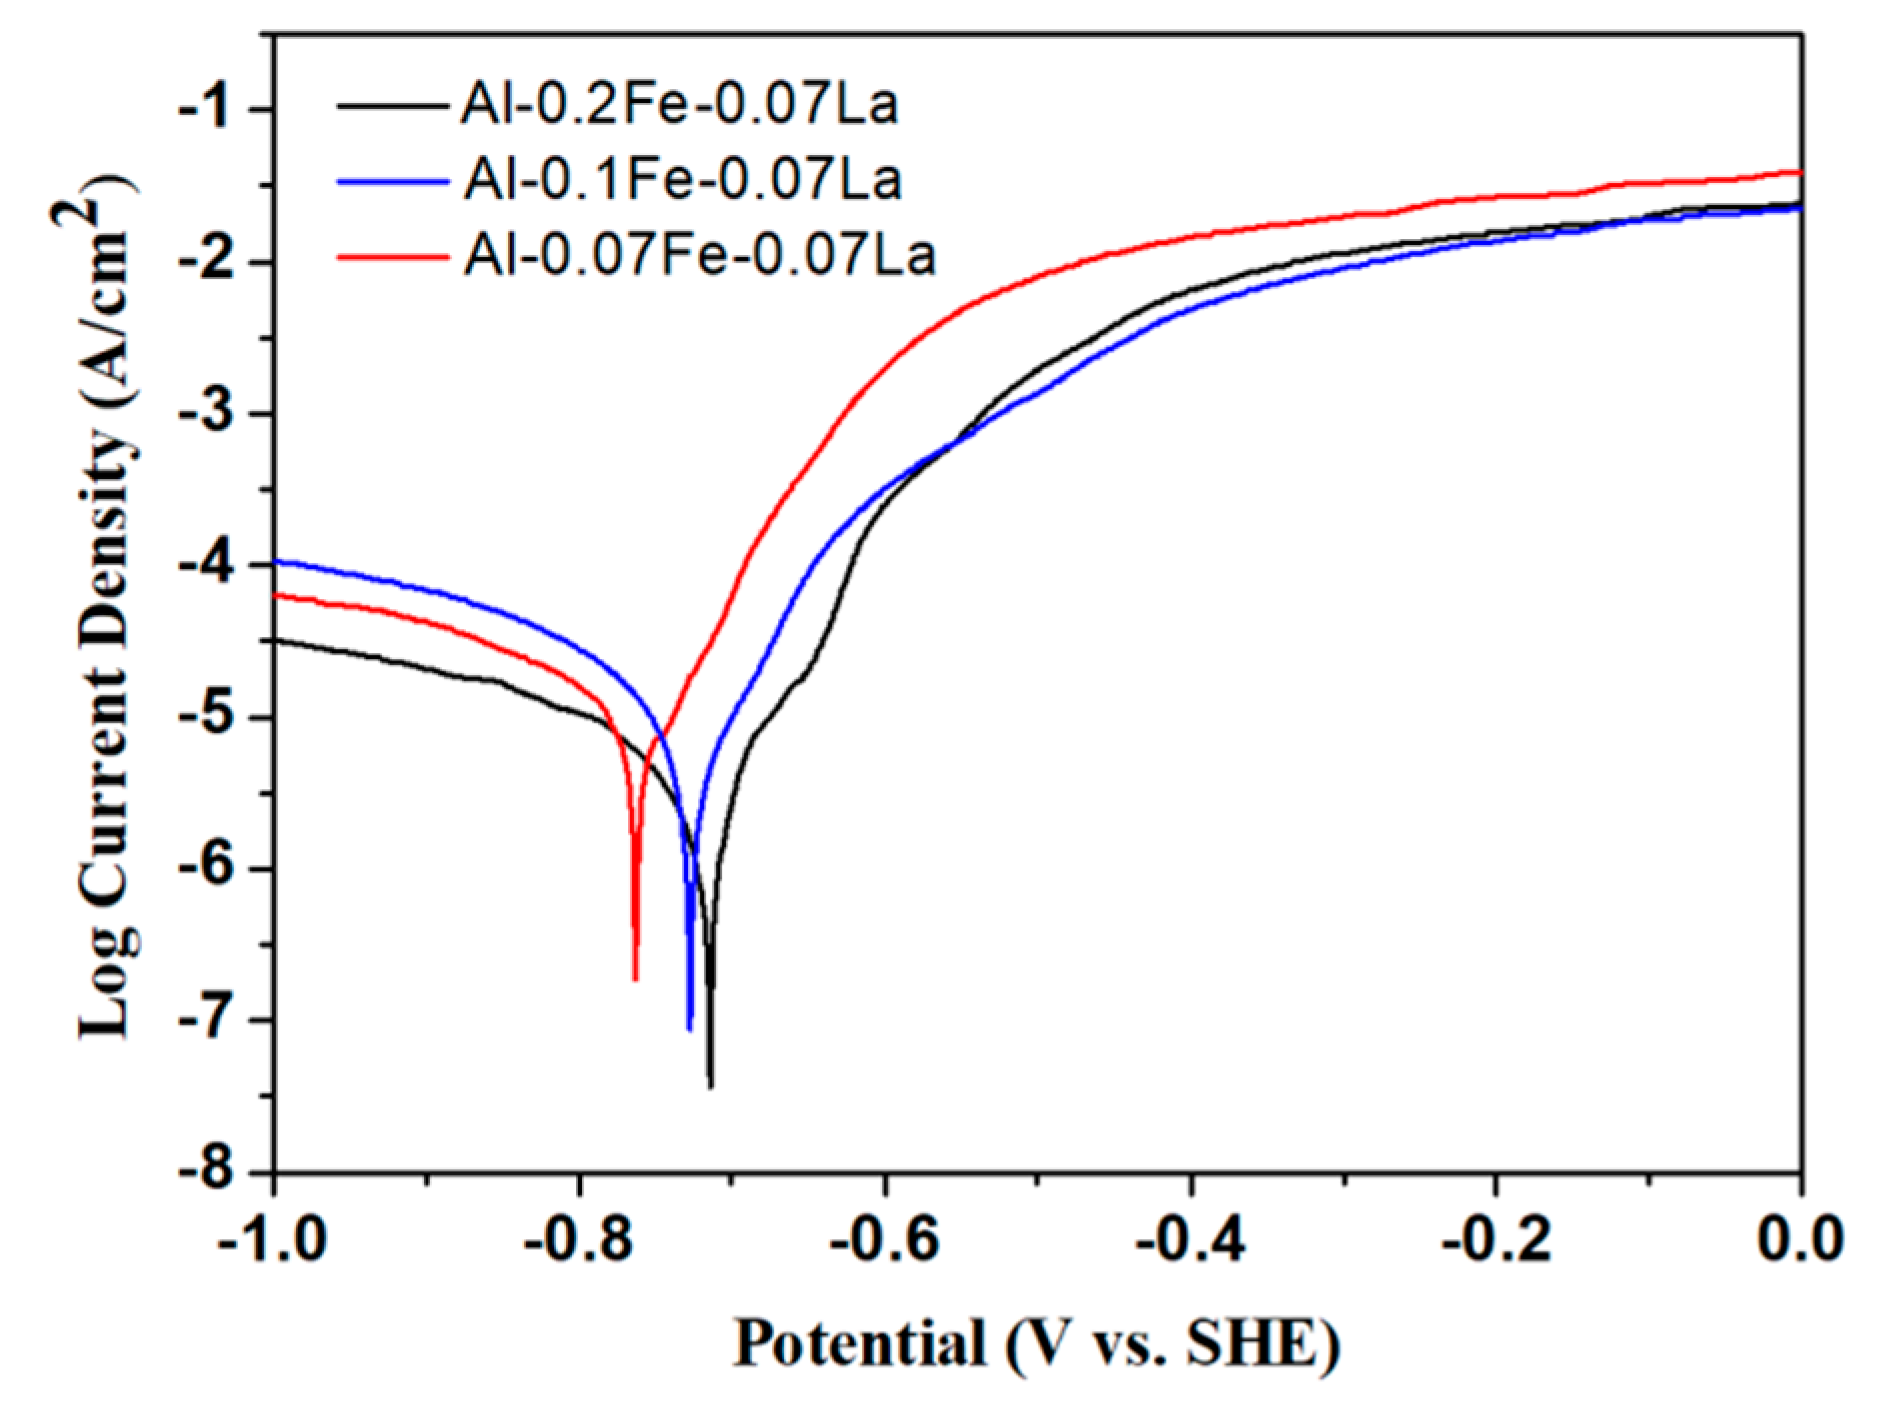
Figure 4 shows the typical Tafel polarization curves of the Al-xFe-0.07La alloy foils in 3.5% NaCl solution at room temperature. The corrosion potential (Ecorr) and corrosion current density (Icorr) obtained by analyzing the Tafel curves are listed in Table 2. From Figure 4, it can be seen that the Tafel curves of Al-xFe-0.07La alloys are similar in shape, and they are typical Tafel curves of an aluminum alloy. Ecorr characterizes the difficulty to corrode alloys. The lower the Ecorr is, the easier the alloy will be corroded. Icorr characterizes the corrosion degree of alloys. The higher the Icorr is, the higher the corrosion degree of the alloy is [24]. The results in Table 2 showed that with the increase of Fe content, Icorr of Al-xFe-0.07La alloys became smaller. Al-0.1Fe-0.07La alloy had much more positive Ecorr than that of Al-0.07Fe-0.07La alloy. Although Ecorr of Al-0.2Fe-0.07La alloy did not improve significantly compared to Al-0.1Fe-0.07La alloy when considering the error, Al-0.02Fe-0.07La alloy had much smaller Icorr than that of Al-0.1Fe-0.07La alloy. Therefore, the corrosion resistance of Al-0.2Fe-0.07La alloy was better than that of Al-0.1Fe-0.07La alloy. Therefore, the results of Figure 4 indicated that the corrosion resistance of Al-xFe-0.07La alloy was improved with the increase of Fe content but the improvement effects of Fe content may become smaller when the Fe content is large.
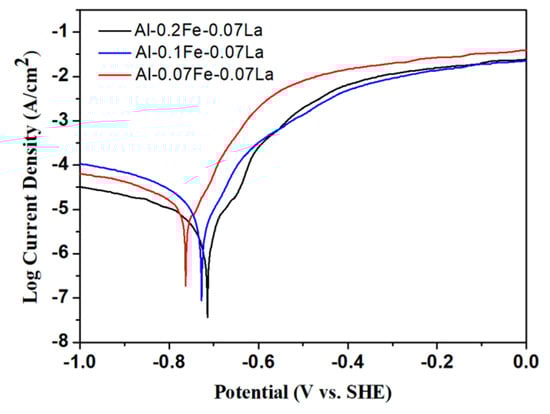
Figure 4.
Typical Tafel polarization curves of the Al-xFe-0.07La alloys in 3.5% NaCl solution.
Table 2.
Tafel polarization parameters of the Al-xFe-0.07La alloys in 3.5% NaCl solution.
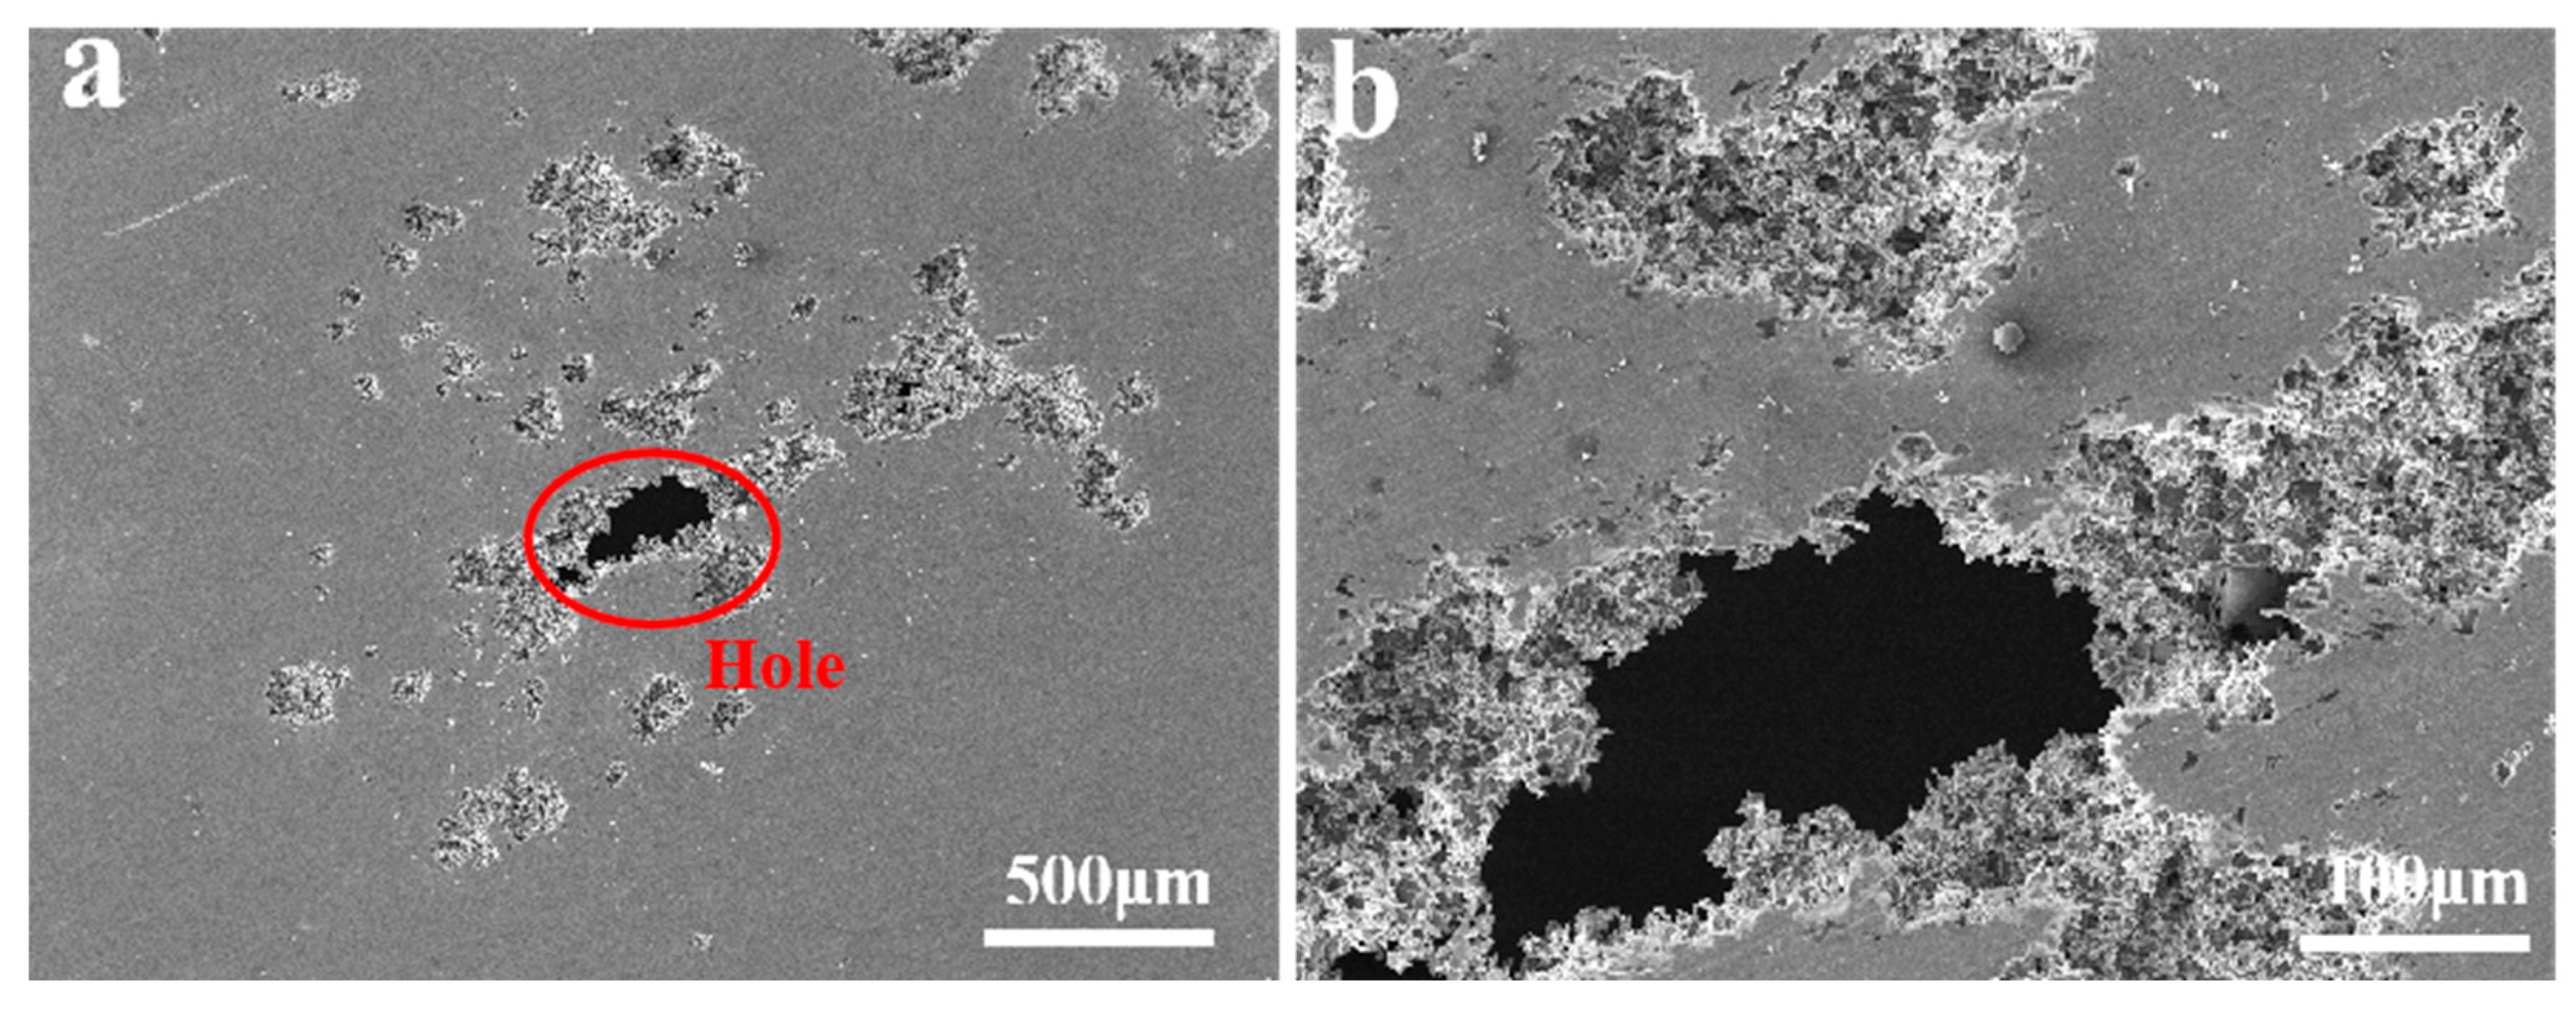
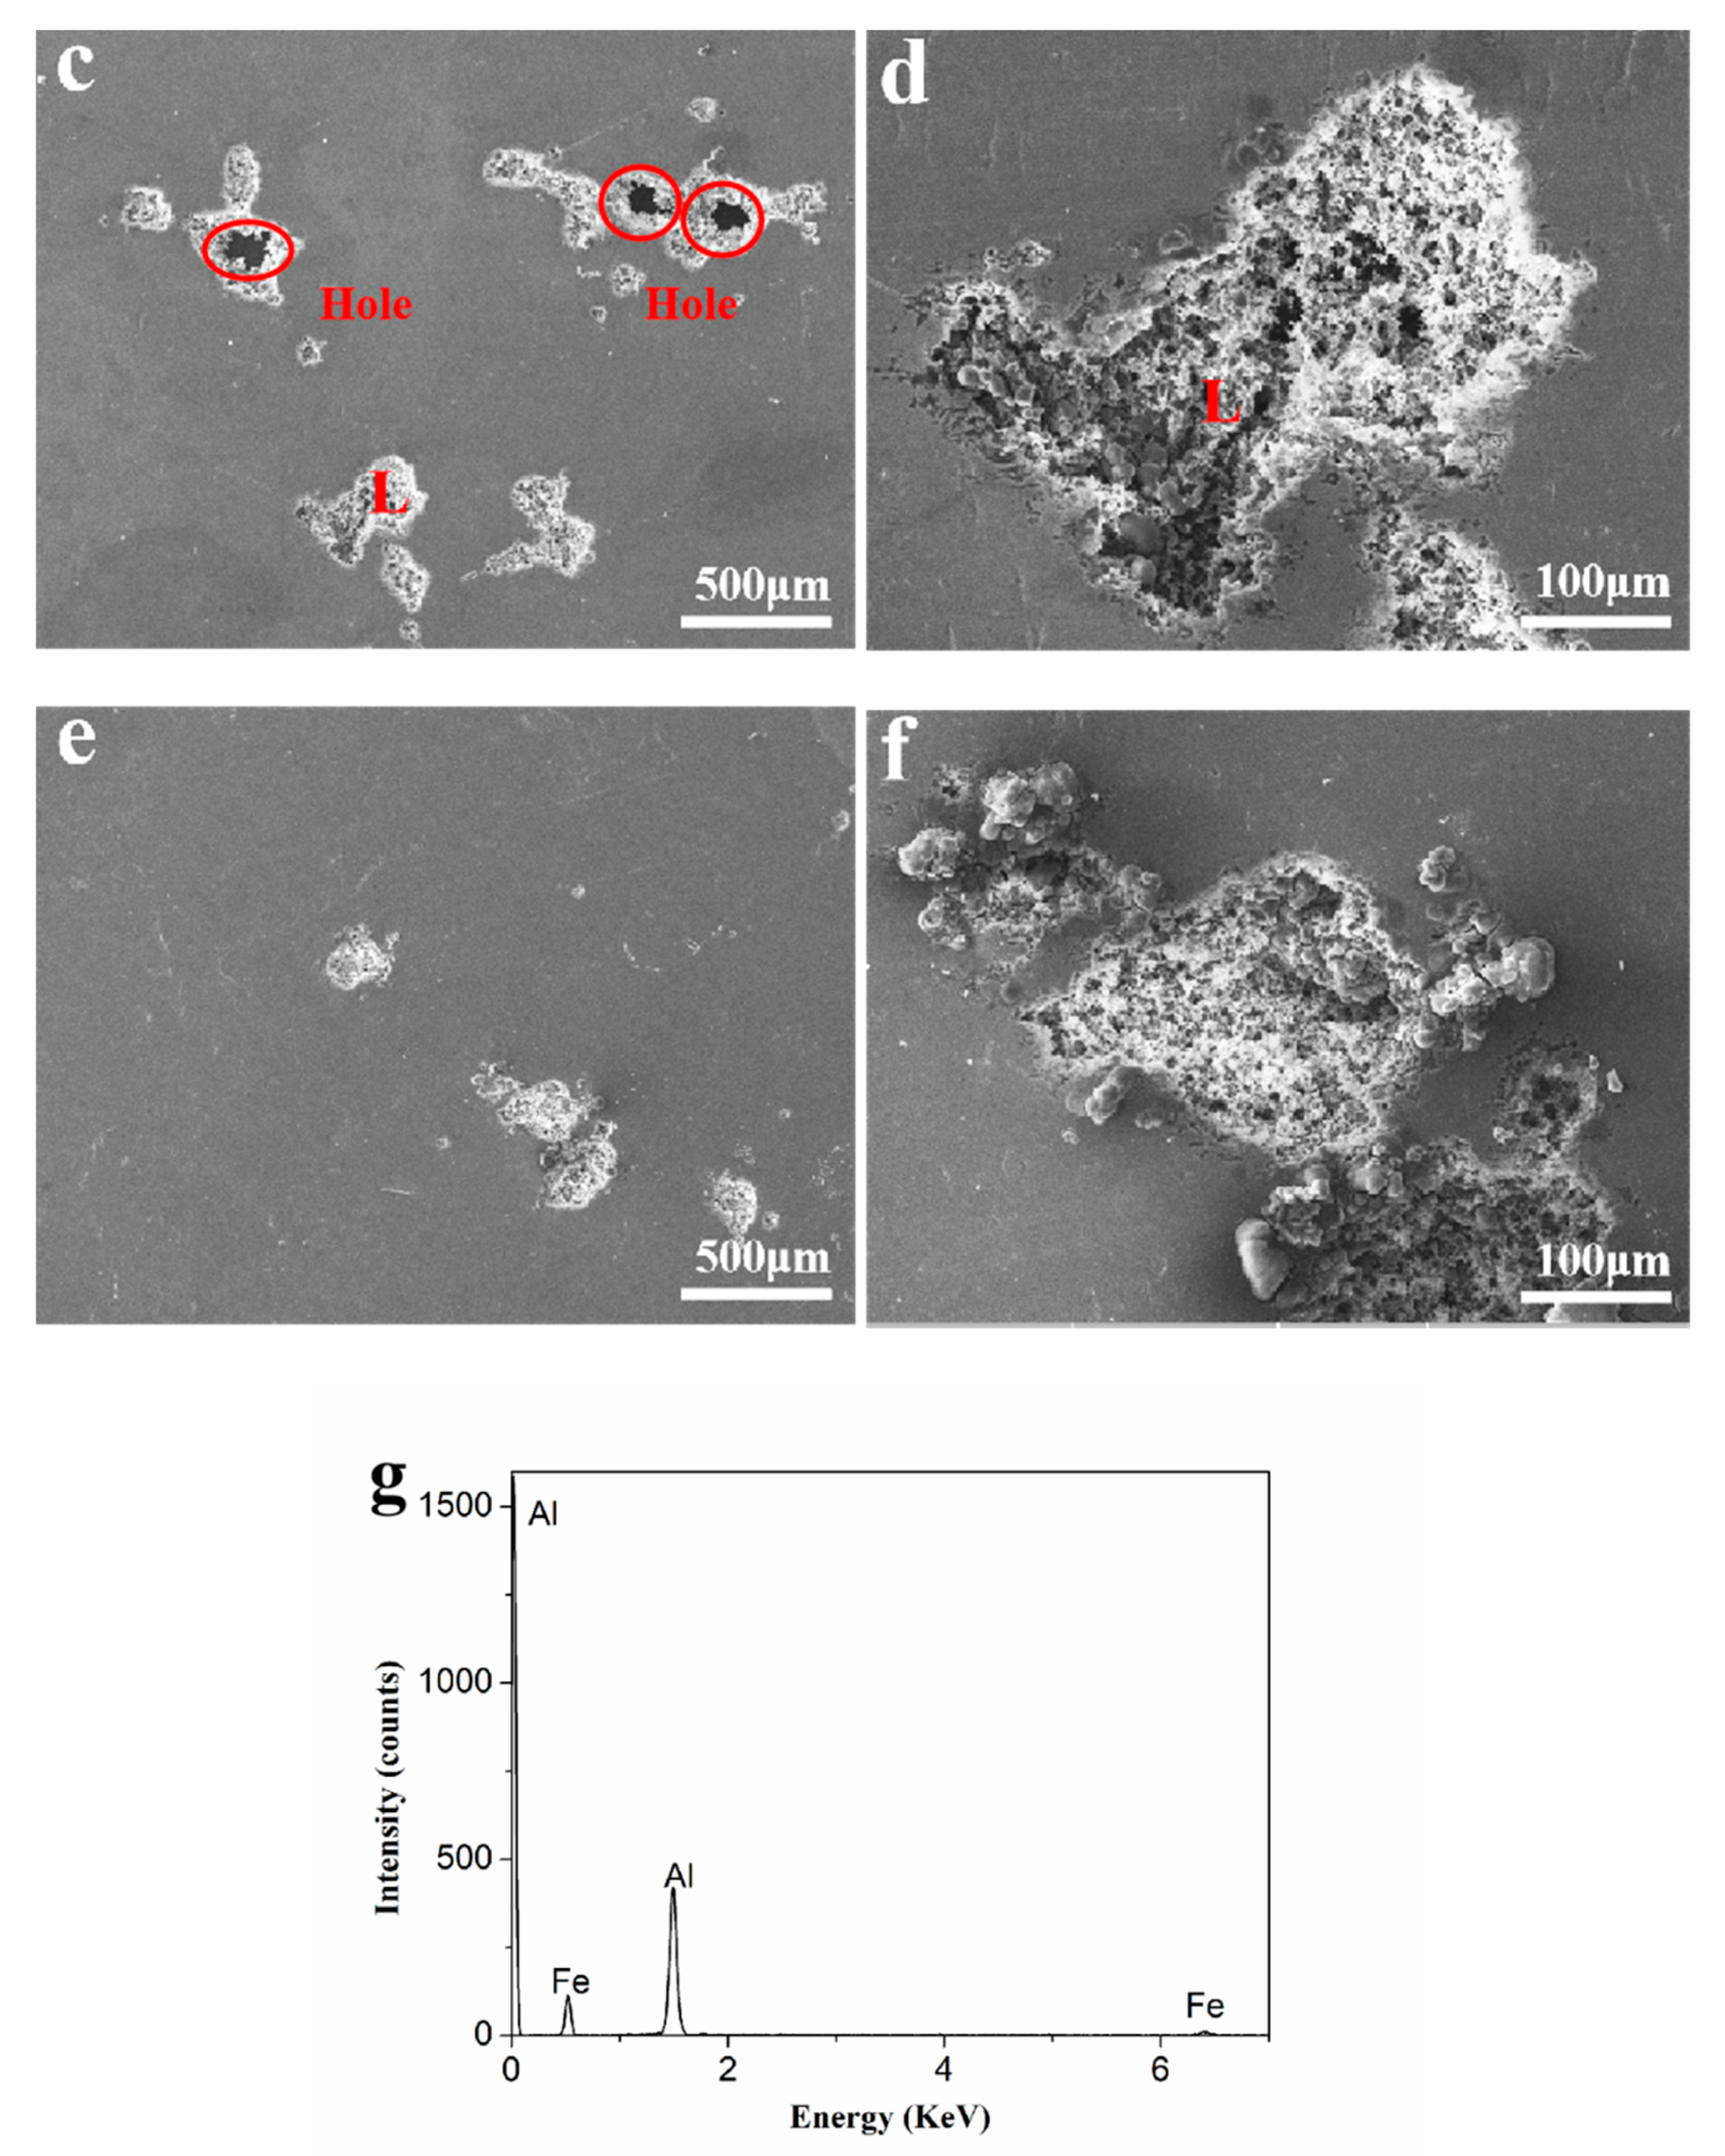
Figure 5 shows the corrosion surface morphology of the Al-xFe-0.07La alloy foils tested after Tafel testing. It can be seen from Figure 5a,c,e that all the alloys were pitting corrosion, but there were larger and deeper pits and even big holes on the corrosion surfaces of Al-0.07Fe-0.07La and Al-0.1Fe-0.07La alloy foils in comparison with the corrosion surface of Al-0.2Fe-0.07La alloy foil. With the increase of Fe content, the corrosion pits of Al-xFe-0.07La alloy became smaller and the corrosion degree was lighter, which was consistent with the results of Tafel curves. The corrosion pit L of Al-0.1Fe-0.07La alloy was analyzed by EDS (Figure 5g). It was found that the Fe-rich phase was the main phase at corrosion pit L.
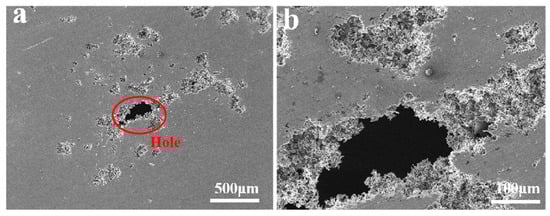

Figure 5.
Corrosion surface morphology of the Al-xFe-0.07La alloy foils in 3.5% NaCl solution: (a,b) Al-0.07Fe-0.07La; (c,d) Al-0.1Fe-0.07La; (e,f) Al-0.2Fe-0.07La; (g) EDS analysis of corrosion pit L.
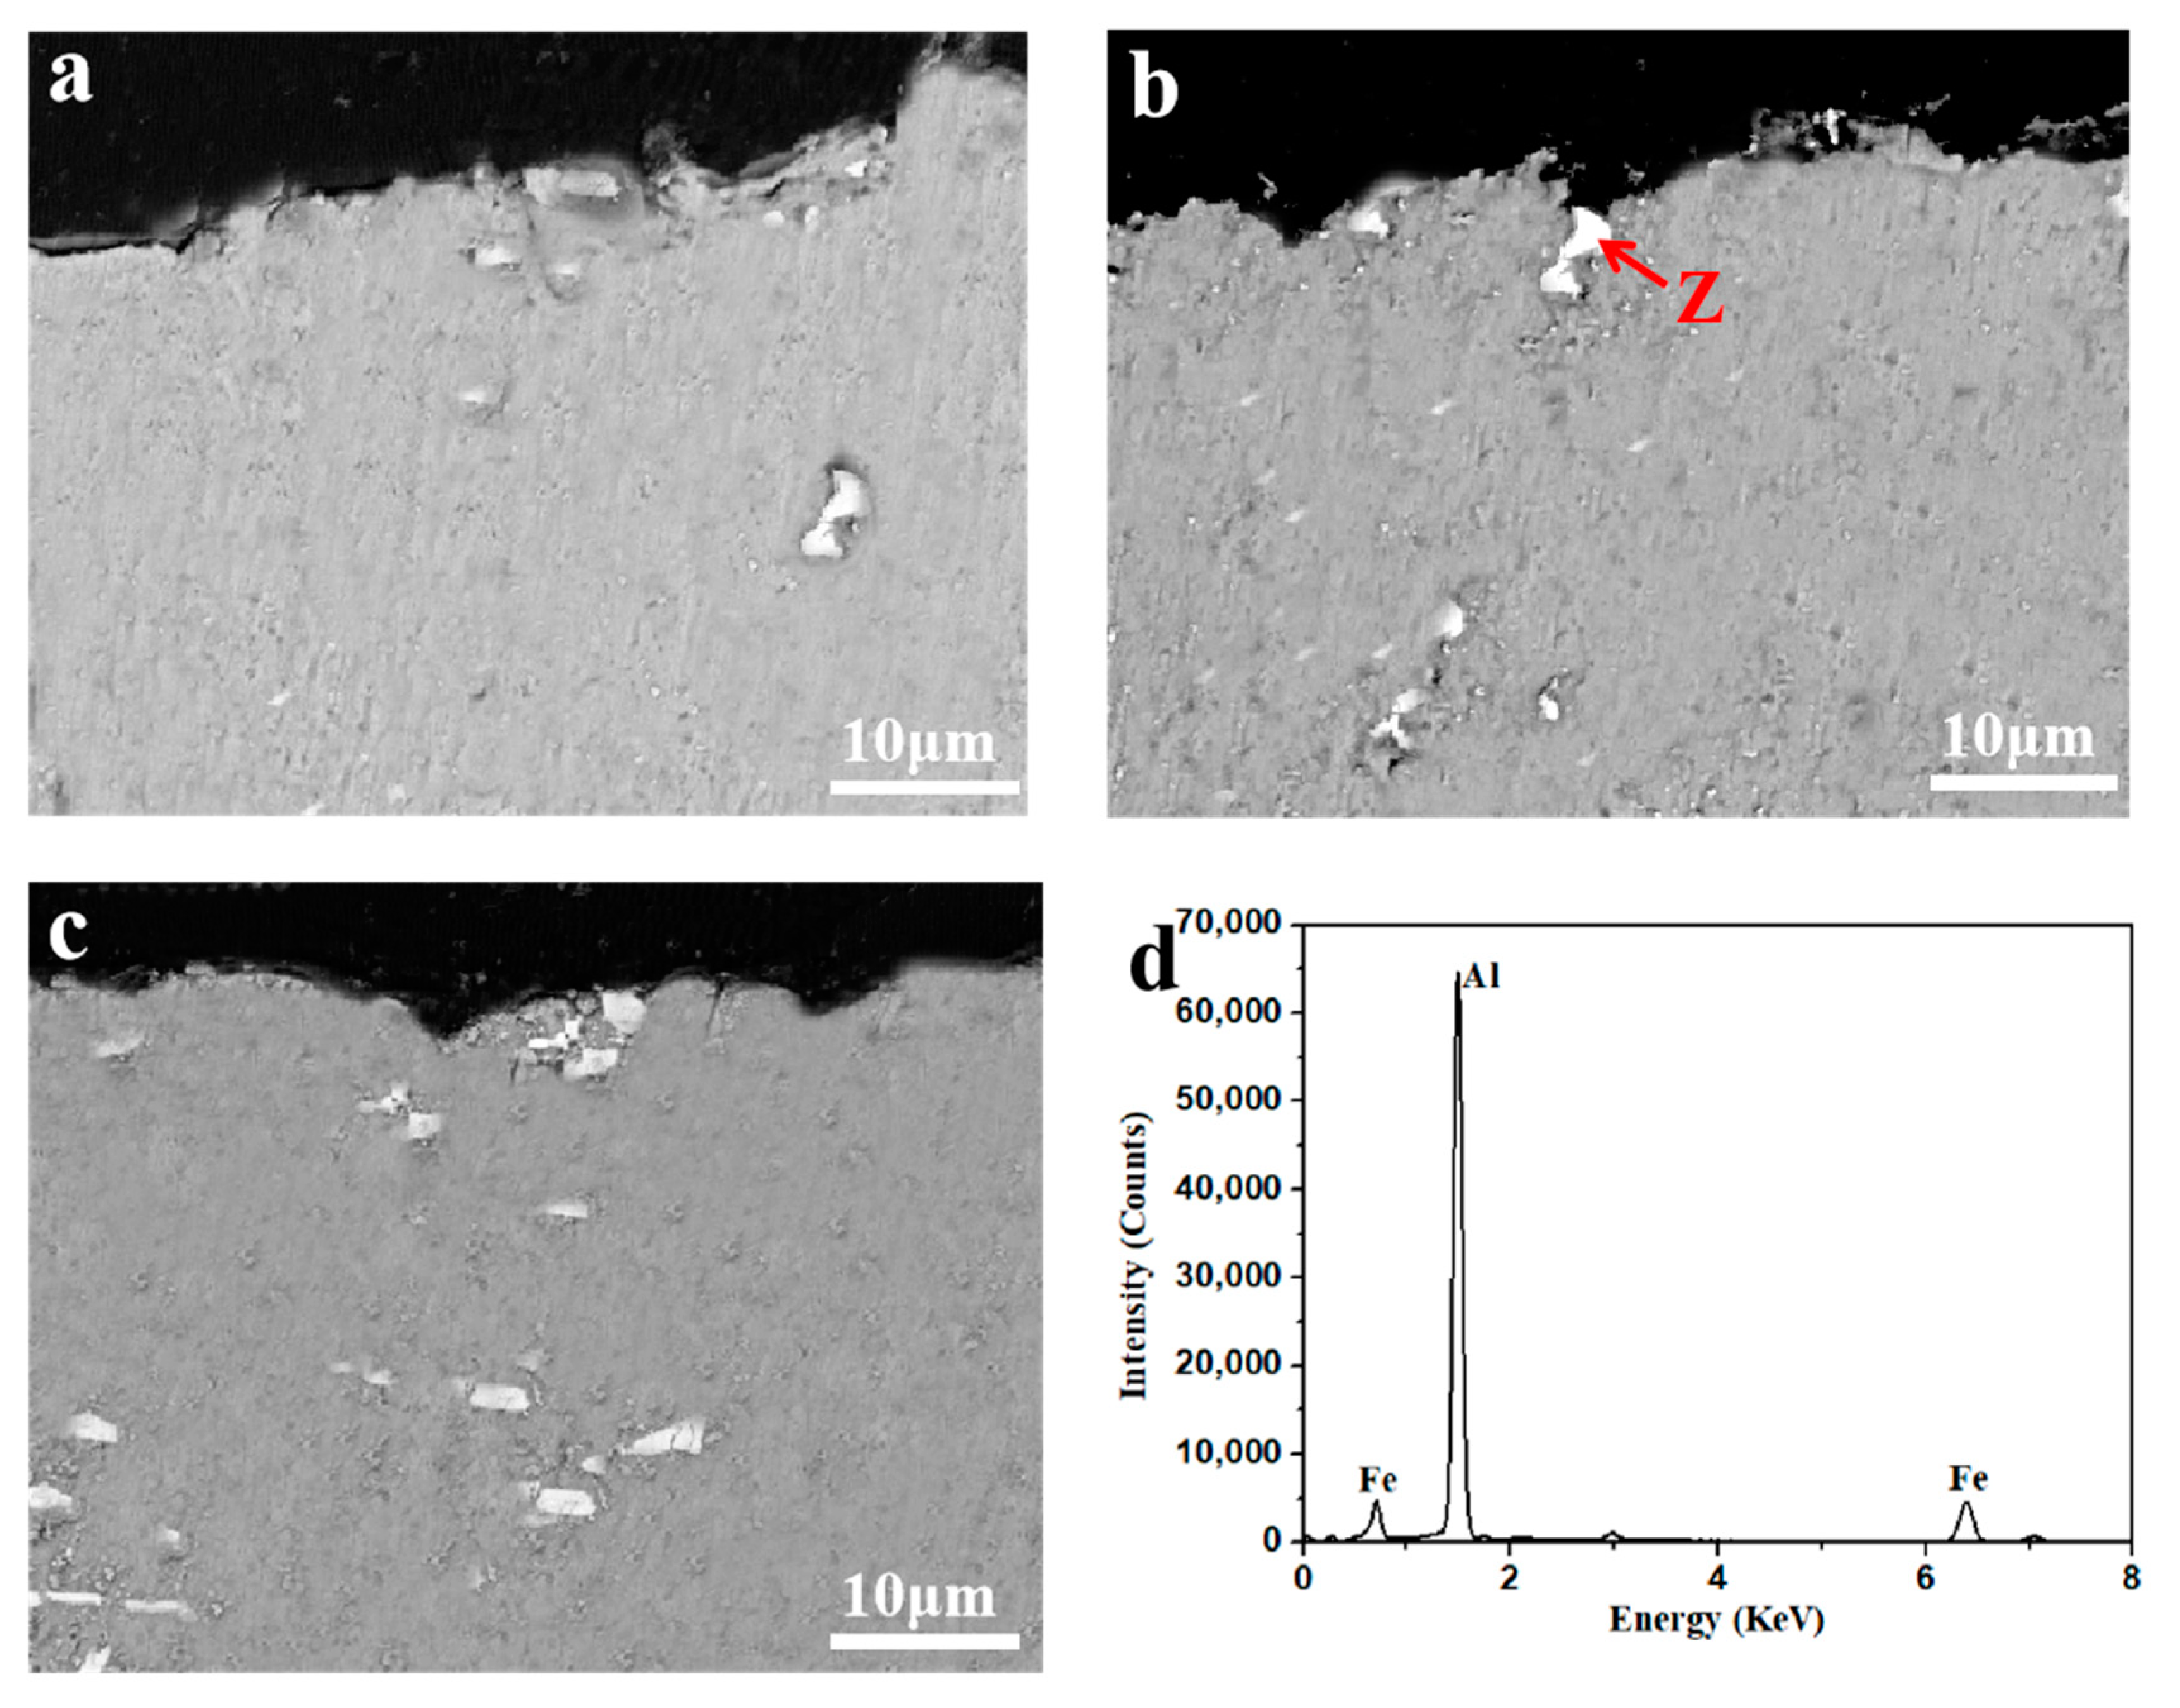
Figure 6 shows corrosion cross sectional SEM/BSE images of the Al-xFe-0.07La alloy foils in 3.5% NaCl solution and the EDS analysis of phase Z. It could be seen that there were white phases in the corrosion pits of the three kinds of alloys. The EDS analyses had been conducted in these phases and these phases were found to be AlFe phases. Thus, we could infer that the corrosion origins of Al-xFe-0.07La alloy foils were AlFe phases. Because of the potential difference between the Fe-rich phase and the aluminum matrix, corrosion was more likely to occur in the second phase which was rich in Fe [4,25]. As a local cathode, the AlFe phase aggravated the cathodic reaction in the alloy, resulting in local alkalization around the Fe-rich phase [26,27]. Although the number of AlFe phases in the Al-xFe-0.07La alloys increased with the increase of Fe content, the size of AlFe phases in Al-xFe-0.07La alloys became smaller and more uniform with the increase of Fe content. Fine and uniform second phases are beneficial to improve the electrochemical performance of the alloys [19].
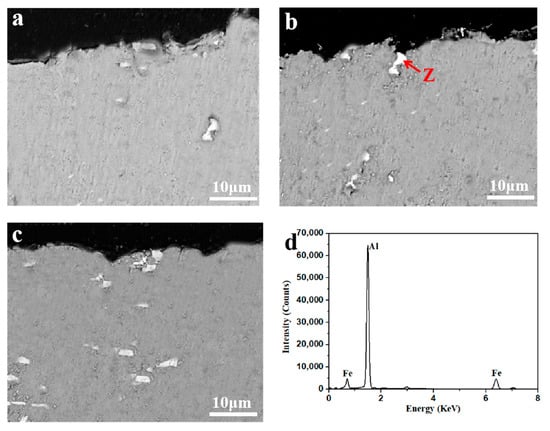
Figure 6.
Corrosion cross sectional SEM/BSE images of the Al-xFe-0.07La alloy foils in 3.5% NaCl solution: (a) Al-0.07Fe-0.07La; (b) Al-0.1Fe-0.07La; (c) Al-0.2Fe-0.07La; (d) EDS analysis of phase Z.
4. Conclusions
The effect of Fe content on the microstructure, tensile strength and electrochemical performance of Al-xFe-0.07La (x = 0.07, 0.1, 0.2) aluminum alloy foils was studied. With the increase of Fe content, the yield strength and tensile strength of Al-xFe-0.07La alloy foils increased greatly and the electrochemical performance of Al-xFe-0.07La alloy foils also improved. Especially the yield strength and tensile strength of Al-0.2Fe-0.07La alloy respectively increased by 51.19% and 58.48%, and the elongation also increased by 88.41% compared to Al-0.07Fe-0.07La alloy. Besides, Al-0.2Fe-0.07La alloy had much more positive Ecorr and much smaller Icorr than those of Al-0.07Fe-0.07La alloy. This was because with the increase of Fe content, the second phases in Al-0.2Fe-0.07La alloy were more numerous and more dispersed. The finely dispersed second phases helped to improve the microstructure, the mechanical and the electrochemical performance of the alloy [16,17,18,19,20,21]. In this work, only the effects of trace Fe element (Fe wt.% ≤ 0.2) on Al-xFe-0.07La alloy had been explored. Due to the fact that the tensile strength of Al-0.2Fe-0.07La alloy was enough for the application of aluminum current collector of lithium-ion batteries and more, the Fe element might worsen the electric conductivity of Al-xFe-0.07La alloy according to previous work [9,10,11,12,13,14,15].
Author Contributions
Conceptualization, D.D.; formal analysis, Y.G., G.C., Y.H., J.T., W.Z.; investigation, X.Y., Z.W., Y.X., and R.C.; writing—original draft preparation, X.Y.; writing—review and editing, X.Y. and D.D.; project administration, D.D.
Funding
This work was supported by Shanghai Excellent Technical Leader Project (No. 15XD1524600).
Acknowledgments
The authors would like to thank the Instrumental Analysis Center of Shanghai Jiao Tong University for SEM experiments.
Conflicts of Interest
The authors declare no conflicts of interest.
References
- Manthiram, A. Materials challenges and opportunities of lithium ion batteries. J. Phys. Chem. Lett. 2011, 2, 176–184. [Google Scholar] [CrossRef]
- Iwakura, C.; Fukumoto, Y.; Inoue, H.; Ohashi, S.; Kobayashi, S.; Tada, H.; Abe, M. Electrochemical characterization of various metal foils as a current collector of positive electrode for rechargeable lithium batteries. J. Power Sour. 1997, 68, 301–303. [Google Scholar] [CrossRef]
- Whitehead, A.H.; Schreiber, M. Current collectors for positive electrodes of lithium-based batteries. J. Electrochem. Soc. 2006, 152, A2105. [Google Scholar] [CrossRef]
- Church, B.C.; Kaminski, D.T.; Jiang, J. Corrosion of aluminum electrodes in aqueous slurries for lithium-ion batteries. J. Mater. Sci. 2014, 49, 3234–3241. [Google Scholar] [CrossRef]
- Raghavan, V. Al-Fe-La (Aluminum-Iron-Lanthanum). J. Phase Equilibria 2001, 22, 566–567. [Google Scholar] [CrossRef]
- Li, G.; Bian, X.; Song, K.; Guo, J.; Li, X.; Wang, C. Effect of Si addition on glass forming ability and thermal stability of Al–Fe–La alloys. J. Alloys Compd. 2009, 471, L47–L50. [Google Scholar] [CrossRef]
- Liang, Y.H.; Shi, Z.M.; Li, G.W.; Zhang, R.Y.; Zhao, G. Effects of Er addition on the crystallization characteristic and microstructure of Al-2wt%Fe cast alloy. J. Alloys Compd. 2019, 781, 235–244. [Google Scholar] [CrossRef]
- Lai, X.F.; Peng, H.P.; Wang, J.H.; Wu, C.J.; Tu, H.; Liu, Y.; Su, X.P. Effect of La on intermetallic layer of galvalume. Surf. Eng. 2013, 29, 390–395. [Google Scholar] [CrossRef]
- Miyake, J.; Fine, M.E. Electrical conductivity versus strength in a precipitation hardened alloy. Acta Metall. Mater. 1992, 40, 733–741. [Google Scholar] [CrossRef]
- Kino, T.; Endo, T.; Kawata, S. Deviations from matthiessen’s rule of the electrical resistivity of dislocations in aluminum. J. Phys. Soc. Jpn. 1974, 36, 698–705. [Google Scholar] [CrossRef]
- Han, K.; Walsh, R.P.; Ishmaku, A.; Toplosky, V.; Brandao, L.; Embury, J.D. High strength and high electrical conductivity bulk Cu. Philos. Mag. 2004, 84, 3705–3716. [Google Scholar] [CrossRef]
- Valiev, R.Z.; Murashkin, M.Y.; Sabirov, I. A nanostructural design to produce high-strength Al alloys with enhanced electrical conductivity. Scr. Mater. 2014, 76, 13–16. [Google Scholar] [CrossRef]
- Sauvage, X.; Bobruk, E.V.; Murashkin, M.Y.; Nasedkina, Y.N.; Enikeev, A.R.; Valiev, Z. Optimization of electrical conductivity and strength combination by structure design at the nanoscale in Al-Mg-Si alloys. Acta Mater. 2015, 98, 355–366. [Google Scholar] [CrossRef]
- Hou, J.P.; Wang, Q.; Zhang, Z.J.; Tian, Y.Z.; Wu, X.M.; Yang, H.J.; Li, X.W.; Zhang, Z.F. Nano-scale precipitates: the key to high strength and high conductivity in Al alloy wire. Mater. Des. 2017, 132, 148–157. [Google Scholar] [CrossRef]
- Hou, J.P.; Wang, Q.; Zhang, Z.J.; Tian, Y.Z.; Wu, X.M.; Yang, H.J.; Li, X.W.; Zhang, Z.F. Breaking the trade-off relation of strength and electrical conductivity in pure Al wire by controlling texture and grain boundary. J. Alloys Compd. 2018, 769, 96–109. [Google Scholar] [CrossRef]
- Sherby, O.D.; Taleff, E.M. Influence of grain size, solute atoms and second-phase particles on creep behavior of polycrystalline solids. Mater. Sci. Eng. A 2002, 322, 89–99. [Google Scholar] [CrossRef]
- Yamanaka, A.; Okamoto, M. Grain growth in a system containing finely dispersed mobile second-phase particles: a GPU-accelerated multi-phase-field study. In Proceedings of the 6th International Conference on Recrystallization and Grain Growth (ReX&GG 2016), Pittsburgh, PA, USA, 17–21 July 2016. [Google Scholar]
- Brunner, J.G.; Birbilis, N.; Ralston, K.D.; Virtanen, S. Impact of ultrafine-grained microstructure on the corrosion of aluminium alloy AA2024. Corros. Sci. 2012, 57, 209–214. [Google Scholar] [CrossRef]
- Ralston, K.D.; Fabijanic, D.; Birbilis, N. Effect of grain size on corrosion of high purity aluminium. Electrochim. Acta 2011, 56, 1729–1736. [Google Scholar] [CrossRef]
- Mi, G.F.; Dong, C.F.; Zhao, D.W. Effect of different cooling speed and rare earth La on the microstructures and phase constitution of Al-Fe alloy. Appl. Mech. Mater. 2010, 44–47, 2126–2130. [Google Scholar] [CrossRef]
- Khan, M.; Amjad, M.; Khan, A.; Ud-Din, R.; Ahmad, I.; Subhani, T. Microstructural evolution, mechanical profile, and fracture morphology of aluminum matrix composites containing graphene nanoplatelets. J. Mater. Res. 2017, 32, 2055–2066. [Google Scholar] [CrossRef]
- Srivatsan, T.S.; Sriram, S.; Veeraraghavan, D.; Vasudevan, V.K. Microstructure, tensile deformation and fracture behaviour of aluminium alloy 7055. J. Mater. Sci. 1997, 32, 2883–2894. [Google Scholar] [CrossRef]
- Zhang, J.C.; Ding, D.Y.; Xu, X.L.; Gao, Y.J.; Chen, G.Z.; Chen, W.G.; You, X.H.; Huang, Y.W.; Tang, J.S. Effect of Ce addition on the mechanical and electrochemical properties of a lithium battery shell alloy. J. Alloys Compd. 2014, 617, 665–669. [Google Scholar] [CrossRef]
- Zhang, R.; Ding, D.Y.; Zhang, W.L.; Gao, Y.J.; Wu, Z.L.; Chen, G.Z.; Chen, R.Z.; Huang, Y.W.; Tang, J.S. Al-1.5Fe-xLa alloys for lithium-ion battery package. Metals (Basel) 2018, 8, 890. [Google Scholar] [CrossRef]
- Seri, O.; Furumata, K. Effect of Al-Fe-Si intermetallic compound phases on initiation and propagation of pitting attacks for aluminum 1100. Mater. Corros. 2002, 53, 111–120. [Google Scholar] [CrossRef]
- Park, J.O. Influence of Fe-Rich Intermetallic inclusions on pit initiation on aluminum alloys in aerated NaCl. J. Electrochem. Soc. 1999, 146, 517. [Google Scholar] [CrossRef]
- Nişancioğlu, K. Electrochemical behavior of aluminum-base intermetallics containing iron. J. Electrochem. Soc. 2006, 137, 69. [Google Scholar] [CrossRef]

© 2019 by the authors. Licensee MDPI, Basel, Switzerland. This article is an open access article distributed under the terms and conditions of the Creative Commons Attribution (CC BY) license (http://creativecommons.org/licenses/by/4.0/).