Article

Fretting-Fatigue Analysis of Shot-Peened Al 7075-T651 Test Specimens

Department of Mechanical Engineering, University of Seville, 41004 Sevilla, Spain
*
Author to whom correspondence should be addressed.
Metals 2019, 9(5), 586; https://doi.org/10.3390/met9050586
Submission received: 25 April 2019 / Revised: 16 May 2019 / Accepted: 17 May 2019 / Published: 21 May 2019
(This article belongs to the Special Issue Recent Advances on Fretting Fatigue)

Abstract

:
Shot peening is a mechanical treatment that induces several changes in the material: surface roughness, increased hardness close to the surface, and, the most important, compressive residual stresses. This paper analyzes the effect of this treatment on alloy Al 7075-T651 in the case of fretting fatigue with cylindrical contact through the results of 114 fretting fatigue tests. There are three independent loads applied in this type of test: a constant normal load N, pressing the contact pad against the specimen; a cyclic bulk stress σ in the specimen; and a cyclic tangential load Q through the contact. Four specimens at each of 23 different combinations of these three parameters were tested—two specimens without any treatment and two treated with shot peening. The fatigue lives, contact surface, fracture surface, and residual stresses and hardness were studied. Improvement in fatigue life ranged from 3 to 22, depending on fatigue life. The relaxation of residual-stress distribution related to the number of applied cycles was also measured. Finally, another group of specimens treated with shot peening was polished and tested, obtaining similar lives as in the tests with specimens that were shot-peened but not polished.

1. Introduction

Fretting is a phenomenon produced when two elements in contact under pressure are subjected to very small amplitude relative displacements. The amplitude of those relative displacements is usually in the microns or tens of microns. The normal contact pressure and the shear tractions produced by the interaction between the contact surfaces usually produce a high-stress field close to the contact that cyclically varies with the relative displacements. These varying stresses initiate cracks that grow through the zone where stresses are high enough. The relative displacements are generally produced by global loads or displacements applied to the elements in contact—loads that also generate a global stress field. If the global stress field, far from the contact, is small, the initiated cracks stop growing when they reach a low-stress zone. In this case, the effect of fretting is only wear and the phenomenon is called fretting wear. However, if the global stress field is high enough, the initiated cracks continue growing until final failure. In this case, the phenomenon is called fretting fatigue. There are many examples of mechanical elements prone to fretting-fatigue failure, such as bolted joints, rotor-blade dovetail connections, metal cables, or shrink-fitted couplings [1,2].
There are some aspects that make fretting fatigue different to plain fatigue. First, there is a very high stress gradient near the contact zone, with stresses decreasing steeply with the distance to the contact zone. These gradients are similar to those produced by small notches. Another particular characteristic of the stress field produced in fretting is the multiaxiality and nonproportionality of the stress-field variation, even when all loads and displacements vary in phase. This nonproportionality of the stresses is especially high very close to the contact surfaces [3]. There are other characteristic aspects, such as the wear produced during fretting, the influence of the friction coefficient, and the stress-level variation during the process [4,5,6].
Considering the importance of fretting-fatigue failures and their differences with plain fatigue, it is important to understand the phenomenon and the effect of different parameters in order to avoid or reduce the produced damage. There are many different proposed design solutions to reduce or avoid fretting-fatigue damage. Some of them are based on design modifications to eliminate or reduce contact stresses, and others try to modify the material or contact-surface properties [7,8], such as coatings [9,10] or thermochemical [11] or mechanical surface treatments. Among those solutions, one important group is that of mechanical treatments, producing compressive residual stresses in the zone where the fretting crack initiates and initially grows. In this group, we can include deep rolling, burnishing, laser-shock peening, and shot peening [12,13,14,15,16]. Among these treatments, the most used in the industry nowadays is shot peening, which is widely used mainly because it is easy to apply to pieces of many different geometries [17,18,19,20].
The shot-peening treatment is a cold work process carried out by projecting small balls at a high speed on the surface of the piece. This causes high plastic deformation on the external layer of the piece, generating compressive residual stresses close to the surface. These stresses may be as high as the yield strength, but only very near to the surface, decreasing their value with a steep gradient, so that they are close to zero at depths of about 200 to 400 µm, with the maximum usually between 25 and 100 µm. The intensity and distribution of residual stress depends on many parameters, such as ball diameter, material, and velocity, piece material, projection direction, and process duration.
These compressive stresses exist only in the zone where the stresses produced by fretting are also higher. Therefore, they diminish the peak stresses produced by the contact by an amount equal to the residual compressive stress, lessening the damage by reducing the tendency of cracks to initiate and grow while they are small enough to be inside the compressive stress layer. However, these beneficial compressive stresses may relax in more or less of an amount depending on the stress level produced by the fretting phenomenon, or by high temperatures sustained for long enough to produce a relaxation process.
However, the plastic strain produced by the impact of the balls also produces some other effects. It generates a transformation of the material close to the surface, increasing the density of dislocations, causing a hardening effect. The new microstructure has many new barriers for the new dislocations generated by the variable stresses, as well as for cracks to grow, producing another beneficial effect. In addition, shot peening produces a high roughness on the work piece surface, which is detrimental in plain fatigue. However, it is not clear if the effect is produced by the roughness in the case of fretting fatigue [18,21].
For the particular case of high strength aluminum alloys, the effect produced by shot peening on fatigue life has been demonstrated to be beneficial in many situations, such as plain fatigue [22,23], notch fatigue [24,25], and especially notable in fretting fatigue [16,26,27].
The objective of this paper is to analyze the effect of shot peening in general, as well as for each one of the main transformations produced by the treatment, such as residual stress and its relaxation, hardening, or roughness on the fretting-fatigue strength of Al 7075-T651. This analysis was carried out by testing specimens with different treatments, trying to separate the effect of each one of these transformations.

2. Experiment Setup

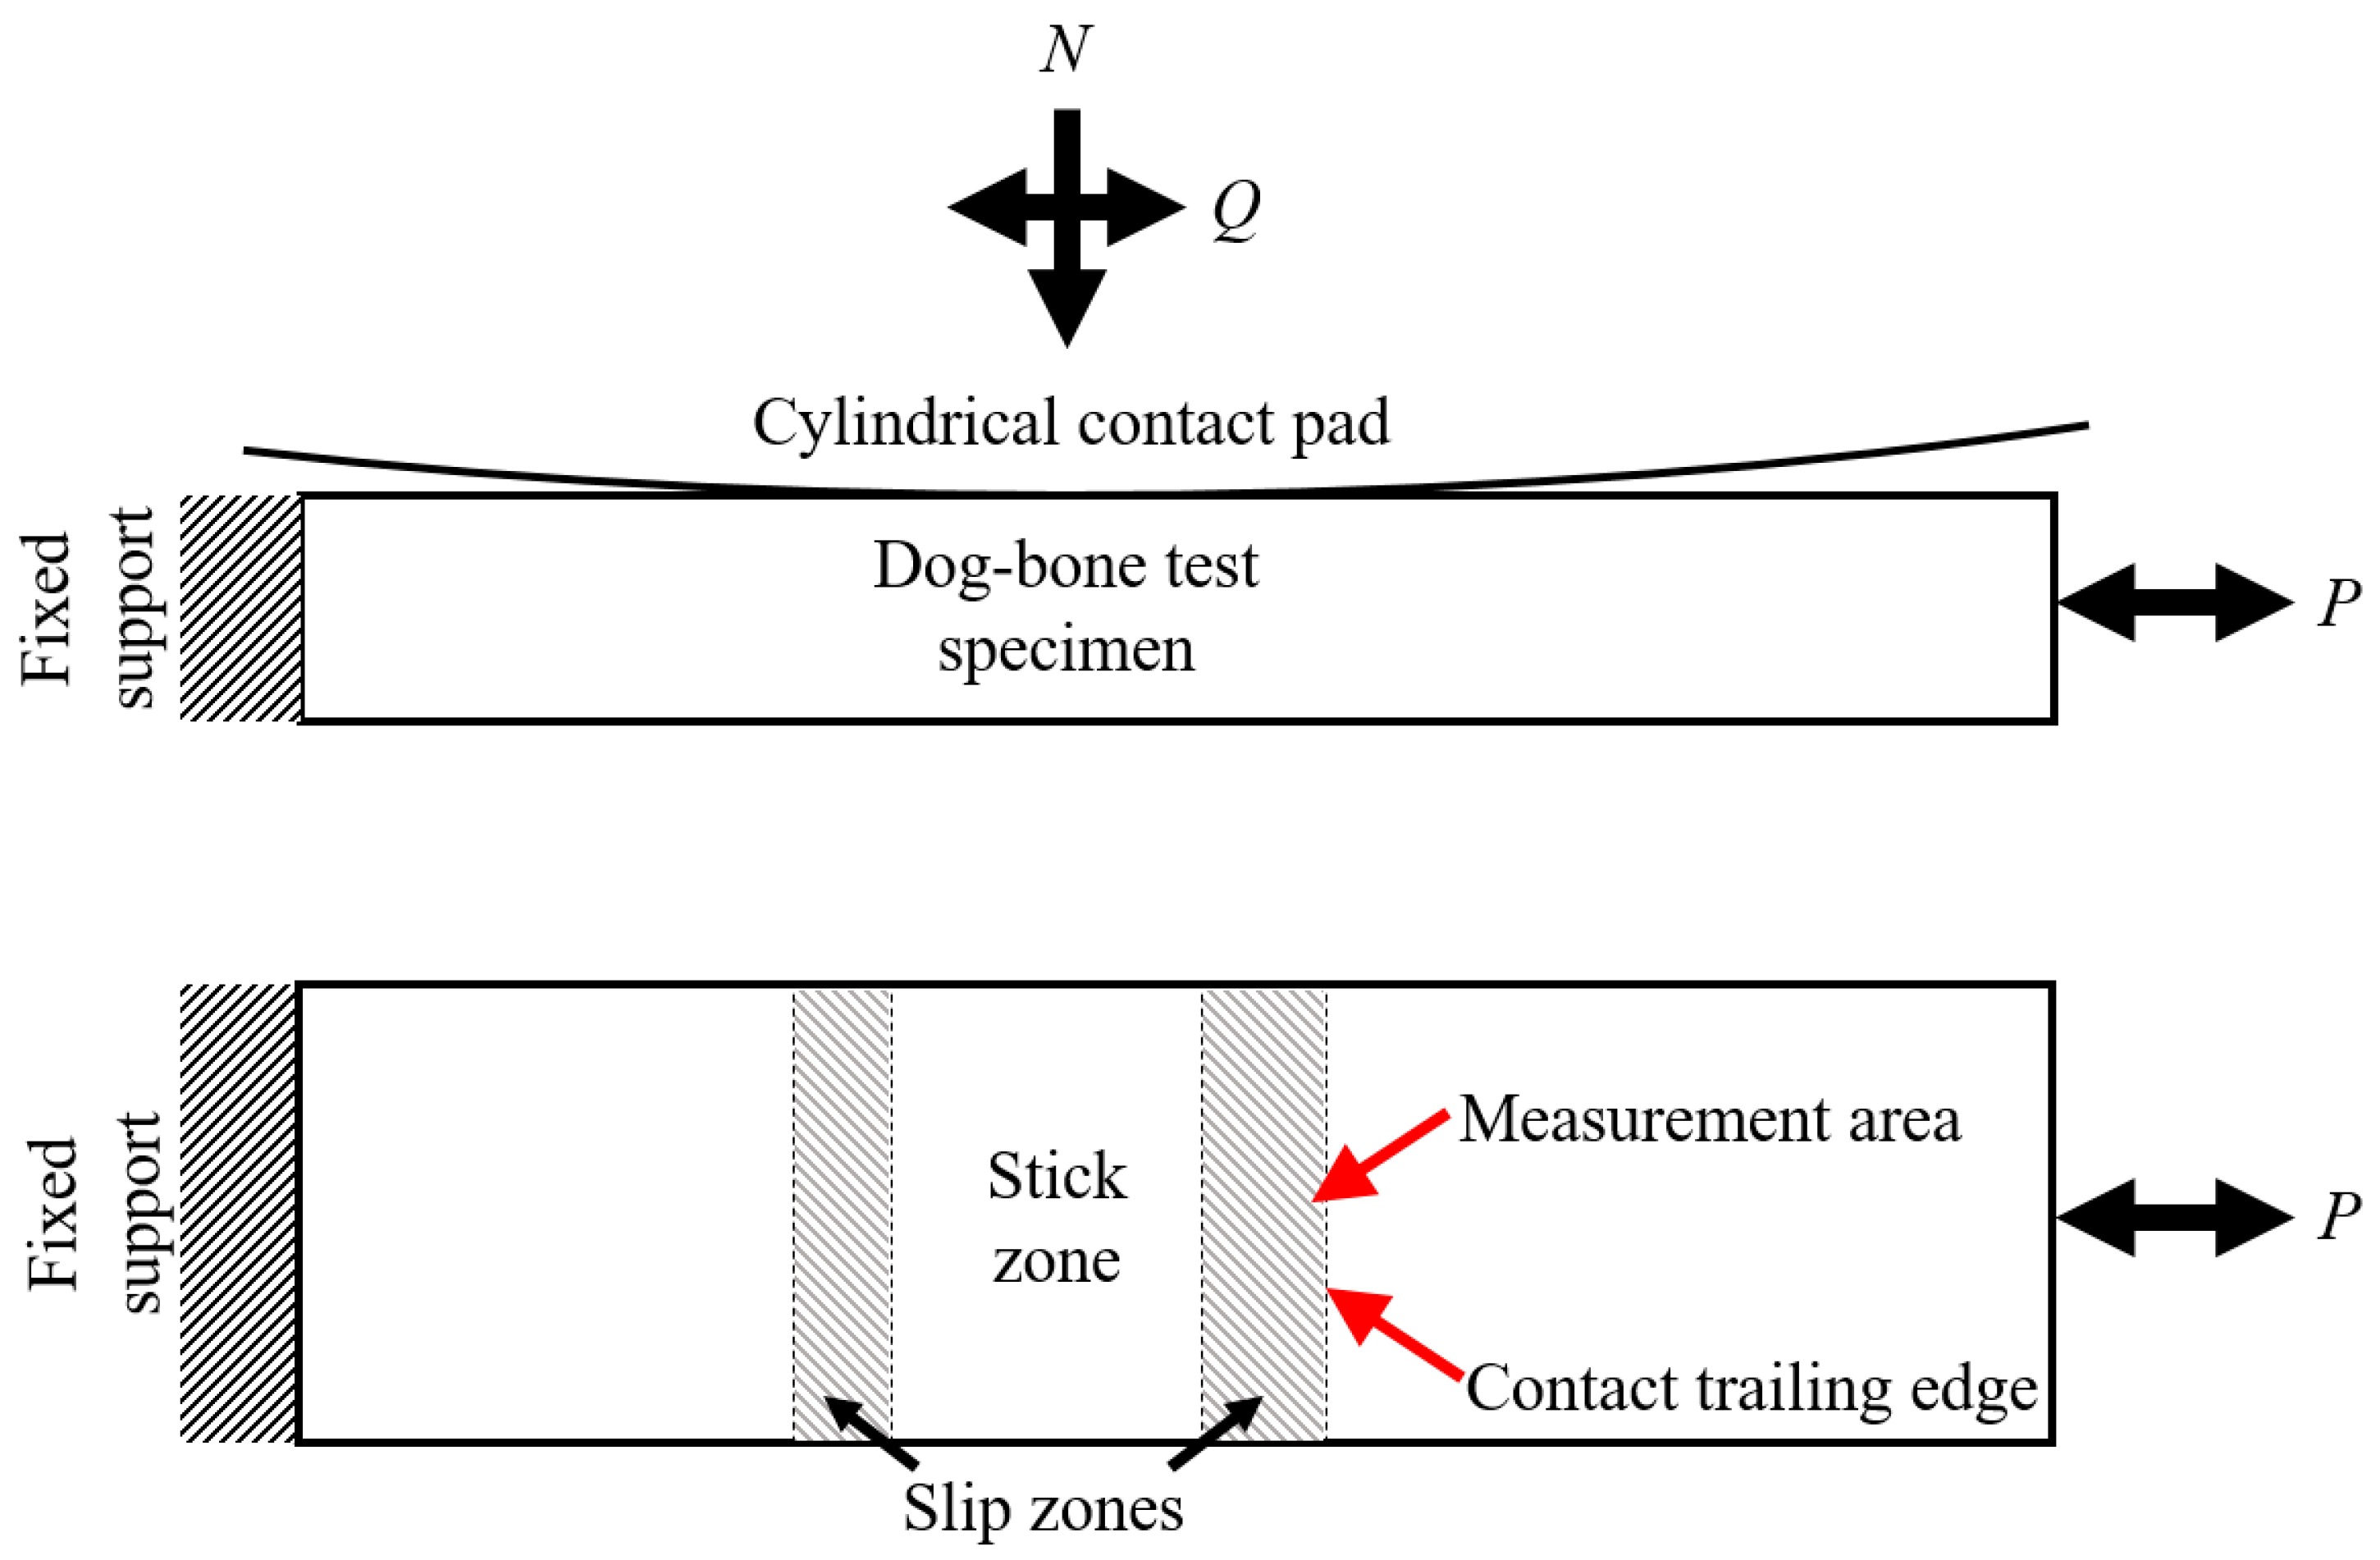
An experimental campaign was conducted in order to study the effect produced by the shot-peening process on fretting fatigue. All fretting-fatigue tests were carried out using an ad hoc test device. A scheme for this test device, which is similar to that described in [28], is shown in Figure 1a. In this test machine, the first two cylindrical contact pads were pressed against a dog–bone-type test specimen by means of normal constant load N. Then, a cyclic (harmonic) axial load with an amplitude of P was applied to the dog–bone test specimen, and due to the stiffness of the system and the friction between the contacting surfaces, a cyclic and in-phase tangential load Q was developed. Under this load configuration, fretting cracks always initiate at the slip zone near the contact trailing edge; see a sample fretting scar obtained from these tests in Figure 1b.
Due to the moving supports, it is possible to modify the stiffness of the device, and thus obtain different values of tangential load amplitude Q without varying axial load amplitude P. This fact makes multiple fretting-load combinations (P, Q, N) achievable with the present device. In this type of fretting-fatigue test, it is important to monitor all fretting loads, so the test device was instrumented with load cells able to measure these forces. The signals from these load cells were transferred to a signal conditioner, then passed via a data-acquisition card to a PC in order to display and record fretting loads P, Q, and N in real-time.
In the present work, the material of both parts, dog–bone test specimens and contact pads, was the aluminum alloy 7075-T651, which is a widely used material in the aerospace industry to manufacture wing skins, panels, covers [29], seat rear legs, and seat spreaders [30]. In Table 1 and Table 2, the chemical composition for this aluminum alloy [31] and its leading mechanical properties [32] are shown, respectively. The main geometric features for the contact pads and fretting-fatigue test specimens are shown in Figure 2. On the contact zone, the fretting-fatigue test specimens have a rectangular cross section of 8 × 10 mm2; the contact is produced on the 8 mm side. The pads have a cylindrical contact surface with an R = 100 mm radius. This radius in conjunction with the test-specimen width (8 mm) led us to obtain a wide range of contact-stress values using achievable fretting loads (P, Q, N) by the present test device. In addition, the geometry of the contact pair, and assuming that a great part of it was under plain strain conditions, allowed us to assume that the behavior of both contacting bodies (test specimens and contact pads) was as half-planes [33]. Under these hypotheses, analytical formulae are available for a first estimation of the contact stress and strain fields and contact areas [34,35]. These data were very useful in order to determine the range of fretting-fatigue loads to be applied. In Table 3, all the load combinations used in the experimental campaign are shown. In addition, this table shows obtained contact parameters from contact Hertzian theory. The expressions for these parameters are the following [34]:
a = 8 N * R ( 1 ν 2 ) π E
c = a 1 Q μ N *
e = R σ ( 1 ν 2 ) μ E
p 0 = 2 N * π a
Δ σ x x = σ + 4 μ p 0 c a ( a + e c ) 2 1
where a is the contact semi-width, c is the stick-zone semi-width, e is the eccentricity of the stick zone, p0 is the maximum normal pressure, σ is the axial stress amplitude due to P, Δσxx is the range of the direct stress at the contact trailing edge, and N* is the normal load per unit length (N* = N/8 N/mm in the present case).
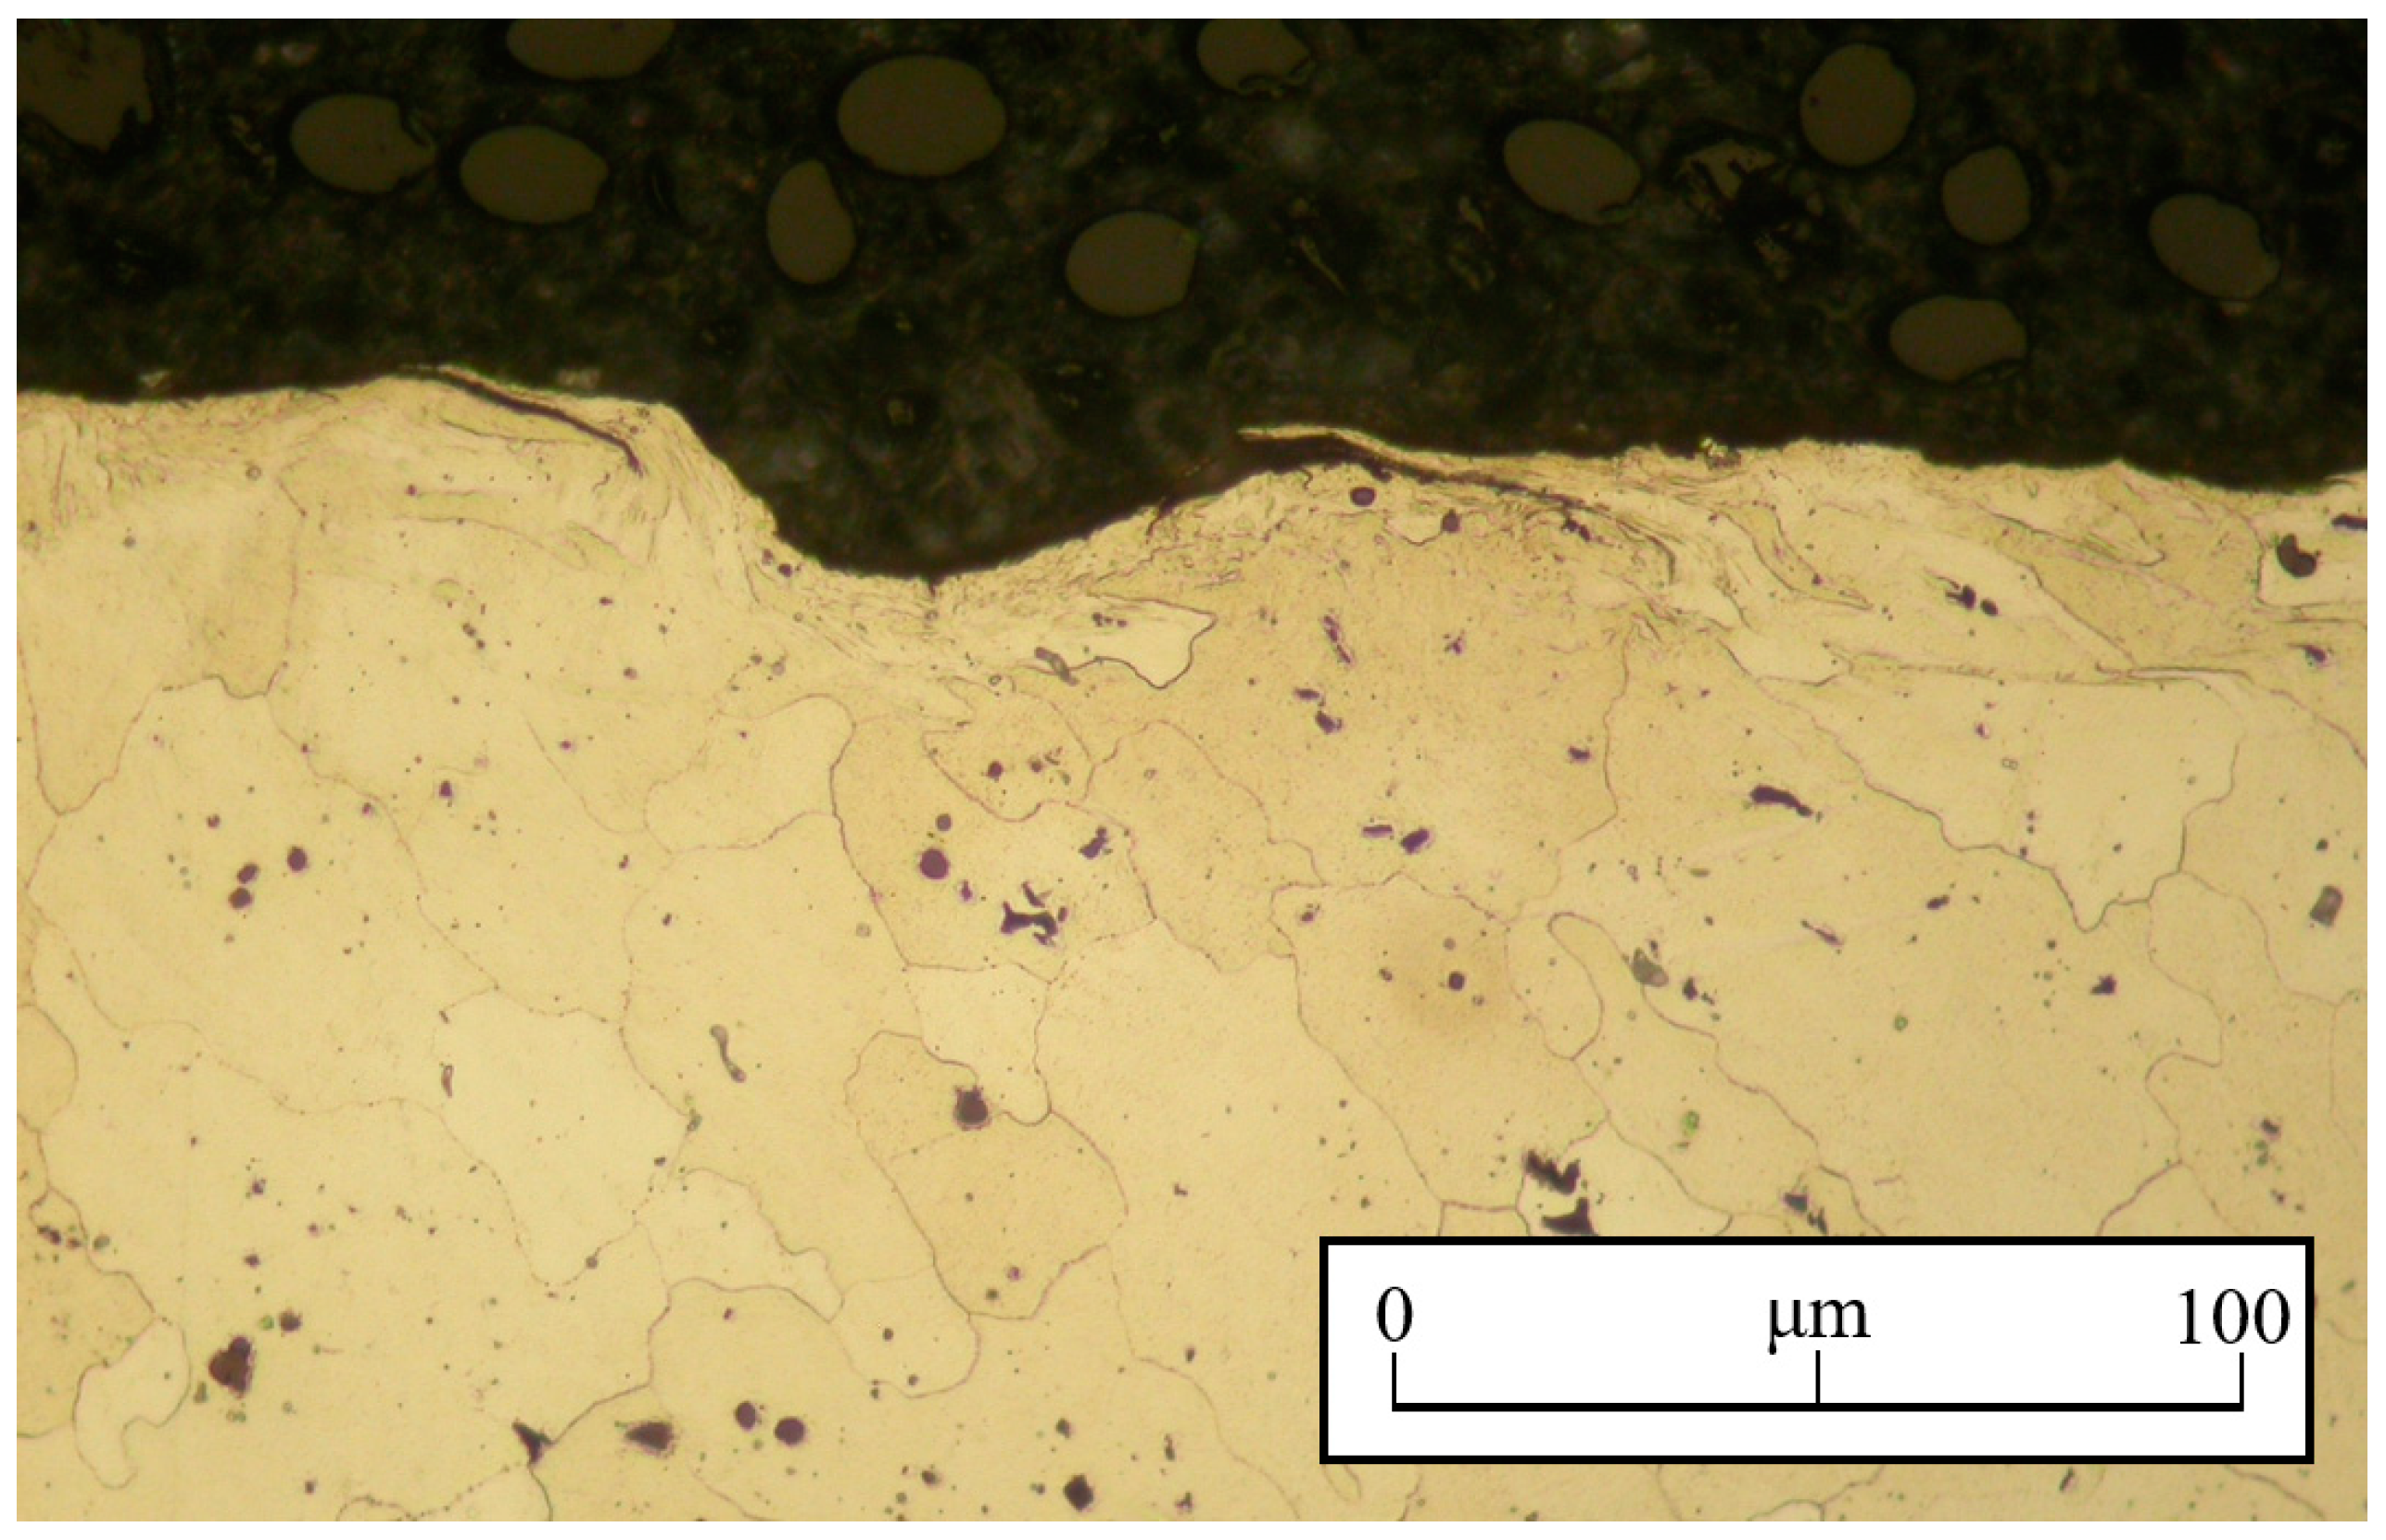
In order to analyze the effect produced by the shot-peening process in the above fretting tests, dog–bone-type test specimens were shot-peened. The parameters describing the shot-peening treatment according to the AMS Standard [36] are 9A 230-H 90°. The test specimens were shot-peened along all their surfaces, even in the threaded zones (to improve fatigue performance, and thus avoiding an undesirable fatigue failure at those zones). A cross section of a shot-peened test specimen is shown in Figure 3. In this figure, the highly deformed layer typical of the shot peening process and the characteristic surface with valleys and peaks are easily observable. In addition, the formation of cracks due to the severe deformation produced by the ball’s bombardment during the treatment is noticeable. Even when these cracks clearly have a negative effect on fatigue behavior, previous works [16,37,38] showed that, in a fretting-fatigue situation, the beneficial effect produced by residual stress and cold working due to shot peening makes the detrimental influence of these cracks vanish.
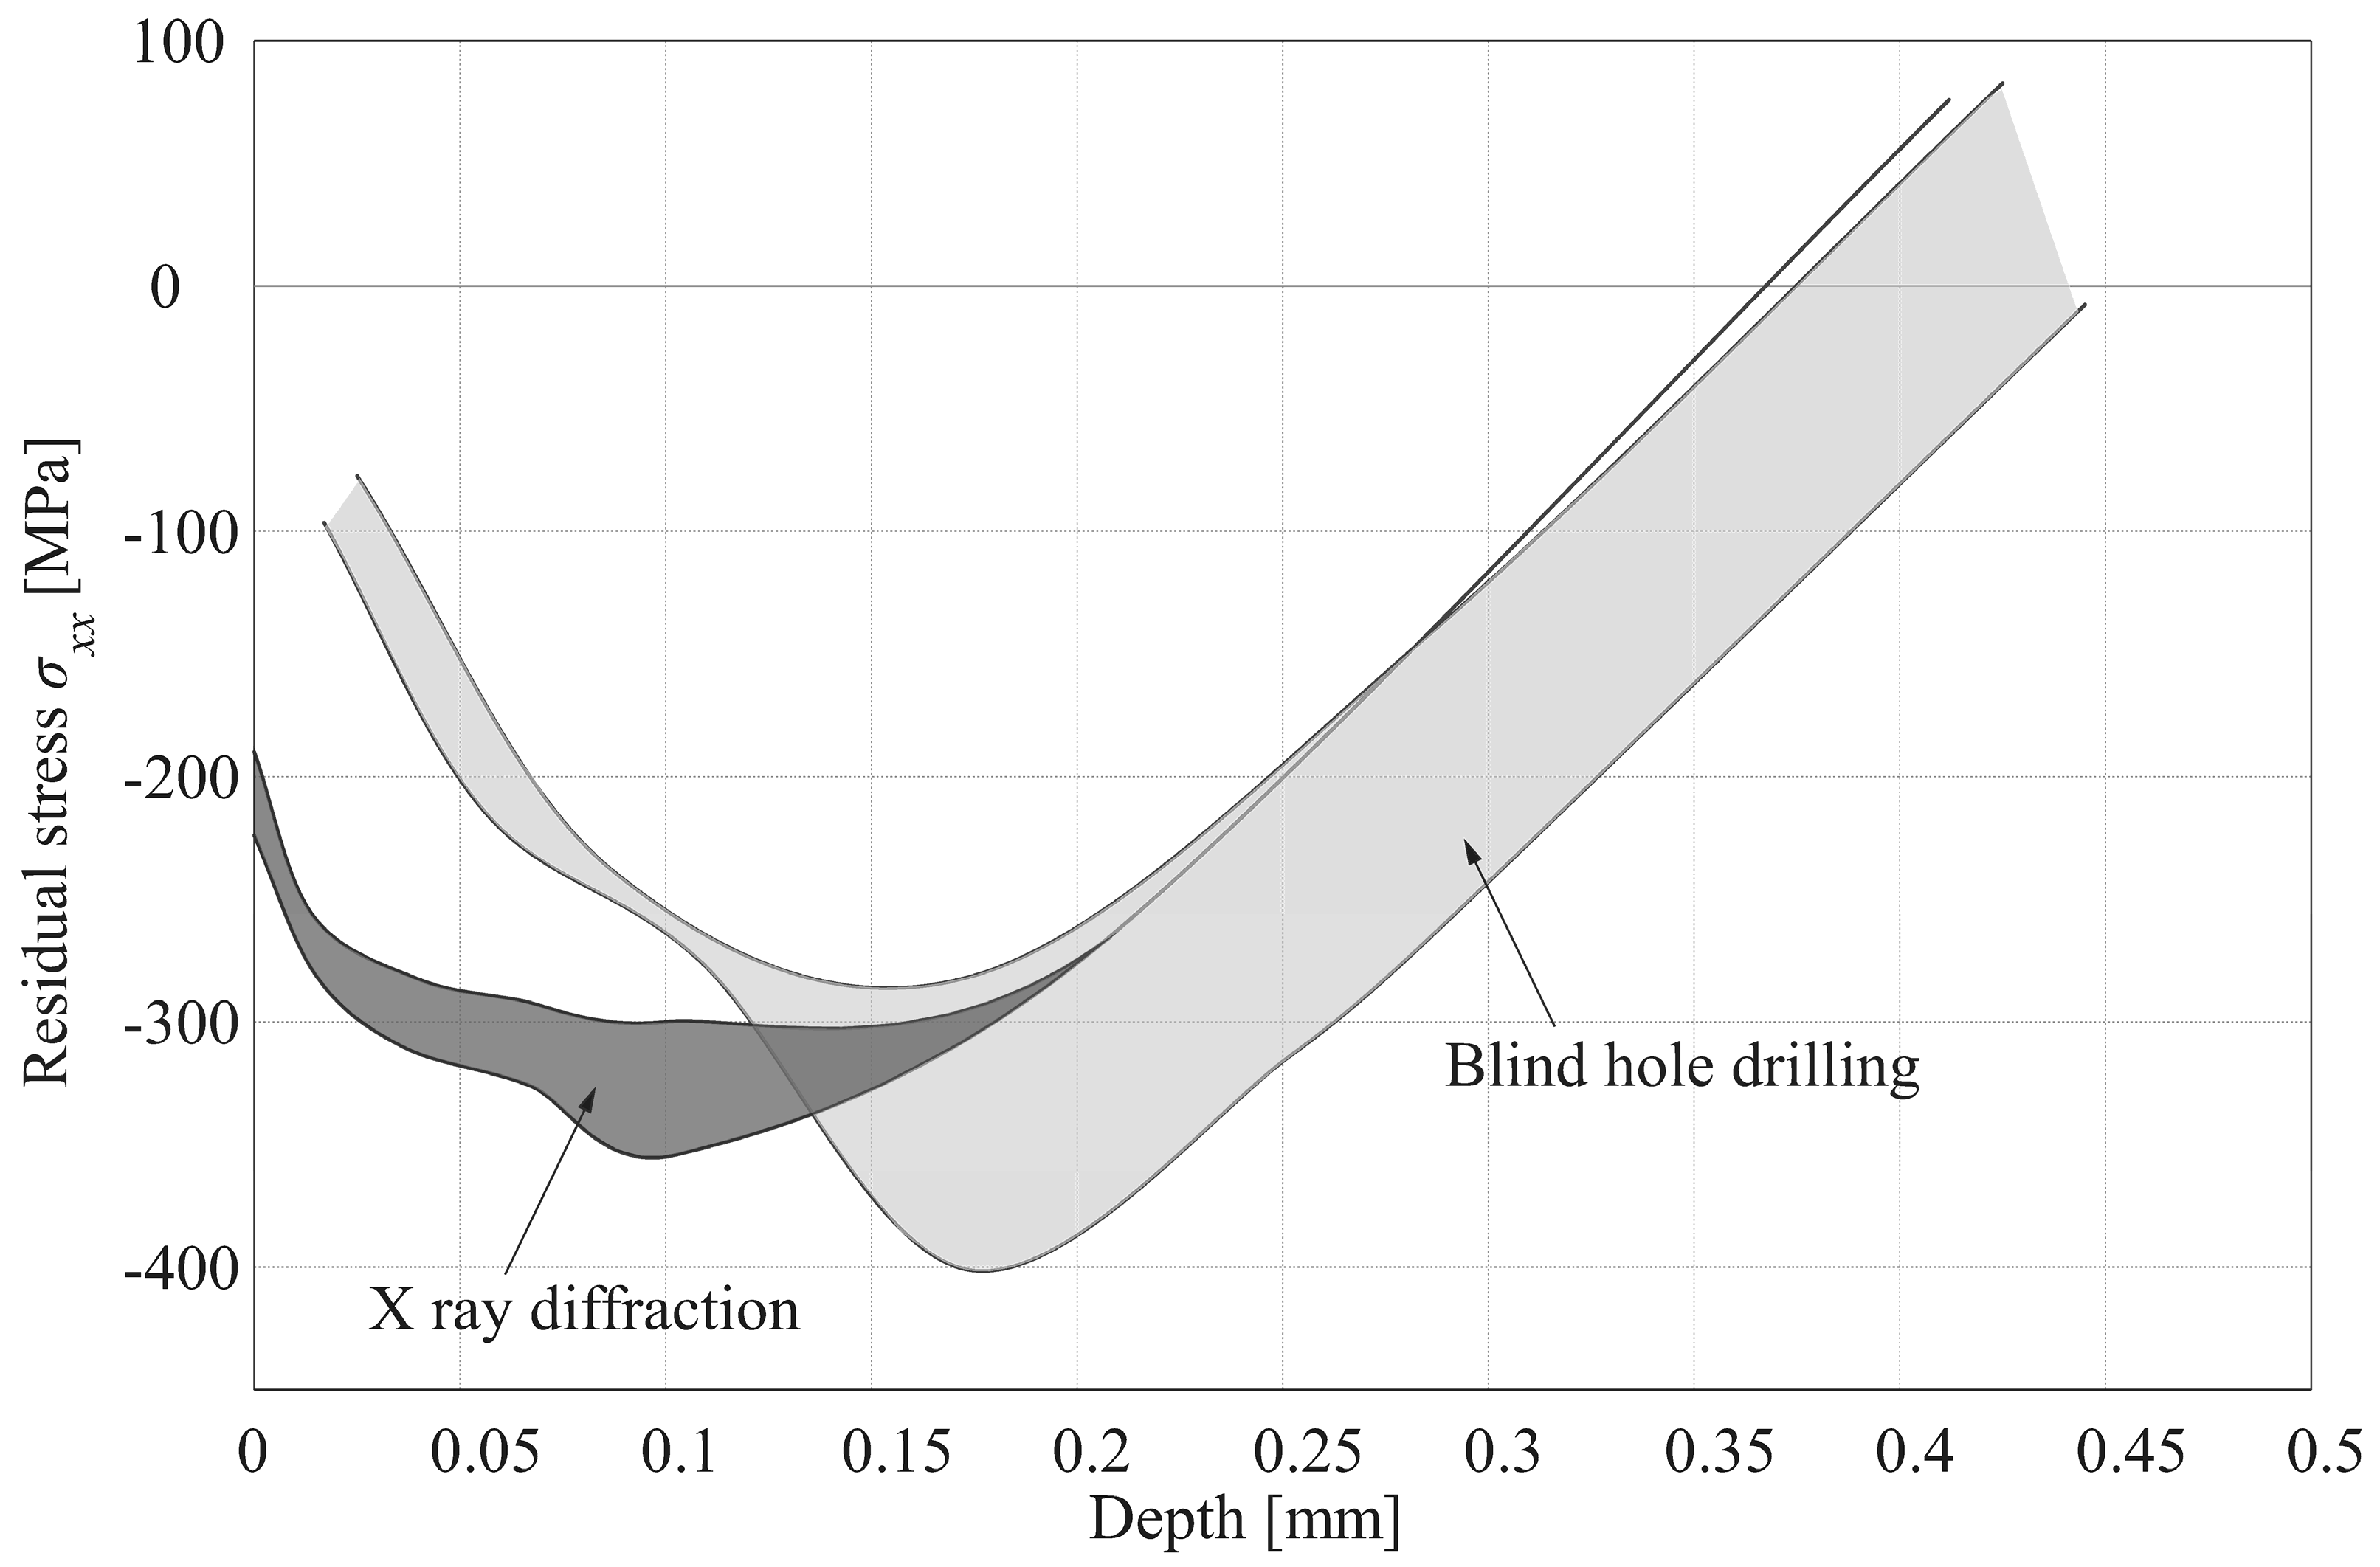
The residual-stress field produced on the test specimens by the above shot-peening treatment was measured by means of two different techniques: the hole-drilling and X-ray diffraction (XRD) methods. Both residual-stress measurement techniques are widely used and their results are reliable. Regarding the hole-drilling method, residual-stress distribution was established using the integral method [39,40], which for the hole-drilling technique, is the most suitable method to measure residual-stress distribution with a steep gradient. Regarding the hole-drilling device, an MTS 3000 instrument from the manufacturer HBM™ was used for both drilling and reading strain values during the drilling process. On the other hand, measurements obtained via XRD were carried out according to the EN 15305:2008 standard [41], and the in-depth correction of the measurements via the method described by Moore and Evans [42] was used. The equipment used was a portable residual stress analyzer iXRD from the manufacturer PROTO. All measurements were done on the midthickness test specimens (xy plane), where both methods, the integral method and that of Moore and Evans, are applicable. Figure 4 shows the residual-stress distributions measured with the above methods. In both cases, the hole-drilling and XRD methods, only the residual stress in the longitudinal direction of the test specimen, σxx, was plotted, which is thought to be more important from a fatigue point of view. In any case, the residual-stress measurements showed that in the xz plane, principal residual stresses were very similar, indicating that the residual-stress values were almost independent of the considered direction. In Figure 4, the residual-stress distributions lie in a series of bands that indicate the different values obtained among all measurements. Both measurement methods produced residual-stress distributions with a similar shape, although values are notably different. These differences can mainly be attributed to the different methods (integral and Moore and Evans) used to consider the redistribution in the stresses produced by the removed material during the drilling (hole-drilling) or electropolishing processes (XRD). In any case, both methods produced maximum values and residual-stress distributions that were similar to those obtained in a previous study for the same material and test specimens, but slightly different shot-peening process parameters [16].

3. Results

In this type of tests, as mentioned earlier, there are three different fundamental loading parameters: bulk stress amplitude (σ), constant normal load (N), and tangential load amplitude (Q). Therefore, to study the fretting behavior of a material, the three of them need to be varied from one test to another. A set of 23 different combinations were designed, where the influence of these parameters could be individually analyzed and combined. Each load combination was tested with specimens treated with shot peening and specimens without any treatment (two specimens in each condition). These tests are shown in Table 4, including the loads and number of cycles to failure (Nf).
The shot-peening treatment, besides compressive residual stresses, leaves a rough and deformed surface that may play a role in fatigue behavior. To analyze this parameter, a subset of all loading combinations was chosen for the study of the surface condition. A new group of specimens was tested, where they were polished after the shot-peening treatment, eliminating between 20 and 30 microns of material (Table 5). This slightly modifies the residual stress distribution but considerably diminishes the roughness of the surface. The polishing of the surface has a side effect—the modification of the friction coefficient—which, in turn, affects stress distribution during the test, and hence fatigue life. Table 6 shows the measured average roughness and friction coefficient. In all cases, surface roughness was measured by means of a Sensofar S Neox device, which is an optical profiler. The values of the roughness presented in Table 6 correspond to the values obtained along a 4 mm length line. Finally, all values presented in that table are the average obtained from three different measurements.
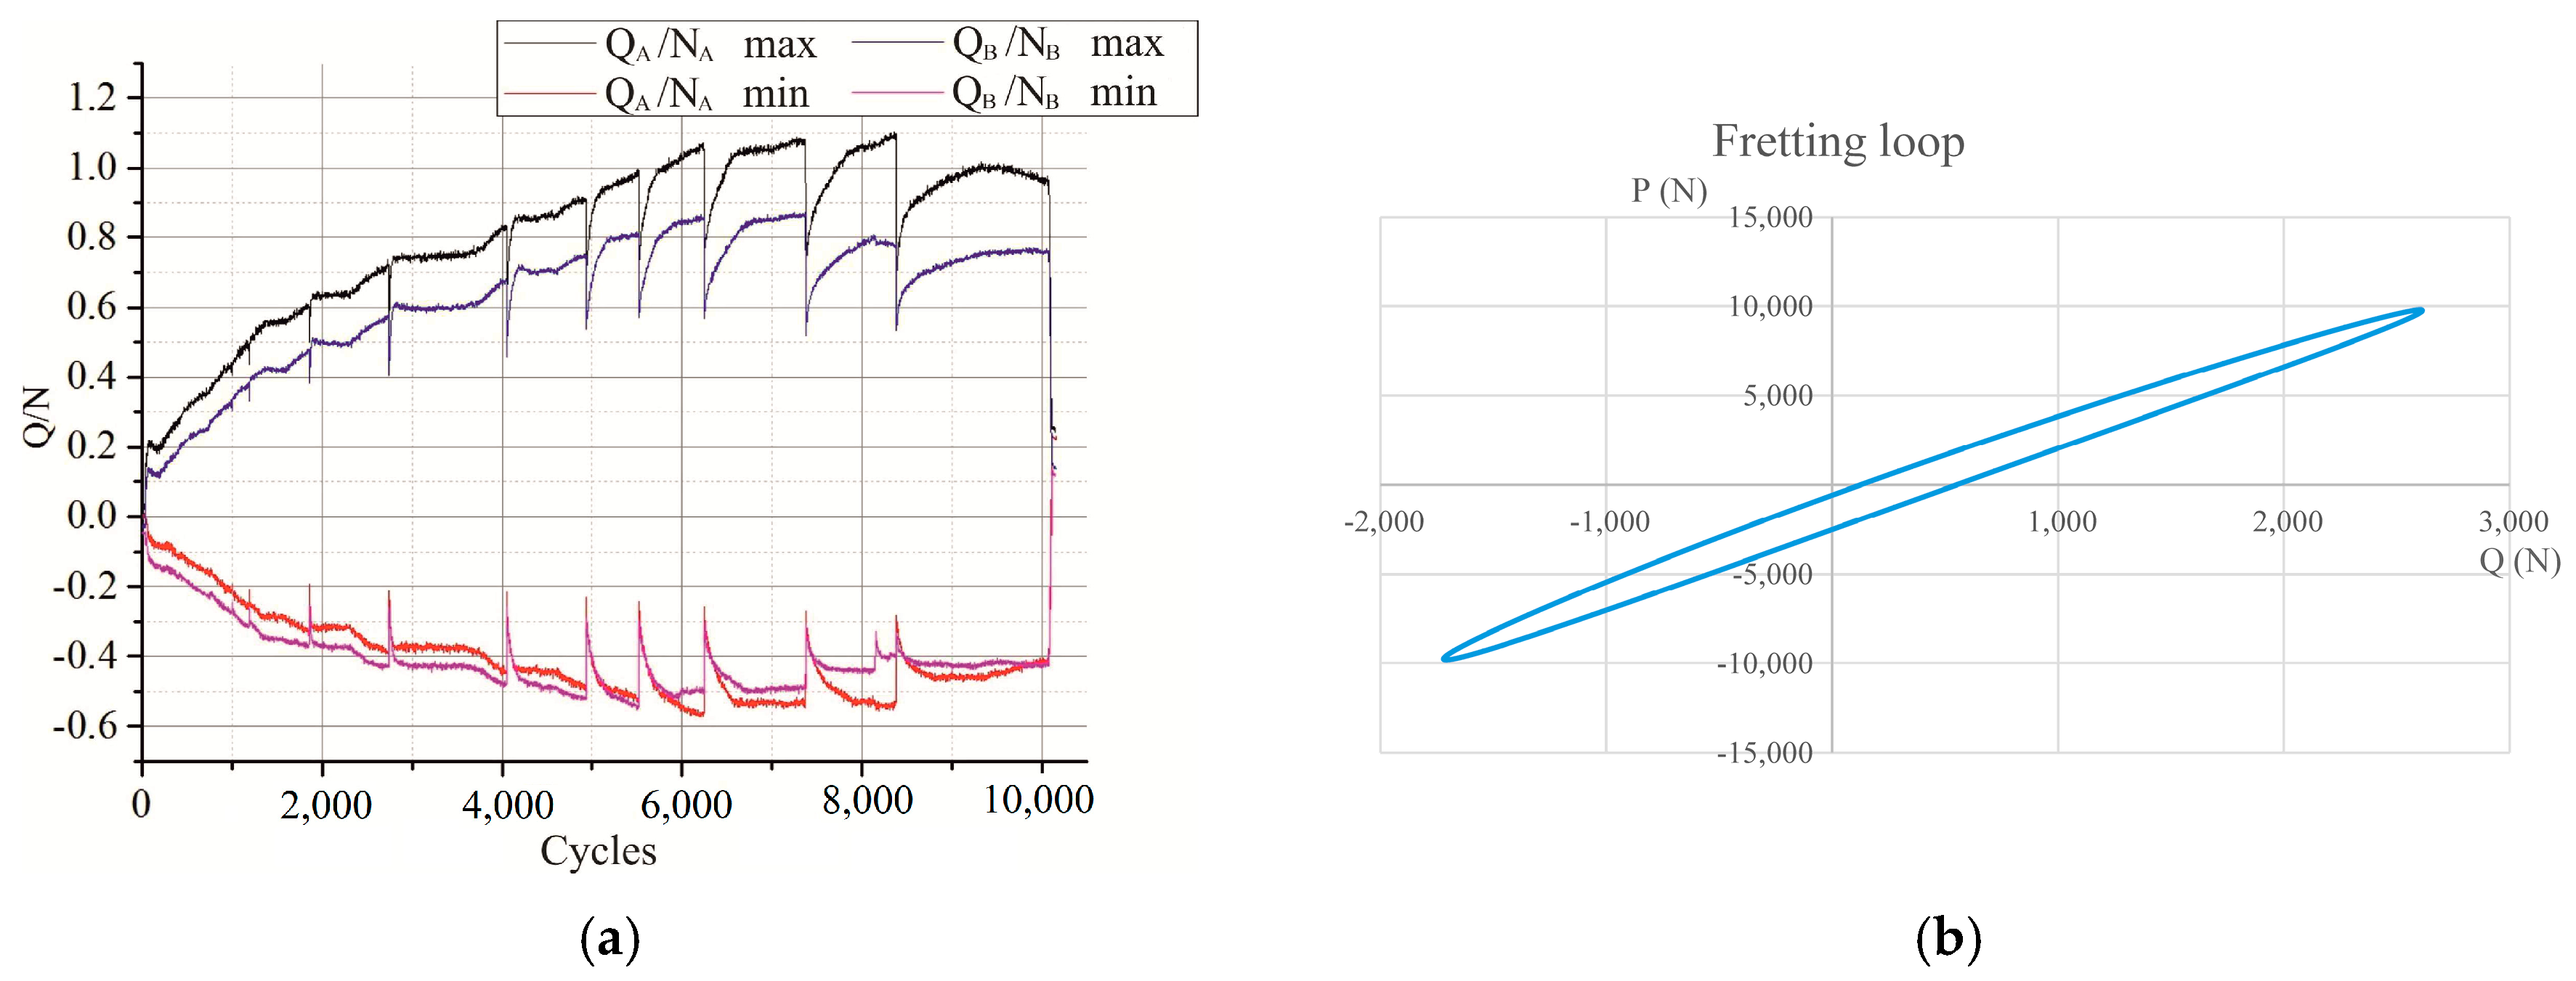
The friction coefficient is measured in a test specifically designed for this [28]. It is similar to a regular fretting-fatigue test, where the initial amplitude of the axial load, and therefore the tangential load, is small. At the beginning, the amplitude of the tangential load is gradually increased, which, in turn, increases the size of the sliding zone; the process is shown in Figure 5a. A and B refer to the two contacts on the specimen. It is known that in the sliding zone, the friction coefficient increases with the number of cycles, which reduces the size of the sliding zone. At some moments, with the increase of the loading amplitude, global sliding occurs and a sudden reduction in tangential load is observed, but after a few cycles the friction coefficient increases and partial slip is again attained. After this, axial load amplitude is increased again. This process is repeated until partial slip is never recovered again. It is assumed that in this situation, the friction coefficient reached its maximum and the value would be the ratio of Q/N right before the final stage of global sliding occurs. The friction coefficient was measured on both contacts in three specimens of each type; therefore, the value presented in Table 6 is the average of these six values. As said before, all the fatigue tests performed were done under partial slip. This can be observed in Figure 5b, where the axial load in the specimen, P, versus the tangential load in the contact, Q, is represented for several cycles in one of the tests with the load combination 23.
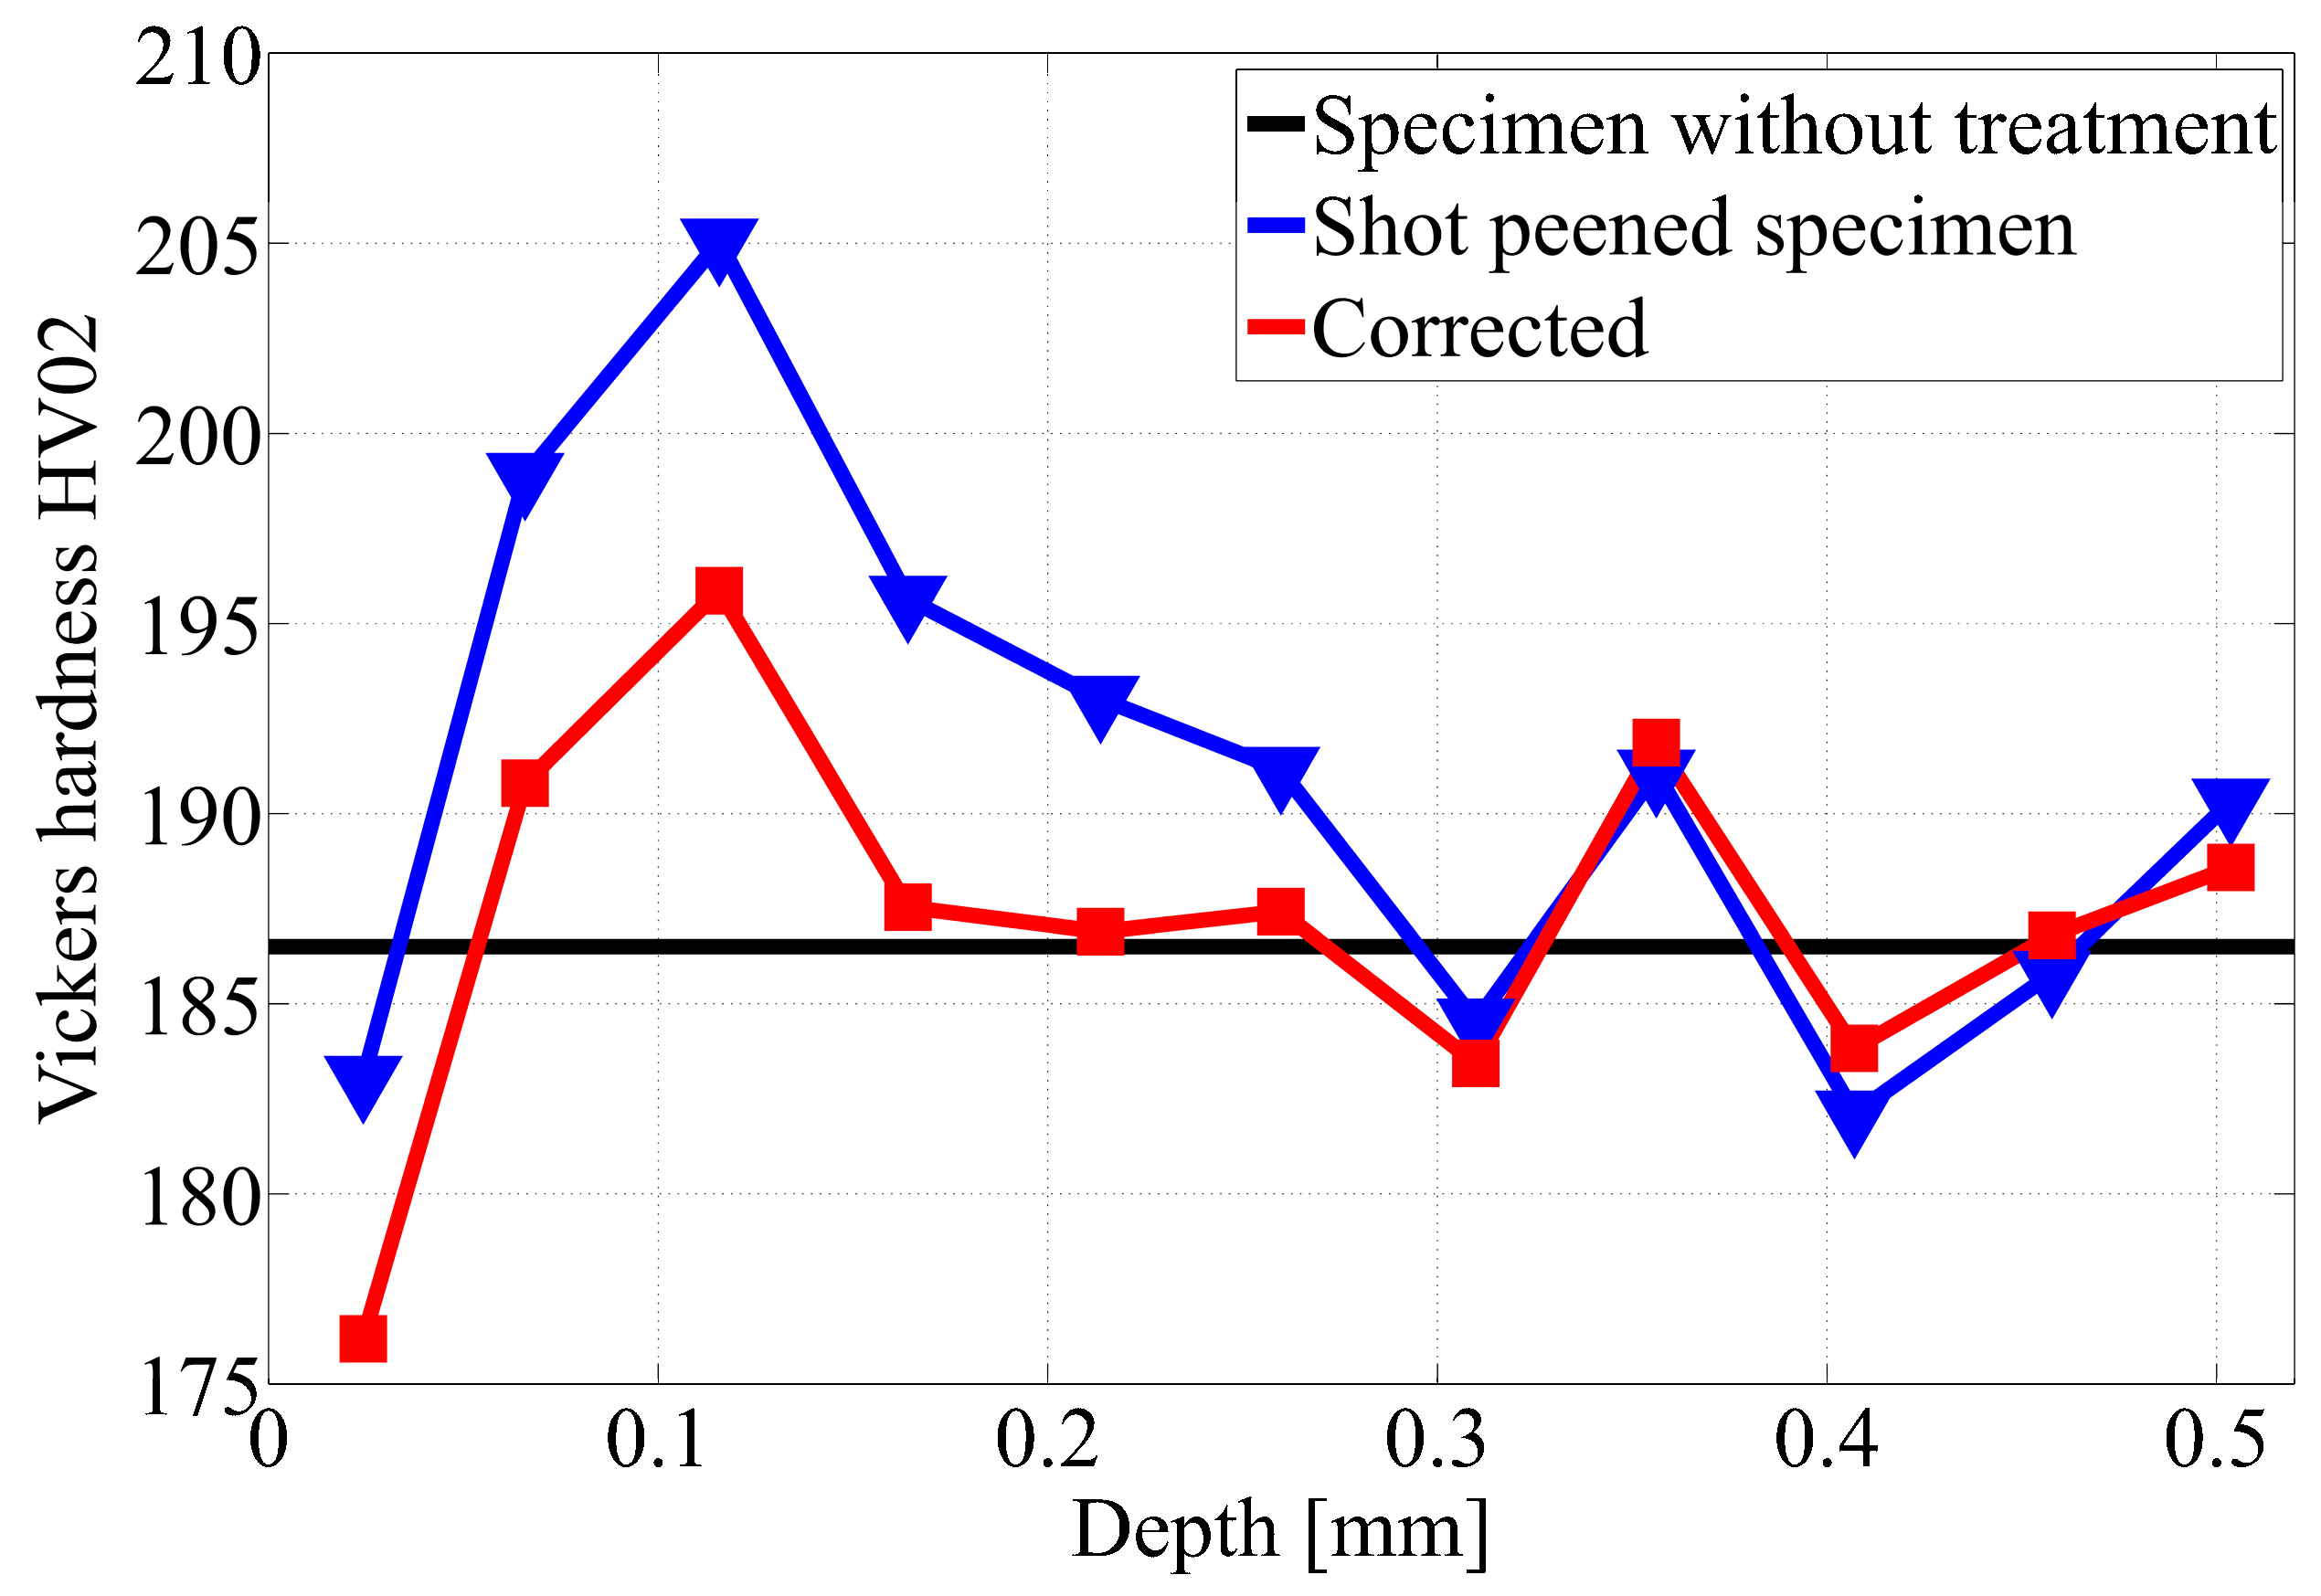
The shot-peening process changes the hardness of the layer close to the surface, as can be seen in Figure 6. This figure shows the measured value on a specimen without any treatment (black line), and the values measured along the depth in a specimen treated with shot peening (blue line). The value close to the surface is not very reliable because of the presence of the free surface, and it can be neglected. The residual stress field present in the shot-peened specimens close to the surface also distorts the measurement, which was corrected with the method proposed by Tsui et al. [43] (red line). Taking into account this correction, it was observed that shot peening induces a modification of the hardness that is below 5%.

3.1. Fatigue Lives

3.1.1. Shot-Peening Improvement of Fatigue Life

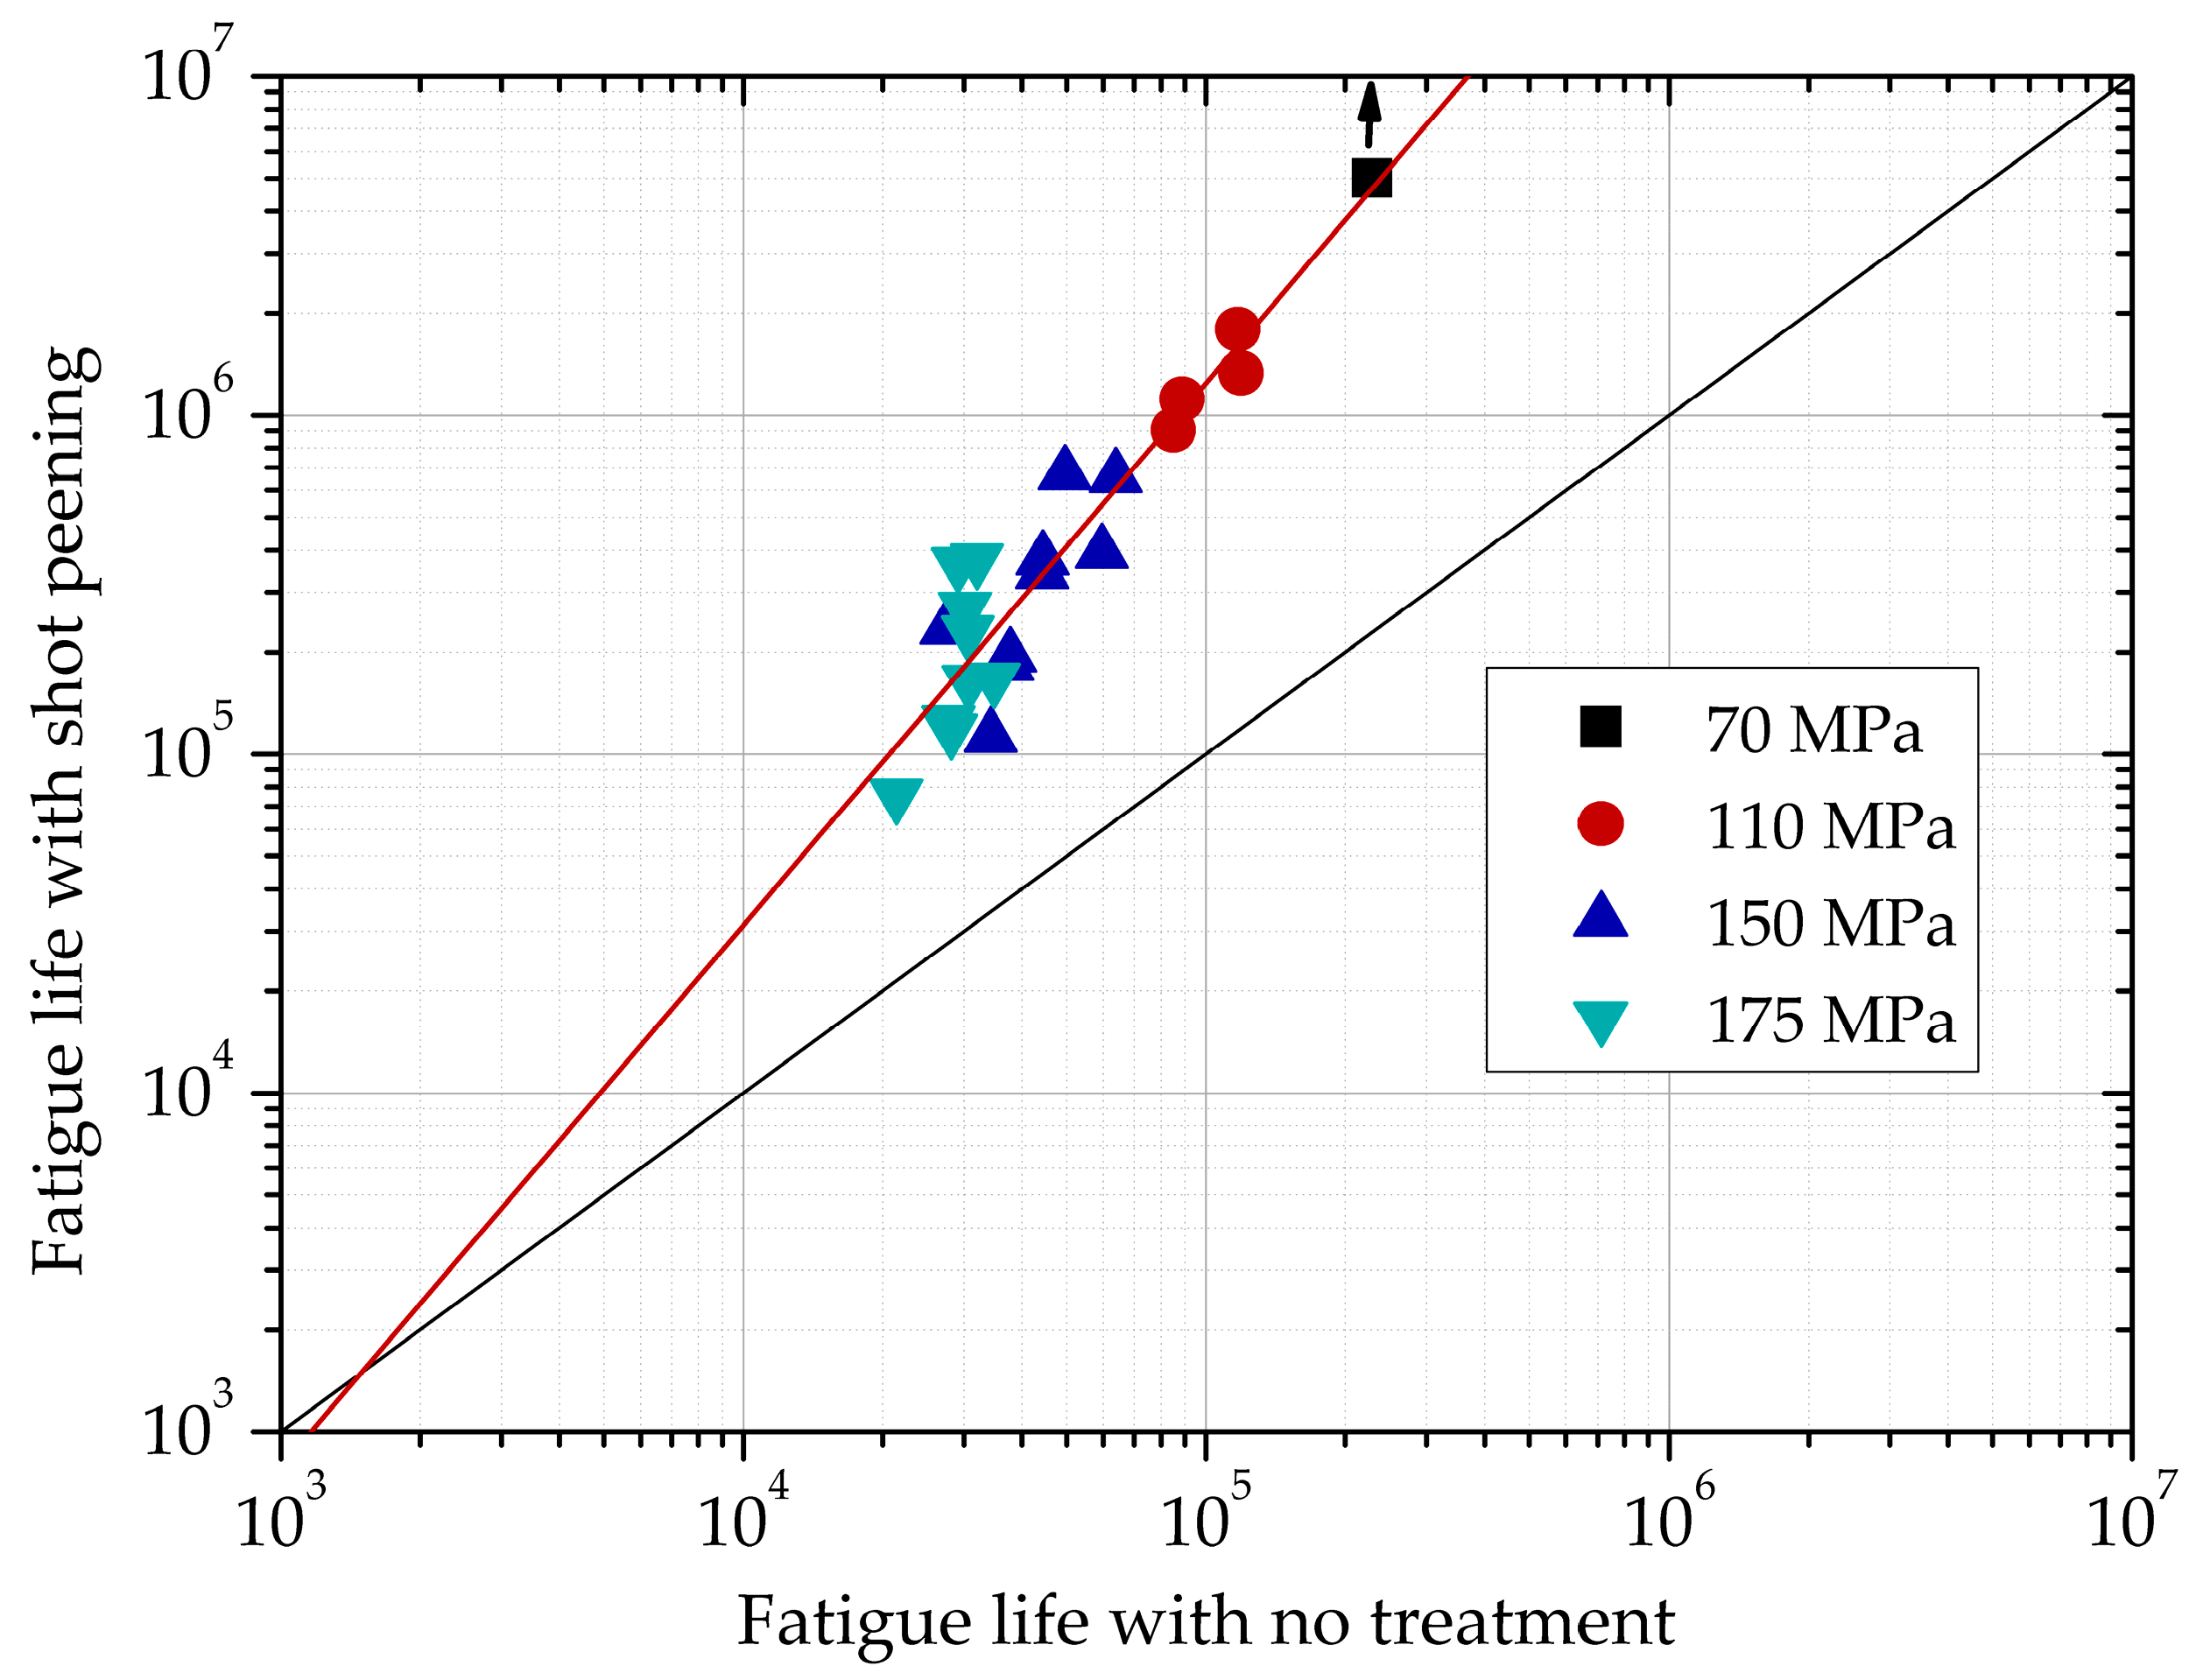
Figure 7 shows the fatigue lives in specimens with and without shot peening. Since there are two tests for each load combination and condition (with and without shot peening), the fatigue lives shown in this figure are the antilogarithm of the average of the logarithm of these two tests’ lives. The average life is calculated in this way, and not by means of an arithmetic average, because fatigue life is usually represented in a logarithmic scale [44]. It is true that two tests in each load combination is not ideal for having a reliable life distribution and scatter band, however it is much better to have two tests instead of only one at each test combination. In fretting fatigue there are three independent loads instead of only one, as in plain fatigue, so for the sake of economy in the number of tests, we performed only two at each combination. In order to compare fatigue lives for the different load combinations with and without shot peening in Figure 7 the individual lives cannot be used, so a better comparison is to take the average between the two tests performed at each load combination. In any case, except for two load combinations in the untreated specimens and in eight load combinations in the shot peened specimens out of twenty three combinations in each case, the ratio between the lives obtained for the same load combination is equal or below 1.3, which is a low value in fatigue. In the rest this ratio is below 2, except for two cases. Therefore, the ratio between any value and the average value is even less. That is why we consider it is unnecessary to include the scatter bands in this figure.
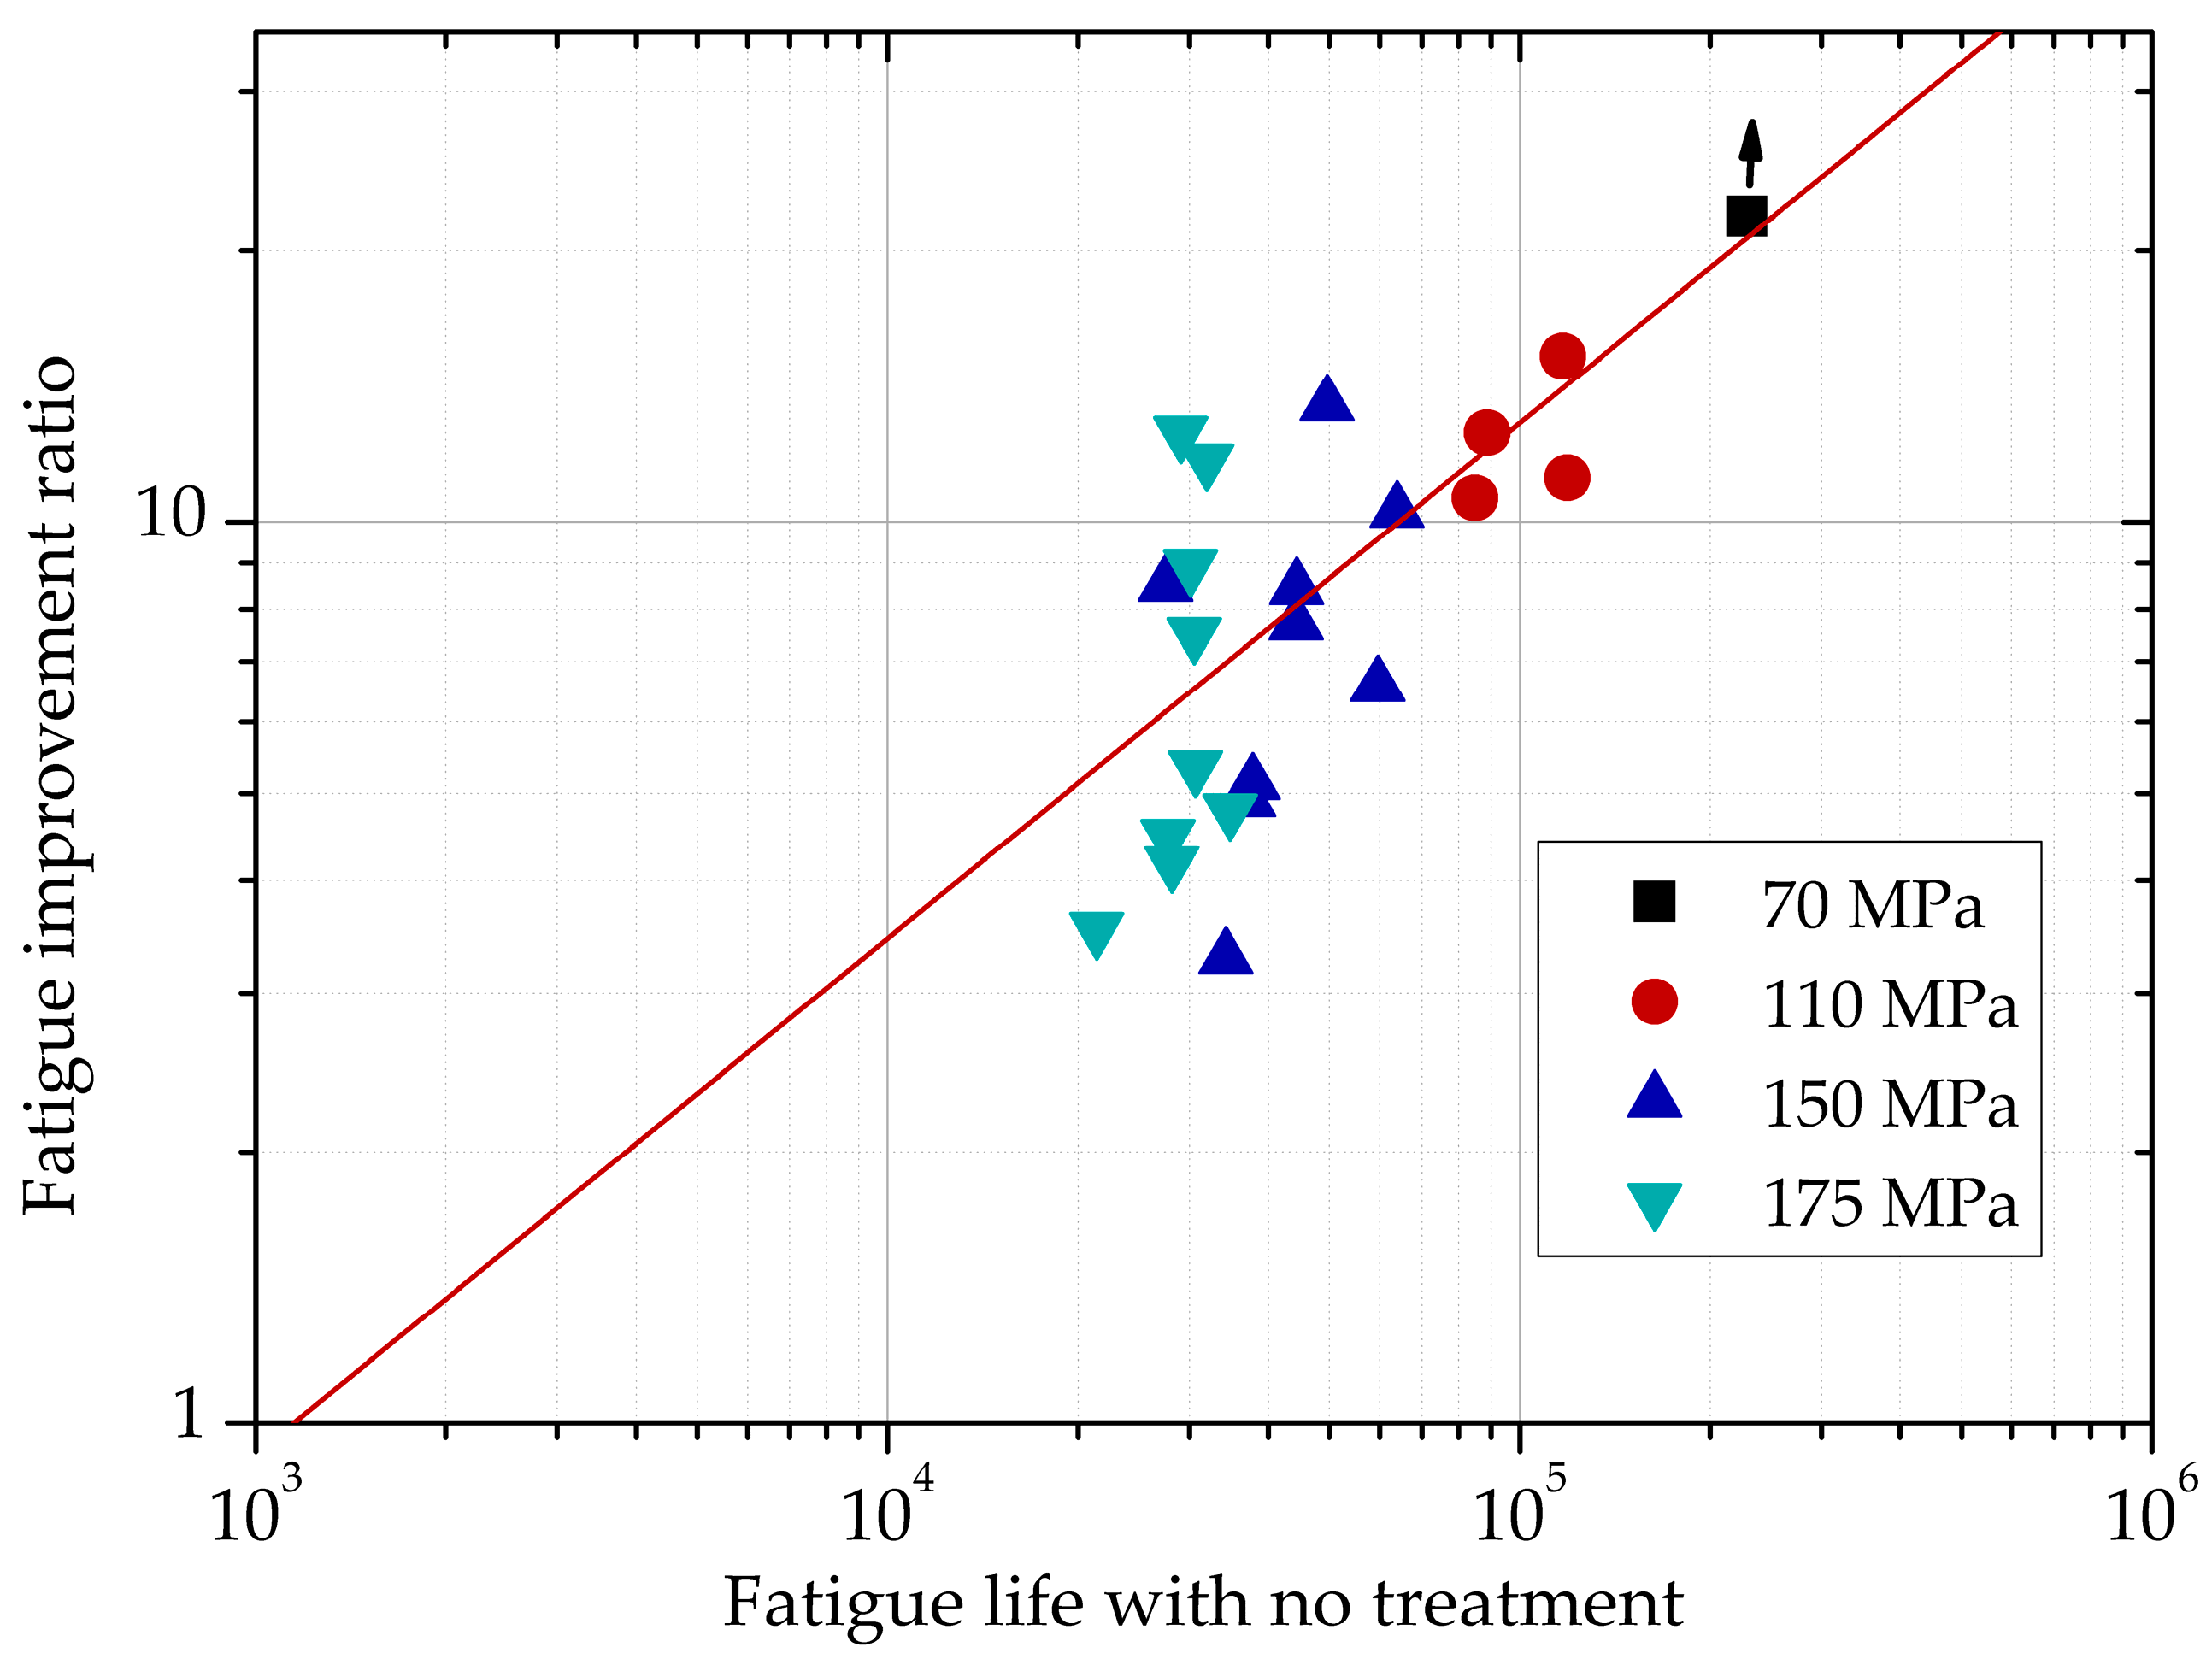
The improvement in fatigue life can clearly be seen. This also shows that this improvement is higher for high-cycle fatigue. The data in the graph were grouped based on the bulk stress applied in the test. It is obvious that for higher stresses, the lives are lower, but for each bulk stress there is a scatter in lives due to the different values of the tangential load Q, and normal load, N. The data indicate that a higher Q decreases fatigue life, and a higher N increases fatigue life. The red line is a power law fitted to the results showing that if the observed behavior is extrapolated to lower lives, there would not be any improvement with the use of the shot-peening treatment around 1000 cycles. This statement is in agreement with previously published works dealing with the performance of shot-peened parts at a low cycle regime [45,46]. This can also be seen when representing the data in a different format. Figure 8 shows the ratio of the average fatigue life obtained with the specimens with shot peening over the average life obtained with the specimens without any treatment versus fatigue life without shot peening. For finite lives between 104 and 105 cycles, the fatigue-life improvement ratio ranges between 3 and 15, which is much better than that observed with other types of surface treatment, such as nitriding (ranging from a negative effect to an improvement in fretting fatigue life of about 70%) [11,47,48,49] or carburizing, which has a negative effect [50]. There is some scatter in this graph, but given the wide range and combination of loads, it seems that there is a strong relation between fatigue life and the fatigue-improvement ratio. As said before, at a fatigue life of around 1000 cycles, there would be no improvement. A new set of tests would be needed to cover the range between 103 and 104 cycles to confirm this evolution. It is important to be aware of this limitation of the shot-peening treatment, i.e., to know when it is worth applying it and when it is not. In the range of lives above 105 cycles, it is not possible to give an improvement ratio, since the specimens with shot peening enter the region beyond “fatigue limit”. In this zone, tests would need to be continued into the region of gigacycles to finally obtain a failure, and therefore an improvement ratio. However, this was not affordable with the hydraulic machine used in this work. It is true that we are dealing here with a very specific problem, which is fretting fatigue with cylindrical contact, but it seems probable that in other situations the benefit of shot peening is lower for low cycle fatigue. In this situation the high stresses are expected to produce an important relaxation of the residual stress field.
As was mentioned earlier and shown in Table 6, the shot-peening treatment increases the friction coefficient. If the contact is ideal and smooth, this increase would produce, for the same external load, higher stresses that would decrease life. Nevertheless, the variation in friction coefficient is not very high and the strong effect of the compressive residual stresses prevails.

3.1.2. Polished Surface

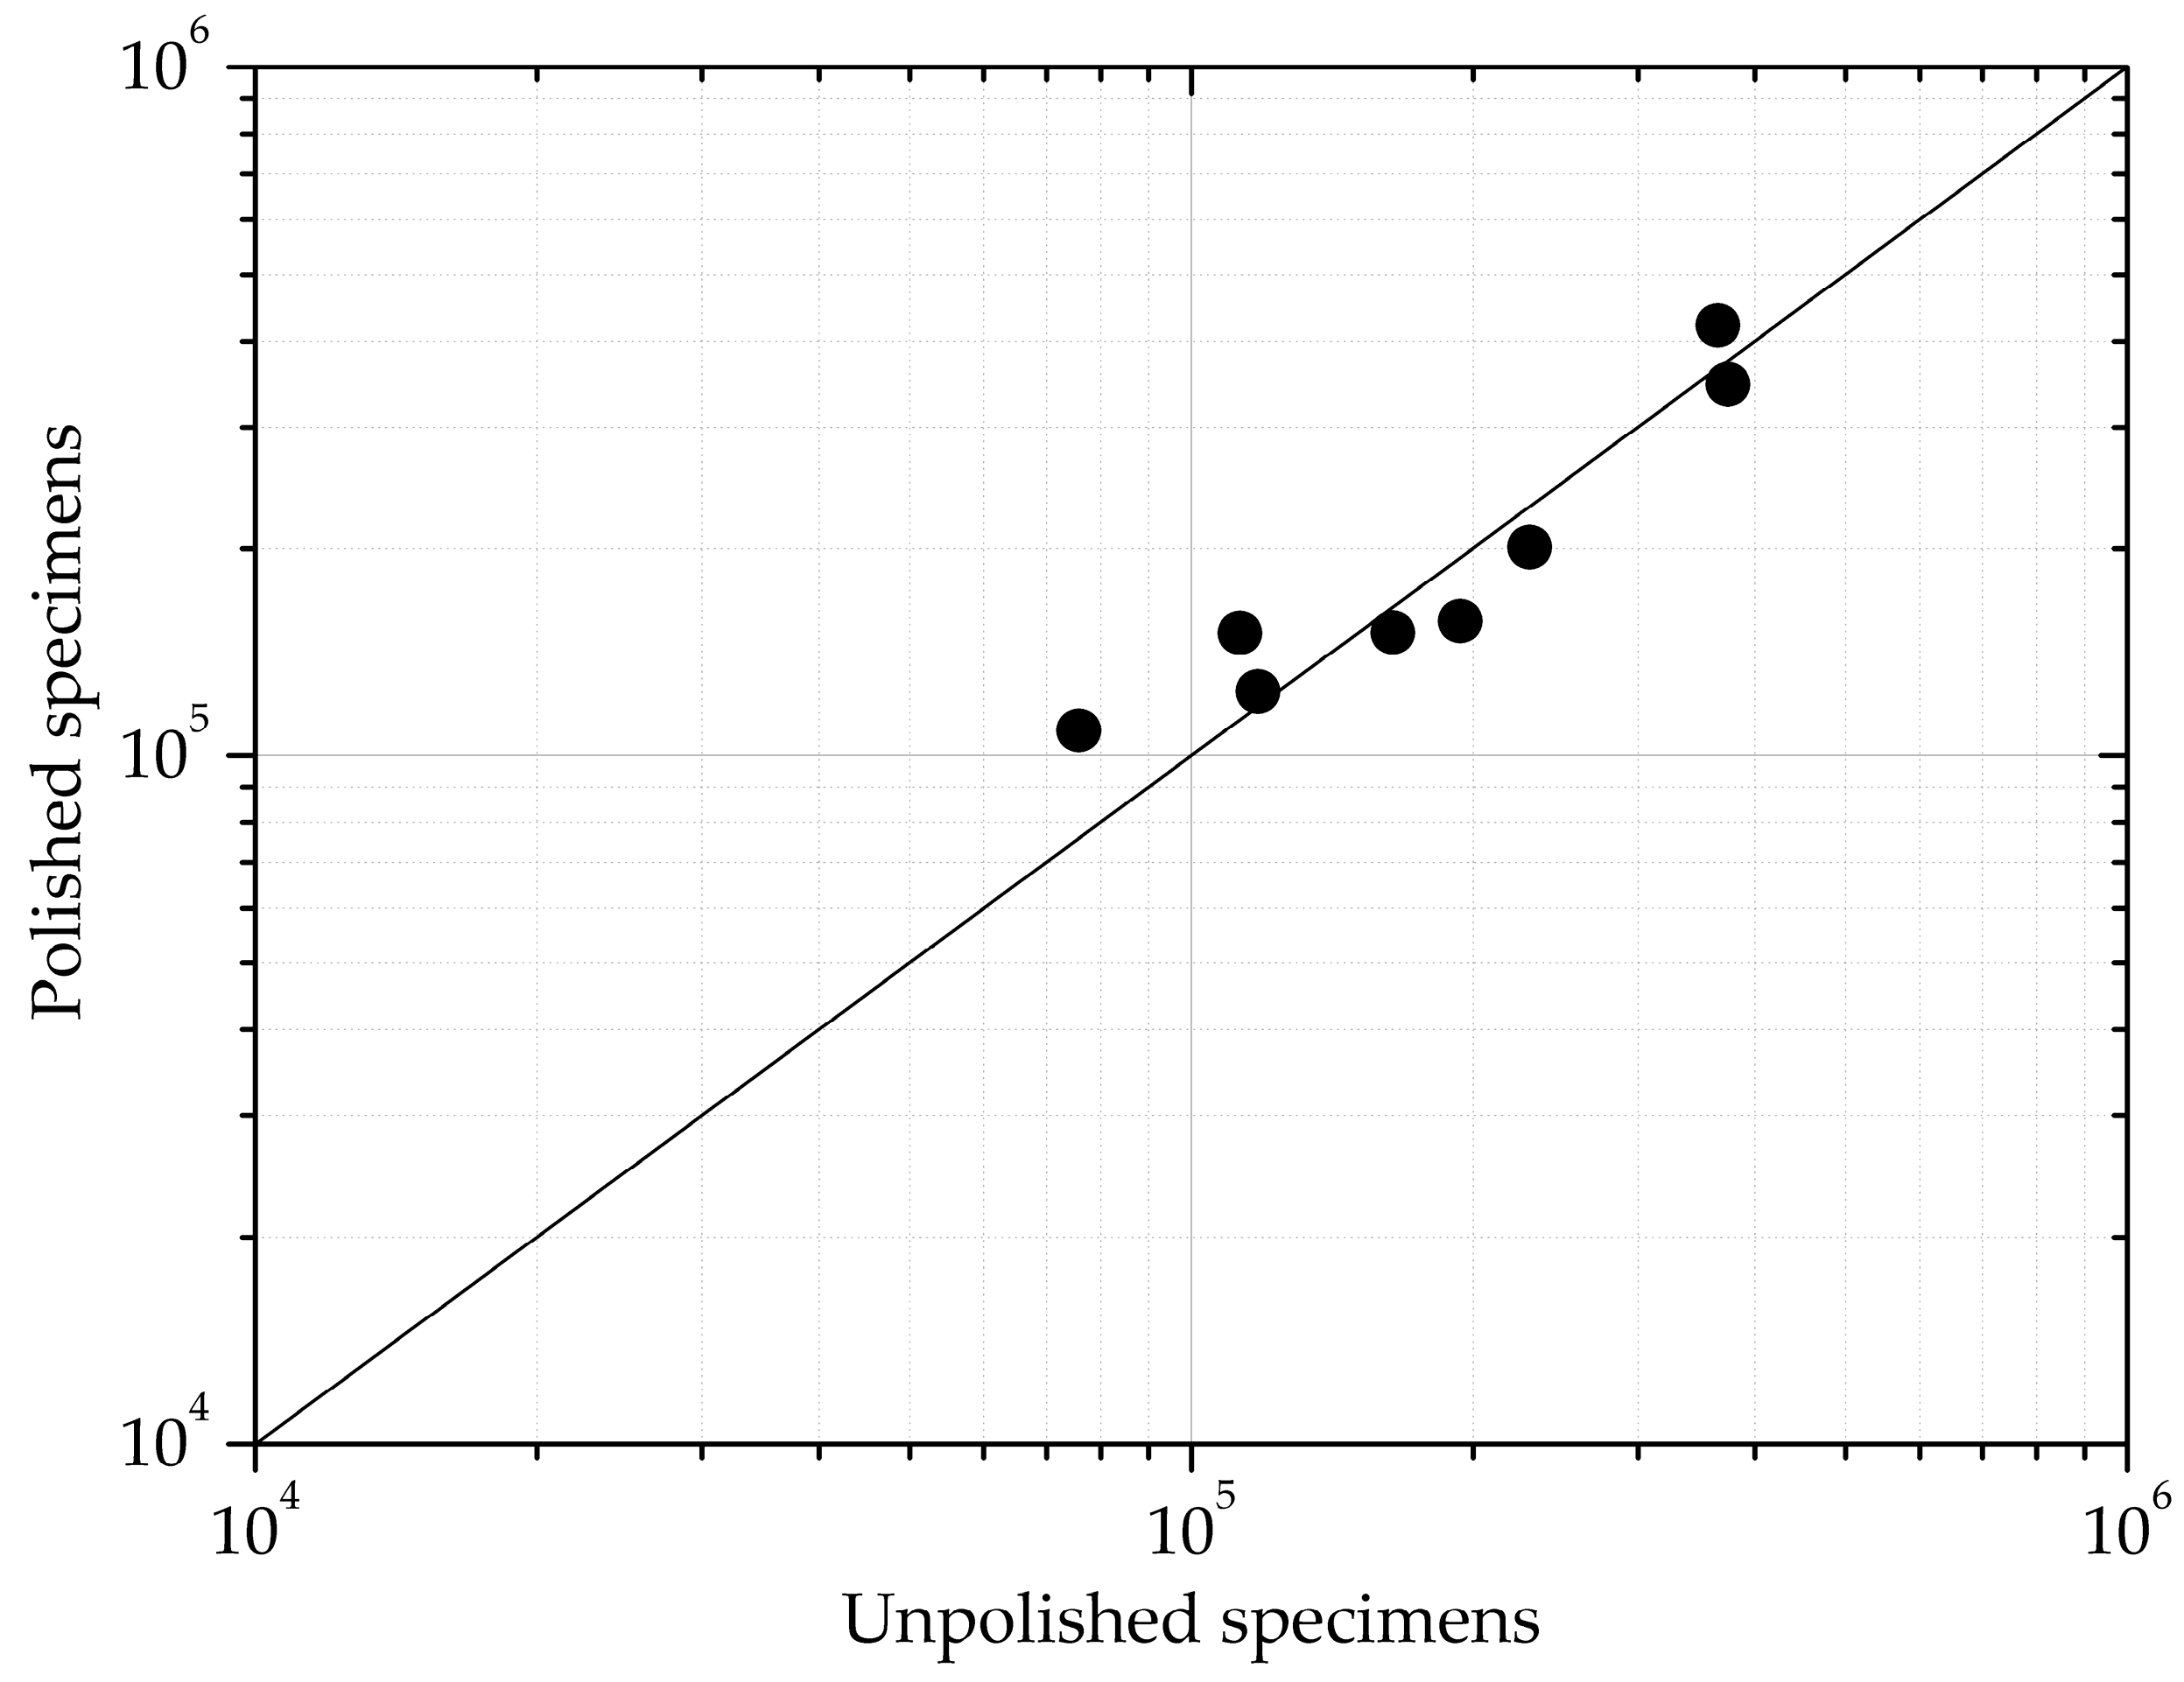
The tests results in Table 5 are drawn in Figure 9. Again, since there are two tests for each load combination, the fatigue lives shown in this figure are the antilogarithms of the average of the logarithms of the lives of these two tests. Scatter bands are not included in this figure for the same reason as in Figure 7. It is known that in plain fatigue the surface roughness is important mainly for high cycle fatigue. The range of fatigue lives observed in this comparison lies between 80,000 and 400,000 cycles, which is considered as high cycle fatigue. Of course, more tests would be desirable but we think there are enough to suggest that there is no significant modification of fretting fatigue life in the geometry studied. The lack of dependency on the surface roughness is probably due to the rapid initiation phase in fretting fatigue due to the high stresses near the surface, as some fatigue life estimation models predict [51]. Therefore, this phase, where the roughness has a major effect, is very short compared to the total life.
As mentioned before, the direct effect of polishing is to slightly modify the residual stress near the surface and decrease the friction coefficient. The latter of these effects should, in theory, increase life, but as can be seen in Figure 9, the conclusion is that polishing the surface does not significantly change fatigue life. Therefore, the effects of these two factors seems negligible in this case. Of course, this conclusion is not valid for plain fatigue without shot peening, where surface roughness clearly affects fatigue life in high-cycle fatigue. The doubt would still remain for plain fatigue with specimens treated with shot peening.

3.2. Fracture Surfaces

Fracture surfaces were analyzed with scanning electron microscopy (SEM). The microscope used was the model Teneo from the manufacturer FEI (Hillsboro, OR, USA). Figure 10 shows the fracture surfaces on both sides of a specimen with Load Combination 2, without shot peening and interrupted at 93,740 cycles, i.e., at approximately 80% of fracture life. This figure shows that there were multiple cracks initiating that merge at relatively small crack lengths and form a unique and uniform crack front. In this case, the maximum crack depth measured on both sides was 0.4 and 0.5 mm.
Figure 11 and Figure 12 show the crack front in the two specimens tested with Load Combination 2 and without shot peening. In this case, since the complete fracture of the specimen was finally reached, the photographed crack front was that of the crack starting from the opposite side of the one that provoked the final failure. In these two tests, the crack front was also uniform at around 0.6 mm, except for the region close to the corner, where the cracks were longer.
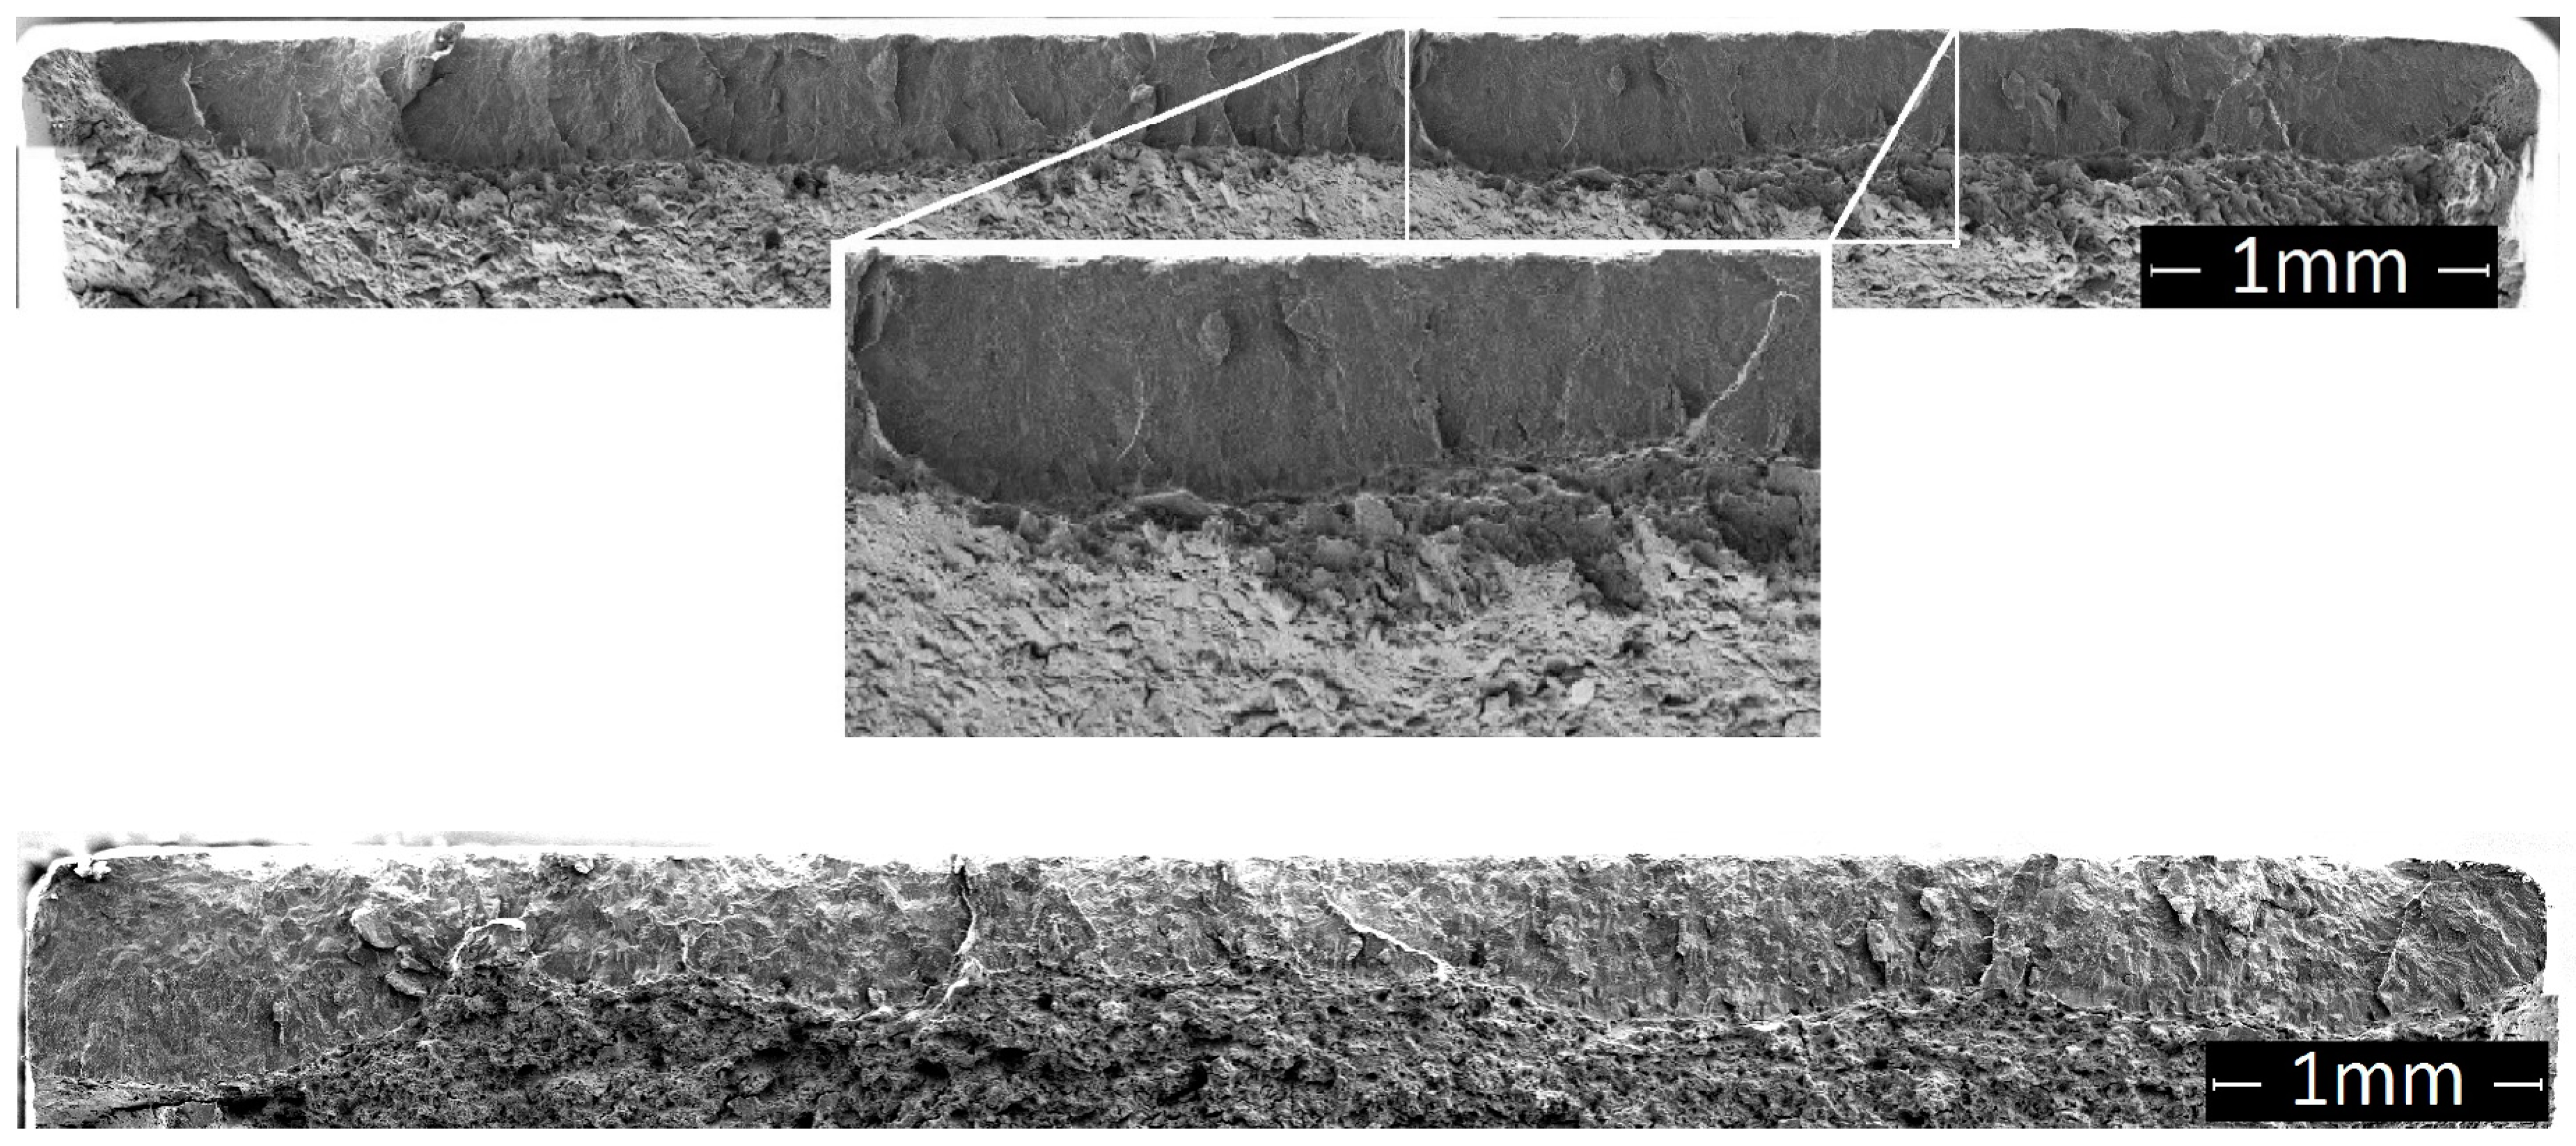
In the specimens treated with shot peening, a uniform crack front did not appear. The number of cracks found after failure on the opposite side of the contact that produces the crack that breaks the specimen is usually only one or two. This is because the initiation phase is much longer due to compressive residual stresses. The shapes are sometimes semi-elliptical (Figure 13a), and others even almost circular (Figure 13b), because, in this case, the crack is not necessarily initiated at the surface.

3.3. Scar of Contact Zone

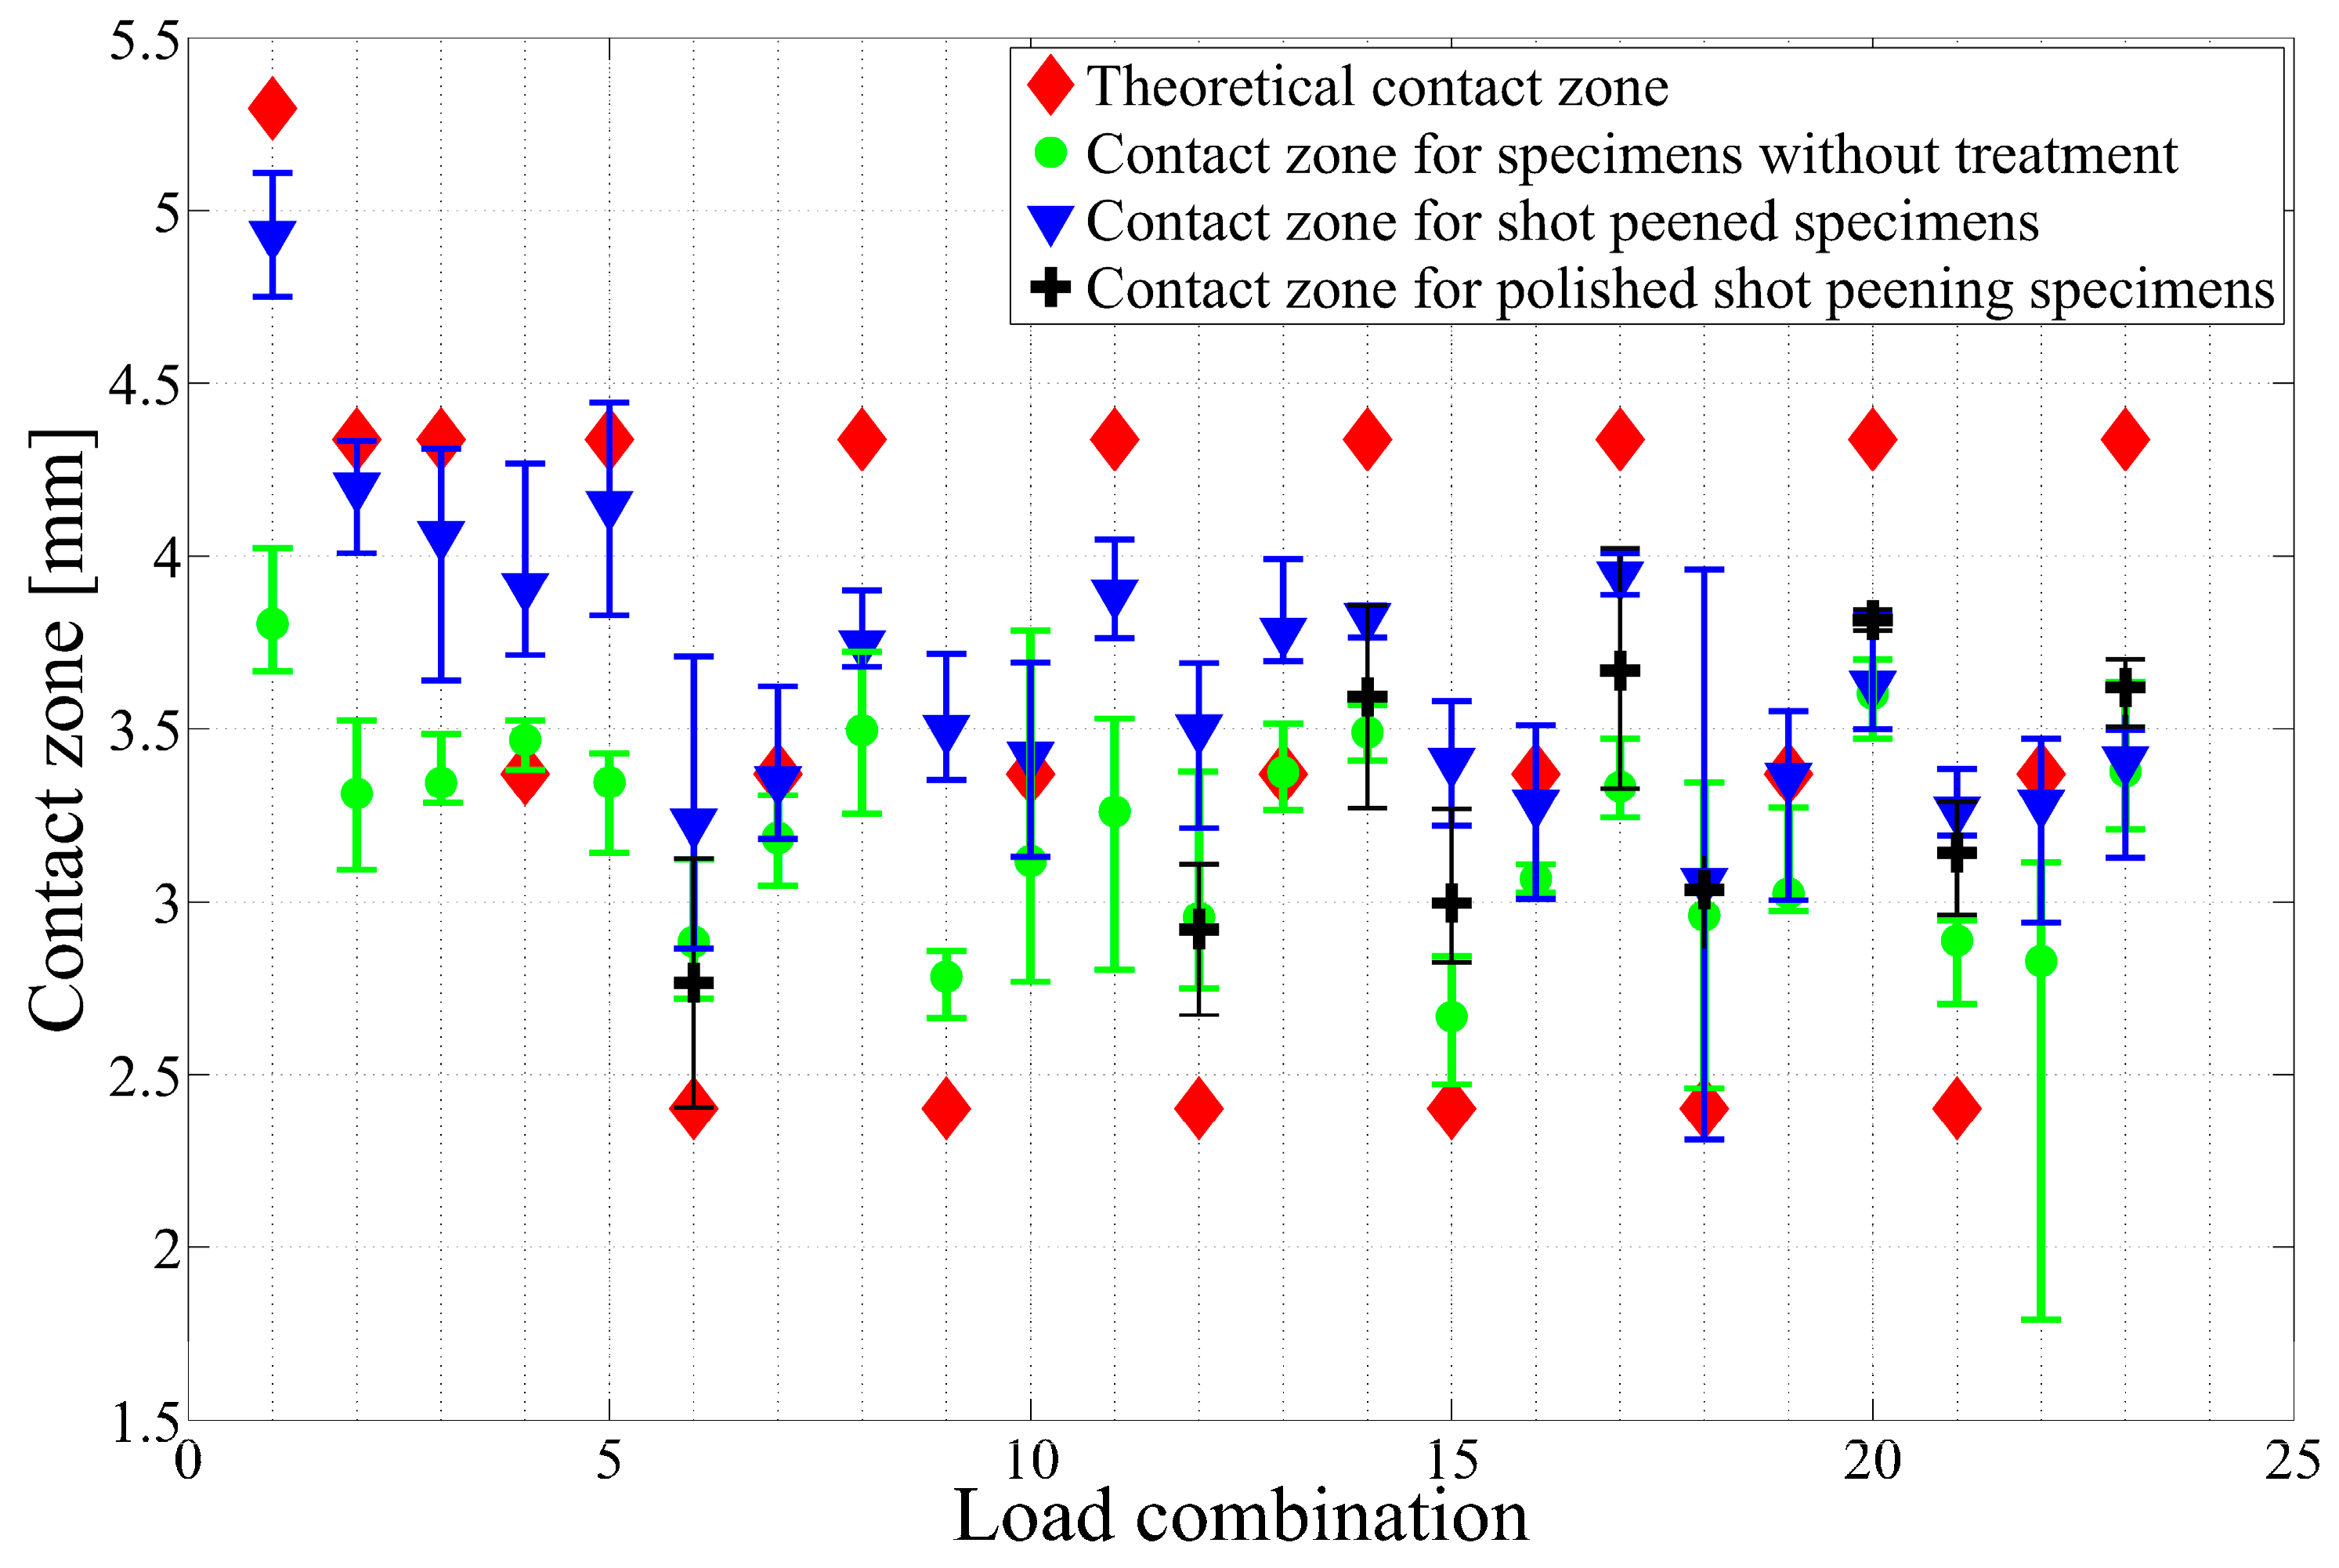
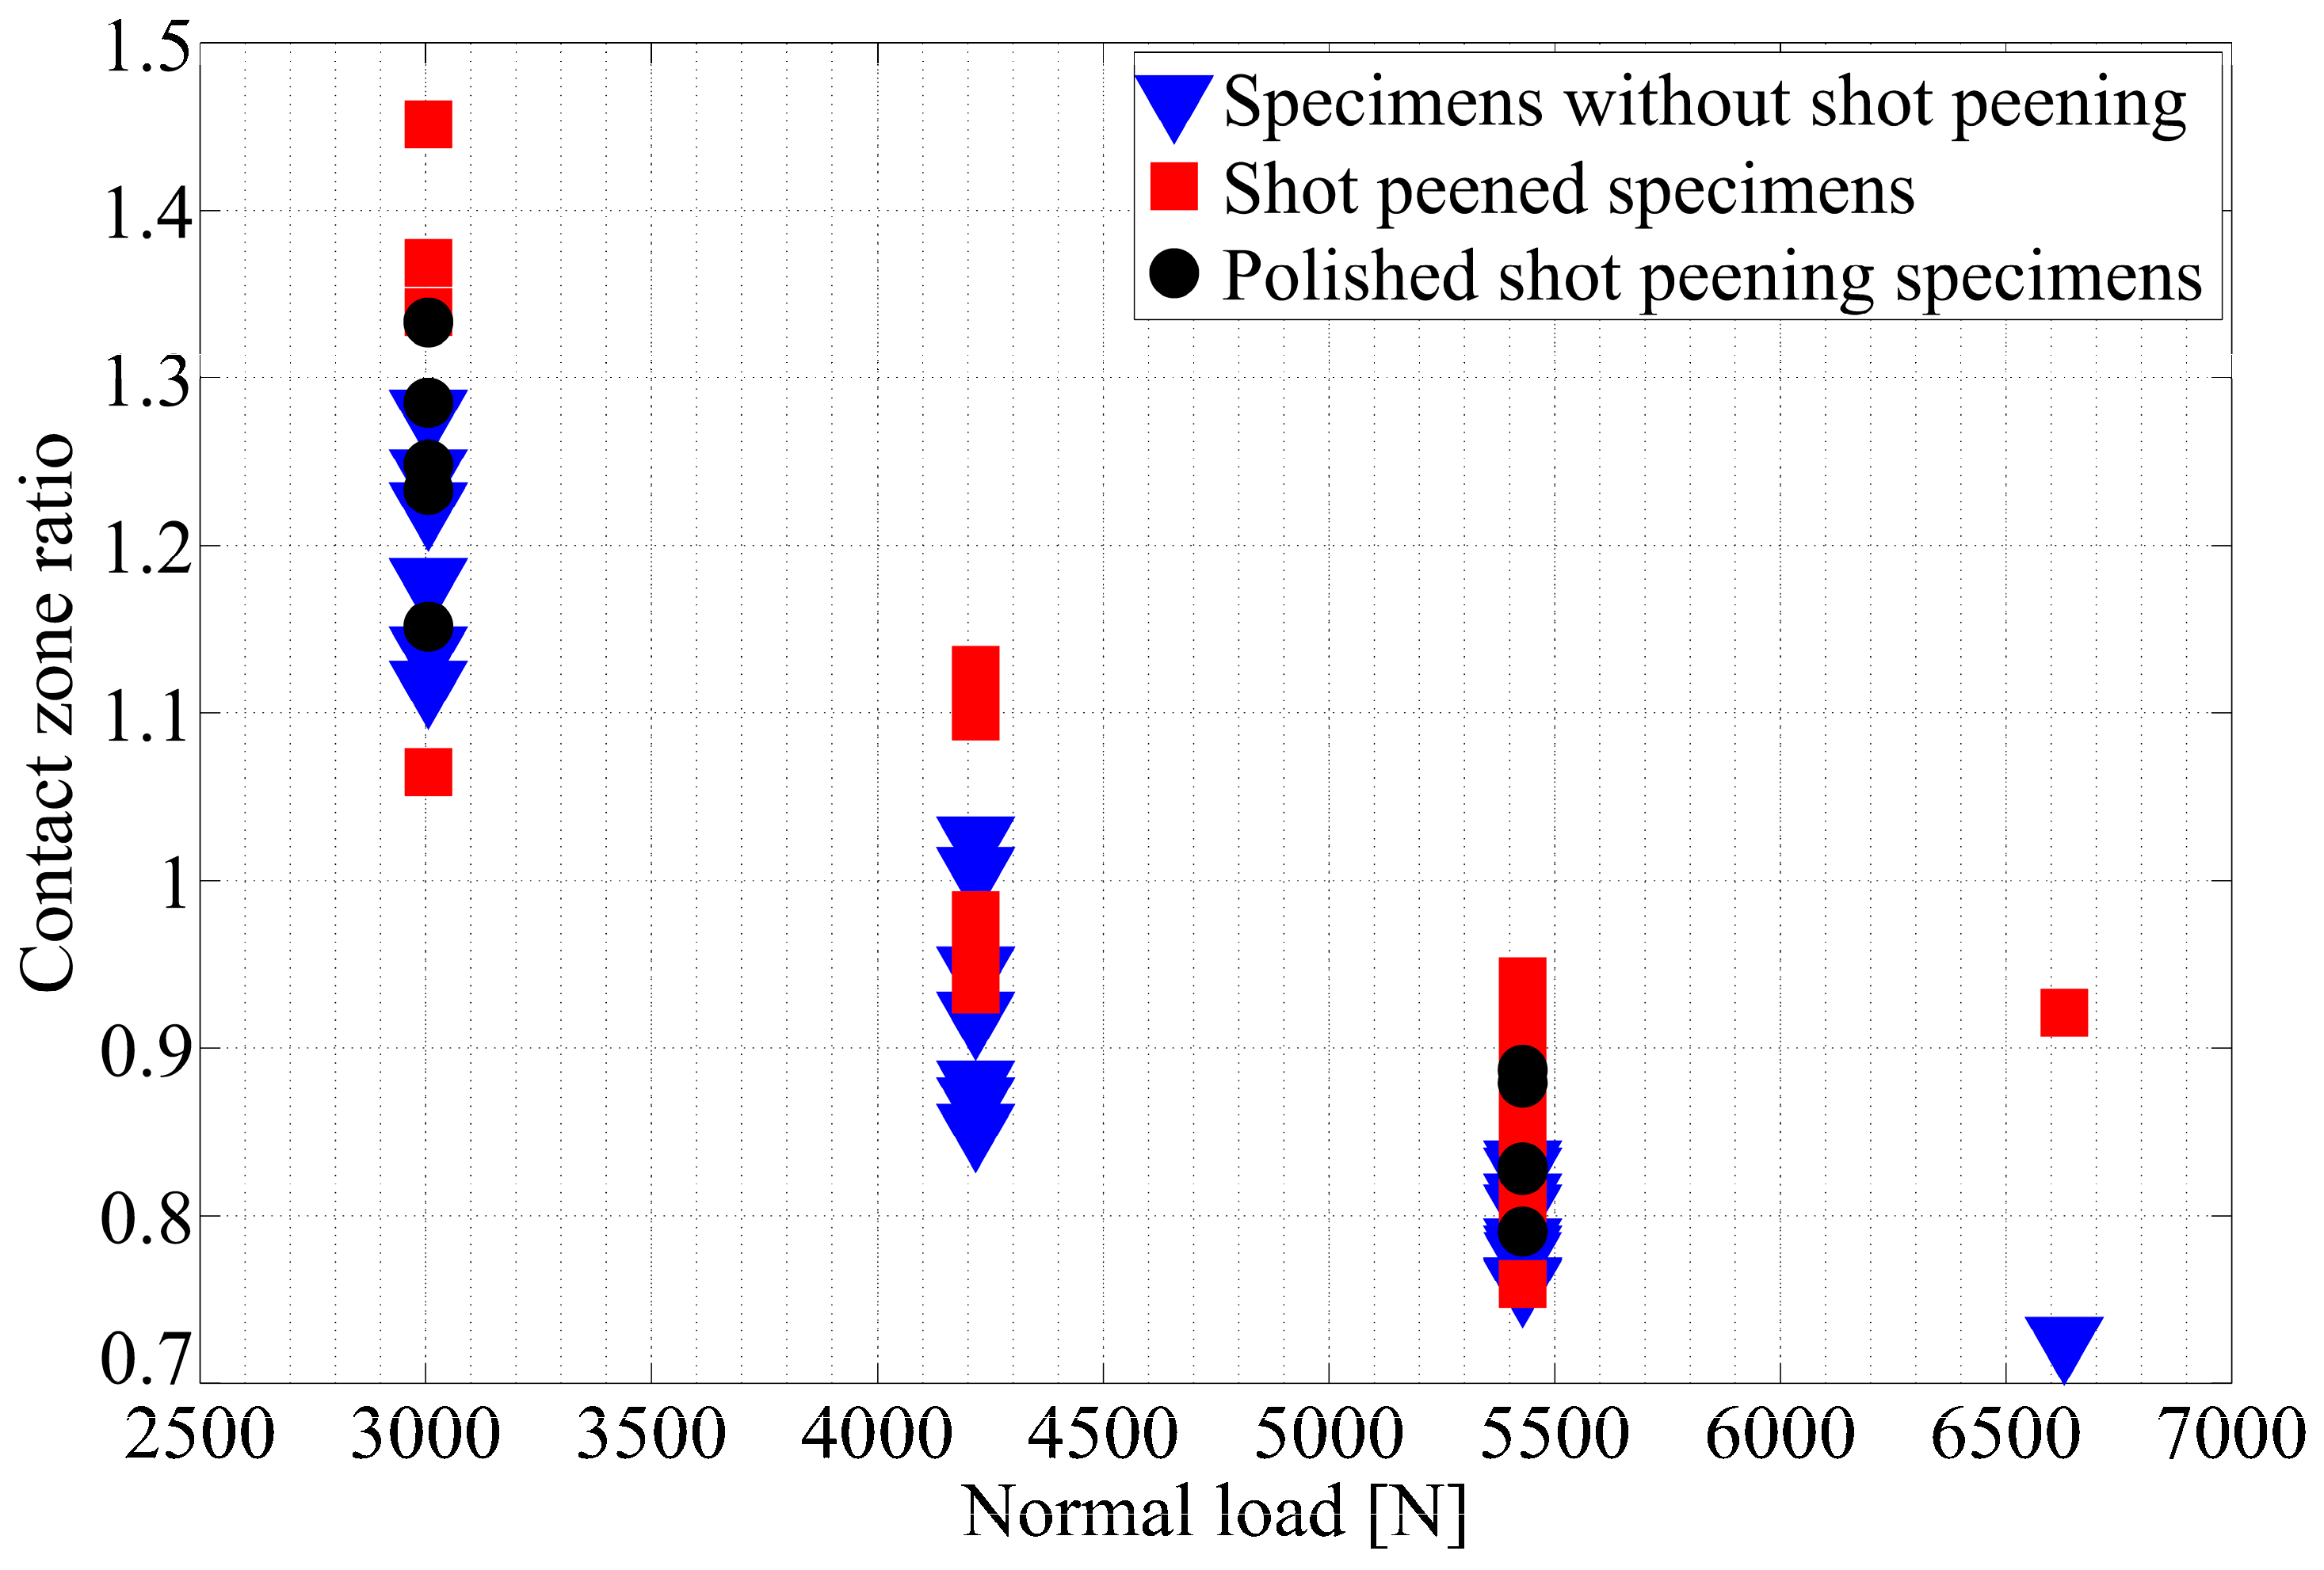
Contact width was measured for every test by means of optical microscope images of the fretting scars, and the results are shown in Figure 14. Together with the experiment values, the theoretical value obtained through Hertz’s theory is also shown (twice the value of Equation 1). Of course, this theory assumes a perfect and smooth surface and semi-infinite solids. It is interesting to see that in some cases, width is overestimated, and in others it is underestimated. The same information is shown in Figure 15, but representing the ratio of the experimental value over the theoretical value for different values of the normal load. Figure 15 shows that for low values of the normal load, contact width is underestimated, and for high values of the normal load, it is overestimated. This figure also shows that specimens with the shot-peening treatment had higher contact width, probably due to higher roughness.
The use of the expression from Hertz’s theory may lead to errors of up to 40% in contact size, and therefore errors in the value of the stresses.

4. Cyclic Relaxation of Residual Stress

When used as a palliative against fatigue, an important aspect of residual stress is its stability. Cyclic loads, even those producing stresses below the yield limit, are known to relax the residual-stress field [52,53]. To quantify relaxation in the present experimental campaign, a series of interrupted fretting-fatigue tests were performed. Next, after the required load cycles, test specimens were withdrawn from the testing device in order to measure actual residual stress. Once the residual stress is measured after the target number of cycles, the test specimen cannot be tested again because the contact zone is destroyed during the measurement, so every measurement corresponds to a different test specimen. Measurements were made in a place very close to the right edge of the contact zone (contact trailing edge) but always inside the slip zone (see Figure 16), which is the place where fretting-fatigue cracks are experimentally found and where stresses are higher.
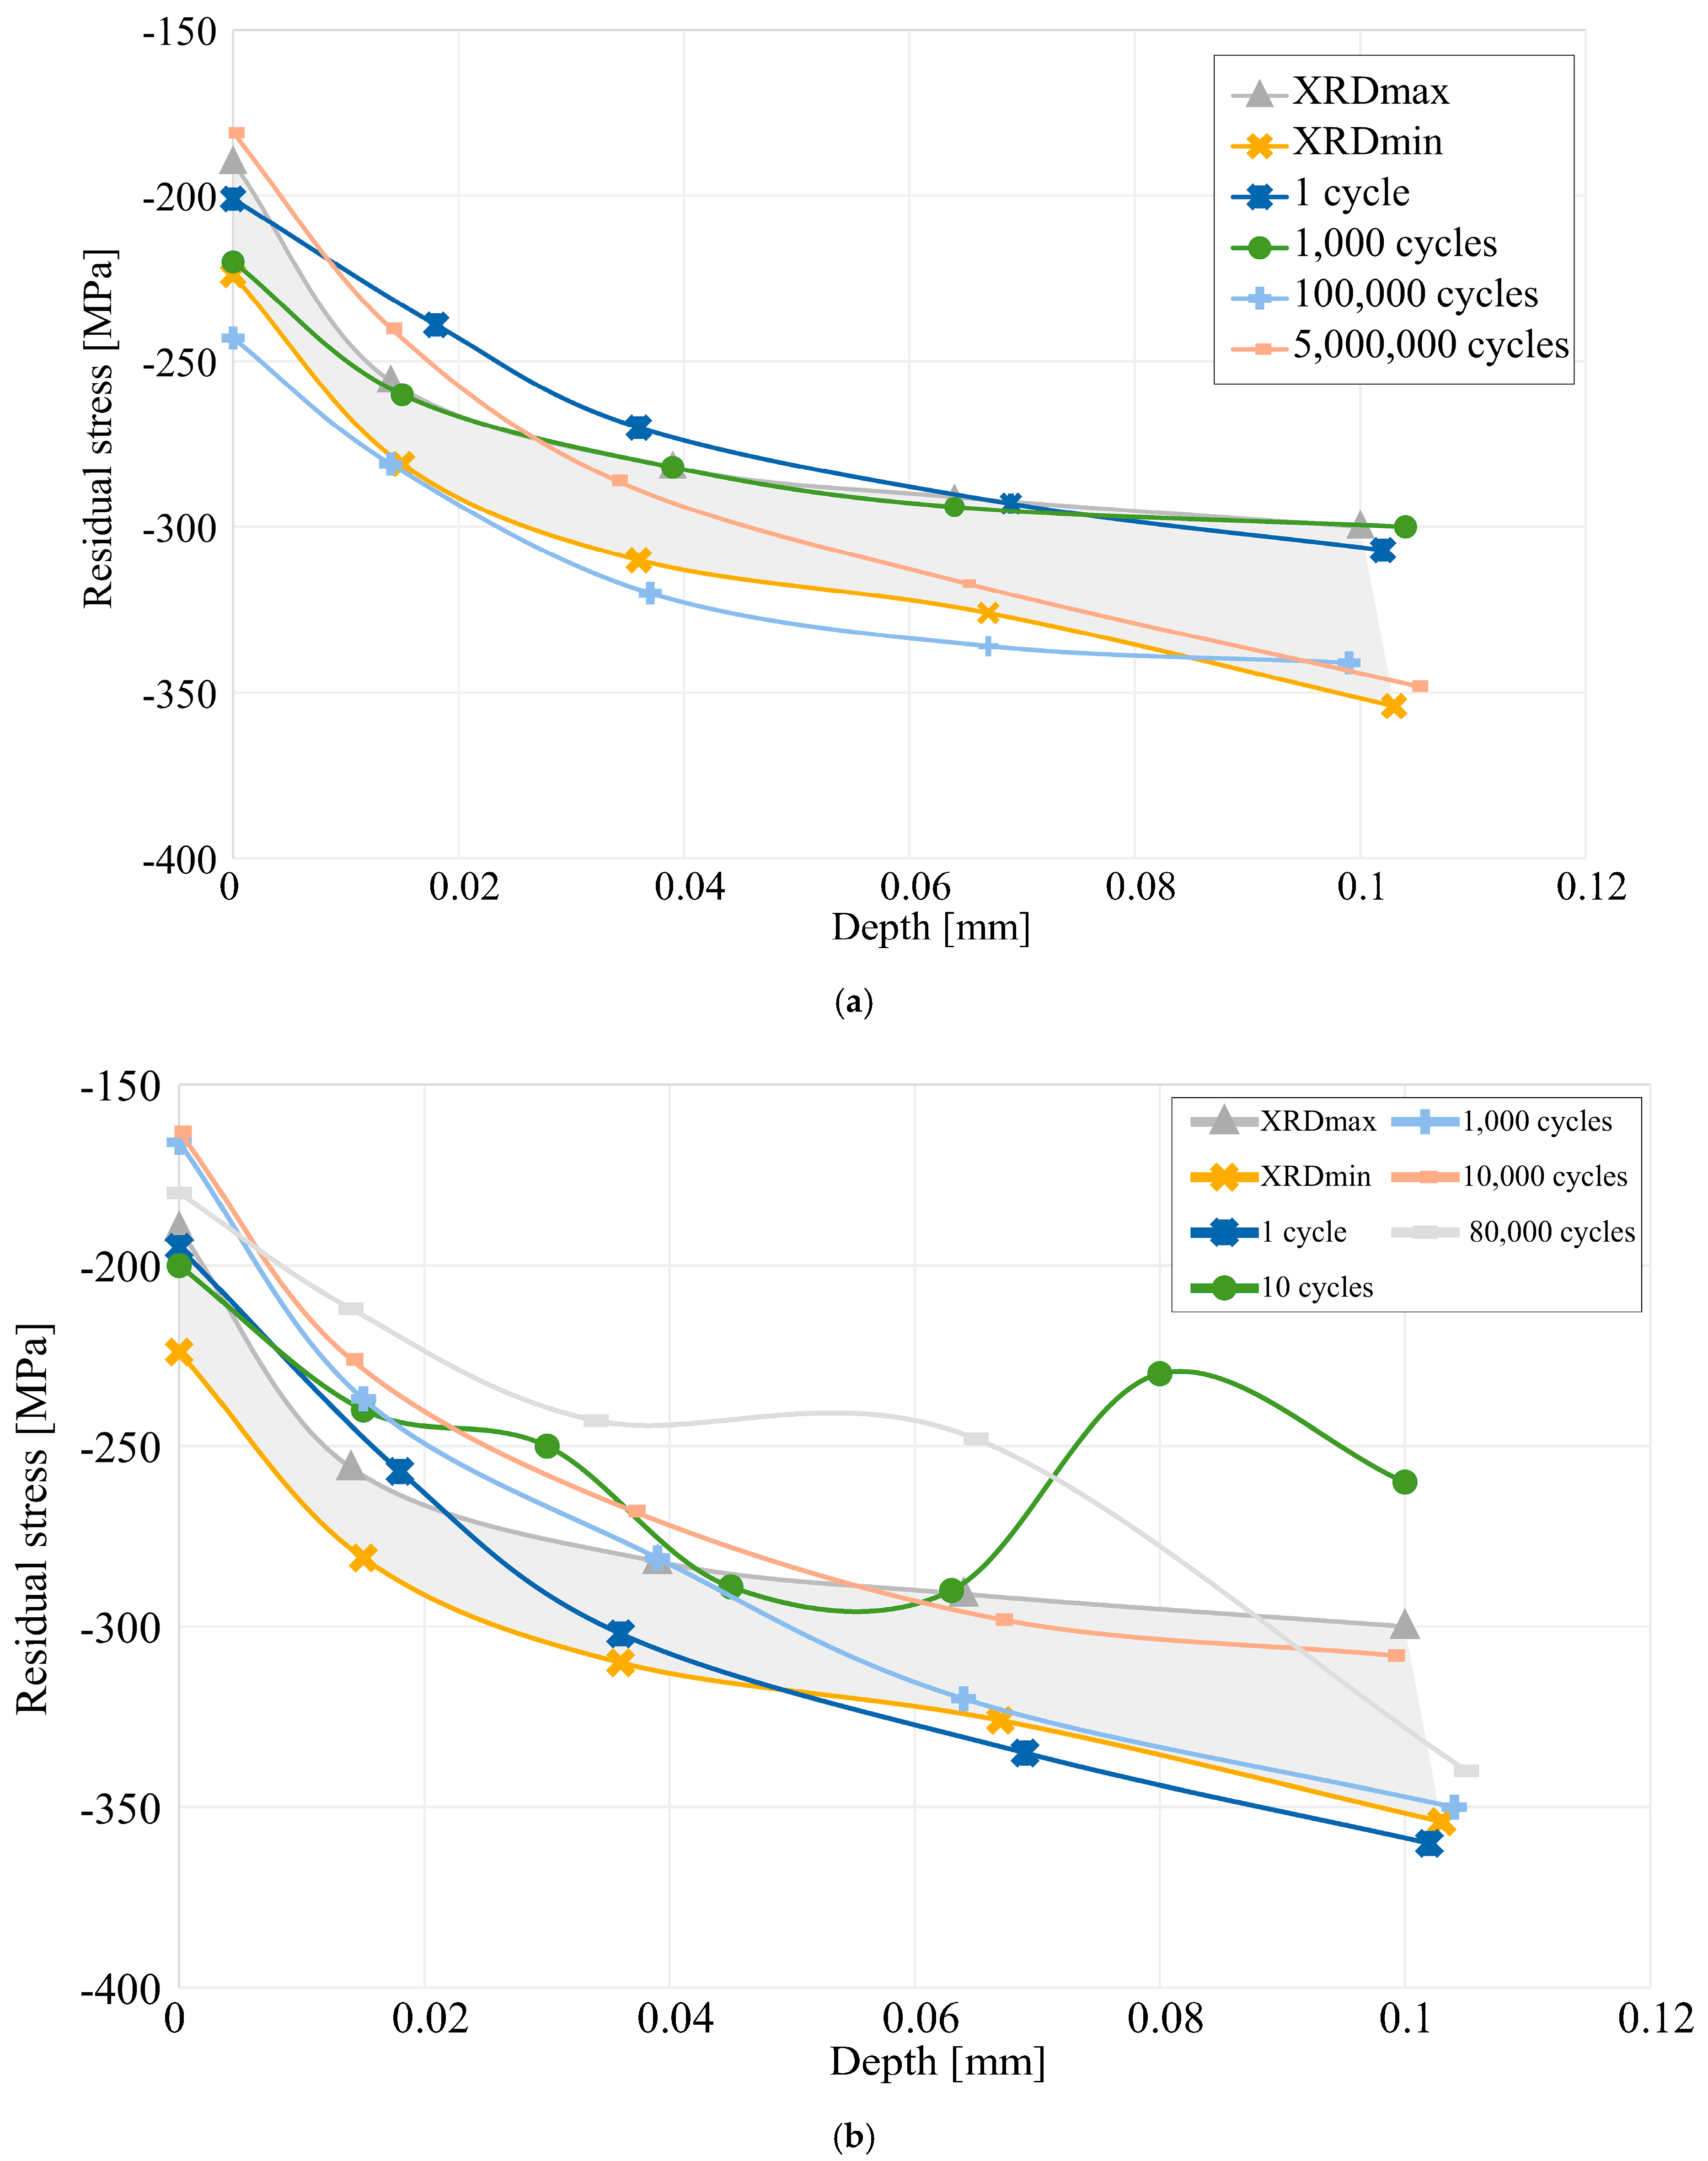
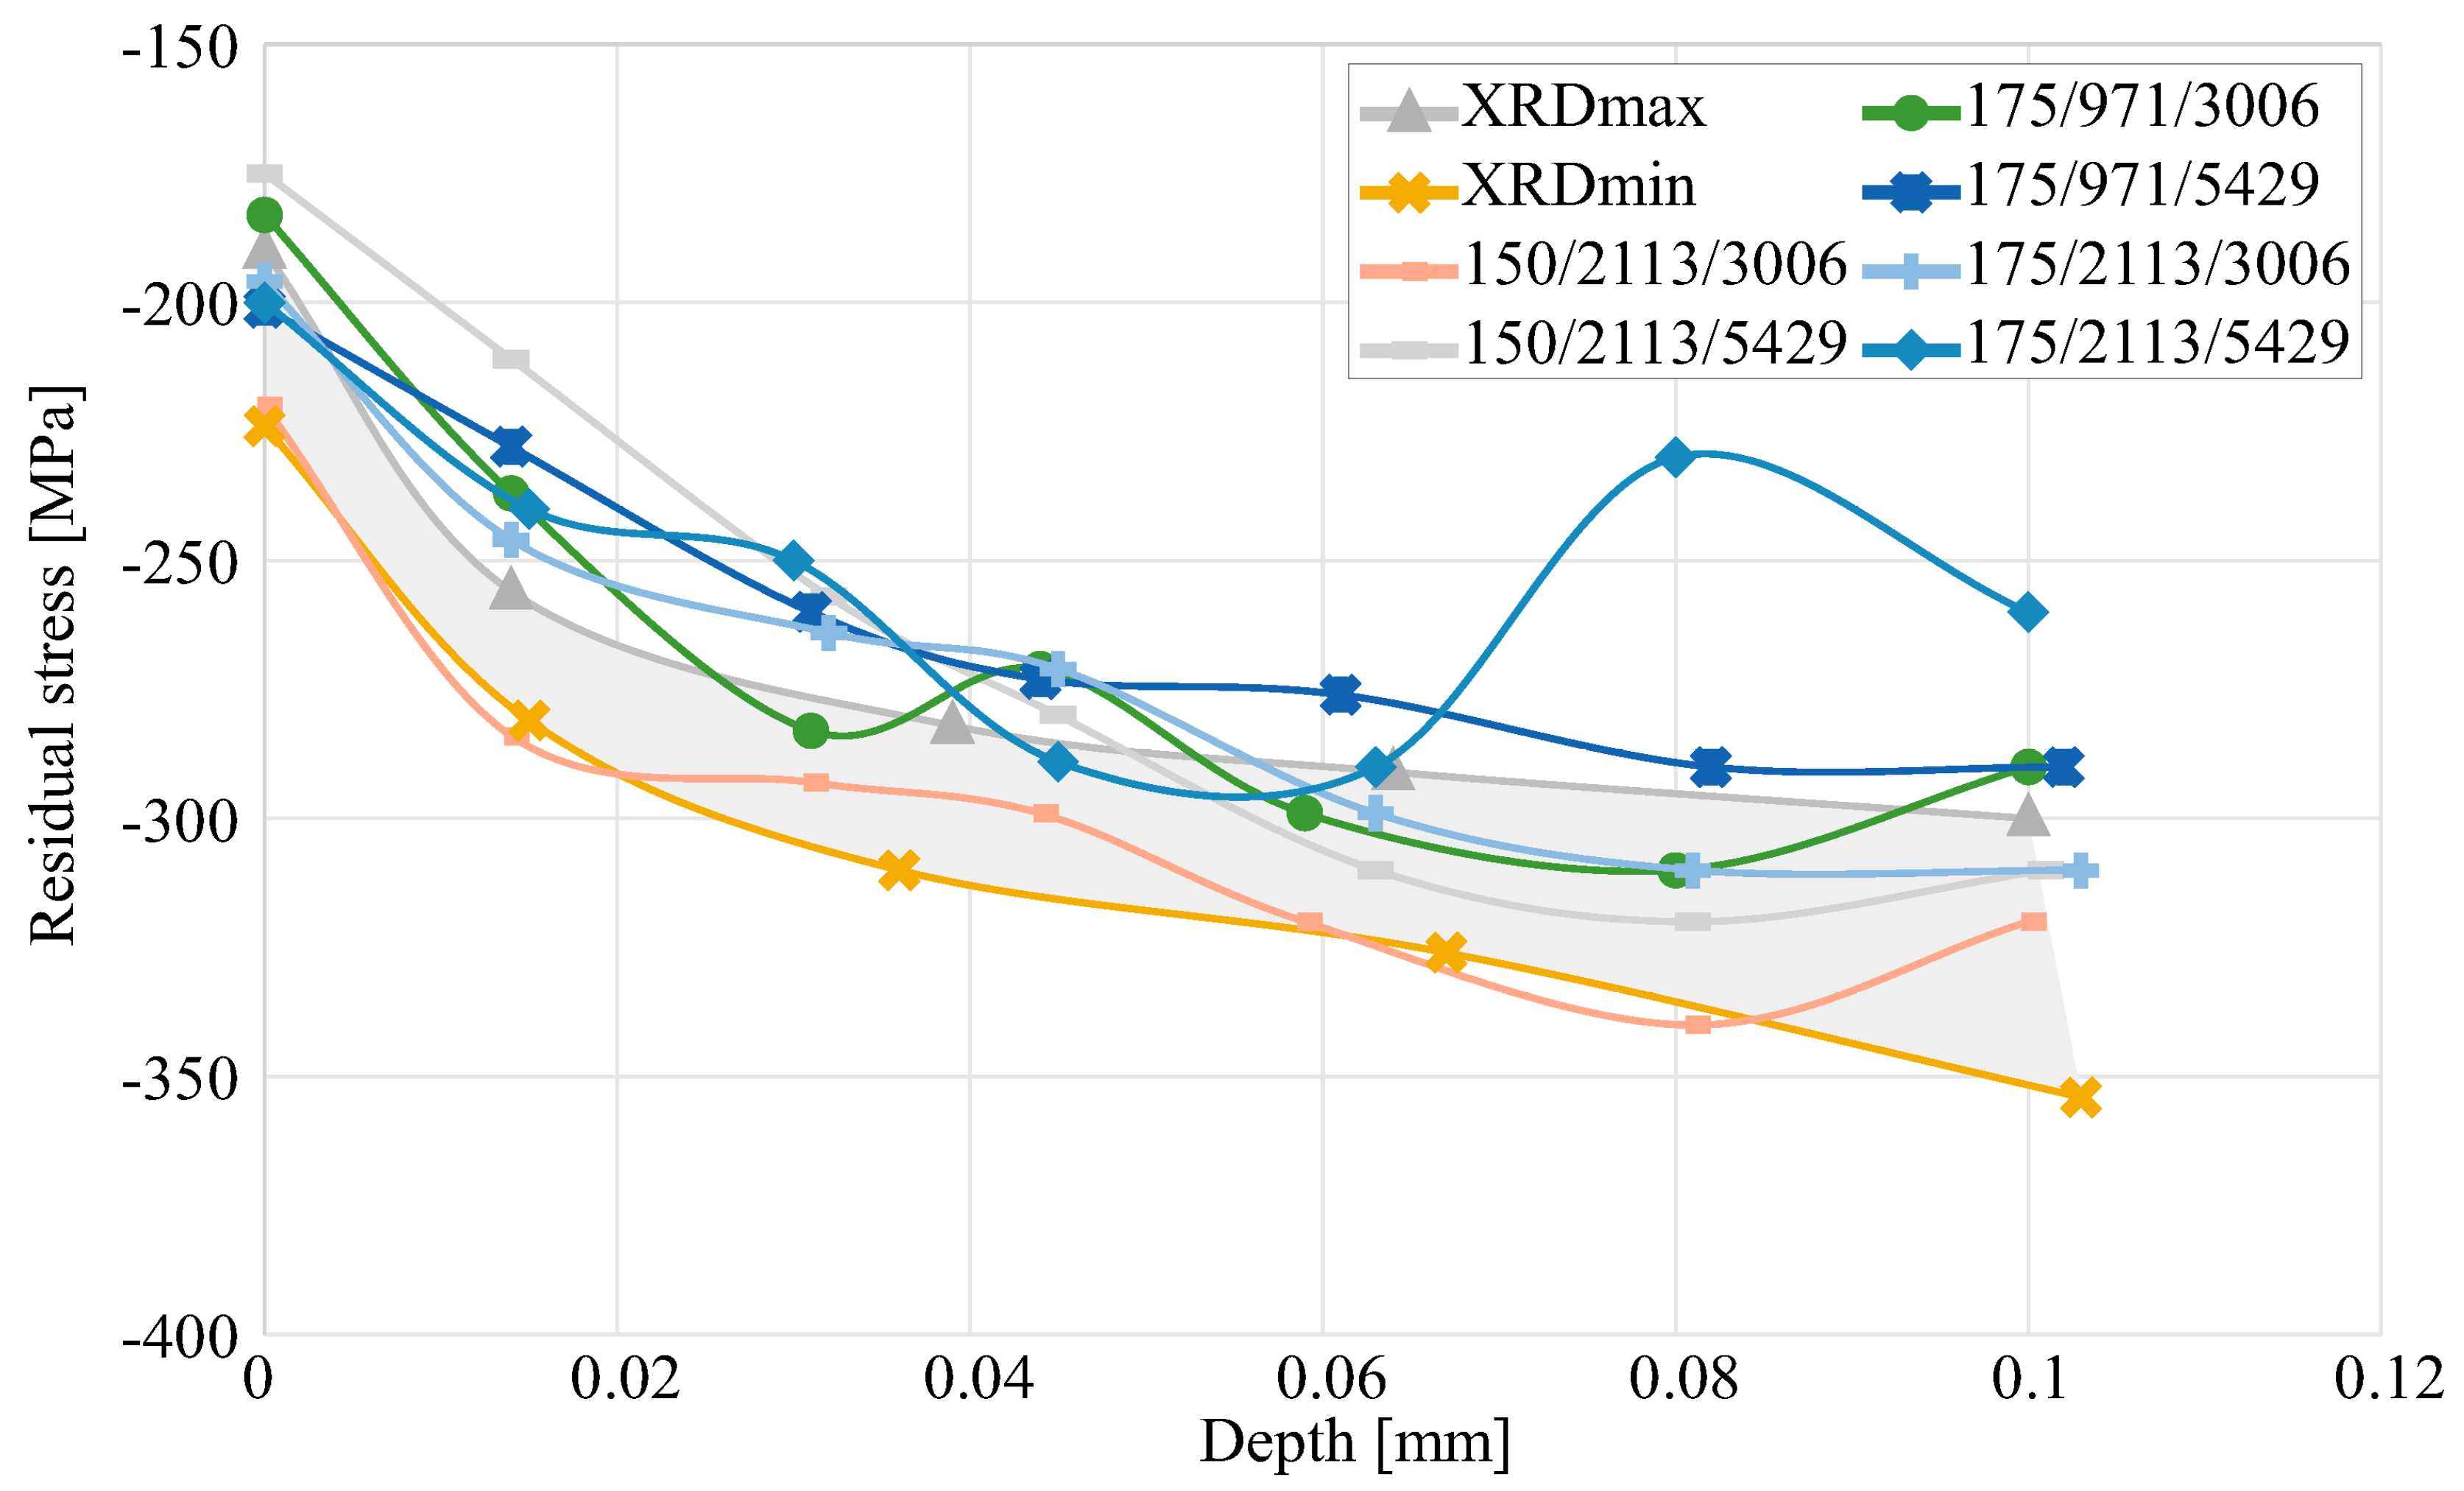
In the present work, a considerable number of fretting load combinations were used in the experimental campaign. Because it is impractical to analyze cyclic relaxation in all these cases, only the relaxation produced in the lowest (σ = 70 MPa, Q = 971 N, N = 6629 N) and the highest (σ = 175 MPa, Q = 2113 N, N = 5429 N) load combination was measured in a preliminary study. In these two load cases, the residual stress field after a different number of fretting cycles was measured. Figure 17 shows the residual stress distributions measured via XRD in these tests; the area between the curves represented as XRDmax and XRDmin represents the scatter band for the residual stress measurement in uncycled test specimens. Results for depths beyond 0.1 mm are not shown in these figures because these residual stress measurements were outside the EN 15305:2008 standard. Regarding the results obtained with the lowest load combination, Figure 17a shows that there is no clear correlation between the variation of residual stress and the number of cycles; for the first thousand cycles, some relaxation is appreciable. Then, after 105 cycles, values return to values that are very close to those originally measured (0 cycles). Finally, after 5 × 10⁶ cycles, residual stress returns to values that depending on depth, range between those obtained at 1 and 105 cycles. Perhaps the actual relaxation of the residual stress produced on these tests has a clear pattern, but it is likely that the resolution and accuracy of the measurement techniques used in this work, and the variability in the residual-stress field between different test specimens, do not allow us to outline this pattern. On the other hand, for the highest load combination, Figure 17b depicts a clearer pattern in the cyclic relaxation of residual stress. In such a case, and excluding a few isolated points, the higher the number of elapsed cycles, the higher the observed relaxation is.
The above results suggest two things: first, if some relaxation occurs, this is noticeable even in the first load cycles, and second, a load combination with high load levels needs to be used in order to measure the cyclic relaxation with a certain confidence. All these facts led us to measure the residual stresses after 10 fretting load cycles and use the fretting load combinations shown in Table 4.
Figure 18 shows the residual stress distribution before testing and after 10 load cycles in all loading cases shown in Table 7. This figure shows that with the exception of the first load combination considered in Table 7 (σ = 150 MPa, Q = 2113 N, N = 3006 N), noticeable relaxation of residual stress was produced in the first 10 load cycles in all cases. This important fact leads us to think that in the present fretting-fatigue tests, relaxation of residual stresses was mainly due to plastic flow. Analyzing and comparing the load combinations in which only one fretting load is changed, we can observe the exerted influence by this fretting load on relaxation. Thus, it is possible to see that for load combinations with the same values for normal and tangential forces, the higher the amplitude of the axial bulk stress is, the higher the stress relaxation is. We can also analyze load combinations having equal normal force and axial bulk stress and observe that the tangential force has a slight influence on the relaxation of residual stresses. Finally, and comparing load combinations with equal axial stress and tangential force, it was observed that a higher normal force implies greater stress relaxation, although this is more influential for small axial tension values.

5. Conclusions

This paper shows the results of 114 fretting-fatigue tests with cylindrical contact where the mechanical treatment of shot peening was studied. Different aspects of this treatment were analyzed, namely, improvement of fatigue life, distribution of residual stresses and their relaxation, and surface roughness and hardness. The main conclusions are detailed below.
The fatigue-life improvement of the shot-peening process follows an approximate power law, where at lives of around 1000 cycles in specimens without shot peening, there is supposed to be no improvement, and around 105 cycles, the improved life is in the order of millions.
The shot-peening process creates a very rough surface that would be detrimental in plain fatigue, but it was shown in these tests that polishing the surface, leaving it as smooth as before the treatment, does not improve life.
The residual stress field changes due to the application of loading cycles, but this relaxation seems to mainly be due to the plastic flow at the beginning of the test in fewer than 10 cycles. As was expected, the degree of relaxation depends on the applied loads, with the value of the bulk stress being more important.
As a final comment, many data on fretting fatigue with a cylindrical contact with and without a shot-peening treatment were generated. All these data can be included in the “database” that could be generated with the results of all published papers from different authors. This would be increasingly relevant in the new era of big data.

Author Contributions

Conceptualization, J.V., C.N. and J.D.; methodology, J.V. and C.N.; software, V.M.; validation, J.D.; formal analysis, V.M.; investigation, V.M.; resources, C.N.; data curation, V.M.; writing—original draft preparation, V.M.; writing—review and editing, J.V., C.N. and J.D.; visualization, J.V. and C.N.; supervision, J.D.; project administration, J.V. and C.N.; funding acquisition, J.D.

Funding

This research was funded by the Junta de Andalucía through the project P12-TEP-2632.

Acknowledgments

Special thanks to Metal Improvement Company, Seville, for their valuable technical help in the selection of process parameters and application of the shot-peening treatment to all the test specimens used in this work.

Conflicts of Interest

The authors declare no conflict of interest. The funders had no role in the design of the study; in the collection, analyses, or interpretation of data; in the writing of the manuscript or in the decision to publish the results.

References and Notes

  1. Waterhouse, R.; Lindley, T. Fretting Fatigue; ESIS Publication 18: London, UK, 1994. [Google Scholar]
  2. Hoeppner, D.W.; Chandrasekaran, V. Fretting Fatigue: Current Technology and Practices; Elliot, C.B., Ed.; ASTM STP 1367: Philadelphia, PA, USA, 2000. [Google Scholar]
  3. Domínguez, J. Cyclic variations in friction forces and contact stresses during fretting fatigue. Wear 1998, 218, 43–53. [Google Scholar] [CrossRef]
  4. Madge, J.J.; Leen, S.B. The critical role of fretting wear in the analysis of fretting fatigue. Wear 2007, 263, 542–551. [Google Scholar] [CrossRef]
  5. Magaziner, R.; Jin, O. Slip regime explanation of observed size effects in fretting. Wear 2004, 257, 190–197. [Google Scholar] [CrossRef]
  6. Cardoso, R.A.; Doca, T.; Néron, D.; Pommier, S.; Araújo, J.A. Wear numerical assessment for partial slip fretting fatigue conditions. Trib. Int. 2019, 136, 508–523. [Google Scholar] [CrossRef]
  7. Golden, P.J.; Hutson, A.; Sundaramc, V.; Arpsd, J.H. Effect of surface treatments on fretting fatigue of Ti–6Al–4V. Int. J. Fat. 2007, 29, 1302–1310. [Google Scholar] [CrossRef]
  8. Hutson, A.L.; Niinomi, M. Effect of various surface conditions on fretting fatigue behaviour of Ti–6Al–4V. Int. J. Fat. 2002, 24, 1223–1234. [Google Scholar] [CrossRef]
  9. Fu, Y.; Wei, J. Some considerations on the mitigation of fretting damage by the application of surface-modification technologies. J. Mat. Proc. Technol. 2000, 99, 231–245. [Google Scholar] [CrossRef]
  10. Navarro, C.; Muñoz, S.; Domínguez, J. Fracture mechanics approach to fretting fatigue behaviour of coated aluminium alloy components. J. Strain Anal. Eng. Des. 2014, 49, 66–75. [Google Scholar] [CrossRef]
  11. Ganesh Sundara Raman, S.; Jayaprakash, M. Influence of plasma nitriding on plain fatigue and fretting fatigue behaviour of AISI 304 austenitic stainless steel. Surf. Coat. Technol. 2007, 201, 5906–5911. [Google Scholar] [CrossRef]
  12. Golden, P.J.; Michael, J. Life prediction of fretting fatigue with advanced surface treatments. Mater. Sci. Eng. A 2007, 468–470, 15–22. [Google Scholar]
  13. Prevéy, P.S.; Jayaraman, N. Mitigation of fretting fatigue damage in blade and disk pressure faces with low plasticity burnishing. J. Eng. Gas Turbines Power 2010, 132, 61–69. [Google Scholar] [CrossRef]
  14. Srinivasan, S.; Garcia, D.B. Fretting fatigue of laser shock peened Ti–6Al–4V. Tribol. Int. 2009, 42, 1324–1329. [Google Scholar] [CrossRef]
  15. Liu, K.K.; Michael, R. The effects of laser peening and shot peening on fretting fatigue in Ti–6Al–4V coupons. Tribol. Int. 2009, 42, 1250–1262. [Google Scholar] [CrossRef]
  16. Vázquez, J.; Navarro, C.; Domínguez, J. Experimental Results in Fretting Fatigue with Shot and Laser Peened Al 7075-T651 Specimens. Int. J. Fat. 2012, 40, 143–153. [Google Scholar] [CrossRef]
  17. Vázquez, J.; Navarro, C.; Domínguez, J. A model to predict fretting fatigue life including residual stresses. Theor. Appl. Fract. Mech. 2014, 73, 144–151. [Google Scholar] [CrossRef]
  18. Zhang, X.; Liu, D. Effect of shot peening on fretting fatigue of Ti811 alloy at elevated temperature. Int. J. Fat. 2009, 31, 889–893. [Google Scholar] [CrossRef]
  19. Yang, Q.; Zhou, W. Effect of shot-peening on the fretting wear and crack initiation behavior of Ti-6Al-4V dovetail joint specimens. Int. J. Fat. 2018, 107, 83–95. [Google Scholar] [CrossRef]
  20. Majzoobi, G.H.; Abbasi, F. On the effect of shot-peening on fretting fatigue of Al7075-T6 under cyclic normal contact loading. Surf. Coat. Tech. 2017, 328, 292–303. [Google Scholar] [CrossRef]
  21. Vázquez, J.; Navarro, C.; Domínguez, J. Analysis of the effect of a textured surface on fretting fatigue. Wear 2013, 305, 23–35. [Google Scholar] [CrossRef]
  22. Benedetti, M.; Fontanari, V.; Monelli, B.D. Plain fatigue resistance of shot peened high strength aluminium alloys: Effect of loading ratio. Procedia Eng. 2010, 2, 397–406. [Google Scholar] [CrossRef]
  23. Takahashi, K.; Osedo, H.; Suzuki, T.; Fukuda, S. Fatigue strength improvement of an aluminum alloy with a crack-like surface defect using shot peening and cavitation peening. Eng. Fract. Mech. 2018, 193, 151–161. [Google Scholar] [CrossRef]
  24. Benedetti, M.; Fontanari, V.; Santus, C.; Bandini, M. Notch fatigue behaviour of shot peened high-strength aluminium alloys: Experiments and predictions using a critical distance method. Int. J. Fatigue 2010, 32, 1600–1611. [Google Scholar] [CrossRef]
  25. Honda, T.; Ramulu, M.; Kobayashi, A.S. Effect of Shot Peening on Fatigue Crack Growth in 7075-T7351. In Residual Stress Effects on Fatigue and Fracture Testing and Incorporation of Results into Design; ASTM International: West Conshohocken, PA, USA, 2009; pp. 14–33. [Google Scholar]
  26. Liu, X.; Liu, J.; Zuo, Z.; Zhang, H. Effects of Shot Peening on Fretting Fatigue Crack Initiation Behavior. Materials 2019, 12, 743. [Google Scholar] [CrossRef]
  27. Majzoobi, G.H.; Azadikhah, K.; Nemati, J. The effects of deep rolling and shot peening on fretting fatigue resistance of Aluminum-7075-T6. Mater. Sci. Eng. A 2009, 516, 235–247. [Google Scholar] [CrossRef]
  28. Wittkowsky, B.U.; Birch, P.R.; Dominguez, J.; Suresh, S. An Apparatus for Quantitative Fretting Fatigue Testing. Fatigue Fract. Eng. Mater. Struct. 1999, 22, 307–320. [Google Scholar] [CrossRef]
  29. Merati, A.; Eastaugh, G. Determination of fatigue related discontinuity state of 7000 series of aerospace aluminium alloys. Eng. Fail. Anal. 2007, 14, 673–685. [Google Scholar] [CrossRef]
  30. Czerwinski, F. Controlling the ignition and flammability of magnesium for aerospace applications. Corros. Sci. 2014, 86, 1–16. [Google Scholar] [CrossRef]
  31. Alloy 7075 Plate and Sheet: Alcoa Mill Products: SPD-10-037, 2001.
  32. Boller, C.; Seeger, T. Materials data for Cyclic Loading, 1st ed.; Elsevier: Amsterdam, The Netherlands, 1998. [Google Scholar]
  33. Tur, M.; Fuenmayor, J.; Ródenas, J.J.; Giner, E. 3D analysis of the influence of specimen dimensions on fretting stresses. Finite Elem. Anal. Des. 2003, 39, 933–949. [Google Scholar] [CrossRef]
  34. Vázquez, J.; Navarro, C.; Domínguez, J. A new method for obtaining the stress field in plane contacts. Int. J. Solids. Struct. 2012, 49, 3659–3665. [Google Scholar] [CrossRef] [Green Version]
  35. Vázquez, J.; Navarro, C.; Domínguez, J. Explicit equations for sub-surface stress field in plane contacts. Int. J. Mech. Sci. 2013, 67, 53–58. [Google Scholar] [CrossRef]
  36. AMS2430: Shot peening, automatic. SAE Standards: AMS B Finishes Processes and Fluids Committee, 2009.
  37. Watanabe, Y.; Hasegawa, N.; Endo, H.; Marui, E.; Aoki, Y. An effect of shot peening on fretting fatigue. In Proceedings of the ICSP-7, Warsaw, Poland, 28–30 September 1999; pp. 127–134. [Google Scholar]
  38. Waterhouse, R.B.; Trowsdale, A.J. Residual stress and surface roughness in fretting fatigue. J. Phys. D 1992, 25, A236–A237. [Google Scholar] [CrossRef]
  39. Schajer, G.S. Measurement of Non-Uniform Residual Stresses Using the Hole Drilling Method, Part I—Stress Calculation Procedures. ASME J. Eng. Mater. Technol. 1988, 110, 318–342. [Google Scholar] [CrossRef]
  40. Schajer, G.S. Measurement of Non-Uniform Residual Stresses Using the Hole Drilling Method, Part II—Practical Application of the Integral Method. ASME J. Eng. Mater. Technol. 1988, 110, 344–349. [Google Scholar] [CrossRef]
  41. EN 15305:2008. Non-destructive Testing–Test Method for Residual Stress analysis by X-ray. Diffraction. Available online: https://shop.bsigroup.com/ProductDetail/?pid=000000000030199156 (accessed on 20 April 2019).
  42. Moore, M.G.; Evans, W.P. Mathematical correction for stress in removed layers in X-ray diffraction residual stress analysis. SAE Trans. 1958, 66, 340–345. [Google Scholar]
  43. Tsui, T.Y.; Oliver, W.; Pharr, G.M. Influences of stress on the measurement of mechanical properties using nanoindentation: Part I: Experimental studies in an aluminium alloy. J. Mater. Res. 1996, 11, 752–759. [Google Scholar] [CrossRef]
  44. Navarro, C.; Muñoz, S.; Domínguez, J. On the use of multiaxial fatigue criteria for fretting fatigue life assessment. Int. J. Fat. 2008, 30, 32–44. [Google Scholar] [CrossRef]
  45. Abood, A.N.; Saleh, A.H.; Salem, R.K.; Kadhim, G.A.; Abdullah, Z.W. Strain Life of Shot Peening AA 2024-T4. J. Mater. Sci. Res. 2012, 2, 113–123. [Google Scholar] [CrossRef]
  46. Dalaei, K.; Karlsson, B.; Svensson, L.-E. Stability of shot peening induced residual stresses and their influence on fatigue lifetime. Mater. Sci. Eng. A 2011, 528, 1008–1015. [Google Scholar] [CrossRef]
  47. Deng, Y.; Zhang, B.; Luo, W. The fretting behaviour of a nitrided steel 38CrMoAl. Wear 1988, 125, 193–204. [Google Scholar]
  48. Li, C.X.; Sun, Y.; Bell, T. Consideration of fretting fatigue properties of plasma nitrided En19 steel. Surf. Eng. 1999, 15, 149–153. [Google Scholar]
  49. Mubarak Ali, M.; Ganesh Sundara Raman, S. Effect of Plasma Nitriding Environment and Time on Plain Fatigue and Fretting Fatigue Behavior of Ti–6Al–4V. Tribol. Lett. 2010, 38, 291. [Google Scholar] [CrossRef]
  50. Mutoh, Y.; Tanaka, K. Fretting fatigue in several steels and a cast iron. Wear 1988, 125, 175–191. [Google Scholar] [CrossRef]
  51. Navarro, C.; Vázquez, J.; Domínguez, J. A general model to estimate life in notches and fretting fatigue. Eng. Fract. Mech. 2011, 78, 1590–1601. [Google Scholar] [CrossRef]
  52. Kodama, S. The behavior of residual stress during fatigue stress cycles. In Proceedings of the International Conference on Mechanical Behavior of Metals II, Kyoto, Japan, 15–20 August 1971; 1972; pp. 111–118. [Google Scholar]
  53. Zhuang, W.Z.; Halford, G.R. Investigation of residual stress relaxation under cyclic load. Int. J. Fat. 2001, 23, 31–37. [Google Scholar] [CrossRef]
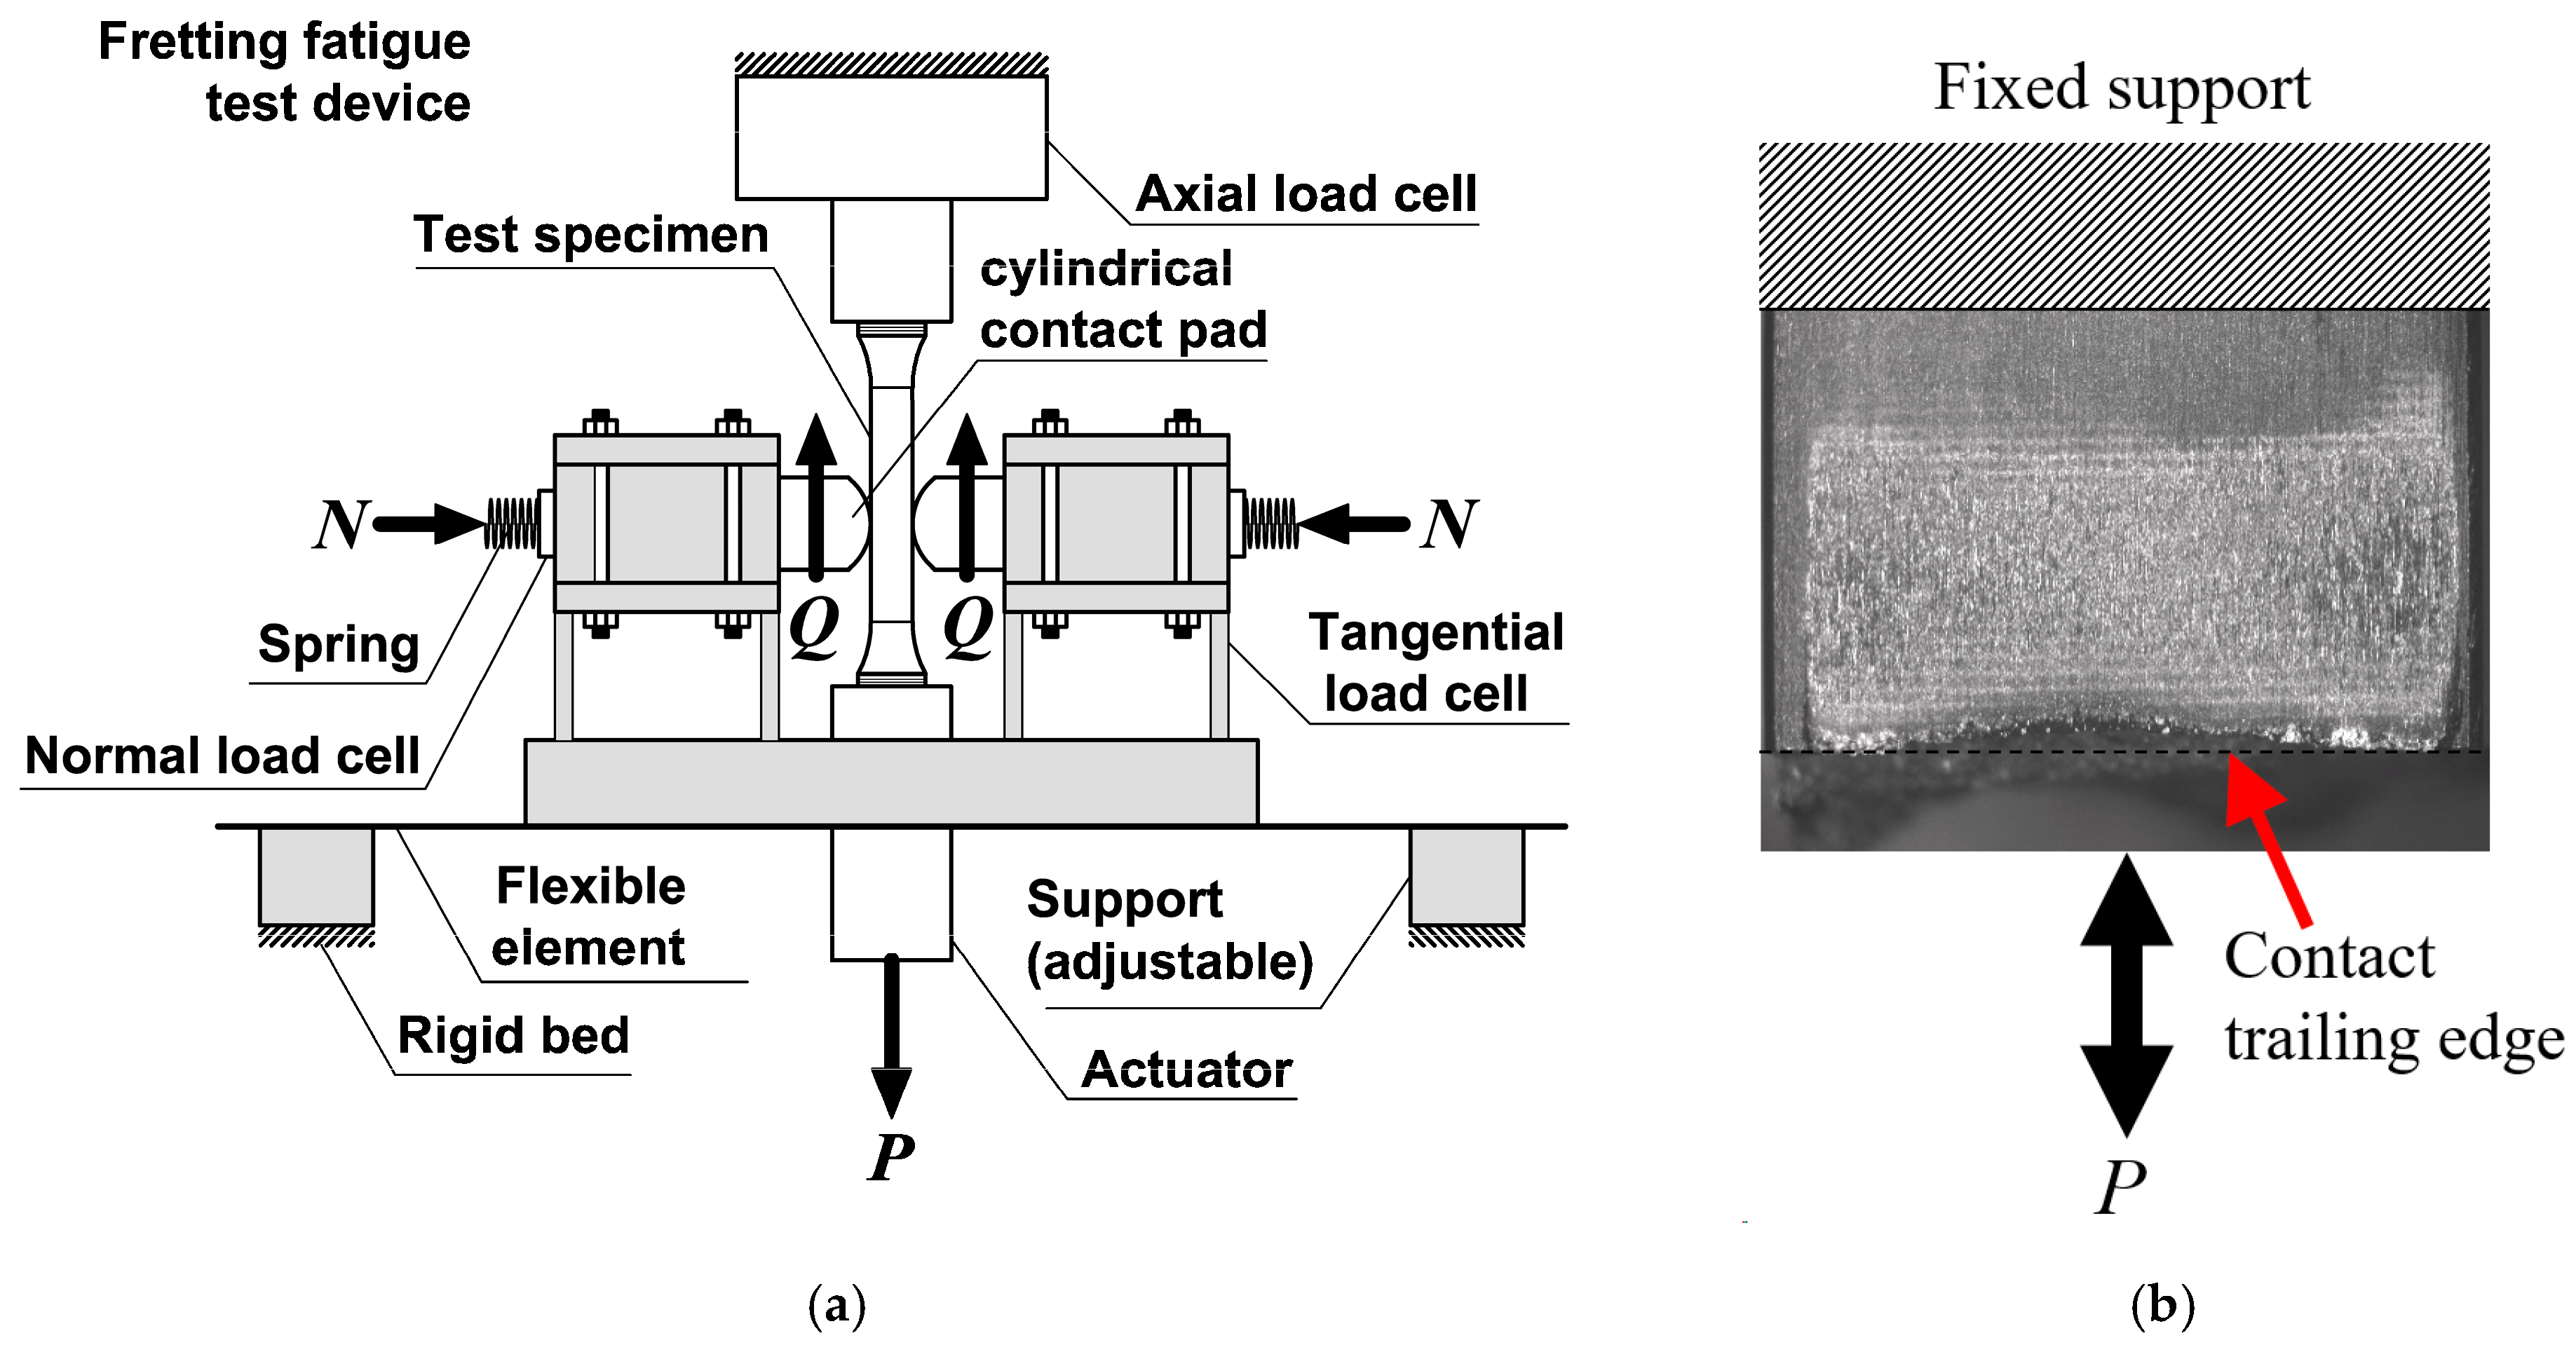
Figure 1. (a) Scheme for the device used in the fretting-fatigue tests; (b) sample fretting scar obtained in these tests showing where fretting cracks appear.
Metals 09 00586 g001
Figure 2. Contact and test specimen (sizes in mm).
Metals 09 00586 g002
Figure 3. An optical microscope image of the cross section in a shot-peened dog–bone test specimen.
Metals 09 00586 g003
Figure 4. Measured residual-stress distributions in shot-peened dog–bone test specimens.
Metals 09 00586 g004
Figure 5. (a) Measurement of friction coefficient. (b) Fretting loop obtained in a test with load combination number 23.
Metals 09 00586 g005
Figure 6. Hardness in a specimen treated with shot peening.
Metals 09 00586 g006
Figure 7. Lives in specimens treated with shot peening compared to lives in specimens with no treatment for different values of bulk stress.
Metals 09 00586 g007
Figure 8. Ratio of fatigue life in specimens with shot peening over life in specimens without shot peening for different values of bulk stress.
Metals 09 00586 g008
Figure 9. Comparison of fatigue lives in specimens treated with shot peening, both polished and unpolished.
Metals 09 00586 g009
Figure 10. Fracture surfaces on both sides of a specimen with Load Combination 2, without shot peening and interrupted at 93,740 cycles.
Metals 09 00586 g010
Figure 11. Fracture surface of a specimen with Load Combination 2, without shot peening and a fatigue life of 126,496 cycles.
Metals 09 00586 g011
Figure 12. Fracture surface of a specimen with Load Combination 2, without shot peening and a fatigue life of 112,165 cycles.
Metals 09 00586 g012
Figure 13. Fracture surface of specimens with shot peening: (a) Load Combination 22; (b) Load Combination 19.
Metals 09 00586 g013
Figure 14. Total contact width in each test of each group and theoretical values given by Hertz’s theory.
Metals 09 00586 g014
Figure 15. Ratio of experimental and theoretical contact size.
Metals 09 00586 g015
Figure 16. Scheme of zone where relaxed residual stress was measured.
Metals 09 00586 g016
Figure 17. Measured residual stress (XRD) after cyclic loading: (a) distribution for load combination σ = 70 MPa, Q = 971 N, N = 6629 N; (b) distribution for load combination σ = 175 MPa, Q = 2113 N, N = 5429 N.
Metals 09 00586 g017
Figure 18. Measured residual stress (XRD) after 10 load cycles for the load combinations shown in Table 7.
Metals 09 00586 g018
Table 1. Chemical composition for the Al 7075-T651 alloy, data from [1].
%AlZnMgCuFeSiMnCrTiOthers
Max91.46.12.92.00.50.40.30.280.20.05
Min87.15.12.11.2---0.18--
Table 2. Mechanical properties for the Al 7075-T651 alloy, data from [32].
Young’s modulusE71 × 103 MPa
Poisson’s ratioν0.33
Yield strengthσy503 MPa
Tensile strengthσu572 MPa
Table 3. Load combinations and related Hertzian parameters.
Load Num.σ (MPa)Q (N)N (N)a (mm)c (mm)e (mm)p0 (MPa)Δσxx (MPa)
17097166291.631.470.11324.1659.3
211097154291.471.300.17293.3754.8
3110125754291.471.240.17293.3798.2
4110154342171.300.960.17258.5822.1
5110154354291.471.180.17293.3839.1
615097130061.100.850.24218.3805.1
715097142171.301.100.24258.5834.0
815097154291.471.300.24293.3858.0
9150154330061.100.660.24218.3888.3
10150154342171.300.960.24258.5914.0
11150154354291.471.180.24293.3935.6
12150211330061.100.380.24218.3962.9
13150211342171.300.790.24258.5986.3
14150211354291.471.060.24293.31006.1
1517597130061.100.850.27218.3862.2
1617597142171.301.100.27258.5894.2
1717597154291.471.300.27293.3920.8
18175154330061.100.660.27218.3941.9
19175154342171.300.960.27258.5970.8
20175154354291.471.180.27293.3994.9
21175211330061.100.380.27218.31013.9
22175211342171.300.790.27258.51040.4
23175211354291.471.060.27293.31062.6
Table 4. Lives in the tests with and without shot peening (S-P).
Load Num.σ (MPa)Q (N)N (N)Nf without S-PNf without S-PNf with S-PNf with S-P
1709716629316,603165,6965,000,000 5,000,000
21109715429112,165126,4961,811,104980,678
311012575429120,663113,7991,649,7361,941,545
41101543421788,21689,3761,110,1741,117,513
51101543542987,48182,5591,008,310810,402
6150971300660,04059,23423,1459665,167
7150971421767,77660,288678,676634,259
8150971542947,73751,574707,514631,491
91501543300619,22339,408275,417198,884
101501543421750,36939,001234,651497,260
111501543542950,26839,202290,460482,862
121502113300634,90441,002140,189267,873
131502113421734,71640,004166,088201,105
141502113542932,33936,431190,76366,564
15175971300626,58731,815364,153366,164
16175971421727,72432,843235,467308,455
17175971542935,17129,100338,774413,654
181751543300631,22430,154164,835163,474
191751543421734,74834,930169,382164,384
201751543542933,34928,005228,379231,132
211752113300621,66921,20768,80183,544
221752113421726,98928,595121,642127,770
231752113542928,11228,17894,741146,553
Run out tests.
Table 5. Lives in the tests with shot peening, polished and unpolished.
Load Num.σ (MPa)Q (N)N (N)Nf unpolished *Nf unpolished *Nf polishedNf polished
1215021133006140,189267,873154,964158,621
1415021135429190,76366,564147,563153,813
151759713006364,153366,164417,318425,643
171759715429338,774413,654374,036319,601
1817515433006164,835163,474150,578151,347
2017515435429228,379231,132233,005173,024
211752113300668,80183,544116,731101,295
231752113542994,741146,553133,132115,329
* Already shown in Table 4.
Table 6. Surface roughness and friction coefficient for specimens under different treatments and contact pads.
SamplesFriction CoefficientRoughness
Ra (µm)Ry (µm)Rz (µm)
Without shot peening0.750.231.61.4
With shot peening—unpolished0.855.5935.2129.23
With shot peening—polished0.770.23.22.1
Contact pads-0.131.531.13
Table 7. Fretting load combinations used to measure cyclic relaxation of residual stress.
Load Num.σ (MPa)Tangential Force Q (N)Normal Force N (N)
1215021133006
1415021135429
151759713006
171759715429
2117521133006
2317521135429