Abstract
Laser quenching hardening is one of the most used surface treated technologies. In order to study the effect of laser quenching on the fretting fatigue life, fretting fatigue experiments of TC11 (Ti-6.5Al-1.5Zr-3.5Mo-0.3Si) titanium alloy specimens with different surface conditions were carried out on a special hydraulic servo fatigue test system. The experimental results showed that laser quenching hardening has a good performance in increasing the fretting fatigue lives of the TC11 alloy. However, the effects of laser quenching on fretting fatigue are more obviously at low stress level than at high stress level, the fretting fatigue life was increased by 110.78% at low stress level and 17.56% at high stress level, respectively. Based on the critical plane approach, the traditional SWT (Smith–Watson–Topper) parameter was modified and used to describe the fretting fatigue life of the TC11 alloy after hardening by the consideration of the variations of the hardening layer’s elastic modulus. Compared with the experimental results, all the errors of the predicted results lied in the error band of two.
1. Introduction
Fretting is usually recognized as a kind of near-surface damage arising from the relative slip between the contact surfaces of many mechanical assemblies, such as dovetail joints, bolts and flange connections. If one of the components of the fretting assembly is cyclically stress loaded, then this can be called fretting fatigue [1]. Fretting may accelerate the nucleation of small cracks and reduce the fatigue life. Plenty studies have shown that the service life of the mechanical connection structures can be reduced by more than 30% or even as high as 80% due to the existence of fretting fatigue [2,3,4]. Many surface treatments, such as coating and shot peening, have been proved to be effective in improving the fretting fatigue lives by the improvement of the surface wear resistance [5,6,7,8]. Laser quenching is recognized as a clean and convenient surface treatment because of the high laser power densities, fast cooling rate and no need of cool medium, such as water or oil. Relevant researches showed that laser quenching improve the surface hardness and induce the compressive residual stresses beneath the contact surfaces, which result in a good performance in fretting wear resistance [9]. However, there are few studies on the effect of laser quenching on fretting fatigue life. Hence, a series of fretting fatigue tests were carried out to study the effect of laser quenching in this paper.
The process of fretting fatigue involves multiple loads in different directions, which cause the stress field of the contact area to be multiaxial [10]. During the past several decades, there have been numbers of fatigue models which are suitable to predict fatigue life under complex stress fields. Most of these models can be classified into five types: (a) Empirical, (b) Stress Invariant, (c) Critical Plane, (d) Stress energy and (e) Mesoscopic [11,12]. Critical plane approach (CP), which uses certain preferential planes to define failure parameters [10], is one of the most used methods. Based on the CP approach, different multiaxial criteria have been developed by researches. However, it is hard to ensure that these models are available in fretting fatigue because of the less consideration of the surface damage and other fretting factors. Moreover, it was observed that in the multiaxial non-proportional stress state the best agreement with the experimental tests could be obtained using the criteria based on the integral approach. In the regime of high-cycle fatigue (HCF), the application of multiaxial HCF criteria based on the critical plane approach to the contact problems generally leads to the overestimation of the fatigue life [13,14]. Nevertheless, the Smith–Watson–Topper (SWT), which has been used to describe the fretting fatigue life successfully in the regime of low-cycle fatigue (LCF) [15,16,17], is one of the famous damage parameters. In this paper, the traditional SWT parameters are modified to describe the fretting fatigue life of the TC11 alloy after hardening by the consideration of the variations of the hardening layer’s elastic modulus.
The purpose of this paper is to investigate the effect of laser quenching on the fretting fatigue life of TC11 by a series of fretting fatigue tests. At the same time, the fretting fatigue life prediction model of TC11 after laser quenching based on SWT parameters will be established. The outline of this paper takes the following form: In Section 2, the experimental process and effects of the laser quenching hardening on fretting fatigue life are presented. The traditional SWT parameter was modified in Section 3. In Section 4, the modified SWT parameter was used to describe the fretting fatigue life of the TC11 alloy after hardening. In Section 5, some conclusions are summarized.
2. Experiments and results
2.1. Specimen Materials
The specimens and fretting pads are TC11 alloy, which is widely used in the China aviation field, and the chemical composition of this alloy (in wt. %) is given in Table 1 [18]. The material properties of the TC11 alloy at room temperature are listed in Table 2 [18]. As shown in Table 2, E means Modulus of elasticity, is Poisson ratio, represents the fatigue limit when the stress ratio is −1, is the breaking strength, means yield strength, and are the fatigue strength coefficient and the fatigue strength exponent, and mean the fatigue ductility coefficient and the fatigue ductility exponent.

Table 1.
Chemical composition of titanium alloy (TC11) [18].
Table 2.
Material parameters of TC11 at room temperature [18].
The main specimen was the “dog bone” tensile test piece, and the fretting pads were cylindrical, which were loaded against the main specimen. The details of the specimen and fretting pads are shown in Figure 1. In order to improve the anti-fatigue properties, both the two side faces of the specimens were hardened by laser quenching on the SLCF-X12x25 laser system (Shanghai Unity Prima Laser Equipment Co., Ltd., Shanghai, China) (Figure 2). During the hardening process, the output power of the laser was 1000 W, the scanning speed was 1000 mm/min, the spot diameter was 3 mm, and the width of the scanning area was 60 mm. Figure 3 shows the hardening surface of the specimens. The metallographic of a depth of the main specimen’s quenched layer is shown in Figure 4. The Magnification is 100, and the formulation of the corrosive agent is as follows: HF:HNO3:H20 = 1:3:15. It is obvious that the grain distribution in the surface layer is more compact, and the grain size increases gradually with the increase in depth. It is interesting to note that the grain distribution is particularly dense at the surface layer of about 200–300 microns, and there is an obvious boundary, which indicates that laser quenching has the best effect in this depth range.
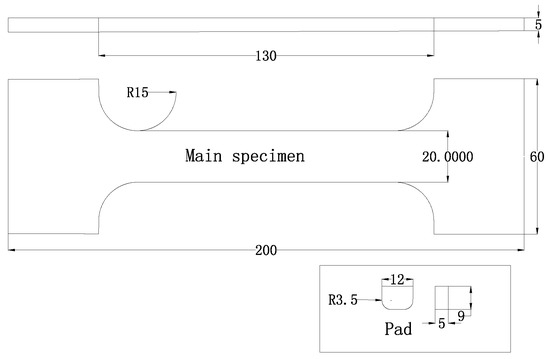
Figure 1.
Computer-aided design (CAD) drawing of the main specimen and fretting pad.
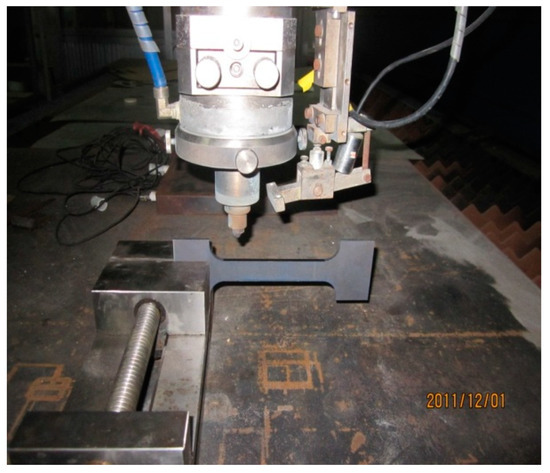
Figure 2.
Picture of the SLCF-X12x25 laser system.
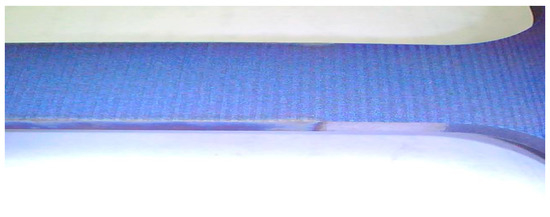
Figure 3.
The specimen after hardening.
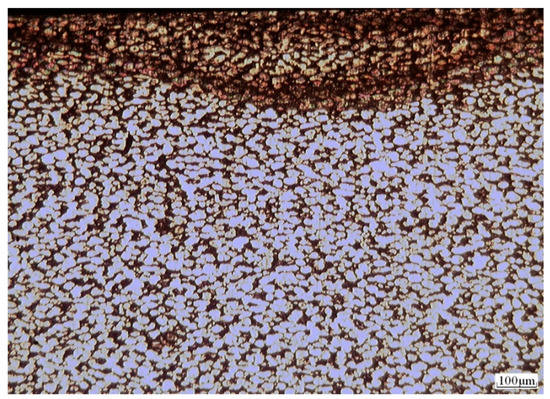
Figure 4.
Metallographic of the quenched layer (magnification: 100).
2.2. Hardness of TC11 Alloy after Hardening
In order to analyze the effect mechanism of laser quenching on the fretting fatigue life, the hardness of the specimens after laser quenching hardening was measured by an HXS-1000AK micro-hardness tester (Xi’an Minsks Test Equipment Co., Ltd., Xi’an, China) firstly. This micro-hardness tester used a small probe indenter to produce indentation on the surface of the test piece. The indentation area was displayed on the screen in a diamond shape. The range of the diamond shape was drawn out, and the hardness of the test piece could be obtained by calculating the diamond area with the corresponding conversion algorithm. With this micro-hardness tester, the track on the side of the laser quenched surface could be set at the same time when measuring the depth of the hardening layer, and indentation could be printed automatically. After measuring, the depth and curve of the hardened layer could be obtained. In the hardness test experiment, three samples were selected and each sample included five measuring tracks. Finally, the hardness curve, including the mean hardness and rank of limit hardness, was drawn in Figure 5. According to the measure results, the hardness of the laser quenching hardening specimen’s surface was HV648, while the hardness of the untreated specimen was HV362. Figure 5 also shows the relationship that the hardness of the hardening layer varies with the depth value under the surface. As shown in Figure 5, the hardness of the hardening layer varies little when the depth value is less than 0.3 mm under the surface. However, the hardness decreases obviously with the increase of the depth value under the surface when the depth value is greater than 0.3 mm, and the hardness at the depth of 1 mm decreased to HV362, which is the same value of the hardness of the untreated specimen. The relationship between the hardness and the depth value under the surface is caused by the hardening layer microstructures, in which the grain size is refined due to the effect of the laser quenching technology. Compared with the treated samples, the surface hardness of the TC11 alloy after laser quenching increased by about 79%. The improvement of surface hardness can greatly improve the wear resistance of components, thereby improving their fretting wear resistance.
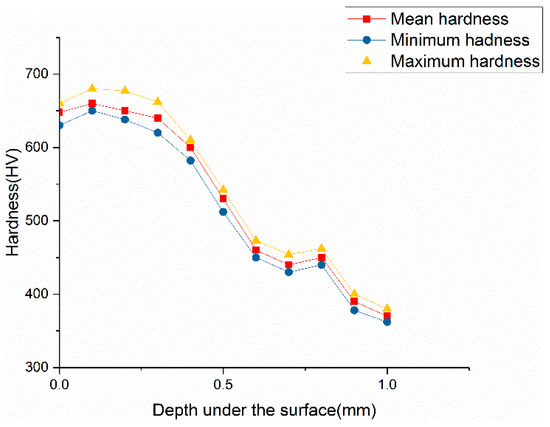
Figure 5.
The hardness of the hardening layer.
2.3. Fretting Fatigue Test
Fretting fatigue tests were conducted by the SDS-50 hydraulic servo fatigue test system (Changchun Research Institute for Mechanical Science Co., Ltd., Changchun, China) equipped with a transverse loading hydraulic cylinder, which is shown in Figure 6. Figure 7 shows the details of the configuration of the transverse loading hydraulic cylinder. During fretting tests, the fretting pads are put in the fretting block, which is held by the pad holder. Both pad holder and hydraulic cylinder are fixed on the base plate with the bolts. The hydraulic pressure will push the piston rod, and then the rod will push the fretting block to the specimen, which leads to the emergence of the normal load. In order to make sure that this normal load is stable during the whole fretting tests, an accumulator is connected to the hydraulic line, and the normal load can be calculated by the hydraulic pressure. The specimen passes through the pad holder and is fixed by the grips of the fatigue testing machine, which produce the axial load up to 50 kN. During the fretting tests, the camera was set up to take pictures of the fretting area on each test piece. Once the fretting cracks are observed in the area, the experiment was stopped immediately, and the local areas where the fretting cracks originated were photographed.
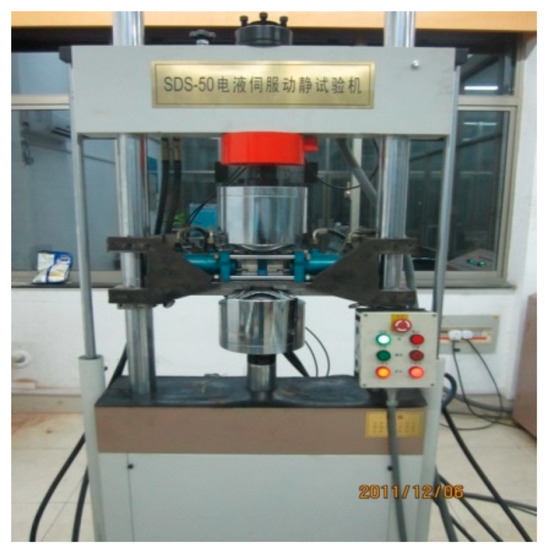
Figure 6.
Picture of the fretting fatigue experimental setup.
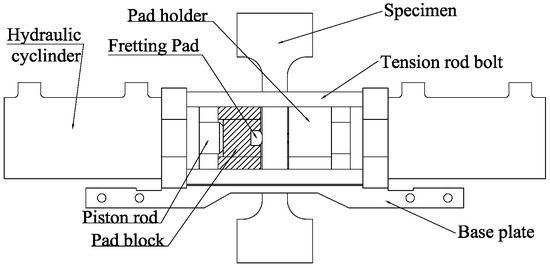
Figure 7.
Schematic diagram of the fretting fatigue rig.
In order to make it easy to understand the load configuration of the tests, Figure 8 images the load configuration of the fretting fatigue test. As seen from Figure 8, the static normal force, P, is first applied, and then the cycle tensile loads varying between Qmin and Qmax are applied. Table 3 lists the experimental parameters of the fretting tests and the arrangements of specimens. As seen from Table 3, the specimens in Series 1 and Series 3 were tested at low stress level, and the specimens in Series 2 and Series 4 were tested at high stress level.
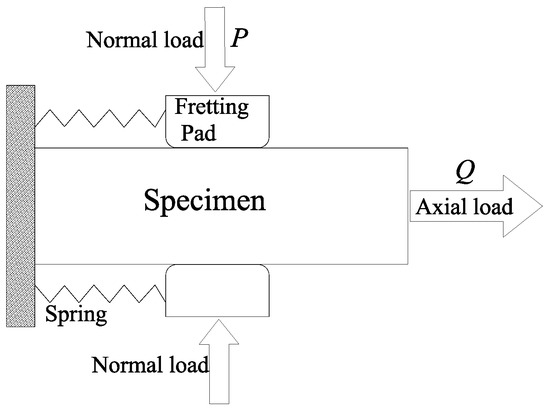
Figure 8.
Load configuration of the fretting test.
Table 3.
Experimental parameters used in fretting fatigue tests.
2.4. Fretting Fatigue Experimental Results
Twelve specimens that were used to conduct the fretting fatigue tests and the crack initiation lives are recorded in Table 4 accordingly. All the fretting fatigue lives of the specimens after laser quenching hardening are greater than the untreated specimens obviously, which shows that laser quenching can improve the fretting fatigue life. However, the effect of laser quenching on fretting fatigue varies with the stress levels. Comparing the fretting fatigue lives of Series 1 with that of Series 3, it showed that the laser quenching increased the fretting fatigue lives by 110.78% at low stress level (P = 0.65 MPa, Qmax = 30 kN), while the comparison results between Series 2 and Series 4 showed that laser quenching increased the fatigue lives only by 17.56% at high stress level (P = 1.3 MPa, Qmax = 40 kN). This interesting phenomenon is caused by the mechanism of fretting cracks initiation. When the contact surface suffered a low stress level, the dominant factor in the crack initiation is the surface wear rather than the stress strain field, thus the better wear resistance due to the laser quenching can have an obvious improvement in the fretting fatigue life. When the contact surface suffers a high stress level, the dominant factor in the crack initiation may be changed, and the laser quenching may be not so effective in the fretting fatigue resistance.
Table 4.
Experimental fretting fatigue initiation life of TC11 with different surface treatments.
During the experiment, the camera was installed to take pictures of the fretting area on each test piece. Once the fretting cracks that appeared in the area were observed, the experiment was stopped immediately, and the local areas where the fretting cracks originated were photographed. The orientation of the crack initiation of Series 2 and 4 are shown in Figure 9 and Figure 10. Both of the cracks appeared at the lower edge of the contact area, which is about 2.8 mm from the center. The crack initiation angle of the specimen after laser quenching hardening was 80.478 degree, the crack expands along this angle, and the direction of the crack propagation does not change. However, the crack initiation angle of the untreated specimen was 52.949 degree, and the direction of the crack propagation changed almost perpendicular to the surface after the crack extended to a certain stage, and the rest Series showed the same rules. As known to all, the fretting fatigue crack initiates around the boundary of grains, the grain size in the hardening layer of the specimens after laser quenching is refined due to the effect of laser quenching technology. That is why the crack initiation angles of the specimens after laser quenching hardening are different from the angles of the untreated specimens.
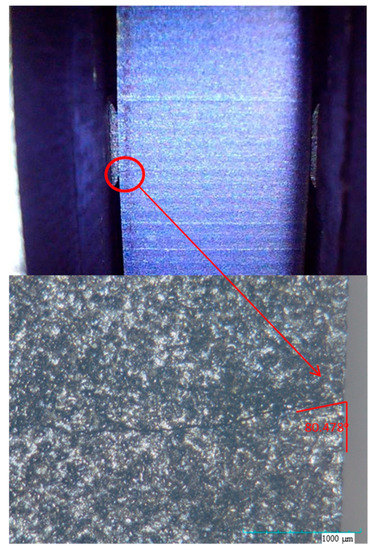
Figure 9.
Image of the orientation of the crack initiation of Series 2.
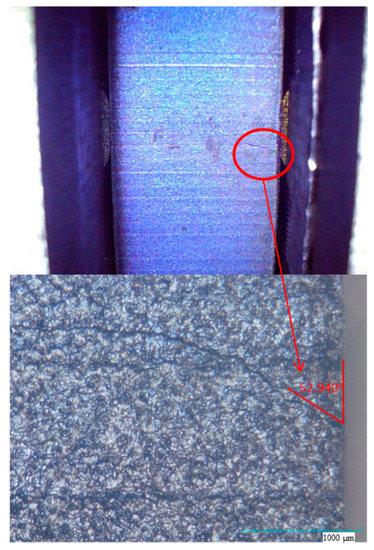
Figure 10.
Image of the orientation of the crack initiation of Series 4.
3. The Modified SWT Parameter
In order to describe the fretting fatigue life of the specimens after hardening, the traditional SWT parameter was modified in this section. The details of the SWT [15] critical plane parameter to a multiaxial fatigue case can be expressed as
where is the crack initiation life, is the difference between the maximum and the minimum strain perpendicular to the plane during the total cycle, and means the max value of the maximum stress component perpendicular to the plane during the cycle. Thus, the critical plane is one that experiences the max value of .
As mentioned, the SWT parameter may not be suitable for the fretting fatigue life prediction. Therefore, a simple modified SWT parameter, which is similar to the formation of the Basquin and Manson-Coffin equation [19], is assumed in this paper. This new equation is defined as
where and are constants, which are used to simulate the fretting influence on the fatigue life.
Laser quenching can change the hardness and the elastic modulus of the hardening layer. And the relationship between the Elastic modulus E and hardness H used here is according to Bao’s research [20], which can be written as
where D is the constant related to the shape of the indenter, is the recovery resistance, and it is defined as
where is the peak load, and reflects the elastic deformation at the perimeter of indentation and is proportional to the depth of elastic recovery at the indentation center, which is shown in Figure 11.
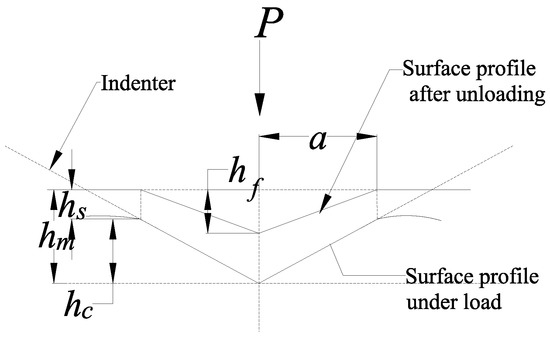
Figure 11.
Schematic of indentation deformation at peak load and after unloading.
is the reduced modulus, which can be written as
where and are the elastic modulus and Poisson’s ratio of the specimen, and are the elastic modulus and Poisson’s ratio of the indenter.
With those equations, it is found that for a given recovery resistance, the reduced elastic modulus increases with the square root of the hardness.
4. Simulation and Discussion
As mentioned, the existence of the hardening layer makes the finite element model of the specimen after laser quenching hardening different from the untreated specimen. Figure 12 shows the schematic of the finite element model of the specimen after hardening, and the size of the fretting pad is the same as that in Figure 1. As shown in Figure 12, the elastic modulus of the hardening layer is different from the untreated specimen. As mentioned in Section 2.2, the hardness of the hardening layer varies little when the depth value is less than 0.3 mm under the surface, and the hardness at the depth of 1 mm decreased to HV362 that is the same value of the hardness of the untreated specimen. Considering that the contact problem is mainly concerned with the contact surface and for the convenience of calculation, the hardness of the hardening layer is assumed to be the surface hardness and the hardening layer depth is selected as 1 mm. With the experimental data and Equation (3), the elastic modulus of the hardening layer is 162 GPa. The finite element calculation is completed by the commercial software ANSYS. The left end of the main specimen is fixed and symmetrical constraints are applied to the lower end in consideration of the symmetry. Considering the actual experimental situation, the pressure load P is applied on the top of the fretting pad first, and then the cyclic load Q is added to the right end of the main specimen. The element type of the main specimen and the pad is PLANE82, and the element behavior is selected as the plane strain. The contact element type is CONTA172 and TARGE169, which correspond to the fretting pad and the main specimen, respectively. The number of the elements is 23319. The meshes of the contact area and the hardened layer are refined to 10 microns, which can guarantee the accuracy of contact calculation to a certain extent.
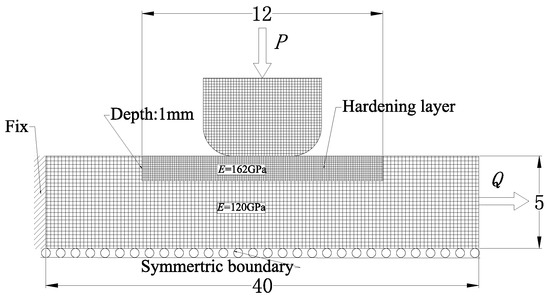
Figure 12.
Schematic diagram of the finite element model.
The distributions of SWT parameters around the contact area in Series 1 and 2 are plotted in Figure 13, respectively. The distribution curve of SWT parameters is similar to the saddle type. It can be seen that the maximum value of SWT all appear at the location of 2.8 mm from the center, which is very close to the location where the fretting cracks occur. The maximum equivalent stress and the maximum SWT value of all the series are listed in Table 5. As seen in Table 5, the maximum values of the contact stress of Series 1 and 2 specimens after laser quenching hardening are 535 MPa and 982 MPa, respectively, while the maximum values of the contact stress of Series 3 and 4 untreated specimens are 509 MPa and 917 MPa, respectively. It can be found that the maximum equivalent stress in the fretting zone is increased after laser quenching hardening due to the change of surface hardness. Although the increase of hardness will increase the equivalent stress on the surface of specimens, the Maximum SWT value of the specimens after laser quenching hardening are smaller than that of the untreated specimens due to the decrease of strain. The smaller the SWT parameter value, the smaller the possibility of crack initiation. This proves that the laser quenching process can improve the fretting fatigue life of the components.
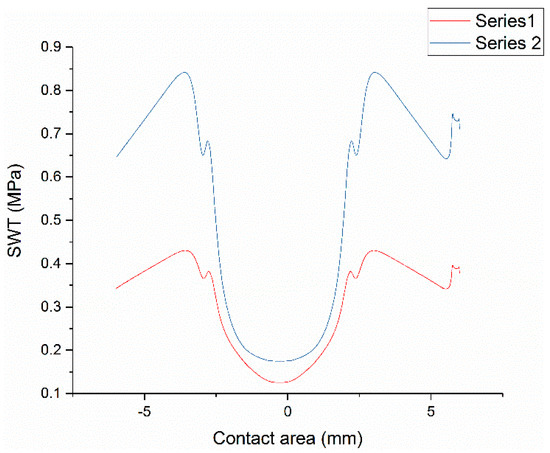
Figure 13.
Smith–Watson–Topper (SWT) parameter distribution in contact area.
Table 5.
Finite element results.
In order to describe the fretting fatigue life of the specimens after hardening, the parameters, A and n, in Equation (2) can be calculated by the nonlinear fitting method. Based on the experimental data of fretting fatigue lives of TC11 in literature [21], the two parameters can be calculated to be A = 10,843 and n = 0.416, respectively. Then, the fretting fatigue lives of the TC11 alloy after hardening can be calculated with Equation (2), and the error distribution between the calculated results and the experimental data are shown in Figure 14. As seen from Figure 14, all the errors of the predicted results lied in the error band of two.
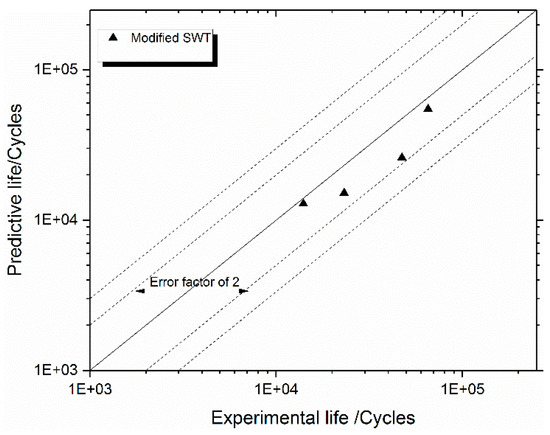
Figure 14.
Comparison of predicted lives with experimental lives for TC11.
5. Conclusions
(1) In order to study the effects of laser quenching hardening on the surface properties of the TC11 alloy, the metallographic evaluation of TC11 alloy after laser quenching hardening were studied in this paper. Experimental results showed that: The grain distribution in the surface layer is more compact, and the grain size increases gradually with the increase in depth.
(2) The hardness of the TC11 alloy after laser quenching hardening was measured by a micro-hardness tester. Measure results showed that the surface hardness of the laser hardened specimen increased by 79%, and the depth of the hardened layer was about 1 mm.
(3) The fretting fatigue experiments of TC11 alloy specimens with different surface conditions were carried out to study the effect of laser quenching on the fretting fatigue life. The experimental results showed that laser quenching hardening has a good performance in increasing the fretting fatigue lives of the TC11 alloy. However, the effects of laser quenching on fretting fatigue are more obviously at low stress level than at high stress level.
(4) The traditional SWT parameter was modified to describe the fretting fatigue life of the TC11 alloy after hardening by the consideration of the variations of the hardening layer’s elastic modulus. Compared with the experimental results, all the errors of the predicted results lied in the error band of two.
Author Contributions
Conceptualization, H.Z.; Investigation, H.Z., X.Y.; Project administration, H.Z., W.W. and H.C.; Software, X.Y.; Supervision, H.Z., W.W. and H.C.; Writing—original draft, X.Y.; Writing—review & editing, H.Z.
Funding
This research was funded by National Natural Science Foundation of China, grant number: 91860111.
Conflicts of Interest
The authors declare no conflict of interest.
References
- Hills, D.A. Mechanics of fretting fatigue. Wear 1994, 175, 107–113. [Google Scholar] [CrossRef]
- Araújo, J.A.; Nowell, D. The effect of rapidly varying contact stress fields on fretting fatigue. Int. J. Fatigue 2002, 24, 763–775. [Google Scholar] [CrossRef]
- Nesládek, M.; Španiel, M.; Jurenka, J.; Růžička, J.; Kuželka, J. Fretting fatigue—Experimental and numerical approaches. Int. J. Fatigue 2012, 44, 61–73. [Google Scholar] [CrossRef]
- Rajasekaran, R.; Nowell, D. Fretting fatigue in dovetail blade roots: Experiment and analysis. Tribol. Int. 2006, 39, 1277–1285. [Google Scholar] [CrossRef]
- Golden, P.J.; Hutson, A.; Sundaram, V.; Arps, J.H. Effect of surface treatments on fretting fatigue of Ti–6Al–4V. Int. J. Fatigue 2007, 29, 1302–1310. [Google Scholar] [CrossRef]
- Vazquez, J.; Navarro, C.; Dominguez, J. Experimental results in fretting fatigue with shot and laser peened Al 7075-T651 specimens. Int. J. Fatigue 2012, 40, 143–153. [Google Scholar] [CrossRef]
- Srinivasan, S.; Garcia, D.B.; Gean, M.C.; Murthy, H.; Farris, T.N. Fretting fatigue of laser shock peened Ti–6Al–4V. Tribol. Int. 2009, 42, 1324–1329. [Google Scholar] [CrossRef]
- Liu, K.K.; Hill, M.R. The effects of laser peening and shot peening on fretting fatigue in Ti–6Al–4V coupons. Tribol. Int. 2009, 42, 1250–1262. [Google Scholar] [CrossRef]
- Dai, Z.D.; Wang CPan, S. Improving the fretting wear resistance of titanium alloy by laser beam quenching. Wear 1997, 213, 135–139. [Google Scholar] [CrossRef]
- Bhatti, N.A.; Wahab, M.A. Fretting fatigue crack nucleation: A review. Tribol. Int. 2018, 121, 121–138. [Google Scholar] [CrossRef]
- Araujo, J.A.; Nowell, D.; Vivacqua, R.C. The use of multiaxial fatigue models to predict fretting fatigue life of components subjected to different contact stress fields. Fatigue Fract. Eng. Mater. Struct. 2004, 27, 967–978. [Google Scholar] [CrossRef]
- Weber, B. Fatigue Multiaxiale des Structures Industrielles sous Chargement Quelconque [Enligne]. Ph.D. Thesis, Institut National des Sciences Appliquées de Lyon, Lyon, France, 1999. [Google Scholar]
- Romanowicz, P. Numerical assessment of fatigue load capacity of cylindrical crane wheel using multiaxial high-cycle fatigue criteria. Arch. Appl. Mech. 2017, 87, 1707–1726. [Google Scholar] [CrossRef]
- Bernasconi, A.; Filippini, M.; Foletti, S.; Vaudo, D. Multiaxial fatigue of a railway steel under non-proportional loading. Int. J. Fatigue 2006, 28, 663–672. [Google Scholar] [CrossRef]
- Smith, K.; Watson, N.; Topper, P.T. A stress strain function for the fatigue of metals. J. Mater. 1970, 5, 767–778. [Google Scholar]
- Hwang, D.H.; Cho, S. Mean stress effects in fretting fatigue life estimation method using fatigue damage gradient correction factor. J. Mech. Sci. Technol. 2017, 31, 4195–4202. [Google Scholar] [CrossRef]
- Bhatti, N.A.; Pereira, K.; Wahab, M.A. Effect of stress gradient and quadrant averaging on fretting fatigue crack initiation angle and life. Tribol. Int. 2019, 131, 212–221. [Google Scholar] [CrossRef]
- Aeronautical Manufacture Engineering Committee. Aeronautical Manufacture Engineering Handbook; Aerospace Industry Press: Beijing, China, 1997. [Google Scholar]
- Sum, W.S.; Williams, E.J.L. Finite element, critical-plane, fatigue life prediction of simple and complex contact configurations. Int. J. Fatigue 2005, 27, 403–416. [Google Scholar] [CrossRef]
- Bao, Y.W.; Wang, W.; Zhou, Y.C. Investigation of the relationship between elastic modulus and hardness based on depth-sensing indentation measurements. Acta Mater. 2004, 52, 5397–5404. [Google Scholar] [CrossRef]
- Shi, W.; Wen, W.D.; Cui, H.T. Prediction and Analysis on Fretting Fatigue Crack Initiation of Titanium Alloy TC11. Gas Turbine Exp. Res. 2014, 27, 37–40. [Google Scholar]
© 2019 by the authors. Licensee MDPI, Basel, Switzerland. This article is an open access article distributed under the terms and conditions of the Creative Commons Attribution (CC BY) license (http://creativecommons.org/licenses/by/4.0/).