Abstract
The fatigue property is significantly affected by the inner inclusions in steel. Due to the inhomogeneity of inclusion distribution in the micro-scale, it is not straightforward to quantify the effect of inclusions on fatigue behavior. Various investigations have been performed to correlate the inclusion characteristics, such as inclusion fraction, size, and composition, with fatigue life. However, these studies are generally based on vast types of steels and even for a similar steel grade, the alloy concept and microstructure information can still be of non-negligible difference. For a quantitative analysis of the fatigue life improvement with respect to the inclusion engineering, a systematic and carefully designed study is still needed to explore the engineering dimensions of inclusions. Therefore, in this study, three types of bearing steels with inclusions of the same types, but different sizes and amounts, were produced with 50 kg hot state experiments. The following forging and heat treatment procedures were kept consistent to ensure that the only controlled variable is inclusion. The fatigue properties were compared and the inclusions that triggered the fatigue cracks were analyzed to deduce the critical sizes of inclusions in terms of fatigue failure. The results show that the critical sizes of different inclusion types vary in bearing steels. The critical size of the spinel is 8.5 μm and the critical size of the calcium aluminate is 13.5 μm under the fatigue stress of 1200 MPa. In addition, with the increase of the cleanliness of bearing steels, the improvement of fatigue properties will reach saturation. Under this condition, further increasing of the cleanliness of the bearing steel will not contribute to the improvement of fatigue property for the investigated alloy and process design.
1. Introduction
Fatigue property is a key feature for bearing steel [1,2]. With the development of industrial demand and the improvement of steel quality, more researchers begin to focus on fatigue properties in high cycle fatigue (HCF) and very high cycle fatigue (VHCF) regimes [3,4,5]. Inclusions and the cleanliness of steel play an important role in the fatigue property, especially in HCF and VHCF regimes. Vast studies have been carried out on the improvement of metallurgical process to increase the cleanliness of molten steel through the control and removal of nonmetallic inclusions, such as adjusting the composition of the refining slag [6,7,8,9], optimizing the charging during melting [10,11,12], and improving the physical design of the tundish [13,14,15], etc. Based on these studies, the metallurgical technique develops rapidly, and the cleanliness of steels keeps improving.
So far, various investigations have been performed to correlate the inclusion characteristics, such as inclusion fraction, size and composition, with fatigue life. Murakami et al. [16,17] developed a theory describing the effect of the inclusion size on fatigue life and claimed that there is always a critical inclusion size in an investigated area, which will lead to fatigue crack initiation during fatigue process. A well-recognized and used conclusion is illustrating a monotonic relation between the fatigue strength with respect to the critical inclusions size, which indicates that the inclusion engineering shows great capability in improving the fatigue life of materials. Spriestersbach et al. [18] reported that the inclusion type also affects the fatigue process, except for inclusion size based on the investigation on the fatigue properties of bainitic high-strength steel. Gu et al. [19] have also demonstrated that the residual stresses generated during the heat treatment of steel production between the inclusions and the steel matrix has also constructive impacts on the fatigue life and various types of the inclusions could induce quite different residual stress profiles according to their thermal expansion and mechanical properties [20]. Nevertheless, these experimental studies are generally based on vast types of steels and even for a similar steel grade, the alloy concept and microstructure information can still be quite different. For the numerical studies, it is possible to investigate the single-variable effect keeping the others constants, e.g., to investigate only the size effect of one specific type of inclusions on the fatigue life [21]. However, the microstructure-based modeling approach can so far only focus on one type of fatigue mechanisms without considering the competition between various ones driven by either inclusions or matrix. For a quantitative analysis of the fatigue life improvement with respect to the inclusion engineering, a systematic and carefully designed experimental study is still needed.
With the improvement of the cleanliness of steel and the sharp decrease in the amount and size of inclusions in steel, some new failure mechanisms are induced during the service of steel [22]. Based on multiple studies on fatigue properties, the fish eye structure is a typical sign for internal fatigue crack initiations induced by inclusions [23]. Nevertheless, in recent decades, a different structure, named optically dark area (ODA) [24,25], fine granular area (FGA) [2], or granular bright facet (GBF) [3] by different research groups, has been proved to be possibly generated before the fish eye structure during the fatigue crack initiation especially for cracks initiated from smaller inclusions. Based on this new progress, it is reasonable to doubt whether the fatigue property still improves with the increase of cleanliness. In the previous research by Gu et al. [26], the fatigue properties of two high carbon bearing steels deoxidized with different deoxidizing agents with non-negligible differences of cleanliness have been compared. The results show that the fatigue properties are still close regardless of the difference in cleanliness. The unusual fatigue property related to different deoxidizing agents was also reported by Bertrand et al. [27] based on the research of spring steels. Besides, the hydrogen trapped by inclusions in bearing steel is reported to be related to the formation of ODA [17,24,25] and plays an important role during the fatigue cracking process [28]. To decrease the hydrogen embrittlement in bearing steel, the hydrogen content in bearing steels should be carefully controlled during the production [29]. Louthan [30] also claimed that cracks that result from the precipitation of internal hydrogen are called fisheyes.
To quantitatively analyze the fatigue life improvement with respect to the inclusion engineering, three types of bearing steels with inclusions of the same types, but different sizes and amounts were produced with 50 kg hot state experiments. The followed forging and heat treatment procedures were kept consistent to ensure the only controlled variable is the inclusion. The fatigue properties were compared and the inclusions which triggered the fatigue cracks were analyzed to deduce the critical sizes of inclusions in terms of fatigue fractures.
2. Materials and Experimental Procedures
2.1. Material Preparation
Three 50 kg bearing steels were smelt with a vacuum induction furnace (Jinzhou Vacuum Furnace Co., LTD, Jinzhou, China) in this study. In each steel, the consistent deoxidizing agent Al was added and different total oxygen content (T.O) in steels were obtained. T.O is usually recognized as the indicator of the cleanliness of steel.
The main compositions and controlled T.O are shown in Table 1. In this study, the steels with T.O lower than 8 × 10⁻⁶ are defined as high-quality steel; the steels with T.O in the range of 8 × 10⁻⁶–12 × 10−6 are defined as commercial quality steel.

Table 1.
The main compositions and controlled total oxygen content (T.O).
During the melting process, the temperature was kept at 1650 °C. After the addition of the deoxidizing agent Al, the furnace was evacuated to ultimate vacuum and filled with argon. The holding time for steels A, B, and C was 30 min. Afterwards, the molten steel was poured into a mold, which was mainly made of MgO. The shape of the mold was a cylinder with a diameter of 150 mm.
The ingots were kept under 1200 °C for 3 h and forged into round steel bars with a diameter of 35 mm. The temperature of the whole forging process was kept above 850 °C. The subsequent heat treatment procedures included vacuum oil quenching after being held for 20 min at 835 °C and tempered for 120 min at 180 °C. The whole forging and heat treatment processes of steels A, B, and C were kept exactly the same, guaranteeing that the microstructures, as well as the relative movement and the deformation of inclusions, are invariant, while T.O is the only variable in the three steels. The inclusion analysis samples and fatigue test specimens were all taken from the steel bars.
2.2. Fatigue Tests
The fatigue tests were carried out in high cycle fatigue (HCF) and very high cycle fatigue (VHCF) regimes. The fatigue specimens were all taken near the surface of the steel bar along the bar axis. The specimen geometry and the positions are shown in Figure 1. To avoid fatigue cracks initiated from the surface, the arc parts in the middle of the specimens were carefully polished. The roughness Ra of the arc parts in the specimen is smaller than 0.01 (GB/T1031-2009). The polished scratches were all in the longitudinal direction.

Figure 1.
The geometry of specimen for fatigue tests: (a) Sketch map (unit: mm); (b) the positions of specimens in the hot-rolled bar.
Fatigue tests were conducted under a frequency of 20 kHz with UFT-Core UA00RTE resonance fatigue testing machine (MCT Technology, Chengdu, China) produced by MCT Technology. To ensure the high frequency, the shape of fatigue specimen shown in Figure 1 was designed based on the Young’s modulus and density of the steel so that the natural frequency of the specimen matches the vibration frequency of ultrasonic fatigue testing machine. During the fatigue tests, the stresses were loaded through the resonance occurred at the specimens. Since the yield stresses of steels A, B, and C were 2323 MPa, 2331 MPa, and 2329 MPa, respectively, the stress amplitudes were in the range of 1070–1320 MPa (~50% of yield stress). The loading condition was a fully reversed tension-compression (stress ratio R = −1). The fatigue tests were conducted in the pulse/pause mode under air cooling to avoid the effect of temperature. The loading sequences of 500 ms interrupted by pause sequences of 1000 ms were applied. The temperature during the tests was kept under 50 °C. After the specimens were broken, the fractures were observed with scanning electron microscopy (SEM) (FEI, Hillsboro, OR, USA) to clarify the morphologies and determine the crack initiation sites, which were further tested by energy dispersive spectroscopy (EDS) (FEI, Hillsboro, OR, USA) for chemical composition analysis.
2.3. Inclusion Analysis Methods
The inclusion analysis specimens (15 mm × 15 mm × 15 mm) were also taken near the surface of the steel bar along the bar axis. The cross sections of the steel bars in the samples were polished by SiC paper and polishing paste. To improve the efficiency of data acquisition, the automatic inclusion analysis system was adopted. This system is based on SEM-EDS, analyzing the size, composition, and shape of every inclusion larger than 0.6 μm in the predefined area. In this study, oxide inclusions in 44.5 mm2 of each steel were investigated to characterize the oxide inclusion information.
To clarify the three-dimensional morphologies of different types of oxide inclusions, the potentiostatic electrolytic extraction technique was adopted. The schematic diagram of the electrolytic extraction equipment is shown in Figure 2. The steel sample (10 mm × 10 mm × 10 mm) held by a Pt tweezer was the anode and a Pt ring soaking in the electrolyte was the cathode. The whole electrolytic extraction process lasted around 2 h with a consistent current density of 0.05 A. The electrolyte, consisting of 10% acetylacetone, 1% tetramethylammonium chloride and methanol, was filtrated after the electrolytic extraction and the precipitates containing oxide inclusions were collected and observed with SEM-EDS.
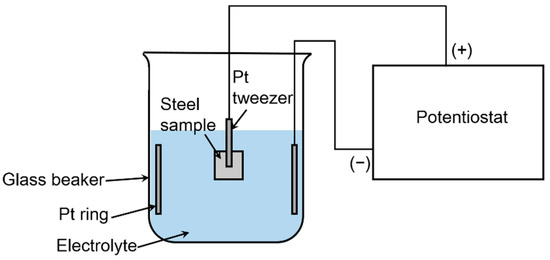
Figure 2.
The schematic diagram of the electrolytic extraction equipment.
3. Results
3.1. Characterization of Oxide Inclusions
The charters of oxide inclusions are described in terms of area number densities, types, sizes and typical morphologies in 44.5 mm2 of the steels from steels A, B, and C in this section. Generally, there are three types of oxide inclusions: Spinel, silicate, and calcium aluminate. Most of the initial deoxidation product Al2O3 inclusions react with Mg elements from the mold and the alloy raw materials due to the strong reaction capacity between Mg and Al2O3 inclusions. Therefore, there are barely pure Al2O3 inclusions in steels A, B, and C. The typical morphologies of these inclusions vary distinctly, as seen in Figure 3. The spinel inclusions are usually polygon. The calcium aluminate inclusions are usually spherical. The total area number densities of all oxide inclusions decrease with the decrease of T.O. The histograms of each type of oxide inclusions in steels A, B, and C are shown in Figure 4. Most of the oxide inclusions are smaller than 4 μm. With the decrease of T.O, the ratio of larger inclusions tends to decrease, which leads to the ratio of smaller inclusions increase. These data will be used to calculate their contributions to T.O in Section 4.2.
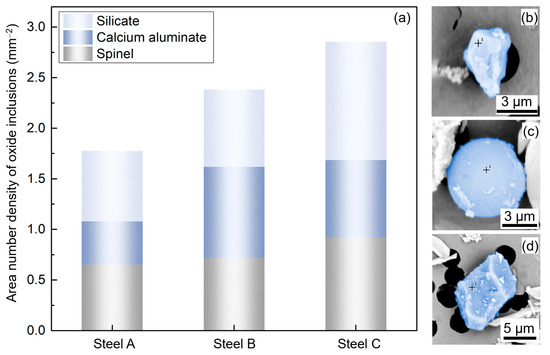
Figure 3.
Characterization of the oxide inclusions: (a) Area number densities sorted by inclusion type and typical morphologies of the oxide inclusions; (b) silicate inclusion; (c) calcium aluminate inclusion; (d) spinel inclusion.
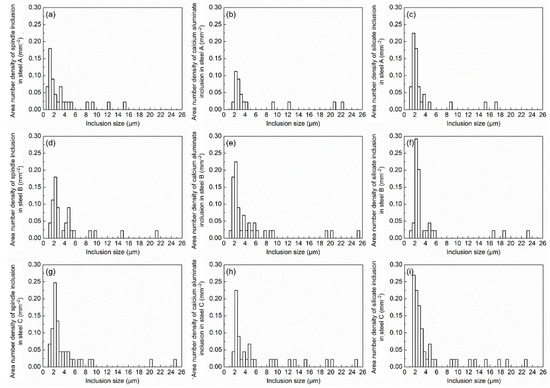
Figure 4.
Histograms of area number densities of oxide inclusions sorted by types: (a) Spinel inclusions in steel A; (b) calcium aluminate inclusions in steel A; (c) silicate inclusions in steel A; (d) spinel inclusions in steel B; (e) calcium aluminate inclusions in steel B; (f) silicate inclusions in steel B; (g) spinel inclusions in steel C; (h) calcium aluminate inclusions in steel C; (i) silicate inclusions in steel C.
3.2. Characterization of Fatigue Properties
Figure 5 shows the S-N curves and the reasons for crack initiations. The fatigue properties of steels A and B obviously improved when T.O decreases from 12 × 10−6 to 8 × 10⁻⁶. While when T.O keeps decreasing, the improvement of fatigue property is extremely slight. The S-N curves are fitted with the power function, which is shown in Equation (1):
where Nf is fatigue life. σ is the fatigue stress amplitude. C and α are material constants. The fitting results for C and α are shown in Table 2.
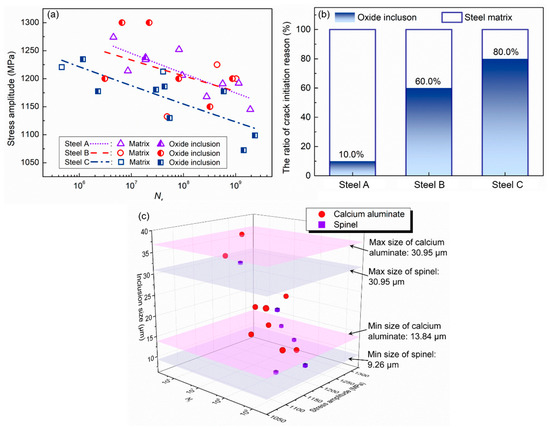
Figure 5.
Fatigue properties of steel from steels A, B, and C: (a) S-N curves; (b) the ratio of fatigue crack initiation reasons; (c) the oxide inclusion induced fatigue characters (fatigue life vs. stress amplitude vs. inclusion size).
Table 2.
The material constants C and α for steels A, B, and C.
All the fatigue cracks in the present study are initiated inside the specimens from the steel matrix (the hollow symbols in Figure 5a) or from internal oxide inclusions (the half solid symbols in Figure 5a). There is a competitive relationship between these two fatigue crack mechanisms. When the effects of inclusions on the fatigue property decrease, the fatigue crack will eventually initiate from the steel matrix. In steels A, B, and C, the ratios of fatigue cracks caused by oxide inclusions decrease with the decrease of T.O. All the oxide inclusion induced fatigue characters are shown in Figure 5c. Among all three types of oxide inclusions, silicate inclusions are not observed in the fatigue crack initiation sites, while the other two types of inclusions are both related to the fatigue crack initiations. The maximum and minimum sizes of the spinel inclusion observed in the fatigue crack initiation site are 30.95 μm and 9.26 μm, respectively; the maximum and minimum sizes of the calcium aluminate inclusion observed in the fatigue crack initiation site are 36.83 μm and 13.84 μm, respectively. Figure 6, Figure 7 and Figure 8 show typical morphologies of cracks initiated from spinel, calcium aluminate, and steel matrix. The fish eye structures are observed in all fatigue fractures and optical dark area (ODA) is observed in part of the fatigue fractures. In addition, there are obvious scatters in the fatigue data, which is caused by the scattering of inclusions and the inhomogeneity of the steel matrix.
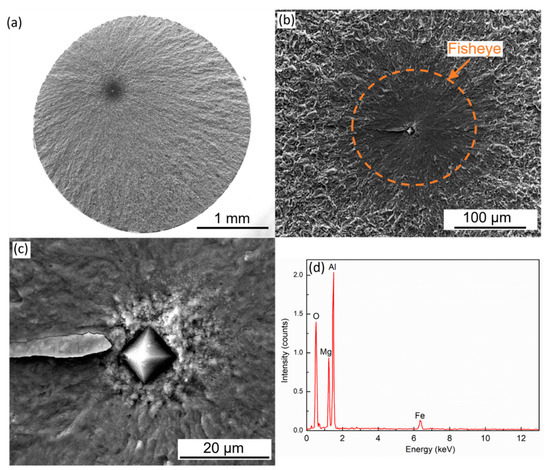
Figure 6.
Typical morphologies of the fatigue crack initiated from a spinel inclusion: (a) Fracture surface; (b) fish eye structure; (c) inclusion in the crack initiation site; (d) EDS analysis of the inclusion.
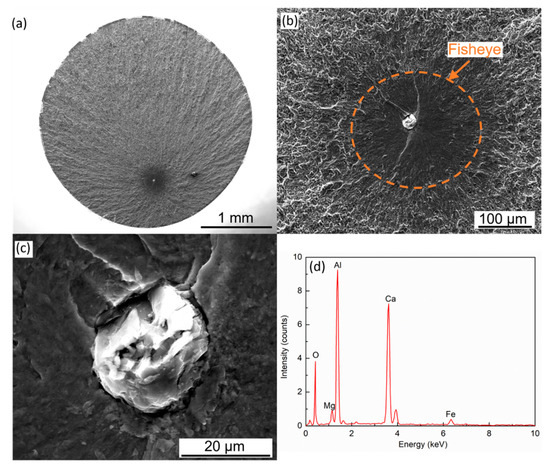
Figure 7.
Typical morphologies of the fatigue crack initiated from a spinel inclusion: (a) Fracture surface; (b) fish eye structure; (c) inclusion in the crack initiation site; (d) EDS analysis of the inclusion.
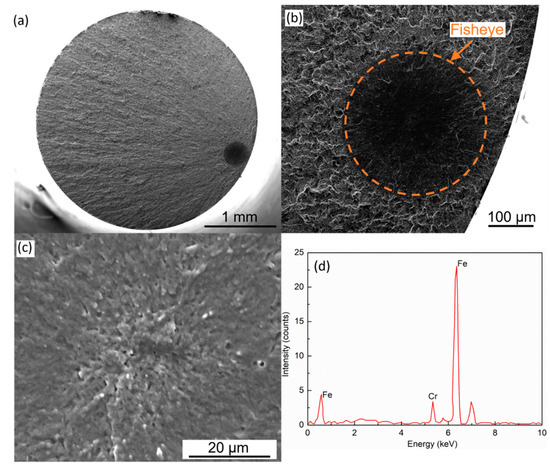
Figure 8.
Typical morphologies of the fatigue crack initiated from the steel matrix: (a) Fracture surface; (b) fish eye structure; (c) inclusion in the crack initiation site; (d) EDS analysis of the inclusion.
4. Discussion
4.1. The Effect of Oxide Inclusions on Fatigue Properties
4.1.1. The Correlation between 109-Fatigue Limit and the Inclusion Characteristics
To analyze the correlation between the fatigue property and the inclusion characters, the 109-fatigue limits of Steel A, B and C were extracted from Figure 5a. Based on the extracted data, the correlation between 109-fatigue limit and the number density of inclusions, and the correlation between 109-fatigue limit and the average size of inclusions in bearing steels with different cleanliness are shown in Figure 9. When the number density of oxide inclusions decreases from 2.85 mm−2 to 2.38 mm−2, 109-fatigue limit of bearing steel increases significantly, while this increase stops when the number density of oxide inclusions keeps decreasing. The same tendency also appears on the correlation between 109-fatigue limit and the average size.
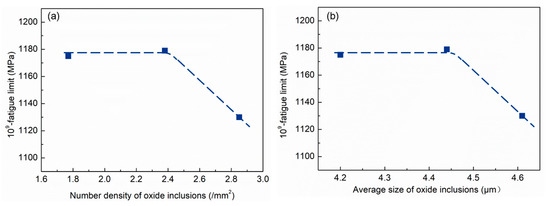
Figure 9.
The correlation between the 109-fatigue limit and (a) the number density of inclusions; (b) the average size of bearing steels with different cleanliness.
4.1.2. The Critical Size of Different Types of Inclusions
All types of inclusions in steel will lead to stress concentrations during fatigue loadings, which contribute largely to the fatigue crack initiations. Targeting at analyzing the effect of inclusion sizes on fatigue properties, Murakami et al. [31] introduced the stress intensity factors (SIF) and reported there is a relation between the maximum SIF Kmax,inc and the square root of the internal inclusions area and the fatigue stress amplitude σ0 when R = −1, see Equation (2):
When Kmax,inc exceeds the threshold value for the propagation of a long crack Kth (4–6 MPa·m1/2 for high strength steel, Kth = ∆Kth/2 for R = −1), the crack will initiate with the generation of the fish eye structure. With the investigation of fatigue properties of steel in VHCF regime, researchers found that when Kmax,inc is lower than Kth, the fatigue failure still occurs, but initiates with the generation of the ODA structure.
Although Equation (2) well explains the relation between the size of inclusions and the crack generation behavior during the fatigue process, other parameters of inclusions, which also affect the fatigue property, are neglected, such as the inclusion type [18,32]. Figure 10 illustrates the relation between Kmax,inc and the fatigue life Nf based on the fatigue data in this study. The data in Figure 9 is sorted by inclusion types. It is obvious that the minimum Kmax,inc for crack initiations of different types of inclusions varies: 2.92 MPa·m1/2 for spinel inclusions; 3.68 MPa·m1/2 for calcium aluminate inclusions.
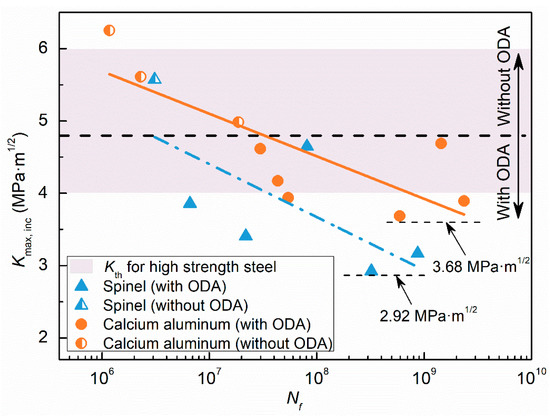
Figure 10.
Kmax,inc for spinel inclusions and calcium aluminate inclusions.
Based on the different values of minimum Kmax,inc for different inclusions, the critical sizes of different inclusions under different fatigue stress amplitude are also deduced with the assistance of Equation (2), which is shown in Figure 11. When the size of the inclusion is smaller than the critical size, fatigue crack will not initiate. For both spinel and calcium aluminate inclusions, the critical size decreases with the increase of fatigue stress amplitude. When the fatigue stress amplitude keeps consistent, the critical size for spinel inclusions appears obviously smaller than that of calcium aluminate inclusions. The fatigue stress amplitude of 1200 MPa being taken as an example, the critical sizes of spinel inclusions and calcium aluminate inclusions are 8.5 μm and 13.5 μm, respectively. In the following section, the relation between T.O and oxide inclusions will be discussed based on the critical sizes under 1200 MPa. The spinel inclusions larger than 8.5 μm and the calcium aluminate inclusions larger than 13.5 μm are defined as the critical inclusions, while the spinel inclusions smaller than 8.5 μm, the calcium aluminate inclusions smaller than 13.5 μm, and all silicate inclusions are defined as non-critical inclusions since no fatigue crack initiation is found to be caused by silicate inclusions.

Figure 11.
The critical size of spinel inclusions and calcium aluminate inclusions under different fatigue stress amplitude.
4.2. The Relation between Oxide Inclusions and the Cleanliness Indicator T.O
To investigate the relation between oxide inclusions and the cleanliness indicator T.O, the effects of critical inclusions and non-critical inclusions on the variation of T.O are analyzed numerically in this section.
T.O in steel consists of the oxygen content in oxide inclusions ([O]ox) and the oxygen content dissolved in steel ([O]free), see Equation (3):
where [O]ox can be calculated by Equation (4):
where ρFe is the density of steel, kg/m3. ρox is the density of the oxide inclusion, kg/m3, which can be calculated with the parameters shown in Table 3 [33] according to the mass ratio of simple oxides in complex inclusion. (O)ox is the mass fraction of oxygen in a single oxide inclusion. V is the volume fraction of oxide inclusions in steel. The parameter V can be expressed with Equation (5):
where d is the average size of investigated inclusions, m; Nv is the volume number density of investigated inclusions, m−3. Due to the difficulty on the precise measurement of Nv, the value of Nv can be calculated with the area number density of inclusions Na, m−2, see Equation (6) [34]:
where the area number density of inclusions Na is the number of inclusions observed in an area of steel divided by the area of the steel, which can be easily obtained with the two-dimension inclusion observation.
Table 3.
The densities of simple oxide inclusions (kg/m3).
Based on Equations (3)–(6), the numerical effect of the inclusion size and the number density on [O]ox is analyzed first. Figure 10 illustrates the variation of [O]ox with the average size of inclusions d and the volume number density of inclusions Nv. As shown in Figure 12, [O]ox increases with both d and Nv. Due to the power three of the parameter d in Equation (4), the contribution of d on the variation of [O]ox is larger than Nv. Nevertheless, the larger contribution of d is not absolute. The addition of 1 inclusion/mm3 of 9.5 μm and 20 inclusions/mm3 of 3.6 μm can both contribute to the increase of 0.1 × 10⁻⁶ of [O]ox; the addition of 1 inclusion/mm3 of 20.5 μm and 20 inclusions/mm3 of 9.5 μm can both contribute to the increase of 1 × 10⁻⁶ of [O]ox. For high-quality steel, the number density of the oxide inclusion with larger size decreases and the number density of the oxide inclusion with smaller size increases, which directly leads to less contribution of the oxide inclusions with a larger size on T.O.
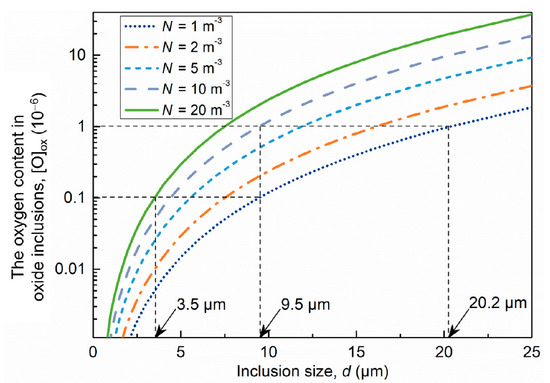
Figure 12.
The effect of the harmonic average size of inclusions d and the volume number density of inclusions Nv on the variation of [O]ox.
According to the area number densities of oxide inclusions shown in Figure 4, the histograms of [O]ox of different types of inclusions are also calculated with Equations (3)–(6). The results are shown in Figure 13. T.O contributed by the inclusions larger than the critical size (spinel ≥ 8.5 μm and calcium aluminate ≥ 13.5 μm) is defined as critical T.O. The rest of the T.O, contributed by non-critical inclusions (spinel ≤ 8.5 μm, calcium aluminate ≤ 13.5 μm and silicate) and the oxygen content dissolved in steel [O]free, is defined as non-critical T.O. Figure 14 shows the variation of critical T.O and non-critical T.O in steels A, B, and C. It is obvious that the decrease of T.O is mainly caused by the decrease of non-critical T.O, which keeps a steady decreasing trend when T.O decreases from 12 × 10−6 to 6 × 10⁻⁶. While the critical T.O only decreases by 0.9 × 10⁻⁶ when T.O decreases from 12 × 10−6 to 8 × 10⁻⁶ for commercial quality steel. When T.O keeps decreasing to 6 × 10⁻⁶ for high-quality steel, the decreasing trend of the critical T.O almost disappears, which well explains the reason for the slight improvement of fatigue property of steels A and B. Therefore, for high quality steel with low T.O, further decreasing T.O is getting less sufficient to the improvement of fatigue life due to the barely decreased critical T.O.
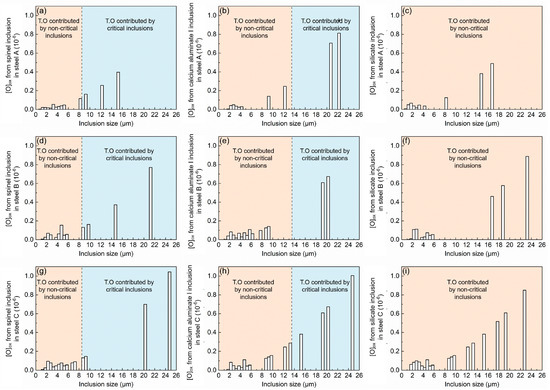
Figure 13.
Histograms of [O]ox sorted by types: (a) Spinel inclusions in steel A; (b) calcium aluminate inclusions in steel A; (c) silicate inclusions in steel A; (d) spinel inclusions in steel B; (e) calcium aluminate inclusions in steel B; (f) silicate inclusions in steel B; (g) spinel inclusions in steel C; (h) calcium aluminate inclusions in steel C; (i) silicate inclusions in steel C.
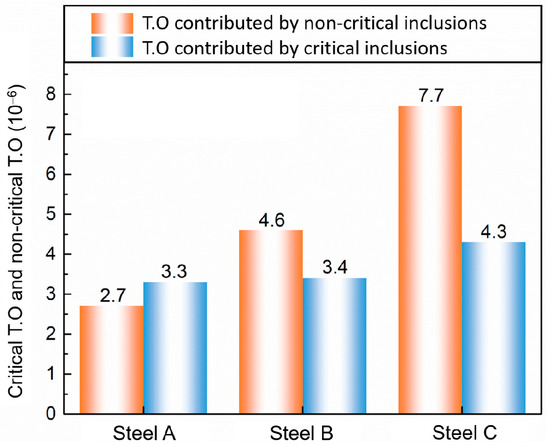
Figure 14.
The effects of critical T.O and non-critical T.O on the variation of T.O.
5. Conclusions and Summary
A systematic and carefully designed experimental study was developed for quantitative analysis of fatigue life improvement with respect to the inclusion engineering. In this study, only the inclusion characteristics are changed. The following conclusions are obtained:
(1) The minimum Kmax,inc for fatigue crack initiation varies with the inclusion type. For spinel and calcium aluminate inclusions in the investigated steel, the minimum Kmax,inc are 2.92 MPa·m1/2 and 3.68 MPa·m1/2, respectively.
(2) The critical size of spinel and calcium aluminate inclusions under different fatigue stress amplitude is deduced according to the minimum Kmax,inc. Under the stress amplitude of 1200 MPa, the critical sizes of spinel and calcium aluminate inclusions are 8.5 μm and 13.5 μm, respectively.
(3) With the increase of the cleanliness of bearing steels, the improvement of fatigue properties will reach saturation. Under this condition, further increasing the cleanliness of the bearing steel will not contribute to the improvement of fatigue property for this investigated alloy and process design.
(4) For the improvement of fatigue properties, further decreasing the total oxygen content becomes less sufficient since the critical total oxygen content for fatigue life barely decreases with the decrease of the total oxygen content for high-quality steel. Refinement, homogenized distribution of inclusions, and the improvement of the steel matrix are expected to have more outstanding effects on the improvement of fatigue properties.
Author Contributions
Data curation, C.G.; funding acquisition, Y.B.; investigation, C.G. and M.W.; methodology, M.W., Y.B. and F.W.; supervision, Y.B., J.L. and F.W.; writing—original draft, C.G.; writing—review & editing, J.L.
Funding
This work was supported by the State Key Laboratory for Advanced Metallurgy Foundation (No. 41618030).
Conflicts of Interest
The authors declare no conflict of interest.
References
- Kang, J.H.; Hosseinkhani, B.; Rivera-Díaz-del-Castillo, P.E.J. Rolling contact fatigue in bearings: Multiscale overview. Mater. Sci. Tech. 2012, 28, 44–49. [Google Scholar] [CrossRef]
- Sakai, T.; Sato, Y.; Oguma, N. Characteristic S-N properties of high-carbon-chromium-bearing steel under axial loading in long-life fatigue. Fatigue Fract. Eng. Mater. 2002, 25, 765–773. [Google Scholar] [CrossRef]
- Shiozawa, K.; Lu, L.; Ishihara, S. S-N curve characteristics and subsurface crack initiation behaviour in ultra-long life fatigue of a high carbon-chromium bearing steel. Fatigue Fract. Eng. Mater. 2001, 24, 781–790. [Google Scholar] [CrossRef]
- Akiniwa, Y.; Miyamoto, N.; Tsuru, H.; Tanaka, K. Notch effect on fatigue strength reduction of bearing steel in the very high cycle regime. Int. J. Fatigue 2006, 28, 1555–1565. [Google Scholar] [CrossRef]
- Li, W.; Sakai, T.; Li, Q.; Lu, L.T.; Wang, P. Reliability evaluation on very high cycle fatigue property of GCr15 bearing steel. Int. J. Fatigue 2010, 32, 1096–1107. [Google Scholar] [CrossRef]
- Chen, S.H.; Jiang, M.; He, X.F.; Wang, X.H. Top slag refining for inclusion composition transform control in tire cord steel. Int. J. Min. Met. Mater. 2012, 19, 490–498. [Google Scholar] [CrossRef]
- Cai, X.; Bao, Y.; Lin, L.; Gu, C. Effect of Al content on the evolution of non-metallic Inclusions in Si-Mn deoxidized steel. Steel Res. Int. 2016, 87, 1168–1178. [Google Scholar] [CrossRef]
- Park, J.S.; Park, J.H. Effect of slag composition on the concentration of Al2O3 in the inclusions in Si-Mn-killed steel. Metall. Mater. Trans. B 2014, 45, 953–960. [Google Scholar] [CrossRef]
- Ma, W.; Bao, Y.; Wang, M.; Zhao, L. Influence of slag composition on bearing steel cleanness. Ironmak. Steelmak. 2014, 41, 26–30. [Google Scholar] [CrossRef]
- Hou, Z.; Jiang, M.; Yang, E.; Gao, S.; Wang, X. Inclusion characterization in aluminum-deoxidized special steel with certain sulfur content under combined influences of slag refining, calcium treatment, and reoxidation. Metall. Mater. Trans. B 2018, 49, 3056–3066. [Google Scholar] [CrossRef]
- Tabatabaei, Y.; Coley, K.S.; Irons, G.A.; Sun, S. Model of inclusion evolution during calcium treatment in the ladle furnace. Metall. Mater. Trans. B 2018, 49, 2022–2037. [Google Scholar] [CrossRef]
- Ma, W.; Bao, Y.; Wang, M.; Zhao, L. Effect of Mg and Ca treatment on behavior and particle size of inclusions in bearing steels. ISIJ Int. 2014, 54, 536–542. [Google Scholar] [CrossRef]
- Bessho, N.; Yamasaki, H.; Fujii, T.; Nozaki, T.; Hiwasa, S. Removal of Inclusion from Molten Steel in Continuous Casting Tundish. ISIJ Int. 1992, 32, 157–163. [Google Scholar] [CrossRef]
- Ren, Y.; Zhang, L.; Ling, H.; Wang, Y.; Pan, D.; Ren, Q.; Wang, X. A reaction model for prediction of inclusion evolution during reoxidation of Ca-treated Al-killed steels in tundish. Metall. Mater. Trans. B 2017, 48, 1433–1438. [Google Scholar] [CrossRef]
- Ni, P.; Jonsson, L.T.I.; Ersson, M.; Jönsson, P.G. Non-metallic inclusion behaviors in a new tundishand SEN design using a swirling flow during continuous casting of steel. Steel Res. Int. 2017, 83, 1600155. [Google Scholar] [CrossRef]
- Murakami, Y.; Endo, M. Effects of defects, inclusions and inhomogeneities on fatigue strength. Int. J. Fatigue 1994, 16, 163–182. [Google Scholar] [CrossRef]
- Murakami, Y.; Yokoyama, N.; Nagata, J. Mechanism of fatigue failure in ultralong life regime. Fatigue Fract. Eng. Mater. 2002, 25, 735–746. [Google Scholar] [CrossRef]
- Spriestersbach, D.; Grad, P.; Kerscher, E. Influence of different non-metallic inclusion types on the crack initiation in high-strength steels in the VHCF regime. Int. J. Fatigue 2014, 64, 114–120. [Google Scholar] [CrossRef]
- Gu, C.; Lian, J.; Bao, Y.; Münstermann, S. Microstructure-based fatigue modelling with residual stresses: Prediction of the microcrack initiation around inclusions. Mat. Sci. Eng. A 2019, 751, 133–141. [Google Scholar] [CrossRef]
- Gu, C.; Lian, J.; Bao, Y.; Xiao, W.; Münstermann, S. Numerical study of the effect of inclusions on the residual stress distribution in high-strength martensitic steels during cooling. Appl. Sci. 2019, 9, 455. [Google Scholar] [CrossRef]
- Gu, C.; Lian, J.; Bao, Y.; Xie, Q.; Münstermann, S. Microstructure based fatigue modelling with residual stresses: Prediction of the fatigue life for various inclusion sizes. Int. J. Fatigue 2014. under review. [Google Scholar]
- Lian, J.; Sharaf, M.; Archie, F.; Münstermann, S. A hybrid approach for modelling of plasticity and failure behaviour of advanced high-strength steel sheets. Int. J. Damage Mech. 2012, 22, 188–218. [Google Scholar] [CrossRef]
- Murakami, Y.; Nomoto, T.; Ueda, T. Factors influencing the mechanism of superlong fatigue failure in steels. Fatigue Fract. Eng. Mater. 1999, 22, 581–590. [Google Scholar] [CrossRef]
- Murakami, Y.; Nomoto, T.; Ueda, T.; Murakami, Y. On the mechanism of fatigue failure in the superlong life regime (N > 107 cycles). Part II: A fractographic investigation. Fatigue Fract. Eng. Mater. 2000, 23, 903–910. [Google Scholar] [CrossRef]
- Murakami, Y.; Nomoto, T.; Ueda, T.; Murakami, Y. On the mechanism of fatigue failure in the superlong life regime (N > 107 cycles). Part I: Influence of hydrogen trapped by inclusions. Fatigue Fract. Eng. Mater. 2000, 23, 893–902. [Google Scholar] [CrossRef]
- Gu, C.; Bao, Y.P.; Gan, P.; Lian, J.H.; Münstermann, S. An experimental study on the impact of deoxidation methods on the fatigue properties of bearing steels. Steel Res. Int. 2018, 89, 1800129. [Google Scholar] [CrossRef]
- Bertrand, J.; Molinero, J.; Landa, S.; Elvira, R.; Wild, M.; Barthold, G.; Valentin, P.; Schifferl, H. Metallurgy of plastic inclusions to improve fatigue life of engineering steels. Ironmak. Steelmak. 2003, 30, 165–169. [Google Scholar] [CrossRef]
- Li, Y.; Yang, Z.; Li, S.; Liu, Y.; Chen, S.; Hui, W.; Weng, Y. Effect of Hydrogen on Fatigue Strength of High-Strength Steels in the VHCF Regime. Adv. Eng. Mater. 2009, 11, 561–567. [Google Scholar] [CrossRef]
- Alexander Stopher, M.; Rivera-Diaz-del-Castillo, P.E.J. Hydrogen embrittlement in bearing steels. Mater. Sci. Tech. 2016, 32, 1184–1193. [Google Scholar] [CrossRef]
- Louthan, M.R. Hydrogen Embrittlement of Metals: A Primer for the Failure Analyst. J. Fail. Anal. Prev. 2008, 8, 289–307. [Google Scholar] [CrossRef]
- Murakami, Y.; Usuki, H. Quantitative evaluation of effects of non-metallic inclusions on fatigue strength of high strength steels. II: Fatigue limit evaluation based on statistics for extreme values of inclusion size. Int. J. Fatigue 1989, 11, 299–307. [Google Scholar] [CrossRef]
- Gu, C.; Bao, Y.P.; Gan, P.; Wang, M.; He, J.S. Effect of main inclusions on crack initiation in bearing steel in the very high cycle fatigue regime. Int. J. Miner. Metal. Mater. 2018, 25, 623–629. [Google Scholar] [CrossRef]
- Lide, D.R. CRC Handbook of Chemistry and Physics, 83rd ed.; CRC Press: Boca Raton, FL, USA, 2002. [Google Scholar]
- DeHoff, R.T. Quantitative Microscopy, 1st ed.; McGraw-Hill Book Company: New York, NY, USA, 1968. [Google Scholar]
© 2019 by the authors. Licensee MDPI, Basel, Switzerland. This article is an open access article distributed under the terms and conditions of the Creative Commons Attribution (CC BY) license (http://creativecommons.org/licenses/by/4.0/).