Microstructure Formation of Low-Carbon Ferritic Stainless Steel during High Temperature Plastic Deformation

Abstract
1. Introduction
2. Experimental Details
3. Results and Discussion
3.1. Effect of the Deformation Temperature
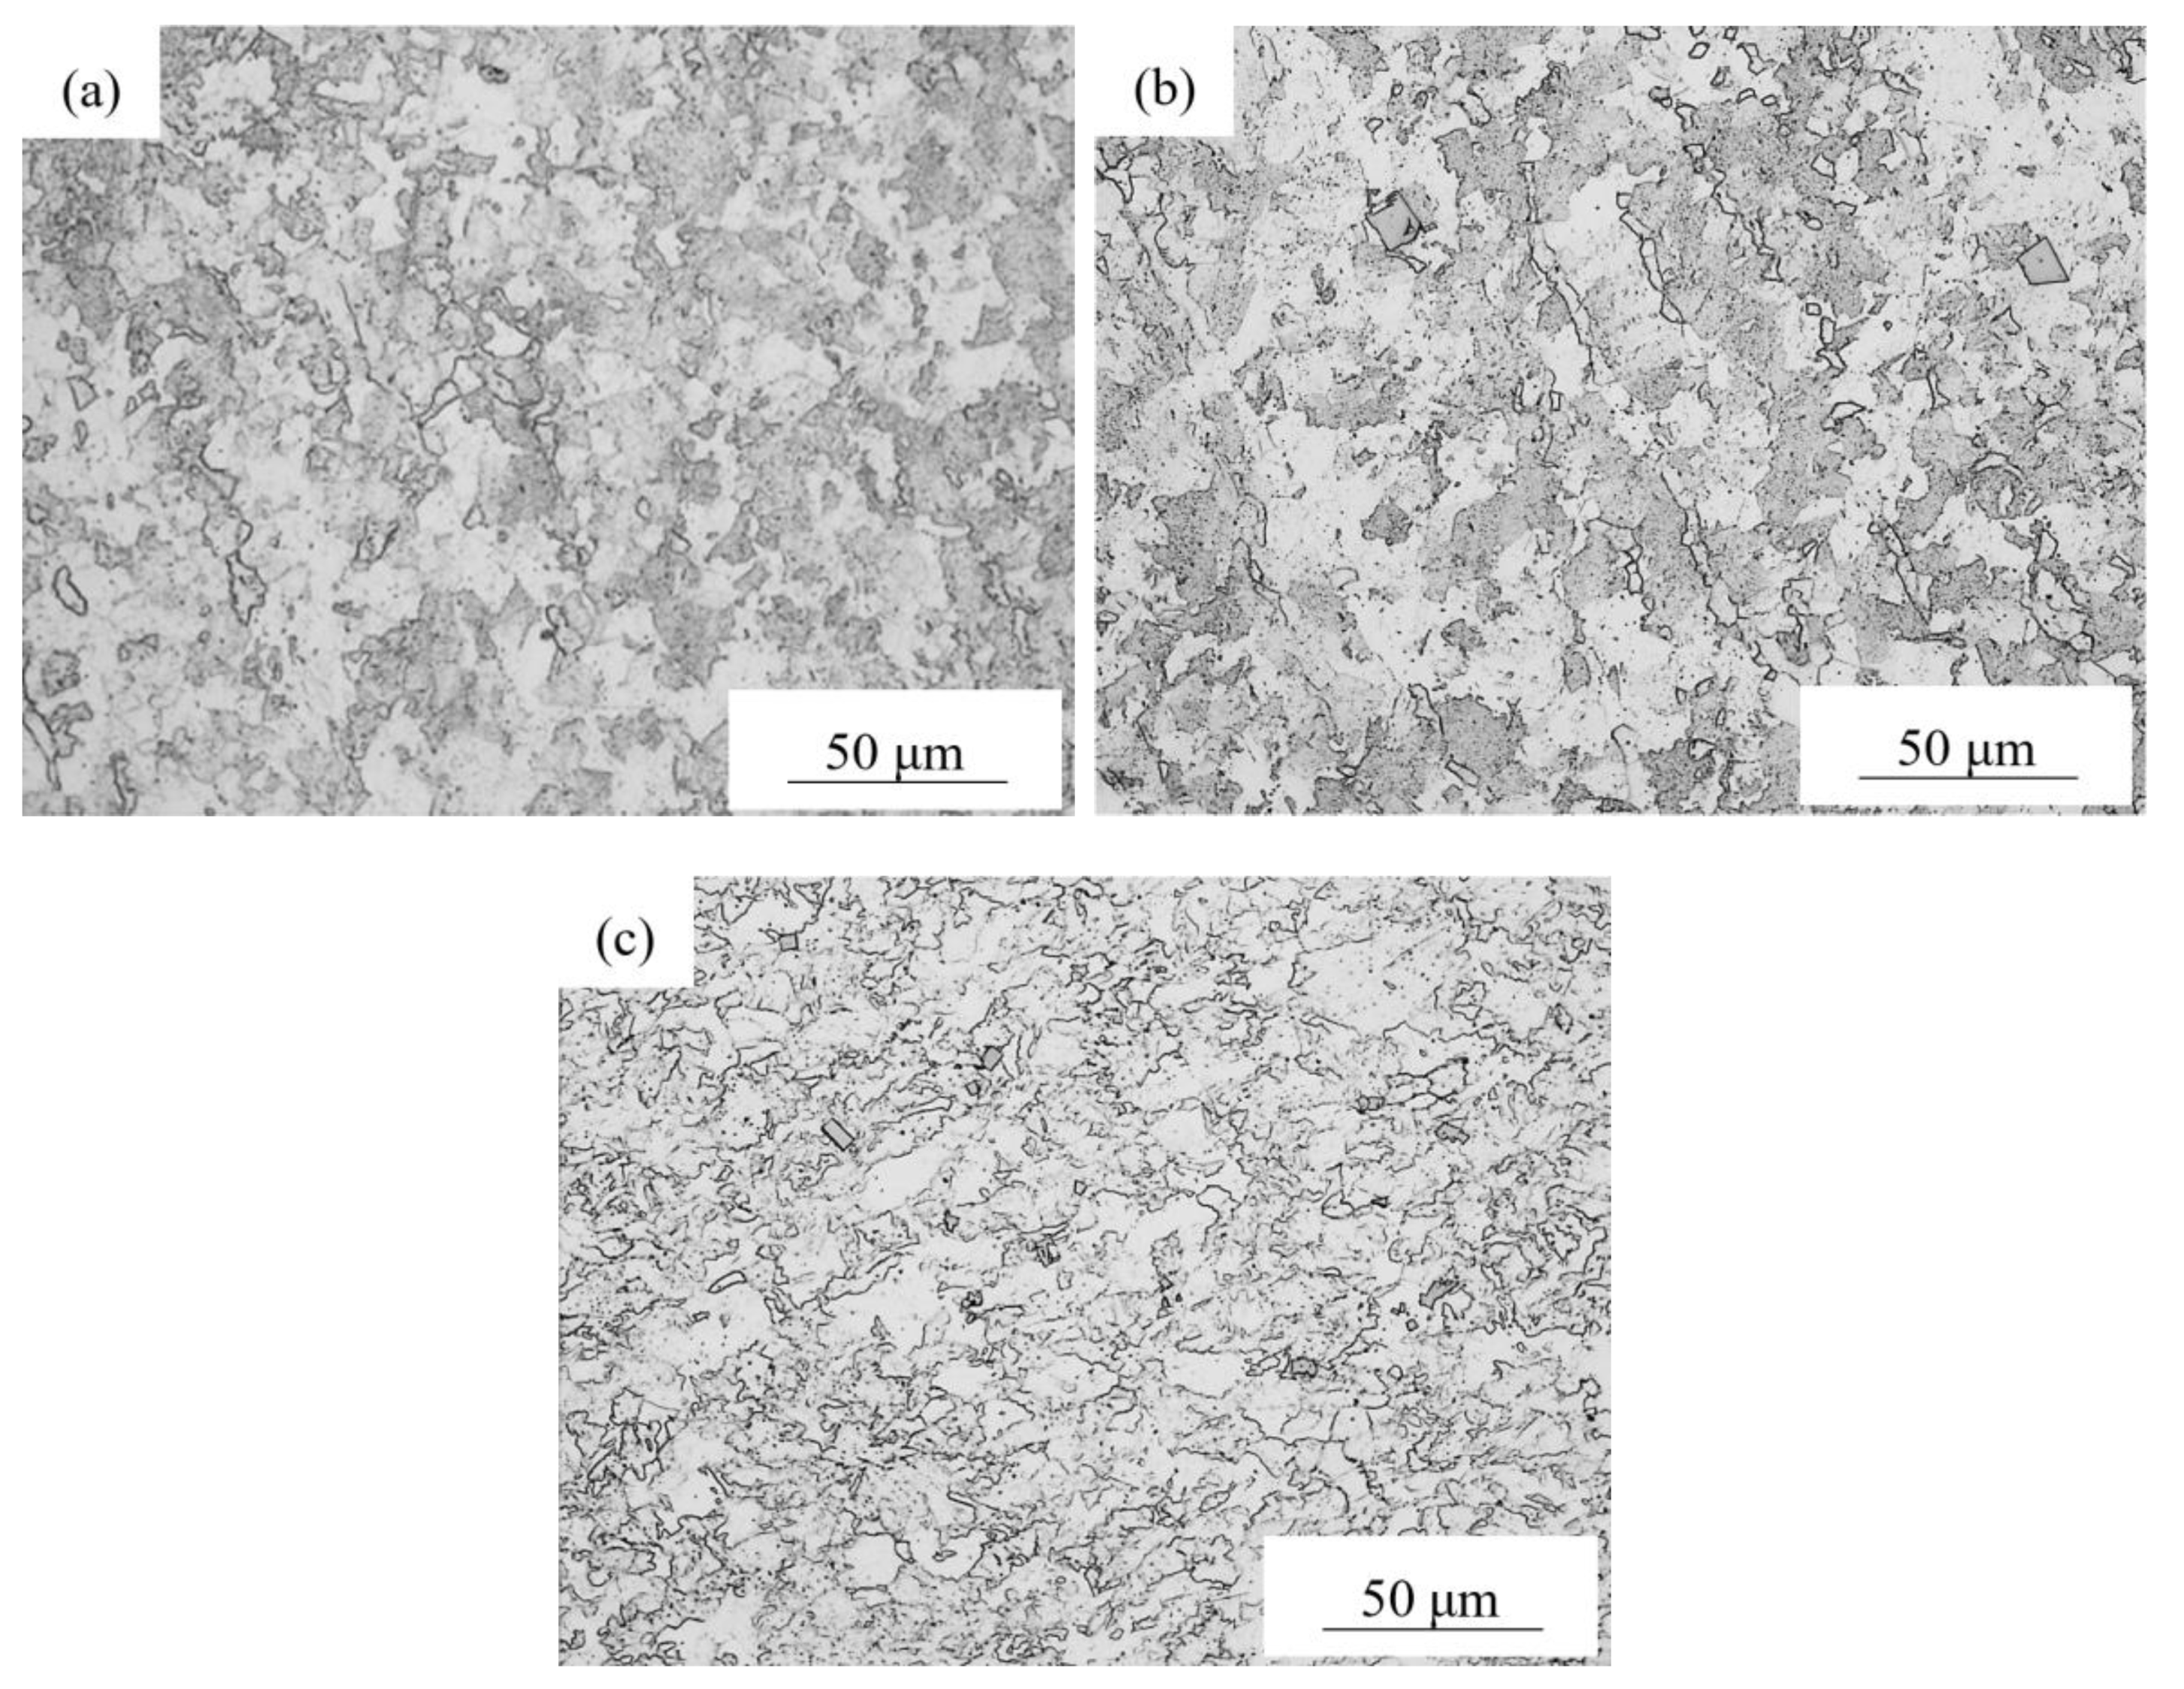
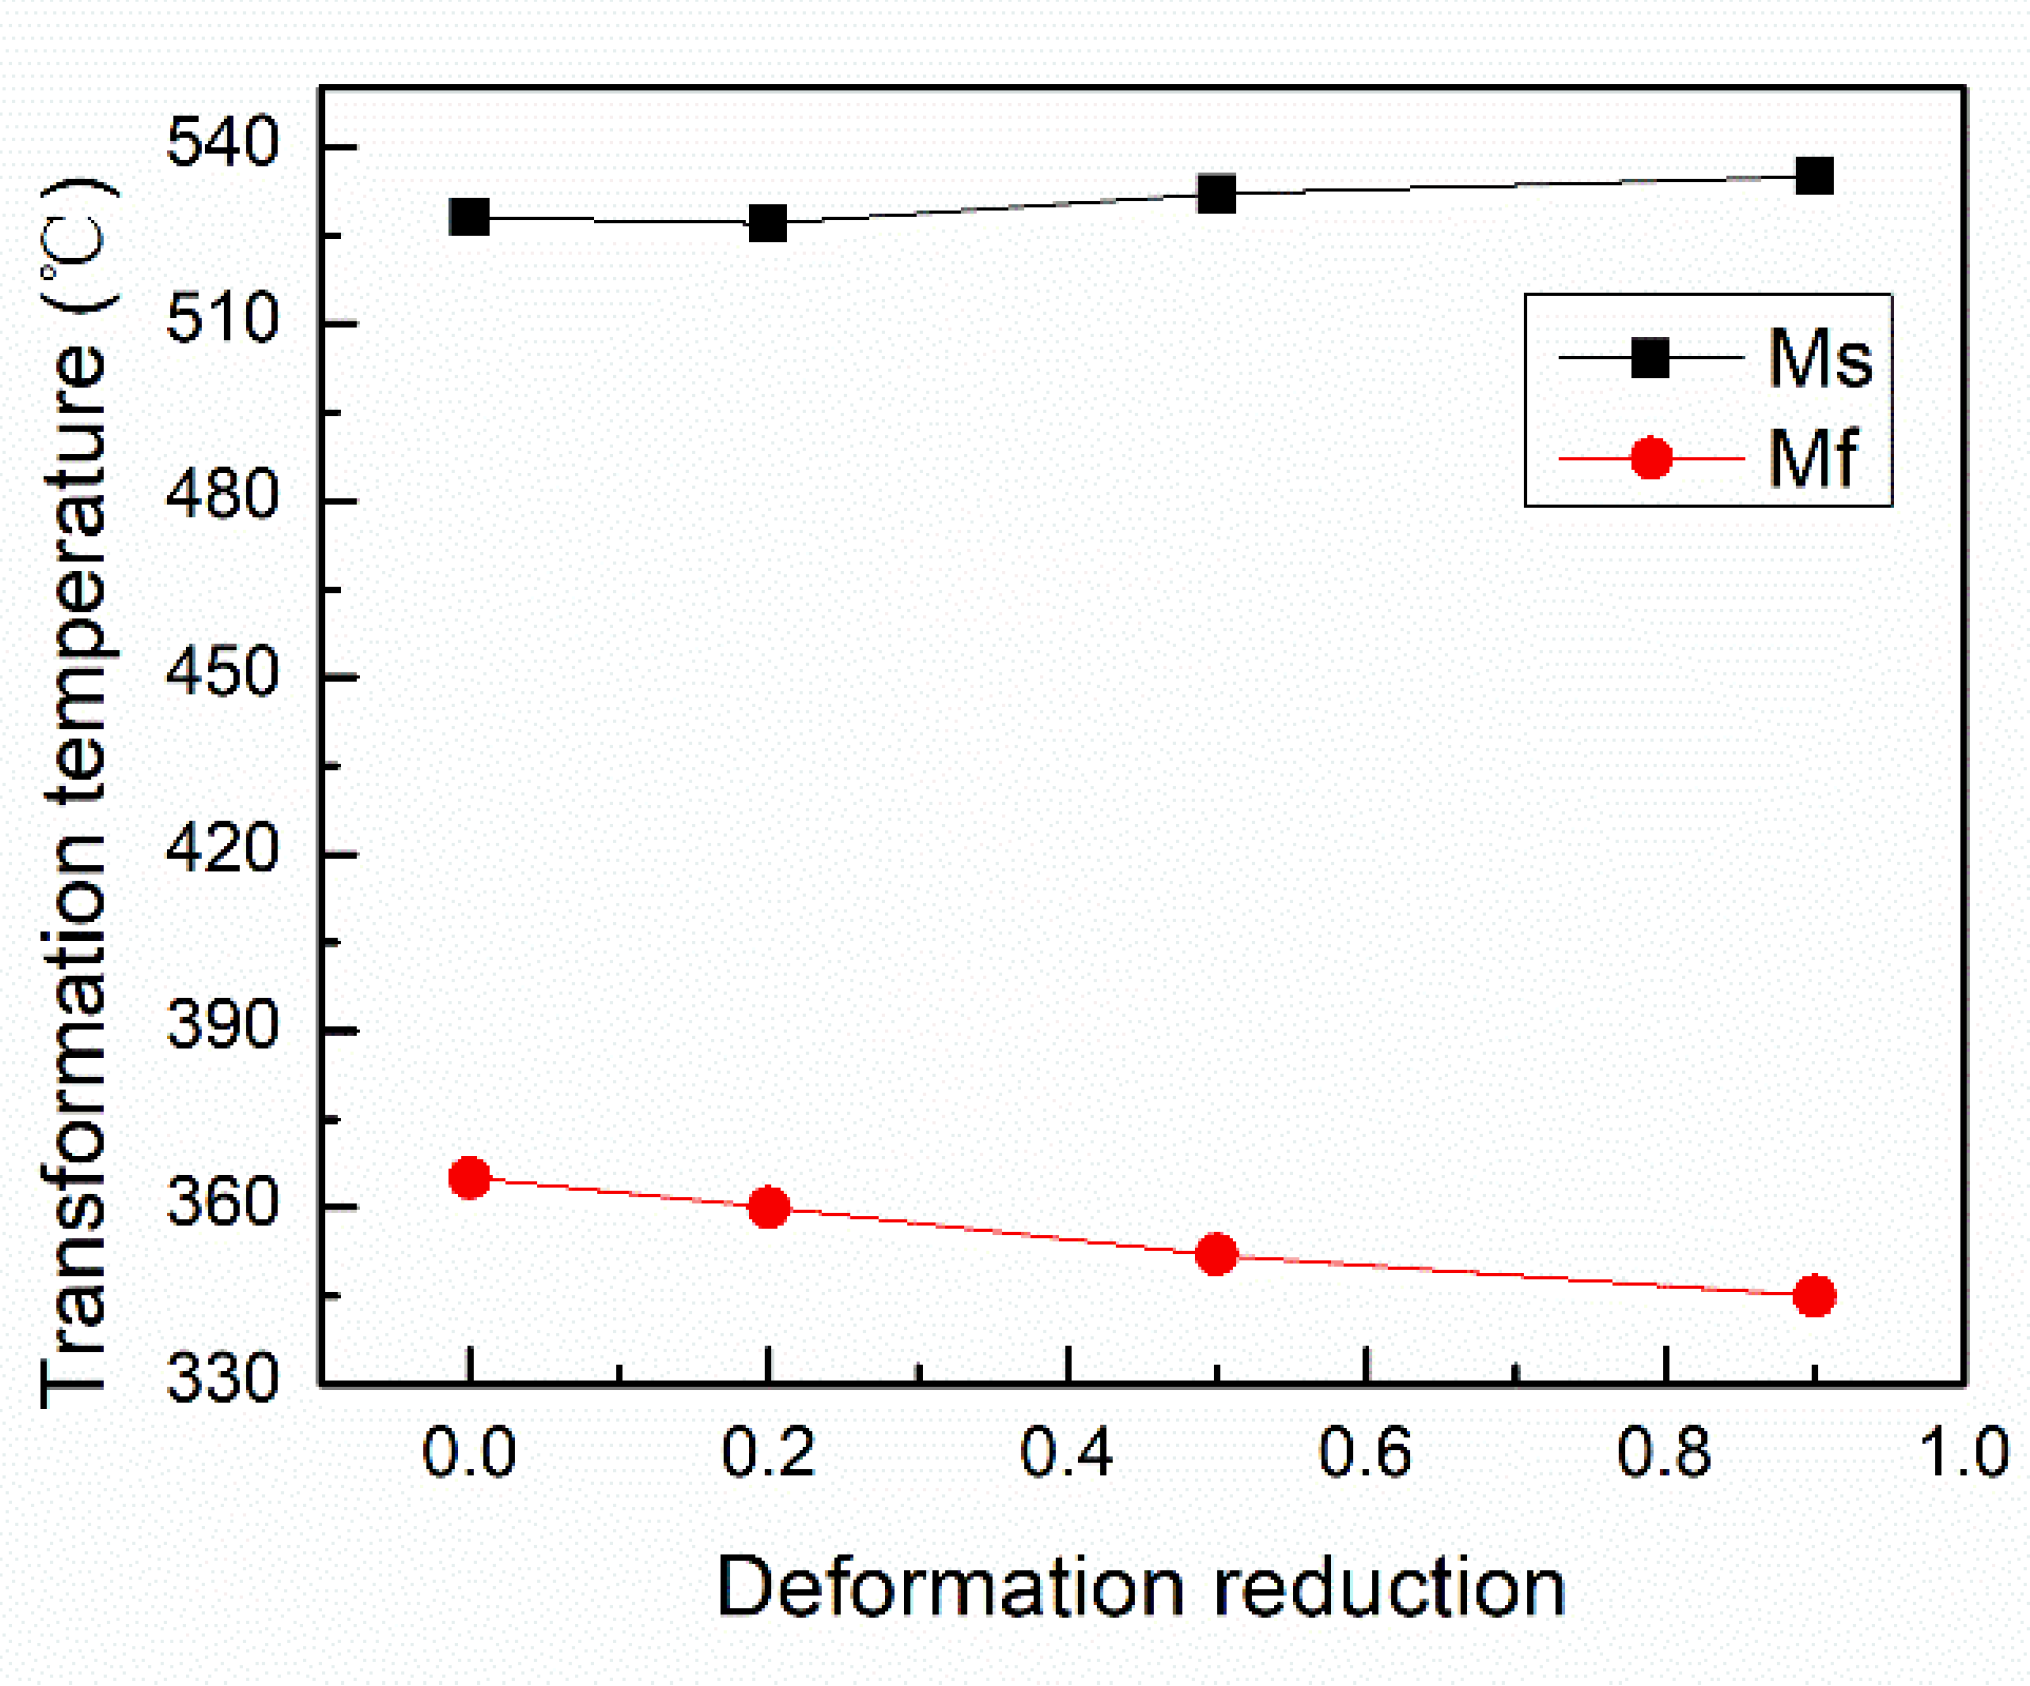
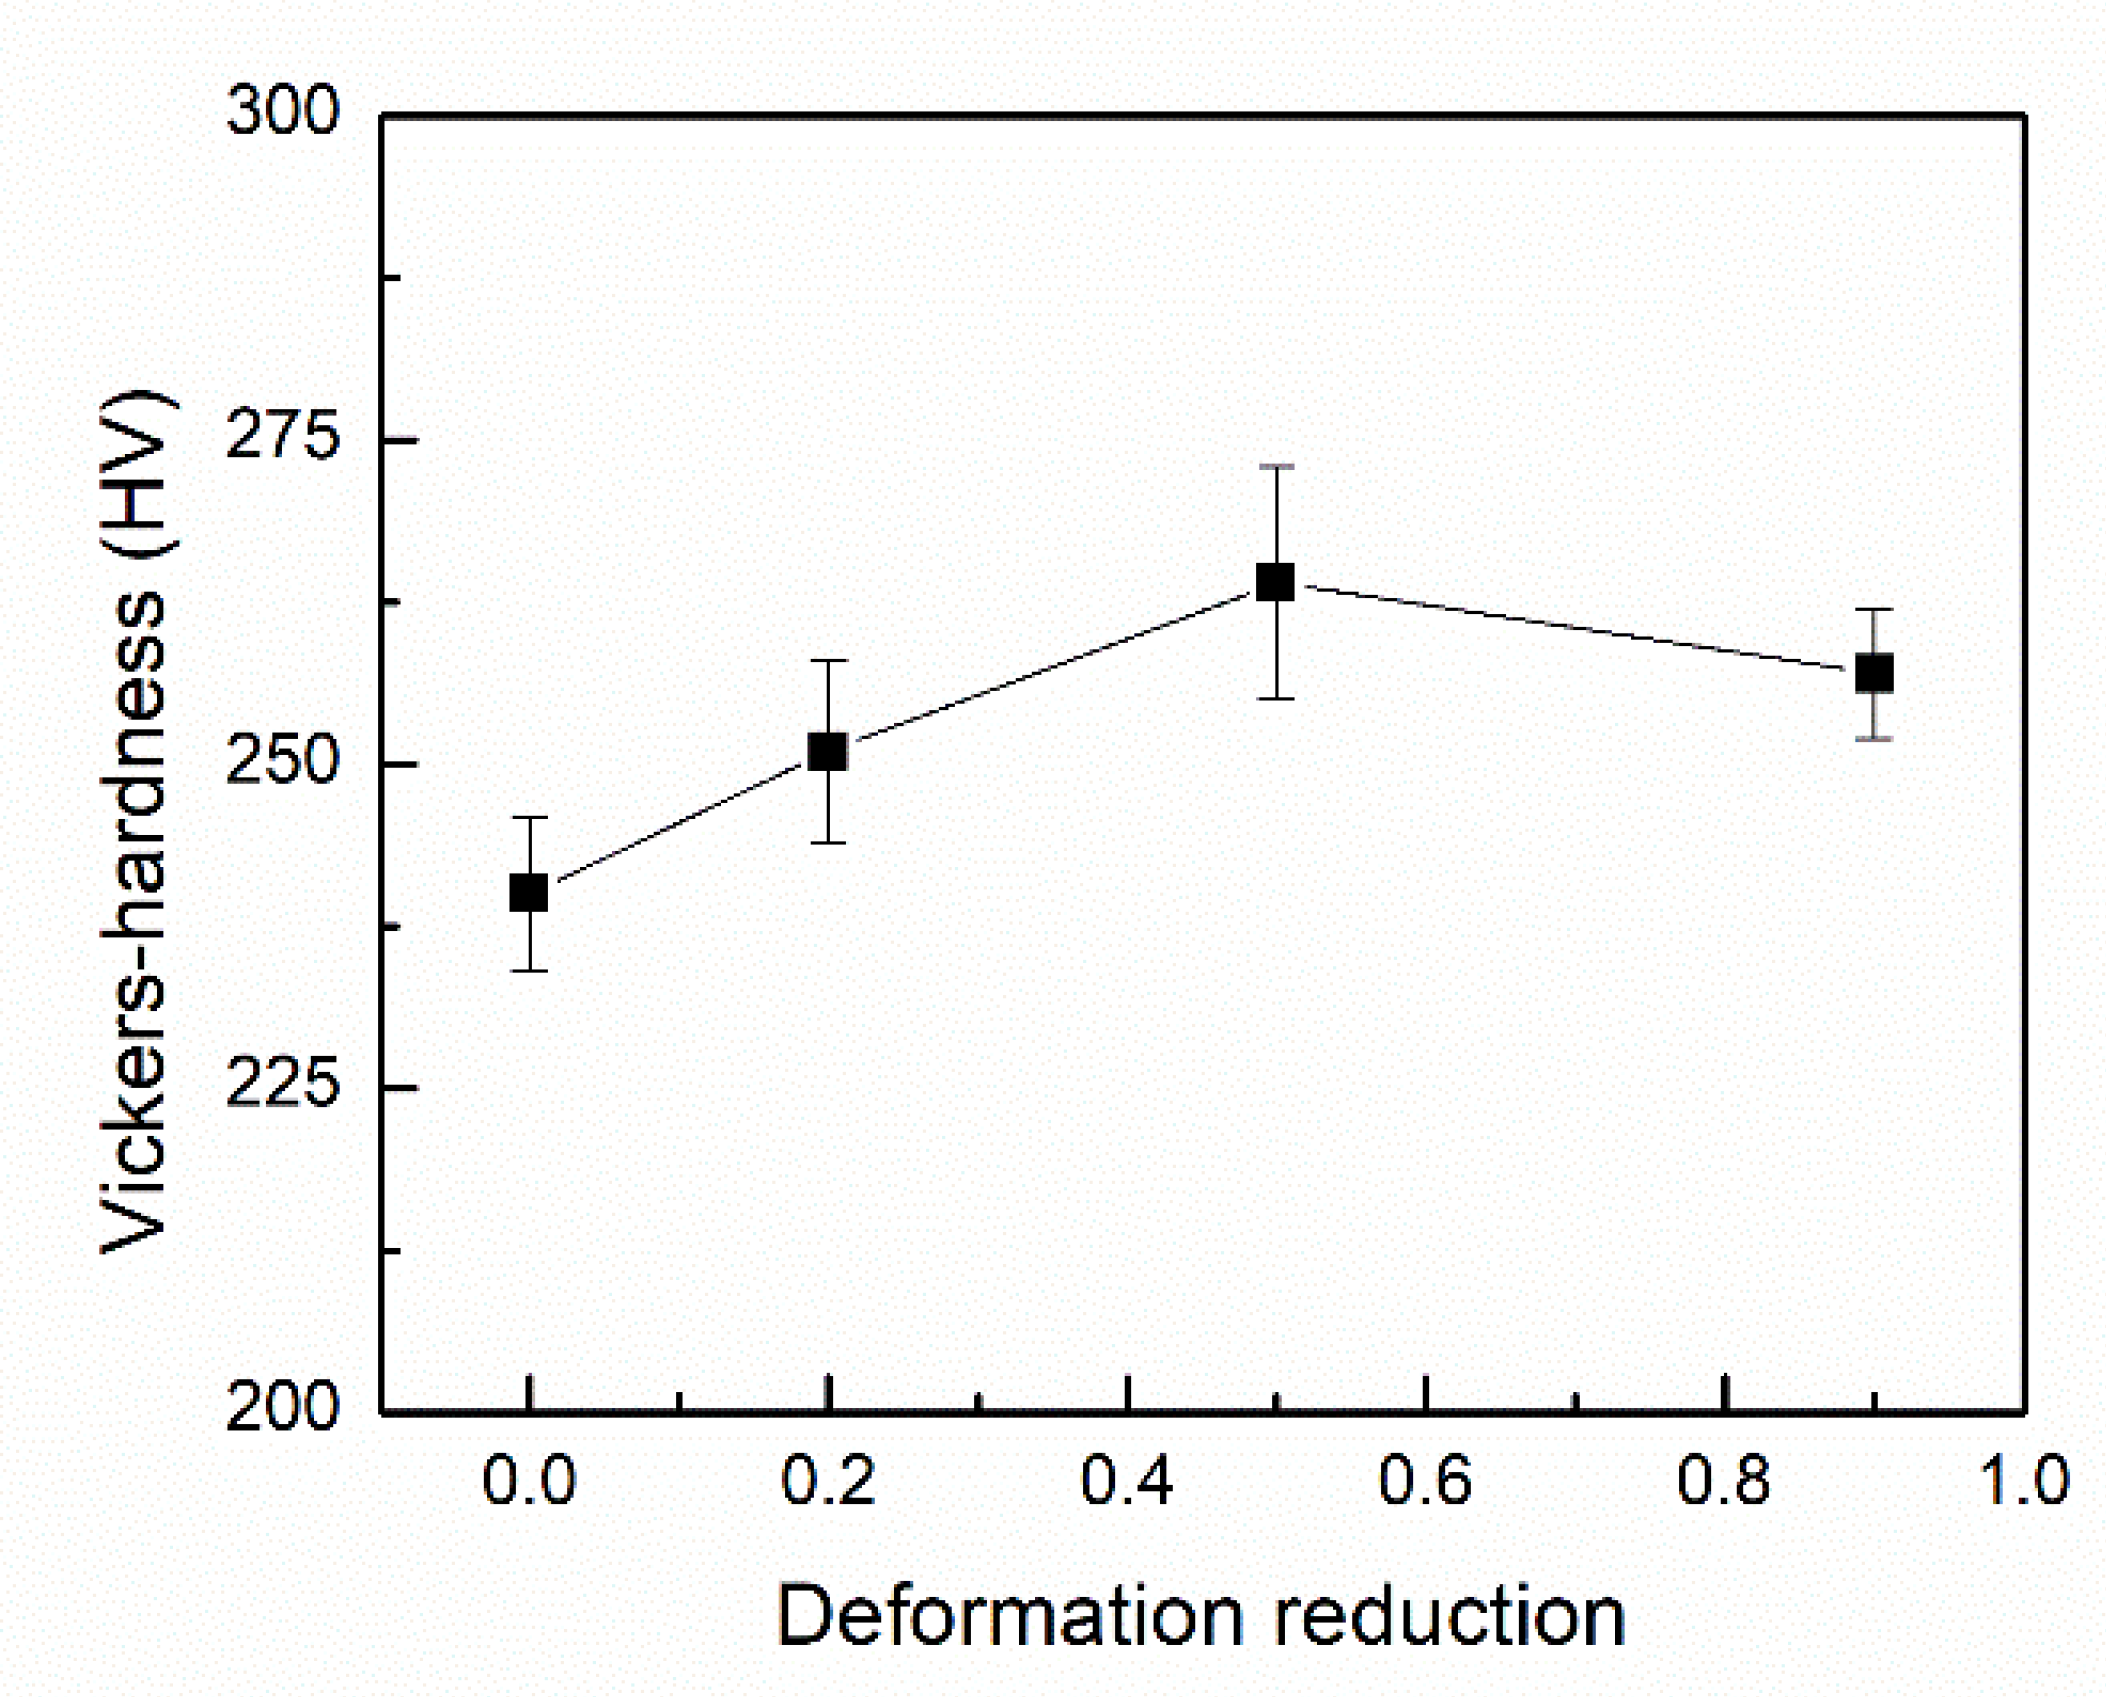
3.2. Effect of Deformation Reduction
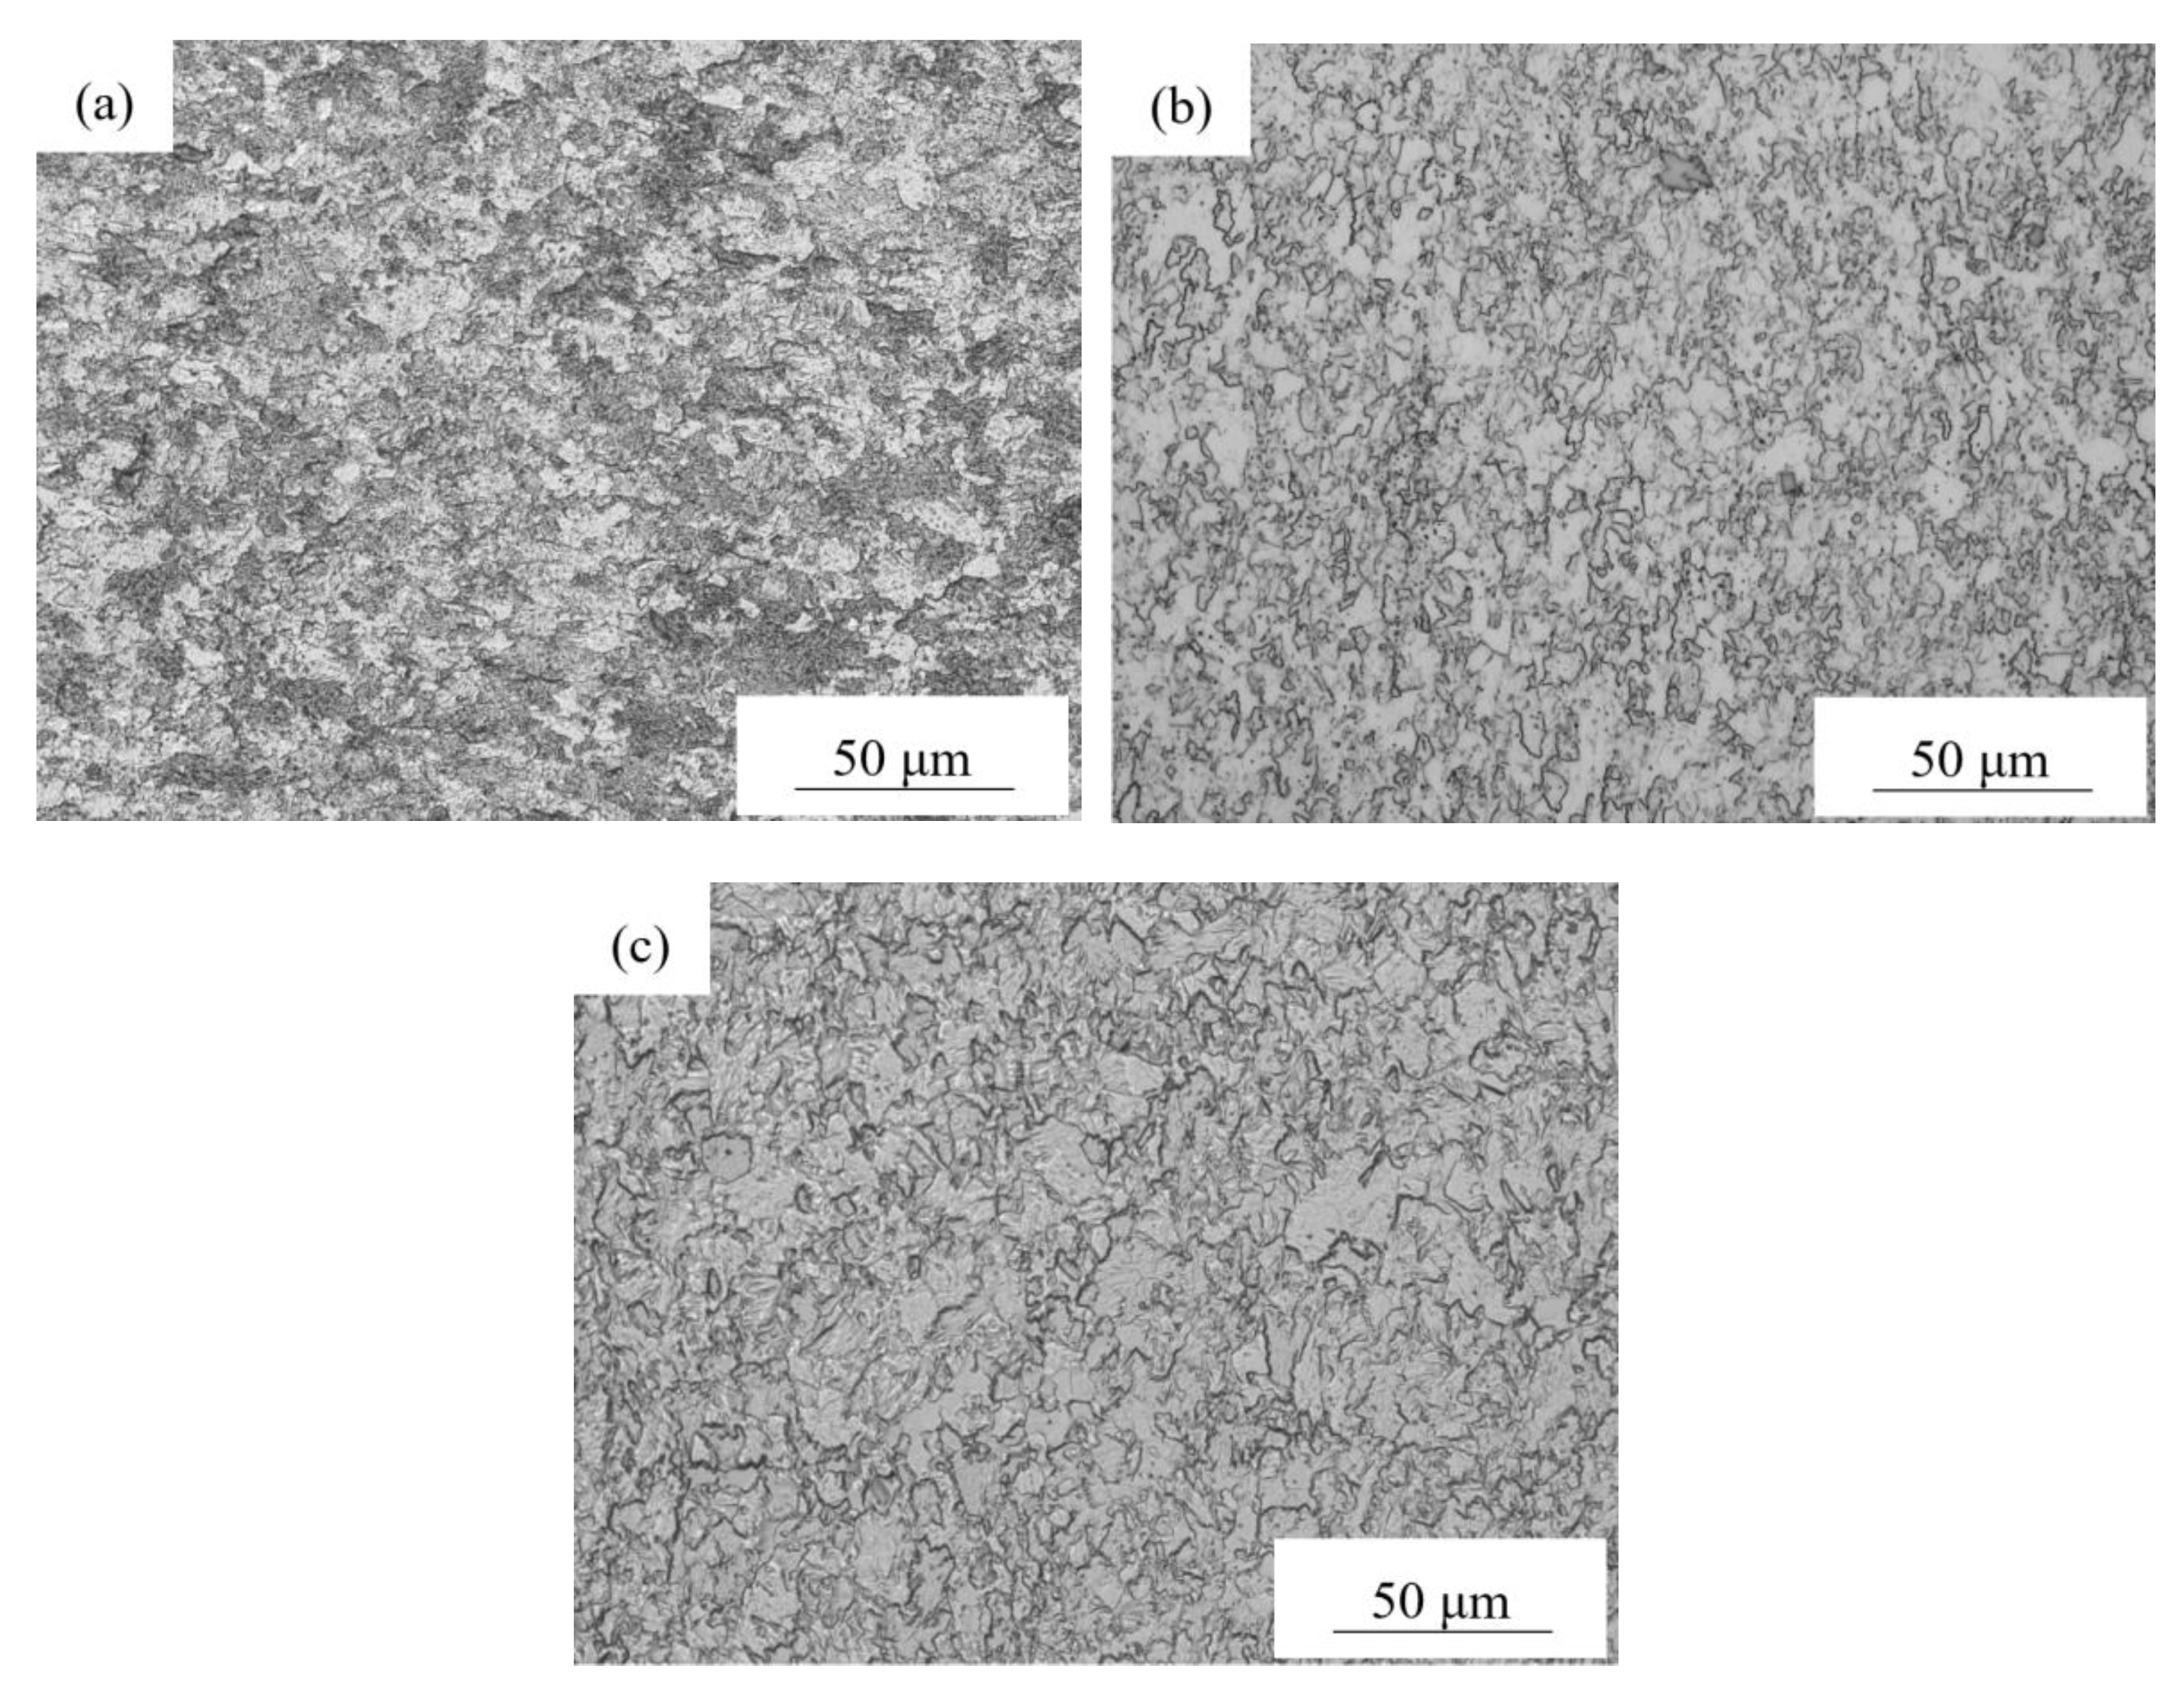
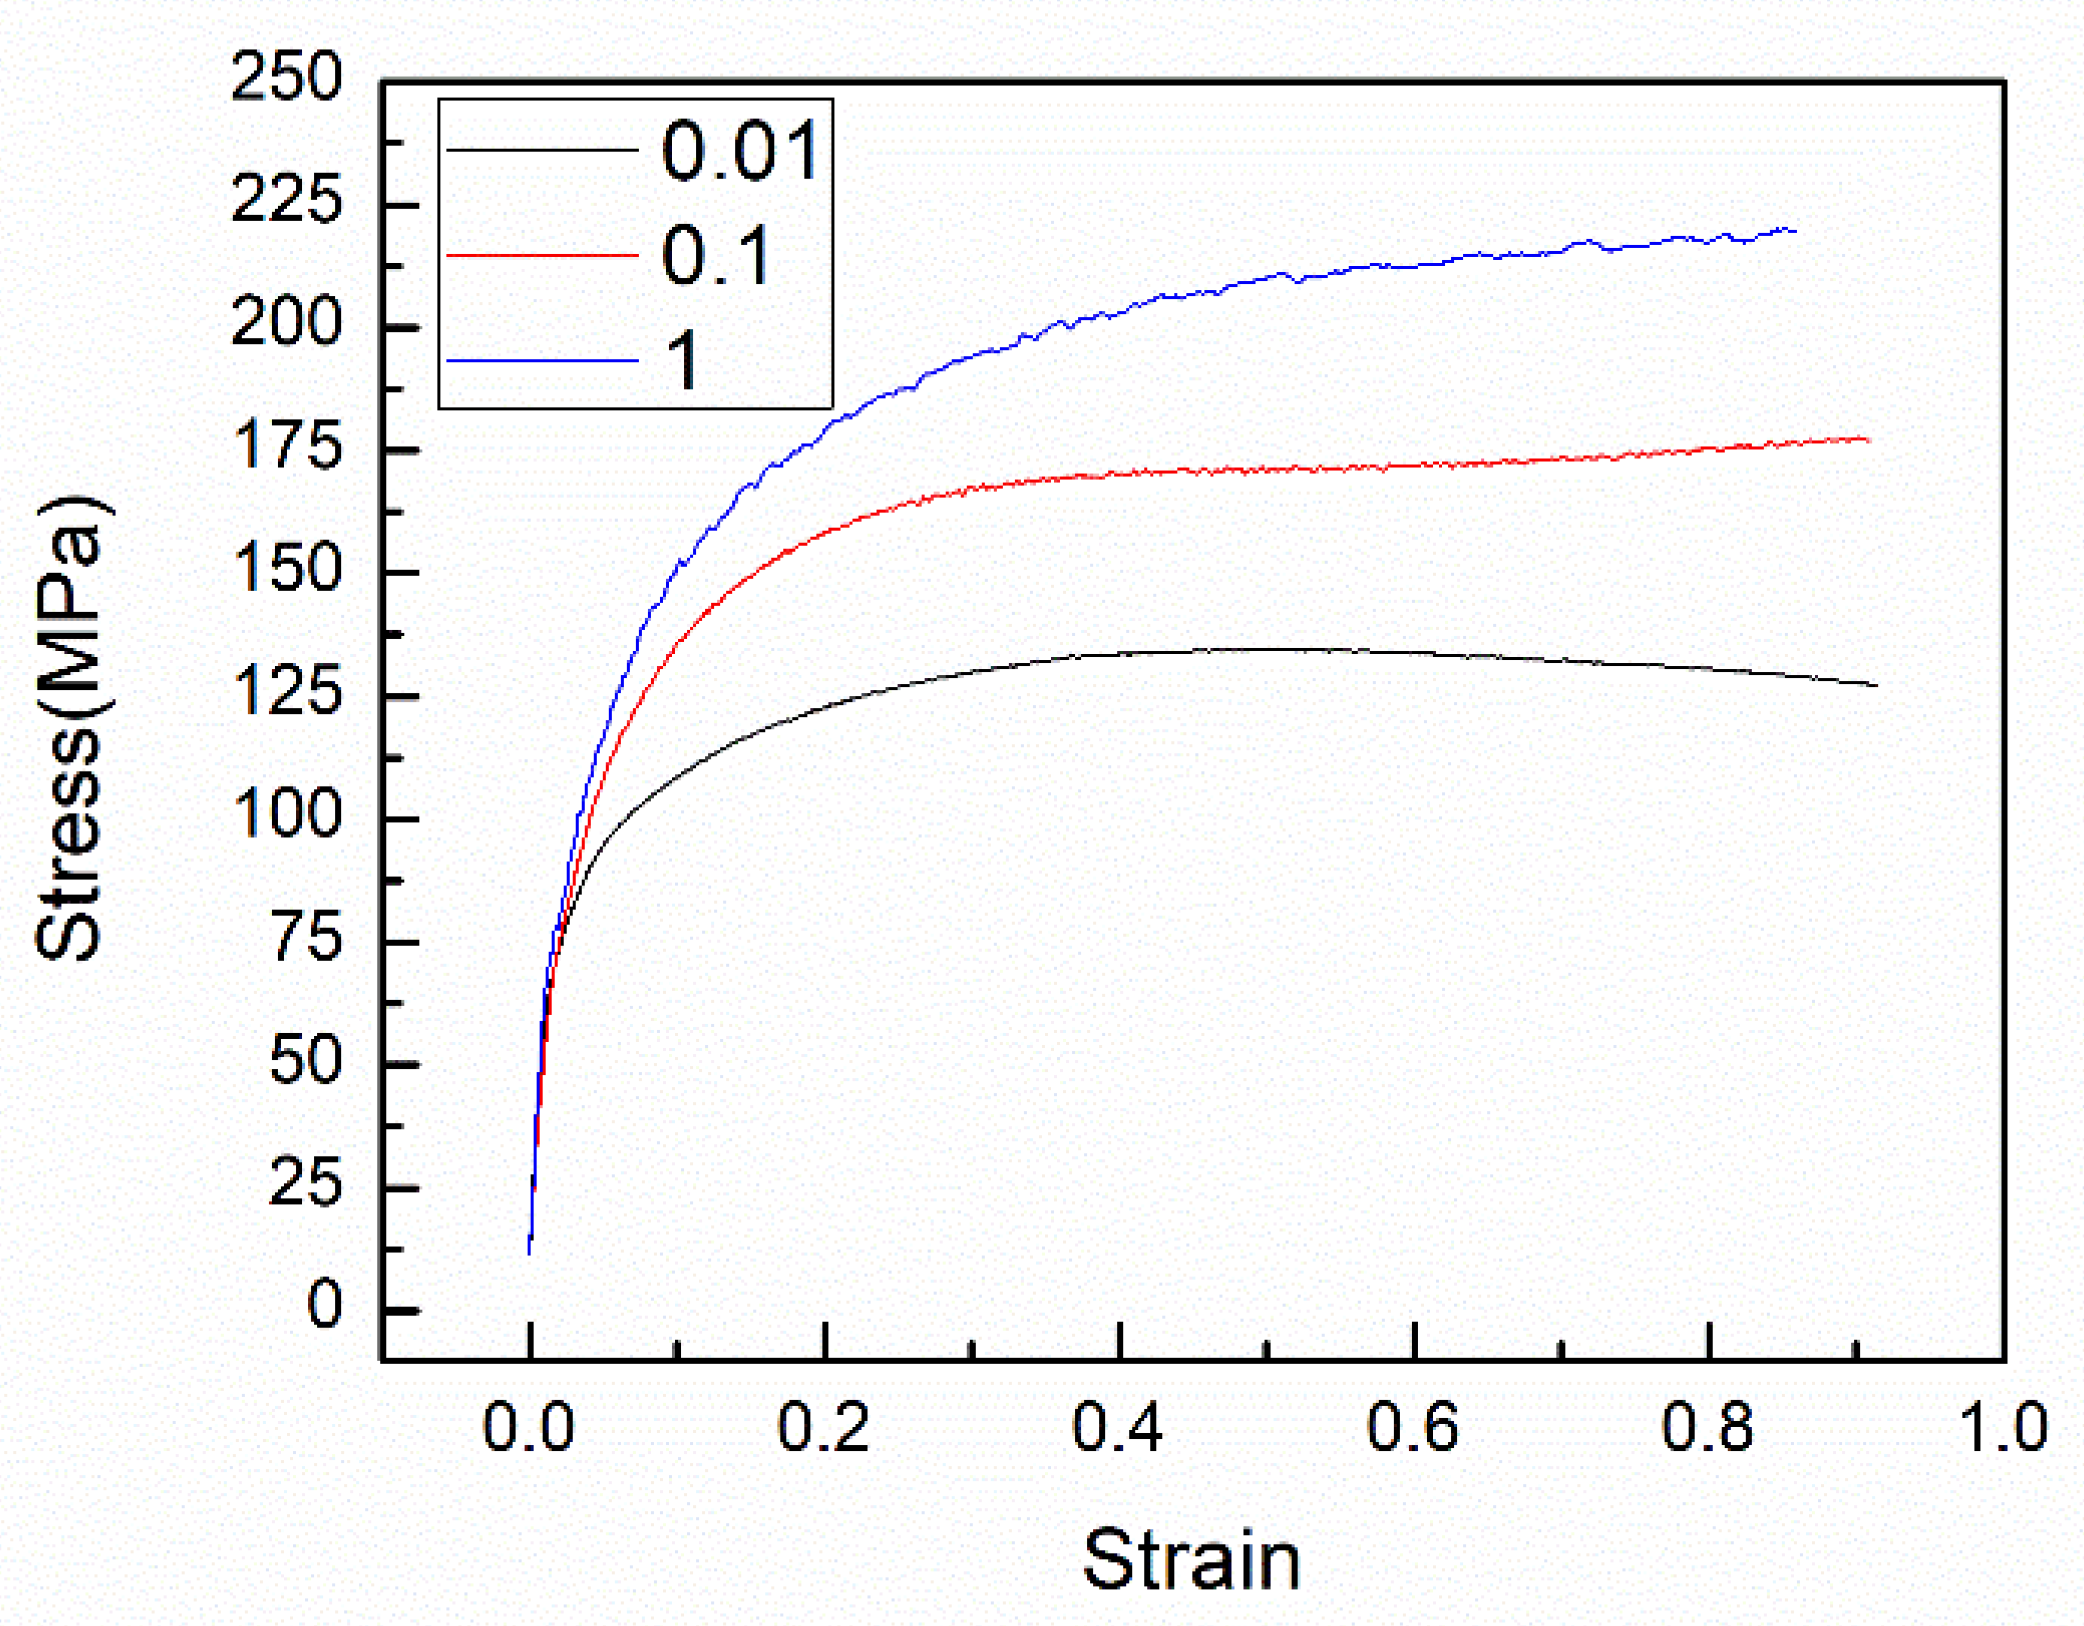
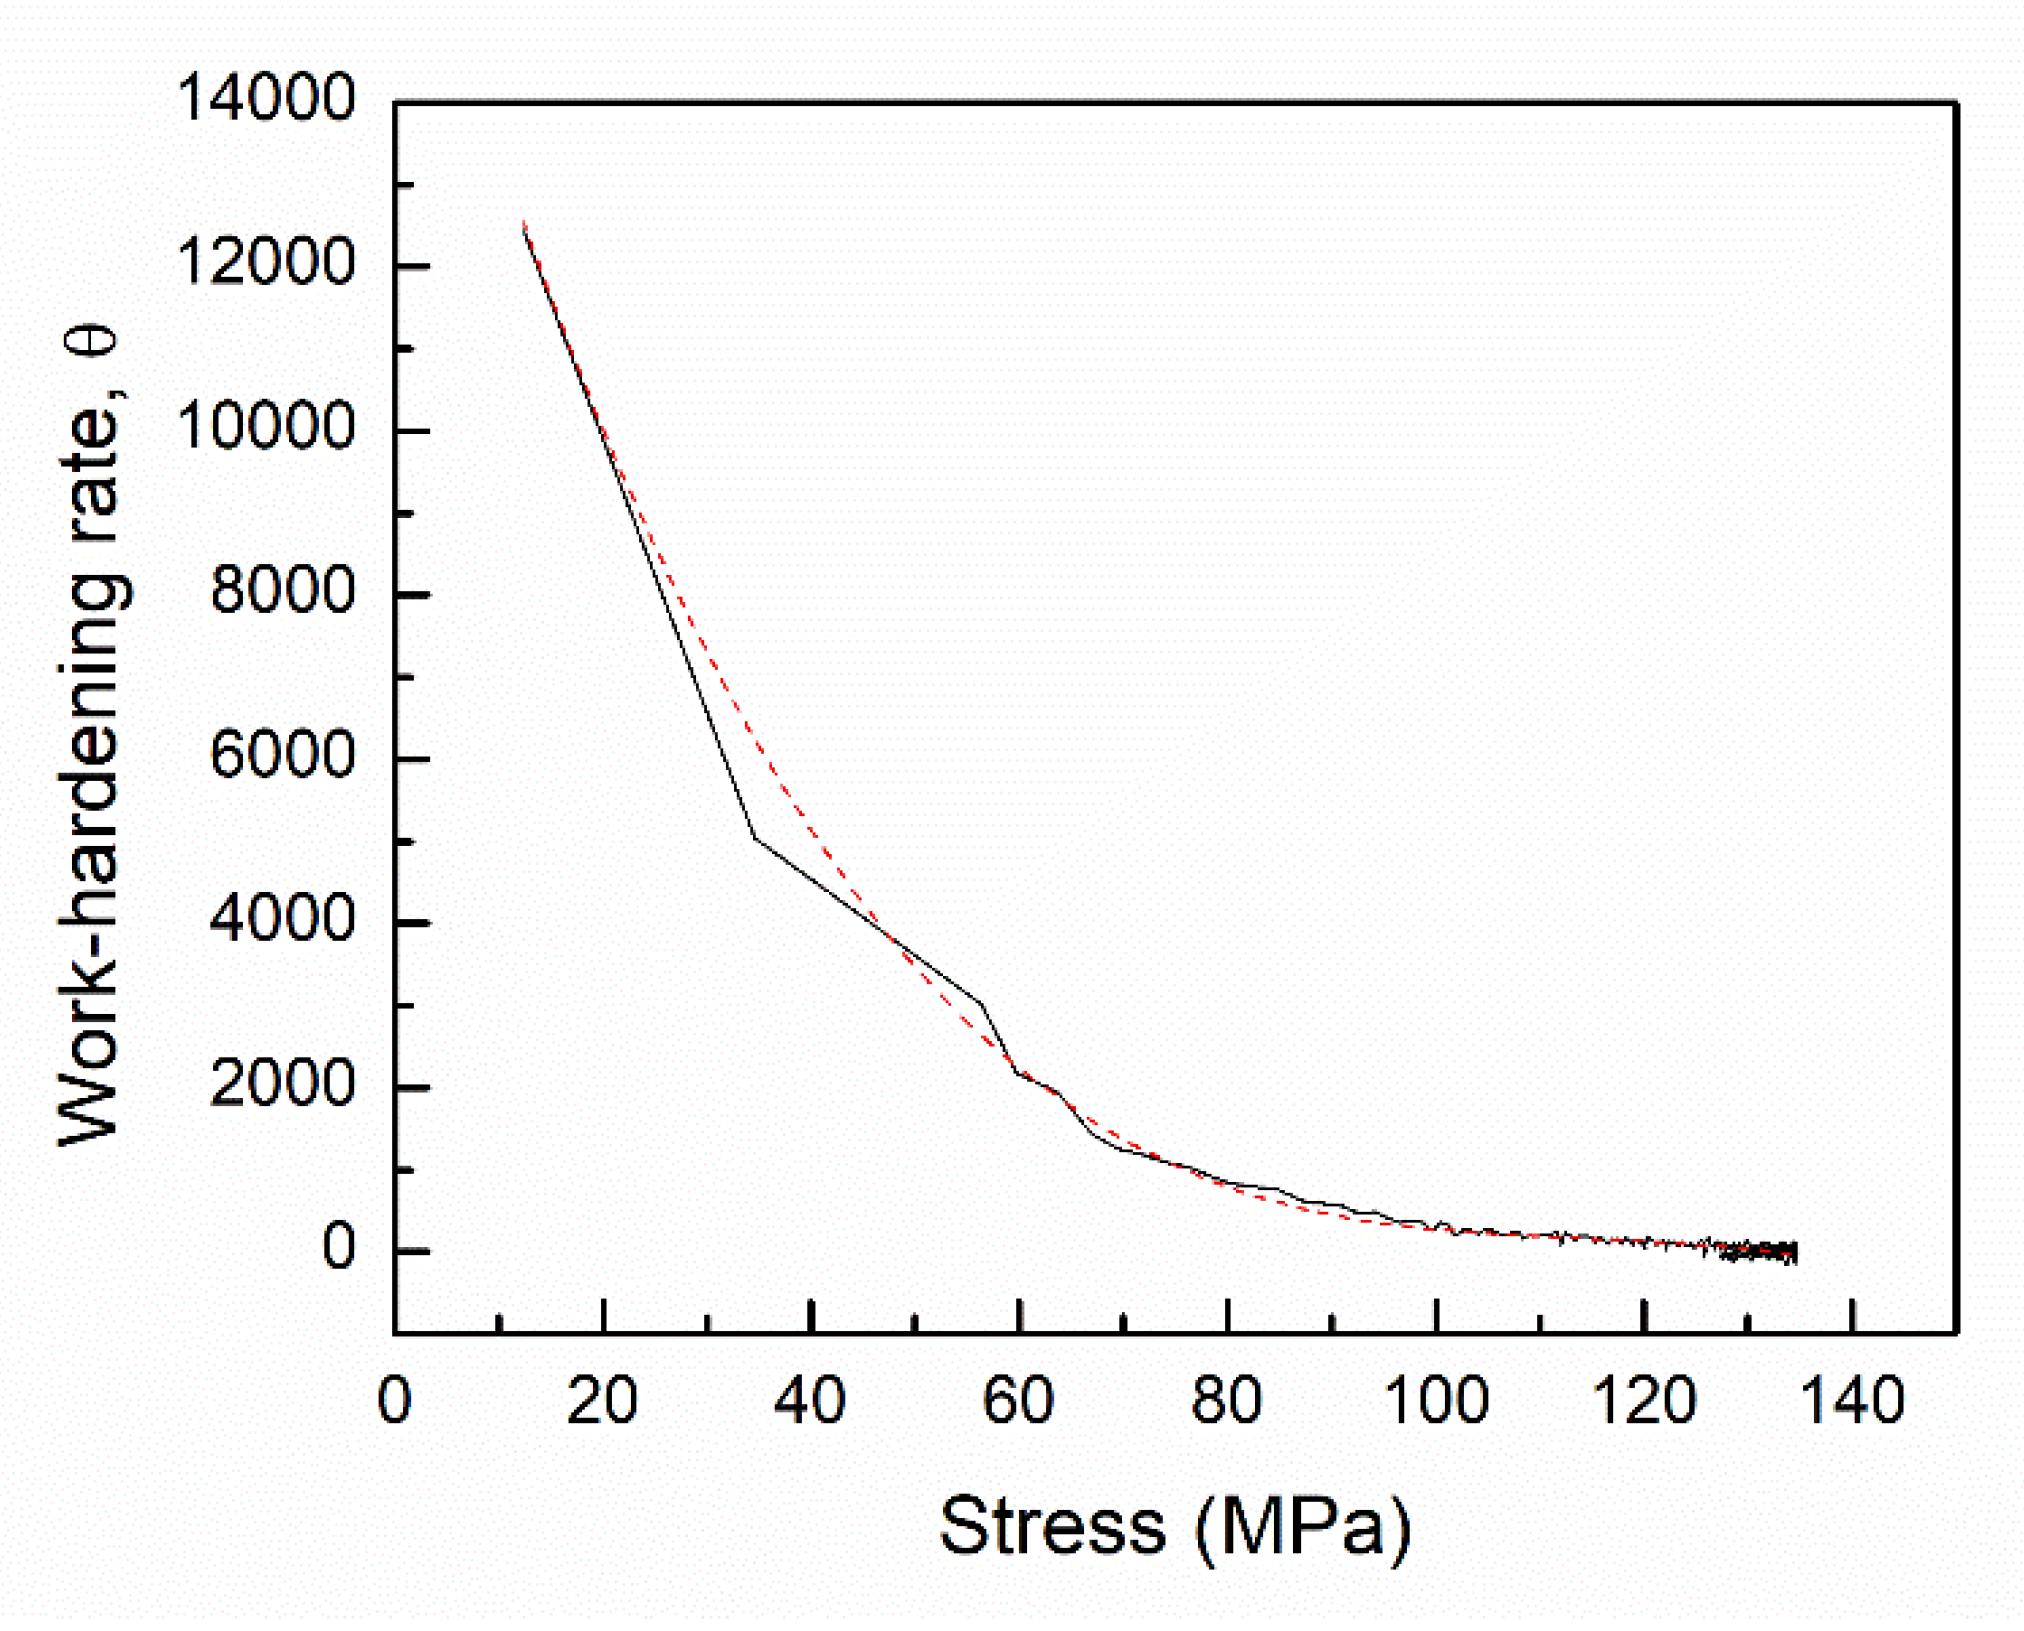
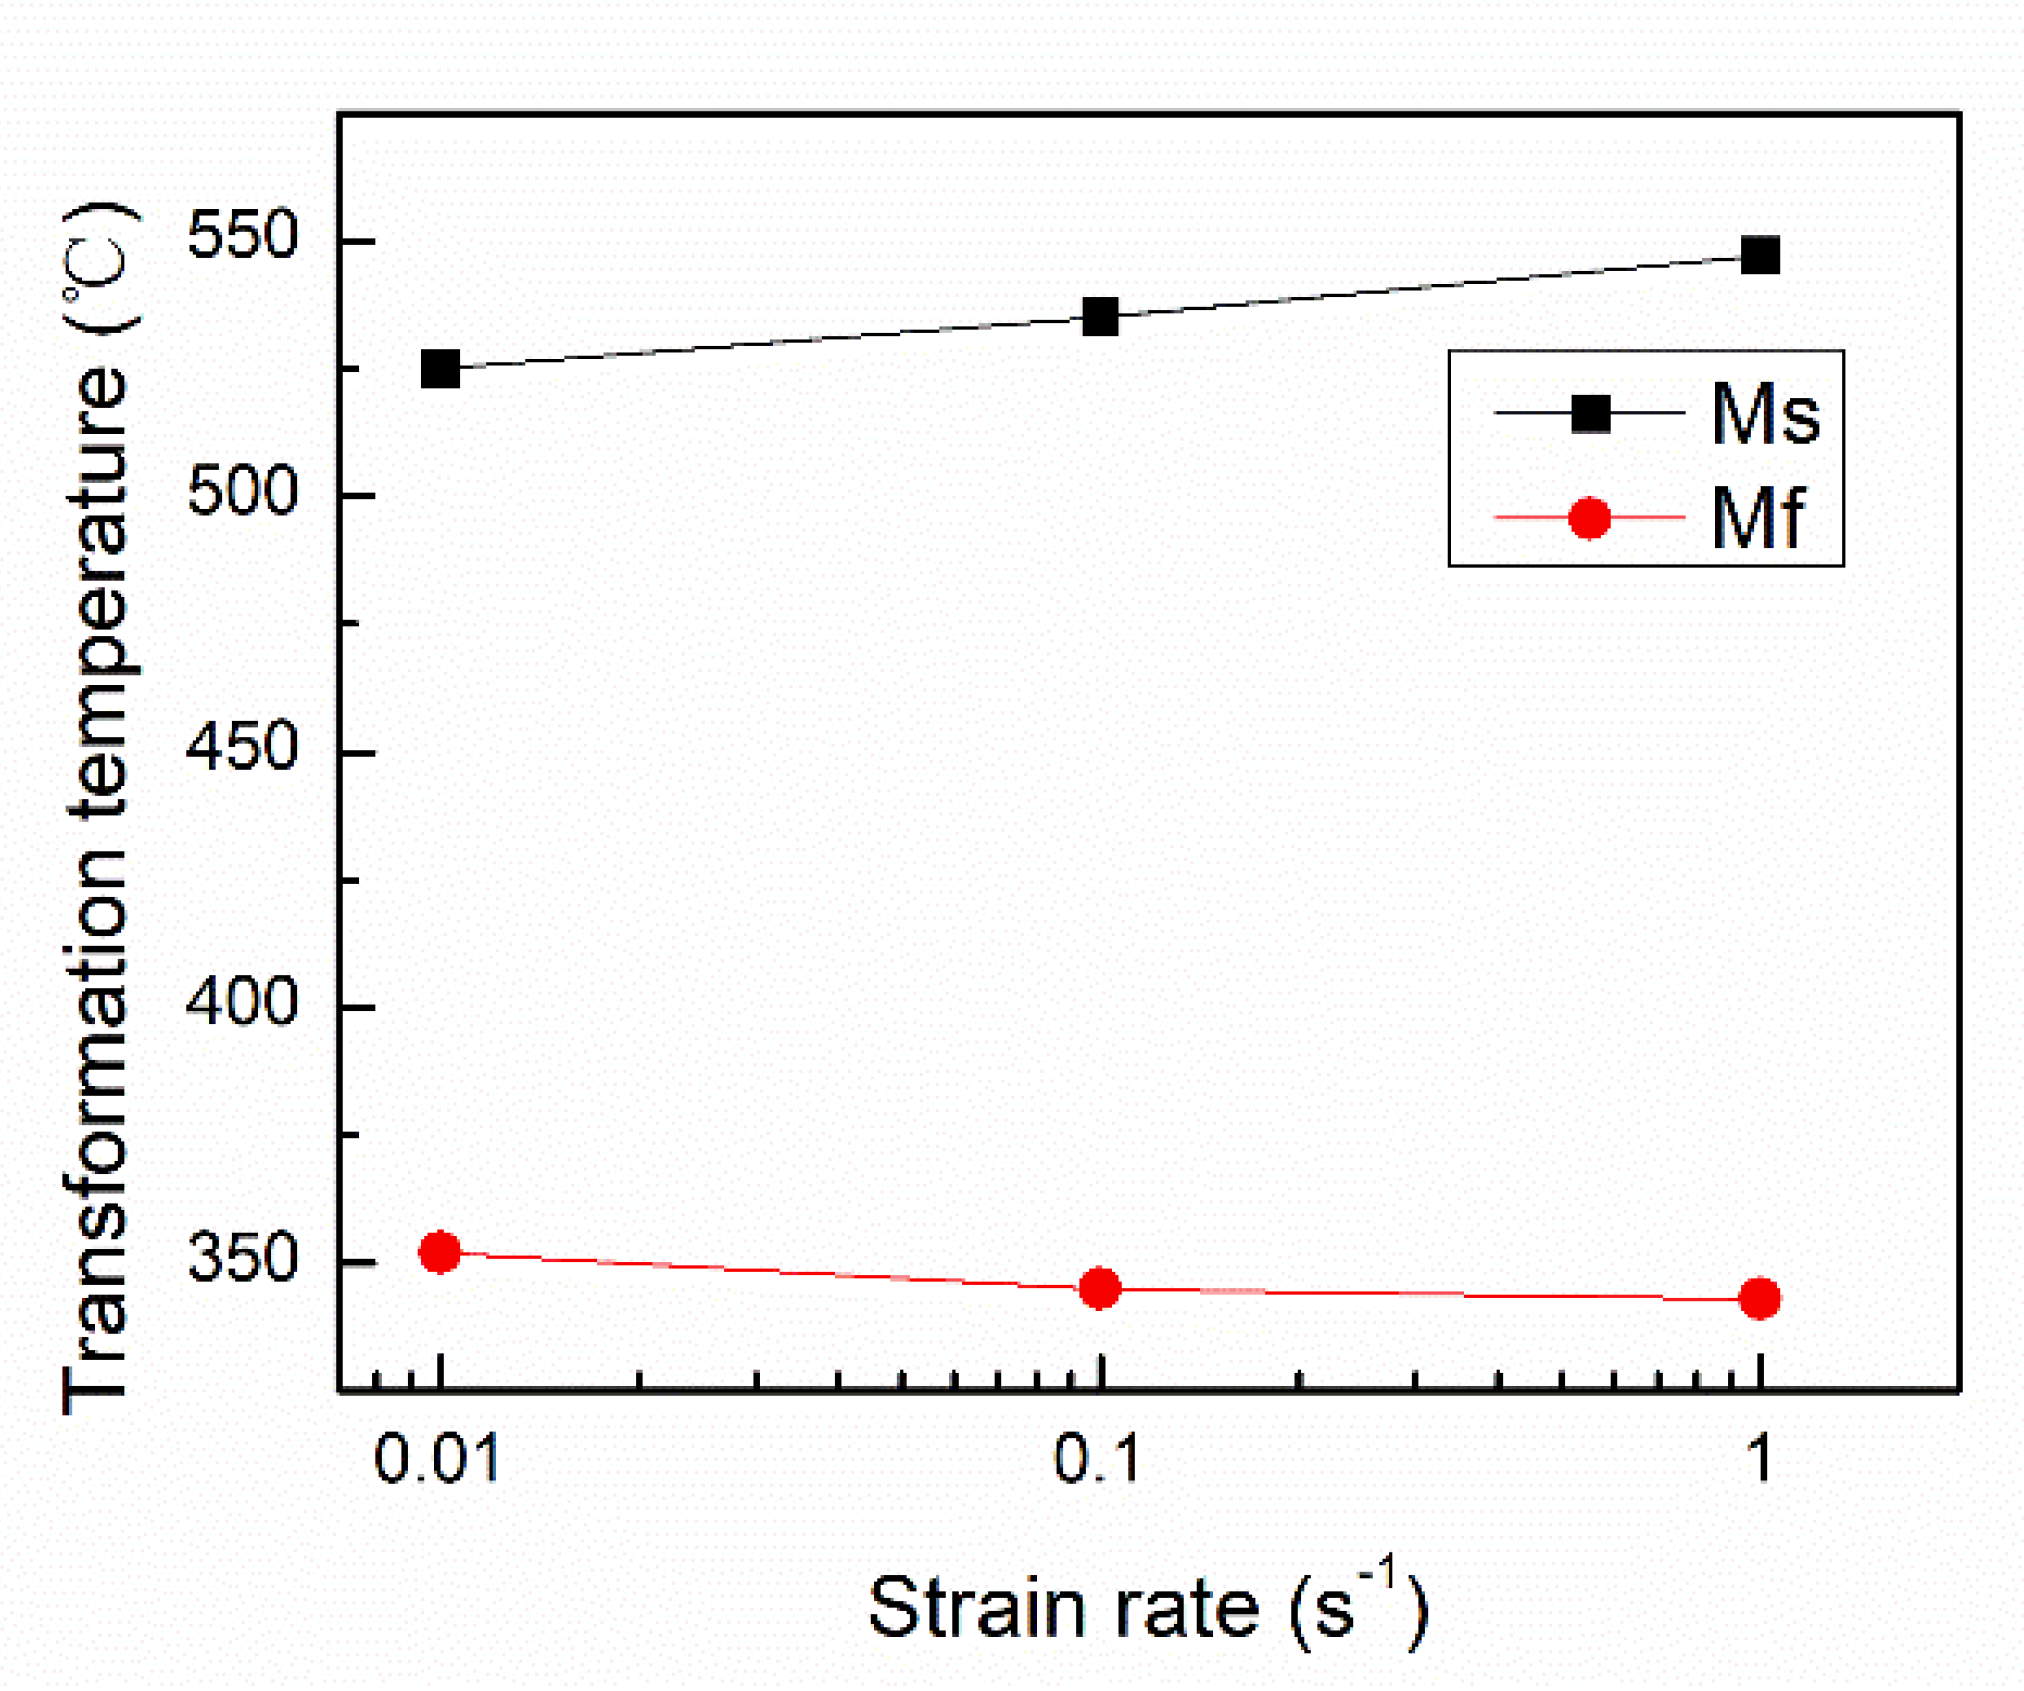
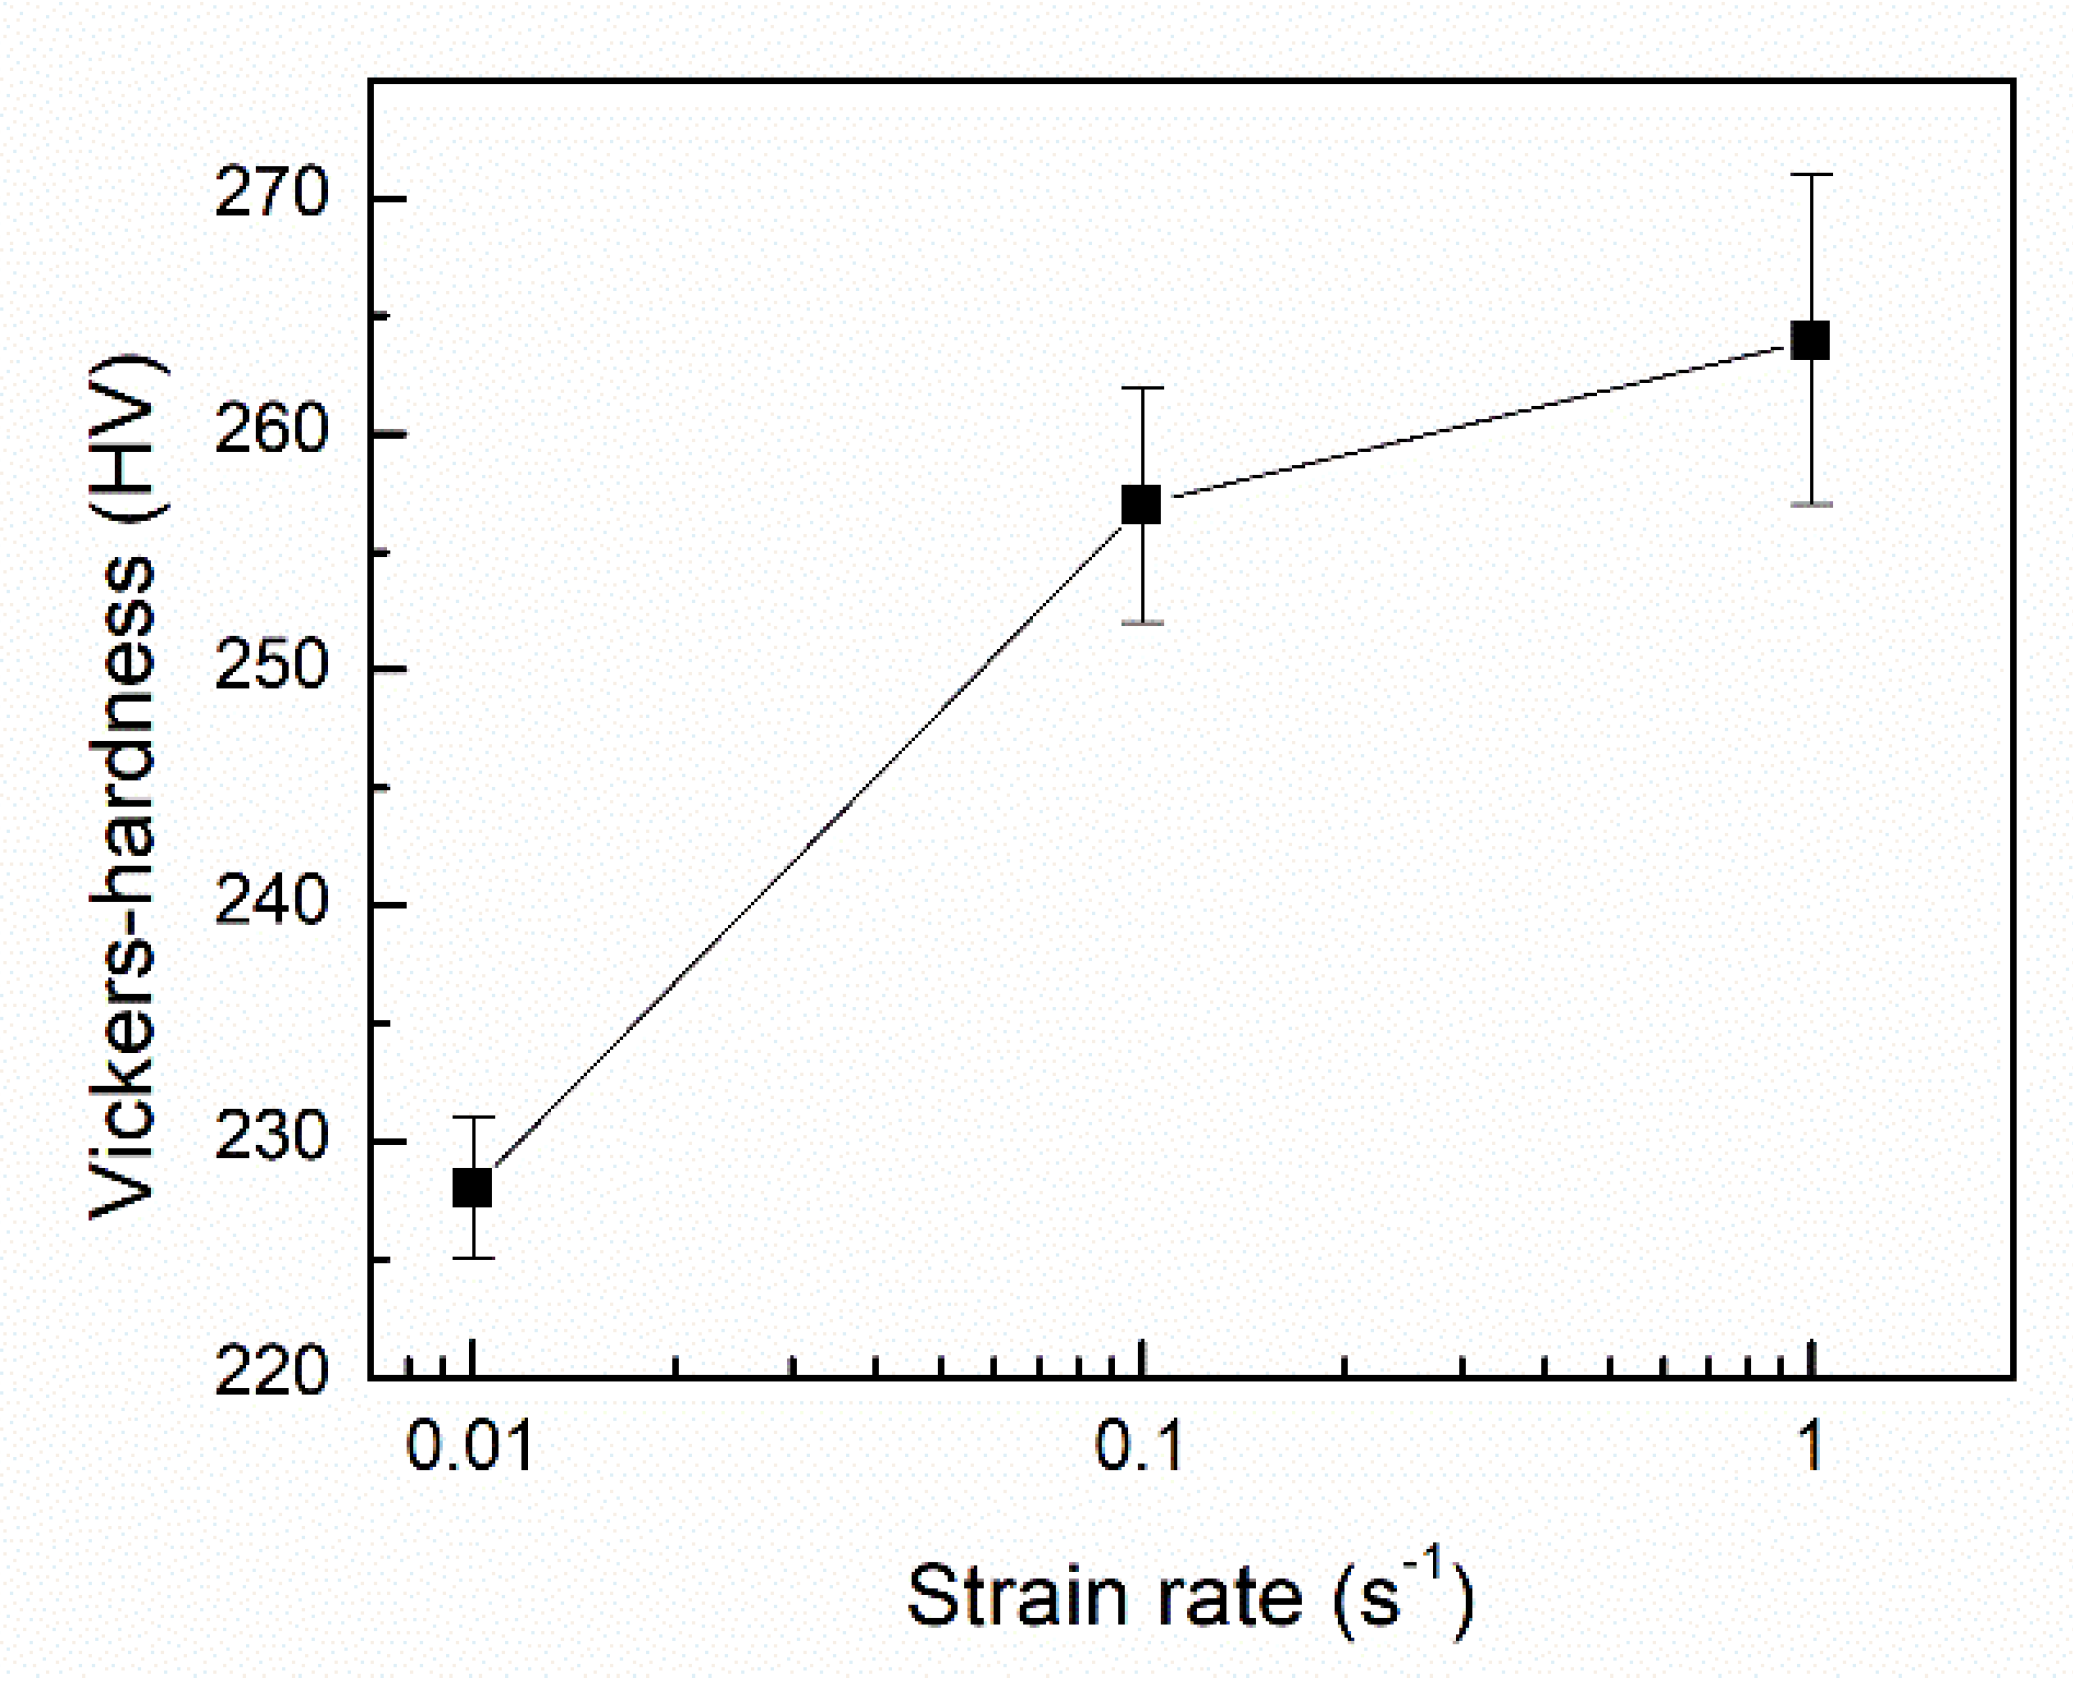
3.3. Effect of the Deformation Rate
4. Conclusions
Author Contributions
Funding
Conflicts of Interest
References
- Huh, M.Y.; Engler, O. Effect of intermediate annealing on texture, formability and ridging of 17%Cr ferritic stainless steel sheet. Mater. Sci. Eng. A 2001, 308, 74–87. [Google Scholar] [CrossRef]
- Yan, H.; Bi, H.; Li, X.; Xu, Z. Microstructure and texture of Nb + Ti stabilized ferritic stainless steel. Mater. Charact. 2008, 59, 1741–1746. [Google Scholar] [CrossRef]
- Seo, M.; Hultquist, G.; Leygraf, C.; Sato, N. The influence of minor alloying elements (Nb, Ti and Cu) on the corrosion resistivity of ferritic stainless steel in sulfuric acid solution. Corros. Sci. 1986, 26, 949–960. [Google Scholar] [CrossRef]
- Mohandas, T.; Reddy, G.M.; Naveed, M. A comparative evaluation of gas tungsten and shielded metal arc welds of a “ferritic” stainless steel. J. Mater. Process. Technol. 1999, 94, 133–140. [Google Scholar] [CrossRef]
- Wang, J.; Qian, S.; Li, Y.; Macdonald, D.D.; Jiang, Y.; Li, J. Passivity breakdown on 436 ferritic stainless steel in solutions containing chloride. J. Mater. Sci. Technol. 2019, 35, 637–643. [Google Scholar] [CrossRef]
- Song, C.; Guo, Y.; Li, K.; Sun, F.; Han, Q.; Zhai, Q. In Situ Observation of Phase Transformation and Structure Evolution of a 12 pct Cr Ferritic Stainless Steel. Metall. Mater. Trans. B 2012, 43, 1127–1137. [Google Scholar] [CrossRef]
- Shao, Y.; Liu, C.; Yue, T.; Liu, Y.; Yan, Z.; Li, H. Effects of Static Recrystallization and Precipitation on Mechanical Properties of 00Cr12 Ferritic Stainless Steel. Metall. Mater. Trans. B 2018, 49, 1560–1567. [Google Scholar] [CrossRef]
- Fujita, N.; Ohmura, K.; Yamamoto, A. Changes of microstructures and high temperature properties during high temperature service of Niobium added ferritic stainless steels. Mater. Sci. Eng. A 2003, 351, 272–281. [Google Scholar] [CrossRef]
- Hu, X.; Du, Y.; Yan, D.; Rong, L. Effect of Cu content on microstructure and properties of Fe-16Cr-2.5Mo damping alloy. J. Mater. Sci. Technol. 2018, 34, 774–781. [Google Scholar] [CrossRef]
- Maki, T. Stainless steel: Progress in thermomechanical treatment. Curr. Opin. Solid State Mater. Sci. 1997, 2, 290–295. [Google Scholar] [CrossRef]
- Sakai, T.; Belyakov, A.; Miura, H. Ultrafine Grain Formation in Ferritic Stainless Steel during Severe Plastic Deformation. Metall. Mater. Trans. A 2008, 39, 2206. [Google Scholar] [CrossRef]
- Dobatkin, S.V. Severe Plastic Deformation of Steels: Structure, Properties and Techniques. In Investigations and Applications of Severe Plastic Deformation; Lowe, T.C., Valiev, R.Z., Eds.; Springer: Dordrecht, The Netherlands, 2000; pp. 13–22. [Google Scholar]
- Belyakov, A.; Kaibyshev, R. Structural changes of ferritic stainless steel during severe plastic deformation. Nanostruct. Mater. 1995, 6, 893–896. [Google Scholar] [CrossRef]
- Liu, C.; Liu, Y.; Zhang, D.; Yan, Z. Kinetics of isochronal austenization in modified high Cr ferritic heat-resistant steel. Appl. Phys. A 2011, 105, 949–957. [Google Scholar] [CrossRef]
- van Warmelo, M.; Nolan, D.; Norrish, J. Mitigation of sensitisation effects in unstabilised 12%Cr ferritic stainless steel welds. Mater. Sci. Eng. A 2007, 464, 157–169. [Google Scholar] [CrossRef]
- Wu, Y.; Liu, Y.; Li, C.; Xia, X.; Wu, J.; Li, H. Coarsening behavior of γ’ precipitates in the γ’ + γ area of a Ni3Al-based alloy. J. Alloys Compd. 2019, 771, 526–533. [Google Scholar] [CrossRef]
- Liu, C.; Zhao, Q.; Liu, Y.; Wei, C.; Li, H. Microstructural evolution of high Cr ferrite/martensite steel after deformation in metastable austenite zone. Fusion Eng. Des. 2017, 125, 367–371. [Google Scholar] [CrossRef]
- Zheng, C.; Xiao, N.; Hao, L.; Li, D.; Li, Y. Numerical simulation of dynamic strain-induced austenite–ferrite transformation in a low carbon steel. Acta Mater. 2009, 57, 2956–2968. [Google Scholar] [CrossRef]
- Liu, Y.; Shao, Y.; Liu, C.; Chen, Y.; Zhang, D. Microstructure Evolution of HSLA Pipeline Steels after Hot Uniaxial Compression. Materials 2016, 9, 721. [Google Scholar] [CrossRef]
- Dong, J.; Li, C.; Liu, C.; Huang, Y.; Yu, L.; Li, H.; Liu, Y. Hot deformation behavior and microstructural evolution of Nb–V–Ti microalloyed ultra-high strength steel. J. Mater. Res. 2017, 32, 3777–3787. [Google Scholar] [CrossRef]
- Chen, J.; Liu, Y.; Liu, C.; Zhou, X.; Li, H. Study on microstructural evolution and constitutive modeling for hot deformation behavior of a low-carbon RAFM steel. J. Mater. Res. 2017, 32, 1376–1385. [Google Scholar] [CrossRef]
- Zhou, Y.; Liu, Y.; Zhou, X.; Liu, C.; Yu, L.; Li, C.; Ning, B. Processing maps and microstructural evolution of the type 347H austenitic heat-resistant stainless steel. J. Mater. Res. 2015, 30, 2090–2100. [Google Scholar] [CrossRef]
- Mao, C.; Liu, C.; Yu, L.; Li, H.; Liu, Y. The correlation among microstructural parameter and dynamic strain aging (DSA) in influencing the mechanical properties of a reduced activated ferritic-martensitic (RAFM) steel. Mater. Sci. Eng. A 2019, 739, 90–98. [Google Scholar] [CrossRef]
- Tamura, I. Deformation-induced martensitic transformation and transformation-induced plasticity in steels. Met. Sci. 1982, 16, 245–253. [Google Scholar] [CrossRef]
- Jonas, J.J.; Quelennec, X.; Jiang, L.; Martin, É. The Avrami kinetics of dynamic recrystallization. Acta Mater. 2009, 57, 2748–2756. [Google Scholar] [CrossRef]
- Najafizadeh, A.; Jonas, J.J. Predicting the Critical Stress for Initiation of Dynamic Recrystallization. ISIJ Int. 2006, 46, 1679–1684. [Google Scholar] [CrossRef]


| C | Cr | Si | Ni | Mn | Nb | Ti | Fe |
|---|---|---|---|---|---|---|---|
| 0.01 | 11.54 | 0.2 | 0.57 | 1.12 | 0.09 | 0.12 | Bal. |
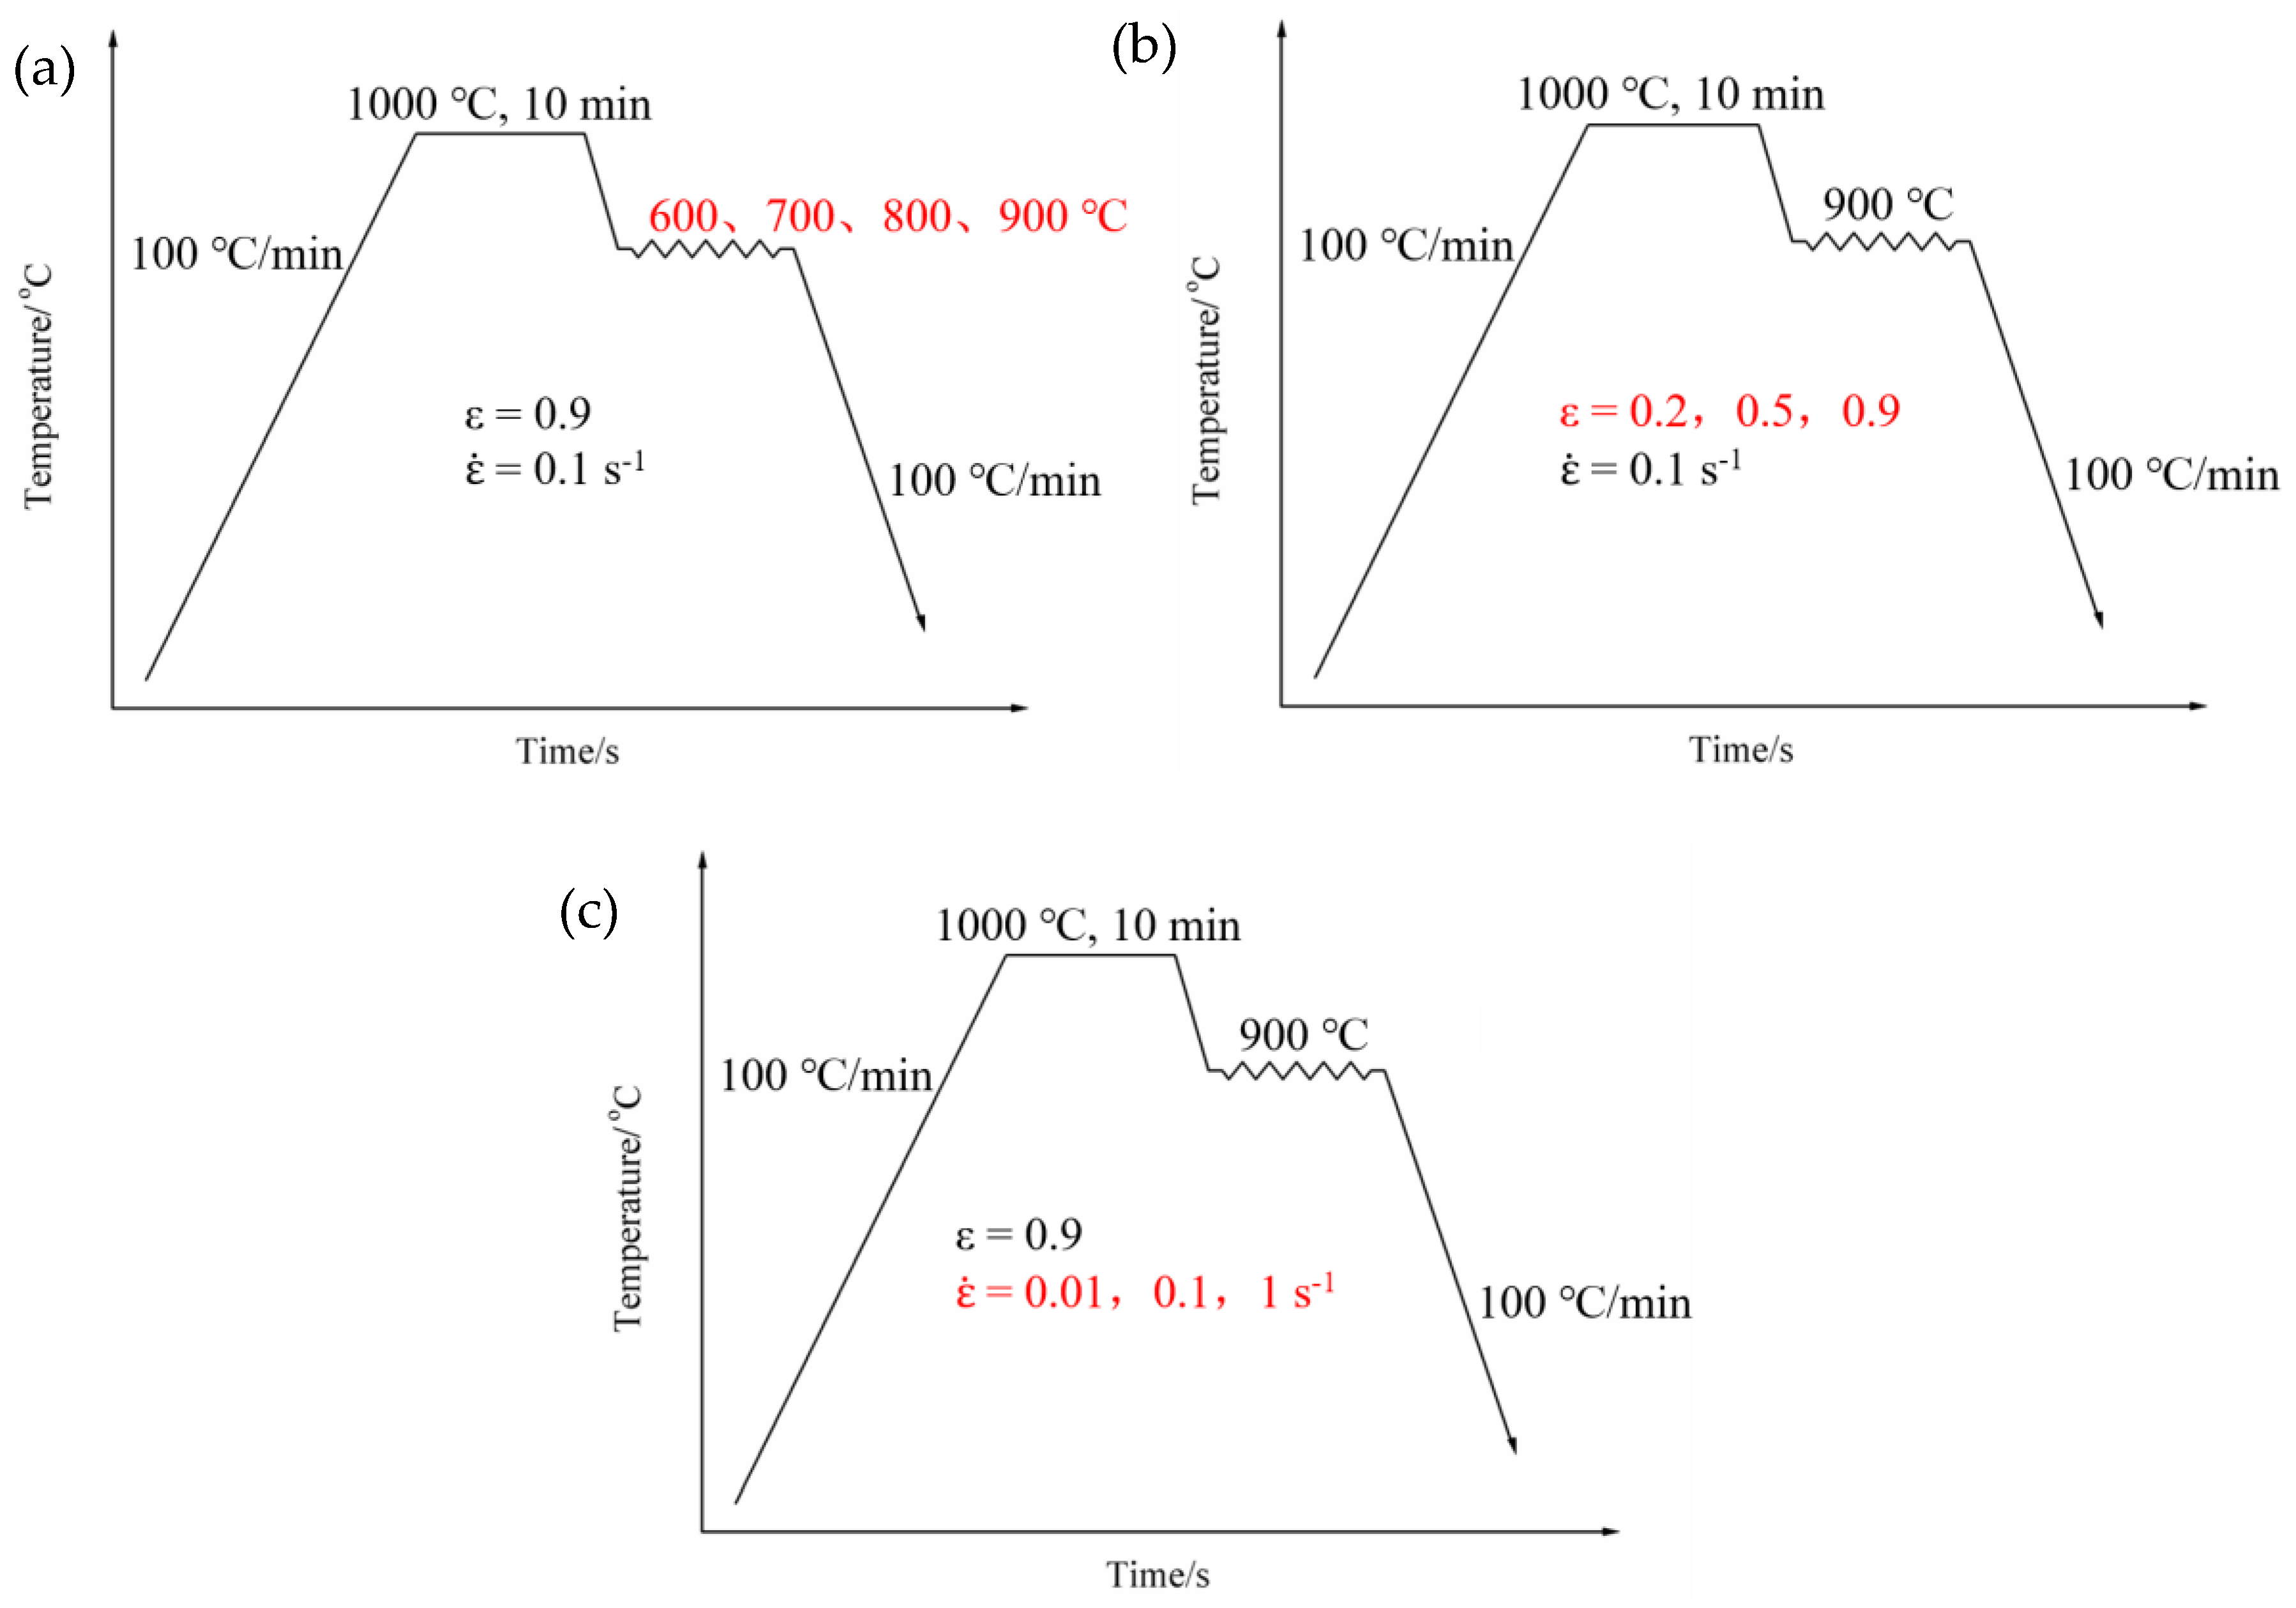
| Experimental Conditions | Deformation Temperature/°C | Deformation Reduction | Deformation Rate/s−1 |
|---|---|---|---|
| For the different deformation temperatures | 600, 700, 800, 900 | 0.9 | 0.1 |
| For the different deformation reductions | 900 | 0.2, 0.5, 0.9 | 0.1 |
| For the different deformation rates | 900 | 0.9 | 0.01, 0.1, 1 |
© 2019 by the authors. Licensee MDPI, Basel, Switzerland. This article is an open access article distributed under the terms and conditions of the Creative Commons Attribution (CC BY) license (http://creativecommons.org/licenses/by/4.0/).
Share and Cite
Shao, Y.; Li, X.; Ma, J.; Liu, C.; Yan, Z. Microstructure Formation of Low-Carbon Ferritic Stainless Steel during High Temperature Plastic Deformation. Metals 2019, 9, 463. https://doi.org/10.3390/met9040463
Shao Y, Li X, Ma J, Liu C, Yan Z. Microstructure Formation of Low-Carbon Ferritic Stainless Steel during High Temperature Plastic Deformation. Metals. 2019; 9(4):463. https://doi.org/10.3390/met9040463
Chicago/Turabian StyleShao, Yi, Xiaohua Li, Junjie Ma, Chenxi Liu, and Zesheng Yan. 2019. "Microstructure Formation of Low-Carbon Ferritic Stainless Steel during High Temperature Plastic Deformation" Metals 9, no. 4: 463. https://doi.org/10.3390/met9040463
APA StyleShao, Y., Li, X., Ma, J., Liu, C., & Yan, Z. (2019). Microstructure Formation of Low-Carbon Ferritic Stainless Steel during High Temperature Plastic Deformation. Metals, 9(4), 463. https://doi.org/10.3390/met9040463