Article

Dynamic Phase Transformation Behavior of a Nb-microalloyed Steel during Roughing Passes at Temperatures above the Ae3

1
Department of Materials Engineering, Federal Institute of Maranhao, Sao Luis 65075-441, Maranhao, Brazil
2
Département de Génie Mécanique, École de Technologie Supérieure, Montreal, QC H3C 1K3, Canada
3
Materials Engineering, McGill University, Montreal, QC H3A 0C5, Canada
4
Dynamic Systems Inc. 323 NY 355, Poestenkill, NY 12140, USA
5
Mechanical Engineering, University of New Brunswick, Fredericton, NB E3B 5A3, Canada
*
Author to whom correspondence should be addressed.
Metals 2019, 9(3), 334; https://doi.org/10.3390/met9030334
Submission received: 16 February 2019 / Revised: 8 March 2019 / Accepted: 12 March 2019 / Published: 15 March 2019
(This article belongs to the Special Issue Advances in Low-carbon and Stainless Steels)

Abstract

:
A five-pass torsion simulation of the roughing passes applied during hot plate rolling was performed in the single-phase austenite region of a Nb-microalloyed steel under continuous cooling conditions. The deformation temperatures were approximately half-way between the Ae3 and the delta ferrite formation temperature (i.e., 250 °C above the Ae3) in which the free energy difference of austenite and ferrite is at maximum. The microstructures in-between passes were analyzed to characterize and quantify the occurrence of deformation-induced dynamic phase transformation. It was observed that about 7% of austenite transforms into ferrite right after the final pass. The results are consistent with the calculated critical strains and driving forces which indicate that dynamic transformation (DT) can take place at any temperature above the Ae3. This mechanism occurs even with the presence of high Nb in the material, which is known to retard and hinder the occurrence of DT by means of pinning and solute drag effects. The calculated cooling rate during quenching and the time–temperature–transformation curves of the present material further verified the existence of dynamically transformed ferrite.

1. Introduction

The thermomechanical processing of steels is carried out primarily within the austenite phase field. Previous work has shown that hot rolling produces partial phase transformation of austenite into ferrite in the roll bite inside the single austenite phase field [1,2]. This has been referred to as dynamic transformation (DT) and was first investigated by Yada and co-workers in the 1980’s [3,4]. In their study, fine grains of ferrite were produced when three plain carbon were strained during compression testing above the Ae3 temperature.
In order to provide real-time evidence for the occurrence of DT, Yada and co-workers returned to its study in early 2000s. They used the in-situ X-ray diffraction technique coupled to a torsion machine and deformed three Fe-C alloys above the Ae3 temperature [5]. They captured the diffraction patterns associated with α-ferrite during deformation. Chen and Chen [6] performed experiments in 2003 by using a laser dilatometry technique and observed the reverse transformation of dynamically transformed ferrite into austenite at temperatures above the Ae3. Liu et al. [7] performed tests in a Gleeble thermomechanical simulator in 2007 on a low-carbon steel and obtained similar metallographic results. In 2008, Sun et al. also employed a laser dilatometer in order to follow the reverse DT both below and above the Ae3 [8]. The former authors deformed a 0.17% C plain carbon steel using a Gleeble thermomechanical simulator above the Ae3. They confirmed the existence of both the forward and reverse transformation at temperatures up to 115 °C above the Ae3.
In 2010, Basabe and Jonas [9] conducted torsion tests on a 0.036% Nb microalloyed steel in order to study the effects of strain, strain rate, and temperature on DT. They concluded that the reverse transformation was retarded by the addition of niobium in comparison with a plain C steel. This phenomenon was a result of dislocation pinning and solute drag of the niobium carbonitride precipitates and Nb in solution, respectively.
In 2013, Ghosh et al. [10], showed that DT ferrite can be formed as high as 130 °C above the Ae3. In their work, they allowed for the inhomogeneous distribution of dislocations, leading to driving forces for ferrite formation as high as 197 J/mol when their materials were submitted to large strains. In 2015, Aranas et al. [1,11,12], presented a new approach involving thermodynamic features to explain the occurrence of DT as much as 500 °C above the Ae3. The driving force for DT was redefined to consist only of the softening that takes place during transformation due to the applied stress. The free energy barrier against the driving force for DT consists of the Gibbs free energy difference between the phases as well as the lattice dilatation work and shear accommodation work. According to this model, DT takes place when the driving force overcomes the total barrier preventing its formation.
More recently, Rodrigues et al. [13,14,15], investigated the phenomenon of DT under various industrial plate rolling simulation conditions. They found that the application of roughing passes under isothermal conditions can lead to the presence of around 8% of transformed ferrite after deformation. The occurrence of DT above the Ae3 temperature during thermomechanical processing is known to generate lower rolling loads and mean flow stresses (MFS) [16]. Moreover, the volume flow rate (as the bar passes through a rolling mill) increases due to formation of less dense ferrite. This type of transformation involves carbon partitioning, which can generate undesirable volume fractions of martensite. Thus, an accurate account of phases during high temperature deformation leads to better mechanical properties of the material.
Nevertheless, the phenomenon of DT has not been studied under the cooling stage of roughing rolling simulation, which represents more realistic industrial conditions. Thus, the present study represents an advance over the previous investigations in that the DT behavior of a Nb-microalloyed steel is investigated under continuous cooling condition of 2 °C/s, comparable to industrial roughing rolling schedules. The results obtained are described and discussed in following sections.

2. Materials and Methods

A Nb-microalloyed steel was investigated in the present work. This material was provided by EVRAZ North America in the form of hot-rolled plates. The complete chemical composition of the material (in wt%) is displayed in Table 1. The orthoequilibrium and paraequilibrium Ae3 temperatures were identified by employing the FSstel database of the FactSage thermodynamic software 7.1 [17]. For the present analysis, the orthoequilibrium Ae3 temperature will be considered, where both the substitutional and interstitial atoms are assumed to participate during phase transformation. The hot-rolled plates were machined into torsion samples with diameters and gauge lengths of 10 mm and 20 mm, respectively. The cylindrical axis of all the samples were parallel to the rolling direction of the plate. The torsion experiments were carried out using a Gleeble 3800 thermomechanical simulator (Dynamic Systems Inc. Poestenkill, NY, USA) with a Hot Torsion Mobile Conversion Unit (MCU). The samples were heated by flowing alternated current to the desired reheat temperature. This ensured that each deformation occurred at the proper temperature simulated by that rotation step. Thermal gradients in the sample were controlled by making the specimen solid in the torsion span and hollow on both sides to minimize gradients in the sample that would otherwise develop due to non-uniform current densities in the shoulders versus the reduced center section of the sample. A thermocouple was welded to the sample to accurately track the deformation temperatures at every pass.
The thermomechanical schedule of the present work is shown in Figure 1. The torsion samples were heated to 1200 °C at a rate of 1 °C/s and were isothermally held for 5 min to attain a single-phase austenite microstructure. The samples were then cooled to 1100 °C at a rate of 1 °C/s. The first deformation was applied after 60 s at 1100 °C, followed by controlled cooling at a rate of approximately 2 °C/s. The succeeding deformations (from 2nd pass up to the 5th pass) were applied during continuous cooling conditions with an interpass time of 10 s, mimicking the actual plate rolling process. The deformation temperatures were 1080 °C (2nd), 1060 °C (3rd), 1040 °C (4th), and 1020 °C (5th). Note that the samples were strained to 0.3 during each pass applied at a strain rate of 1 s−1. A strain higher than the critical stains for the onset of DT [9,10,11,12,13,14,15] was selected so as to allow for DT to take place. Water spray quenching after R1, R3, and R5 were performed at minimum rate of 500 °C/s using the Gleeble high flow quenching system. All experiments were performed under argon atmosphere to minimize the oxidation and decarburization, which can affect the results. Additionally, the experiments were repeated three times to validate the results. In general, less than 3% difference in the level flow curves was observed.
The deformed samples were water quenched before the 1st pass, and after 1st, 3rd, and 5th pass to accurately track the evolution of microstructure during multi-pass rolling simulation. The deformed and quenched torsion samples were sectioned longitudinally to reveal the changes in grain shape that accompany straining for microscopy analysis. These analyses were carried out at about 150 µm below the surface of the samples so as to avoid the oxidized outer layer. A conductive hot phenolic resin was used to mount the samples. These were polished using SiC grits 400, 600, 800, and 1200 lubricated with water. The final polishing was carried out using 3 and 1 µm diamond suspensions. The polished surfaces were etched with 2% nital (to reveal the microstructure) followed by 10% aqueous metabisulfite (Na2S2O5) solution (to provide contrast between ferrite and martensite).

3. Results

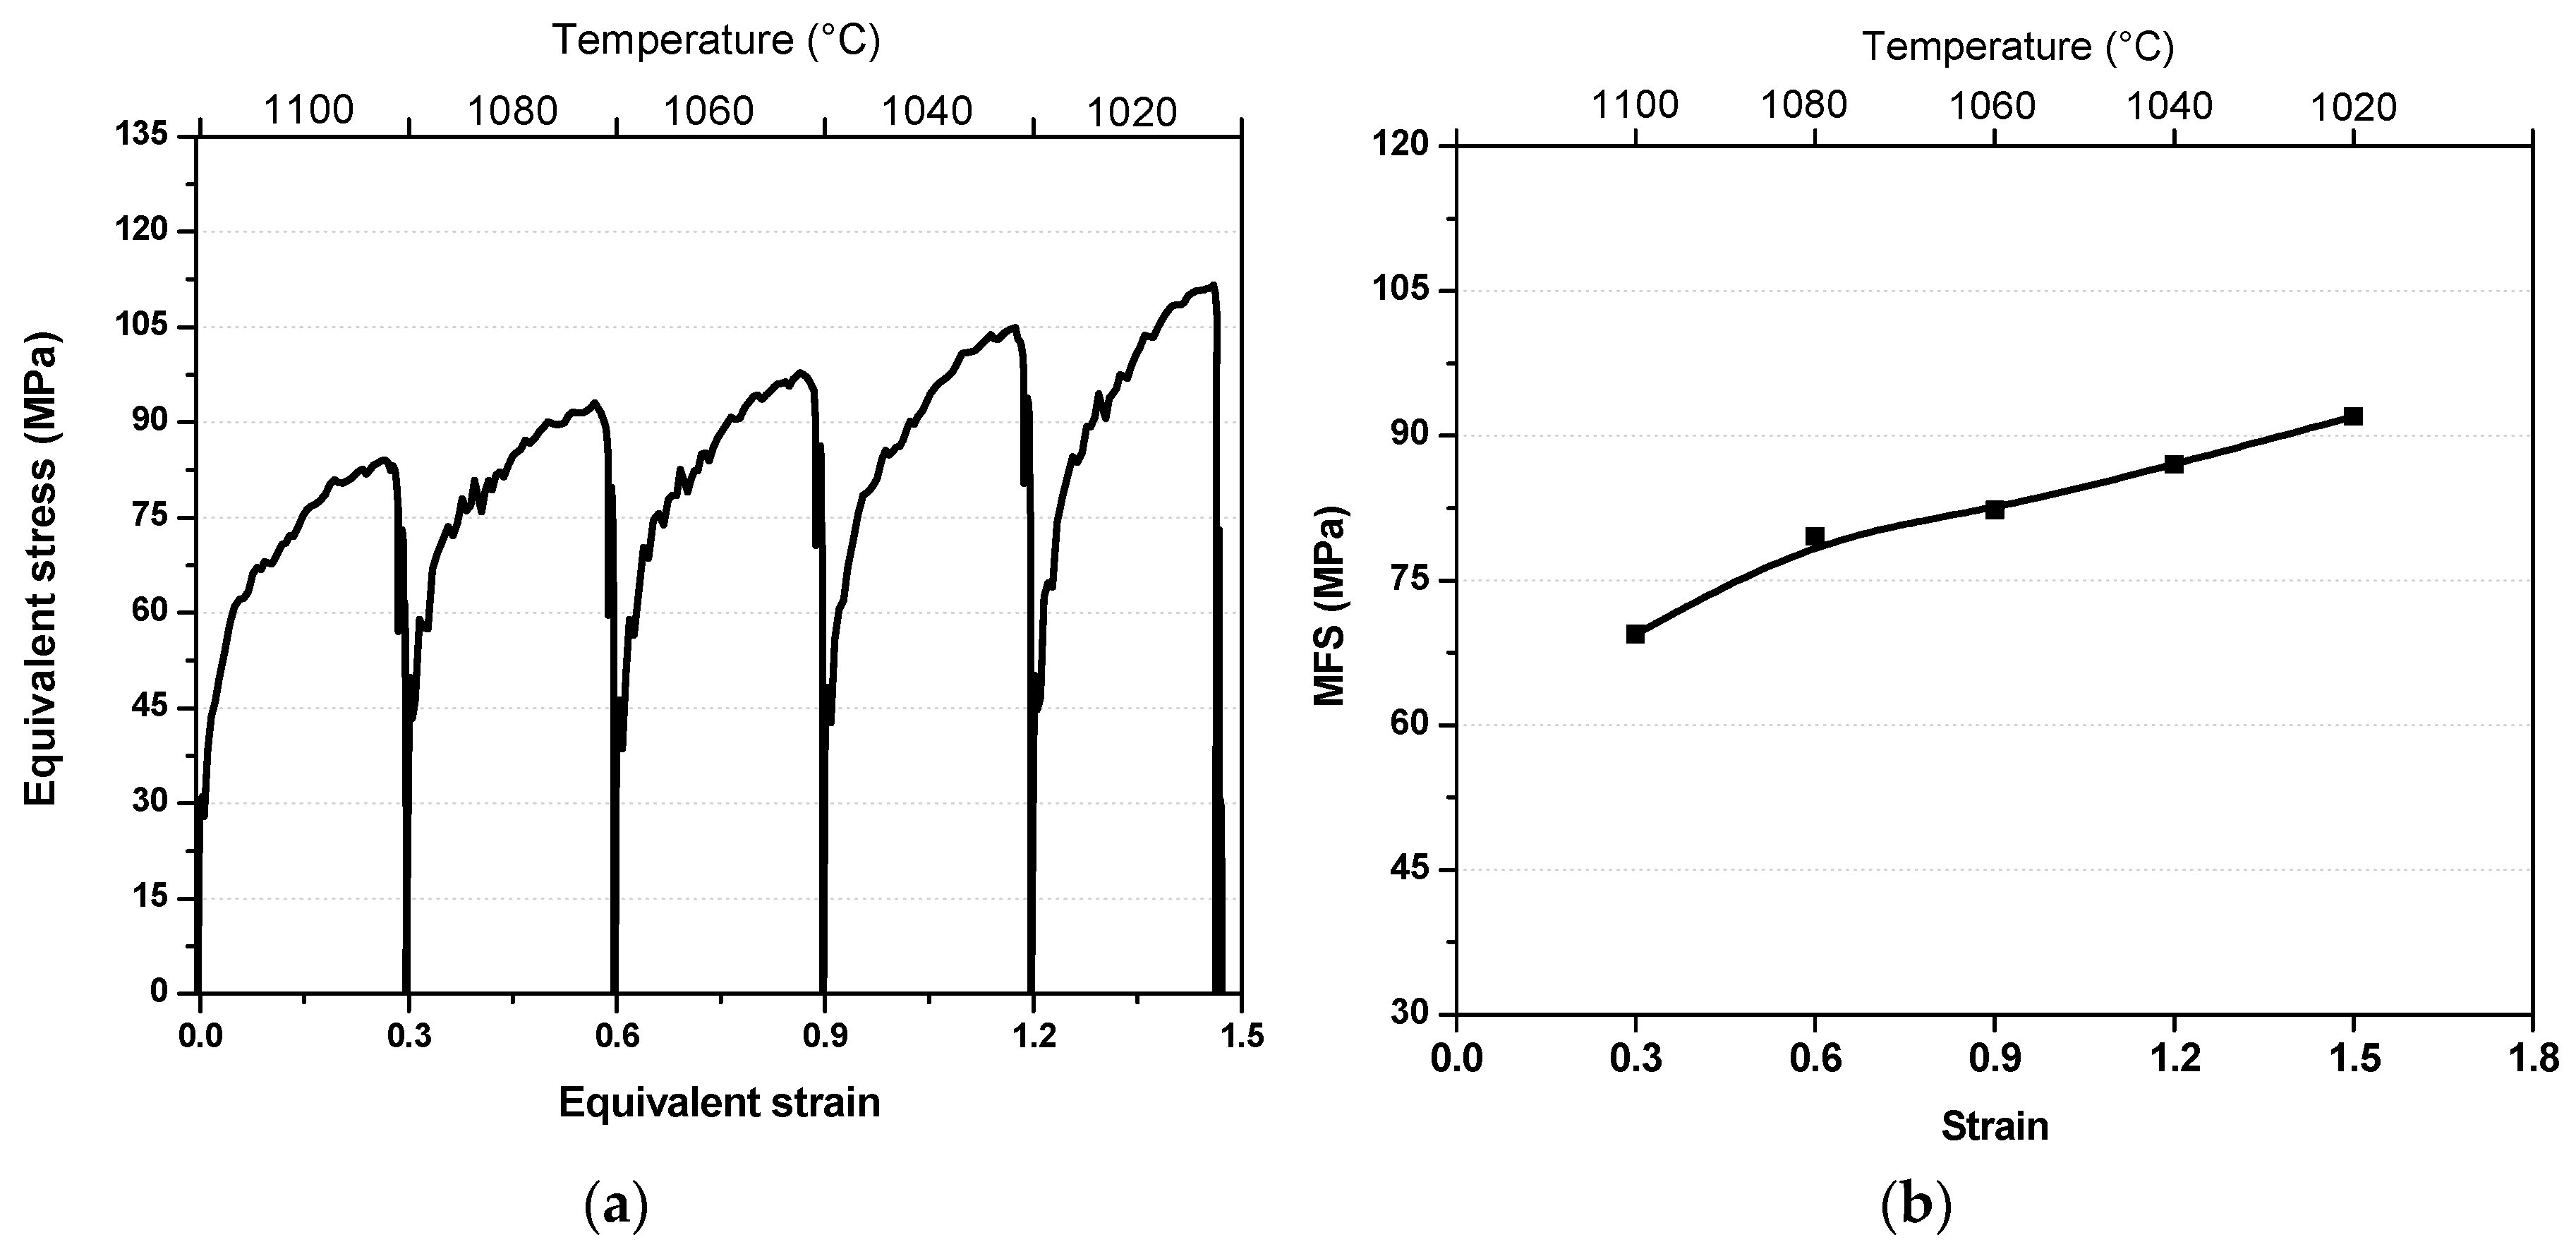
3.1. Flow Curves and Mean Flow Stress

The torque-twist curves obtained were converted into stress-strain curves using Fields and Backofen formulation [18]. The stress–strain curves associated with the five-pass torsion simulation are displayed in Figure 2a. The peak stresses of the 1st (1100 °C) 2nd (1080 °C), 3rd (1060 °C), 4th (1040 °C), and 5th (1020 °C) passes are 83, 93, 98, 105, and 112 MPa, respectively. Although the increasing trend of peak stresses during cooling appears to be typical behavior of a material during cooling, note that the rate of increase from 1st pass going to the 2nd pass is about 0.5 MPa/°C. This rate is higher than the ones in succeeding passes due to strain accumulation. For example, from 2nd to 5th pass, the average rate of increase from pass to pass is approximately 0.3 MPa/°C. This is 40% lower than the rate of increase from the initial two passes. It appears that the low rate of peak stress increase indicates that dynamic softening is taking place in the material. To further analyze these observations from the stress–strain curves, the mean flow stresses (MFS) were calculated by measuring the area of the stress–strain curves, normalized by the amount of strain. The dependence of MFS on temperature and on the total applied strain is shown in Figure 2b. Note that the slope of the linear relation between the 1st and 2nd passes are considerably higher than the slope of the 3rd, 4th, and 5th passes. This is an indication of softening by combination of recrystallization and phase transformation occurring in the material during deformation.

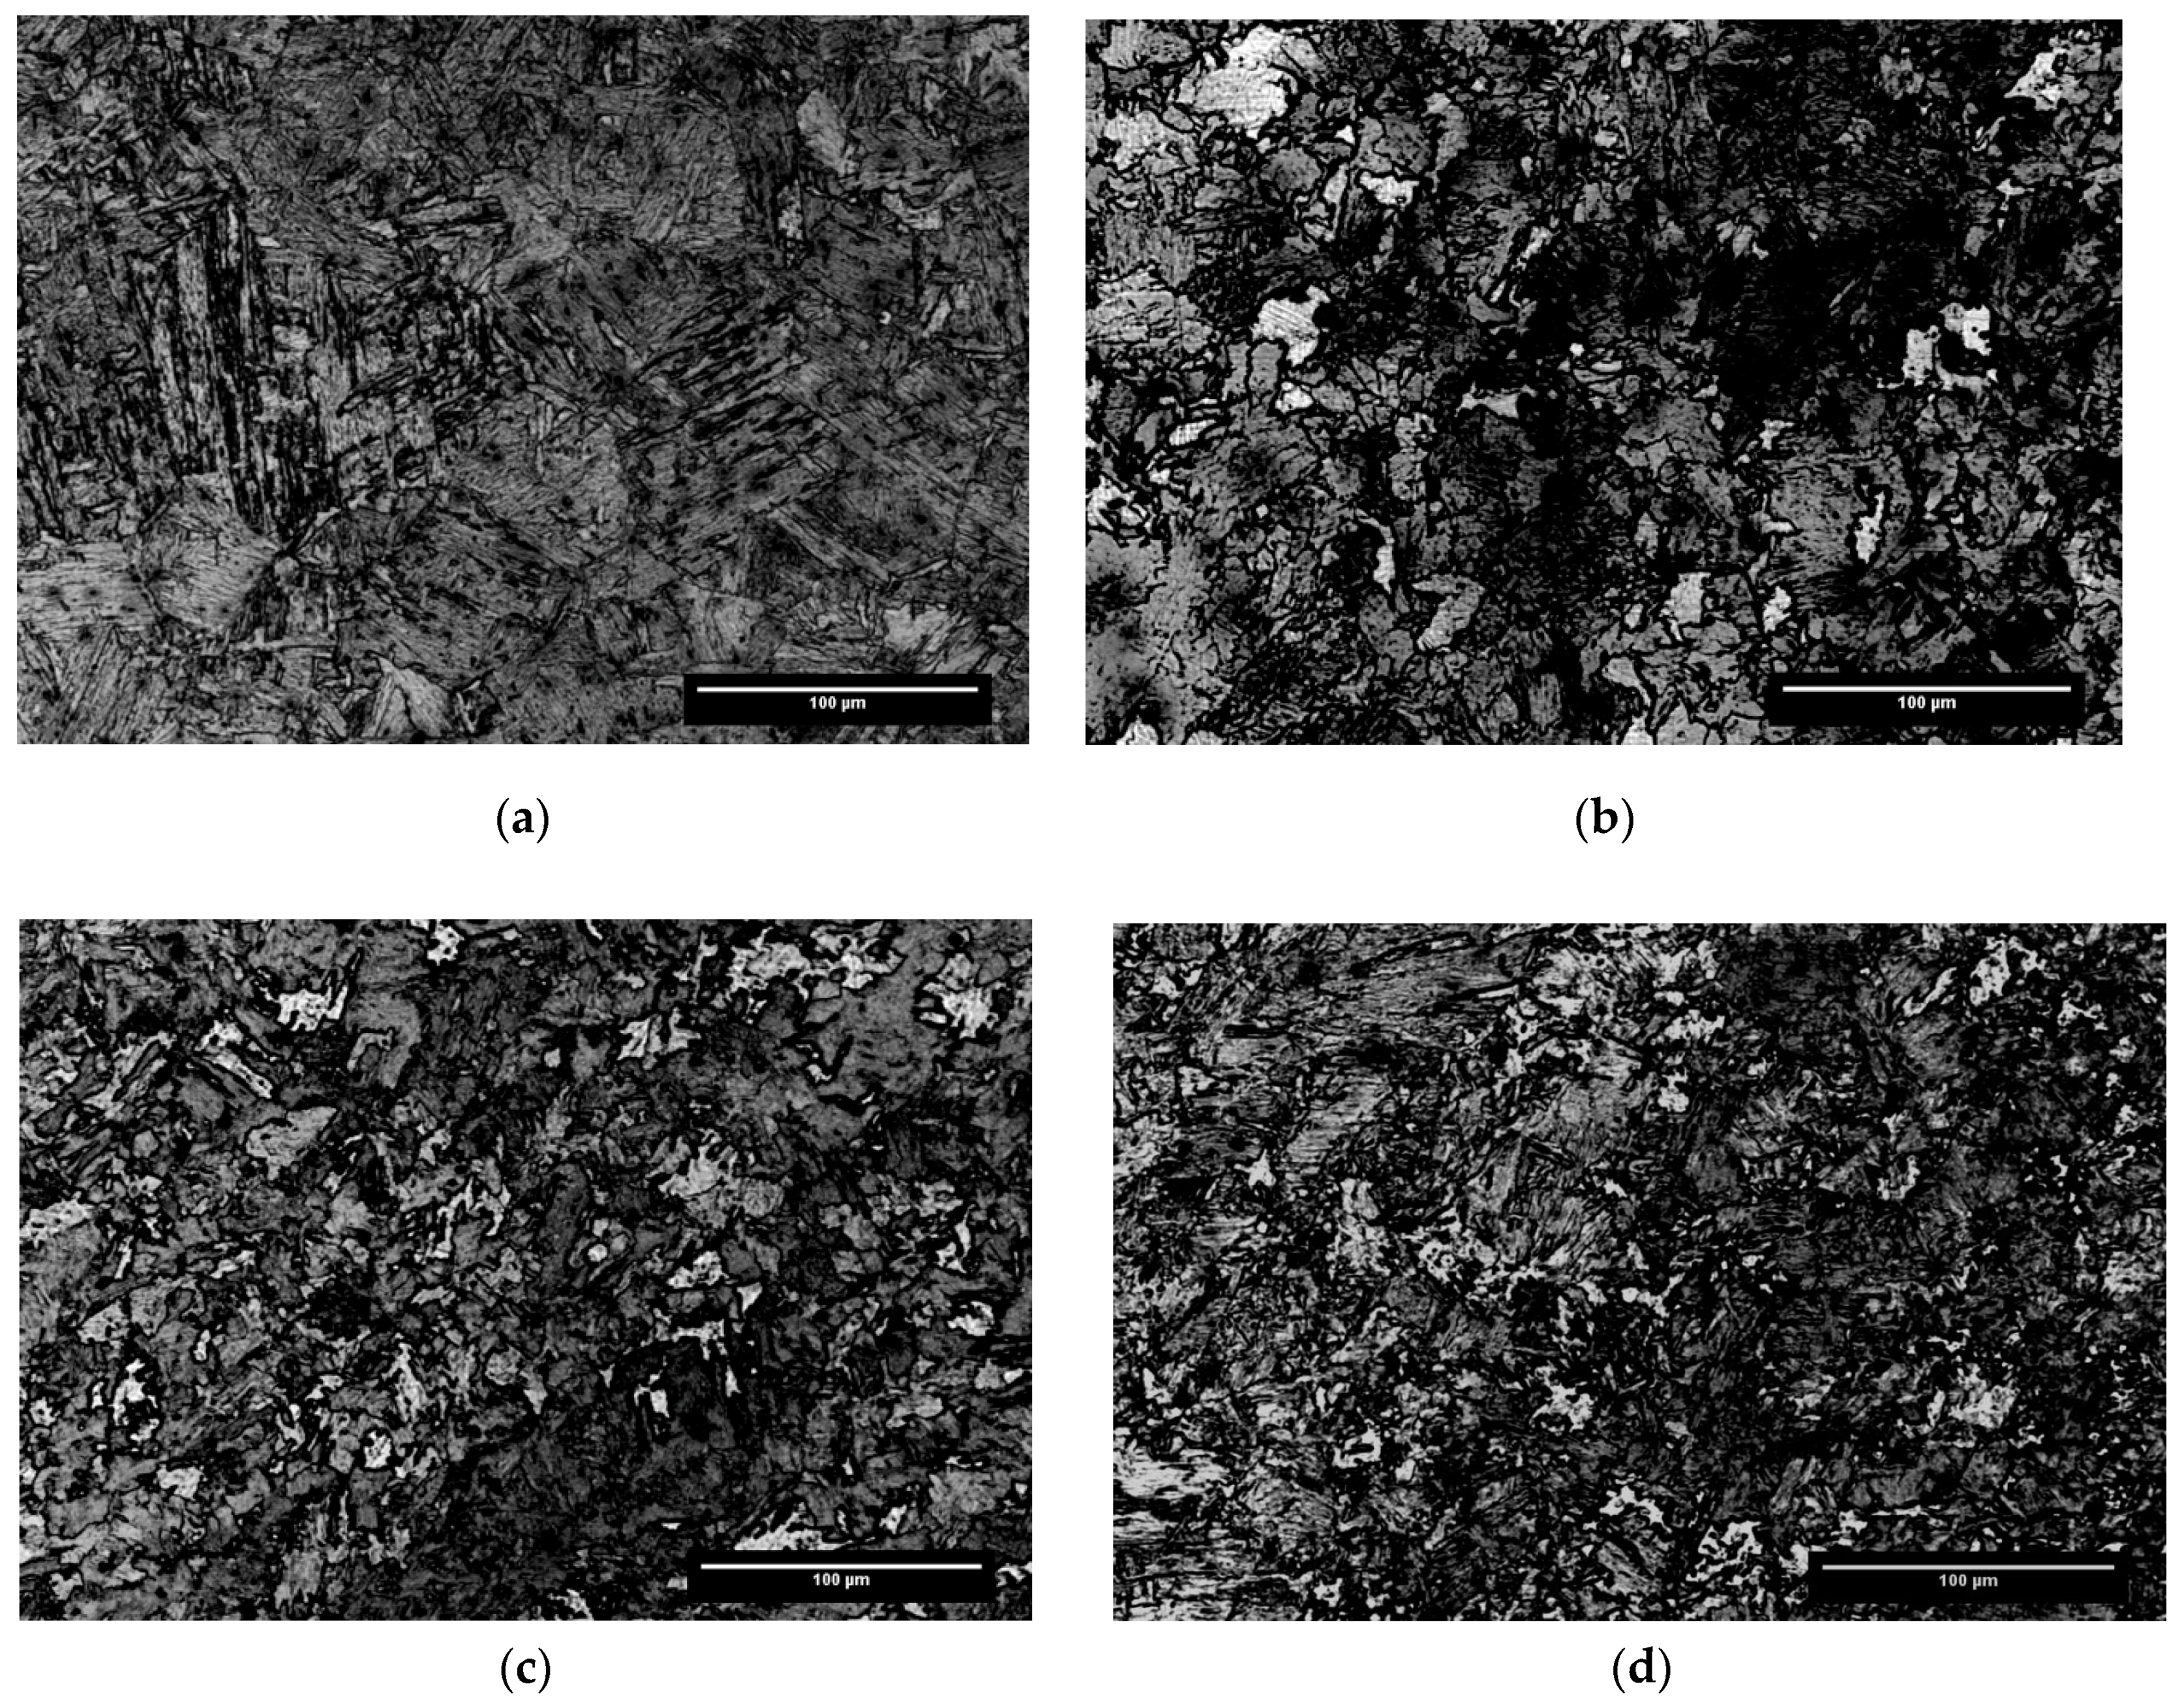
3.2. Microstrutural Results

The microstructures before the 1st pass (Figure 3a), after the 1st pass (Figure 3b), after the 3rd pass (Figure 3c), and after the 5th (Figure 3d) are displayed in Figure 3. The martensite phase appears dark and characterized by needle-shape structures inside the grains, while ferrite is the lighter structure and commonly identified by its polygonal structure. Here the grain sizes before the initial deformation are quite large, which was measured to be around 54 ± 15 µm (see Figure 3a). These grain sizes are slightly smaller than the typical sizes of austenite phase in industrial plate rolling before applying the roughing passes. The phase consists of entirely martensitic structure (prior austenite phase at elevated temperature). Note that after the five-pass simulation (see Figure 3d), the grain sizes decreased to less than 10 µm, which suggests the occurrence of either static recrystallization (SRX), metadynamic recrystallization (MDRX), dynamic transformation (DT), or a combination of these softening mechanisms. Although a long interpass time of 10 s was employed, it is important to note that the presence of Nb can significantly delay SRX in-between passes. A more interesting observation is the presence of light structures (ferrite), which forms dynamically. It is well-known that ferrite is softer than austenite due to its higher stacking fault energy [19]. Therefore, the presence of dynamically transformed ferrite (in combination with DRX) can generate significant softening of the material.

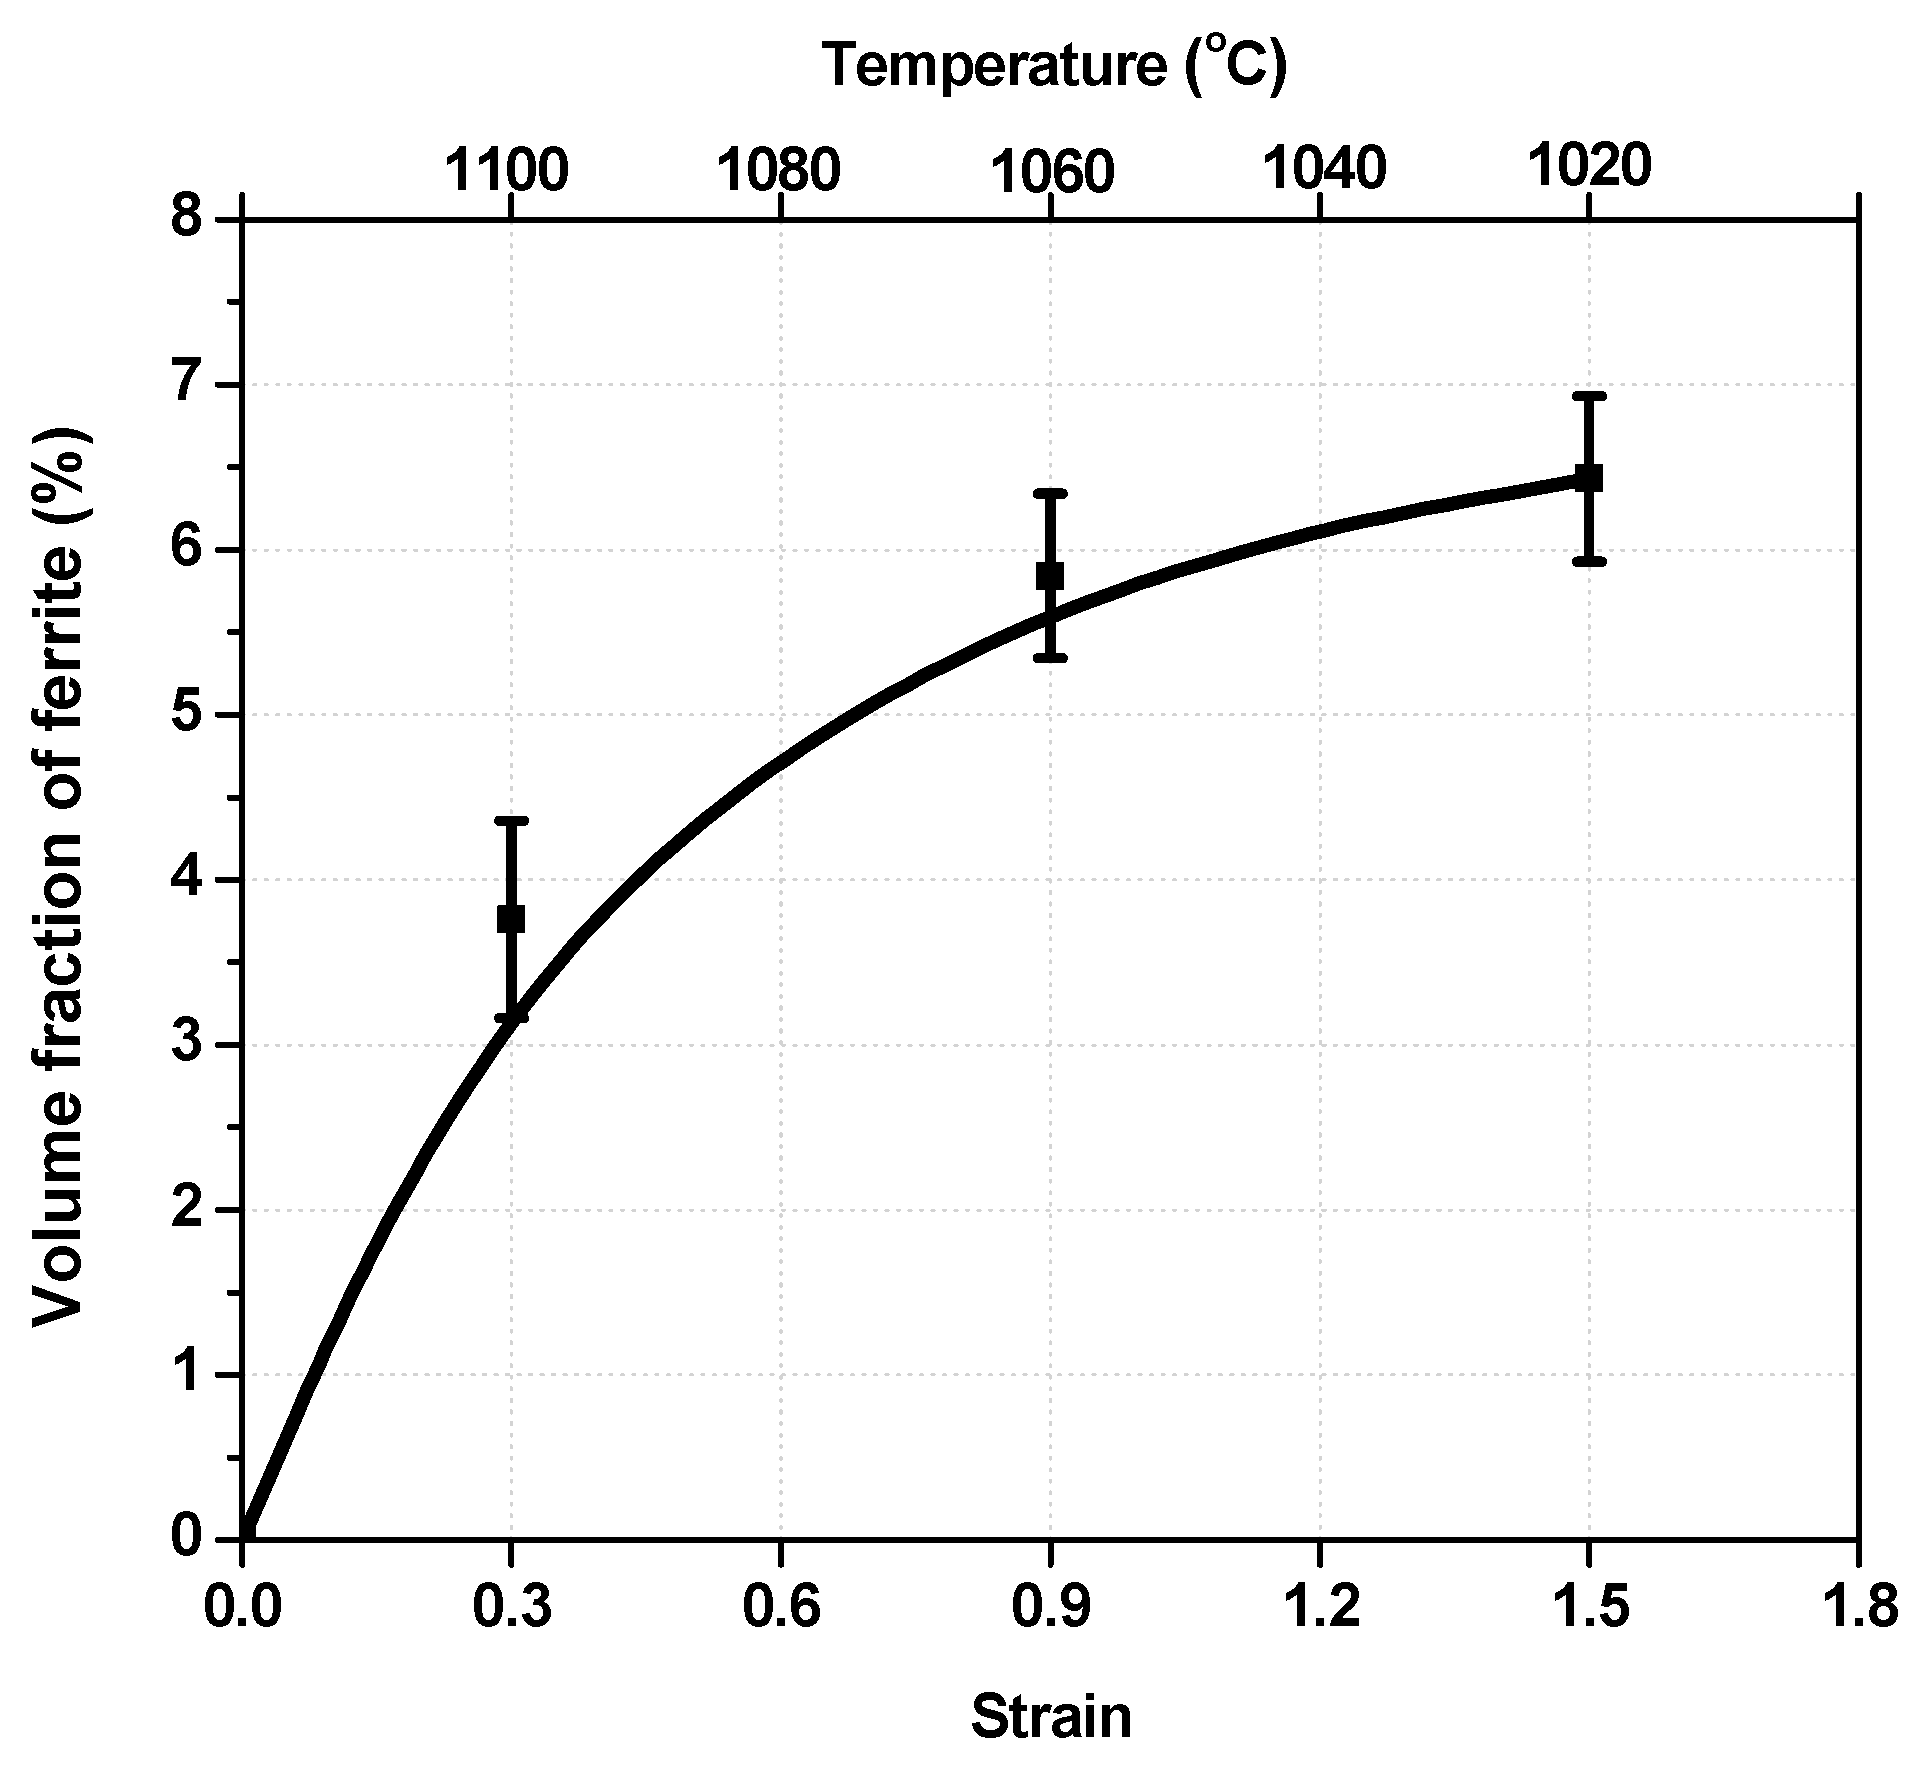
3.3. Volume Fraction of Transformed Ferrite

The volume fraction of ferrite was measured using the ImageJ software [20] to quantify the contribution of DT ferrite on the unusual behavior of the stress–strain curves, as shown above. The results are plotted and presented in Figure 4. The volume fraction of ferrite was measured based on the cumulative strain. Even though the reverse transformation of ferrite back into austenite can take place during the pass intervals, the amount of ferrite continously increases with applied strain. Note that the volume fraction of ferrite after the 2nd and 4th passes were interpolated. These values demonstrate that the rate of peak stress increase during cooling can be significantly affected by the occurrence of DT once the volume fraction of ferrite reached above 5%. This observation is consistent with the results of an earlier work of the present authors [13,14,15].

4. Discussion

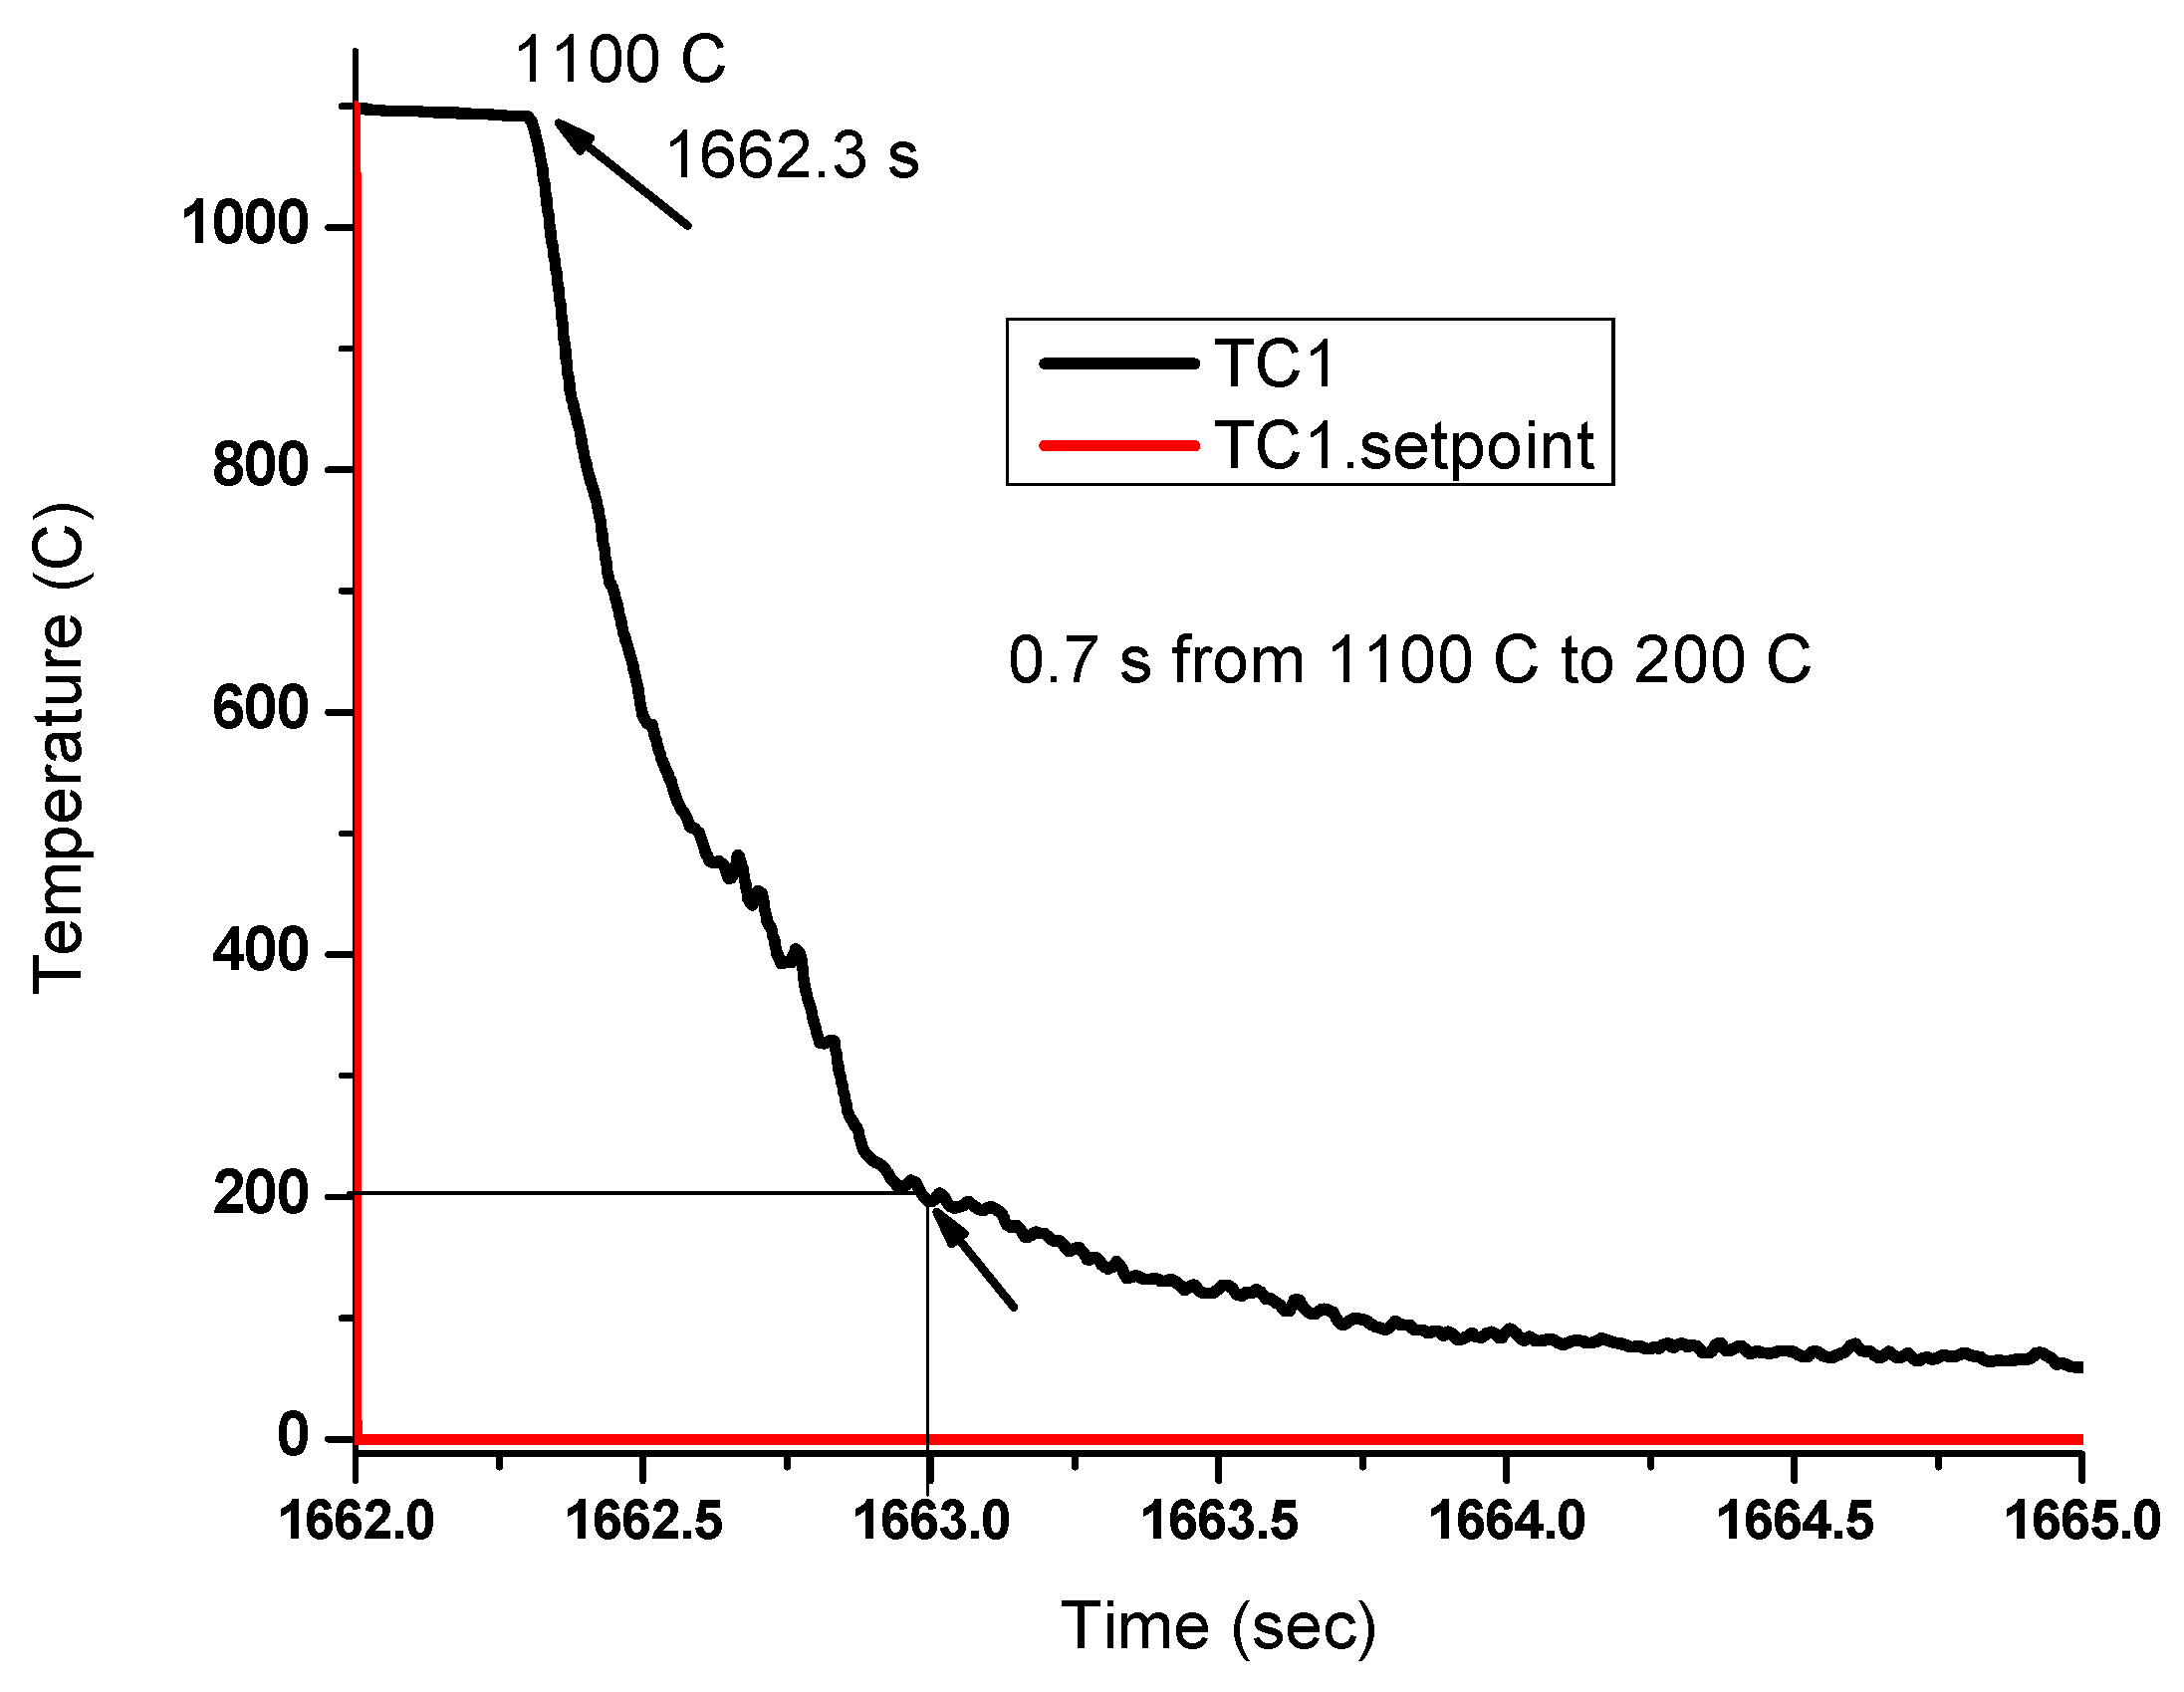
4.1. Cooling Rate and Continuous Cooling Transformation Curves

Although the microstructures after quenching can be considered as a direct evidence of dynamic transformation of austenite to ferrite above the Ae3 temperature, the cooling rate during quenching is a critical data that should be obtained to verify the validity of the observations. This is due to the fact that ferrite can also form during cooling of austenite. In the present experiments, the quenching rate was measured to be above 1200 °C/s. For example, water quenching from 1020 °C to 200 °C (well below the Ae3) took 0.7 s (see Figure 5). These measurements were taken using a welded thermocouple attached to the surface of the sample and it remained connected even after deformation. Although the cooling rate of the cylindrical sample may vary from the surface going to its center, the microstructures shown in the previous section were obtained from near the surface of the samples, which can accurately represent the microstructures with cooling rates of more than 1200 °C/s.
The continuous cooling transformation (CCT) curves of the present material with austenite grain sizes of 10 µm and 26 µm are displayed in Figure 6a,b, respectively. These were calculated using the Fe Alloys module of JMatPro software 10.2 (Guildford, UK). Based on these plots, it can be seen that it requires approximately 4 s to obtain 1% ferrite. This required cooling time of austenite is applicable to both coarse and fine grain austenite structure. In the present work, the cooling time is always below 1 s. This means that the ferrite phase observed and measured from the previous section was solely due to the applied deformation at elevated temperature.

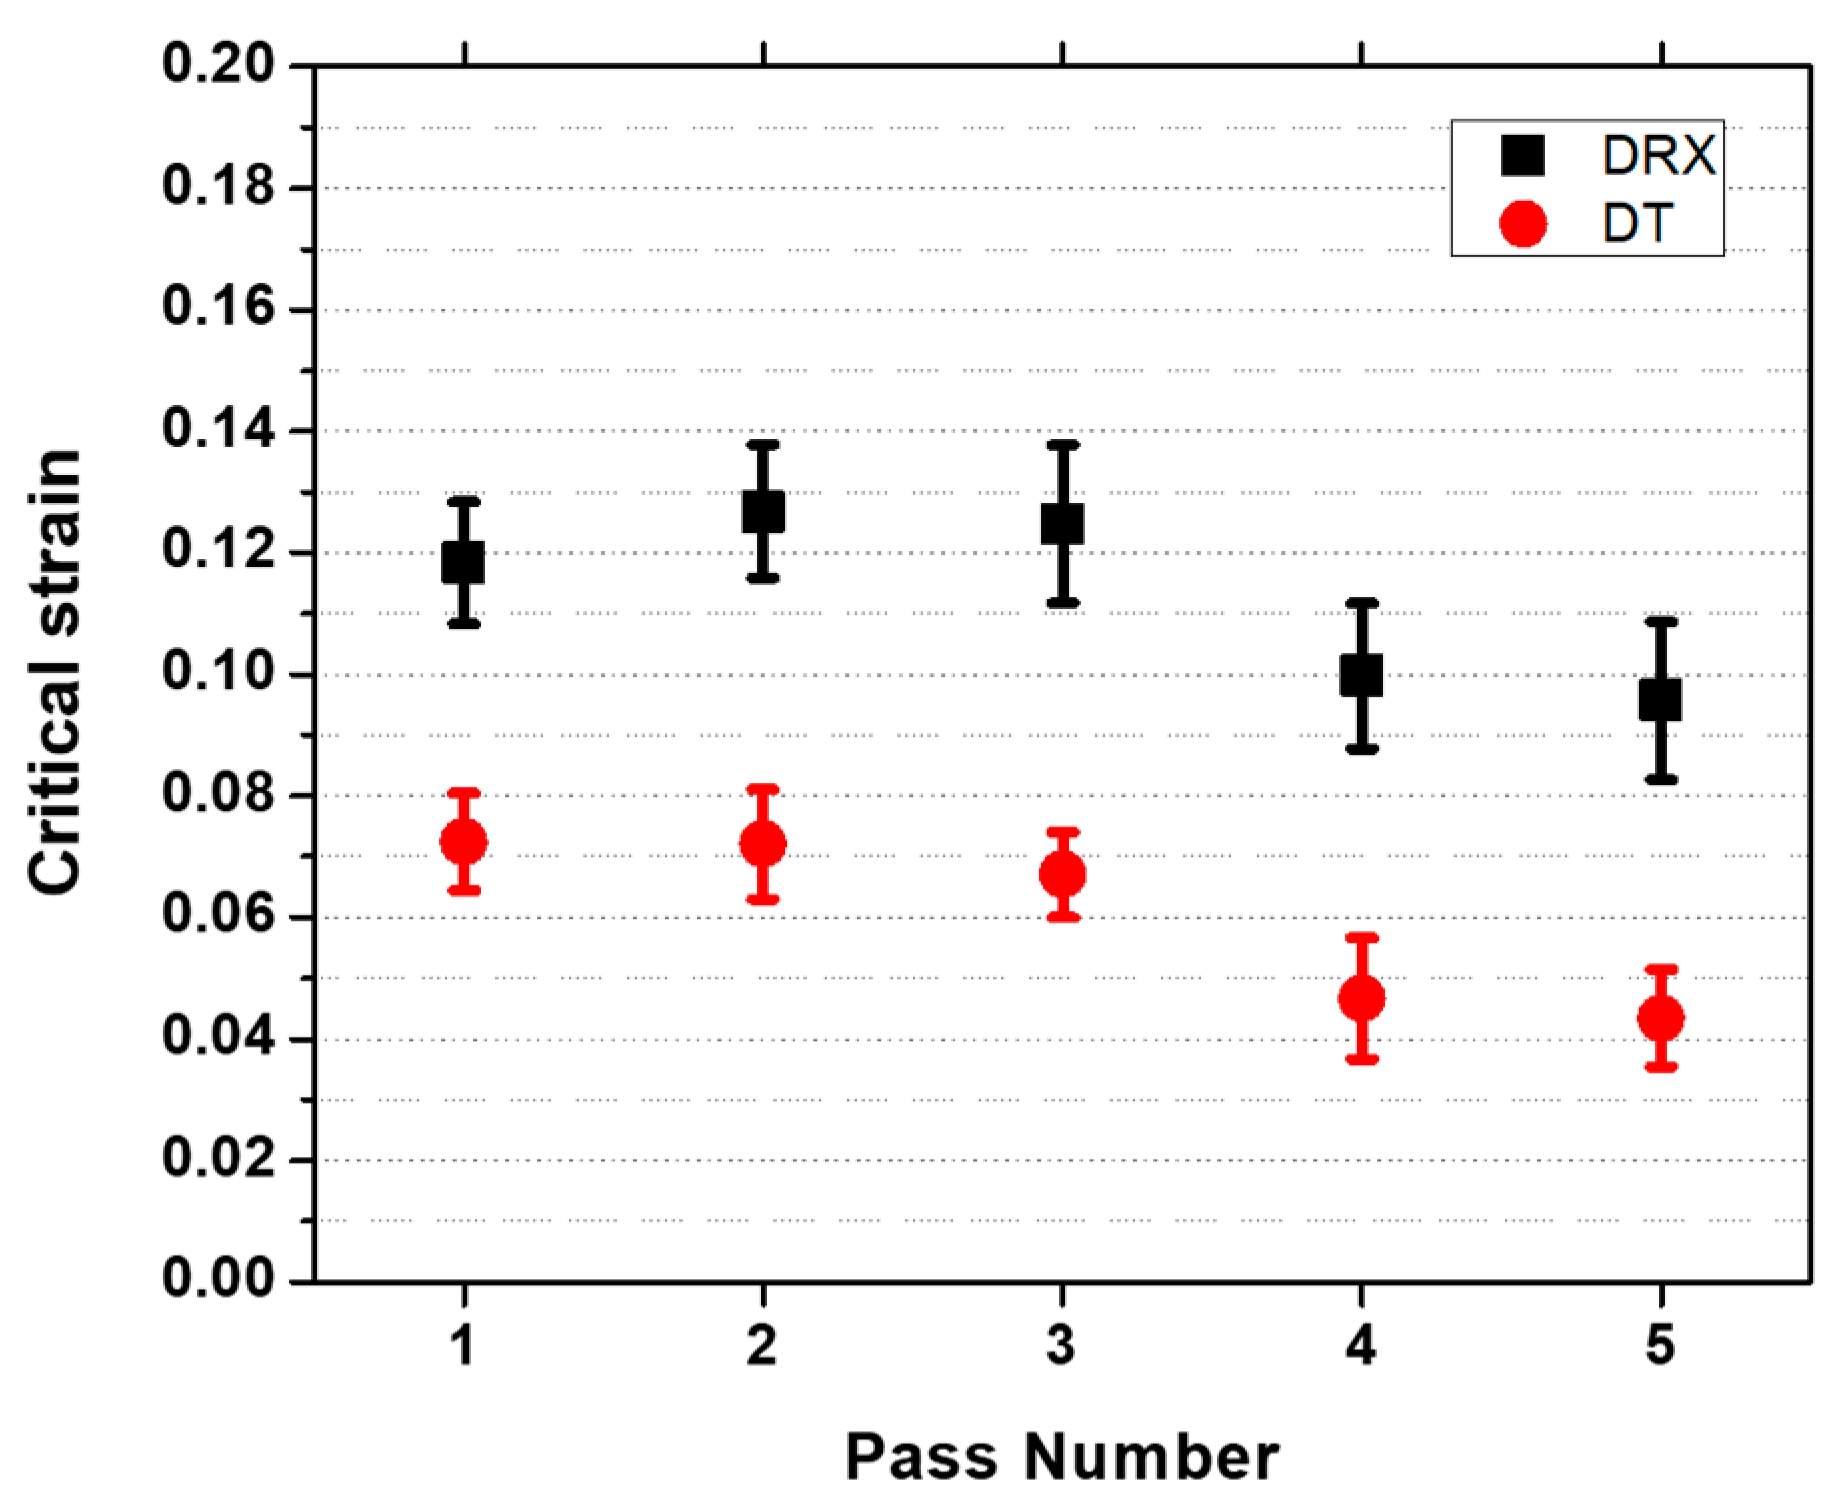
4.2. Critical Stresses and Strains

The stress–strain curves associated with 5-pass rolling simulation of Figure 2a are fitted with a 9th order polynomial using a Matlab software R2018b (The MathWorks, Natick, MA, USA) followed by application of the double differentiation method [18]. In this process, the critical stresses and strains were determined by initially plotting the θ versus σ curves where θ is strain hardening rate calculated by δσ/δε at a fixed strain rate (first derivative). The critical stresses are characterized by inflection points of the θ-σ plot. This can be described by the equation:
δ δ σ ( δ θ δ σ ) = 0 ,
The minima in the plot of δθ/δσ versus σ (see Figure 7) are related to the softening mechanisms during deformation. The lower critical stresses of each curve are associated with dynamic transformation while the higher critical stresses are for dynamic recrystallization [20]. The critical strains can also be identified from critical stresses of Figure 7.
The dependence of critical strains on pass number is displayed in Figure 8. The critical strains for DT are estimated to be around 0.06 while the critical strain for DRX is 0.12. These values are consistent with previous investigations of the present authors in the present material [21]. Moreover, the critical strains for DRX falls within the range of values shown in the literature [22] using the same method employed in the current work [19].
The critical strains for both DT and DRX display a slight decrease with increasing pass number. Note that for DRX, the critical strains should increase during cooling from one pass to another. The discrepancy in the trend of critical strains can be attributed to retained work hardening from previous pass. This is quite noticeable in the flow curves displayed in Figure 2. Since it is expected that NbC precipitates can form and pin down the dislocations, there is less recovery in-between passes. This leads to higher retained work hardening, which provides additional energy on top of the applied stress. A lower retained work hardening is expected if the material is low-alloyed steel or if the interpass time is increased [16]. In the present work, the attention will be focused on DT and the energies associated with this phenomenon.

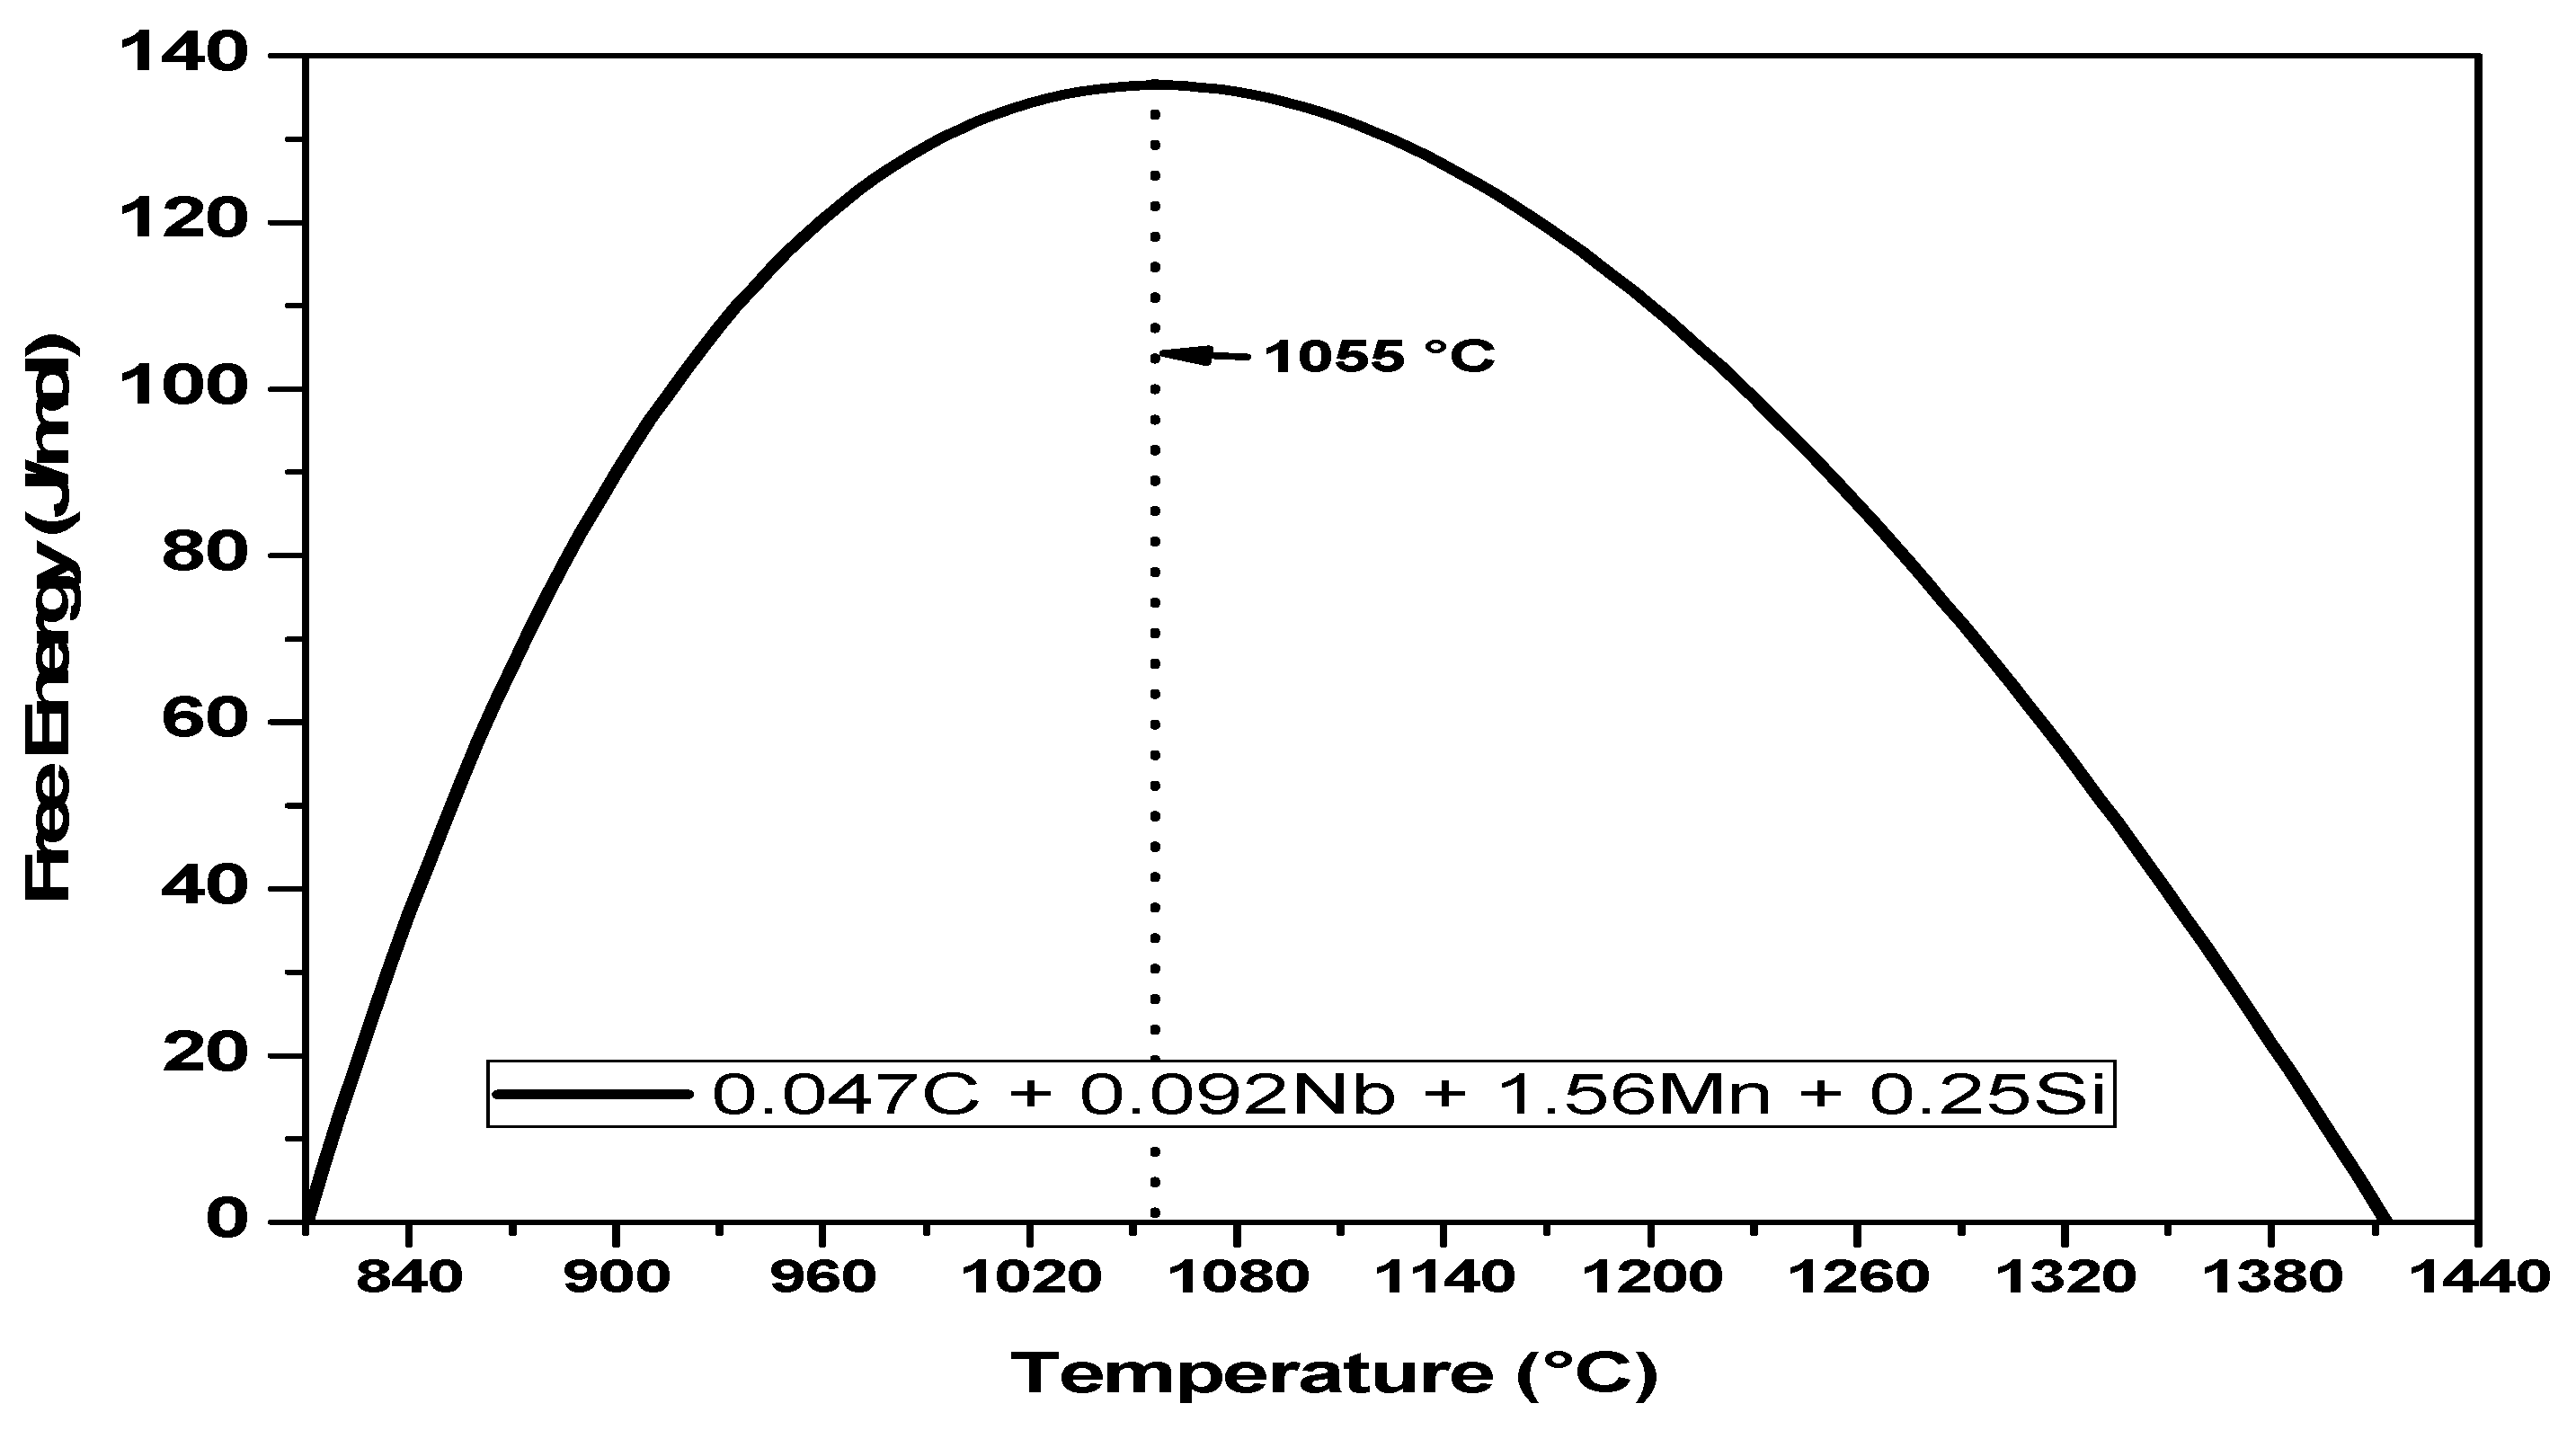
4.3. Total Energy Obstacles and Driving Force

The occurrence of dynamic transformation can be explained in terms of transformation softening model [21]. In this model, the driving force to transformation (DF) is the flow stress difference between the critical stress of the parent phase (σC) and the yield stress of the product phase (σYS) defined by Equation (2) below:
DF = σCσYS,
The critical stresses from austenite phase were obtained from the previous section while the yield stress of ferrite was estimated in a previous work of the present authors [23]. The dependence of the calculated driving force with temperature is shown in Figure 9 (see solid circles). The work per unit volume are converted into thermodynamic quantities using the conversion factor 1 MPa = 7.2 J/mol [10].
The total energy obstacles consist of the work of dilatation (WD) and shear accommodation (WSA) associated with the phase transformation of austenite to ferrite, and the free energy difference between the phases (ΔGγ-α). This is defined by Equations (3)–(5) below:
Total Energy Obstacles = WSA + WD + ΔGγ-α,
WSA = σC × 0.36 × m,
WD = σC × 0.03 × m,
The work of dilatation and shear accommodation are dependent on the critical stresses, which were obtained from the previous section. Since the dilatation and shear accommodation strains are difficult to measure experimentally, the present work assumed values of 0.03 and 0.36, respectively [24]. These values are based on the theoretical required deformation strains to transform austenite into ferrite. The Schmid factor (m) is based on the transformation habit plane and the shear direction when austenite transforms into ferrite, which are (0.506, 0.452, 0.735) and (−0.867, 0.414, 0.277), respectively. The present calculation employs the highest Schmid factor of 0.5 since the most oriented grains (with respect to the applied stress) are expected to transform first. Note that the critical strains are normally associated with the transformation of grains that are well oriented with the direction of applied stress [21,23,25].
The free energy difference between the austenite and ferrite was calculated using the FSstel database of the FactSage thermodynamic software. The sum of the components of the energy obstacles was calculated and are presented in Figure 9 (see solid triangle). Since the driving force is greater than the total energy obstacles for the present temperature range of 1020 °C to 1100 °C, it is expected that transformation of austenite to ferrite can take place. Although the calculated values may not represent the exact driving force and total energy obstacles due to the assumptions specified above, the difference between the curves look reasonable. This is supported by the microstructures which show that austenite transforms into ferrite. The kinetics of transformation may possibly be hindered by niobium which can delay the progression of transformation due to pinning and/or solute drag effects [16]. For this reason, the present material only obtained less than 10% ferrite at total applied torsional strain of 1.5. This may also be the reason for lower difference between the calculated driving forces and total energy obstacle.
It is also important to note that the free energy difference curve for the present material shows a peak, see Figure 10. This behavior indicates that austenite can easily transform if the temperatures are either close to the Ae3 or near the delta-ferrite formation temperature. The present temperature range covers the peak free energy difference; thus, these temperatures requires higher amount of driving force to initiate the occurrence of dynamic phase transformation. Based on the present results at the selected temperature range, it is expected that austenite can be transformed into ferrite at any temperature above the Ae3 for the present material [1].

5. Conclusions

1. Dynamic transformation of austenite to ferrite can take place during roughing passes of the plate rolling process and its volume fractions formed and retained in the simulations increase as the pass number increases. The present work showed that this can take place on a Nb-microalloyed steel subjected to roughing passes at temperature range 1020 to 1100 °C.
2. The calculated CCT diagrams confirmed that the measured cooling rate of 1200 °C/s is enough to prevent the formation of ferrite by cooling. Therefore, the volume fraction of ferrite measured in present work is only attributed to the applied deformation.
3. The thermodynamic calculations show that the driving force for DT is higher than the total barrier in the present investigation. Assumptions were made on the values of dilatation and shear accommodation strains.
4. The critical strains to dynamic transformation were shown to be in the range 0.04 to 0.07. This value decreases from pass to pass due to retained work hardening from the previous pass. The highest critical strain pertains to the first pass (where there is no prior deformation) during multi-pass high-temperature deformation experiments.

Author Contributions

All the authors contributed to this research work: Conceptualization, S.F.R., F.S., C.A.J., M.J. and J.J.J.; Formal analysis, S.F.R., C.A.J. and J.J.J.; Data curation, S.F.R., F.S., G.S.R. and E.S.S.; Methodology, S.F.R., F.S. and J.J.J.; Software, S.F.R., C.A.J. and E.S.S.; Validation, S.F.R., M.Z. and J.J.J.; Investigation, S.F.R., C.A.J., G.S.R. and J.J.J.; Resources, S.F.R., F.S., G.S.R., and E.S.S.; Writing—original draft preparation, S.F.R., C.A.J., F.S. and J.J.J.; Writing—review and editing, C.A.J., F.S. and J.J.J.; Visualization, C.A.J., F.S. and E.S.S.; Supervision, S.F.R., M.Z., J.J.J. and F.S.; Project administration, S.F. and J.J.J.; Funding acquisition, S.F.R., F.S. and C.A.J.

Acknowledgments

The authors acknowledge with gratitude funding received from the Brazilian National Council for Scientific and Technological Development (CNPq), the Industrial Research Chair in Forming Technologies of High Strength Materials of the École de Technologie Supérieure of Montréal, the New Brunswick Innovation Foundation (NBIF) and the Natural Sciences and Engineering Research Council of Canada. They also thank Jon Jackson and Laurie Collins from the EVRAZ North America Research and Development Centre (Regina) for providing the steel investigated in this research.

Conflicts of Interest

The authors declare no conflict of interest.

References

  1. Grewal, R.; Aranas, C.; Chadha, K.; Shahriari, D.; Jahazi, M.; Jonas, J.J. Formation of Widmastatten ferrite at very high temperatures in the austenite phase field. Acta Mater. 2016, 109, 23–31. [Google Scholar] [CrossRef]
  2. Aranas, C.; Jung, I.H.; Yue, S.; Rodrigues, S.F.; Jonas, J.J. A metastable phase diagram for the dynamic transformation of austenite at temperatures above the Ae3. Int. J. Mater. Res. 2016, 107, 881–886. [Google Scholar] [CrossRef]
  3. Matsumura, Y.; Yada, H. Evolution deformation of ultrafine- grained ferrite in hot successive deformation. Trans. ISIJ. 1987, 27, 492–498. [Google Scholar] [CrossRef]
  4. Yada, H.; Matsumura, Y.; Senuma, T. International conference on physical metallurgy of thermomechanical processing of steels and other metals. Thermec-88. Vol. 2. In Proceedings of the 1st Conference Physical Metallurgy of Thermomechanical Processing of Steels and other Metals, Tokyo, Japan, 6–10 June 1988; Tamura, I., Ed.; 1988; pp. 200–207. [Google Scholar]
  5. Yada, H.; Li, C.M.; Yamagata, H. Dynamic γ—A transformation during hot deformation in Iron-Nickel-Carbon alloys. ISIJ Int. 2000, 40, 200–206. [Google Scholar] [CrossRef]
  6. Chen, Y.; Chen, Q. Dilatometric investigation on isothermal transformation after hot deformation. J. Iron Steel Res. Int. 2003, 10, 46–48. [Google Scholar]
  7. Liu, Z.; Li, D.; Lu, S.; Qiao, G. Thermal stability of high temperature deformation induced ferrite in a low carbon steel. ISIJ Int. 2007, 47, 289–293. [Google Scholar] [CrossRef]
  8. Sun, X.; Luo, H.; Dong, H.; Liu, Q.; Weng, Y. Microstructural evolution and kinetics for post-dynamic transformation in a plain low carbon steel. ISIJ Int. 2008, 48, 994–1000. [Google Scholar] [CrossRef]
  9. Basabe, V.V.; Jonas, J.J. The ferrite transformation in hot deformed 0.036% Nb austenite at temperature above the Ae3. ISIJ Int. 2010, 50, 1185–1192. [Google Scholar] [CrossRef]
  10. Ghosh, C.; Basabe, V.V.; Jonas, J.J.; Kim, Y.; Jung, I.; Yue, S. The dynamic transformation of deformed austenite at temperatures above the Ae3. Acta Mater. 2013, 61, 2348–2362. [Google Scholar] [CrossRef]
  11. Aranas, C.; Jonas, J.J. Effect of Mn and Si on dynamic transformation of austenite above the Ae3 temperature. Acta Mater. 2015, 82, 1–10. [Google Scholar] [CrossRef]
  12. Aranas, C.; Nguyen-Minh, T.; Grewal, R.; Jonas, J.J. Flow softening-based formation of Widmanstatten ferrite in a 0.06%C steel deformed above the Ae3. ISIJ Int. 2015, 55, 300–307. [Google Scholar] [CrossRef]
  13. Rodrigues, S.F.; Aranas, C.; Sun, B.; Siciliano, F.; Yue, S.; Jonas, J.J. Effect of grain size and residual strain on the dynamic transformation of austenite under plate rolling conditions. Steel Res. Int. 2018, 89, 1–7. [Google Scholar] [CrossRef]
  14. Rodrigues, S.F.; Aranas, C.; Wang, T.; Jonas, J.J. Dynamic transformation of an X70 steel under plate rolling conditions. ISIJ Int. 2017, 57, 162–169. [Google Scholar] [CrossRef]
  15. Rodrigues, S.F.; Aranas, C.; Jonas, J.J. Retransformation behavior of dynamically transformed ferrite during the simulated plate rolling of a low C and an X70 Nb steel. ISIJ Int. 2017, 57, 929–936. [Google Scholar] [CrossRef]
  16. Aranas, C.; Wang, T.; Jonas, J.J. Effect of interpass time on the dynamic transformation of a plain C-Mn and Nb-microalloyed steel. ISIJ Int. 2015, 55, 647–654. [Google Scholar] [CrossRef]
  17. Bale, C.W.; Belisle, E.; Chartrand, P.; Decterov, S.A.; Eriksson, G.; Hack, K.; Jung, I.H.; Kang, Y.Y.; Melancon, J.; Pelton, A.D.; et al. FactSage thermomechanical software and database-recent developments. Calphad 2009, 33, 295–311. [Google Scholar] [CrossRef]
  18. Fields, D.S.; Backofen, W.A. Determination of strain hardening characteristics by torsion testing. Proc. Am. Soc. Test. Mater. 1957, 57, 1259–1272. [Google Scholar]
  19. Poliak, E.I.; Jonas, J.J. A one-parameter approach to determining the critical conditions for the initiation of dynamic recrystallization. Acta Mater. 1996, 44, 127–136. [Google Scholar] [CrossRef]
  20. Schneider, C.A.; Rasband, W.S.; Eliceiri, K.W. NIH Image to ImageJ: 25 years of image analysis. Nat. Meth. 2012, 9, 671–675. [Google Scholar] [CrossRef] [Green Version]
  21. Ghosh, C.; Aranas, C.; Jonas, J.J. Dynamic transformation of deformed austenite at temperatures above the Ae. Prog. Mater. Sci. 2016, 82, 151–233. [Google Scholar] [CrossRef]
  22. Rodrigues, S.F.; Aranas, C.; Jonas, J.J. Dynamic Transformation during the Simulated Plate Rolling of a 0.09% Nb Steel. ISIJ Int. 2017, 57, 1102–1111. [Google Scholar] [CrossRef] [Green Version]
  23. Poliak, E.I.; Jonas, J.J. Critical strain for dynamic recrystallization in variable strain rate hot deformation. ISIJ Int. 2003, 43, 692–700. [Google Scholar] [CrossRef]
  24. Aranas, C.; Rodrigues, S.F.; Fall, A.; Jahazi, M.; Jonas, J.J. Determination of the critical stress associated with dynamic phase transformation in steels by means of free energy method. Metals 2018, 8, 360. [Google Scholar] [CrossRef]
  25. Jonas, J.J.; Ghosh, C. Role of mechanical activation in the dynamic transformation of austenite. Acta Mater. 2013, 61, 6125–6131. [Google Scholar] [CrossRef]
Figure 1. Thermomechanical schedule employed in the Gleeble torsion simulations of roughing passes. The deformation temperatures were 1100, 1080, 1060, 1040, and 1020 °C, strain of 0.3 was employed in each pass and interpass time of 10 s.
Metals 09 00334 g001
Figure 2. (a) Roughing stress–strain curves determined according to the schedule of Figure 1 using pass strains of 0.3 applied at 1 s−1: (b) mean flow stresses (MFS) curve derived from the stress–strain curves of Figure 2a.
Metals 09 00334 g002
Figure 3. Optical microscopy images of steel subjected to the roughing simulation. The samples were quenched immediately: (a) Before the first pass; (b) after the first pass; (c) after the third pass and (d) after the fifth pass. Light regions are ferrite while the dark regions are martensite (prior austenite).
Metals 09 00334 g003
Figure 4. Dependence of the cumulative volume fraction of ferrite formed on the cumulative strain and temperature.
Metals 09 00334 g004
Figure 5. Setpoint (red line) and measured temperature (black line) by the thermocouple on the surface of the samples. It is observed that took less than 1 s for the temperature to drop well below the Ae3.
Metals 09 00334 g005
Figure 6. Calculated continuous cooling transformation (CCT) of the material quenched from: (a) 1020 °C and grain size of 10 µm and; (b) 1100 °C and grain size of 26 µm.
Metals 09 00334 g006
Figure 7. Plots of−(dθ/dσ) versus σ used to identify the minima related to the initiation of dynamic transformation (DT) and dynamic recrystallization (DRX).
Metals 09 00334 g007
Figure 8. Critical strains for dynamic transformation (DT) and dynamic recrystallization (DRX) as a function of roughing pass number.
Metals 09 00334 g008
Figure 9. Calculated driving force (red line) over the total energy obstacle with the temperature.
Metals 09 00334 g009
Figure 10. ΔG(α-γ) vs ΔT for the present Nb-microalloyed steel showing the Gibbs energy obstacle opposing dynamic transformation.
Metals 09 00334 g010
Table 1. Chemical composition (mass%) and equilibrium transformation temperatures (°C).
CMnSiCrNbNOrthoequilibrium Ae3Paraequilibrium Ae3
0.0471.560.250.210.0920.008845 °C810 °C

