Article

Inclusions Control and Refining Slag Optimization for Fork Flat Steel

1
Department of Materials Science and Engineering, Hebei University of Engineering, Handan 056000, China
2
Warwick Manufacturing Group, University of Warwick, Coventry CV4 7AL, UK
3
Hebei Yongyang Special Steel Group Co., Ltd., Handan 056000, China
*
Author to whom correspondence should be addressed.
Metals 2019, 9(2), 253; https://doi.org/10.3390/met9020253
Submission received: 20 December 2018 / Revised: 11 February 2019 / Accepted: 16 February 2019 / Published: 20 February 2019
(This article belongs to the Special Issue Ironmaking and Steelmaking)

Abstract

:
In order to investigate the causes of the large number of cracks and porosities formed in 33MnCrTiB fork flat steel produced by a special steel plant, scanning electron microscopy (SEM), energy dispersive spectrometer (EDS) analysis, and large sample electrolysis of the obtained steel samples were carried out in different steps of the steelmaking processes. The main micro-inclusions in the fork flat steel samples were Al2O3, CaO-MgO-Al2O3-SiO2, and TiN, and the macro-inclusions were mainly Al2O3, CaO-Al2O3, CaO-Al2O3-SiO2-TiO2, and CaO-MgO-Al2O3-SiO2-TiO2-(K2O) systems which originated from the ladle slag and mold flux in the production process. In order to reduce the number of micro-inclusions effectively, the control range of components in the refining slag was confirmed by the thermodynamic calculation, where the mass ratio of CaO/Al2O3 should be in the range of 1.85–1.92, and the mass fraction of SiO2 and MgO should be controlled to 7.5–20% and 6–8%, respectively. In addition, the numbers of macro-inclusions in the flat steel should be effectively reduced by optimizing the flow field of mold and preventing the secondary oxidation, and the flat steel quality problems caused by the inclusions can be improved by the optimization process above.

1. Introduction

Forklift trucks are common production vehicles, which convey raw materials to the production line, scrap, and final products to the storage areas or to the transportation trucks. The fork is one of the most important parts of a forklift. It not only bears a large external force, but also needs to be a small cross section and lightweight. The strength and stiffness of the fork must meet the safety requirements, but they also require a good plasticity index and certain low-temperature impact properties. The research shows that the load-support parts of forklift forks are subjected to repetitive stress conditions of a variety of load and frequency spectra [1,2], including loading and unloading cycles and vibrations coming from moving on irregular terrain conditions [3,4]. The raw materials’ quality is one of the main causes inducing fatigue failure of forklift forks.
Common forks generally use 33MnCrTiB, 35CrMo, and 40Cr flat steel as raw materials [5]. The 33MnCrTiB fork flat steel, produced by a special steel enterprise in China, has high strength, is lightweight, and has long service life, thus making it a relatively high-quality fork flat steel. Recently, cracks, porosity, and other defects have often been found in the flat steel produced by steel mills. Many inclusions have been found to be the source of the cracks. Therefore, to find out the sources of inclusions in steel and make relevant optimization measures, steel samples obtained from steelmaking plants are analyzed in this study by means of large sample electrolysis, metallographic observation, and scanning electron microscopy.

2. Materials and Experimental Methods

2.1. Fork Flat Steel Production Process

The production process of a 33MnCrTiB low-alloy flat steel plant includes: Scrap + Hot Metal → Consteel Electric Arc Furnace (EAF) → Ladle Furnace (LF) → 160 × 225 mm Billet Continuous Casting → Rolling → Heat Treatment → Product. The chemical compositions of defective samples in the steel plant were analyzed by X-ray, and the results are shown in Table 1. The internal control requirements were satisfied according to the steel standards. In order to reduce the nitrides in the continuous casting process, it was necessary to precisely control the trace elements Ti and B components to the lower limit, and the alloy was then pre-heated to prevent an increase of nitrogen in the molten steel.

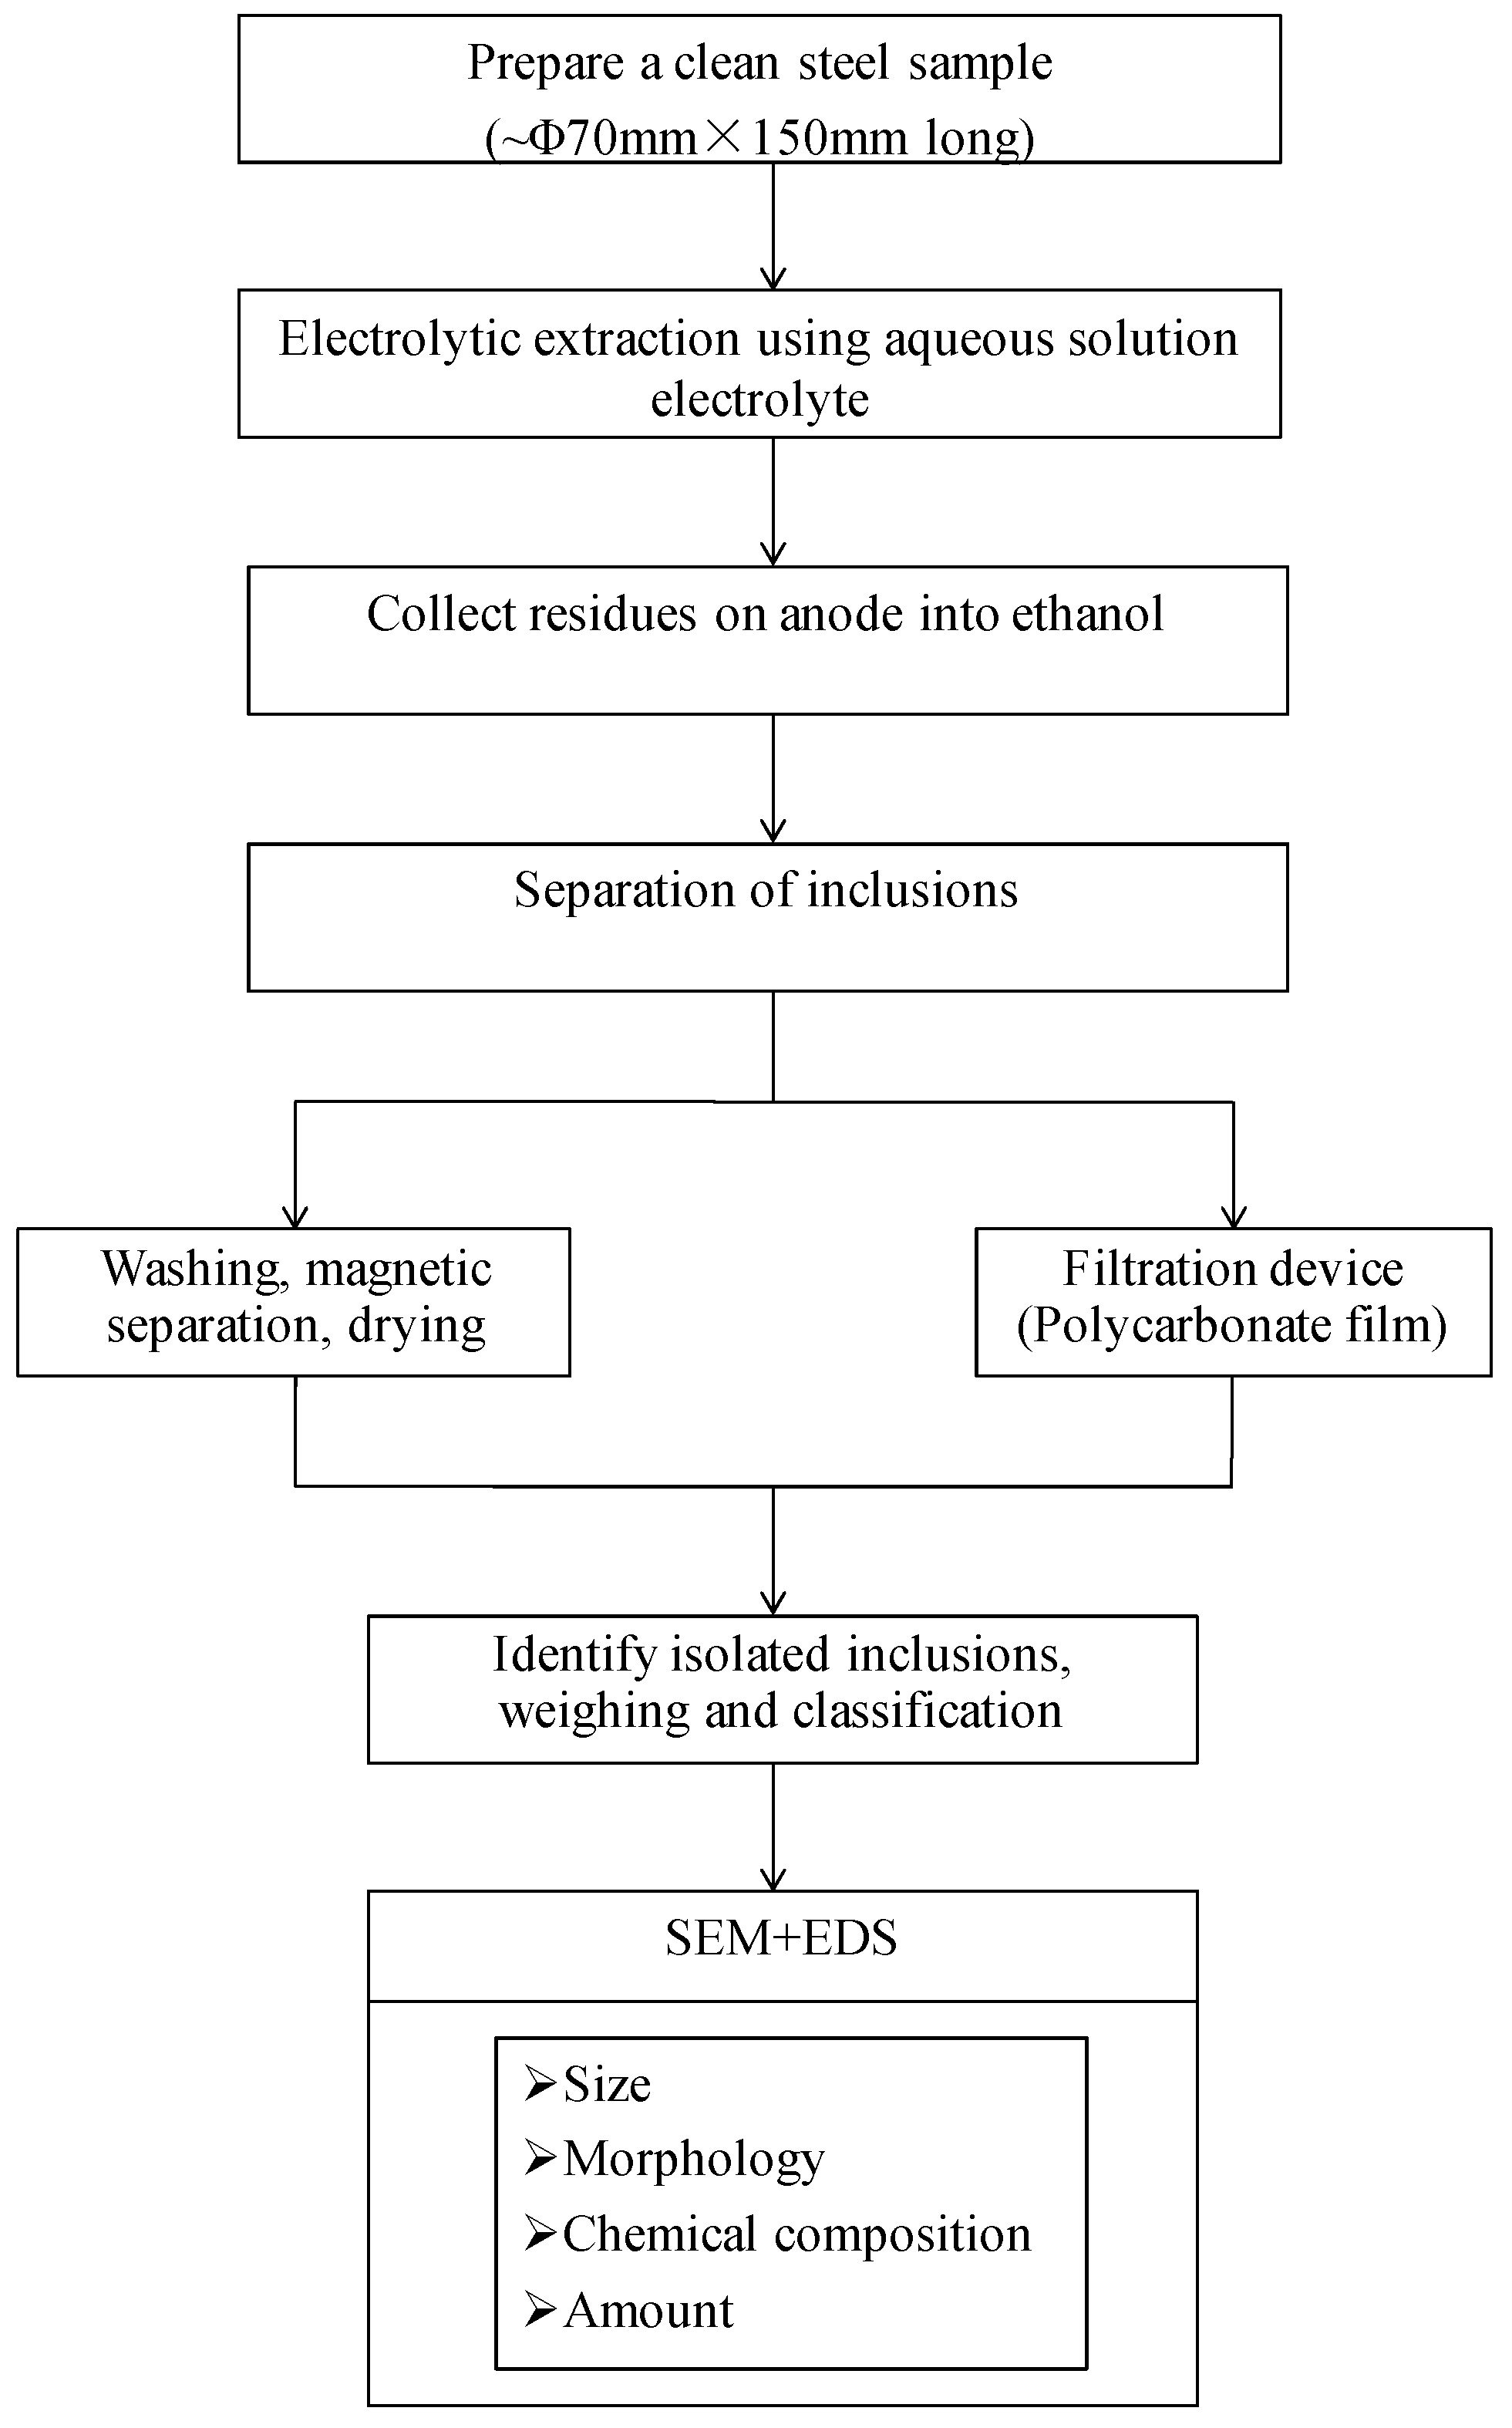
2.2. Experimental Methods

In order to study the influence of inclusions on the straightening cracks of fork flat steel, we analyzed the inclusions in steel according to two sources of inclusions—exogenous and endogenous inclusions. The research objects were 33MnCrTiB steel samples obtained from EAF production processes.
Firstly, the billets were cut and carried out the detection of large inclusions with steel sample electrolysis experiments, where mainly the types, sizes, and microstructures of exogenous inclusions were analyzed [6,7]. In this study, 33MnCrTiB samples were obtained from steel mills, which were cut and surface-cleaned to meet the sample preparation requirements for electrolysis of large inclusions. Then, a cylinder steel sample (Y) was machined as the electrolytic sample. Finally, the electrolysis experiment was carried out at the State Key Laboratory of Advanced Metallurgy in the University of Science and Technology, Beijing. The sample analysis process of large sample electrolysis is shown in Figure 1.
Then, the composition and morphology of endogenous inclusions in steel samples taken during the refining and casting processes were analyzed by the JEOL JSM-6480LV scanning electron microscope (JEOL Ltd., Akishima, Japan) with energy spectrum analysis. Finally, combined with the thermodynamic software Factsage 7.1, the slag compositions and typical inclusions in steel were effectively controlled by using the calculation and experiment results.

3. Analysis and Discussion

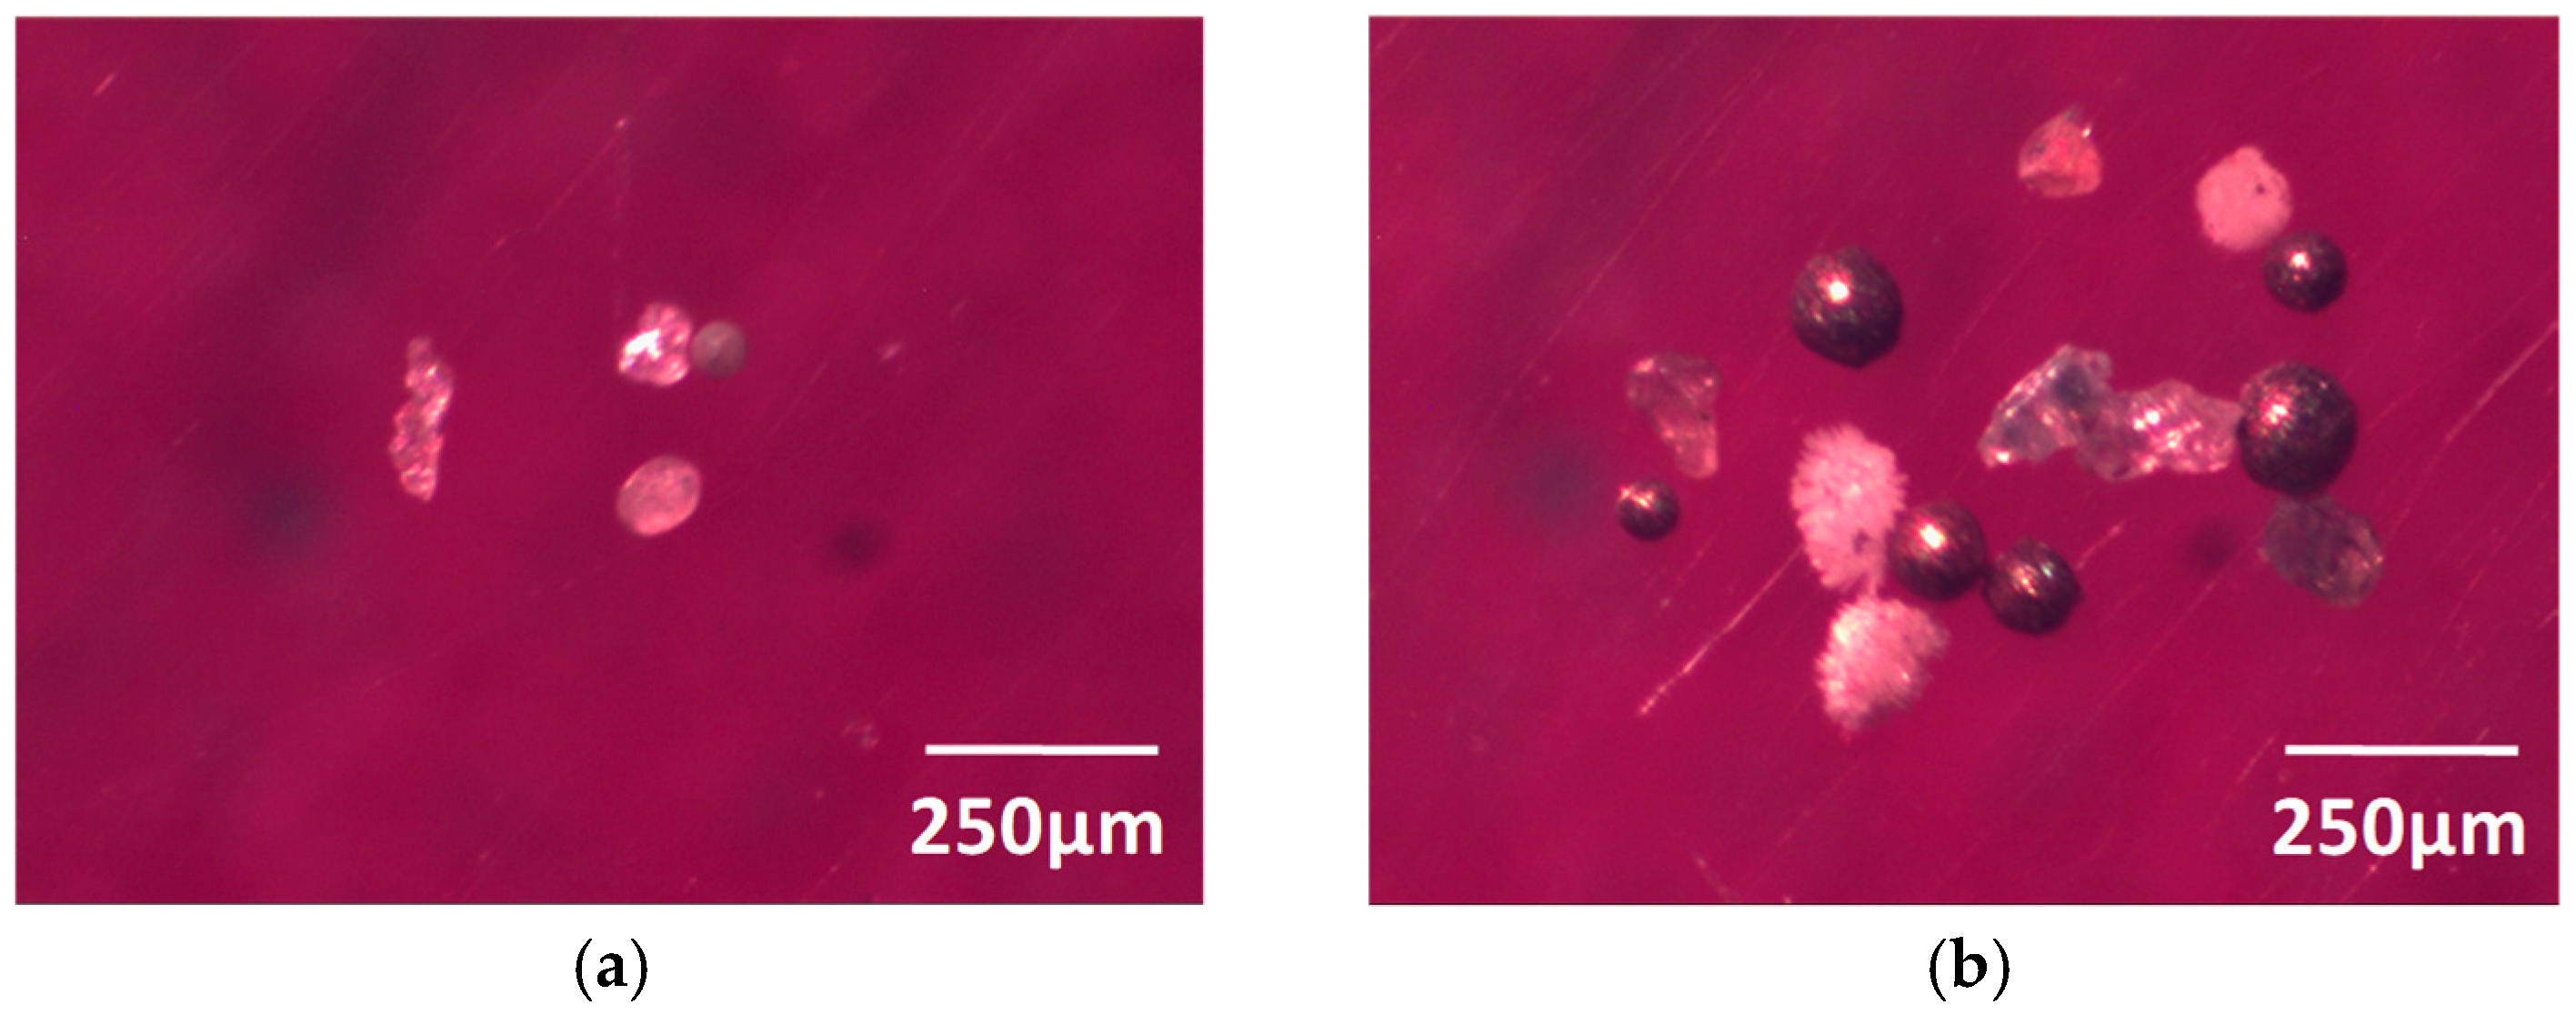
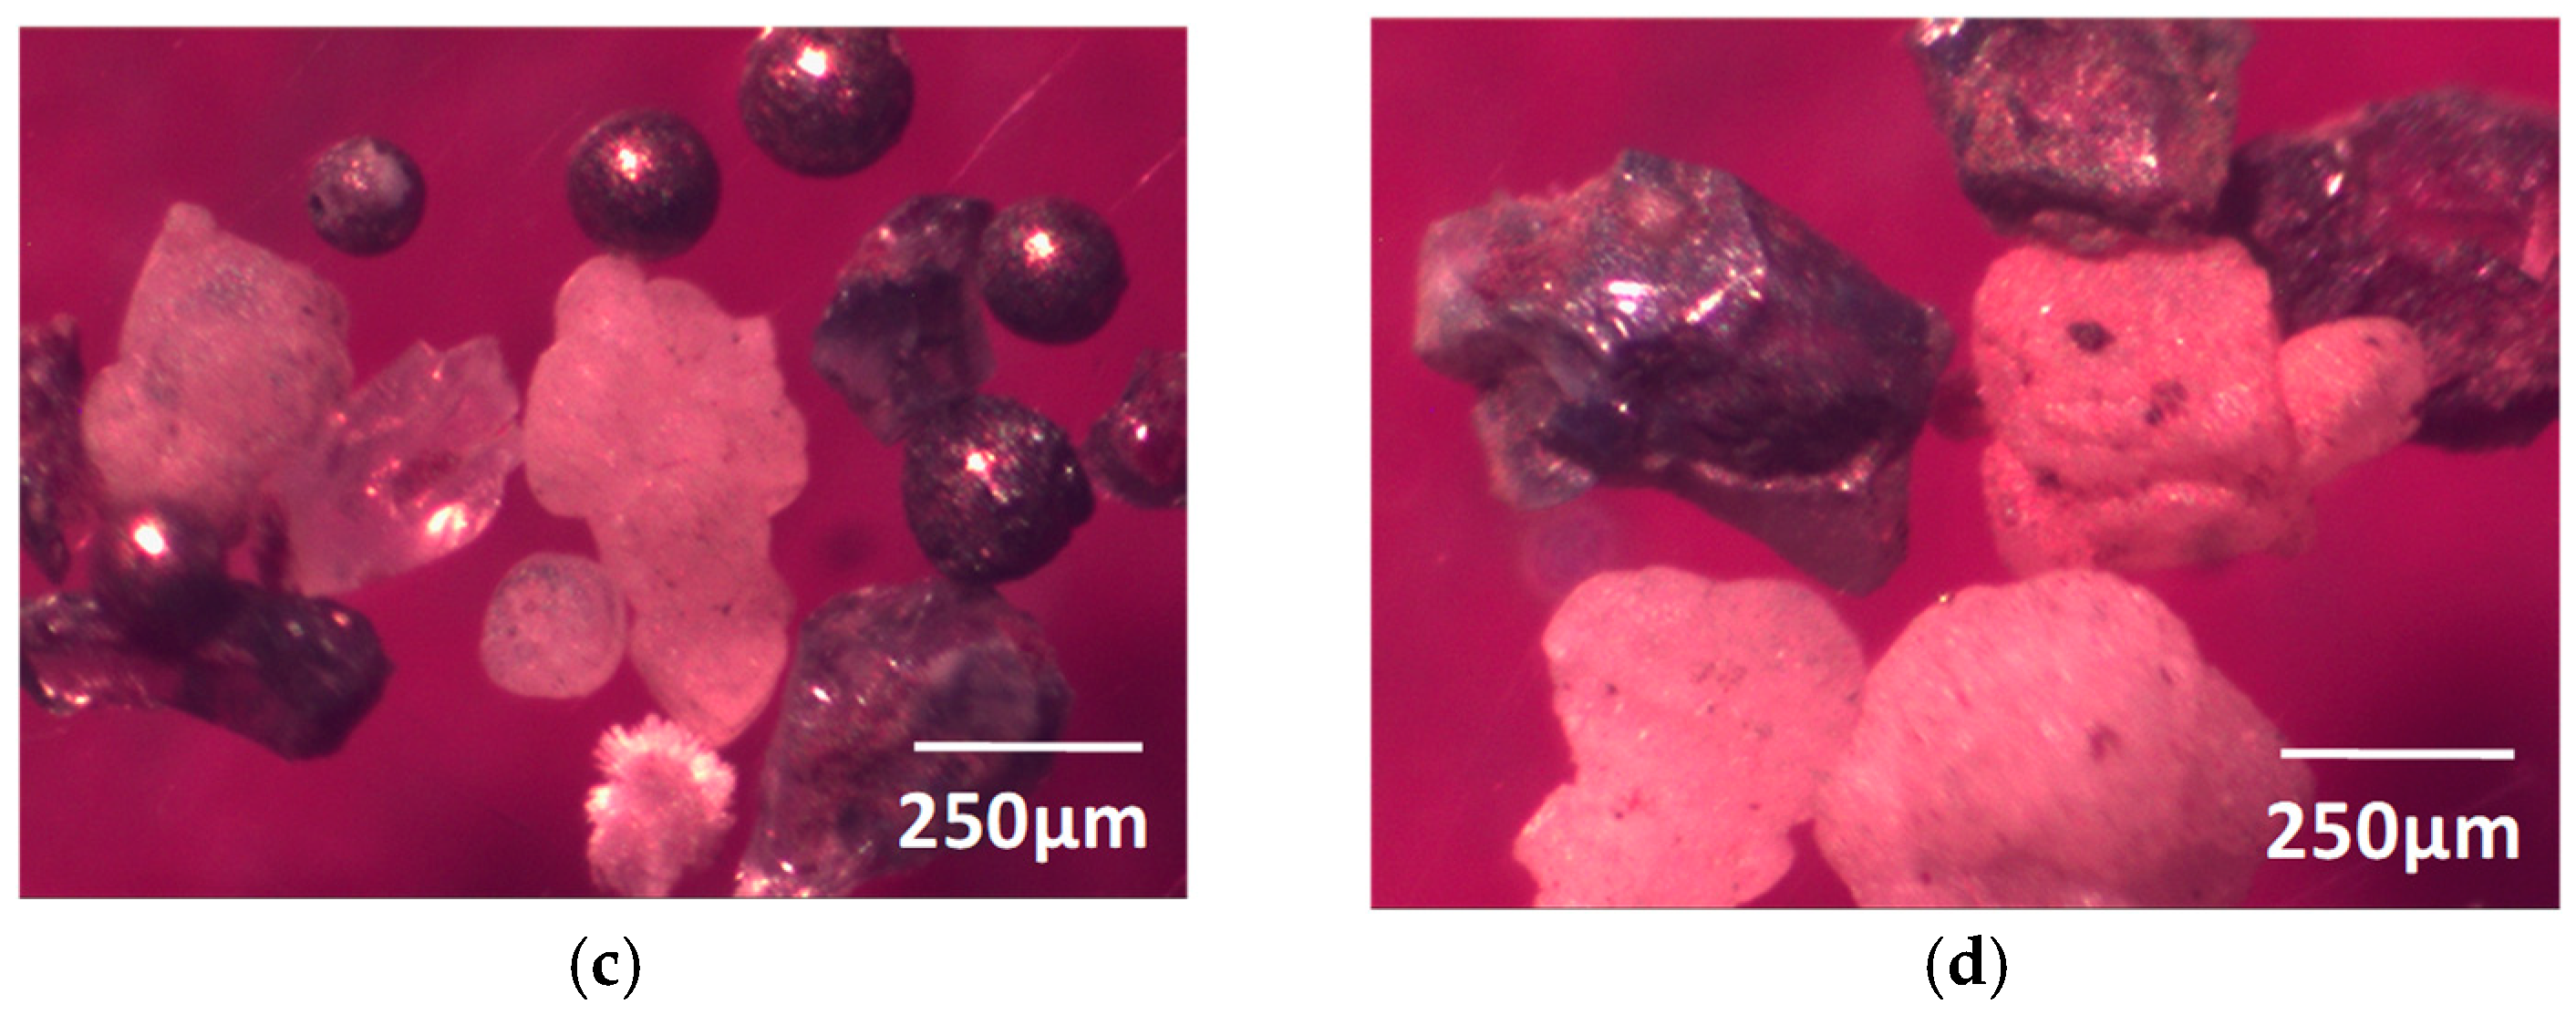
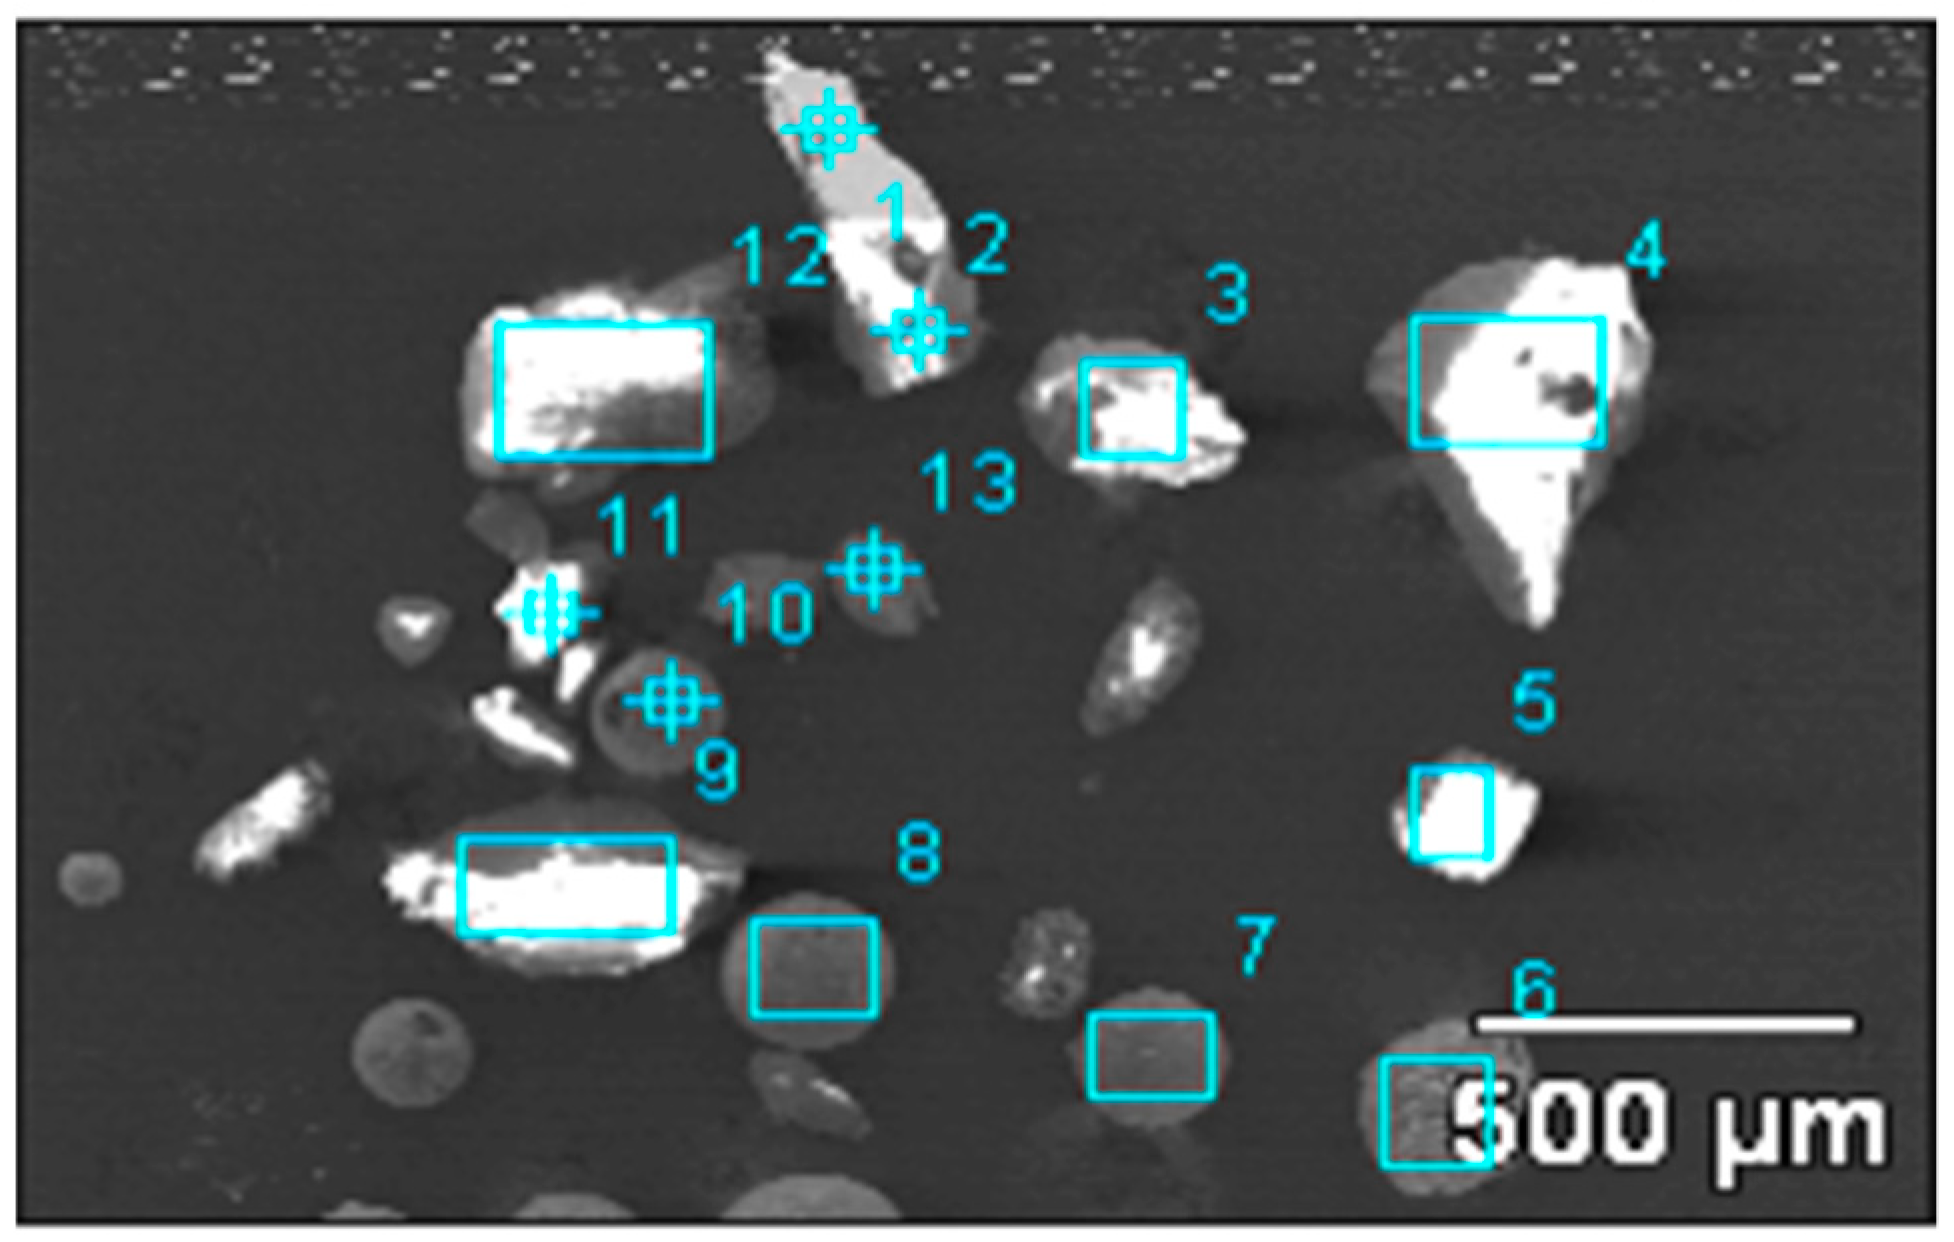
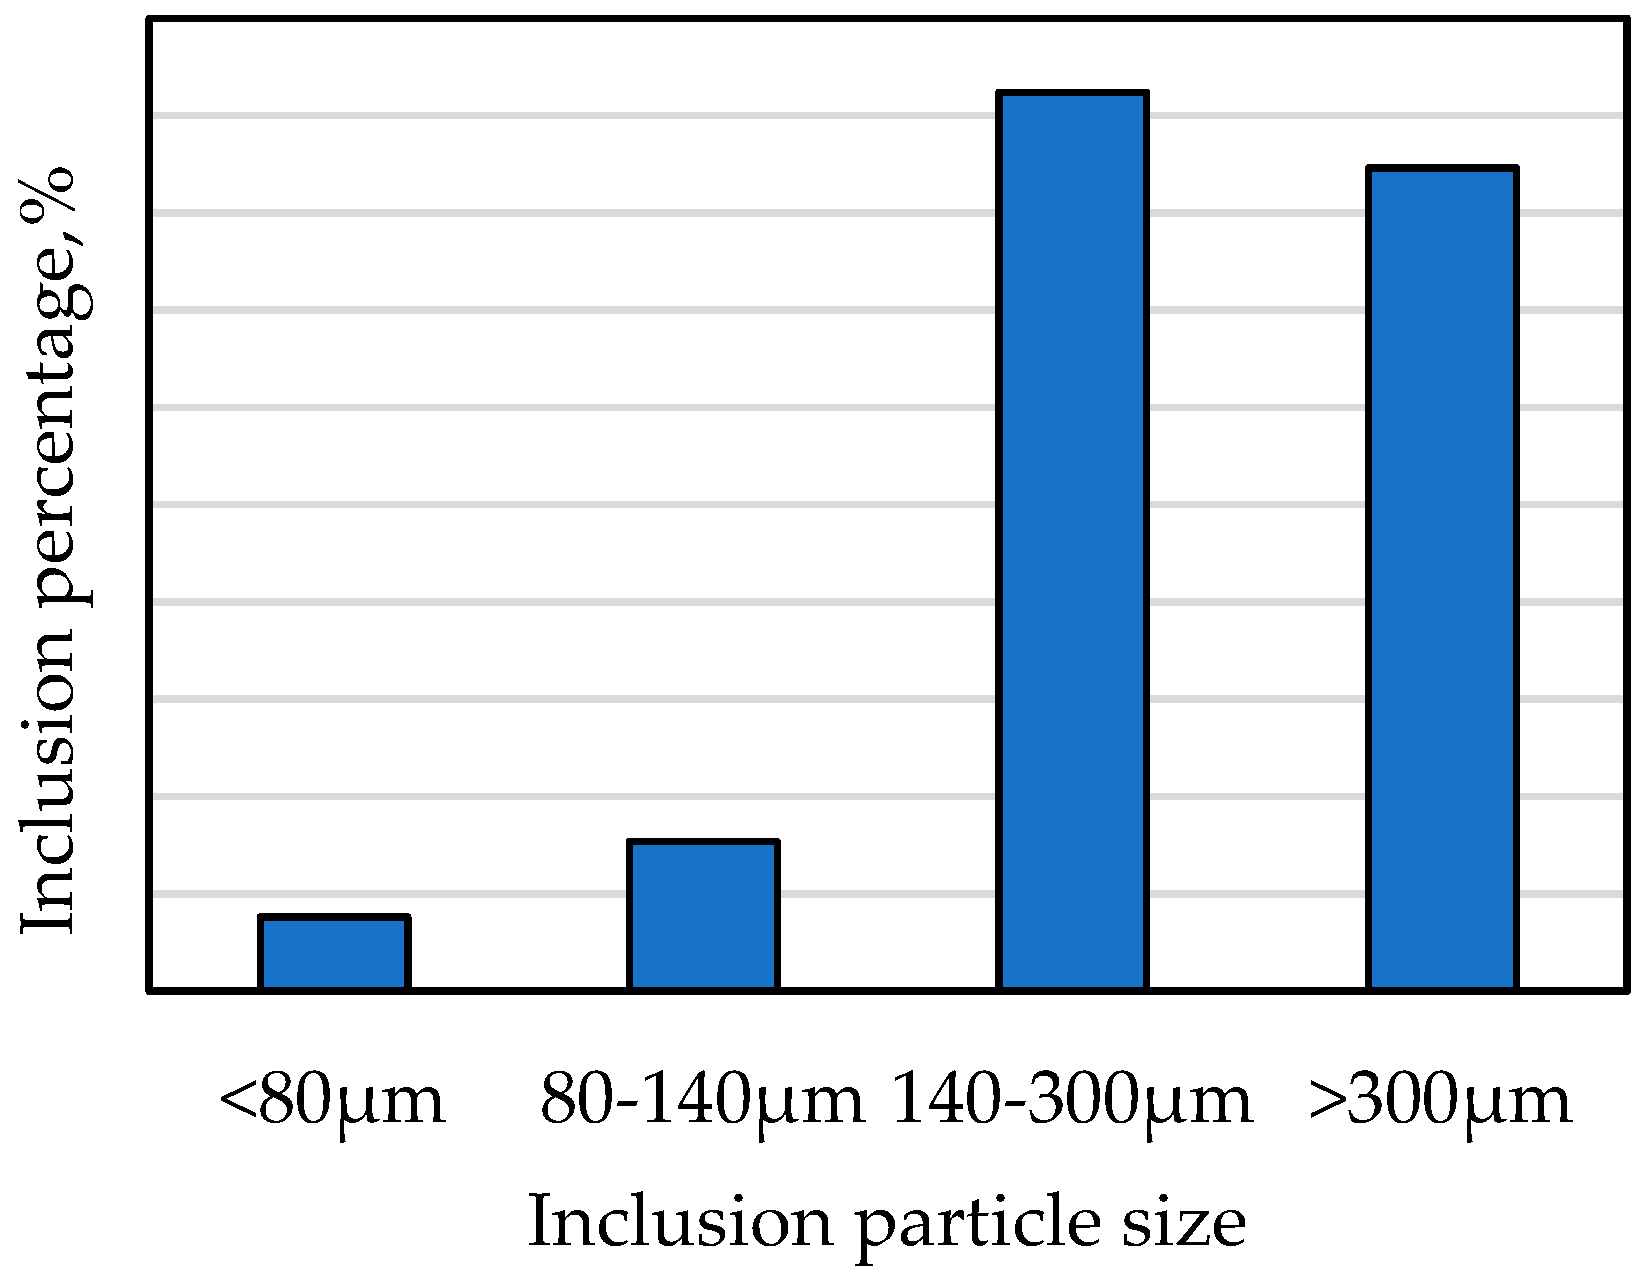
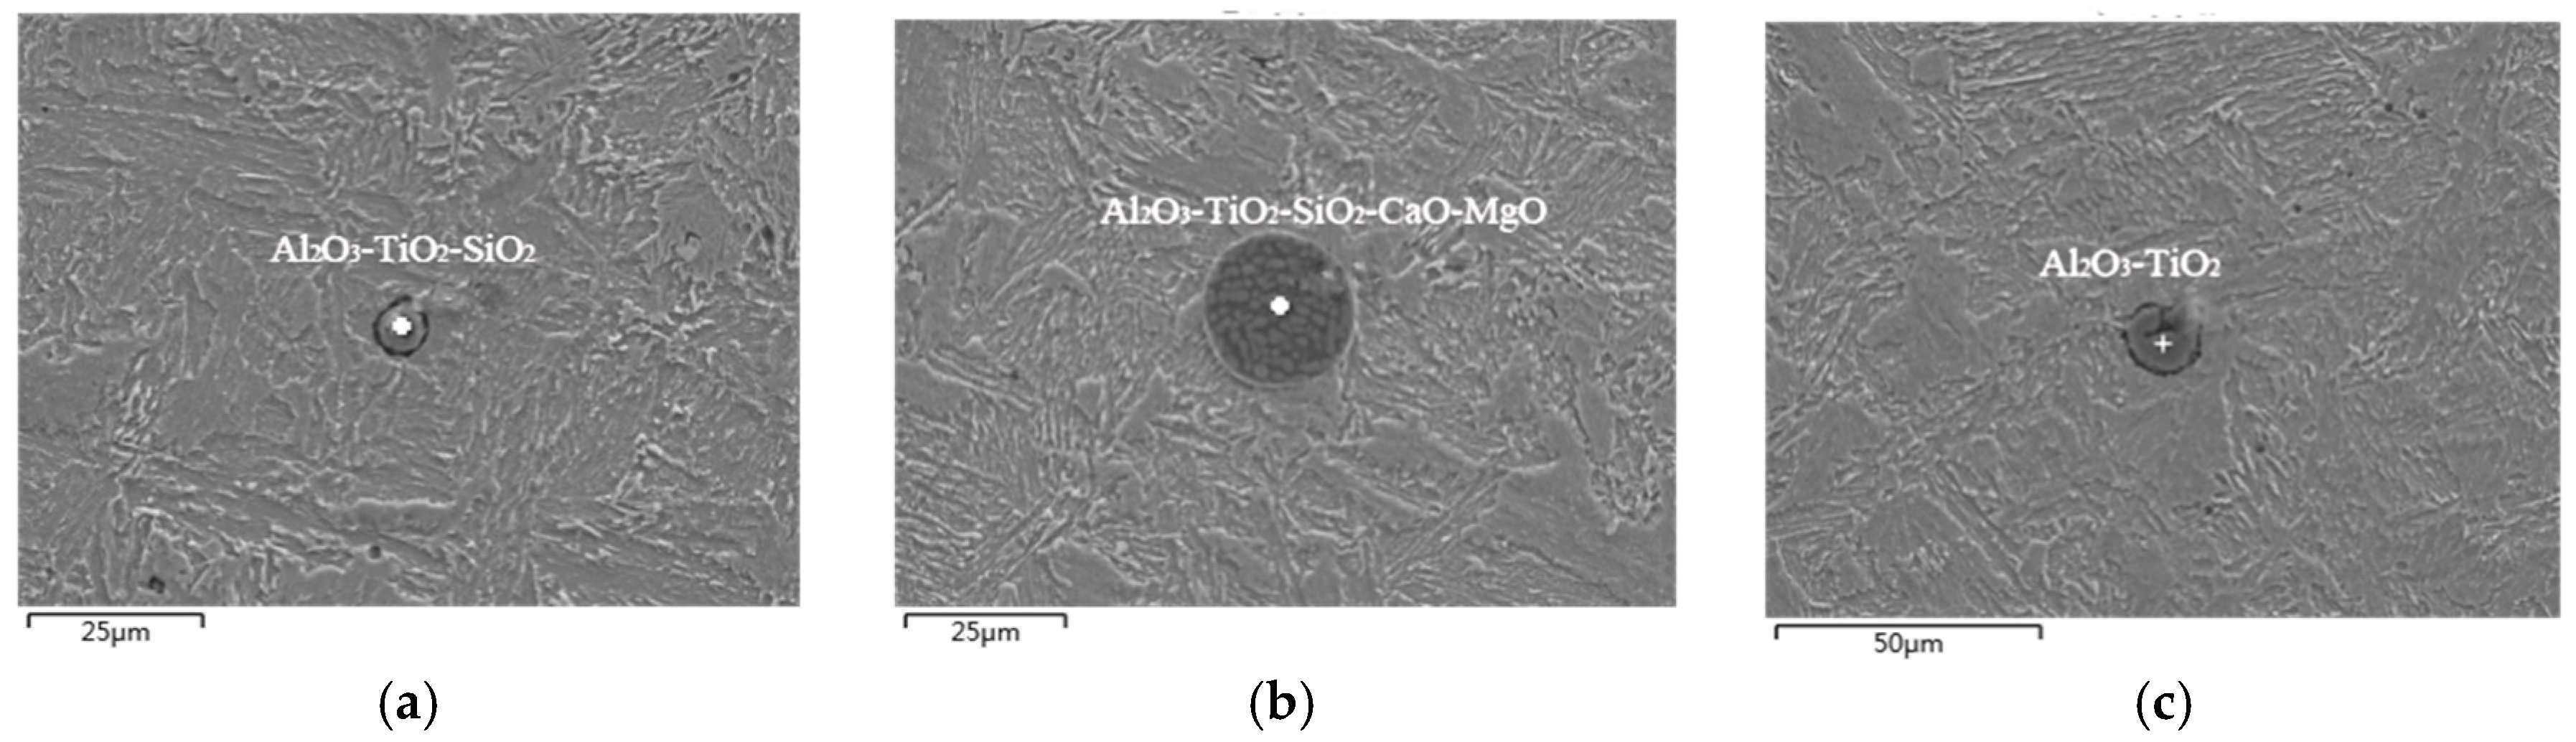
3.1. Exogenous Inclusions in Steel

The size and morphology of large inclusions was observed by SEM, respectively, and the inclusions morphology is shown in Figure 2. The types of large inclusions were analyzed by EDS, and Table 2 shows the composition of each inclusion labelled in Figure 2.
The weighting and classification of large oxide inclusions obtained after the sample electrolysis can be seen in Table 3. The total amount of inclusions is 6.21 mg/10 kg steel.
Figure 3 is the morphology of large inclusions in Sample Y, which was observed at 20× magnification. Through an observation by scanning electron microscope of Sample Y, it can be concluded that the representative inclusions in the electrolysis sample were mainly CaO-MgO-Al2O3-SiO2-TiO2, CaO-Al2O3-SiO2-TiO2, Al2O3, and CaO-Al2O3 oxides, where some quaternary inclusions also included less ZrO2, K2O, etc. There was also a small amount of sulfide inclusions, such as MnS and CuS in the sample. The size of the large inclusions was mostly more than 140 μm in Sample Y, and only small amounts were below 80 μm (Figure 4). Such large oxide inclusions are harmful to the cutting properties, weldability, and corrosion resistance of the steel, and their existence destroys the continuity of the steel matrix and affects the relevant properties of the steel [8,9]. Most of the surface defects on the steel, such as the turnover skull, scabs, concavo-convex, and cracks, are related to large oxide inclusions. The hot brittleness of the steel can be caused by sulfide inclusions in steel, and will affect the plasticity and toughness of the steel.

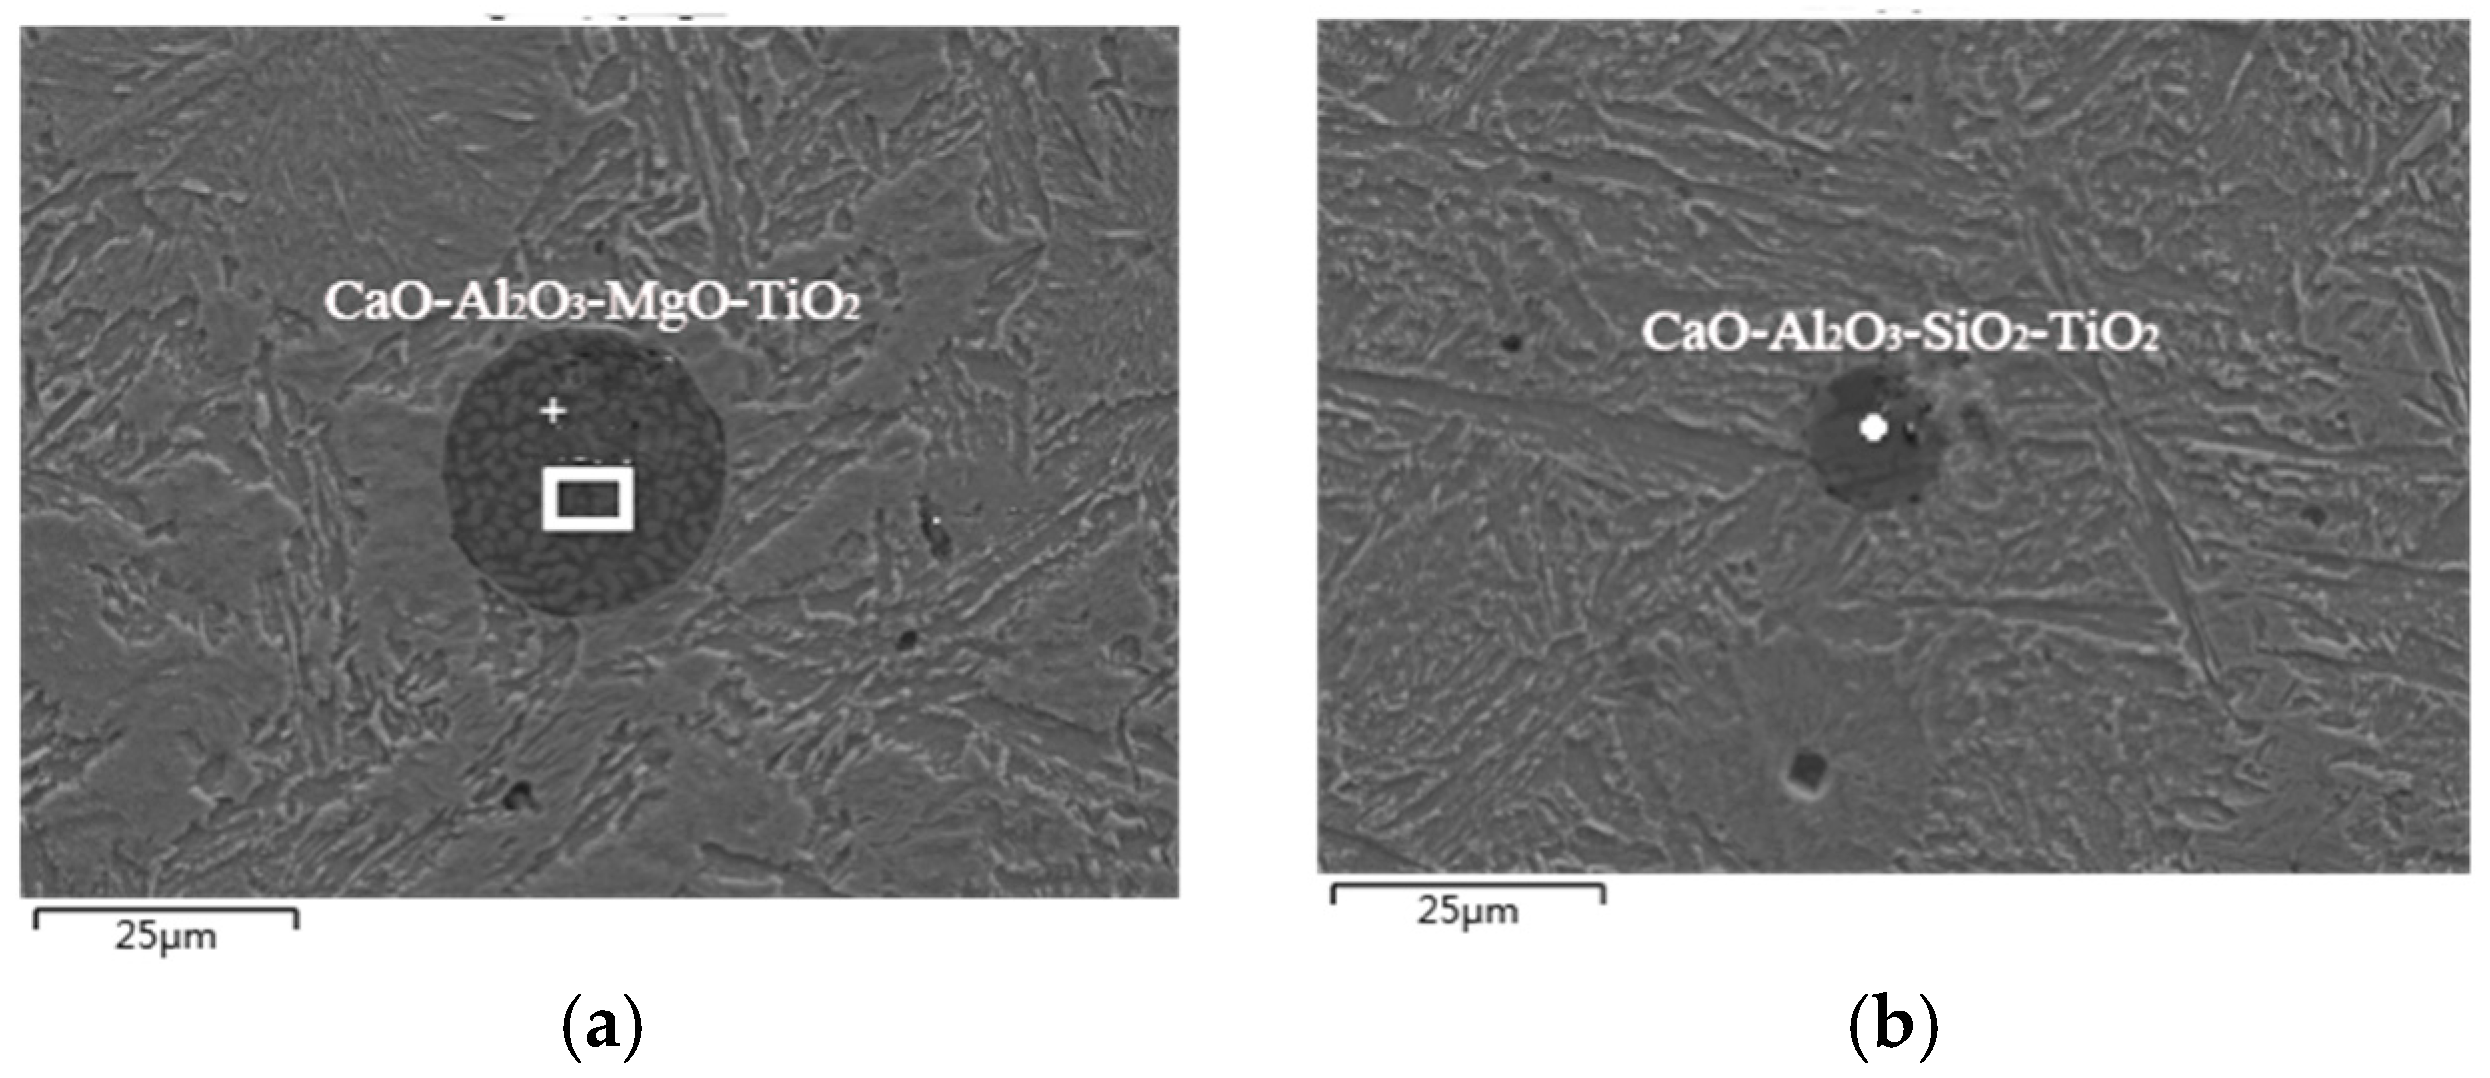
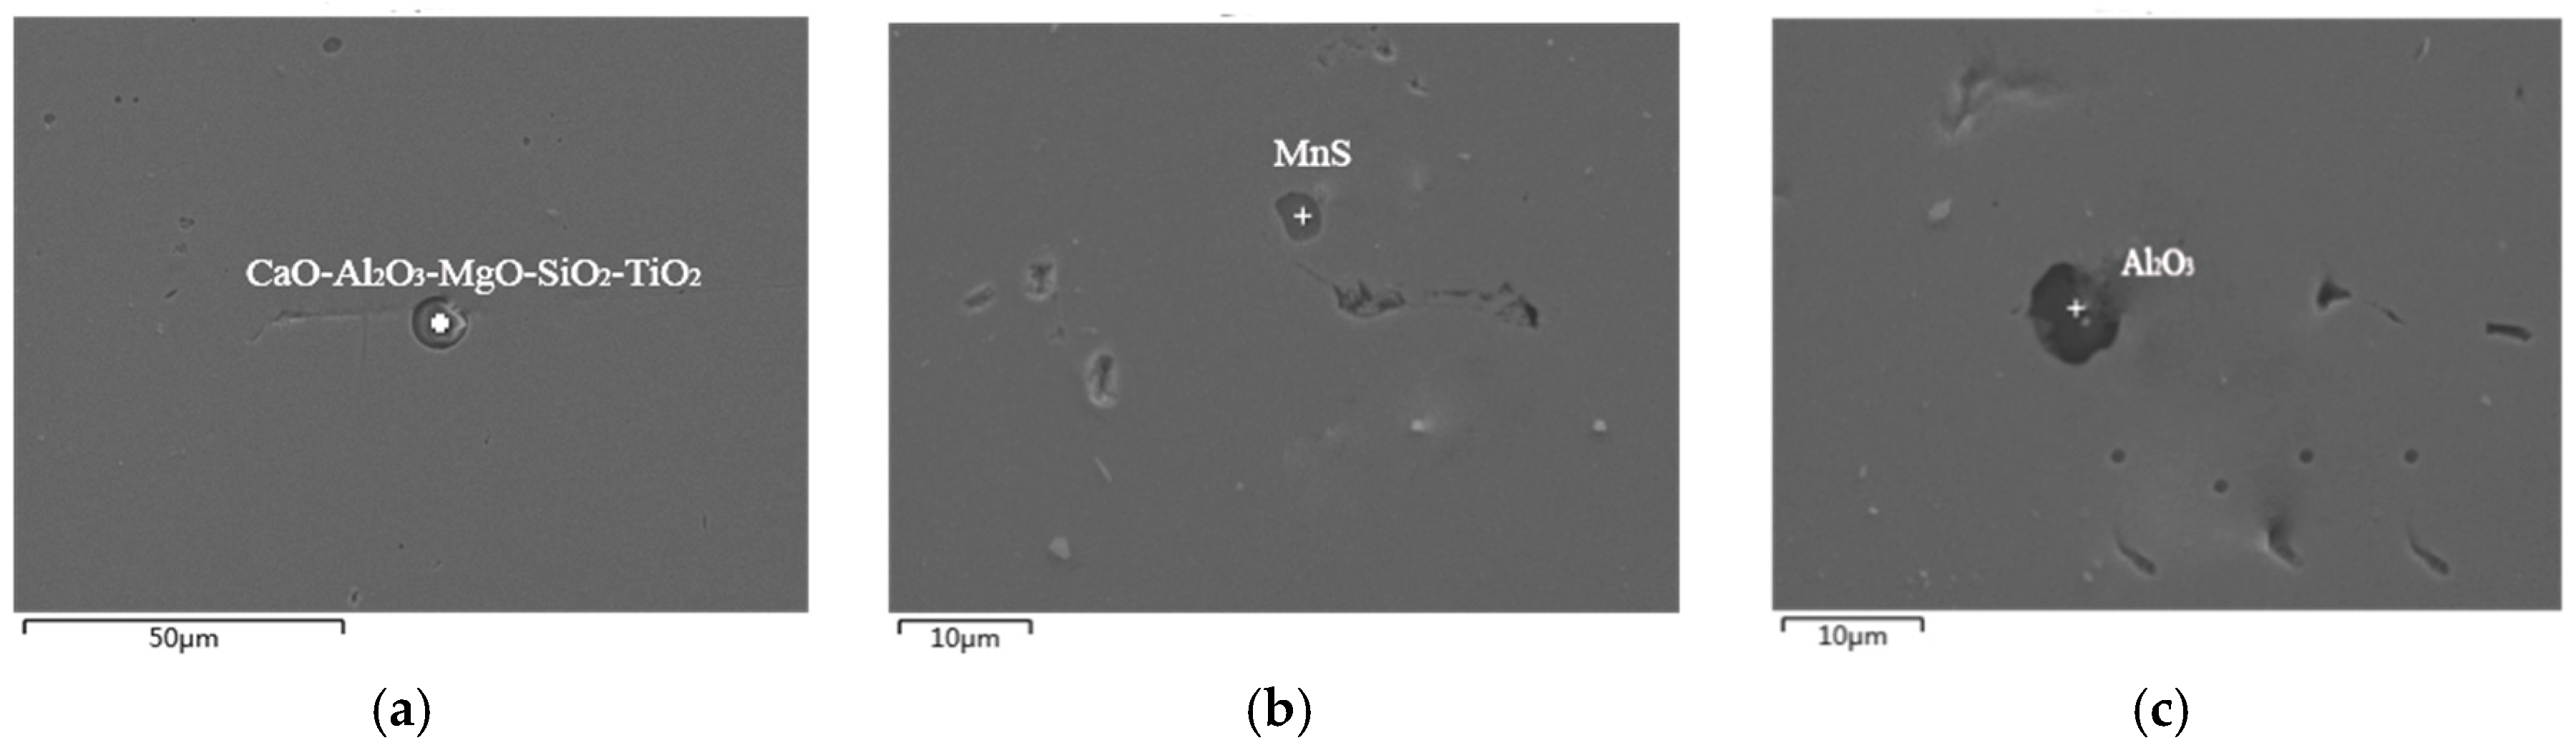
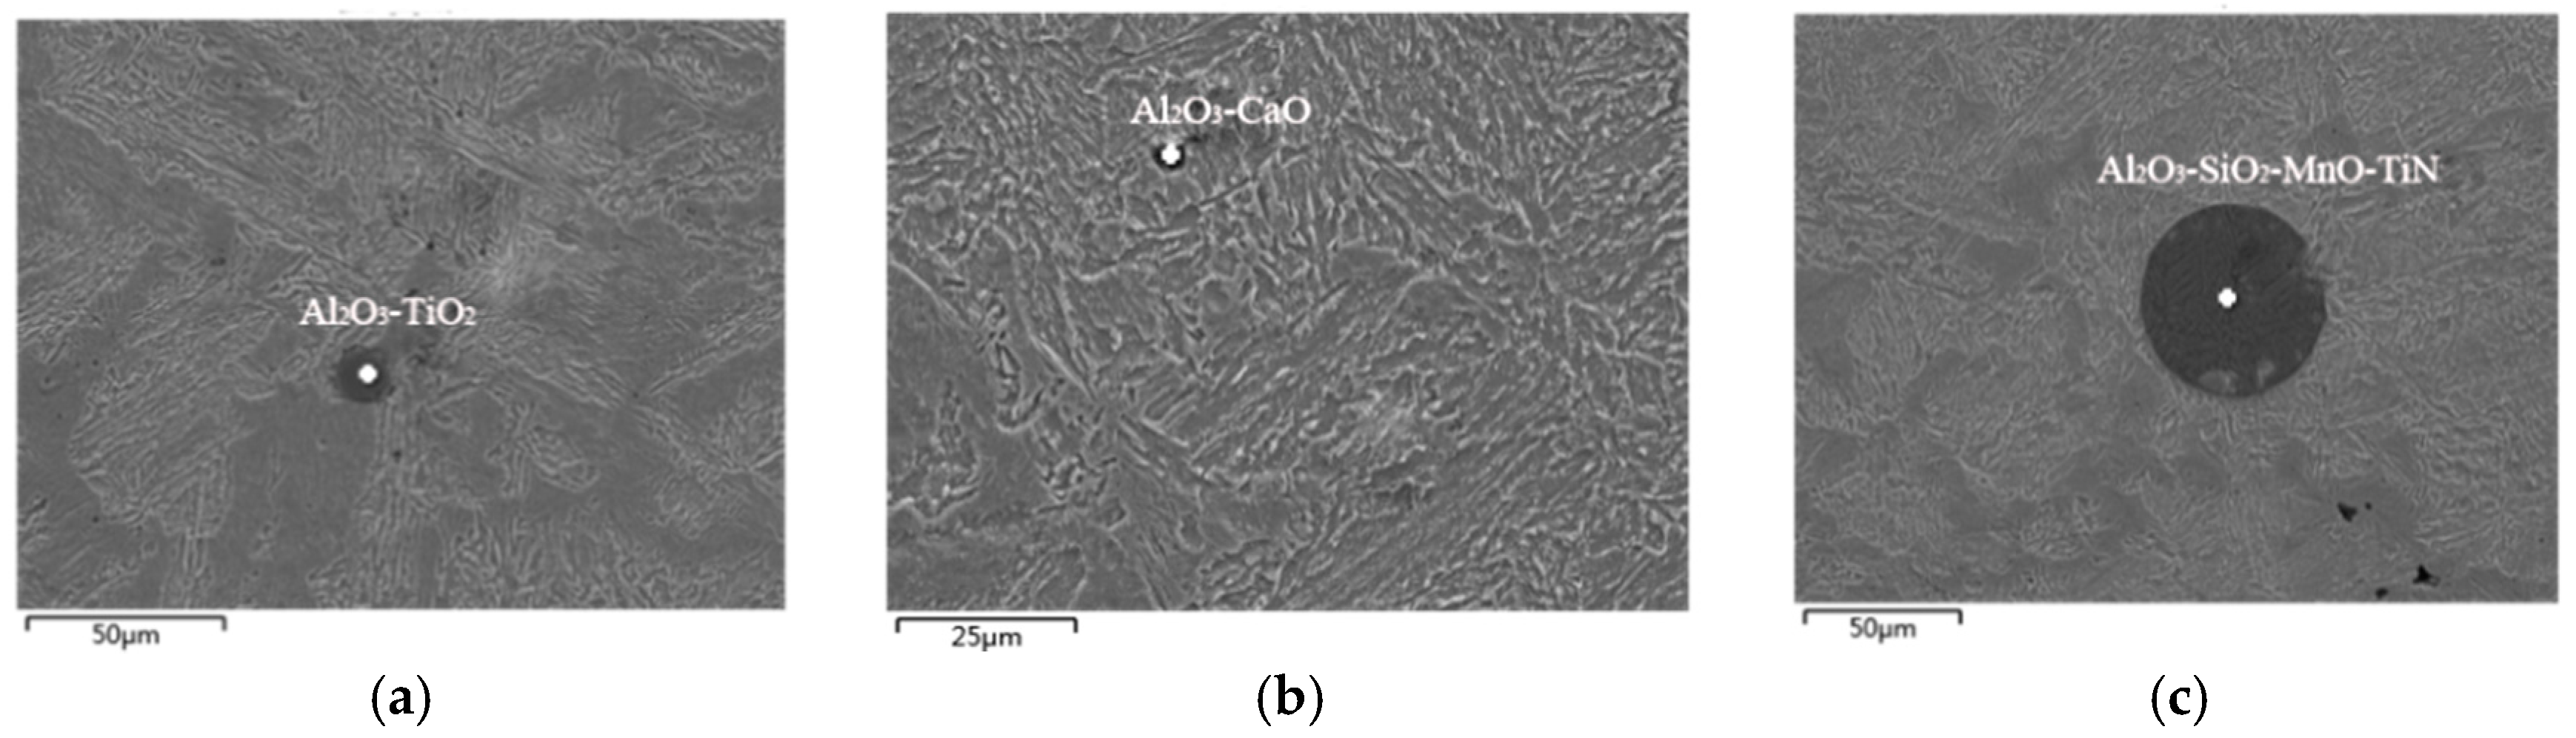
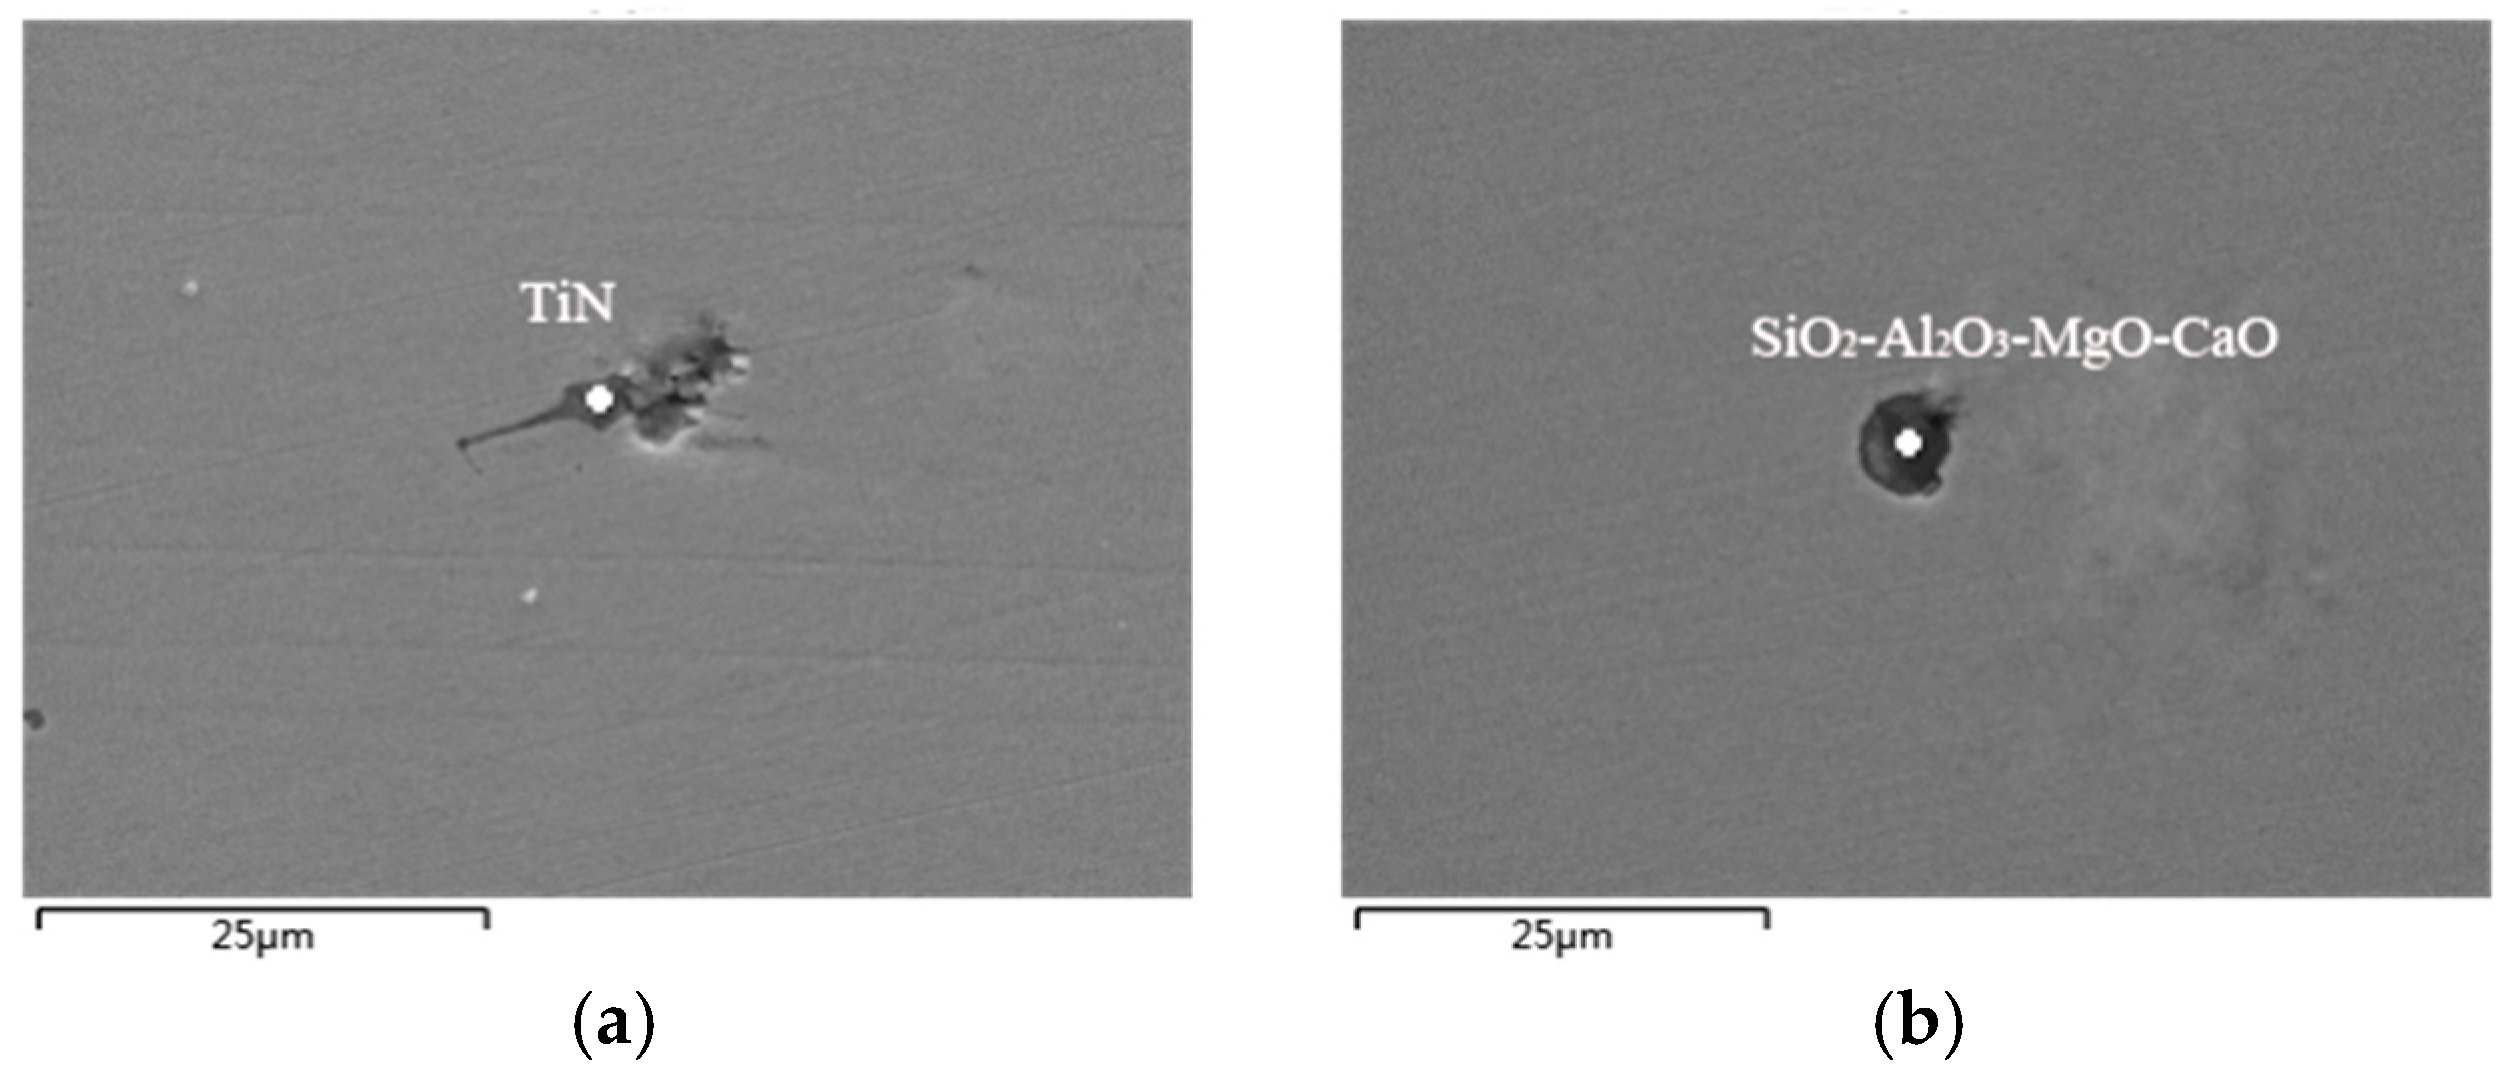
3.2. Endogenous Inclusions in Steel

The origin of endogenous inclusions is closely related to steel quality. Because such inclusion is mainly generated inside the molten steel during steelmaking or continuous casting, endogenous inclusions are more difficult to remove than exogenous inclusions. Next, to identify the components and types of inclusions in steel during the different process, the microscopic analysis of each sample was conducted separately.

3.2.1. Pre-Refining of LF Furnace

After the EAF furnace tapping, the steel samples were obtained from the ladle furnace in the steel mill, and metallographic observations were performed in the laboratory. The inclusion morphology and compositions were also analyzed by SEM and EDS. The experimental results are shown in Figure 5.
According to the analysis results of the steel sample at the beginning of LF refining, the typical inclusions in the steel sample are mainly Al2O3-TiO2, Al2O3-TiO2-SiO2, and Al2O3-TiO2-SiO2-CaO-MgO composite oxides when the ladle enters into working position; there is also a small amount of MnS wrapped around the oxide. Such inclusions mainly come from alloying deoxidation products and the top slag modifier, where they will affect the slagging function in the early stage of refining. The size range of the inclusions is relatively small, the maximum size not exceeding 25 μm and the smallest one only being about 5 μm. The welding performance, corrosion resistance, and fatigue resistance of the material will be seriously destroyed by such complex inclusions existing in the steel. However, the generation of such inclusions can be effectively reduced by the composition’s adjustment of refining slag [10].

3.2.2. Wire Feeding Process

At the end of ladle furnace refining, the steel needs to be further treated with feeding the cored wire, and the pure Ca or CaSi wire is mainly used in the wire feeding process. The metallographic observations were also conducted on steel samples from the steel plant, and SEM and EDS analyses were performed before and after the wire feeding. The inclusions morphology and compositions are shown in Figure 6 (before wire feeding) and Figure 7 (after wire feeding), respectively. The following types are the relevant experimental results in the steel after wire feeding (Ca cored wire feeding in this trial).
By analyzing the above SEM diagrams of inclusions in steel before and after wire feeding, it can be concluded that the typical inclusions in steel before wire feeding mainly include CaO-Al2O3-MgO-TiO2 and CaO-Al2O3-SiO2-TiO2 inclusions. In addition, there is also a small amount of MnO and a very small amount of sulphide, and the size of the inclusion particles is small, which is between 10 μm and 20 μm. After the wire feeding, the typical inclusions in steel are mainly Al2O3 and CaO-Al2O3-MgO-SiO2-TiO2 with a particle size below 10 μm, and there is also less MnS. Compared with the inclusions in steel before wire feeding, it was found that the TiO2 content was greatly reduced, and only a very small amount of titanium oxide was contained. Al2O3, SiO2, and other components were also reduced after wire feeding. This is because feeding Ca wire led to a significant increase in CaO content in the inclusions in steel and consequently formed large-size inclusions that were easier to float out of the steel. As a result, only a few simple inclusions remained in the steel and their sizes were also significantly reduced compared to those before wire feeding.

3.2.3. Tundish Casting Process

After the refining process, the molten steel is transferred to the tundish and mold, and it keeps casting until it is solidified into the final billet. At the same time, the steel samples taken from the tundish were subjected to metallographic and energy dispersive analysis. The results are shown in Figure 8.
Through the SEM and EDS analysis of the inclusions in the tundish, it can be shown that the main types of the inclusions in steel samples are Al2O3-CaO, Al2O3-TiO2, Al2O3-SiO2-MnO-TiN composite inclusions, and the size difference of the inclusions is huge—the larger is about 50 μm and the smaller is less than 10 μm. It is not desirable for these composite inclusions which exist in steel to be seen in actual production. They mainly come from the cooling and solidification process of continuous casting, due to the decrease in solubility and element interactions. Oxygen, nitrogen, and other impure elements dissolved in molten steel were precipitated as the compound from the liquid phase or solid solution during the cooling and solidification process, and finally, they remained in the steel to form inclusions [11]. This kind of inclusion is harmful to the welding performance, corrosion resistance, and fatigue resistance of steel. However, by analyzing the solubility product of related compounds, we can find ways to reduce the generation of such inclusions.

3.2.4. Casting Billet

After the casting flame-cutting, the fixed-length billet was obtained, and its relevant components were analyzed by scanning electron microscopy and an energy spectrum analyzer. Figure 9 shows the results of the experimental analysis.
By analyzing the SEM results of the billet, the main inclusions in the obtained slab were TiN, SiO2-Al2O3-MgO-CaO, and a small amount of TiO2 inclusions. The inclusions size is generally small, with the largest being about 25 μm and the smallest being less than 10 μm. The casting billet contains many irregular TiN, and such inclusions can easily cause fatigue fracture during the processing of the billet or rolled materials. In order to reduce the number of TiN inclusions, it is necessary to avoid the reoxidation of molten steel and reduce the precipitation amounts during the cooling and solidification process.

4. Control of Refining Slag and Precipitation Inclusions

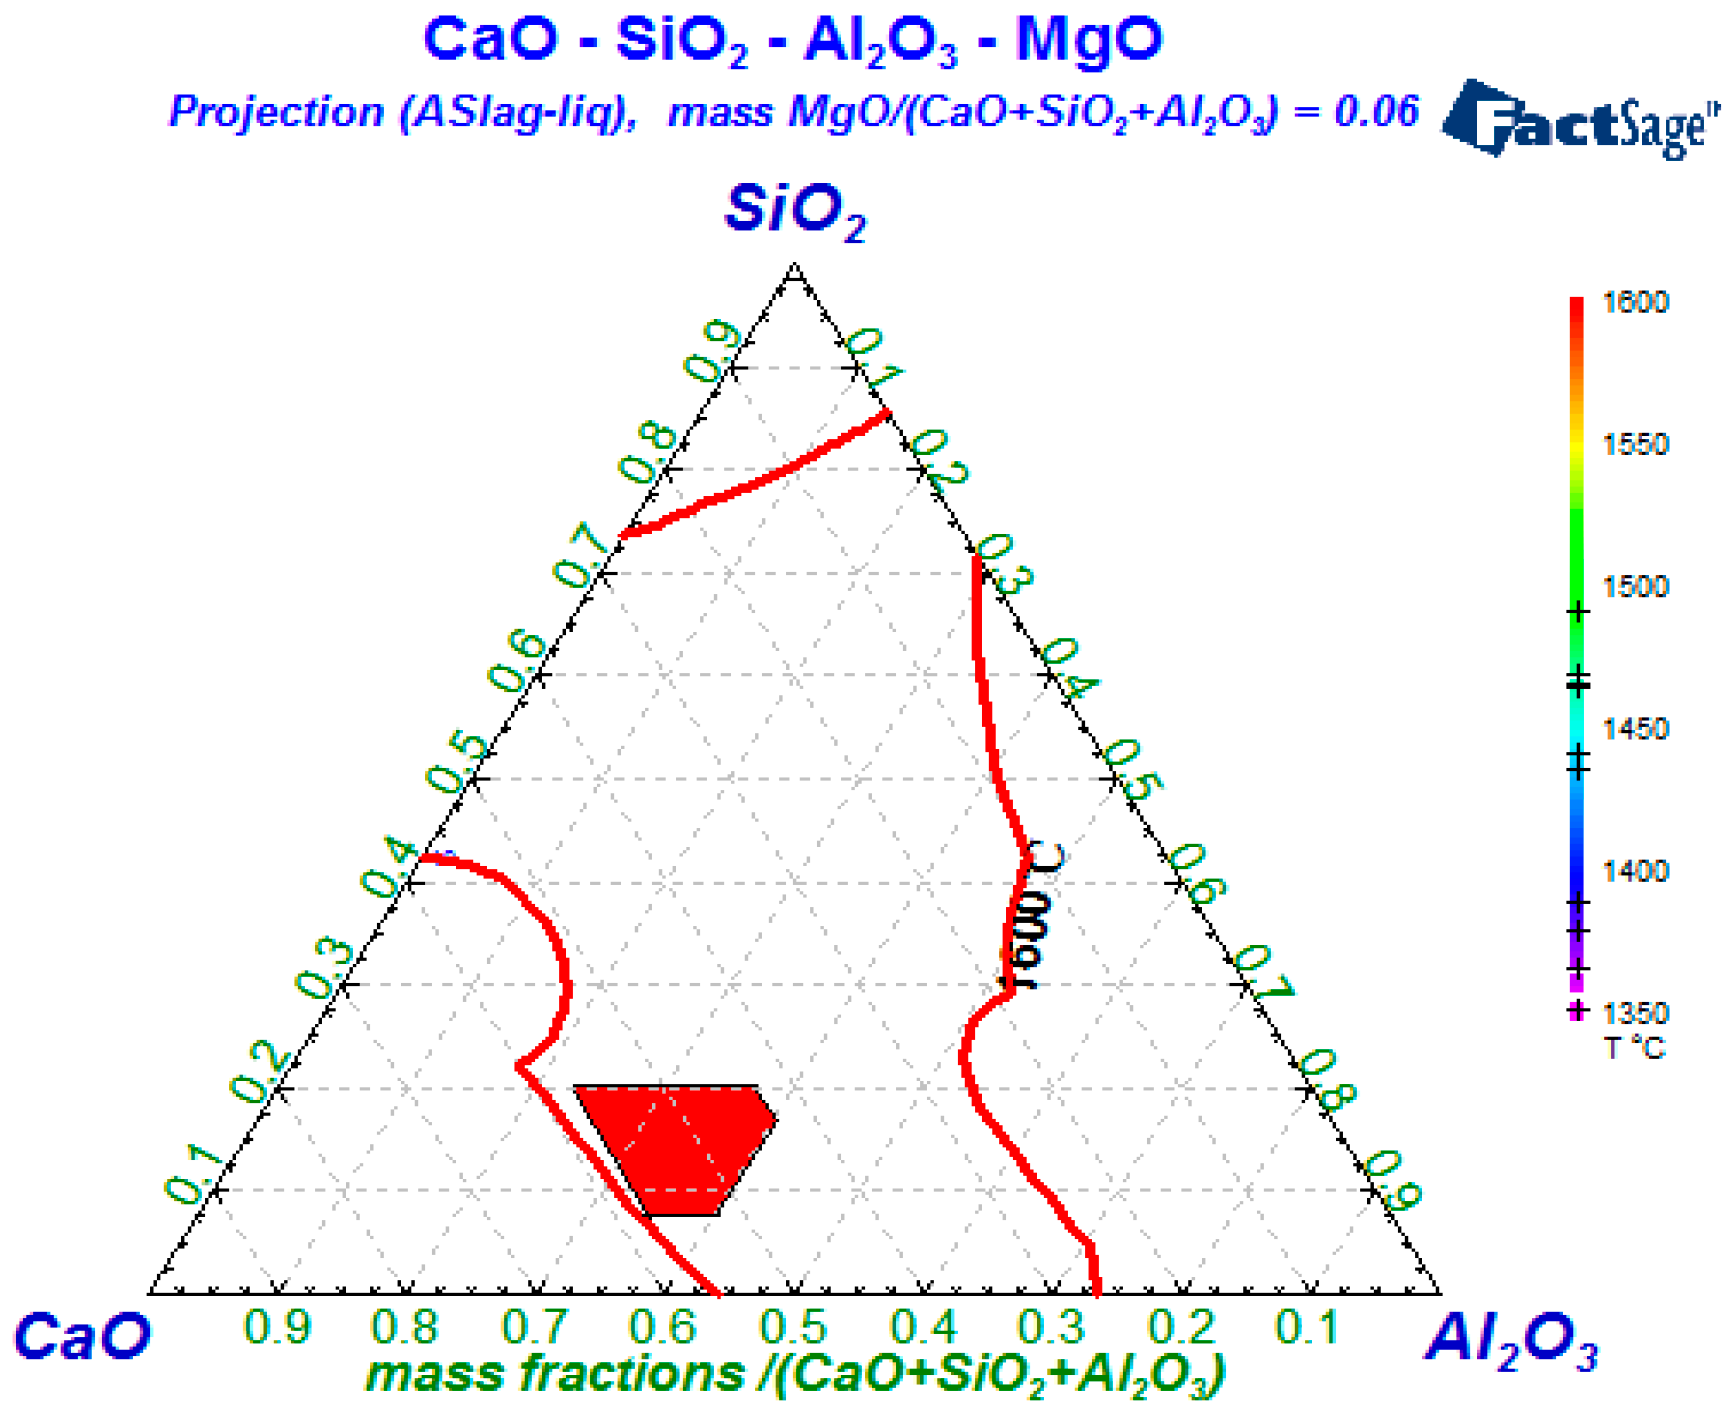
4.1. Compositions Control of Refining Slag

It can be concluded that there are mainly Al2O3 and CaO-MgO-Al2O3-SiO2 oxide inclusions in flat steel during the entire production process. Through the composition determination of the micro-inclusions, it can be concluded that the oxide inclusions in steel mainly come from the slag and deoxidation agents, so it is very important to improve the compositions of refining slag for absorbing the inclusions. In view of the reasonable composition control of final refining slag, the following four points need be followed [12,13,14]:
(1)
The melting-point of the final slag should be appropriate, i.e., lower than the temperature of molten steel at the tundish nozzle (about casting temperature −10 °C);
(2)
The refining slag should be fully reacted with the Al2O3 deoxidation product so that it can be assimilated and absorbed as much as possible. That is, the viscosity of refining slag and the initial activity of Al2O3 in the slag cannot be too large;
(3)
The slag should avoid chemical reactions with the steel, and the sulfur capacity should be as high as possible;
(4)
To ensure that the lining is not eroded by slag, the MgO content should be reduced as much as possible to reduce the melting point and viscosity of the slag. Wang et al. pointed out that the continuous increase of MgO content will reduce the saturation solubility of CaO, which will not only increase the melting point of the slag, but also reduce its desulfurization capacity when w(MgO) < 8% in the slag, its melting point and desulfurization ability are better [15]. Therefore, the MgO content is generally controlled at about 6% to 8%.
Next, the compositions of the refining slag are optimized by the thermodynamic calculations, and then the compositions of inclusions and steel can be controlled effectively due to the slag-steel balanced reaction. The following slag-steel reactions can occur during the refining process:
Steel-slag oxidation reaction: [Al] + 0.75(SiO2) = 0.5(Al2O3) + 0.75[Si]
lg K Al-Si θ = 8595.52 T 1.40
Slag-steel desulphurization reaction: 3[S] + 3(CaO) + 2[Al] = 3(CaS) + (Al2O3)
lg K CaS θ = 44 , 279 T 15.12
According to the system, the Gibbs free energy isothermal equation is ΔG = ΔG0 + RTlnJ. In the above formula, ΔG0 is the Gibbs free energy in a standard state; J is the activity ratio of the substance of above reactions under the actual condition; and R, T is the ideal gas constant and temperature, respectively. When ΔG > 0, the forward reaction is inhibited, favoring the reverse reaction; when ΔG < 0, it favors the forward reaction and the reverse reaction is inhibited; and when ΔG = 0, the chemical reaction reaches equilibrium. Therefore, the steel-slag reaction in this study needs to suppress the oxidation reaction (ΔG > 0) and promote the desulfurization reaction (ΔG < 0).
Therefore, the suppression conditions for the above two reactions at the refining temperature of 1873 K by calculation are as follows:
Inhibiting the steel-slag oxidation reaction was:
( f [ % Si ] ) 0.75 a Al 2 O 3 0.5 f Al [ % Al ] a SiO 2 0.75 > 1.55 × 10 3
Promoting the desulfurization reaction was:
a CaS 3 a Al 2 O 3 ( f S [ % S ] ) 3 ( f Al [ % Al } ) 2 a CaO 3 < 3.32 × 10 8
The activities (ai) and activity coefficients (fi) of each element in the steel can be calculated by the following formula:
a i = f i × [ % i ] ,   lg f i = e i j [ % j ]
The chemical compositions of 33MnCrTiB steel are listed in Table 1, and the element interaction coefficients ( e i j ) in liquid iron are presented in Table 4.
The activities of [%S], [%Si], and [%Al] can be calculated according to the interaction coefficients in Table 4, where aCaS should be chosen as 1 because of its pure solid state, and then the following calculation results can be drawn: For the inhibiting of steel-slag oxidation, a Al 2 O 3 0.5 a SiO 2 0.75 > 36.89 ; for the promoting of slag-steel desulfurization, a Al 2 O 3 a CaO 3 < 3.6965 .
Based on the refining data of the thermodynamic balancing calculation, the corresponding activity values and mass fractions of CaO, Al2O3, and SiO2 which satisfied the above two inequality formulas can firstly be found in the phase diagram database of Factsage; then, the mass fractions of three oxides that satisfy the preconditions are marked in the quaternary phase diagram, and it was found that most points were concentrated in one area. This red area can be seen in Figure 10. Thus, the refining slag range can be obtained, where the CaO content should be controlled in the range of 44.0% to 57.0%, the Al2O3 content between 19.5% and 40.0%, and the SiO2 content between 7.5% and 20.0%.
In addition to the above-mentioned requirements of refining slag, it is also necessary to consider the influence of its own viscosity, melting point, and other factors. Therefore, in order to fully absorb the Al2O3 in molten steel, it is necessary that the refining slag has a suitable melting point and viscosity. Previous studies [14] pointed out that the slag viscosity increases as the MgO content continues to increase, and that when 63% < w(CaO + MgO) < 65% and w(MgO) = 4%~8%, the viscosity of refining slag is the smallest (0.05~0.06 Pa·s) in the CaO-SiO2-Al2O3-MgO system. In other words, the Al2O3 assimilation and absorption ability of the slag are relatively strong. Meanwhile, the higher CaO/Al2O3 ratio in the slag should be maintained, as this will help reduce the activity of Al2O3 and improve the absorption ability of refining slag to the inclusions with high melting points.
In order to obtain a lower melting point, the three oxides’ components should be chosen in the area below 1600 °C, and the red region in Figure 10 can meet the low melting-point requirement. It is also known that when 63% < w(CaO + MgO) < 65%, the viscosity of the quaternary slag system is particularly suitable—thus, the following control range of refining slag could be obtained: the CaO/Al2O3 ratio being between 1.85 and 1.92, 7.5% < w(SiO2) < 20%, and 6% < w(MgO) < 8%.

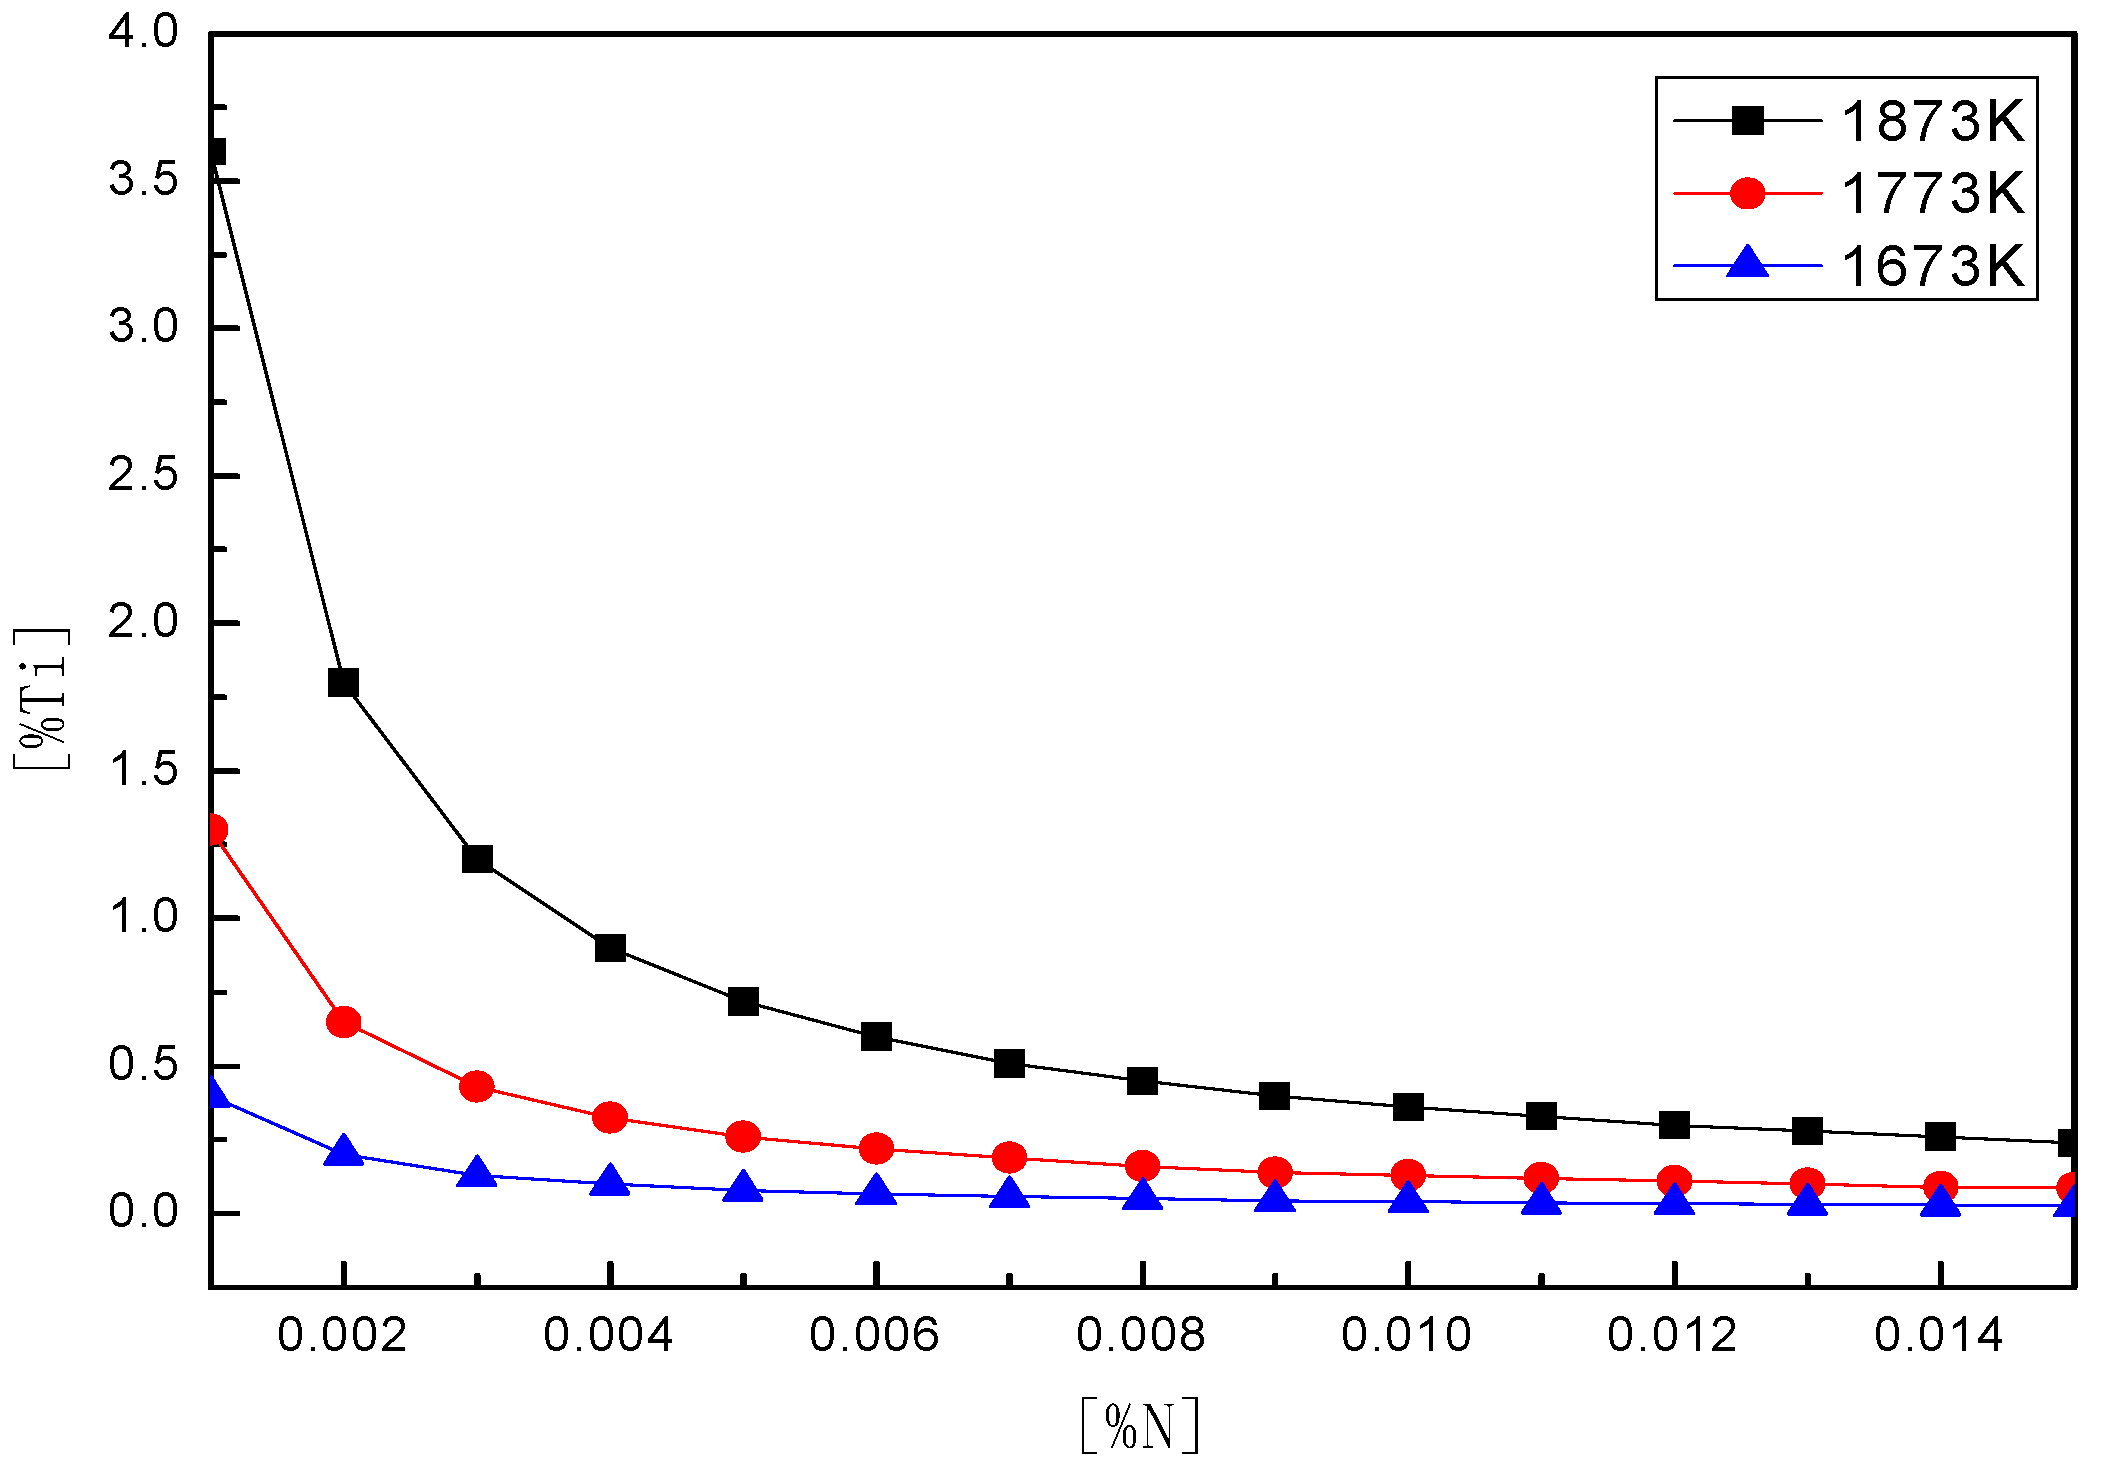
4.2. Thermodynamic Calculation of TiN Precipitations

According to the above analysis, TiN is the typical nitride and mainly formed during the cooling and solidification stage in the continuous casting process. In order to effectively reduce the amount of precipitation, the following calculations were carried out. The chemical reaction equations in molten steel are as follows [16,17]:
[ Ti ] + [ N ] = TiN ( s ) K TiN = a TiN a [ Ti ] a [ N ] = 1 f Ti [ % Ti ] f N [ % N ]
lg K TiN = Δ G θ R T / lg ( e ) = Δ G θ 2.3 R T = 291 , 000 107.91 T 2.3 R T = 15 , 217 T 5.643
The following expression of the logarithmic equation was derived:
lg f Ti + lg f N + lg ( [ % Ti ] [ % N ] ) = 5.643 15 , 217 T
It can be known from the above formulas that the equilibrium activity product of TiN inclusions is mainly affected by the temperature T of the molten steel, and the calculation formula of activity coefficients of the elements in molten steel at 1873 K can refer to Formula (5). fTi, fN are the activity coefficients of Ti and N in the molten steel, respectively, and the activity coefficients of Ti and N have the following relationship with the temperature:
lg f Ti = ( 2557 T 0.365 ) ( e Ti ( 1873 ) j [ % j ] )
lg f N = ( 3280 T 0.75 ) ( e N ( 1873 ) j [ % j ] )
From the chemical compositions of the target steel in Table 1 and the interaction coefficient data in Table 4, it can be calculated:
lg ( [ % Ti ] [ % N ] ) = 5.627 15 , 216 T
Under equilibrium conditions, the relationship between nitrogen and titanium content in molten steel under different temperature conditions is shown in Figure 11:
As shown in Figure 11, the concentration product curves of [Ti] and [N] at three different temperatures under equilibrium conditions were obtained by theoretical calculations. According to the changing trend of different temperature curves, the concentration of TiN in steel also decreases as the temperature continues to decrease. The solubility product of TiN in steel is the smallest when the temperature is 1673 K. [Ti] content in steel is known to be 0.034%, and [N] content is 0.0053%. At this time, the generation concentration of TiN is basically at the temperature curve of 1773 K. It can be concluded that when the molten steel is at 1773 K, TiN in molten steel can be precipitated in the liquid–solid two-phase region—that is, controlling the [Ti], [N] content in the steel and rapid solidification, which can effectively reduce the amount of TiN inclusions in molten steel.

5. Conclusions

According to the above analysis and calculations, the following conclusions can be drawn:
(1)
There are lots of exogenous large inclusions in the billet, including: Al2O3, CaO-Al2O3, CaO-Al2O3-SiO2-TiO2, and CaO-MgO-Al2O3-SiO2-TiO2. Such large-scale inclusions mainly come from refractory materials, mold flux, and covering slag. The large-scale inclusions can generally be removed by optimizing the flow-field of mold and tundish, and adjusting the components of metallurgy auxiliary materials.
(2)
The typical endogenous oxides in molten steel are the Al2O3 and CaO-MgO-Al2O3-SiO2 systems. The size of endogenous inclusions are smaller than that of exogenous inclusions. By optimizing the composition of top slags in the refining process, the amount of Al2O3 and CaO-MgO-Al2O3-SiO2 inclusions can be effectively reduced. According to the thermodynamic calculations, the control range of refining slag should be: CaO/Al2O3 between 1.85 and 1.92, 7.5% < w(SiO2) < 20%, and 6% < w(MgO) < 8%.
(3)
The precipitation amount of TiN could be reduced during the cooling process of continuous casting by controlling the [Ti], [N] content in steel and rapid solidification.

Author Contributions

Methodology and Investigation, Y.G. and S.Z.; Data Curation, L.M.; Funding Acquisition, S.Z. and T.Y.; Writing-Original Draft Preparation, Y.G.; Results Discussion, Writing-Review and Editing, Z.L.; Project Administration, B.Y.

Funding

The project was supported by Natural Science Foundation—Steel and Iron Foundation of Hebei Province [E2016402096, E2016402111], National Natural Science Foundation of China [51501052, 51804094] and Higher Education Teaching Reform Project of Hebei Province [2017GJJG129].

Acknowledgments

The authors would like to appreciate the support from Advanced Manufacturing and Materials Centre, University of Warwick.

Conflicts of Interest

The authors declare no conflict of interest.

References

  1. Figueiredo, M.V.; Oliveira, F.M.F.; Goncalves, J.P.M.; de Castro, P.M.S.T.; Fernandes, A.A. Fracture analysis of a heavy duty lift truck. Eng. Fail. Anal. 2001, 8, 411–421. [Google Scholar] [CrossRef]
  2. Massone, J.M.; Boeri, R.E. Failure of forklift forks. Eng. Fail. Anal. 2010, 17, 1062–1068. [Google Scholar] [CrossRef]
  3. Wang, S.L. Strength structure and manufacture of forks for forklifts. Sci. Technol. Enterp. 2016, 9, 215–217. (In Chinese) [Google Scholar]
  4. Yin, X.G.; Wang, G.; Zhang, X.H. Development of low-alloy high-strength fork flat steel. Mod. Metall. 2009, 37, 13–15. (In Chinese) [Google Scholar]
  5. Wu, X.B.; Pang, B.H.; Wang, B.H.; Zhang, L. Analysis on the development of the material for forks. Heat Treat. Tech. Equip. 2006, 27, 20–22. (In Chinese) [Google Scholar]
  6. Yoshida, Y.; Funahashi, Y. On the extraction of large inclusions in steel by slime method and classification according to the size. J. Iron Steel Inst. Jpn. 1975, 61, 2489–2500. (In Japan) [Google Scholar] [CrossRef]
  7. Tunde, I.O.; Taiwo, E.A.; Augusta, I.E. Investigation of mechanical properties and parametric optimization of the dissimilar GTAW of AISI 304 stainless steel and low carbon steel. World Eng. 2018, 15, 584–591. [Google Scholar]
  8. Boya, O.; Danjuma, Y.; Ibraheem, S.; Dagwa, I.; David, O. Effects of electrode type on the mechanical properties of weldments of some steel samples produced in Nigeria. World Eng. 2014, 11, 95–106. [Google Scholar]
  9. Li, D.Z. Non-metal Inclusions in Steel, 1st ed.; Science China Press: Beijing, China, 1983; pp. 57–76. [Google Scholar]
  10. Zhao, S.; Ge, Y.Y.; Ma, L.; Yan, T.; Lyu, J.C.; Li, Z.S. Formation analysis of edge cracks of 33MnCrTiB fork steel. Metals 2018, 8, 587. [Google Scholar] [CrossRef]
  11. Huang, X.H. Metallurgical Principle of Iron and steel, 3rd ed.; Metallurgical Industry Press: Beijing, China, 2002; pp. 23–52. (In Chinese) [Google Scholar]
  12. Wang, Q.; He, S.P. Optimization of LF refining process and slag for low carbon aluminum containing steel. J. Univ. Sci. Technol. Beijing 2007, 29, 15–17. (In Chinese) [Google Scholar]
  13. Zhao, S.; He, S.P.; Chen, G.J.; Peng, M.M.; Wang, Q. Castability of molten steel and cleanliness of slab for high strength low alloy steel without calcium treatment. Ironmaking Steelmaking 2014, 41, 153–160. [Google Scholar] [CrossRef]
  14. Cui, L.Z. Control non-metal inclusion in steel by LF refining furnace. Hebei Metall. 2010, 179, 30–31. (In Chinese) [Google Scholar]
  15. Hao, N.; Wang, X.H.; Liu, J.G.; Wang, W.J. Effect of MgO content on desulphurization of CaO-Al2O3-SiO2-MgO slag. Steelmaking 2009, 25, 16–19. (In Chinese) [Google Scholar]
  16. Yang, J.; Wang, X.H.; Gong, Z.X.; Jiang, M.; Wang, G.C.; Huang, F.X. Precipitation thermodynamics analysis and control of titanium nitride inclusions in extra- low oxygen wheel steel. J. Univ. Sci. Technol. Beijing 2010, 32, 1139–1143. (In Chinese) [Google Scholar]
  17. Kang, Y.B.; Lee, H.G. Thermodynamic analysis of Mn-depleted zone near Ti oxide inclusions for intragranular nucleation of ferrite in steel. ISIJ Int. 2010, 50, 501–508. [Google Scholar] [CrossRef]
Figure 1. Large sample electrolysis process.
Metals 09 00253 g001
Figure 2. Morphology of large inclusions in Sample Y.
Metals 09 00253 g002
Figure 3. Large inclusions in Sample Y at 20× magnification: (a) <80 µm; (b) 80~140 µm; (c) 140~300 µm; (d) >300 µm.
Metals 09 00253 g003aMetals 09 00253 g003b
Figure 4. Size distribution of inclusion particles in Sample Y.
Metals 09 00253 g004
Figure 5. Types and compositions analysis of inclusions at the beginning of refining (Ladle Furnace (LF)). (a) Al2O3-TiO2-SiO2; (b) Al2O3-TiO2-SiO2-CaO-MgO; (c) Al2O3-TiO2.
Metals 09 00253 g005
Figure 6. SEM and EDS analysis of inclusions before wire feeding. (a) CaO-Al2O3-MgO-TiO2; (b) CaO-Al2O3-SiO2-TiO2.
Metals 09 00253 g006
Figure 7. SEM and EDS analysis of inclusions after wire feeding. (a) CaO-Al2O3-MgO-SiO2-TiO2; (b) MnS; (c) Al2O3.
Metals 09 00253 g007
Figure 8. SEM and EDS analysis of inclusions in tundish. (a) Al2O3-TiO2; (b) Al2O3-CaO; (c) Al2O3-SiO2-MnO-TiN.
Metals 09 00253 g008
Figure 9. SEM and EDS analysis of inclusions in the casting billet. (a) TiN; (b) SiO2-Al2O3-MgO-CaO.
Metals 09 00253 g009
Figure 10. T = 1873 K, quaternary phase diagram of CaO-SiO2-Al2O3-6%MgO slag.
Metals 09 00253 g010
Figure 11. [Ti] and [N]-balanced concentrations in molten steel under different temperatures.
Metals 09 00253 g011
Table 1. Chemical compositions of 33MnCrTiB, wt %.
CSiMnPSCrAlTiB
0.330.261.360.0110.0050.400.0090.0340.0013
0.30–0.350.17–0.371.25–1.50≤0.035≤0.0350.30–0.60-≥0.0150.0005–0.0030
Table 2. Analysis results of inclusions compositions in Figure 2, wt %.
No.OMgAlSiSKCaTiCrMnFeCuZr
150.851.3312.7623.22-3.223.051.850.52-3.2--
260.39-22.583.21--5.031.71--7.09--
350.120.8523.3312.08-1.623.873.06--5.09--
445.98-34.437.55-0.980.952.310.51-7.28--
560.89-21.22.61--9.83---5.46--
620.852.037.181.031.11-6.036.563.465.0146.74--
729.428.624.960.782.15-11.1612.71--7.782.45-
824.453.4725.240.86--18.218.15--2.19-7.44
948.79-51.21----------
1014.141.0923.223.565.47-32.2714.55--5.7--
1144.09-55.91----------
1260.67-20.78---10.03---8.52--
1342.75-32.08---25.17------
Table 3. Analysis results of large inclusions in steel.
SampleOriginal WeightRemaining WeightElectrolytic WeightTotal InclusionsInclusion Particle Size Classification, µm
<8080~140140~300>300
kgkgkgmgmg/10 kgmgmgmgmg
Y4.4380.2514.1782.606.210.100.201.201.10
Table 4. First-order interaction coefficients in liquid iron at 1873 K.
e i j AlBCCuNiNMnHPSSiTiCr
e Al j 0.05-0.090.01-−0.1-0.24-0.030.01--
e S j 0.040.130.11000.01−0.0260.120.0300.06−0.1−0.011
e Si j 0.060.20.180.010.010.090.0020.640.110.060.11-−0.0003
e Ti j --−0.165--−1.80.0043-−0.0064−0.110.050.0130.055
e N j −0.30.0940.130.0090.010−0.021-0.0450.0070.047−0.53−0.047

