Article

A Hierarchical Multiscale Modeling Investigation on the Behavior of Microtextured Regions in Ti-6242 α/β Processing

Department of Civil and Environmental Engineering, University of Tennessee, Knoxville, TN 37996, USA
*
Author to whom correspondence should be addressed.
Metals 2019, 9(2), 233; https://doi.org/10.3390/met9020233
Submission received: 15 December 2018 / Revised: 30 January 2019 / Accepted: 6 February 2019 / Published: 15 February 2019
(This article belongs to the Special Issue Titanium Alloys: Processing and Properties)

Abstract

:
Ti-6242 is a near alpha titanium alloy, which has excellent high-temperature creep resistance and is widely used in jet engine compressors. This alloy is susceptible to creep fatigue failure under dwell loading below 473 K. The existence of microtextured regions (MTRs) contributes significantly to this fast crack propagation. Mechanical processing in the alpha + beta region has been employed to eliminate MTRs, but the efficiency depends significantly on the applied strain path. Previous investigations based on crystal plasticity finite element (CPFE) simulations have demonstrated the relationship between breakdown efficiency and loading direction. Therein, MTRs with regular geometry and pure initial orientation were used to isolate the effect of loading direction from initial microstructure. In this paper, the behavior of MTRs with realistic initial microstructure was investigated using a hierarchical multiscale modeling framework, and the microscale results were analyzed in detail to understand the behavior of MTRs under different loading conditions. It was shown that a hierarchical multiscale model with realistic initial microstructure at the microscale can reflect the influences from different strain paths, initial orientation distributions, and positions of the region simultaneously. The combined effect of initial orientation distribution and loading direction on the MTR breakdown efficiency is discussed in detail.

1. Introduction

Near alpha titanium alloy Ti-6242 (Ti–6Al–2Sn–4Zr–2Mo) is widely used as a primary structural material in high-pressure compressors of aircraft gas-turbine engines due to its high specific strength and excellent high-temperature creep resistance [1]. However, this alloy often suffers from reduced dwell fatigue resistance below 473 K, which is the so-called dwell debit. One major reason for this behavior is the propagation of cracks through α particles with similar orientations, in particular small faceted cracks that link up to form a “quasi-cleavage” surface [2]. Early work [3] has shown that α p particles are refined after α / β processing, but similarly oriented α p particles are still clustered together. These α particles form so-called microtextured regions (MTR) that consist of neighboring α p particles with a similarly oriented c axis. In post-mortem observations, it was found that facets cluster along the fracture surface within the MTR [4], and cracks propagate orders of magnitude faster along the basal plane of the MTRs compared with traditional fatigue cracks. In another study, the different dwell fatigue behavior between Ti-6242 and Ti-6246 was explained by the lower slip system activation energy Δ F induced higher strain rate sensitivity in Ti-6242. Due to this rate sensitivity differences, larger creep strain accumulates in soft-oriented grains of Ti-6242 under dwell fatigue loading, which increases the stiffness contrast between soft grains and hard grains [5]. In order to improve the dwell fatigue performance of Ti-6242, α / β processing is used to eliminate MTRs, but the effect depends significantly on the strain path [6,7], the morphology of the MTRs [8], and the position of the MTRs within the billet [9]. Such effects have not been quantified experimentally, mainly due to their coupled nature and the extensive experiments required to uncover their relative role.
An increasing number of studies have been performed recently on texture evolution during α / β processing based on mesoscale crystal plasticity simulations. For example, the spatial distribution of β α transformation was studied experimentally and computationally [10]. However, only limited research has been performed on the evolution of clustered α p particles under different processing conditions. The viscoplastic self-consistent (VPSC) method was employed to investigate the relationship between microtexture and macrotexture in Ti–6Al–4V [11]. In another study [12], the evolution of MTRs under different processing conditions was investigated using the crystal plasticity finite element method, and an optimal strain path was determined to effectively eliminate MTRs. Idealized MTRs consisting of two ellipsoid α phase regions embedded in a uniformly textured matrix were employed, and all α p particles were assumed to have identical initial orientation. Such idealized MTRs only achieved a qualitative comparison against the experimental measurement, and multiscale modeling with distributed initial microstructure is required to achieve a better comparison and prediction.
This paper extends the previous work by considering the distributed nature of α p particles within MTRs to more precisely capture the morphology evolution of MTRs under different strain paths. Specifically, the initial orientation distribution and particle size distribution of α p particles were extracted from the billet material [13]. These distributions were further employed to generate a statistically equivalent representative volume element (RVE) for the microscale problem of a hierarchical multiscale modeling framework. The strain histories from selected material points in the mesoscale simulations were imposed as boundary conditions onto microscale models of clustered α p particles, and the sharpening or softening of the texture was compared to the initial orientations. The morphology evolution and misorientation distribution of the α p particles were analyzed in detail.
This paper is organized as follows: In Section 2, the numerical simulation setup is briefly summarized, including the material model, generation of statistically equivalent microstructure, and high-temperature compression experiment. The hierarchical multiscale modeling framework is also described in detail. In Section 3, the influence of distributed initial microstructure and the position effect on the MTR breakdown efficiency is presented and discussed in detail, followed by concluding remarks in Section 4.

2. Crystal Plasticity Model and Simulation Setup

It was shown previously that the extended Voce constitutive model captures the highly anisotropic behavior and strain softening response of Ti-6242 observed at 1172 K [12]. These crystal plasticity constitutive equations and corresponding material parameters are first briefly summarized. The crystal plasticity material model was implemented in the open-source finite element software WARP3D [14]. More focus is placed on generating a statistically equivalent representative volume element (RVE) for the billet material based on the experimental measurement [15]. Then, a hierarchical multiscale modeling framework is introduced, where models of clustered α p particles with representative microtexture are subjected to various strain histories from 1172 K mesoscale simulations. Lastly, the high-temperature compression experiment [13] is briefly summarized, which motivates the current investigation.

2.1. Titanium Crystal Plasticity Model Calibration

In crystal plasticity (CP) theory, plastic strains arise from the motion of dislocations along preferential slip systems, where b ( s ) is the slip direction within slip system ( s ) , and n ( s ) is the unit normal of the slip plane. Ti-6242 contains α phase, which is hexagonal close packed (HCP) and β phase which is body-centered cubic (BCC), and the volume percentage of α phase is about 75% at 1172 K. The reduced symmetry of the HCP lattice gives rise to dislocation motion along slip systems with highly disparate resistances.
In the RVE, only α phase material model is used based on the following considerations. First, the volume percentage of α phase is about 75% at the processing temperature [15]; thus, it is assumed that α phase controls the microstructure evolution. Second, α p particles are usually embedded in a small fraction of the β matrix, and the high stiffness contrast between α p particles and β matrix introduces numerical issues. Additionally, we focused on the interaction between two adjacent α p particles and the misorientation evolution within each region in conjunction with [12]. Therefore, the pure α simulation was assumed to be representative of the billet material, and at the same time, it avoids numerical issues.
The Voce model was adopted for the α phase to relate the plastic slip rates γ ˙ ( s ) , the resolved applied shear stress τ ( s ) = b ( s ) σ n ( s ) , and the critical slip resistance g ( s ) [16]. The slip rate γ ˙ ( s ) on each slip system s was taken as a power law expression involving the resolved shear stress τ ( s ) and the slip resistance g ( s ) :
γ ˙ ( s ) = γ ˙ 0 ( s ) τ ( s ) g ( s ) 1 / m sign τ ( s ) , g ˙ ( i ) = i = 1 n s l i p h ( i j ) γ ˙ ( j ) = i = 1 n s l i p q ( i j ) h ( j ) γ ˙ ( j ) ,
where γ ˙ 0 ( s ) is a reference strain rate and m is a constant exponent.The slip resistance evolution is expressed through a combination of self hardening and latent hardening:
h ( j ) = h 0 ( j ) 1 g ( j ) g s ( j ) sign 1 g ( j ) g s ( j ) , g s ( j ) = g ˜ ( j ) γ ˙ ( j ) γ ˙ 0 n .
Strain softening is observed above 1172 K, and the material parameters of the model were calibrated accordingly using a homogenized iso-strain finite element model [12]. Three slip system families were considered: basal 11 2 ¯ 0 { 0001 } , prismatic 11 2 ¯ 0 { 10 1 ¯ 0 } , and 1st order pyramidal 11 2 ¯ 3 { 10 1 ¯ 0 } . The ratio of slip system strengths was held fixed at 1 : 0.67 : 3.0 according to the material response measured by Semiatin and Bieler [8]. The previously calibrated material parameters are listed in Table 1 and Table 2. The units of g ˜ ( j ) , h 0 ( j ) , and g 0 ( j ) are MPa; the other parameters are unitless. The transversely isotropic elastic constants were adjusted from the room temperature values in [16] to match the bulk stress–strain curve at higher temperature [13] while maintaining their relative ratio.

2.2. Statistically Equivalent Microstructure

A statistically equivalent representative volume element (RVE) was generated as the microscale model for hierarchical multiscale modeling. The initial orientation distribution and α p particle size distribution were prescribed from typically observed texture components in Ti-6242 [15,17,18]. An equivalent orientation distribution function (ODF) was calculated based on the EBSD (electron backscatter diffraction) measurement using the open source software MTEX [19]. The input texture was a 1.0 × intensity fiber plus a 1.5 × intensity unimodal component each with 7.5 degree half-width. Figure 1 compares the pole intensity and bandwidth of the ODF. Then, the initial orientation of all the α p particles in the microscale finite element model are instantiated from the simulated ODF to reflect particular microtexture components of the billet material, where the principal orientations of the unimodal components are discussed in Section 2.3. The average MTR size and α p particle size were also taken from the EBSD measurement [15], and grain shapes were generated based on a grain growth simulation. The average MTR diameter of the 209 mm diameter samples used in the high-temperature compression experiment [13] was 196 μ m in the radial direction, while the average α p particle diameter was 10 μ m in the radial direction [15]. In the mesoscale model, the MTR diameter is 300 μ m, while the finite element edge length is 1.7 μ m. Further, it was assumed that the α p particles are equiaxed, which depends on the previous α / β processing parameters and was observed experimentally [20]. Since the crystal plasticity material model (1) is not size-dependent, the MTR and α p particle size in the simulation will not significantly influence the numerical results as long as the RVE contains a sufficient number of grains.

2.3. Hierarchical Multiscale Modeling Framework

At the mesoscale, highly resolved finite element models were developed with 100 × 100 × 100 linear hexahedral finite elements for a cube with 0.5 mm edge length. Within the center of the 3D cell model, two MTRs with pure initial orientation were placed in close proximity; surrounding elements contained a random texture. The 3D cell model was simulated under prescribed constant strain rate imposed as a uniform displacement increment on one face of the cube. The true strain rate is ε ˙ = 9 × 10 3 s 1 , and an average true strain of 0.51 was reached. In the 209 mm radius billet material, the extrusion fiber texture is not obvious, while MTRs have already formed [15]. Two typical MTR orientations were extracted based on experimental observations [17,18], which also exist in the pole figures of the 209 mm radius billet material [15]. Then, high-temperature compression experiments were performed on specimens from this billet material, against which we compared our hierarchical multiscale model. Two specific compression directions with respect to the extrusion texture were considered. In Figure 2a, the compression direction is parallel to the normal direction (ND) of the rolling billet and will be referred to as the ND compression case later. In Figure 2b, the compression direction is 45 to the rolling direction (RD) and ND and will be referred to as the 45 compression case later. RD, ND, and TD (transverse direction) were determined such that the ND pole figures coincided with the experimental measurement [17,18]. Note that both the compression direction and MTR orientation were changed in the mesoscale simulations, such that the uniaxial compression boundary condition can be conveniently applied, and the angle between the MTR axis and compression axis is the same as in the high temperature compression experiment [13,15].
For the mesoscale simulations shown in Figure 2, each MTR is approximated using idealized geometry and pure initial orientation. The relative orientation of the compression direction and the MTR orientation are also shown in the figure. The orientation relation between two MTRs is set to follow the experimental results [17,18]. For the ND compression case (Figure 1a), the initial Bunge Euler angles are ( 0 , 0 , 0 ) for MTR 1 and ( 0 , 90 , 0 ) for MTR 2. For the 45 compression case (Figure 1b), the initial Euler angles are ( 45 , 0 , 0 ) for MTR 1 and ( 45 , 90 , 0 ) for MTR 2. It was observed that the CPFE simulation is qualitatively comparable to the EBSD measurement where the c-axis is concentrated and the ( 10 1 ¯ 0 ) pole figure is scattered after compression [12]. However, the influence of the initial orientation distribution within the MTR was not captured in the mesoscale simulation. These mesoscale results motivate and guide the microscale models conducted in this paper.
Actual MTRs in Ti-6242 contain many α p particles with similar but distinct c-axis alignment. Therefore, we were interested to study if the initially heterogeneous makeup of an MTR, when deformed according to the mesoscale finite element simulations, would exhibit a similar texture evolution. Thus, a microscale model was generated with 75 hexahedral elements along each edge and a log-normal distribution of grain sizes consisting of voxels, as shown in the red-blue cube in the center of Figure 3, containing about 800 particles. A lognormal distribution of 3D spheres was generated using a mean diameter of 10 voxels and standard deviation σ = 0.75 , estimating the number of spheres required to reach a volume fraction of 0.5 in the 75 × 75 × 75 voxel box. Each sphere was then grown until it impinged on another sphere using a Monte Carlo sampling technique to maintain the equal rates of growth in all directions (i.e., maintaining a spherical aspect ratio). The average lattice orientation of the microscopic RVE problem was chosen to agree with the selected point from the mesoscale MTR, shown by the dots on the red-blue ellipsoid. Disorientation distribution with respect to the average α p particle orientation is crucial to precisely characterize the breakdown efficiency of each MTR. The equivalent orientation distribution function was generated based on the local pole figure within MTR [17,18,21], and it was assumed that the scattering is only slightly dependent on the mean MTR orientation [21]. For the re-generated ODF, both peak intensity and half-width were similar to the local EBSD measurement, as shown in Figure 1. Therefore, it is believed that the microscale α p particle orientation is equivalent to the experimentally measured MTRs.
Compression simulations were performed for six strain histories, taken from points in the ND and 45 compression mesoscale models. Finite elements were selected along the MTR center line at positions shown in Figure 3, and the deformation gradients were extracted and used to generate periodic boundary conditions to apply at the microscale. The sample points were considered to be representative, where the outside point reflects the MTR–matrix interaction, the midpoint reflects the evolution within the MTR, and the near-interface location reflects the MTR–MTR interaction. Strain histories from three points are given in Figure 4 for the ND compression case and Figure 5 for the 45 compression case, showing that the transverse axial strains as well as the shear strains are distinct. Therefore, the displacement boundary conditions of the microscale problems differ from those of mesoscale analyses (uniaxial compression). It was observed that the strain history depends mildly on the position within each MTR, especially the transverse components and shear components. Such dependence may also influence the behavior of local misorientation distribution as well as breakdown efficiency of the MTRs. These varying strain paths for the microscale model help to study the effect of mild strain path changes to the resulting texture evolution. One benefit of the hierarchical multiscale modeling is that the mesoscale heterogeneity and microstructure distribution can be considered simultaneously within acceptable computational cost compared with other homogenization techniques [22,23].

2.4. High-Temperature Compression Experiment

The experimental procedures from References [13,15] are briefly summarized, which motivate the initial microstructure in our simulation. The initial state of the extrusion billet material can be found in Reference [15], where equiaxed MTRs are observed. The specimens taken from the mid-radius position of an extrusion billet were used for the high-temperature compression experiments, which were performed at 1172 K with a true strain rate of 0.1/s. The compression directions of the specimens were varied with respect to the billet axis to investigate the effect of loading direction on the MTR evolution. The morphology and orientation distribution of the MTRs were characterized by EBSD after the compression. Corresponding CPFE simulations were performed later to explain the experimental observation and to predict the optimal loading direction [12]. Details of the experiments can be found in Reference [13].

3. Results and Discussion

The effect of loading direction on the MTR breakdown efficiency was investigated previously at the mesoscale only [12], and the MTR breakdown efficiency was quantified using the average misorientation within each region. Actually, the MTR breakdown efficiency varies within each region and is also affected by the initial microstructure, both of which can be captured by the hierarchical multiscale modeling simultaneously. In this section, the misorientation evolution from microscale RVE models was first compared with mesoscale idealized models to illustrate the effect of initial microstructure on the breakdown efficiency. Then, the breakdown efficiency as a function of strain history across points in the mesoscale MTR was studied in detail.

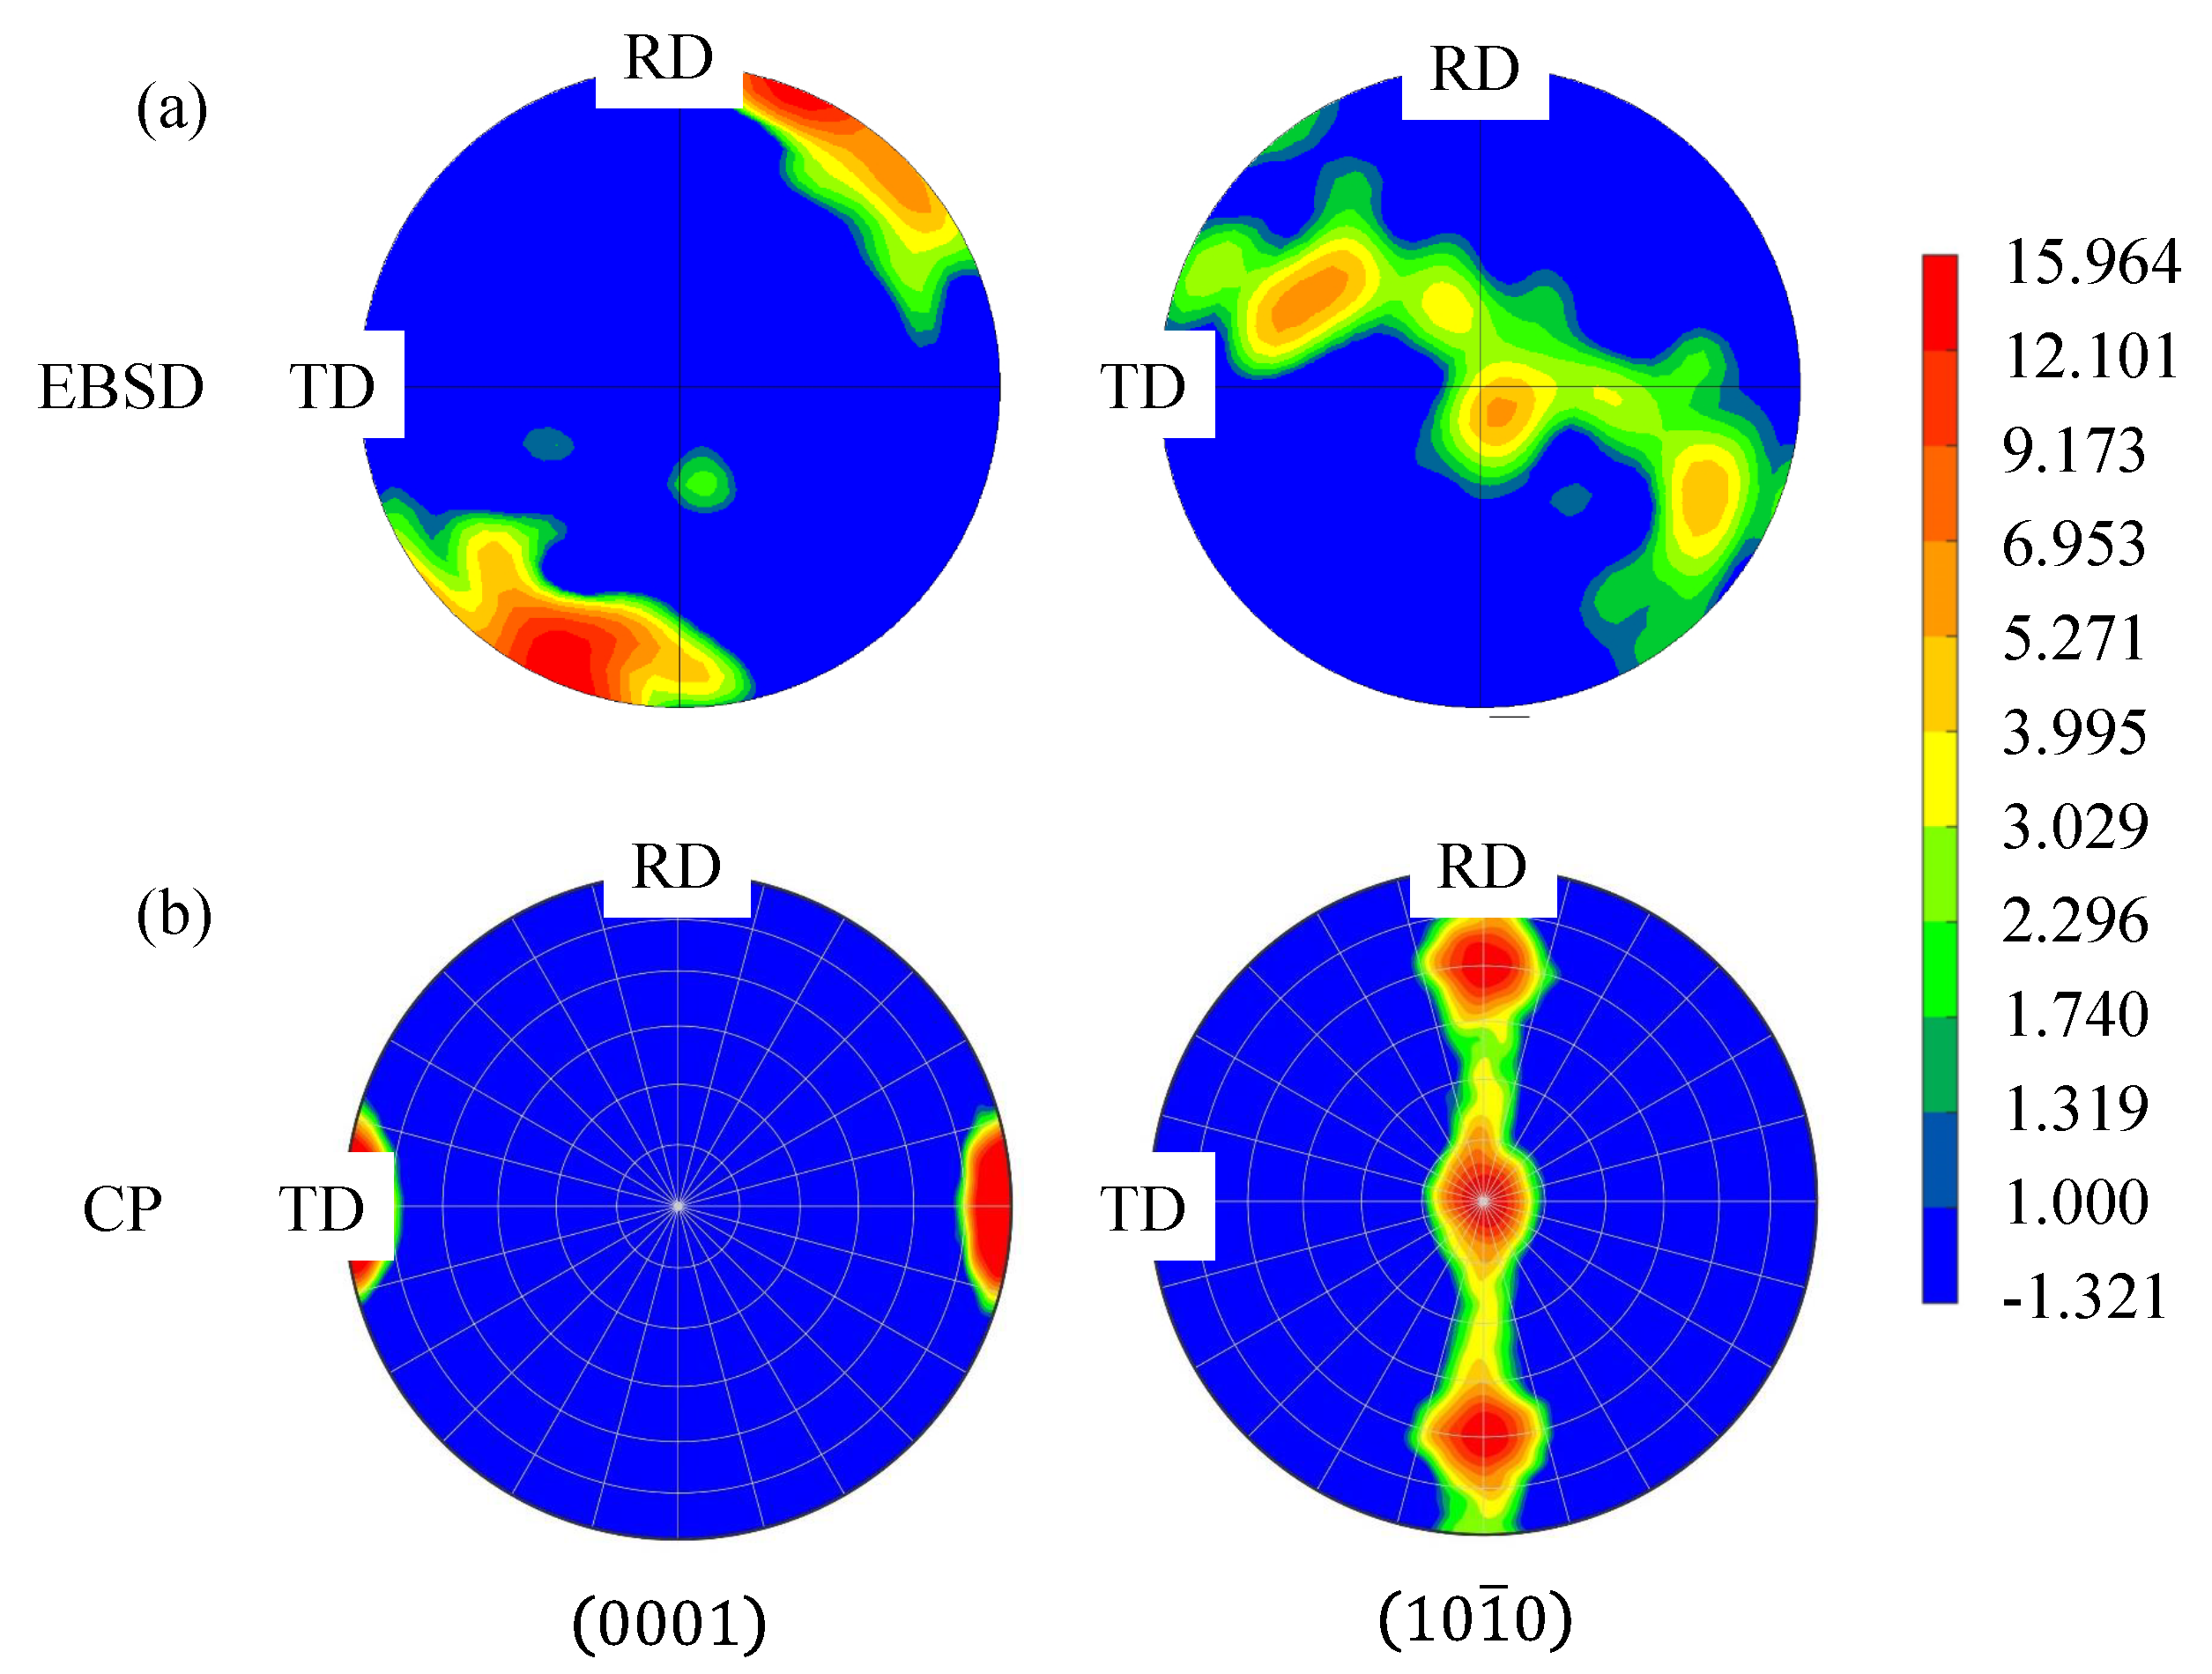
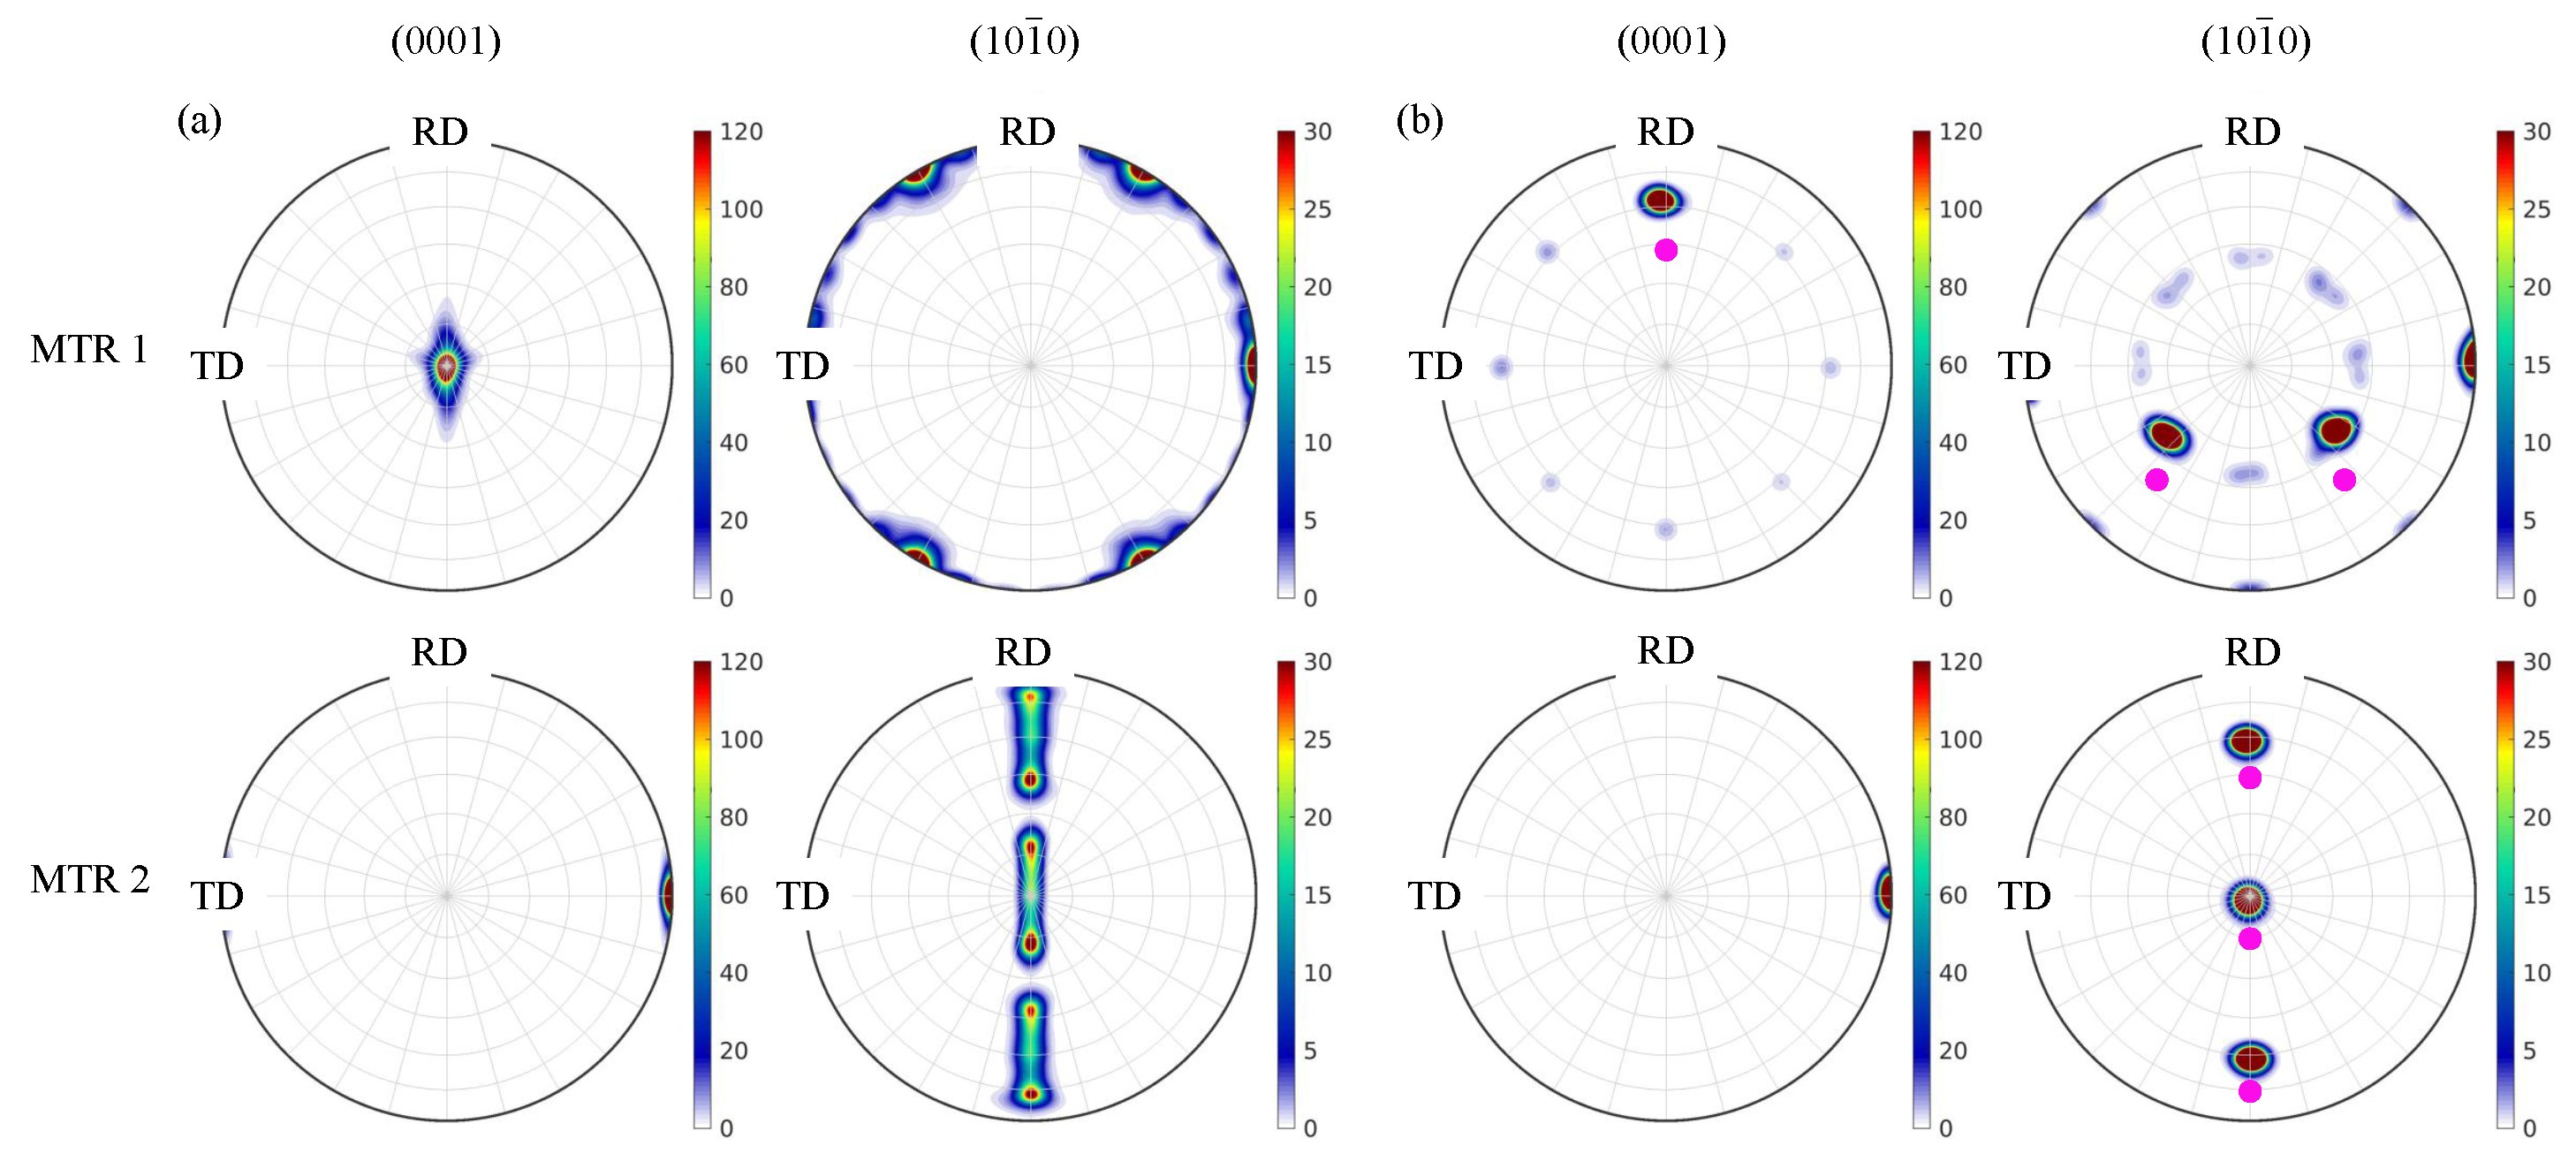
3.1. Comparison between Idealized MTR and Statistically Equivalent MTR

The pole figures are shown in Figure 6 illustrating the texture within the idealized microtextured regions in the mesoscale models before and after the compression. Initially, all the finite elements within an MTR have a single orientation, denoted by a magenta dot in Figure 6b. After the applied matrix compression, the ND compression case in Figure 6a exhibits scattering disorientation within each MTR, while the 45 load case in Figure 6b exhibits a bulk rotation of the crystal lattice in almost all of the MTR elements. This texture evolution of the idealized MTR at the mesoscale is compared with the microscale simulation results below. A more extensive analysis of the idealized MTR behavior was performed in Reference [12], including the matrix texture evolution, changes in MTR morphology, accumulation of plastic strain, etc. The present mesoscale simulations produced essentially similar results to those documented trends.
The ND compression case exhibits a softening of the texture components from the initial condition, as shown in Figure 7. The first MTR has its c-axis parallel to the loading direction, and the orientation spread increases from 15 to 30 in the ( 0001 ) pole figure after 50% strain. In this region, the ( 0001 ) pole figure is obviously scattered as a result of the pyramidal slip system activity. This scatter is limited by the ability to generate plastic deformation, which is consistent with the previous study [12]. In the second MTR, the intensity of the ( 10 1 ¯ 0 ) pole figure also reduces by a factor of two, and the smearing of the unimodal to a fiber texture is also present for both strain histories. This behavior agrees with the mesoscale model with the ideal initial orientation in Figure 6 that develops an orientation gradient; thus, orientation instability does not require a single perfect orientation but can be triggered in imperfect textures as well. This is analogous to column buckling/bifurcation in structures, where the critical applied force inducing large deflection of the column closely agrees for both perfect and imperfect initial conditions. It is also observed that the behavior of the local lattice rotation is less dependent on the position, since MTR2 point B and point C have similar lattice rotation and distribution. This inverse orientation distribution is visualized through Figure 8, comparing the inverse pole figure plotted on the microstructure in the undeformed and deformed states. Misorientation visibly develops within certain grains.
Figure 8 shows the local inverse pole figure (IPF) map of point A of the ND compression case, where the basal plane is perpendicular to the compression direction. The IPF map shows α p particle orientations with respect to the z-axis (compression direction). After compression, the ( 10 1 ¯ 0 ) pole figure is evenly distributed around the c-axis, which is consistent with the mesoscale simulation in Figure 6 using idealized geometry and pure initial orientation. It was observed that after compression, there are two α p particles whose c-axis rotates towards the compression direction, which is not observed in the mesoscale simulation. The major reason for this c-axis rotation is the activation of basal slip systems in these two α p particles, while only prismatic slip systems are activated in the corresponding mesoscale simulation. In the realistic microstructure as shown in the microscale RVE problem, the initial orientation is distributed. For some α p particles, the c-axis is not perpendicular to the compression direction, such that the basal slip systems can be activated during the compression. Such initial orientation distribution may increase the rotation of c-axis towards the compression direction during the deformation process.
By contrast, the resulting texture evolution for 3 points in the 45 load case is shown in Figure 9 through pole figures. Initially, the texture possesses the 7.5 degree half-width components. After deformation, the lattice rotation is obvious, but the breakdown efficiency is very limited. In the deformed microscale pole figure, the initially distributed α p particles become concentrated after compression, while the mesoscale results in Figure 6 remain concentrated both before and after loading. Additionally, the lattice rotation seems to be independent of the local position, since both point B and point C have similar lattice rotation and distribution. For both MTR 1 and MTR 2, which have different initial orientations, the texture sharpens to produce higher peak intensities. Thus, the c-axis orientation of neighboring crystallites is expected to come closer together as the applied strain increases. This indicates that for the 45 compression case, both MTRs are in a stable orientation, which is consistent with the previous study based on the divergence of the lattice rotation velocity [12]. The second MTR particularly intensifies, where the initial fiber texture is almost entirely converted to a unimodal component. Thus, this loading direction is very ineffective at breaking down the initial microtexture. Further, dependence of lattice rotation on the strain path for MTR 1 is fairly mild, according to the similarity of points A and B. Bulk rotation of the MTR is also evident from the motion of the peaks by about 15–30 .
To further compare the microscale and mesoscale simulations, Figure 10 presents the evolution of the average stress components in the longitudinal and transverse directions for selected material points. The mesoscale stress values are reported from the same finite element as was used to provide the effective strain history for the corresponding microscale model. The microscale stress values are integrated and averaged across the entire RVE (see Figure 3). The finer length scales resolved in the microscale models produce a slightly softer response (i.e., lower longitudinal stress for the same applied strain) compared to the mesoscale. Lastly, the ND compression of MTR 1 reveals a 50% greater longitudinal stress compared to the 45 compression case, attributed to the higher resistance of the pyramidal slip systems that are solely activated in the ND case [12]. Note that each MTR at the mesoscale is surrounded by a random textured matrix that can transmit a locally higher stress, while the overall mesoscale cell carries a similar stress level for each loading case.

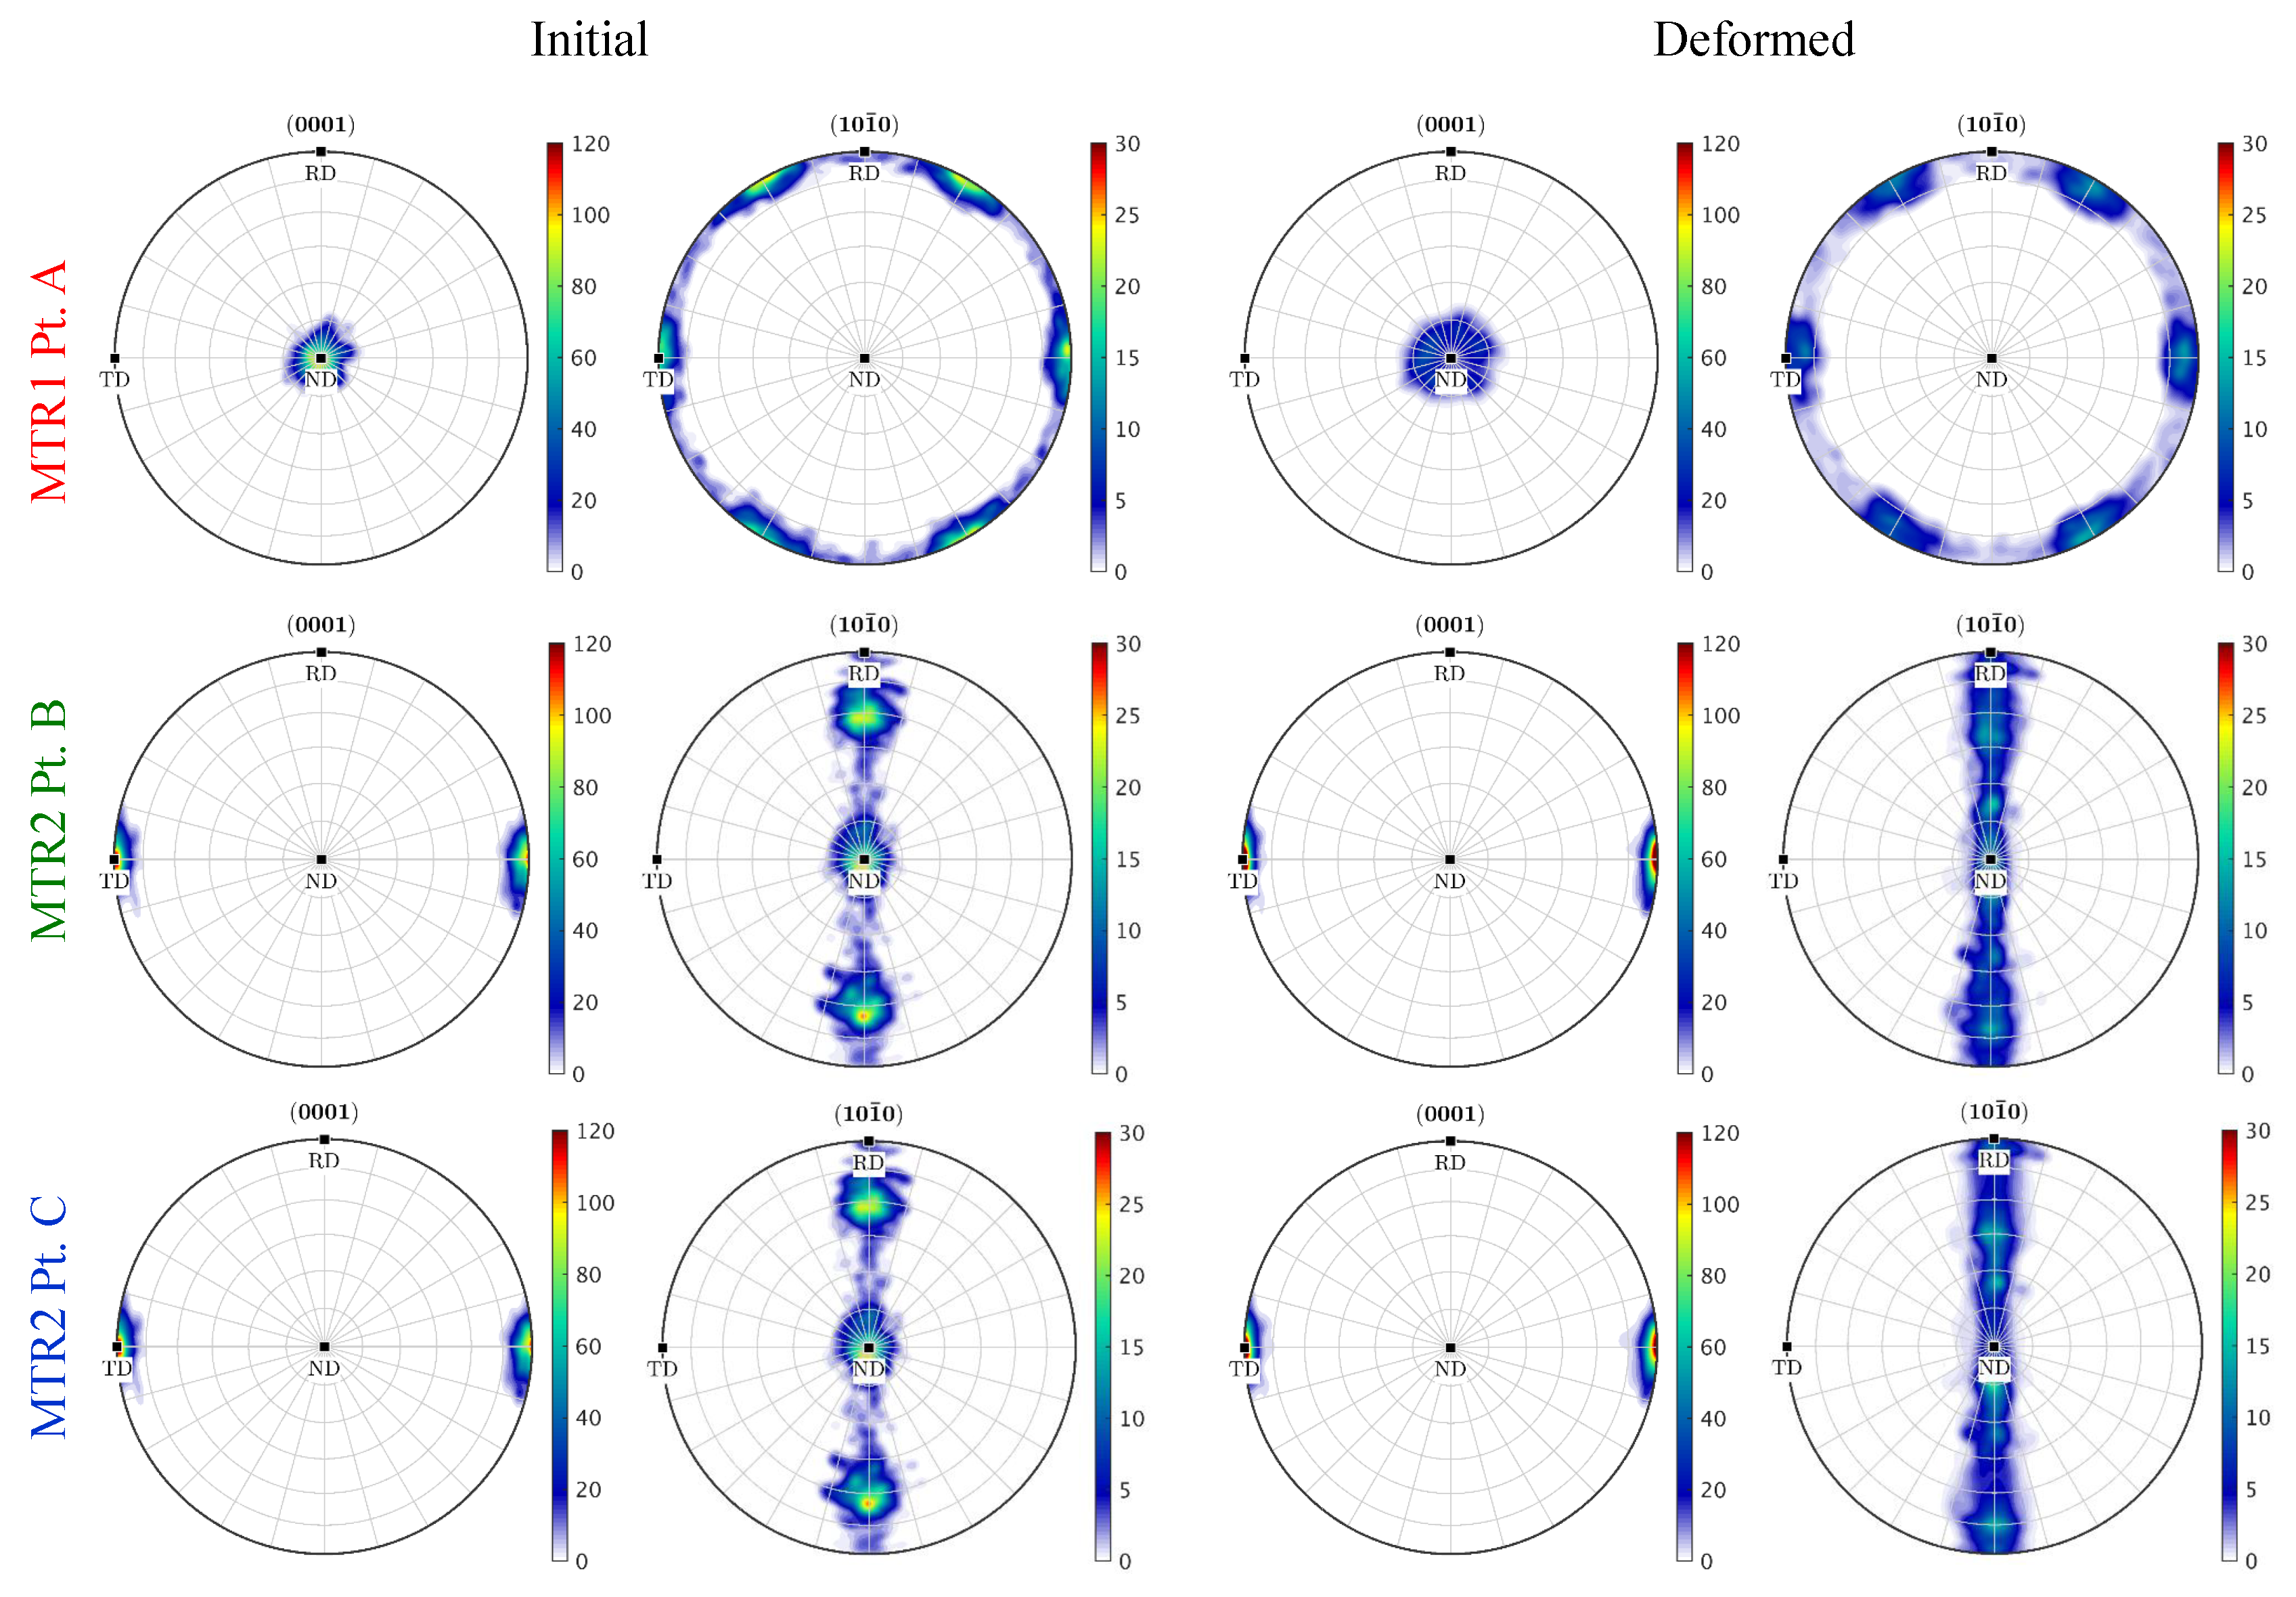
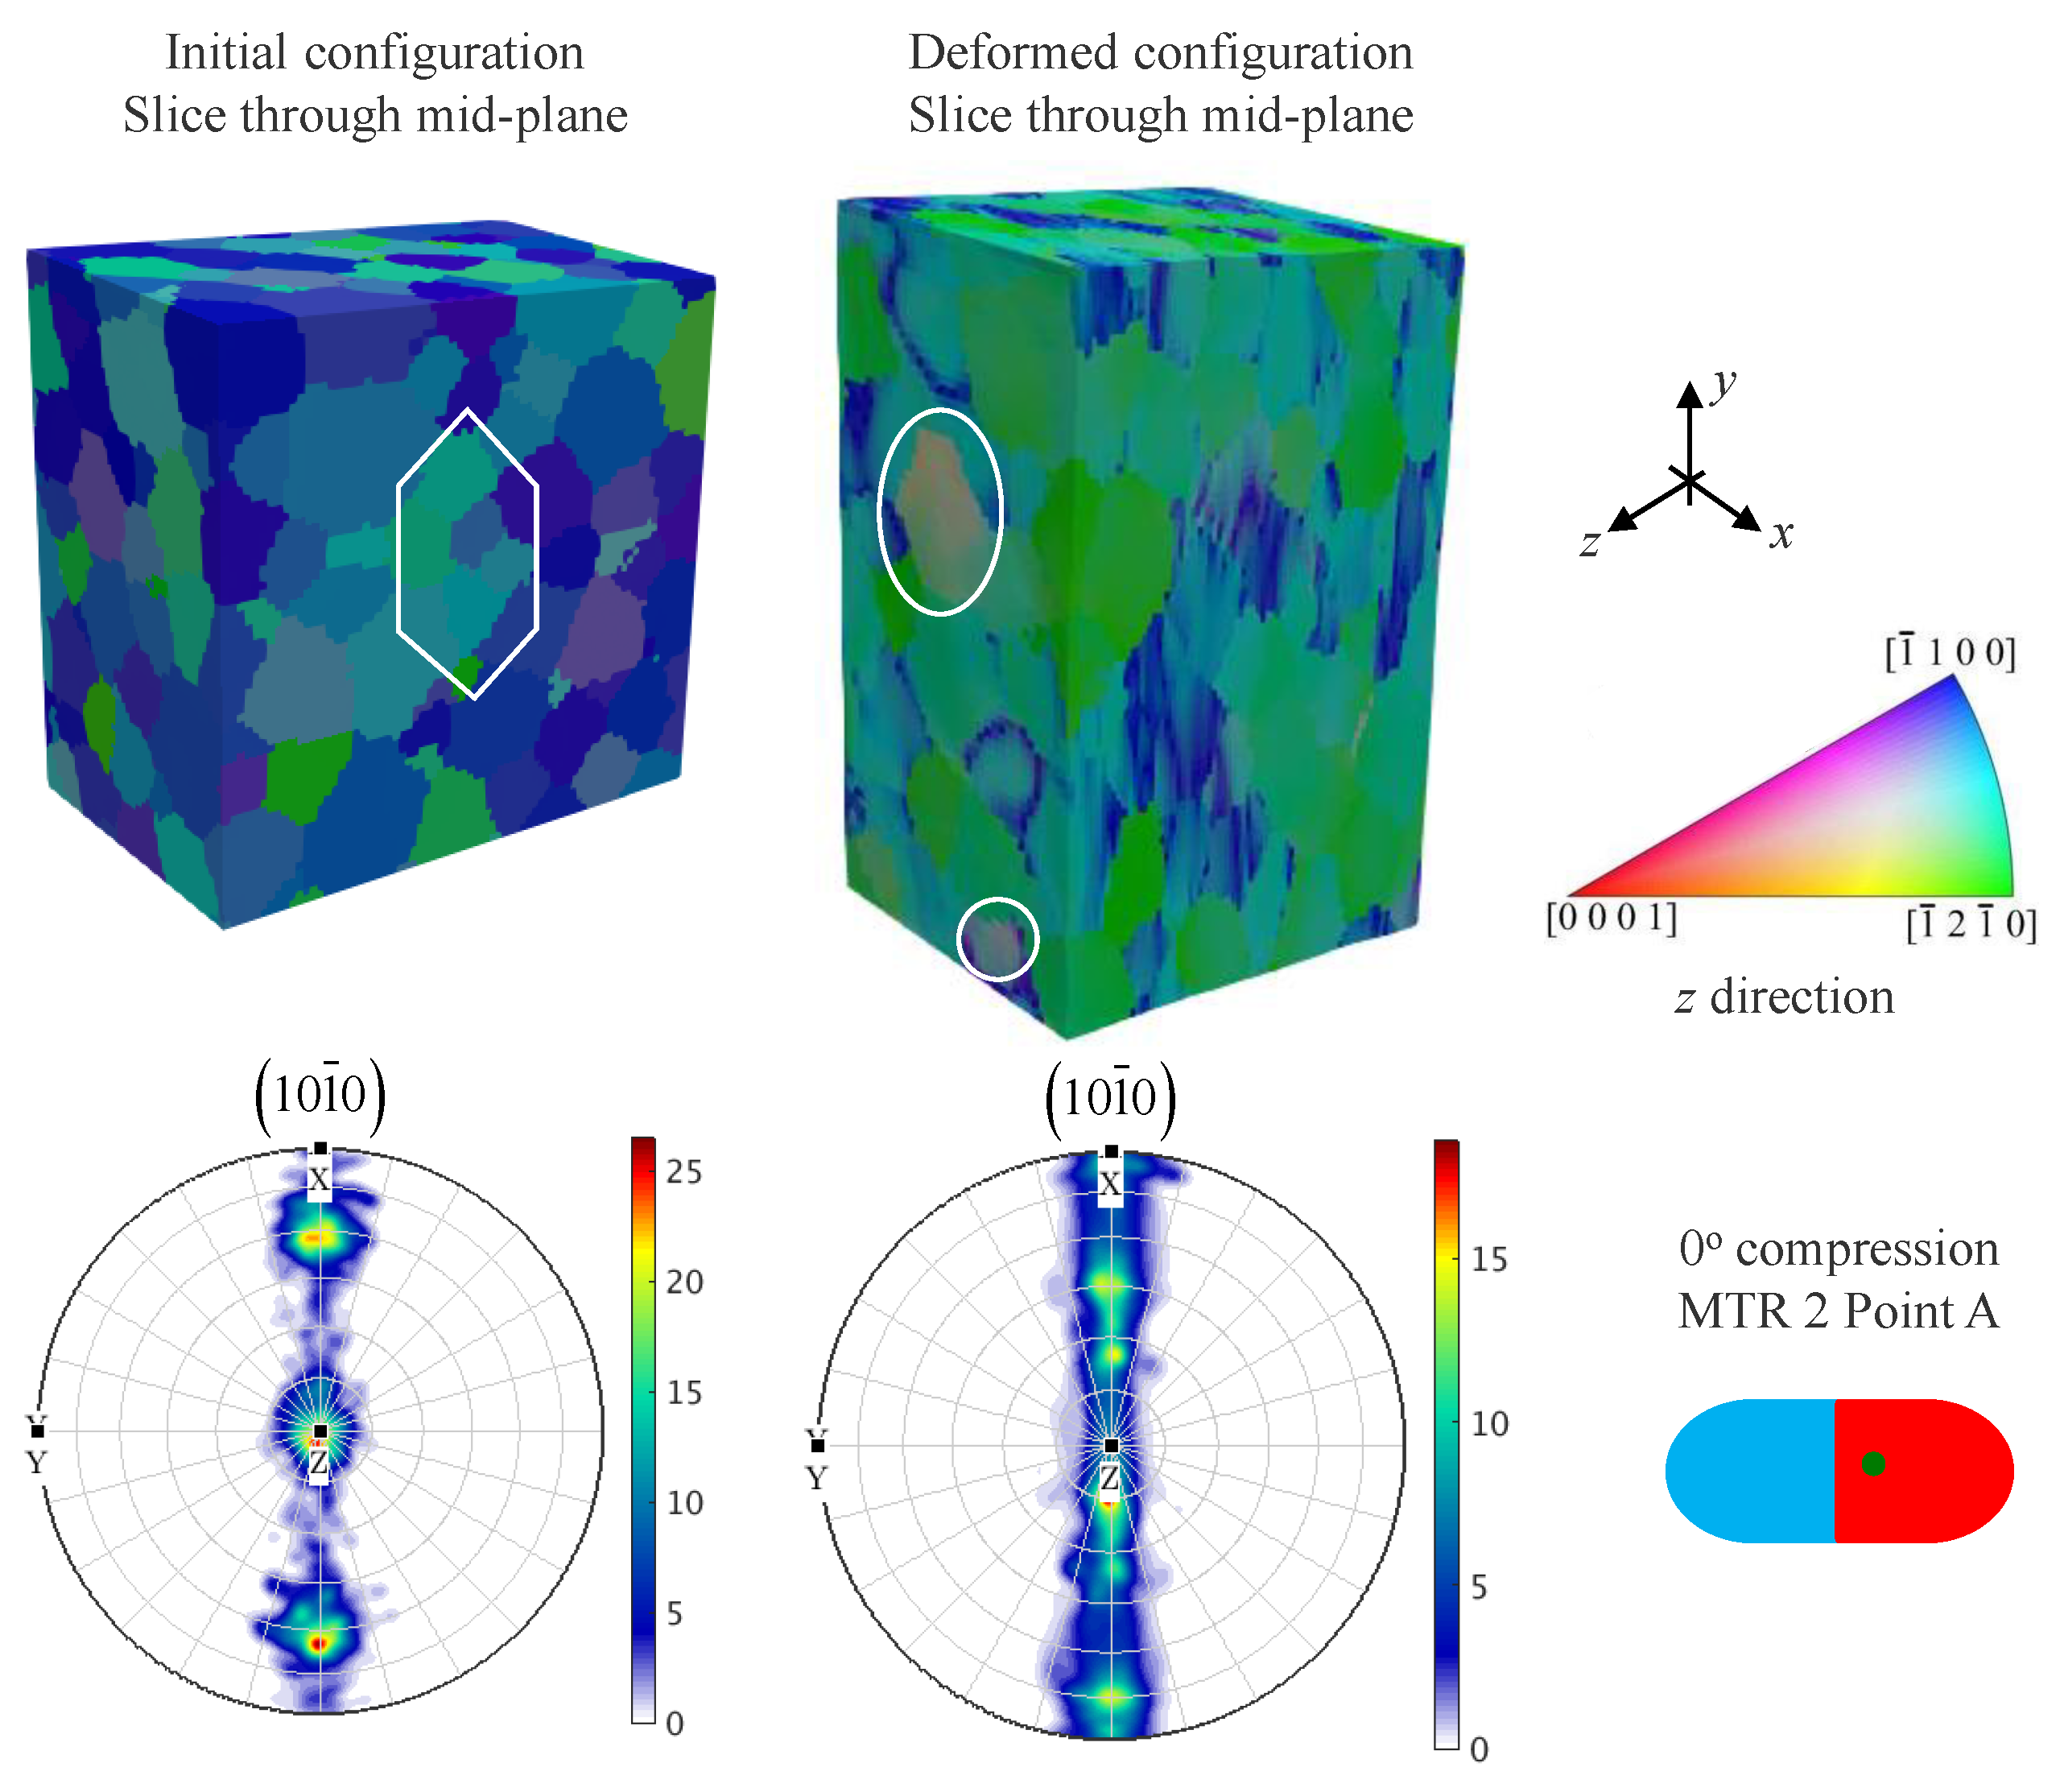
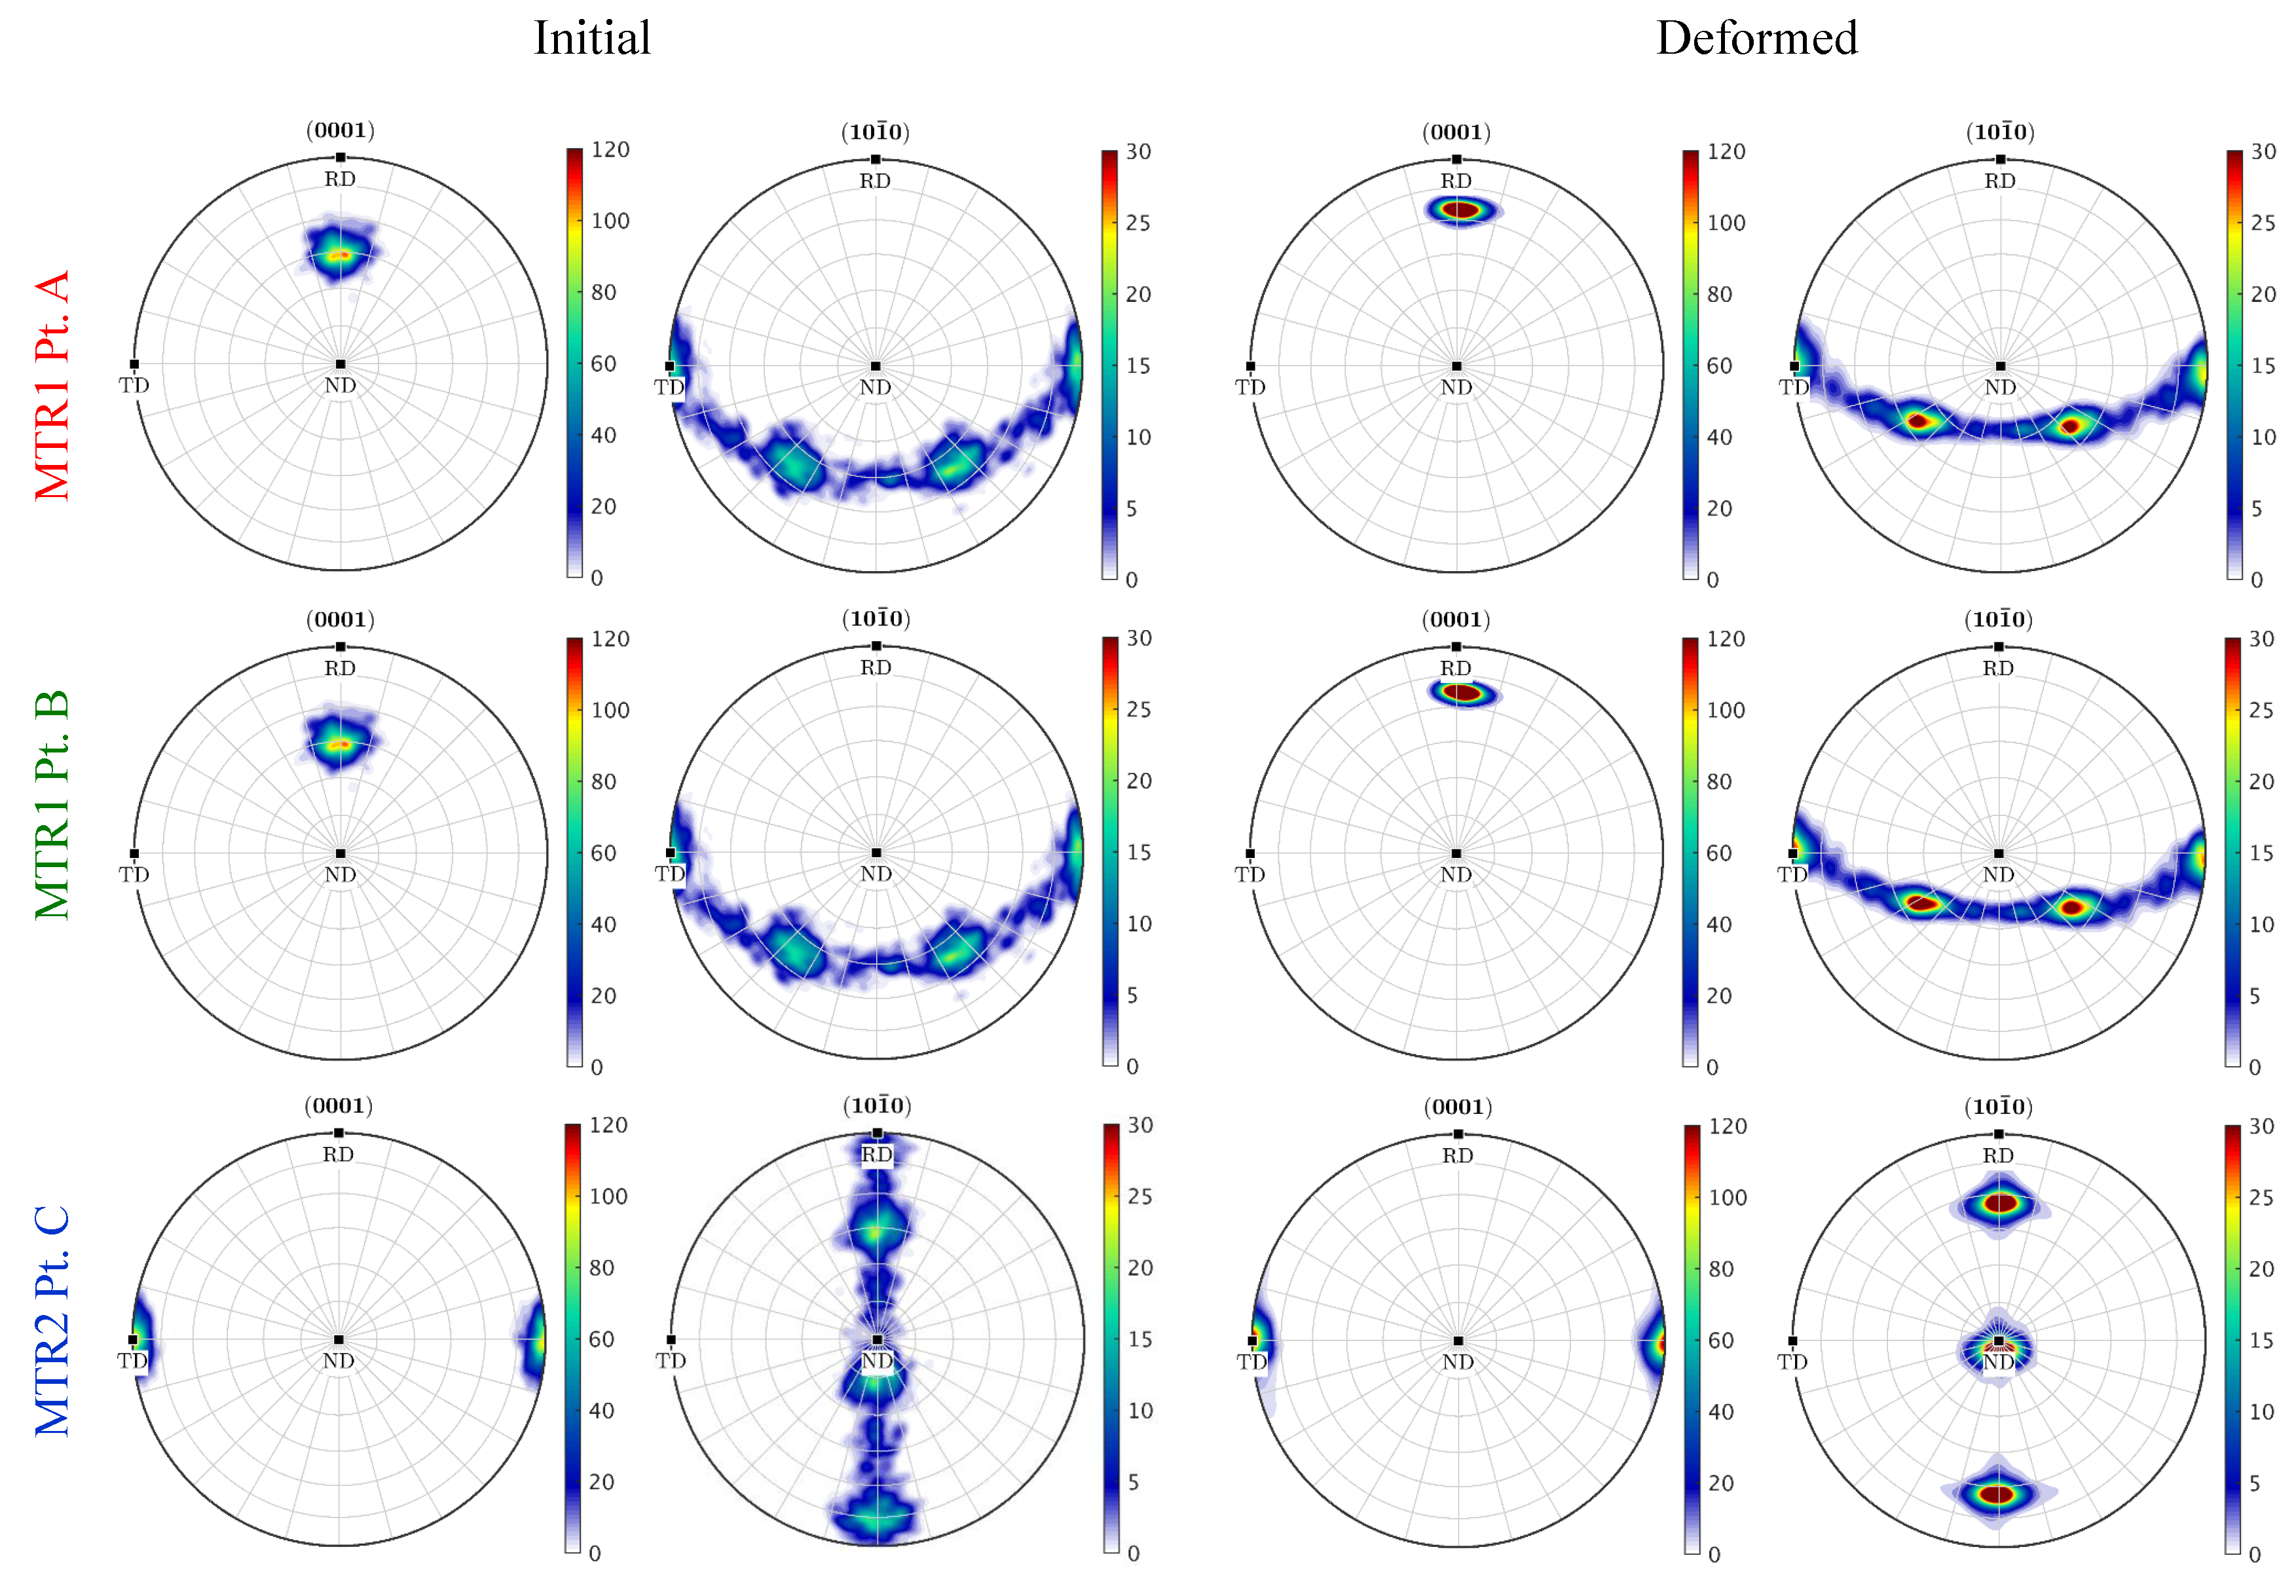
3.2. Disorientation Evolution of Statistically Equivalent MTR

The texture breakdown in the microscale simulations was quantified through the disorientation curves given in Figure 11. Disorientation was measured with respect to the mean orientation of the simulated domain. In the legends for the microscale, “M” denotes which MTR (1 or 2) and “P” denotes which point (A, B, or C). The curves in the left plots correspond to the mesoscale simulations, highlighting the large disorientation for the ND compression case and the small disorientations in the 45 compression case. In the latter, the disorientation from the microscale model shows a reduction in disorientation between the initial (Init) and final (Fin) configuration; the peak has shifted to the left and intensified. Moreover, the final frequency distribution is smoother than the initial condition, which is true in all cases. These observations suggest that although the volume averaged stress–strain response is similar between mesoscale and microscale simulations, local lattice rotation can be well represented only in microscale simulations where a realistic initial microstructure is constructed. By contrast, the ND compression case shows a spreading of the disorientation distribution and a reduction in the peak, showing effective breakdown. Additionally, the dependence of the behavior with respect to the strain path (comparing the blue and black curves) is a bit larger. Crucially, for all loading cases, the trends in disorientation evolution are consistent between the microscale and mesoscale counterparts, such that relative degrees of breakdown efficiency can be assessed from the less expensive mesoscale simulations.

4. Conclusions

A high-temperature compression experiment on Ti-6242 at 1172 K with strain rate 0.009 s 1 was simulated using the crystal plasticity finite element method to investigate the effect of applied strain path on the evolution of microtextured regions (MTRs). A hierarchical multiscale modeling framework was designed to explicitly incorporate the geometry of both MTRs and α p particles, which belong to two different length scales. Strain histories extracted from locations within the MTR of the mesoscale simulations served as the boundary conditions of the microscale simulations, where the initial orientation distribution and grain size distribution were incorporated. Morphology and misorientation evolution of MTRs under different compression directions were characterized and discussed in detail. Major conclusions are summarized as follows:
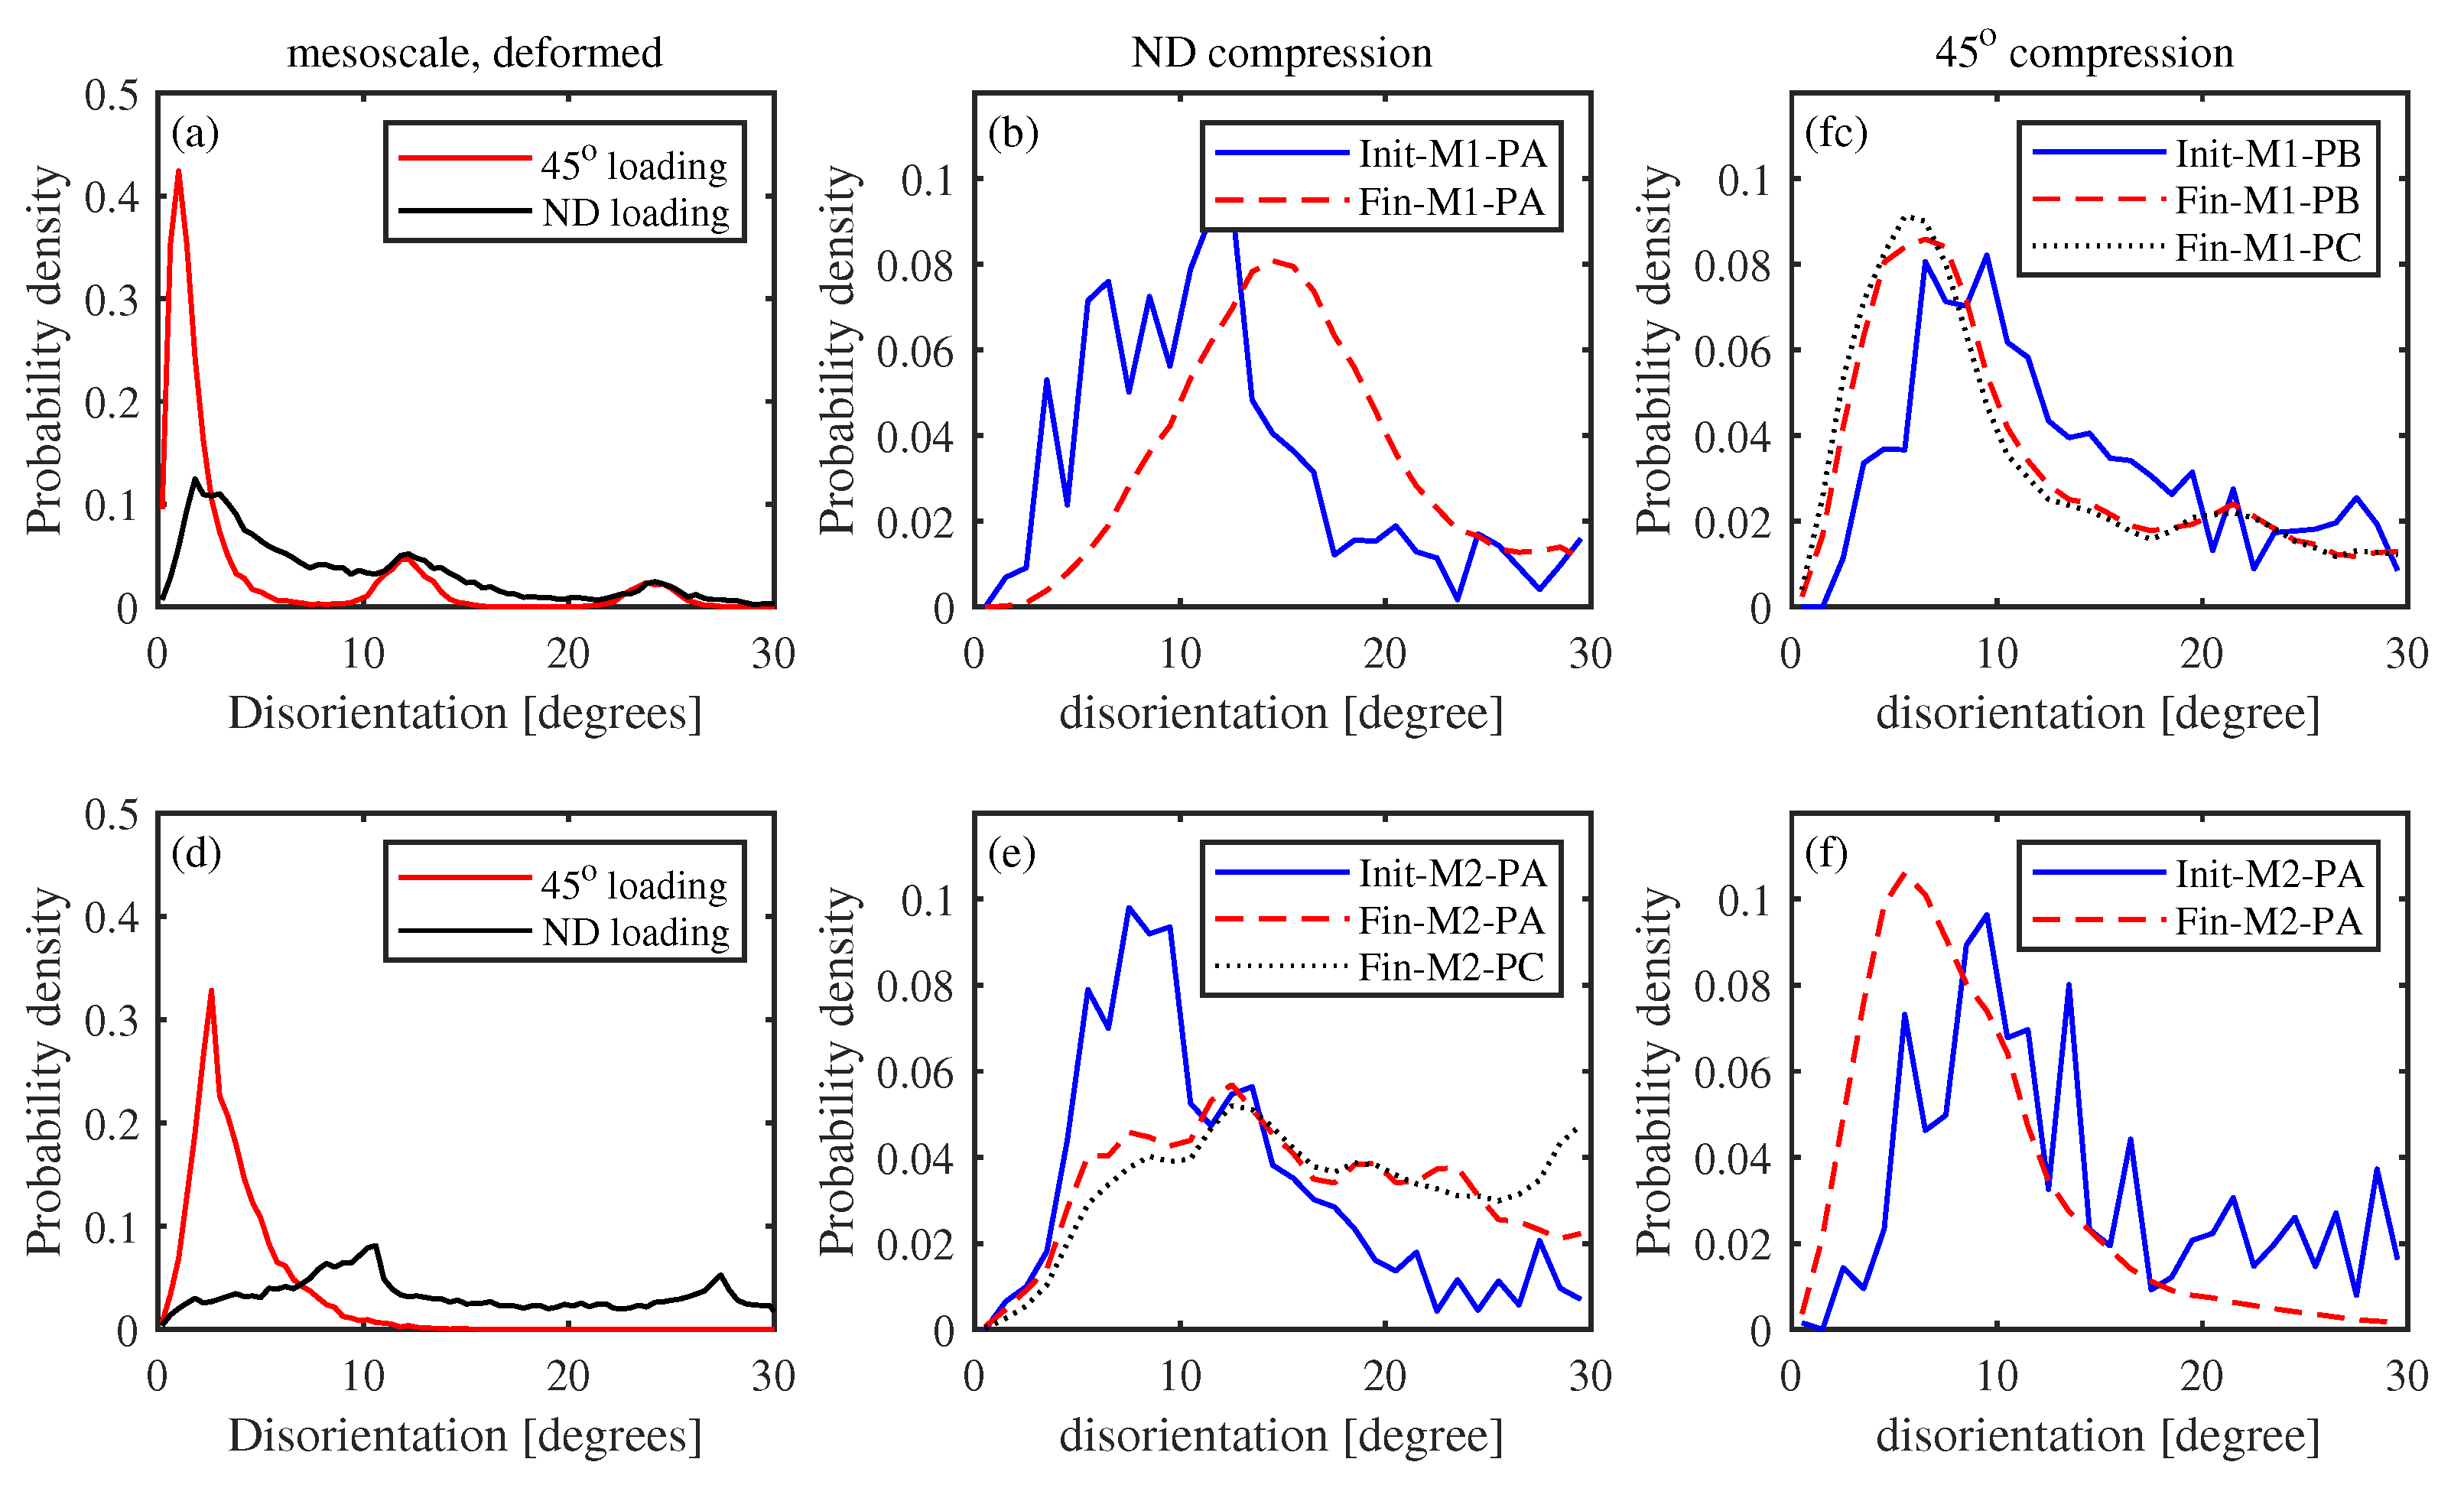
  • While the c-axis parallel loading of the MTR produced the largest breakdown, the efficiency was limited by its resistance to plastic deformation. When the compression direction was parallel to the basal plane, orientation scattering around the c-axis was obvious, but the c-axis remained similarly oriented.
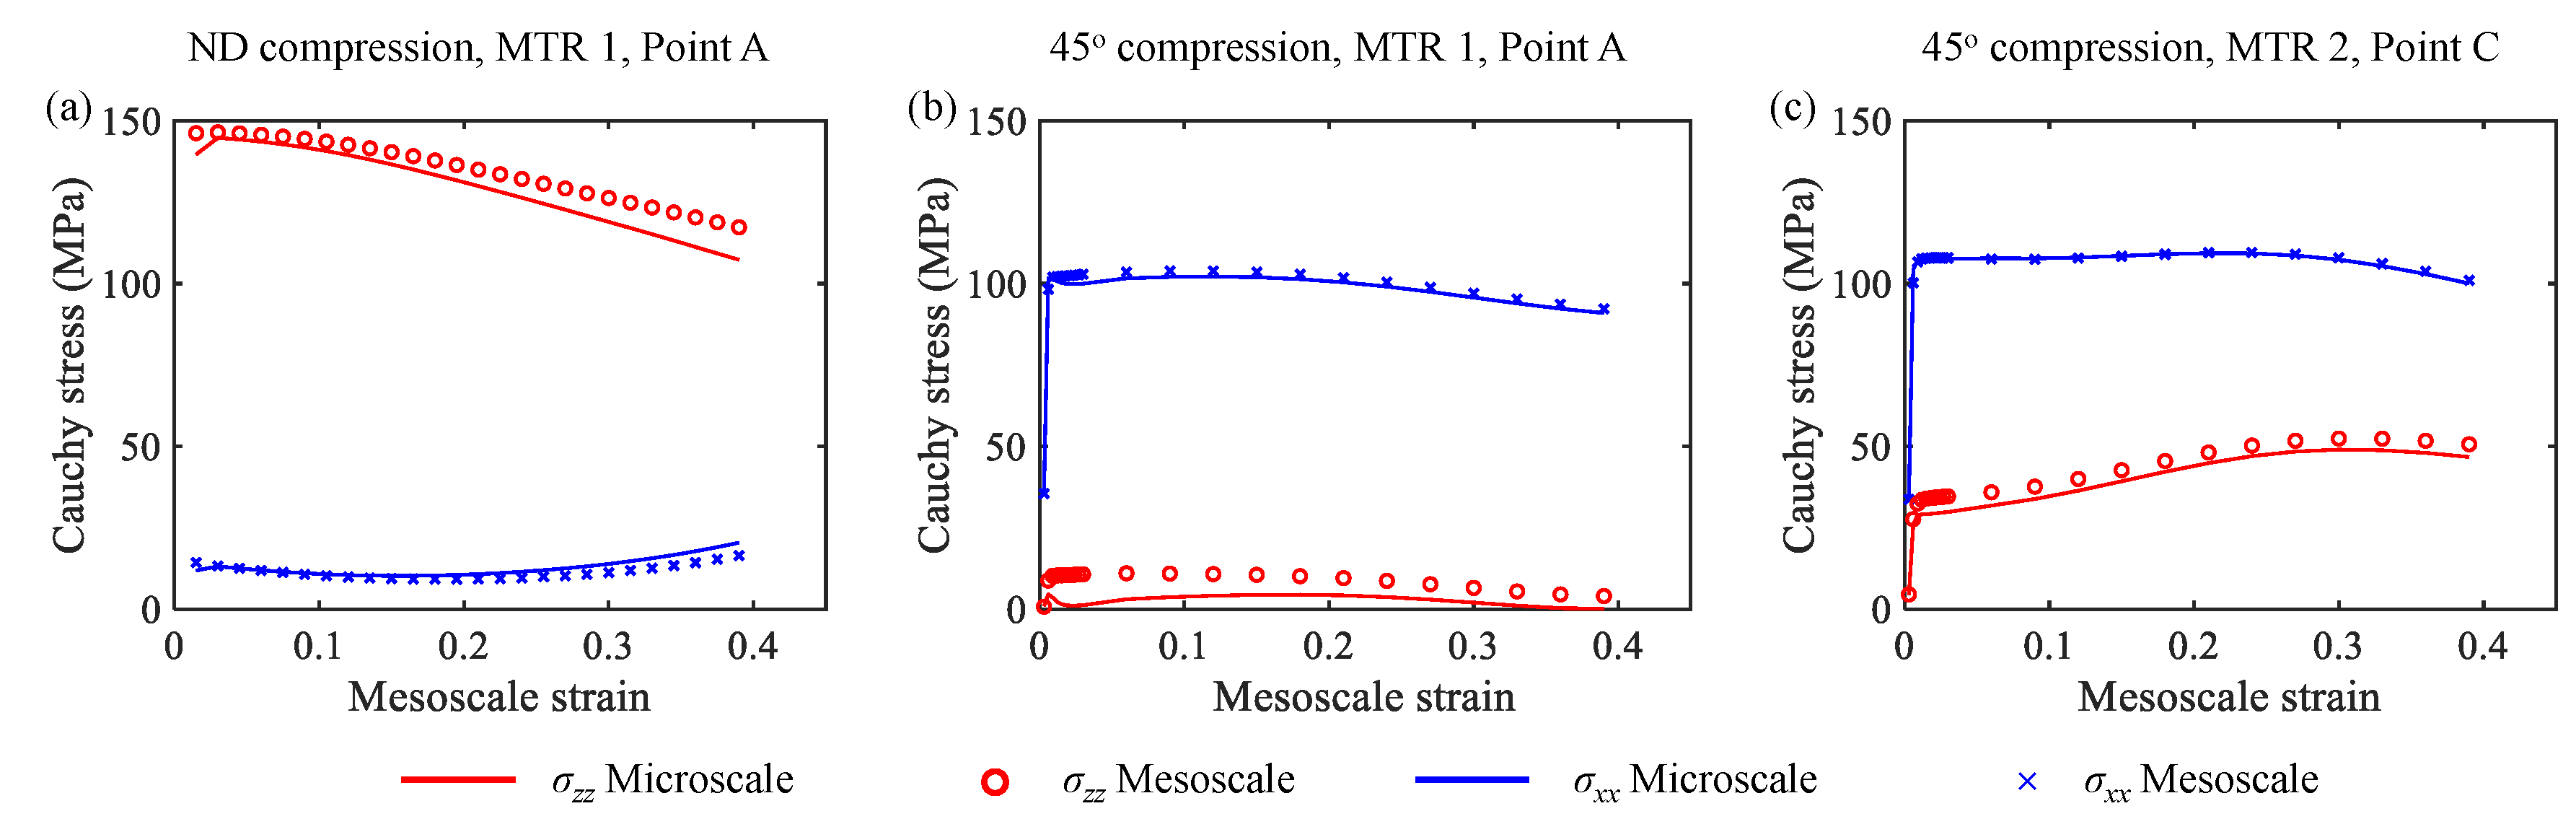
  • The stability of MTRs under different loading directions can be captured by the microscale simulation with distributed initial orientation. More specifically, the scattering of the c-axis was observed in the ND compression case, and the lattice rotation and sharpening was observed in the 45 compression case.
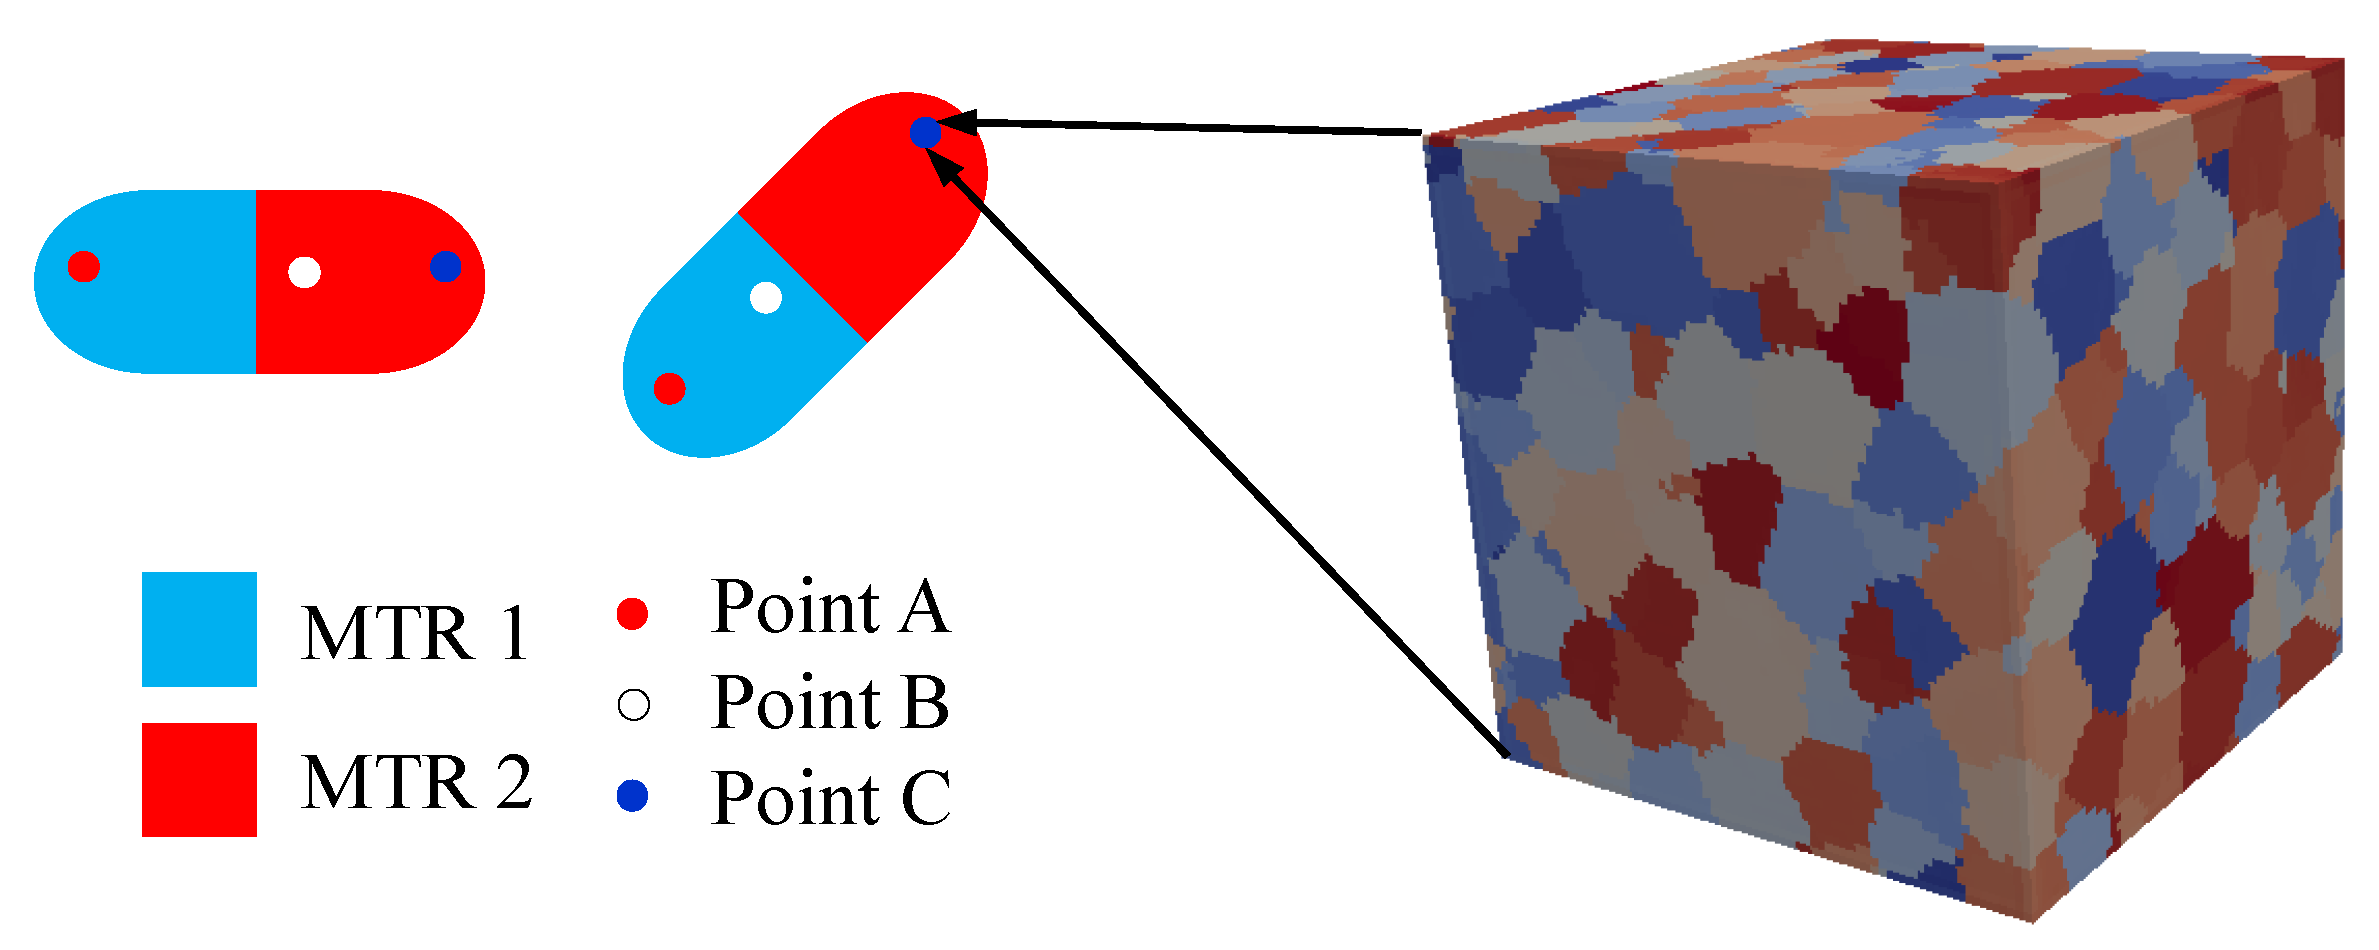
  • The initial position of the microscale simulation within the mesoscale model had minor influence on the microstructure evolution in both the ND compression case and the 45 compression case. Therefore, the variations in stress and strain states near the MTR–MTR and MTR–matrix interfaces compared to the MTR interior had little influence on the relative breakdown efficiency at 1172 K.
In this paper, the morphology and misorientation evolution of MTRs under different loading directions were investigated using a hierarchical multiscale modeling framework. The material model in this paper was calibrated against compression experiments conducted at 1172 K, with a strain rate of 0.009 s 1 . Other factors, including temperature and strain rate, will be investigated in future work when mechanical properties of the β phase are characterized at higher temperature under multiple strain rates. Further, a concurrent multiscale modeling framework will be constructed to capture these two factors simultaneously, aiming at providing practical processing parameters to eliminate the MTRs.

Author Contributions

R.M. wrote the manuscript and analyzed the results; T.J.T. performed the simulations and gave a preliminary analysis of the results.

Funding

T.J.T. was supported by a summer faculty fellowship through the Air Force Office of Scientific Research.

Acknowledgments

AL Pilchak and SL Semiatin are acknowledged for helpful discussion.

Conflicts of Interest

The authors declare no conflict of interest.

Abbreviations

The following abbreviations are used in this manuscript:
MTRmicrotextured region
CPcrystal plasticity
FEMfinite element method

References

  1. Bache, M.; Cope, M.; Davies, H.; Evans, W.; Harrison, G. Dwell sensitive fatigue in a near alpha titanium alloy at ambient temperature. Int. J. Fatigue 1997, 19, 83–88. [Google Scholar] [CrossRef]
  2. Heckel, T.; Tovar, A.G.; Christ, H.J. Fatigue of the near-alpha Ti-alloy Ti6242. Exp. Mech. 2010, 50, 483–489. [Google Scholar] [CrossRef]
  3. Weiss, I.; Froes, F.; Eylon, D.; Welsch, G. Modification of alpha morphology in Ti-6Al-4V by thermomechanical processing. Metall. Mater. Trans. A 1986, 17, 1935–1947. [Google Scholar] [CrossRef]
  4. Pilchak, A.L. Fatigue crack growth rates in alpha titanium: Faceted vs. striation growth. Scr. Mater. 2013, 68, 277–280. [Google Scholar] [CrossRef]
  5. Zheng, Z.; Balint, D.S.; Dunne, F.P. Dwell fatigue in two Ti alloys: An integrated crystal plasticity and discrete dislocation study. J. Mech. Phys. Solids 2016, 96, 411–427. [Google Scholar] [CrossRef] [Green Version]
  6. Germain, L.; Gey, N.; Humbert, M.; Vo, P.; Jahazi, M.; Bocher, P. Texture heterogeneities induced by subtransus processing of near α titanium alloys. Acta Mater. 2008, 56, 4298–4308. [Google Scholar] [CrossRef]
  7. Leo Prakash, D.G.; Honniball, P.; Rugg, D.; Withers, P.J.; Quinta da Fonseca, J.; Preuss, M. The effect of β phase on microstructure and texture evolution during thermomechanical processing of α + β Ti alloy. Acta Mater. 2013, 61, 3200–3213. [Google Scholar] [CrossRef]
  8. Bieler, T.R.; Semiatin, S.L. The origins of heterogeneous deformation during primary hot working of Ti–6Al–4V. Int. J. Plast. 2002, 18, 1165–1189. [Google Scholar] [CrossRef]
  9. Gey, N.; Bocher, P.; Uta, E.; Germain, L.; Humbert, M. Texture and microtexture variations in a near-α titanium forged disk of bimodal microstructure. Acta Mater. 2012, 60, 2647–2655. [Google Scholar] [CrossRef]
  10. Miller, V.; Semiatin, S.; Szczepanski, C.; Pilchak, A. Optimization of VPSC model parameters for two-phase titanium alloys: Flow stress vs orientation distribution function metrics. Metall. Mater. Trans. A 2018, 49, 3624–3636. [Google Scholar] [CrossRef]
  11. Miller, V.; Echlin, M.; Beyerlein, I.; Pollock, T. Polycrystal plasticity simulation of microtextured titanium. In Proceedings of the 13th World Conference on Titanium, San Diego, CA, USA, 16–20 August 2015; pp. 209–214. [Google Scholar]
  12. Ma, R.; Pilchak, A.L.; Semiatin, S.L.; Truster, T.J. Modeling the evolution of microtextured regions during α/β processing using the crystal plasticity finite element method. Int. J. Plast. 2018, 107, 189–206. [Google Scholar] [CrossRef]
  13. Pilchak, A.L.; Shank, J.; Tucker, J.C.; Srivatsa, S.; Fagin, P.N.; Semiatin, S.L. A dataset for the development, verification, and validation of microstructure-sensitive process models for near-α titanium alloys. Integrating Mater. Manuf. Innov. 2016, 5, 14. [Google Scholar] [CrossRef]
  14. Dodds, R. WARP3D: 3-D nonlinear Finite Element Analysis of Solids for Fracture and Fatigue Processes. 2019. Available online: http://www.warp3d.net (accessed on 15 February 2019).
  15. Pilchak, A.; Szczepanski, C.; Shaffer, J.; Salem, A.; Semiatin, S. Characterization of microstructure, texture, and microtexture in near-alpha titanium mill products. Metall. Mater. Trans. A 2013, 44, 4881–4890. [Google Scholar] [CrossRef]
  16. Deka, D.; Joseph, D.S.; Ghosh, S.; Mills, M.J. Crystal plasticity modeling of deformation and creep in polycrystalline Ti-6242. Metall. Mater. Trans. A 2006, 37, 1371–1388. [Google Scholar] [CrossRef]
  17. Bantounas, I.; Lindley, T.C.; Rugg, D.; Dye, D. Effect of microtexture on fatigue cracking in Ti–6Al–4V. Acta Mater. 2007, 55, 5655–5665. [Google Scholar] [CrossRef]
  18. Echlin, M.P.; Stinville, J.C.; Miller, V.M.; Lenthe, W.C.; Pollock, T.M. Incipient slip and long range plastic strain localization in microtextured Ti-6Al-4V titanium. Acta Mater. 2016, 114, 164–175. [Google Scholar] [CrossRef] [Green Version]
  19. Mainprice, D.; Hielscher, R.; Schaeben, H. Calculating anisotropic physical properties from texture data using the MTEX open-source package. Geol. Soc. Lond. Spec. Publ. 2011, 360, 175–192. [Google Scholar] [CrossRef] [Green Version]
  20. Bantounas, I.; Dye, D.; Lindley, T.C. The role of microtexture on the faceted fracture morphology in Ti–6Al–4V subjected to high-cycle fatigue. Acta Mater. 2010, 58, 3908–3918. [Google Scholar] [CrossRef]
  21. Pilchak, A.L. The Effect of Friction Stir Processing on the Microstructure, Mechanical Properties and Fracture Behavior of Investment Cast Ti-6Al-4V. Ph.D. Thesis, The Ohio State University, Columbus, OH, USA, 2009. [Google Scholar]
  22. Zhang, X.; Oskay, C. Eigenstrain based reduced order homogenization for polycrystalline materials. Comput. Meth. Appl. Mech. Eng. 2015, 297, 408–436. [Google Scholar] [CrossRef]
  23. Zhang, X.; Oskay, C. Sparse and scalable eigenstrain-based reduced order homogenization models for polycrystal plasticity. Comput. Meth. Appl. Mech. Eng. 2017, 326, 241–269. [Google Scholar] [CrossRef]
Figure 1. Generation of statistically equivalent orientation distribution function. (a) Typical measured texture in MTR in related alloy Ti–6Al–4V [21], with permission from author, 2009; (b) model input texture (primary orientation depends on parent MTR). In the current figure and the pole figures that follow, the color map denotes the texture component strength times random.
Metals 09 00233 g001
Figure 2. Morphology and initial orientation of the mesoscale microtexture regions (MTRs). (a) Compression along the normal direction (z axis). (b) Compression along the diagonal direction (x axis). For both cases, the red region is MTR 1 and the blue region is MTR 2.
Metals 09 00233 g002
Figure 3. Description of microscale model of α particles within MTR subjected to strain path from individual finite elements at mesoscale; input texture contains fiber texture about mesoscale c-axis.
Metals 09 00233 g003
Figure 4. Green–Lagrange strain history of selected mesoscale MTR points in the normal direction (ND) compression simulation. Point positions are extracted from Figure 3.
Metals 09 00233 g004
Figure 5. Green–Lagrange strain history of selected mesoscale MTR points in the 45 compression simulation. Point positions are extracted from Figure 3.
Metals 09 00233 g005
Figure 6. Mesoscale pole figures of each MTR after compression (T = 1172 K, ε = 0.51 ). (a) ND compression; (b) 45 compression.
Metals 09 00233 g006
Figure 7. Microscale texture development during uniaxial ND compression simulation. Texture components soften in both MTRs, and unstable orientation is apparent in MTR2.
Metals 09 00233 g007
Figure 8. Microscale spatial inverse pole figure of MTR2 (c-axis perpendicular to loading) before and after compression. The point corresponds to point A of region 2 in Figure 9, where an evenly distributed ( 10 1 ¯ 0 ) pole figure is observed. The hexagon represents the average orientation of the α p particles, and two α p particles with rotating c-axis are circled.
Metals 09 00233 g008
Figure 9. Microscale texture development during 45 compression simulation. Texture components sharpen in both MTRs, and bulk rotation of texture components is evident.
Metals 09 00233 g009
Figure 10. Local stress–strain curve comparison between mesoscale and microscale results.
Metals 09 00233 g010
Figure 11. Disorientation with respect to mean orientation in MTR: Initial and final curves for ND compression, and initial and final curves for 45 compression.
Metals 09 00233 g011
Table 1. Elasticity constants of Ti-6242 in the material coordinates (1172 K).
C 11 (GPa) C 33 (GPa) C 12 (GPa) C 13 (GPa) C 44 (GPa) C 66 (GPa)
132.8159.476.5667.1939.8428.12
Table 2. Crystal plasticity parameters for Ti-6242 α p particles at 1172 K.
 BasalPrismaticPyramidal
γ ˙ 0 ( s 1 ) 0.120.120.12
g ˜ ( MPa ) 69.3846.25208.13
h 0 ( MPa ) 4.699.7228.22
g 0 ( MPa ) 68.0854.46163.4
n0.140.150.15
r0.300.290.29
m0.200.200.20

