Article

Hot Deformation Behavior and Microstructure Evolution of a TiBw/Near α-Ti Composite with Fine Matrix Microstructure

1
College of Materials Science and Engineering, Taiyuan University of Technology, Taiyuan 030024, China
2
Inner Mongolia Metallic Materials Research Institute, Ningbo 315103, China
3
Department of Chemical and Materials Engineering, University of Auckland, Private Bag 92019, Auckland 1142, New Zealand
4
MacDiarmid Institute for Advanced Materials and Nanotechnology, University of Victoria Wellington, PO Box 600, Wellington 6140, New Zealand
*
Authors to whom correspondence should be addressed.
Metals 2019, 9(4), 481; https://doi.org/10.3390/met9040481
Submission received: 25 March 2019 / Revised: 23 April 2019 / Accepted: 24 April 2019 / Published: 25 April 2019
(This article belongs to the Special Issue Titanium Alloys: Processing and Properties)

Abstract

:
The hot deformation behavior and microstructure evolution of a 7.5 vol.% TiBw/near α-Ti composite with fine matrix microstructure were investigated under the deformation conditions in a temperature range of 800–950 °C and strain rate range of 0.001–1 s−1 using plane strain compression tests. The flow stress curves show different characteristics according to the various deformation conditions. At a higher strain rate (1 s−1), the flow stress of the composite continuously increases until a peak value is reached. The activation energy is 410.40 kJ/mol, much lower than the activation energy of as-sintered or as-forged composites. The decreased activation energy is ascribed to the breaking of the TiBw reinforcement during the multi-directional forging and the resultant fine matrix microstructure. Refined reinforcement and refined matrix microstructure significantly improve the hot deformation ability of the composite. The deformation conditions determine the morphology and fraction of α and β phases. At 800–900 °C and 0.01 s−1 the matrix α grains are much refined due to the continuous dynamic recrystallization (CDRX). The processing map is constructed based on the hot deformation behavior and microstructure evolution. The optimal hot processing window is determined to be 800–950 °C/0.001–0.01 s−1, which lead to CDRX of primary α grains or dynamic recovery (DRV) and dynamic recrystallization (DRX) of β phase.

1. Introduction

With the advancement of the aerospace industry, particulate-reinforced titanium matrix composites (PRTMCs) have become attractive alternative materials due to their prominent properties such as high strength, high modulus of elasticity, good creep resistance and good high temperature durability [1,2,3,4,5]. It has been well accepted that the mechanical properties of PRTMCs depend on matrix, reinforcement and the interface between them. As for the matrix, the conventional near α high-temperature titanium alloys including Ti-1100 (Ti-6Al-2.75Sn-4Zr-0.4Mo-0.45Si, wt%) and BT36 (Ti-6.2Al-2.0Sn-3.6Zr-0.7Mo-5.0W-0.15Si, wt%) can be used in the applications of compressor disks and gas turbine blades for advanced jet engines, with a maximum service temperature of 600 °C [6,7,8,9]. TiB whiskers (TiBw) are preferentially chosen as the reinforcements for PRTMCs owing to their remarkable properties such as high modulus, high strength, high thermal stability, similar density to titanium and chemical compatibility to titanium matrix [10]. However, addition of reinforcements into titanium alloys causes significant difficulty of thermomechanical processing [11]. Therefore, understanding the hot deformation behavior and mechanisms of near-α PRTMCs is of great significance for optimizing processing parameters and obtaining better workability.
So far, the hot deformation behavior and microstructure evolution of PRTMCs have been studied extensively. Based on the hot compression test, the constitutive equations, processing maps and microstructural characteristic of PRTMCs with coarse matrix microstructure are clarified to reveal the hot deformation mechanisms [12,13,14,15]. Grain size and initial microstructure of titanium alloys also have important effects on their high temperature deformation behavior [16,17,18,19]. For example, Prasad et al. [16] found that in the deformation of β phase field, when the initial microstructure of Ti-6Al-4V were Widmanstatten microstructure and equiaxed microstructure, the corresponding deformation mechanisms were superplasticity and dynamic recrystallization, respectively. Zhao et al. [17,18] found that the apparent activation energy and strain rate sensitivity parameter increased with decreasing the width of α lamella. The dynamic spheroidization of the α lamella was more likely to occur in the deformation of (α + β) phase field. Zhang et al. [19] believe that grain refinement can increase nucleation sites, and dislocations within grains migrate more readily to grain boundaries, thereby increasing DRX driving force. It is noted that the hot deformation behavior of fine-grained titanium matrix composites (TMCs) is different from that of coarse-grained TMCs. However, few research on fine-grained TMCs has been reported. Besides, the research results on the high-temperature deformation behavior of as-cast coarse-grained TMCs are mainly applied to the initial ingot forging. Therefore, investigation of high temperature deformation behavior of fine-grained TMCs is significant for secondary hot working or hot forming such as plate rolling, to reveal the microstructure evolution and hot deformation mechanisms under different processing conditions. Ultimately, we may be able to control hot deformation parameters to optimize microstructures.
In the current study, a 7.5 vol.% TiBw/near α-Ti composite with fine matrix microstructure was obtained by multi-directional forging (MDF). Based on the plane-strain compression tests, the hot deformation behavior and microstructure characteristic were investigated to reveal the hot deformation mechanism of the composite with fine matrix microstructure. Additionally, the optimal hot processing window was determined by establishing the constitutive equations and processing maps.

2. Experiment

In this study, the matrix material was a near α high-temperature titanium alloy (Ti-6Al-2.5Sn-4Zr-0.7Mo-0.3Si), designed on the basis of Ti-1100. The composite ingot reinforced with 7.5 vol.% TiBw was fabricated in an induced skull melting furnace (ISM) [20,21]. Cuboid samples with dimensions of 70 mm × 35 mm × 35 mm were cut from the composite ingot and subjected to multi-directional forging at 1020 °C and at a strain rate of 0.01 s−1. The detailed processing route is schematically presented in Figure 1a,b. As shown in Figure 1b, the sample dimensions were kept unchanged during MDF, but the loading direction was changed by 90° after each pass. The samples were reheated to deformation temperature in the subsequent hot deformation compression tests. As shown in Figure 1c, the microstructure of the samples after multi-directional forging is composed of fine equiaxed α grains of about 2–3 μm and few residual β grains.
Prior to compression tests, we determined the β-transus temperature of the composite using metallographic techniques. Cylindrical samples 5 mm in diameter and 8 mm height were heated in a N2 atmospheric furnace with a temperature accuracy ±2 °C, and held for 30 min at the prescribed temperature, followed by water quenching. The tests were conducted with a temperature interval of 10 °C from 950 to 1050 °C. Depending on whether or not there is precipitation of the primary α in optical micrographs of the composite after quenching, the β-transus temperature of this composite was measured to be approximately 1015 °C.
Rectangular specimens with dimensions of 20 mm × 8 mm × 5 mm were cut from the forged workpieces for the plane strain high-temperature compression tests. The plane strain compression test was undertaken at a temperature from 800 °C to 950 °C with a strain rate of 0.001, 0.01, 0.1 and 1 s−1 on a Gleeble 3800 simulator (Date Sciences International, Minnestoa, MN, USA). The samples were heated at a heating rate of 10 °C/s and maintained for 5 min in a vacuum chamber before the compression test. After isothermal deformation (height reduction was 70%), specimens were quickly quenched in water.
The samples for microstructure observation were all cut from the central regions of the compressed specimens. The microstructural characteristics were observed with an optical microscope (OM, Leica DM-2700M, Wetzlar, Germany), a scanning electron microscope (SEM, Tescan, Brno, Czech Republic) and a transmission electron microscope (TEM, Tecnai G2F30, FEI, Hillsborough, OR, USA). For OM and SEM observations, the samples were mechanically ground and electrochemically polished, then etched with the Kroll’s reagent (10 mL HF, 30 mL HNO3, and 200 mL H2O). The specimens for TEM analysis were mechanically ground to about 50 μm, followed by twin-jet electrochemical thinning at 20 V and −20 °C. Electron Backscattered Diffraction (EBSD) analysis was carried out by an HKL EBSD detector (Oxford Instruments, Oxford, England) and HKL Channel 5 acquisition software on a field-emission scanning electron microscope (Carl Zeiss CrossBeam1540EsB, Jena, Germany). The samples for EBSD analysis were mechanically polished sequentially with 360 to 2000-grit SiC paper, followed by electrolytic polishing in an electrolyte containing 60% methanol, 34% n-butanol, and 6% perchloric acid. The scan step size was 0.2 μm. The image analysis software Image-Pro Plus (ver 6.0, Media Cybermetics, Rockville, MD, USA) and HKL-Channel 5 software (Oxford Instruments, Oxford, UK) were used to investigate the characteristics of the matrix microstructure.

3. Results and Discussion

3.1. Flow Behavior and Kinetic Analysis

The flow stress-strain curves of the 7.5 vol.% TiBw/near α-Ti composite obtained at different deformation conditions are shown in Figure 2. The flow stress decreases significantly with decreasing strain rate and increasing deformation temperature. The flow stress reduction is due to dynamic softening, including dynamic recovery (DRV) and dynamic recrystallization (DRX), both of which are more active at high temperatures and low strain rates. The shapes of true stress-strain curves are related to the relationship between work hardening and dynamic softening [22]. In the initial stage, the flow stress increases rapidly as the strain increases due to work hardening [23,24]. After reaching the maximum value, the flow stresses change moderately in the strain rate range of 0.001–0.1 s−1 because dynamic softening and work hardening reach an equilibrium. At a higher strain rate of 1 s−1, the flow stress continuously increases until a peak value is reached, indicating work hardening is dominant against dynamic softening. The work hardening generally appears as a result of multiplication and pile-up of dislocations. These dislocations do not have sufficient time to slide or climb at high strain rates. Furthermore, at 800 °C/1 s−1 (Figure 2a), the flow stress first increases to a peak value and then decreases until the true strain reaches 0.4 and then increases again. This result could be attributed to severe stress concentration around TiBw, synergic effect of shear band propagation and adiabatic heating [25]. Nevertheless, thermomechanical deformation mechanisms cannot be simply determined relying on the shapes of the flow stress-strain curves, because different microstructural mechanisms may result in several similar flow behaviors during hot deformation. Therefore, the microstructure evolution was further analyzed in the subsequent sections and a more accurate thermal deformation mechanism of the composite will be determined.
The effects of strain, strain rate and temperature on the mechanism of flow softening and hardening are well known during hot deformation. Constitutive models are constructed to provide insight of deformation characteristics. Arrhenius type equations are generally used to describe the relationship among the flow stress, strain rate and deformation temperatures as follows [26]:
ε ˙ = A [ sinh ( α σ ) ] n exp ( Q R T )
where A and α are the material constants independent of temperature, Q is the activation energy for hot deformation, R is the gas constant (8.314 J/mol·K) and n is the stress exponent (n = 1/m, m is the strain rate sensitivity).
Taking natural logarithms of Equation (1) leads to:
ln ε ˙ = ln A Q R T + n ln [ sinh ( α σ ) ]
Differentiation of Equation (2) gives rise to:
Q = R ln [ sinh ( α σ ) ] ( 1 / T ) ε ˙ ln ε ˙ ln [ sinh ( α σ ) ] T = R n n 3
Plots of ln[sinh(ασ)] vs. T−1 and ln[sinh(ασ)] vs. ln ε ˙ are shown in Figure 3. From Figure 3, we calculated n = 3.81 and n3 = 12,940.73. Combining above results, the activation energy (Q) of the composite is estimated to be 410.40 kJ/mol, which is much lower than that of as-forged (TiB + La2O3)/Ti composites (753 kJ/mol) [12] and as-sintered TiBw/Ti60 composite (681.15 kJ/mol) [22], respectively. The decrease of the activation energy is related to the breaking of TiBw reinforcement during multi-directional forging and the fine matrix microstructure which significantly improves the hot deformation ability of the composite.
In addition, the above activation energy (Q) can be used for the Zener-Hollomon parameter (acting as a compensating factor):
Z = ε ˙ exp ( Q R T ) = A [ sinh ( α σ ) ] n
Equation (4) can be rewritten as:
ln Z = ln ε ˙ + Q R T = ln A + n ln [ sinh ( α σ ) ]
Substituting the thermal activation energy Q into Equation (5), we can calculate the corresponding value of lnZ, and plot the linear fitting relationship between lnZ and ln[sinh(ασ)], as shown in Figure 4. The slope in Figure 4 represents the stress index n and the intercept is lnA. The correlation coefficient R2 for the constitutive model is 0.981, indicating that the established constitutive equation is suitable for the 7.5 vol.% TiBw/near α-Ti composite. Finally, the constitutive equation can be presented as:
ε ˙ = e 38.53 [ sinh ( 0.0062 σ ) 3.668 exp ( 410 , 399 R T )

3.2. Microstructure Evolution

3.2.1. Effect of Deformation Temperature

The SEM and OM images from the deformed specimens and at the strain rate of ε = 0.01 s−1 and various temperatures are shown in Figure 5. The variation of α grain size with temperature at the strain rate of ε = 0.01 s−1 is shown in Figure 6. The diameter of equiaxed α phase increases with increasing deformation temperature. In the sample deformed at 800 °C (Figure 5a,b), the matrix microstructure mainly consists of equiaxed α grains with an average diameter of 1.5 μm (Figure 6) and few residual β grains which are elongated perpendicular to compression direction by the rolling force. Similarly, the TiBw are also distributed uniformly perpendicular to compression direction. When the deformation temperature is 850 °C (Figure 5c,d), the distribution of equiaxed α grains (of which the diameter is about 2 μm), residual β grains and TiBw are similar to Figure 5b.
As illustrated in Figure 5e,f and Figure 6, further increasing the temperature to 900 °C causes an increased diameter of equiaxed α grains (about 2.3 μm) and an increased fraction (4.64 vol.%) of transformed β phase (βt). At 950 °C (Figure 5g,h) the βt content further increases to about 52.3 vol.% of matrix. This phenomenon can be attributed to the transformation of more α to β phase at higher temperatures. The average diameter of equiaxed α phase increases to around 5.2 μm ascribing to rapid grain growth at high temperatures.
The microstructure of the specimens deformed at 800 °C/0.01 s−1 and 900 °C/0.01 s−1 are characterized by EBSD and shown in Figure 7. Both microstructures are not uniform. It can be seen that a large quantity of low-angle grain boundaries (LAGBs, 2–15°) are distributed in the equiaxed α grains. The LAGBs fraction decreases from 46 vol.% to 39 vol.% as the deformation temperature increases.
From the above results, it is apparent that the matrix microstructure is significantly influenced by deformation temperature. At the strain rate of 0.01 s−1, the content of primary α phase (αp) decreases with increasing temperature. This phenomenon can be attributed to the transformation of more α phase to β phase at higher temperatures. At different deformation temperatures the primary α and β phases play different roles in hot deformation. At lower temperatures (800–900 °C), the primary α phase acts as a dominant phase and fine equiaxed α grains confirm the occurrence of DRX. The soft β phase is unlikely to make major contribution during hot deformation, thus the flow stress is high. However, with increasing deformation temperature more primary α phase transform into β phase, and final transform into βt (fine needle/lamellar secondary α phase and residual β phase) during the cooling process as shown in Figure 5. It is known that the body centered cubic (bcc) β phase has a single close packed <111> direction, several activated sliding planes and lower strength than hexagonal close-packed (hcp) α phase [27]. Therefore, the β phase acts as a dominant phase during deformation when the β phase content increases to about 50 vol.%. Thus, as shown in Figure 2d, the flow stress dramatically decreases with increasing temperature to 950 °C. Meanwhile, the decreased flow stress is related to the mobility of dislocation in the primary α phase. At higher temperatures, the dislocation movement is easier.
Additionally, the grain refinement of the primary α phase occurs at 800 °C. There are a large number of low-angle grain boundaries (LAGBs, 2–15°) within the DRXed α grains. In the coarse DRXed α grains, the number density of LAGBs is low, as shown in Figure 7d. Dislocation density is one of the factors determining the driving force for the formation of DRXed grains [28]. As the dislocation density increases, the obstacle of the critical nucleus forming can be overcome. Therefore, at low temperatures high dislocation density leads to a high nucleation rate for DRX. Furthermore, it seems that the new DRX grains in αp are evolved from subgrain in situ. This evolution represents a typical continuous dynamic recrystallization (CDRX) mechanism [29]. Since the pre-deformed microstructure is equiaxed α grains with a large quantity of LAGBs, and the size of α grain is very small (around 2 μm), it is relatively easy to disintegrate primary α grains into new DRXed grains. A similar mechanism was proposed by Weiss et al. [30] to explain the formation of lamellar α cleavage in Ti-6Al-4V. In comparison with as-sintered TiB/TA15 composite with initially coarse primary α grains and residual β phase layer microstructure [31] and as-cast Ti-6Al-4V-0.1B alloy with Widmannstatten colonies [32], we can see that the TiBw/near α-Ti composite with fine equiaxed α phase is instrumental to the CDRX. Roy et al. [32] found that globularization at higher temperatures leads to flow softening. In this study, the CDRX occurs at all temperatures. The temperature range of CDRX is broadened by influence of the initially fine matrix microstructure. We believe that grain refinement can increase nucleation sites, and dislocations within grains migrate more easily to grain boundaries, thereby increasing CDRX driving force.

3.2.2. Effect of Strain Rate

Figure 8 shows the microstructure of the TiBw/near α-Ti composite specimens deformed at 900 °C and various strain rates. Figure 9 shows the variation of α grain size with strain rate at 900 °C, we found that α grain size is smallest at the strain rate of 0.01 s−1. The morphology of αp and β grains changes with strain rate and the αp is a dominant phase. At lower strain rates (Figure 8a,b), both αp and βt appear equiaxed and are not elongated perpendicular to compression direction, indicating the DRX is the dominant softening mechanism. The measured average DRXed α grain size increases from 2.3 μm to 5.5 μm (Figure 9) and the proportion of βt increases with decreasing strain rate, which are ascribed to sufficient time for grain growth and phase transformation (α → β). At higher strain rates (Figure 8c,d), the αp and βt are elongated perpendicular to compression direction. In addition, the coarser α grains (Figure 9) and the elongated α grains with the straight boundary indicates low degree of dynamic recovery and dynamic recrystallization due to the insufficient time at high strain rates [22]. We also found that the length of lamellar secondary α phase, embedded in βt, decreases with increasing strain rate from 0.1 s−1 (Figure 8c) to 1 s−1 (Figure 8d). The spheroidization of secondary α phase is more obvious. Furthermore, as the strain rate increases, the proportion of βt increases with strain rate, which is ascribed to the adiabatic temperature rising caused by the low thermal conductivity of titanium during the high strain rate deformation [33].
TEM micrographs are shown in Figure 10 to investigate the effect of the strain rate on the evolution of matrix microstructure. The fine DRXed grains with relatively low dislocation density are observed in Figure 10a. As shown in Figure 10b, some subgrains and dislocations exist in the αp, indicating occurrence of CDRX. The high dislocation density in the αp and lamellar secondary α grain is visible at high strain rate of 1 s−1 (Figure 10c,d), forming dislocation arrays.
From the above observations, we believe that the strain rate can significantly influence the morphology of αp and βt. The equiaxed α grains become refined with increasing strain rate, due to a high nucleation rate and insufficient time for grain growth. DRX does not occur at high strain rates (>0.1 s−1). It is well known that strain energy stored in dislocations and the thermal activation effect are the two key factors that determine the occurrence of DRX. The occurrence of DRX requires sufficient strain energy associated with high dislocation content, as well as sufficient thermal activation effect associated with high deformation temperature (>crystallization temperature) and low strain rate [34]. At 900 °C, the dislocation content increases with increasing strain rate, as shown in Figure 10. At strain rates of 0.1 to 1 s−1 although strain energy is sufficiently high, the DRX hardly takes place due to insufficient time accounting for insufficient thermal activation. Therefore, DRV is the dominant deformation mechanism under these parameters. Besides, we also found that the length of lamellar secondary α phase, embedded in βt, decreases with increasing strain rate from 0.1 s−1 (Figure 8c) to 1 s−1 (Figure 8d), and the spheroidization of secondary α phase is more obvious. The phenomenon is related to the generation of a large number of defects such as dislocations in βt during high strain rate deformation, which provides more nucleation sites for lamellar secondary α during phase transformation [35]. It indicates poor hot deformability of the composite under these conditions. It can be seen from the above results that the deformation microstructure is sensitive to strain rate, and the flow stress during the plane strain compression process also reflects this. The strain rate determines the deformation heat and deformation time, which in turn affects the phase transformation and phase content during thermal deformation.

3.3. Processing Map

Processing maps are constructed based on the principles of dynamic materials model (DMM) [36]. The processing map can provide important information on what a particular mechanism is for a material under certain processing conditions. It can also indicate the processing conditions that should be avoided during thermal processing. The map is usually superimposed by a power dissipation map and an instability map, which can illustrate the “safe” domain and “unsafe” domain during thermomechanical processing.
According to Prasad and Zeigler [36,37], a workpiece is a power dissipater, and the power dissipation characteristics through microstructural changes are expressed as efficiency of power dissipation. The change of the dimensionless parameter (η) is called the efficiency of power dissipation and is given by the strain rate sensitivity parameter (m):
η = 2 m m + 1
The power dissipation map represents how the material dissipates power through the microstructure evolution [38]. Based on the extremum principle of irreversible thermodynamics, the flow instability map is constructed by continuous instability criterion and applied to the large plastic flow, and the instability criterion is derived by [39]:
ξ ( ε ˙ ) = ln ( m m + 1 ) ln ε ˙ + m < 0
The flow stress data are used to construct a processing map of composite under true strain of 0.4, as illustrated in Figure 11a. The contour line represents the efficiency of power dissipation-η (%), and shaded region represents the flow instability region, which is generally correlated with negative ξ(ε) regimes. Prasad et al. argue that the safe domain is usually associated with DRV, DRX or superplasticity, while local plastic flow, adiabatic shear bands and cracks are the main destabilizing mechanisms [16]. From Figure 11a, the results show that the instability domain I appears in the region where the strain rate is greater than about 0.01 s−1 and the temperature is lower than 850 °C. The microstructure instability manifestation of the composite is illustrated in Figure 11b, which corresponds to the sample deformed at 800 °C/1 s−1. The macroscopic image exhibits two cracks located at the junction of the deformed zone and the undeformed zone. The junction has the obvious stress concentration phenomenon, which easily induces crack initiation. Meanwhile, the instability microstructure exhibits a number of voids, bending and kinking of α colonies and fracture of TiBw. Moreover, the voids appearing near the TiBw and the interfacial debonding between TiBw and the matrix can be interpreted that at low temperatures and high strain rates, a large number of dislocations tend to accumulate near TiBw and the stress concentration at the TiBw tip might be sufficiently high to break the TiBw whiskers. Inhomogeneous deformation like bending and kinking of α colonies is considered an instability indication.
The stability domains II and III correspond to lower strain rates and higher temperatures. The microstructure of stability region II is shown in Figure 11c, which corresponds to the sample deformed at 950 °C/0.1 s−1. Under this deformation condition, the microstructure mainly consists of elongated primary α colonies and βt. The wavy boundaries of elongated α colonies indicate that dynamic recovery (DRV) is the dominant softening mechanism. A similar phenomenon can be seen in Figure 8c, as discussed in Section 3.2.2. Furthermore, some equiaxed α grains can be found in Figure 11c, which demonstrates CDRX of some primary α grains. The CDRX in primary α grains is the dominant softening mechanism at 900 °C/0.001 s−1 for region III (Figure 11d). As discussed in Section 3.2.1, at temperature of 800–950 °C and low strain rates, there are sufficient dislocation strain energy and thermal activation for the CDRX in primary α grain or β grain.
Meanwhile, as the strain rate decreases and the temperature increases, the efficiency of power dissipation also increases (Figure 11a). The map shows two peak efficiency domains: One at 850 °C/0.01 s−1 with a peak efficiency of approximately 44% and the other at 950 °C/0.01 s−1 with a peak efficiency of approximately 50%. It is generally agreed that a higher value of η contributes to the thermal deformation of the composite. This region may represent the best hot rolling conditions for the composite. This study suggests that optimal deformation condition is 800–950 °C and 0.001–0.01 s−1.

4. Conclusions

We investigated hot deformation behavior and microstructure evolution of 7.5 vol.% TiBw/near α-Ti composite with fine matrix microstructure under various conditions. The following conclusions can be drawn:
1.
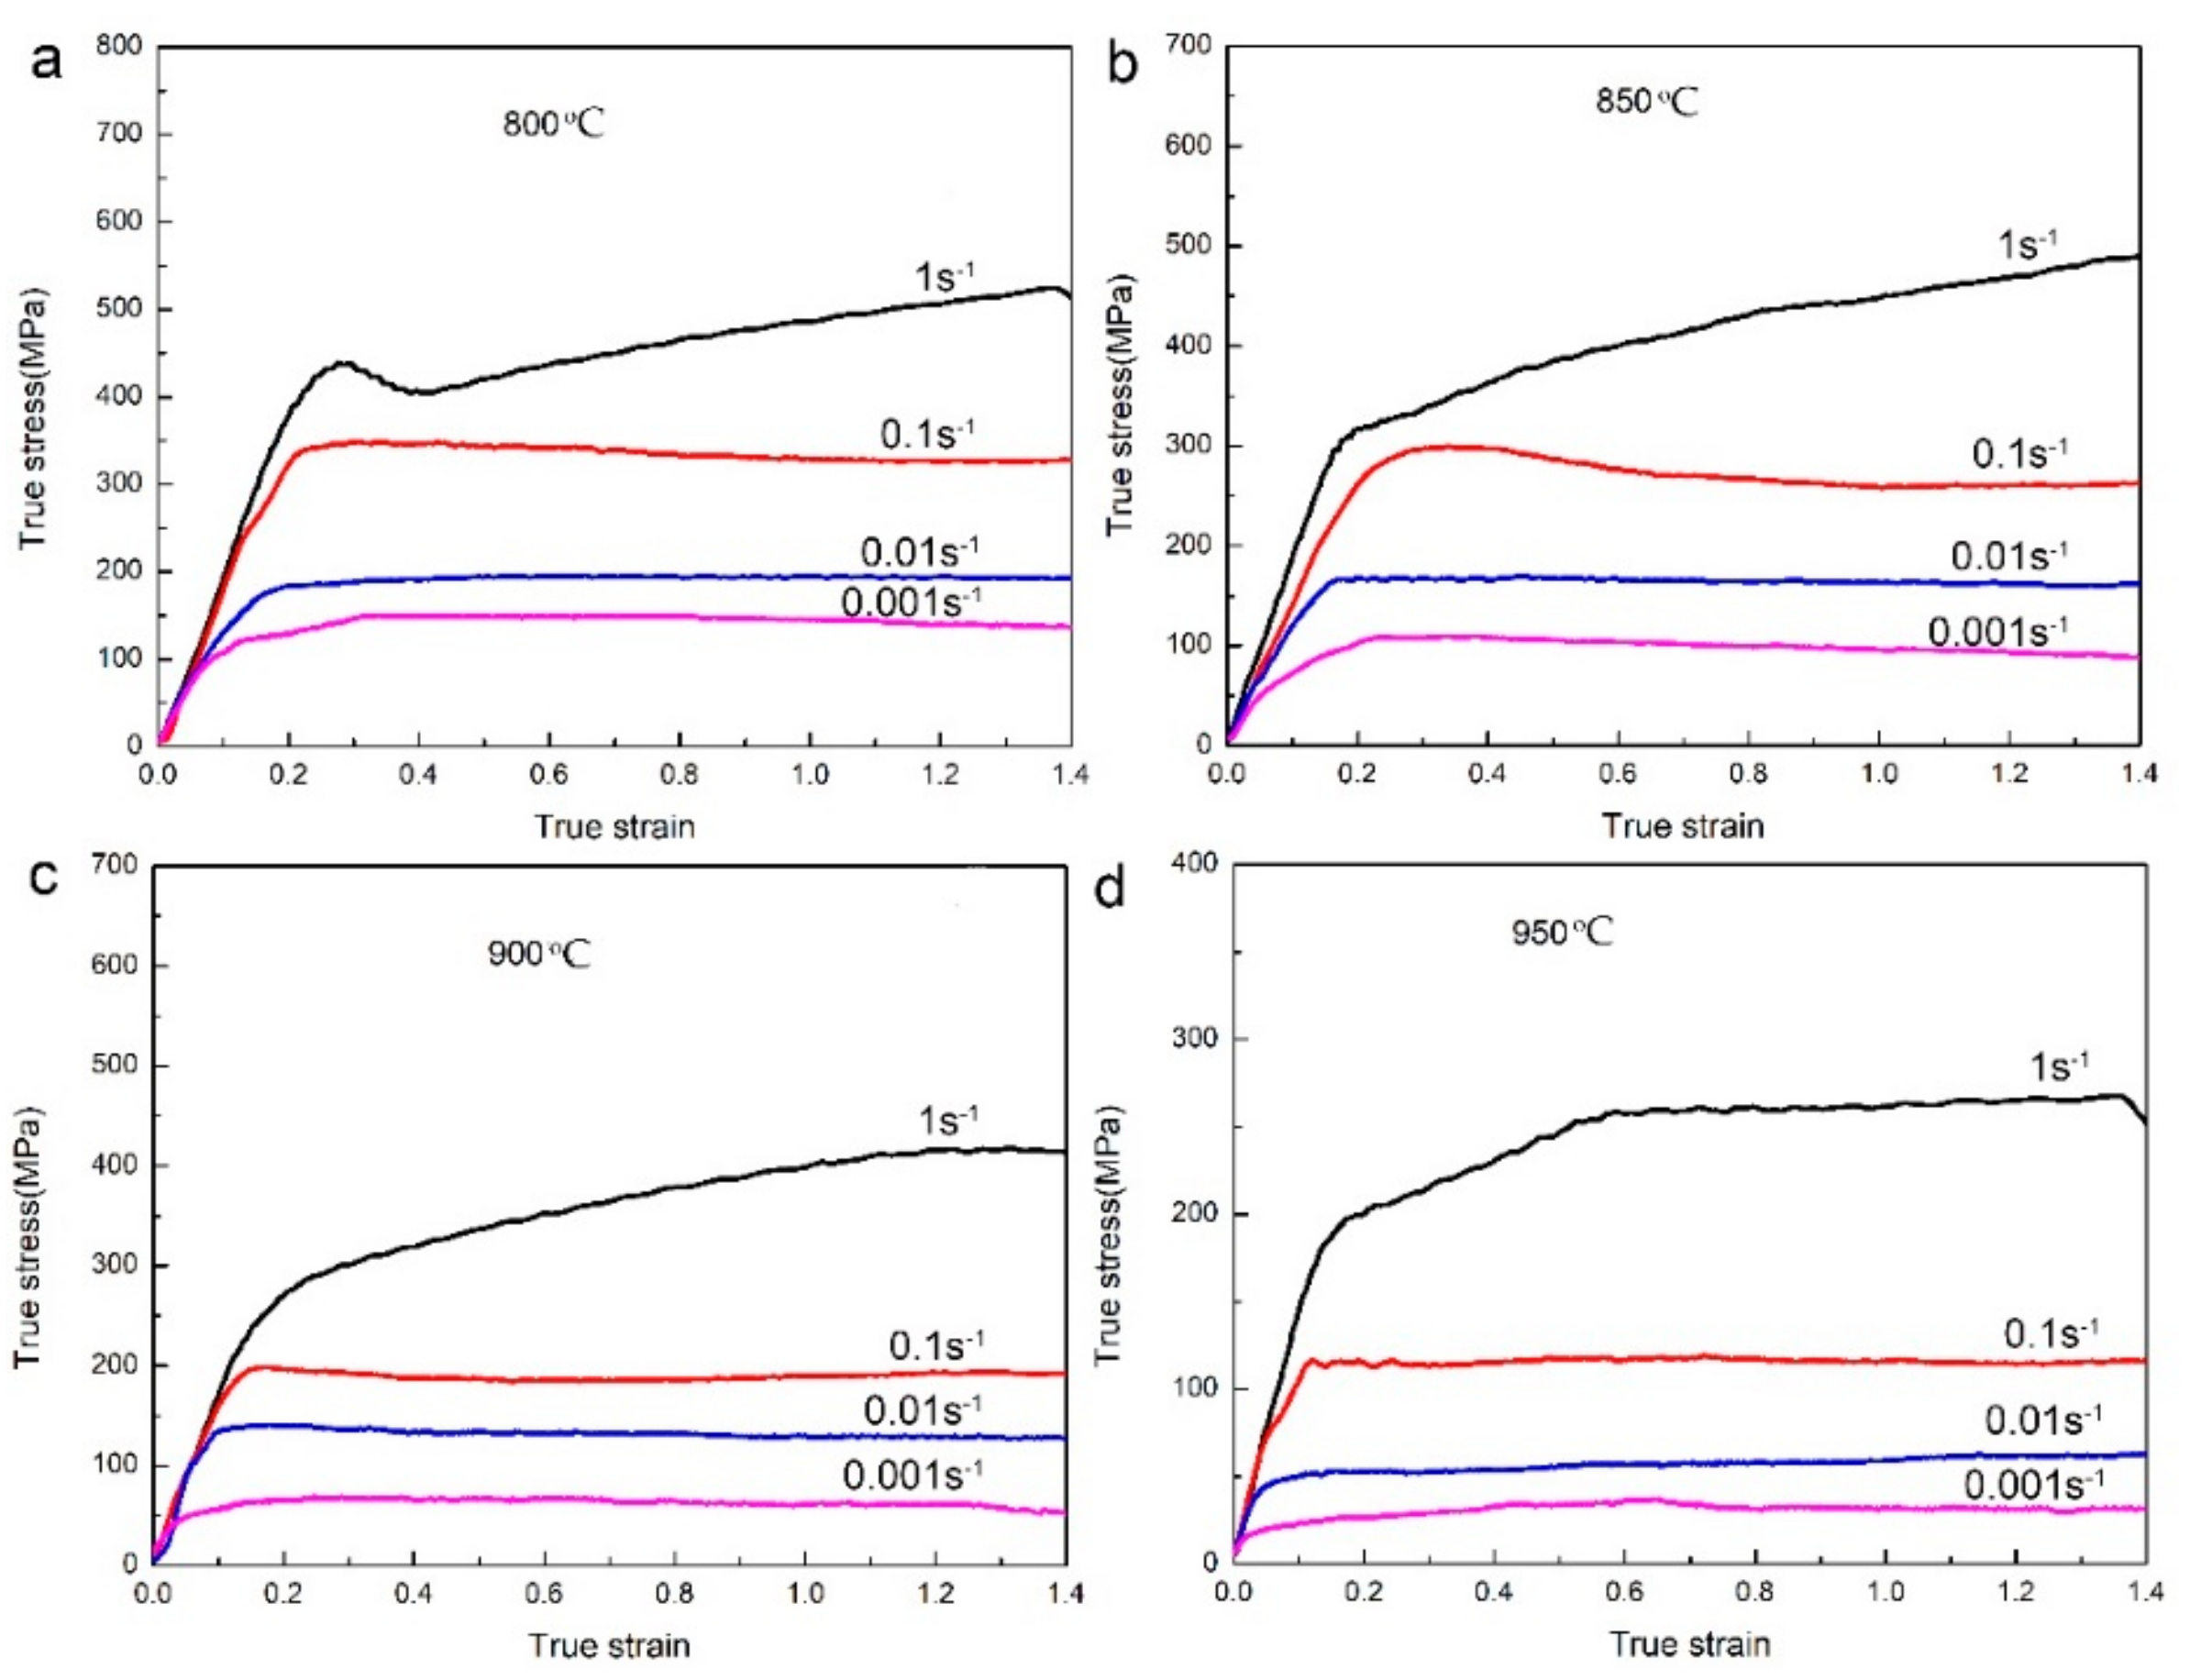
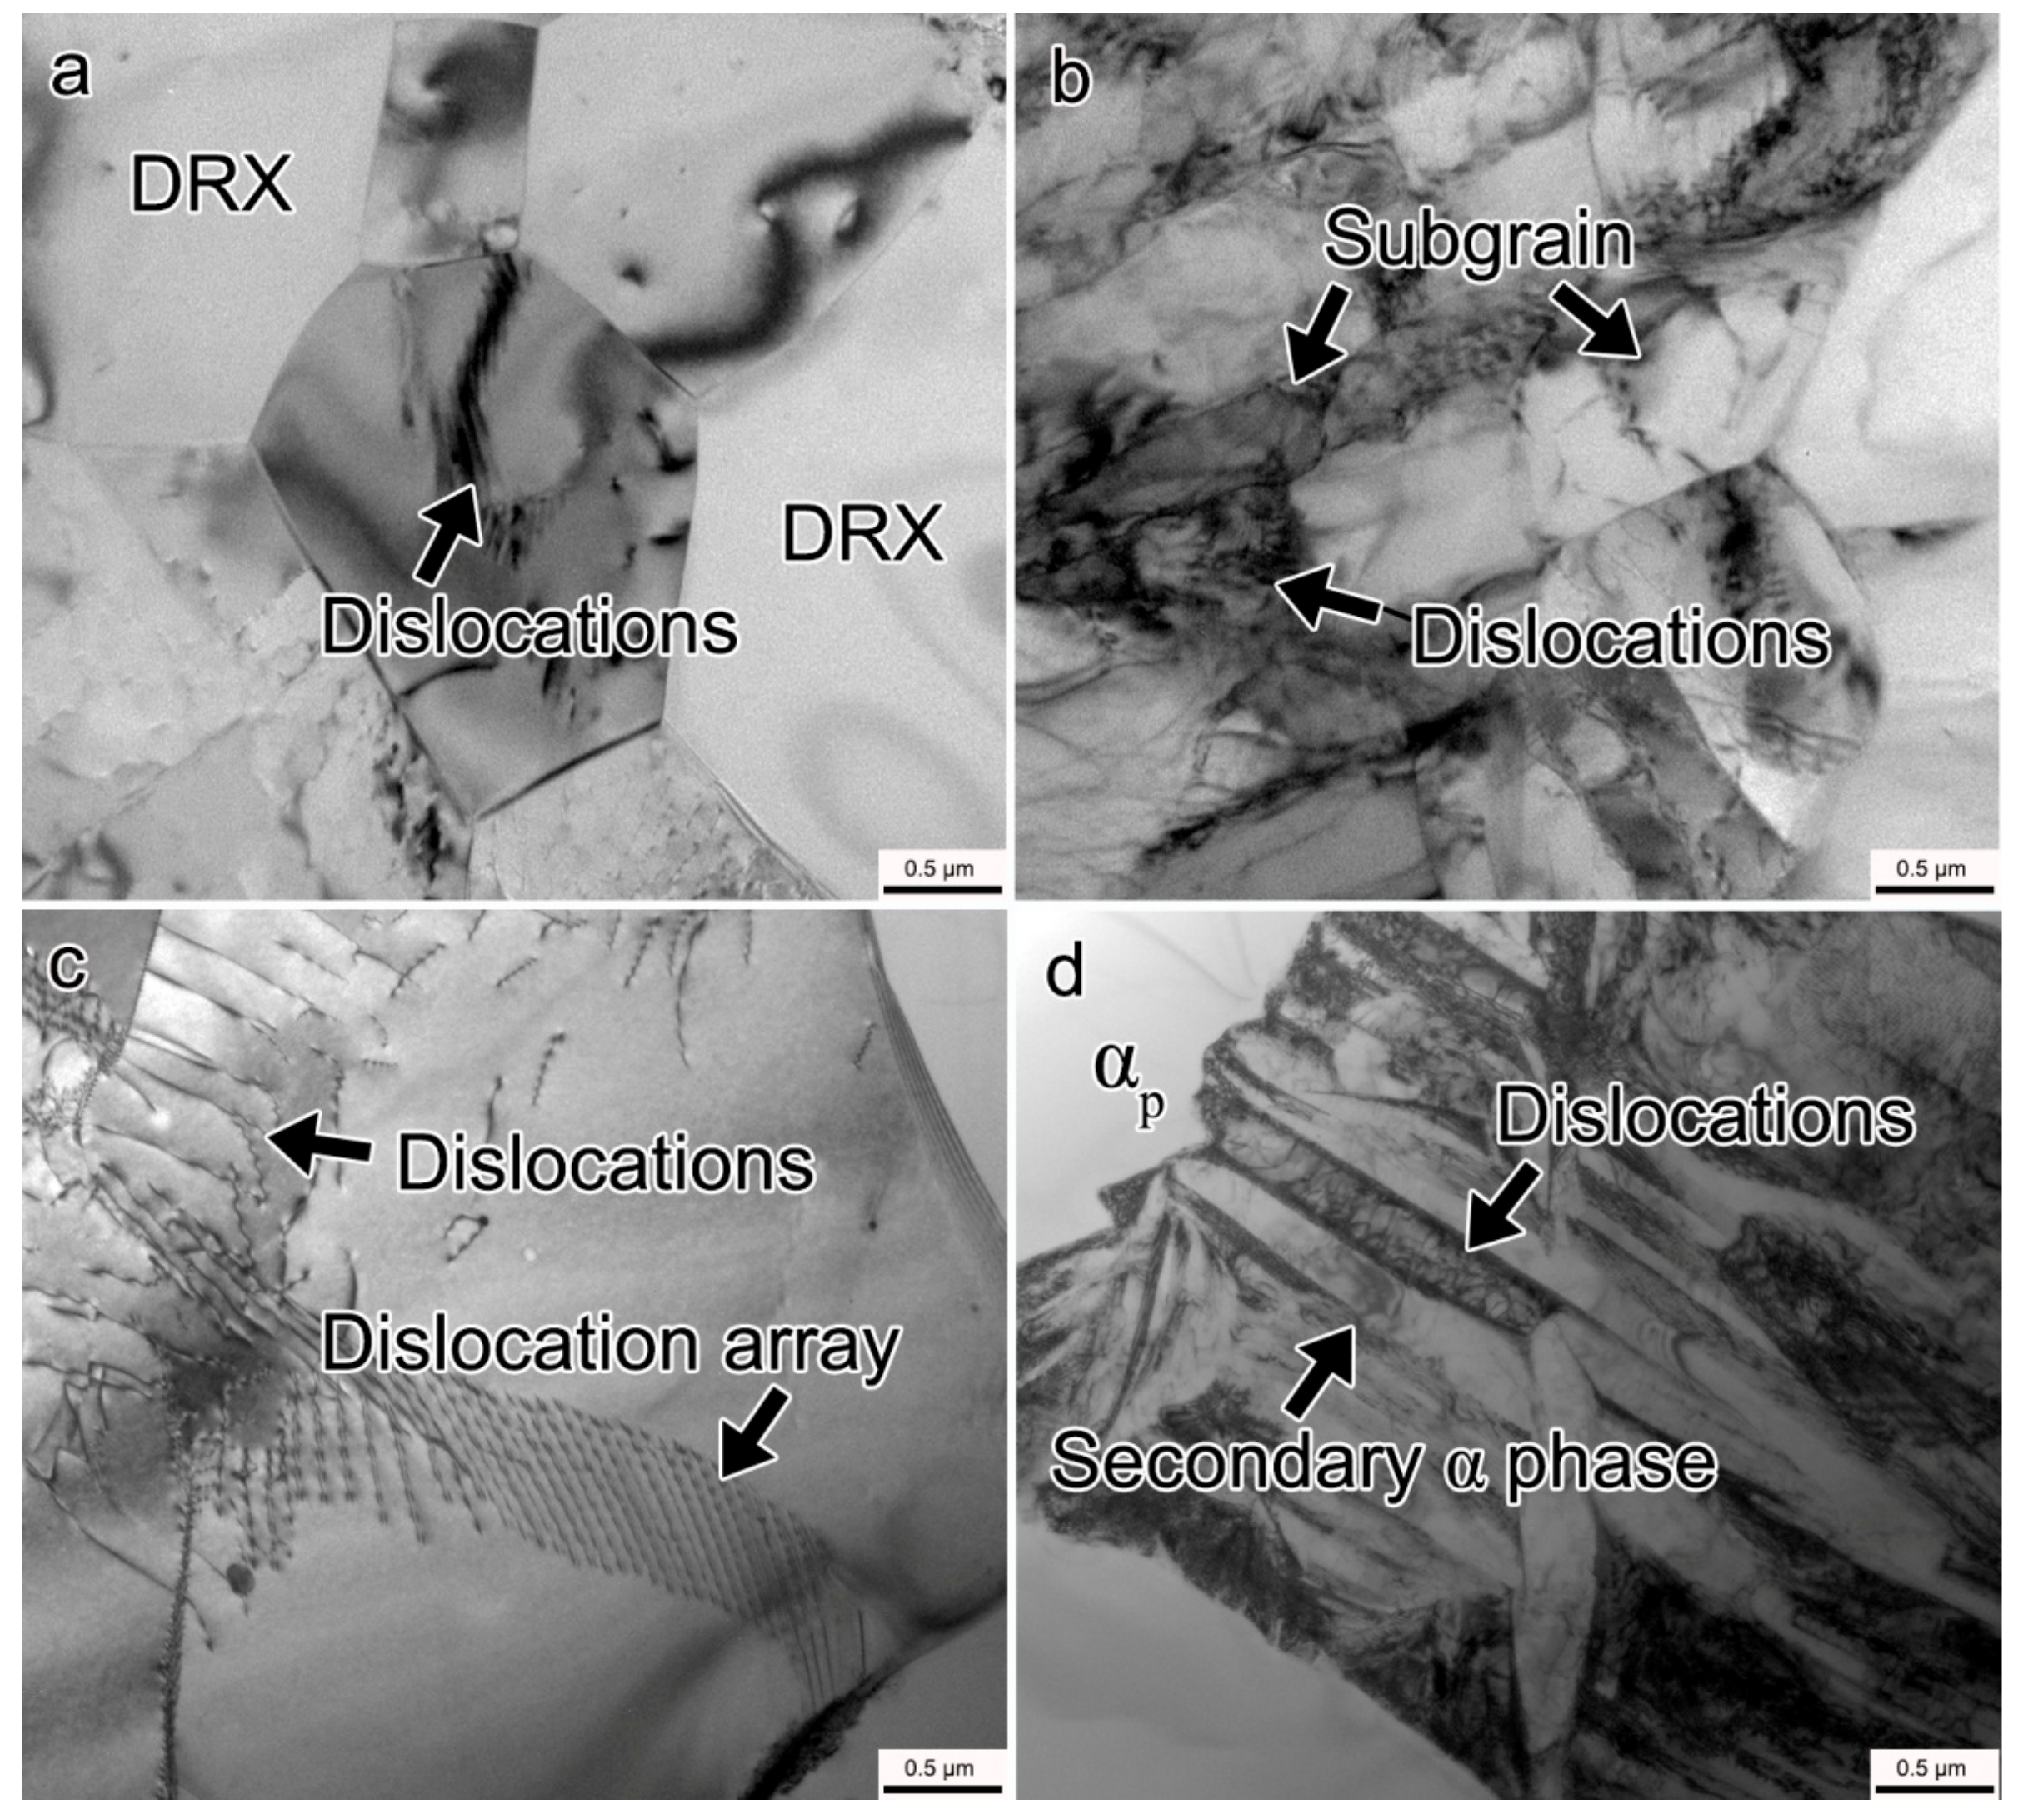
During the plane strain compression test, the deformation temperature and strain rate have an obvious influence on the flow stress of the composite. The flow stress decreases as the temperature increases and the strain rate decreases. Flow stress curves exhibit typical work hardening characteristics at high strain rate (1 s−1), while flow steady state appears at low strain rate (<1 s−1). The flow hardening behavior is believed to be related to multiplication and pile up of dislocations at high strain rates.
2.
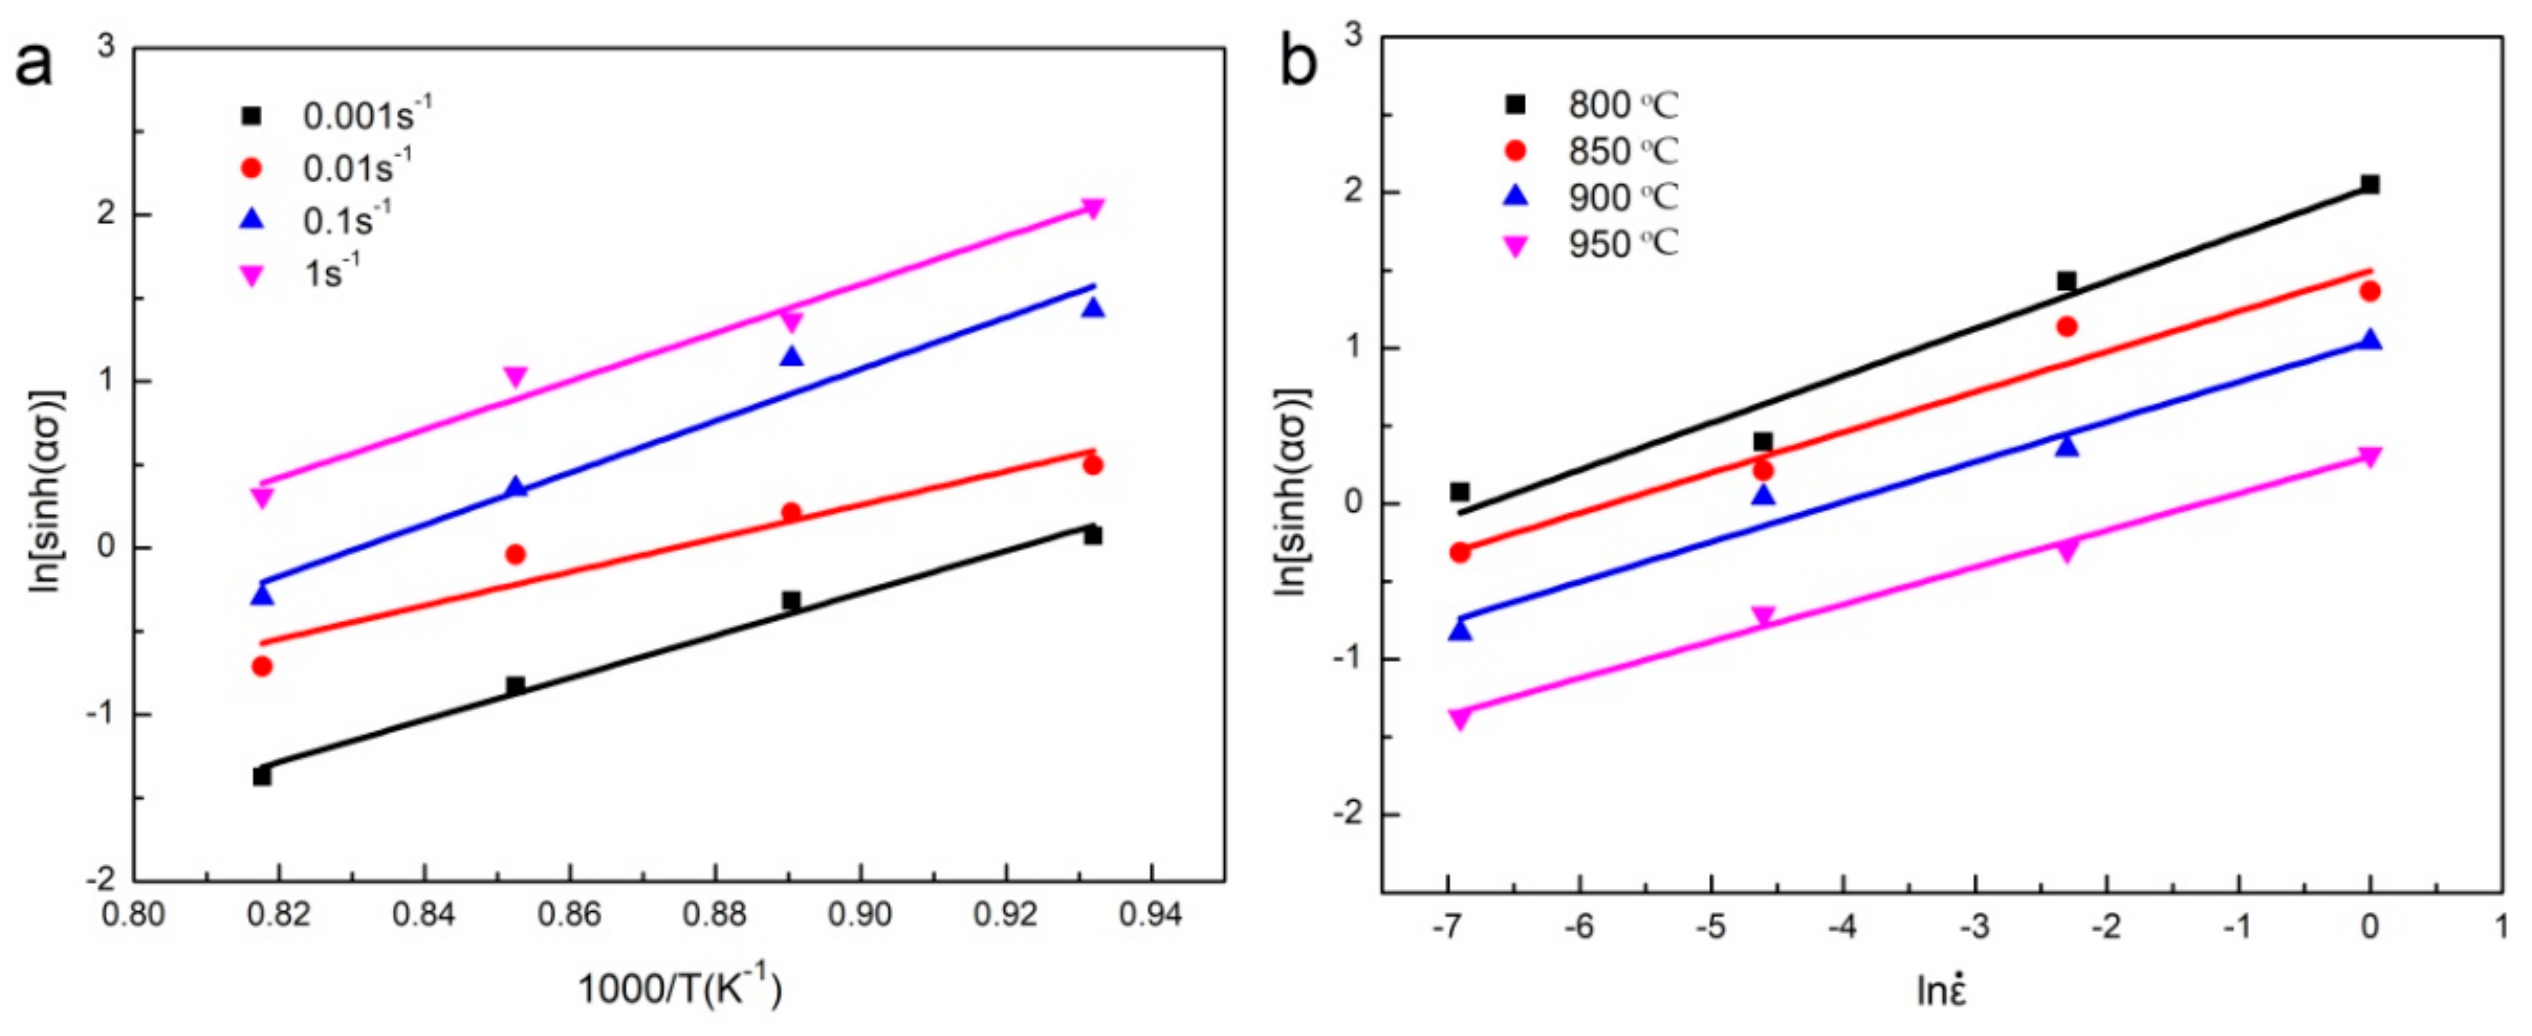
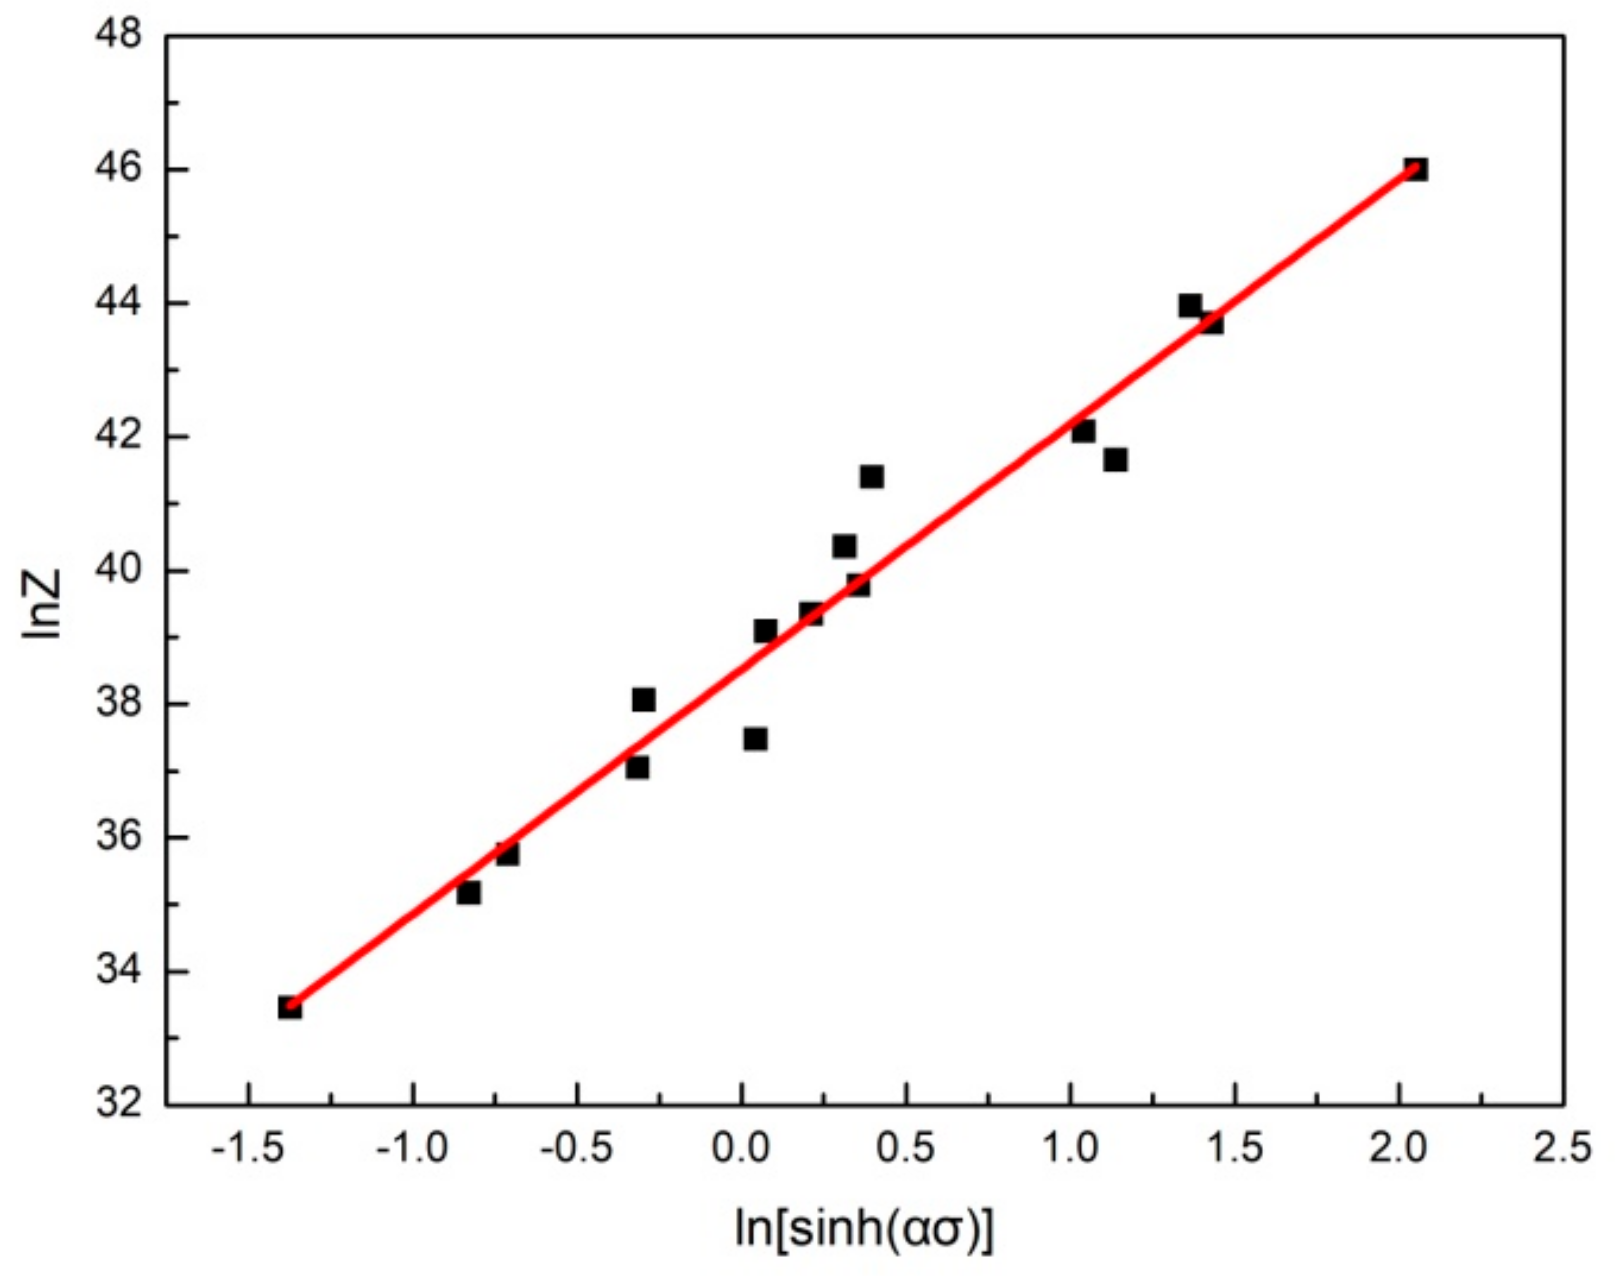
Based on strain, strain rate and temperature, the constitutive equation of the 7.5 vol.% TiBw/near α-Ti composite was established:
ε ˙ = e 38.53 [ sinh ( 0.0062 σ ) ] 3.668 exp ( 410 , 399 R T ) .
The deformation activation energy is 410.40 kJ/mol, which is lower than the activation energy of as-sintered and as-forged composite. The decrease of activation energy is related to the breaking of TiBw reinforcement during multi-directional forging and fine matrix microstructure which significantly improves the hot deformation ability of composite.
3.
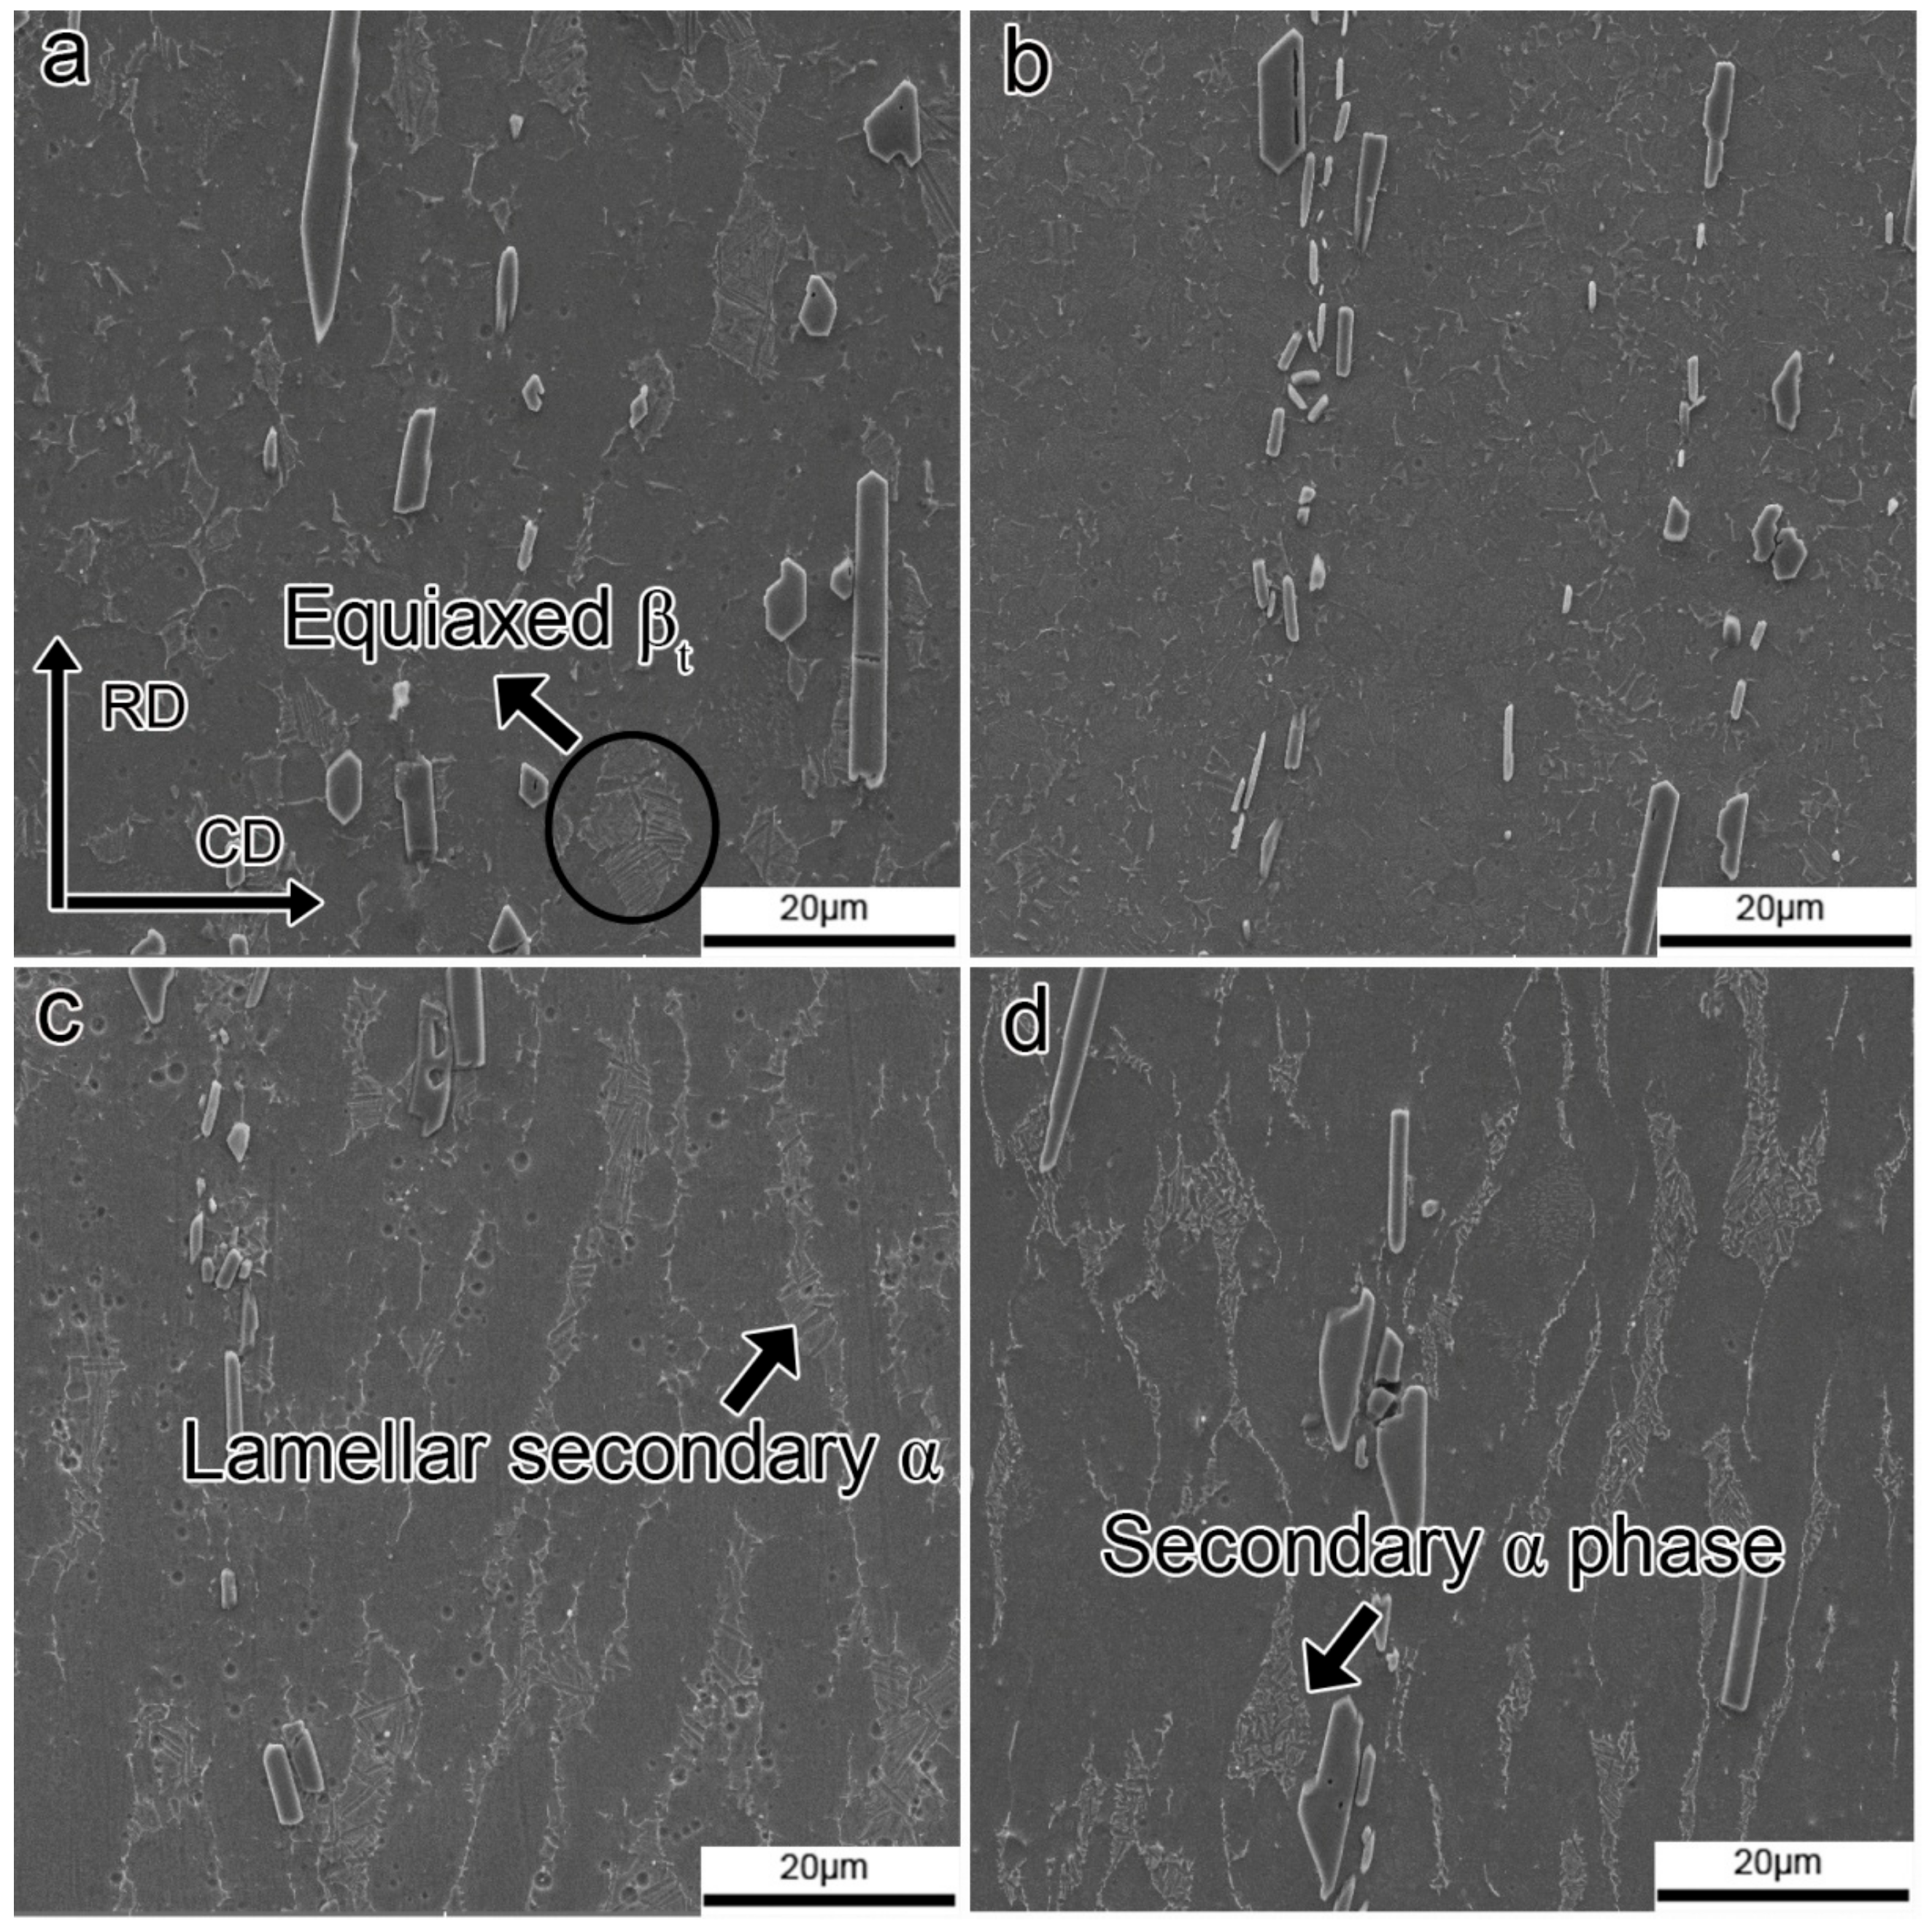
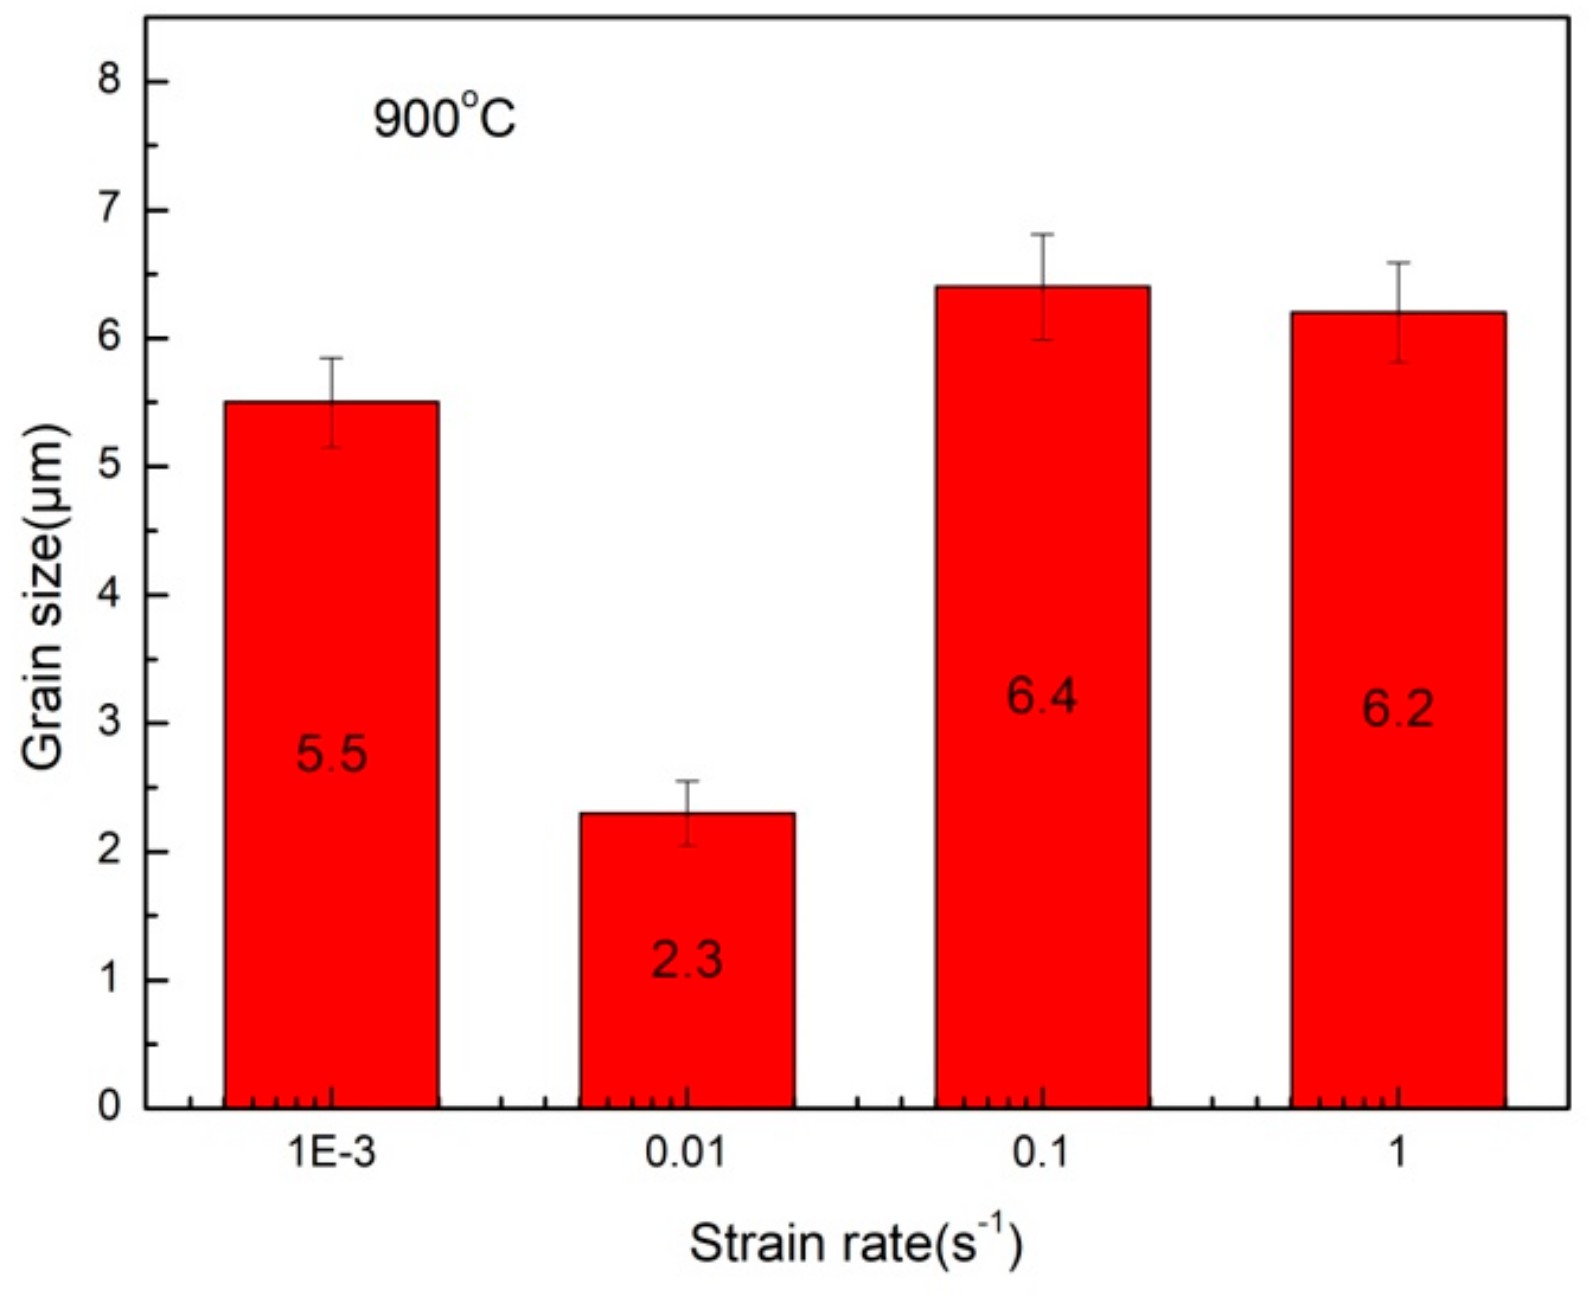
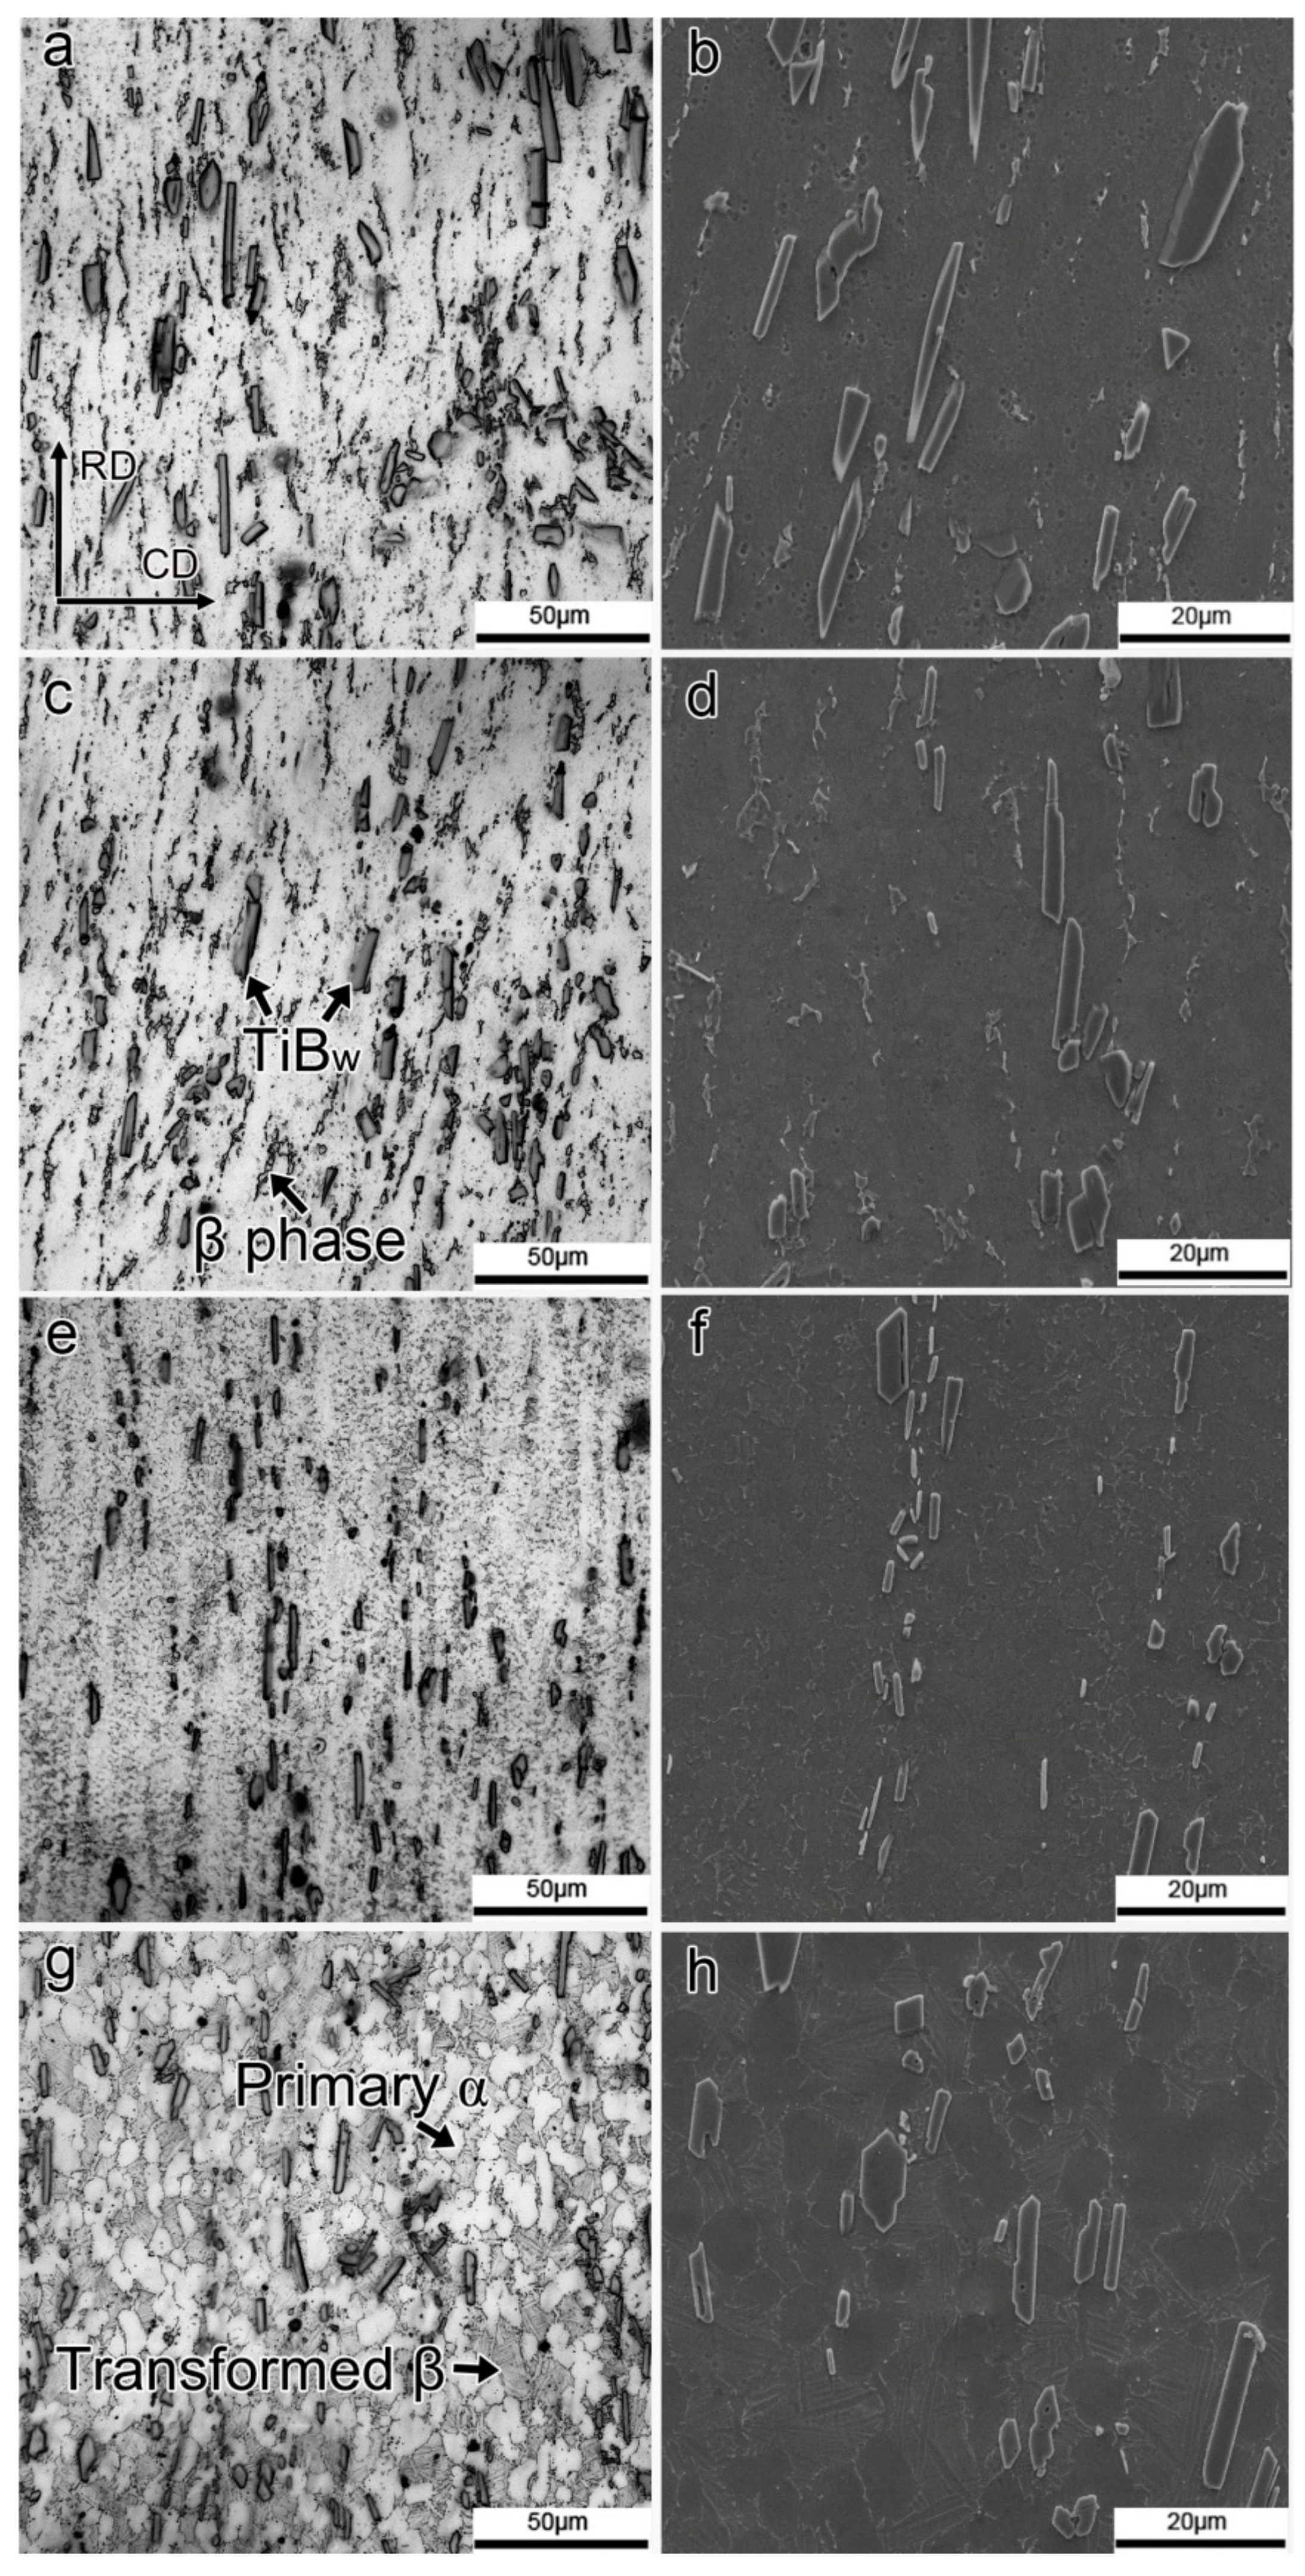
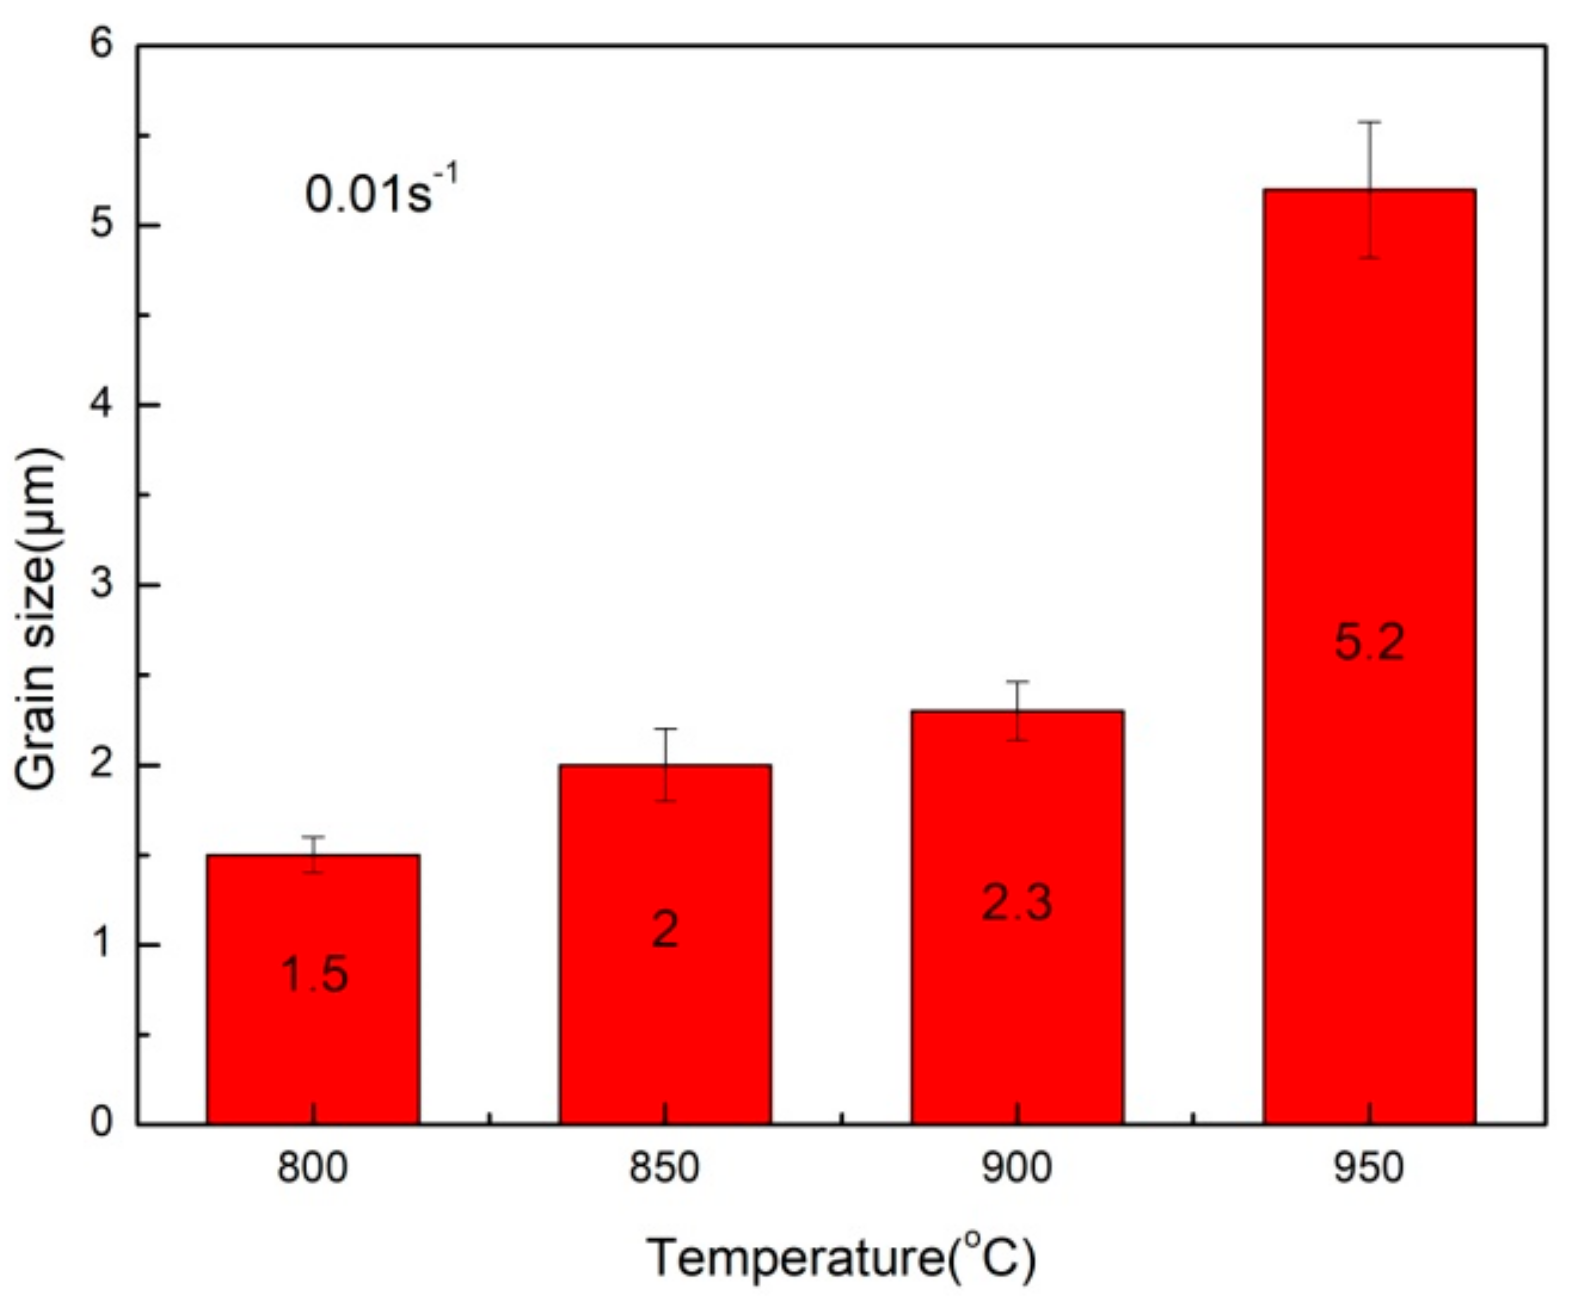
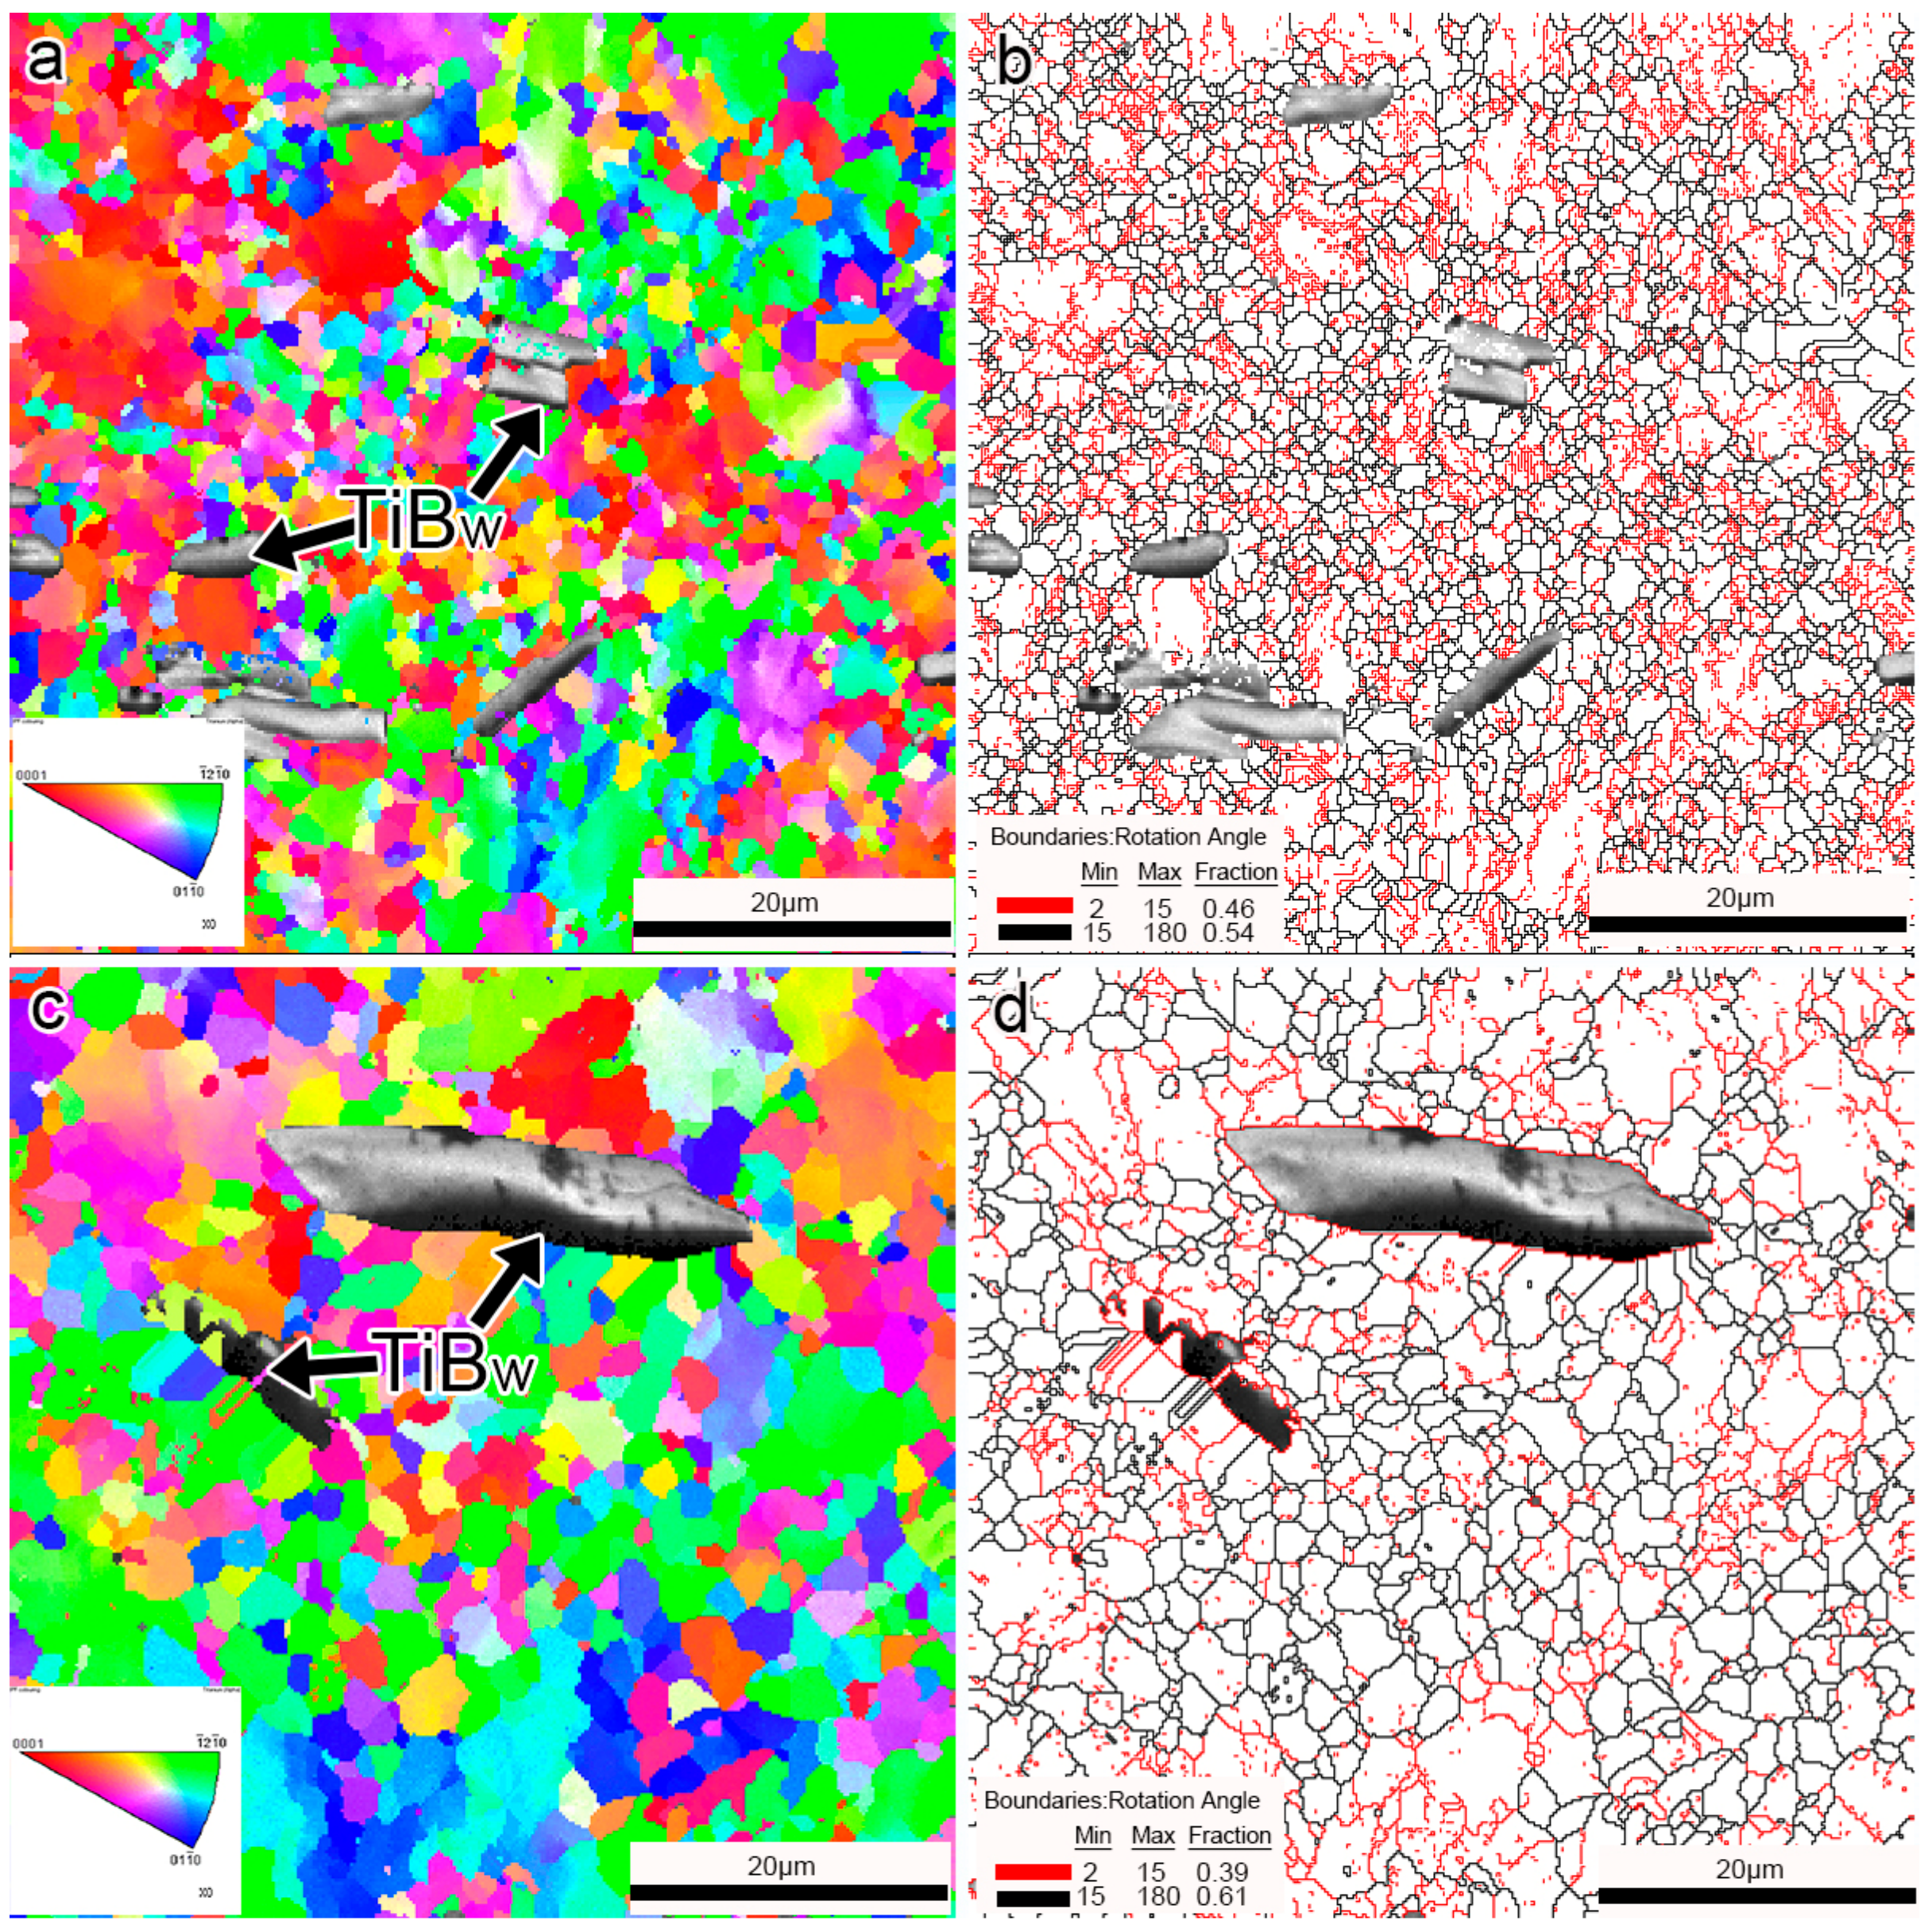
As the deformation temperature increases, the fraction of the primary α phase decreases and the dimension increases, corresponding to a decrease in flow stress. At 800–900 °C and 0.01 s−1 the matrix α grains are fine due to the occurrence of CDRX. The equiaxed α grain refine with increasing strain rate attributing to higher nucleation rate and insufficient time for grain growth. But the DRX cannot occur at high strain rates (>0.1 s−1).
4.
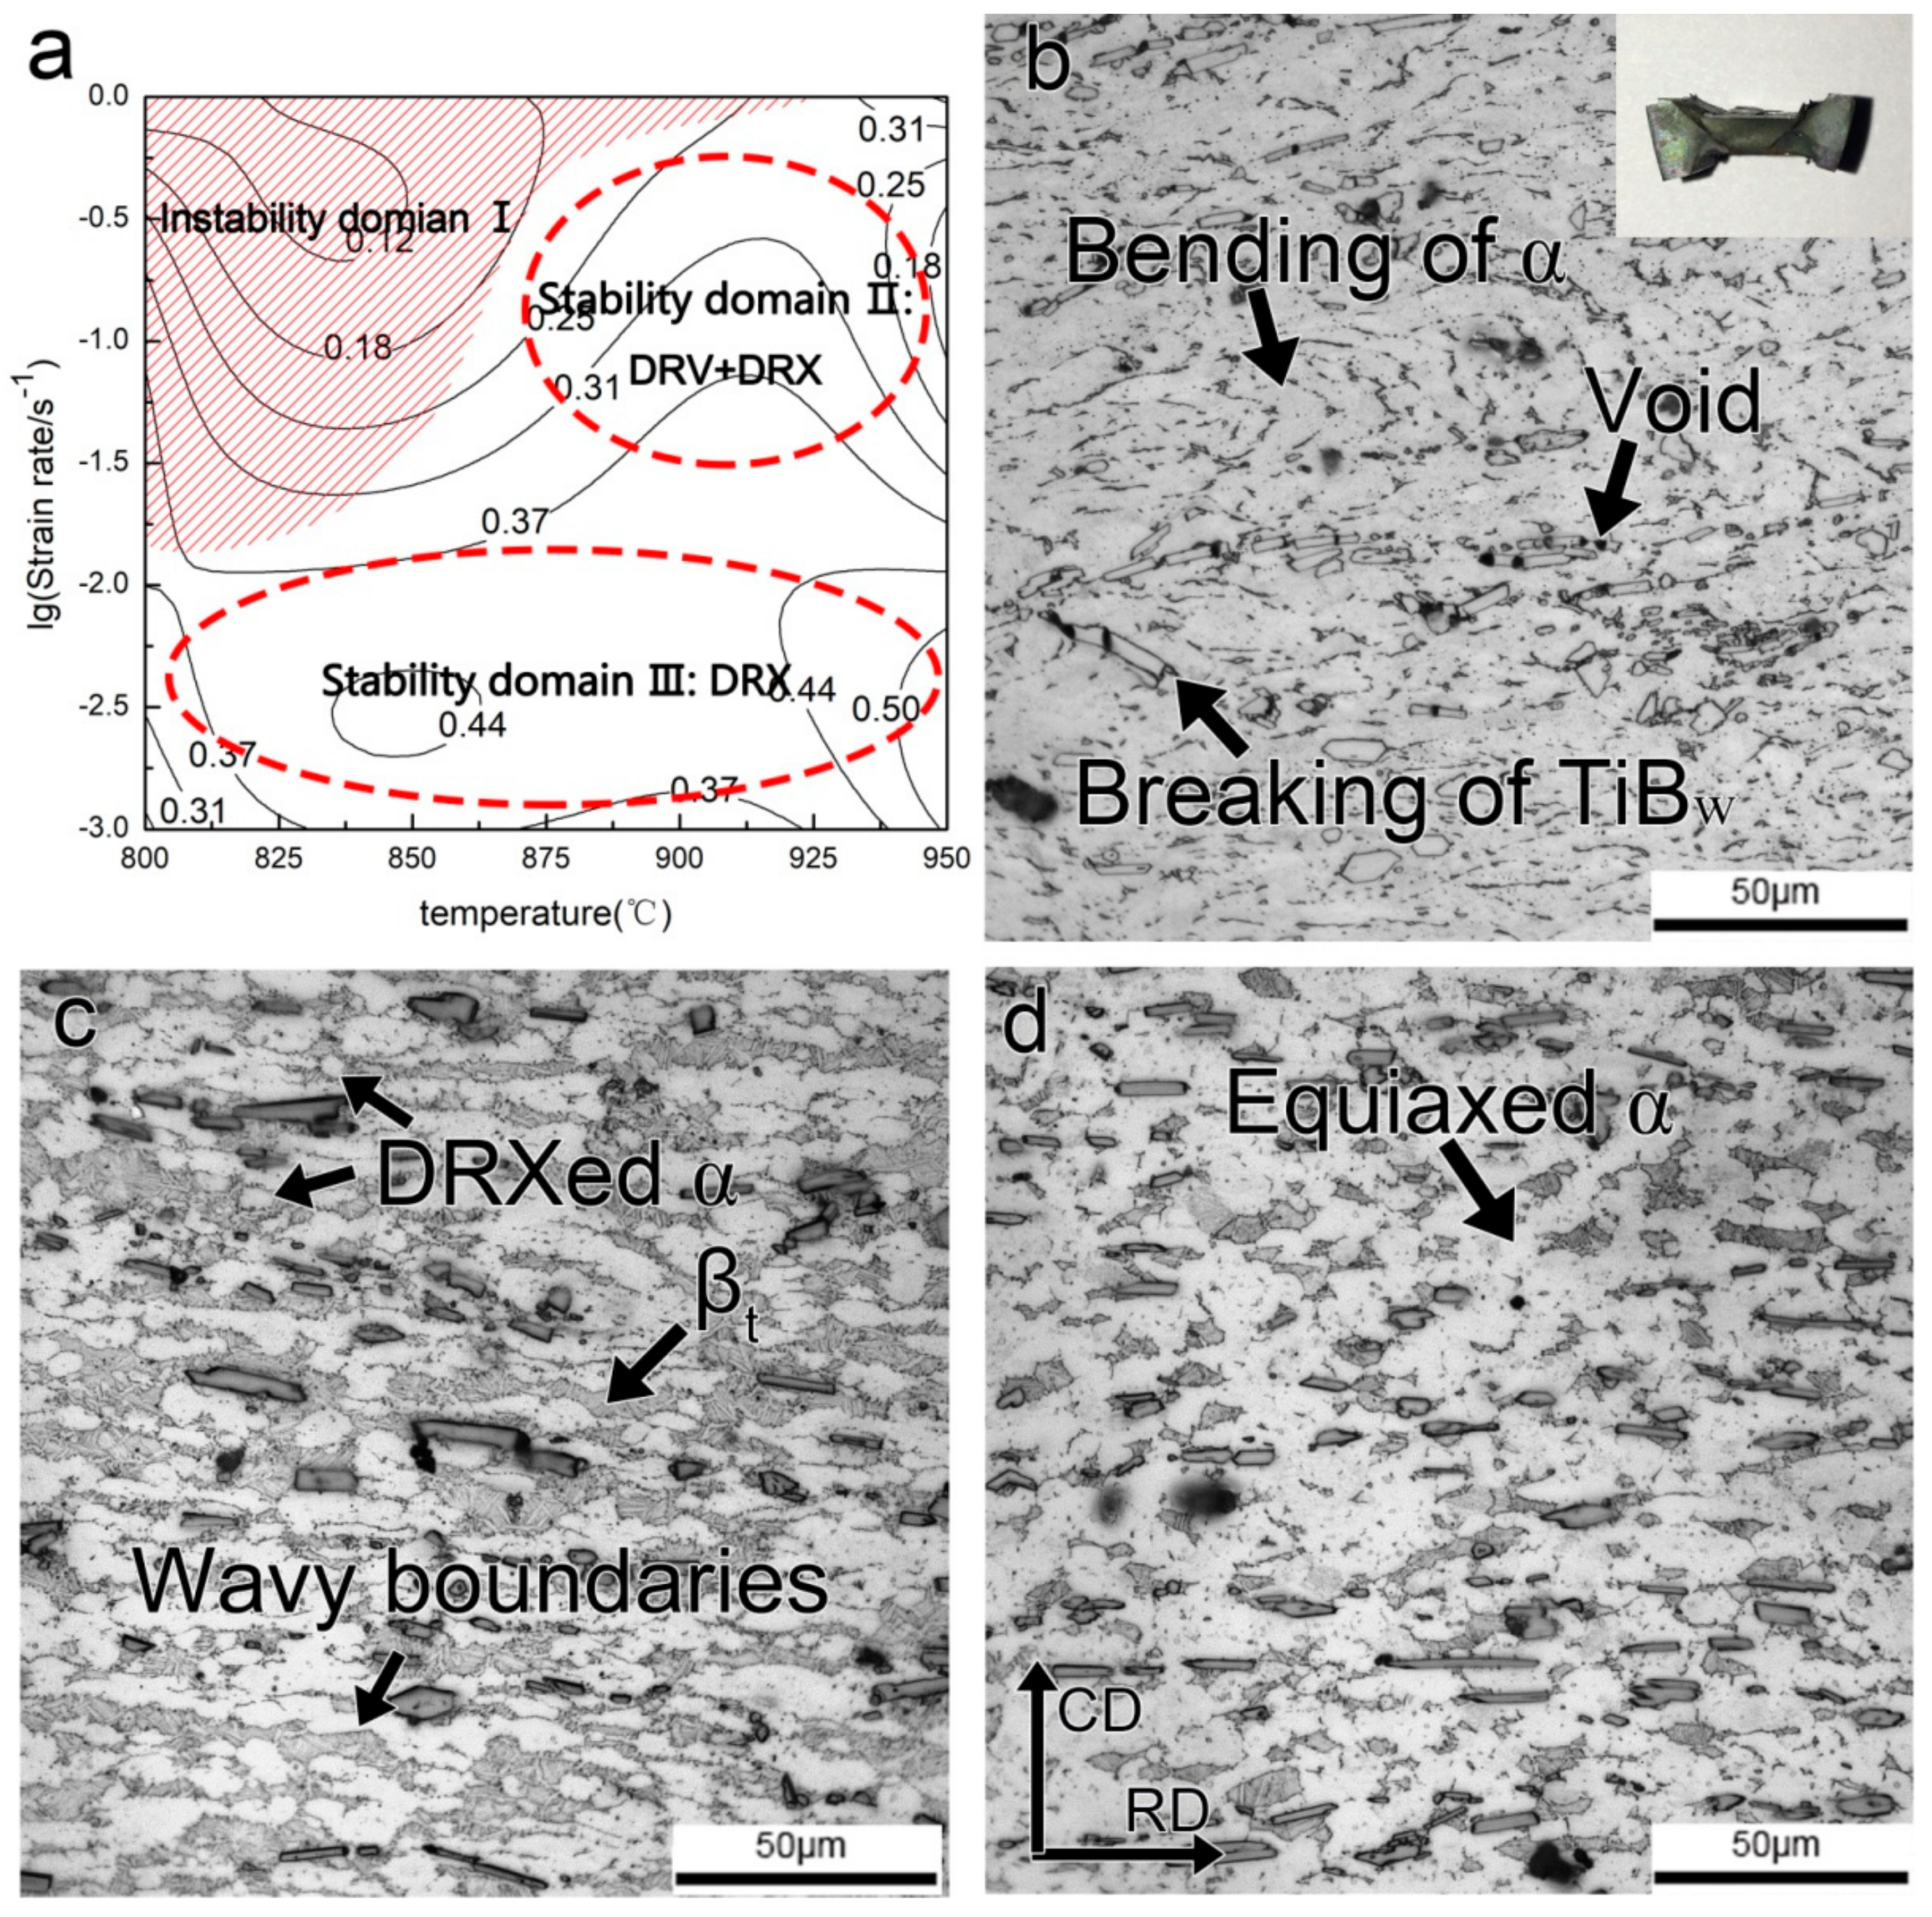
The optimal hot processing window for 7.5 vol.% TiBw/near α-Ti composite is determined to be 800–950 °C/0.001–0.01 s−1, which is related to the CDRX of primary α grains or DRV/DRX of β phase. In addition, its instability mechanisms also include inhomogeneous deformation, voids and fracture or debonding of TiBw.

Author Contributions

All authors have contributed significantly. P.C., S.Z. and C.Z. designed the project. Y.L., Y.C., Y.S., H.F., Y.Z. undertook the experiments and data collection. P.C., S.Z., Y.L. and C.Z. analysed the data. All authors contributed to the discussion of the results.

Funding

This research was funded by the National Natural Science Foundation of China (No. 51504163 and 51604191), the National Science Foundation of Shan Xi (No. 201801D221141 and 201801D121091), the Scientific and Technological Innovation Programs of Higher Education Institutions in Shanxi (No.201802021) and the financial support of the Ningbo Natural Science Foundation (No. 2017A610032).

Acknowledgments

Chongxiao Guo, Zhidan Lü and Xiang Ji who are all postgraduate students of Taiyuan University of Technology, are acknowledged for helpful discussion.

Conflicts of Interest

The authors declare no conflict of interest.

References

  1. Chandran, K.S.R.; Panda, K.B.; Sahay, S.S. TiBw-reinforced Ti composites: Processing, properties, application prospects, and research needs. JOM 2004, 56, 42–48. [Google Scholar] [CrossRef]
  2. Guo, X.; Wang, L.; Wang, M.; Qin, J.; Zhang, D.; Lu, W. Effects of degree of deformation on the microstructure, mechanical properties and texture of hybrid-reinforced titanium matrix composites. Acta Mater. 2012, 60, 2656–2667. [Google Scholar] [CrossRef]
  3. Huang, L.J.; Geng, L.; Peng, H.X. Microstructurally inhomogeneous composites: Is a homogeneous reinforcement distribution optimal? Prog. Mater. Sci. 2015, 71, 93–168. [Google Scholar] [CrossRef]
  4. Huang, L.J.; Geng, L.; Li, A.B.; Yang, F.Y.; Peng, H.X. In situ TiBw/Ti–6Al–4V composites with novel reinforcement architecture fabricated by reaction hot pressing. Scr. Mater. 2009, 60, 996–999. [Google Scholar] [CrossRef]
  5. Ma, Z.Y.; Tjong, S.C.; Gen, L. In-situ Ti-TiB metal-matrix composite prepared by a reactive pressing process. Scr. Mater. 2000, 42, 367–373. [Google Scholar] [CrossRef]
  6. Madsen, A.; Ghonem, H. Effects of aging on the tensile and fatigue behavior of the near-α Ti-1100 at room temperature and 593 °C. Mater. Sci. Eng. A 1994, 177, 63–73. [Google Scholar] [CrossRef]
  7. Zhang, W.J.; Song, X.Y.; Hui, S.X.; Ye, W.J.; Wang, Y.L.; Wang, W.Q. Tensile behavior at 700 °C in Ti-Al-Sn-Zr-Mo-Nb-W-Si alloy with a bi-modal microstructure. Mater. Sci. Eng. A 2014, 595, 159–164. [Google Scholar] [CrossRef]
  8. Wang, T.; Guo, H.Z.; Wang, Y.W.; Peng, X.N.; Zhao, Y.; Yao, Z.K. The effect of microstructure on tensile properties, deformation mechanisms and fracture models of TG6 high temperature titanium alloy. Mater. Sci. Eng. A 2011, 528, 2370–2379. [Google Scholar] [CrossRef]
  9. Guo, C.; Zhang, C.; Han, J.; Zhang, S.; Fei, Y.; Chai, L.; Chen, Z. Effect of trace B on the microstructure and mechanical properties of a newly near α high temperature titanium alloy. Adv. Eng. Mater. 2017, 19, 1700490. [Google Scholar] [CrossRef]
  10. Tjong, S.C.; Mai, Y.W. Processing-structure-property aspects of particulate and whisker-reinforced titanium matrix composites. Compos. Sci. Technol. 2008, 68, 583–601. [Google Scholar] [CrossRef]
  11. Wanjara, P.; Jahazi, M.; Monajati, H.; Yue, S.; Immarigeon, J.-P. Hot working behavior of near-α alloy IMI834. Mater. Sci. Eng. A 2005, 396, 50–60. [Google Scholar] [CrossRef]
  12. Sun, X.; Li, H.; Han, Y.; Li, J.; Mao, J.; Lu, W. Compressive response and microstructural evolution of bimodal sized particulates reinforced (TiB + La2O3)/Ti composites. J. Alloys Compd. 2018, 732, 524–535. [Google Scholar] [CrossRef]
  13. Ma, F.; Shi, Z.; Ping, L.; Wei, L.; Liu, X.; Chen, X.; He, D.; Ke, Z.; Deng, P.; Di, Z. Strengthening effect of in situ TiC particles in Ti matrix composite at temperature range for hot working. Mater. Charact. 2016, 120, 304–310. [Google Scholar] [CrossRef]
  14. Ji, Z.; Shen, C.; Wei, F.; Li, H. Dependence of macro- and micro-properties on α plates in Ti-6Al-2Zr-1Mo-1V alloy with tri-modal microstructure. Metals 2018, 8, 299. [Google Scholar] [CrossRef]
  15. Cojocaru, V.; Șerban, N. Effects of solution treating on microstructural and mechanical properties of a heavily deformed new biocompatible Ti–Nb–Zr–Fe alloy. Metals 2018, 8, 297. [Google Scholar] [CrossRef]
  16. Prasad, Y.V.R.K.; Seshacharyulu, T.; Medeiros, S.C.; Frazier, W.G. Effect of preform microstructure on the hot working mechanisms in ELI grade Ti–6Al–4V: Transformed β v. equiaxed (α + β). Mater. Sci. Technol. 2010, 16, 511–516. [Google Scholar] [CrossRef]
  17. Zhao, Z.L.; Li, H.; Fu, M.W.; Guo, H.Z.; Yao, Z.K. Effect of the initial microstructure on the deformation behavior of Ti60 titanium alloy at high temperature processing. J. Alloys Compd. 2014, 617, 525–533. [Google Scholar] [CrossRef]
  18. Li, H.; Zhao, Z.; Guo, H.; Yao, Z.; Ning, Y.; Miao, X.; Ge, M. Effect of initial alpha lamellar thickness on deformation behavior of a near-α high-temperature alloy during thermomechanical processing. Mater. Sci. Eng. A 2016, 682, 345–353. [Google Scholar] [CrossRef]
  19. Zhang, Z.X.; Qu, S.J.; Feng, A.H.; Shen, J.; Chen, D.L. Hot deformation behavior of Ti-6Al-4V alloy: Effect of initial microstructure. J. Alloys Compd. 2017, 718, 170–181. [Google Scholar] [CrossRef]
  20. Zhang, C.J.; Xiang, L.; Zhang, S.Z.; Chai, L.; Chen, Z.; Kong, F.T.; Chen, Y.Y. Effects of direct rolling deformation on the microstructure and tensile properties of the 2.5 vol.% (TiBw + TiCp)/Ti composites. Mater. Sci. Eng. A 2017, 684, 645–651. [Google Scholar] [CrossRef]
  21. Zhang, C.J.; Qu, J.P.; Wu, J.; Zhang, S.Z.; Han, J.C.; Hayat, M.D.; Cao, P. A titanium composite with dual reinforcements of micrometer sized TiB and submicrometer sized Y2O3. Mater. Lett. 2018, 233, 242–245. [Google Scholar] [CrossRef]
  22. Wang, B.; Huang, L.J.; Geng, L.; Rong, X.D. Compressive behaviors and mechanisms of TiB whiskers reinforced high temperature Ti60 alloy matrix composites. Mater. Sci. Eng. A 2015, 648, 443–451. [Google Scholar] [CrossRef]
  23. Peng, L.; He, Z.; Yuan, S.; Shen, J. Tensile deformation behavior of Ti–22Al–25Nb alloy at elevated temperatures. Mater. Sci. Eng. A 2012, 556, 617–624. [Google Scholar]
  24. Han, J.; Lü, Z.; Zhang, C.; Zhang, S.; Zhang, H.; Lin, P.; Cao, P. The microstructural characterization and mechanical properties of 5 vol. % (TiBw + TiCp)/Ti composite produced by open-die forging. Metals 2018, 8, 485. [Google Scholar] [CrossRef]
  25. Cheng, L.; Xue, X.; Tang, B.; Liu, D.; Li, J.; Kou, H.; Li, J. Deformation behavior of hot-rolled IN718 superalloy under plane strain compression at elevated temperature. Mater. Sci. Eng. A 2014, 606, 24–30. [Google Scholar] [CrossRef]
  26. Jonas, J.J.; Sellars, C.M.; Tegart, W.J.M. Strength and structure under hot-working conditions. Metall. Rev. 1969, 14, 1–24. [Google Scholar]
  27. Quan, G.Z.; Wu, D.S.; Luo, G.C.; Xia, Y.F.; Jie, Z.; Liu, Q.; Lin, G. Dynamic recrystallization kinetics in α phase of as-cast Ti–6Al–2Zr–1Mo–1V alloy during compression at different temperatures and strain rates. Mater. Sci. Eng. A 2014, 589, 23–33. [Google Scholar] [CrossRef]
  28. Huang, G.; Han, Y.; Guo, X.; Di, Q.; Wang, L.; Lu, W.; Di, Z. Effects of extrusion ratio on microstructural evolution and mechanical behavior of in situ synthesized Ti–6Al–4V composites. Mater. Sci. Eng. A 2017, 688, 155–163. [Google Scholar] [CrossRef]
  29. Zherebtsov, S.; Murzinova, M.; Salishchev, G.; Semiatin, S.L. Spheroidization of the lamellar microstructure in Ti–6Al–4V alloy during warm deformation and annealing. Acta Mater. 2011, 59, 4138–4150. [Google Scholar] [CrossRef]
  30. Weiss, I.; Froes, F.H.; Eylon, D.; Welsch, G.E. Modification of alpha morphology in Ti–6Al–4V by thermomechanical processing. Metall. Trans. A 1986, 17, 1935–1947. [Google Scholar] [CrossRef]
  31. Zhang, R.; Wang, D.; Huang, L.; Yuan, S.; Geng, L. Deformation behaviors and microstructure evolution of TiBw/TA15 composite with novel network architecture. J. Alloys Compd. 2017, 722, 970–980. [Google Scholar] [CrossRef]
  32. Roy, S.; Suwas, S. The influence of temperature and strain rate on the deformation response and microstructural evolution during hot compression of a titanium alloy Ti–6Al–4V–0.1B. J. Alloys Compd. 2013, 548, 110–125. [Google Scholar] [CrossRef]
  33. Zhao, J.W.; Ding, H.; Hou, H.L.; Li, Z.Q. Influence of hydrogen content on hot deformation behavior and microstructural evolution of Ti600 alloy. J. Alloys Compd. 2010, 491, 673–678. [Google Scholar] [CrossRef]
  34. Wang, K.; Li, M.; Liu, Q. Evolution mechanisms of the primary α and β phases during α/β deformation of an α/β titanium alloy TC8. Mater. Charact. 2016, 120, 115–123. [Google Scholar] [CrossRef]
  35. Wang, X.; Jahazi, M.; Yue, S. Substructure of high temperature compressed titanium alloy IMI834. Mater. Sci. Eng. A 2006, 434, 188–193. [Google Scholar] [CrossRef]
  36. Prasad, Y.V.R.K.; Gegel, H.L.; Doraivelu, S.M.; Malas, J.C.; Morgan, J.T.; Lark, K.A.; Barker, D.R. Modeling of dynamic material behavior in hot deformation: Forging of Ti-6242. Metall. Trans. A 1984, 15, 1883–1892. [Google Scholar] [CrossRef]
  37. Kupradze, B.V.D. Dynamical problems in elasticity. In Progress in Solid Mechanics; North-Holland Publishing Company: Amsterdam, The Netherlands, 1963. [Google Scholar]
  38. Murty, S.V.S.N.; Rao, B.N.; Kashyap, B.P. Development and validation of a processing map for zirconium alloys. Model. Simul. Mater. Sci. Eng. 2002, 10, 503. [Google Scholar] [CrossRef]
  39. Sun, Y.; Zeng, W.D.; Zhao, Y.Q.; Zhang, X.M.; Shu, Y.; Zhou, Y.G. Research on the hot deformation behavior of Ti40 alloy using processing map. Mater. Sci. Eng. A 2011, 528, 1205–1211. [Google Scholar] [CrossRef]
Figure 1. (a,b) Schematic illustration of multi-directional forging process; (c) SEM micrograph of the 7.5 vol.% TiBw/near α-Ti composite.
Metals 09 00481 g001
Figure 2. Stress-strain curves at various strain rates for 7.5 vol.% TiBw/near α-Ti composite: (a) 800 °C, (b) 850 °C, (c) 900 °C, (d) 950 °C.
Metals 09 00481 g002
Figure 3. Plots of (a) ln[sinh(ασ)] vs. T−1, (b) ln[sinh(ασ)] vs. ln ε ˙ .
Metals 09 00481 g003
Figure 4. Plot of lnZ vs. ln[sinh(ασ)].
Metals 09 00481 g004
Figure 5. Microstructure of 7.5 vol.% TiBw/near α-Ti composite deformed at various temperatures: (a,b) 800 °C, (c,d) 850 °C, (e,f) 900 °C, (g,h) 950 °C. The strain rate was 0.01 s−1 in all of the cases. CD is the compression direction, and RD is perpendicular to CD on the observation surface.
Metals 09 00481 g005
Figure 6. α grain size vs. deformation temperature. The strain rate is 0.01 s−1.
Metals 09 00481 g006
Figure 7. Inverse pole figure and grain boundary map of 7.5 vol.% TiBw/near α-Ti composite: (a,b) deformed at 800 °C /0.01 s−1, (c,d) deformed at 900 °C/0.01 s−1.
Metals 09 00481 g007
Figure 8. Microstructure of 7.5 vol.% TiBw/near α-Ti composite deformed at 900 °C with different strain rates: (a) 0.001 s−1, (b) 0.01 s−1, (c) 0.1 s−1, (d) 1 s−1.
Metals 09 00481 g008
Figure 9. Variation of α grain size with strain rate at 900 °C.
Metals 09 00481 g009
Figure 10. TEM micrographs of 7.5 vol.% TiBw/near α-Ti composite deformed at (a,b) 900 °C/0.01 s−1 and (c,d) 900 °C /1 s−1.
Metals 09 00481 g010
Figure 11. The processing map (a) and the microstructure of 7.5 vol.% TiBw/near α-Ti composite in instability and stability domains: (b) 800 °C/1 s−1, (c) 950 °C/0.1 s−1, (d) 900 °C/0.001 s−1. (The shadow domain represents the instability domain).
Metals 09 00481 g011

