Article

Influence of Strain Rate and Waveshape on Environmentally-Assisted Cracking during Low-Cycle Fatigue of a 304L Austenitic Stainless Steel in a PWR Water Environment

1
Pprime Institute, UPR 3346 CNRS-ENSMA-Université de Poitiers, ISAE-ENSMA, Téléport 2, 1 avenue Clément Ader, BP 40 109-86961 Futuroscope Chasseneuil CEDEX, France
2
Framatome, Tour Areva - 1 place Jean Millier, 92 084 La Défense CEDEX, France
*
Author to whom correspondence should be addressed.
Metals 2019, 9(2), 197; https://doi.org/10.3390/met9020197
Submission received: 18 December 2018 / Revised: 4 February 2019 / Accepted: 6 February 2019 / Published: 8 February 2019
(This article belongs to the Special Issue Metal Plasticity and Fatigue at High Temperature)

Abstract

:
In this paper, the low cycle fatigue resistance of a 304L austenitic stainless steel in a simulated pressurized water reactor (PWR) primary water environment has been investigated by paying a special attention to the interplay between environmentally-assisted cracking mechanisms, strain rate, and loading waveshape. More precisely, one of the prime interests of this research work is related to the consideration of complex waveshape signals that are more representative of solicitations encountered by real components. A detailed analysis of stress-strain relation, surface damage, and crack growth provides a preliminary ranking of the severity of complex, variable strain rate signals with respect to triangular, constant strain-rate signals associated with environmental effects in air or in PWR water. Furthermore, as the fatigue lives in PWR water environment are mainly controlled by crack propagation, the crack growth rates derived from striation spacing measurement and estimated from interrupted tests have been carefully examined and analyzed using the strain intensity factor range ΔKε. It is confirmed that the most severe signal with regards to fatigue life also induces the highest crack growth enhancement. Additionally two characteristic parameters, namely a threshold strain εth* and a time T*, corresponding to the duration of the effective exposure of the open cracks to PWR environment have been introduced. It is shown that the T* parameter properly accounts for the differences in environmentally-assisted growth rates as a function of waveshape.

1. Introduction

The aging management of nuclear power plants is one of the main challenges for the energy stakeholders worldwide in the coming years. In particular, the potential damage induced by corrosion and environmentally-assisted cracking needs to be more thoroughly investigated in order to assess the residual structural integrity of the components. In the case of pressurized water reactors (PWR), water is used both as a nuclear reaction moderator and as a heat carrier medium. In order to maintain the water in a liquid state throughout the entire primary circuit, a pressure of about 140 bars is applied while its temperature varies between 290 and 350 °C. This water, with a definite and controlled chemistry, represents the PWR medium. Additionally, the primary circuit pipings, commonly made of austenitic stainless steel, are subjected to complex thermomechanical loadings in the low-cycle fatigue domain, due to numerous operating transients, in conjunction with this exposure to the PWR environment.
The design against fatigue of components in nuclear power plants is fundamentally based on the fatigue life established in air at room temperature. Different transposition factors are thereafter applied to these data so as to account for the respective influence of different parameters which mainly are the scale effects, the material variability, the load history, the surface finish, etc. In recent years, nuclear safety and inspection authorities have paid a special attention to environmental effects, and more precisely to the influence of the PWR environment on fatigue damage. In this context, among the various factors controlling the fatigue life in PWR medium, strain rate is extremely important. Indeed, most of the environmentally-assisted cracking mechanisms are time-dependent and, therefore, depend to some extent on the exposure duration [1,2,3,4]. Nevertheless, one cannot exclude complex interactions between the environmental exposure duration and the load signal waveform to account for damage mechanisms at the crack tip.
Additionally, in conventional fatigue testing, simple input signal shapes, such as triangular or saw-tooth signals, are used. In such cases, the strain rate is easily controlled and kept constant during a large part of the load period. Typically, strain-control triangular signals are commonly applied to establish the data required in design codes. However, especially when investigating the very low strain rate domain, saw-tooth signals with a slow loading rate and a fast unloading rate are also considered in order to reduce the test duration, by assessing that the fatigue lives are only dependent of the rising load part duration [2,3,4]. However, this type of loading does not fully account for the actual loading conditions in industrial components. For instance, in PWR, the Safety Injection System (SIS) is used in case of incident to introduce boron-containing cold water under high pressure to moderate the nuclear reaction and ensure a proper cooling of the reactor core.
The signal shown in Figure 1 corresponds to the resulting mechanical loading imposed on the pipes of primary circuit when using the SIS circuit. It can be seen that the strain rate continuously varies during the fatigue cycle. Thus, the first part of the signal corresponds to the injection of cold water (20 °C) into the primary circuit. The component is then rapidly stressed in tension because the material shrinks. Thereafter, the hot water (300 °C) normally circulating in the primary circuit causes a further expansion which results into a compressive deformation. Finally, the temperature becomes homogeneous when recovering equilibrium conditions. The evolution of the mechanical deformation resulting from such thermal loading can be used as a loading signal in isothermal tests in simulated PWR environment. This signal will be denoted in the following as the SIS A signal.
Therefore, it seems important to investigate the effect of such a more complex and representative signal shape on the fatigue resistance in PWR medium, in order to assess the conservatism of the design rules. In particular, in comparison with triangular signals, it can be expected that such complex loadings, with a varying strain rate during one loading period, will not only affect the cyclic stress-strain behavior, in relation with dynamic strain aging (DSA), but also the exposure of the crack tip to the medium and subsequently influence the fatigue damage and the crack growth rates [5], through interactions between elementary processes of deformation and damage. Typically, DSA can introduce strain localization [6,7,8], which, in turn, can modify the action of the corrosive medium.
With this aim, the influence of strain rate and SIS complex loading signal shape on the LCF resistance in PWR environment of a 304L austenitic stainless steel is addressed in the present paper. More precisely, the material cyclic stress-strain (CSS) behavior and fatigue lives with complex signals were first determined in PWR medium and then compared to data obtained using triangular signals in the same environment, but also to data obtained in air in similar loading conditions at total strain amplitude of 0.6%. Furthermore, previous studies have shown that in the PWR environment the initiation stage is very short [9]. This is the reason why a special attention has been paid here to a fine analysis of the propagation stage, by combining measurements of striation spacing with crack growth data derived from interrupted tests, using a methodology explained in [9]. The objective is to identify a parameter that can account for the crack growth behavior under different strain rates and loading signals. While this work is a part of a more comprehensive study, encompassing the examination of the effect of surface finishing, only results obtained on polished samples are considered here for the sake of clarity. The aspects peculiar to the ground surface finishing, which is also representative of some actual surface conditions in a component, were addressed in another paper [9].

2. Experimental Conditions

2.1. Material and Specimens

The material used in this study is a 304L austenitic stainless steel from a 30 mm thick plate elaborated by Creusot Loire Industries (CLI, Creusot, France). It was obtained by rolling and subjected to a solution-treatment at 1100 °C before being water-quenched. Its chemical composition is (in weight %): C-0.029, Si-0.37, Mn-1.86, P-0.029, S-0.004, Ni-10.0, Cr-18.00, Mo-0.04, N-0.056, and Fe balance. The grain size is about 80 µm.
The tensile properties of this specific cast have been determined in a previous study [10]. The results are given in Table 1. Additional information about the cyclic stress-strain behavior and low-cycle fatigue resistance as a function of temperature and environment can be found in [11,12,13,14].
Fatigue specimens are machined with the loading axis parallel to the rolling direction of the plate. The gauge length is 13.5 mm and the diameter is 9 mm. The surface of the fatigue samples were thereafter mirror-polished by mechanical polishing down to 1 µm grade diamond paste. The specimen geometry and tensile mechanical properties were described in more details elsewhere [9]. In addition, flanges were machined on both specimen shoulders in order to fix the strain measurement system described in the next section, which requires a calibration to relate the elongation applied between flanges to the strain amplitude targeted in the gauge length.

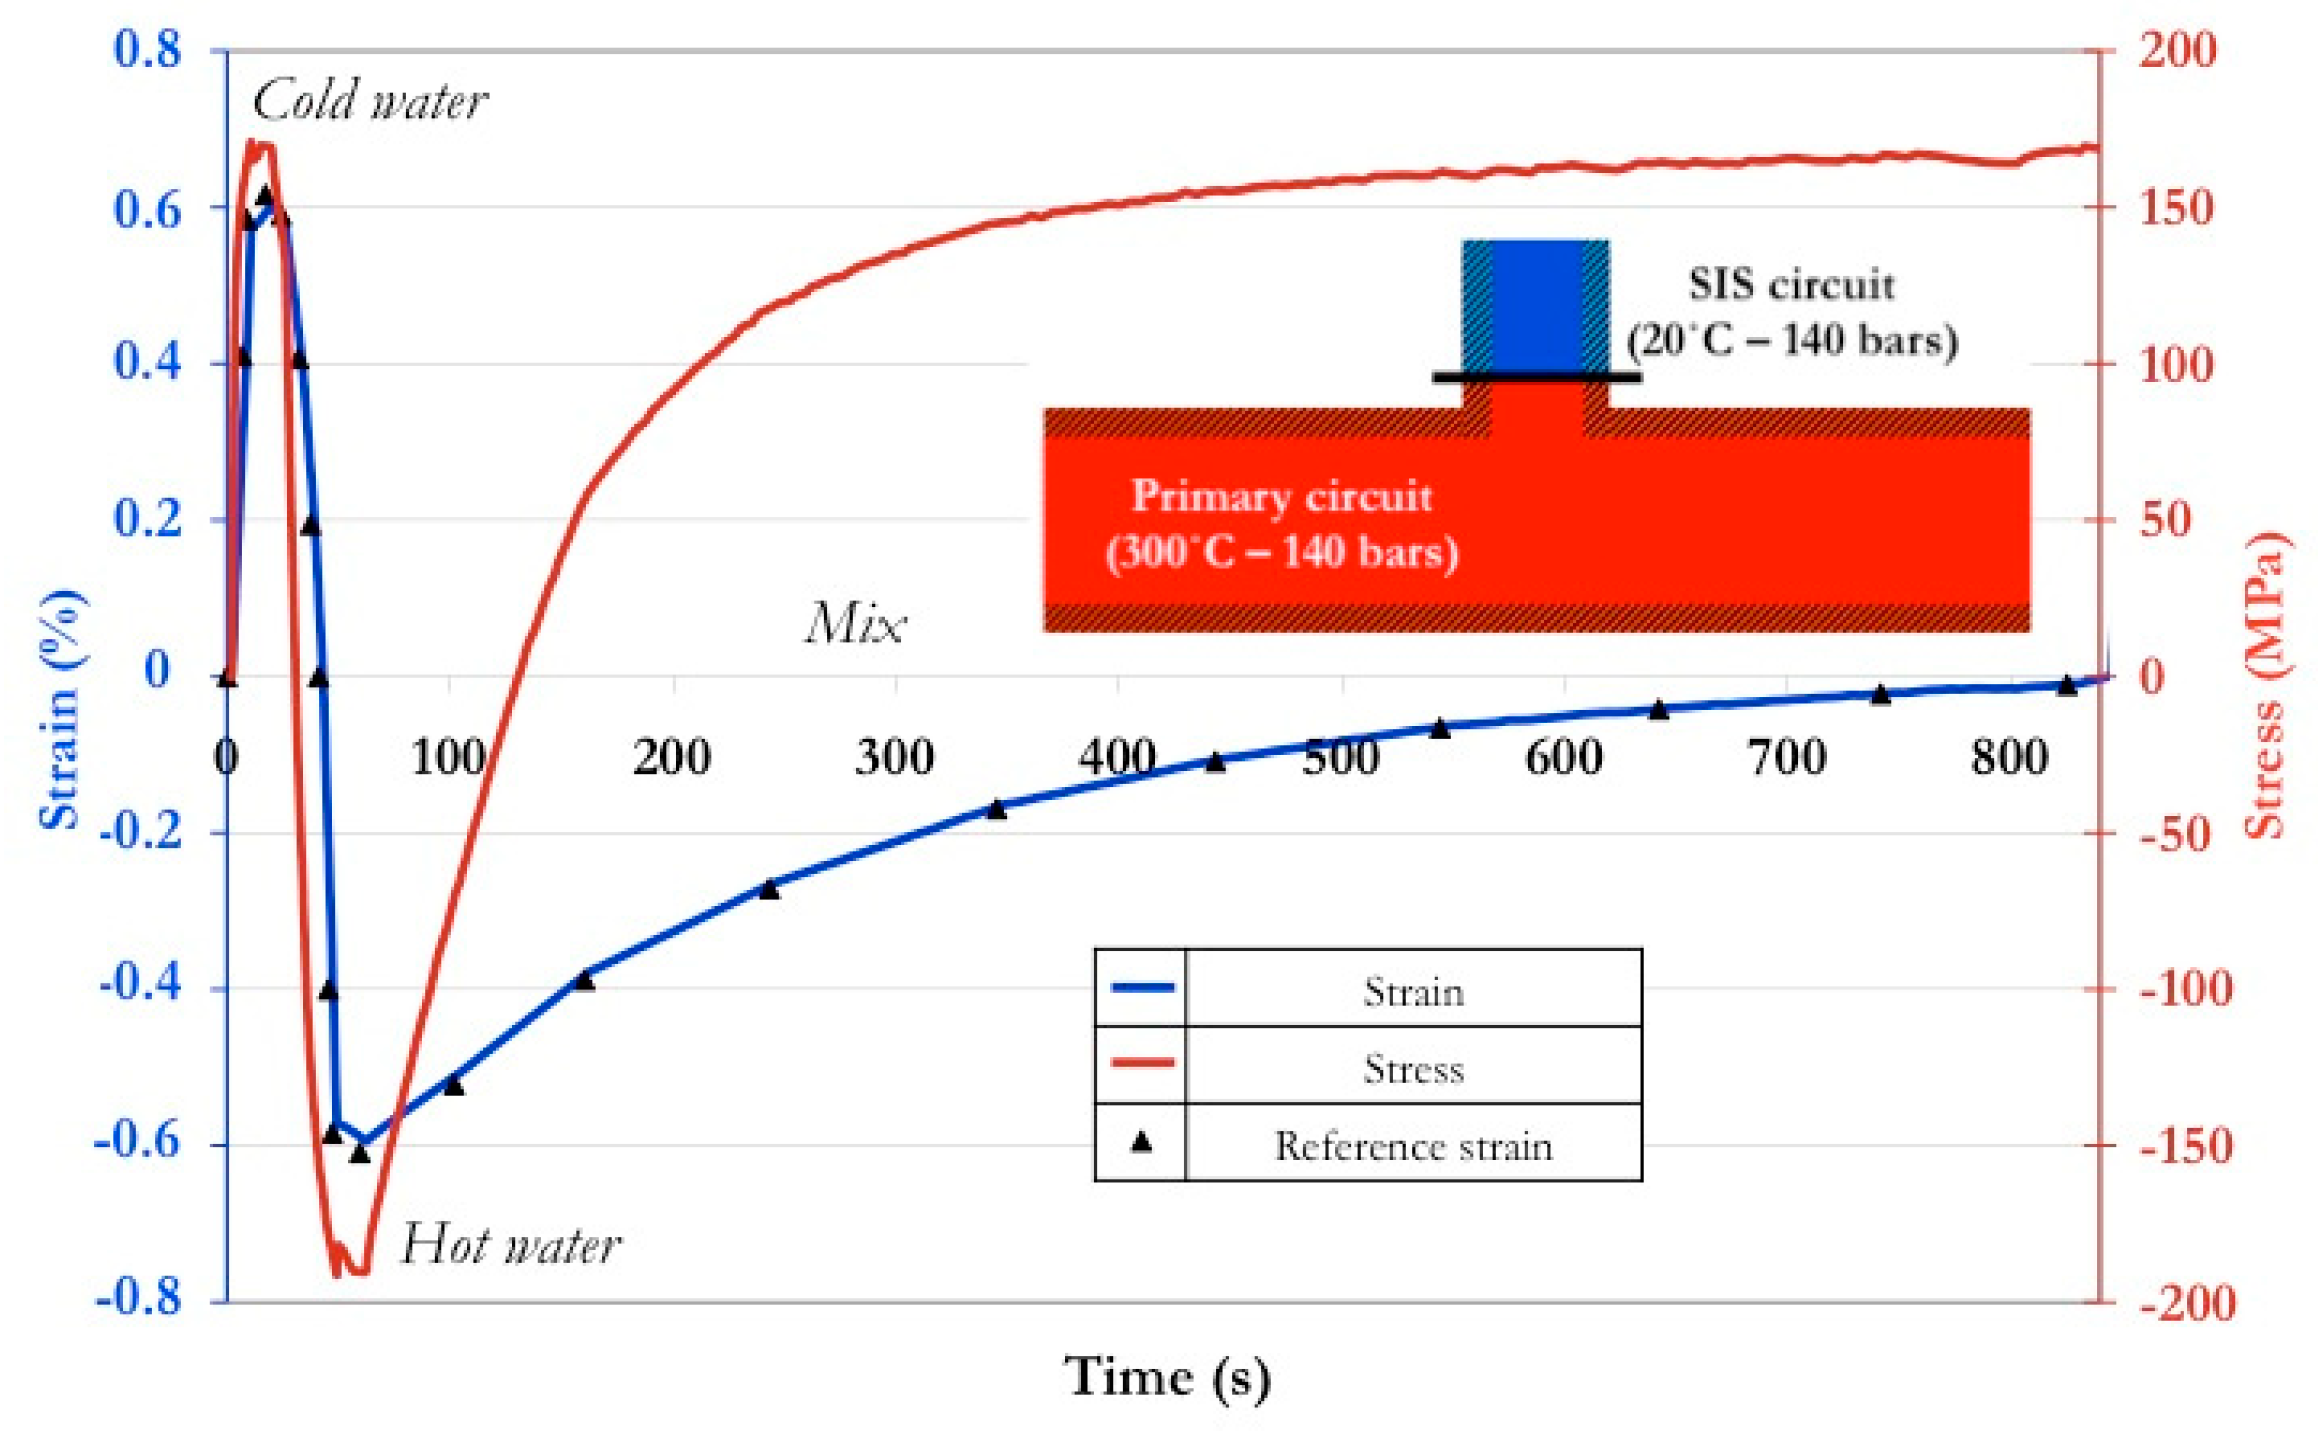
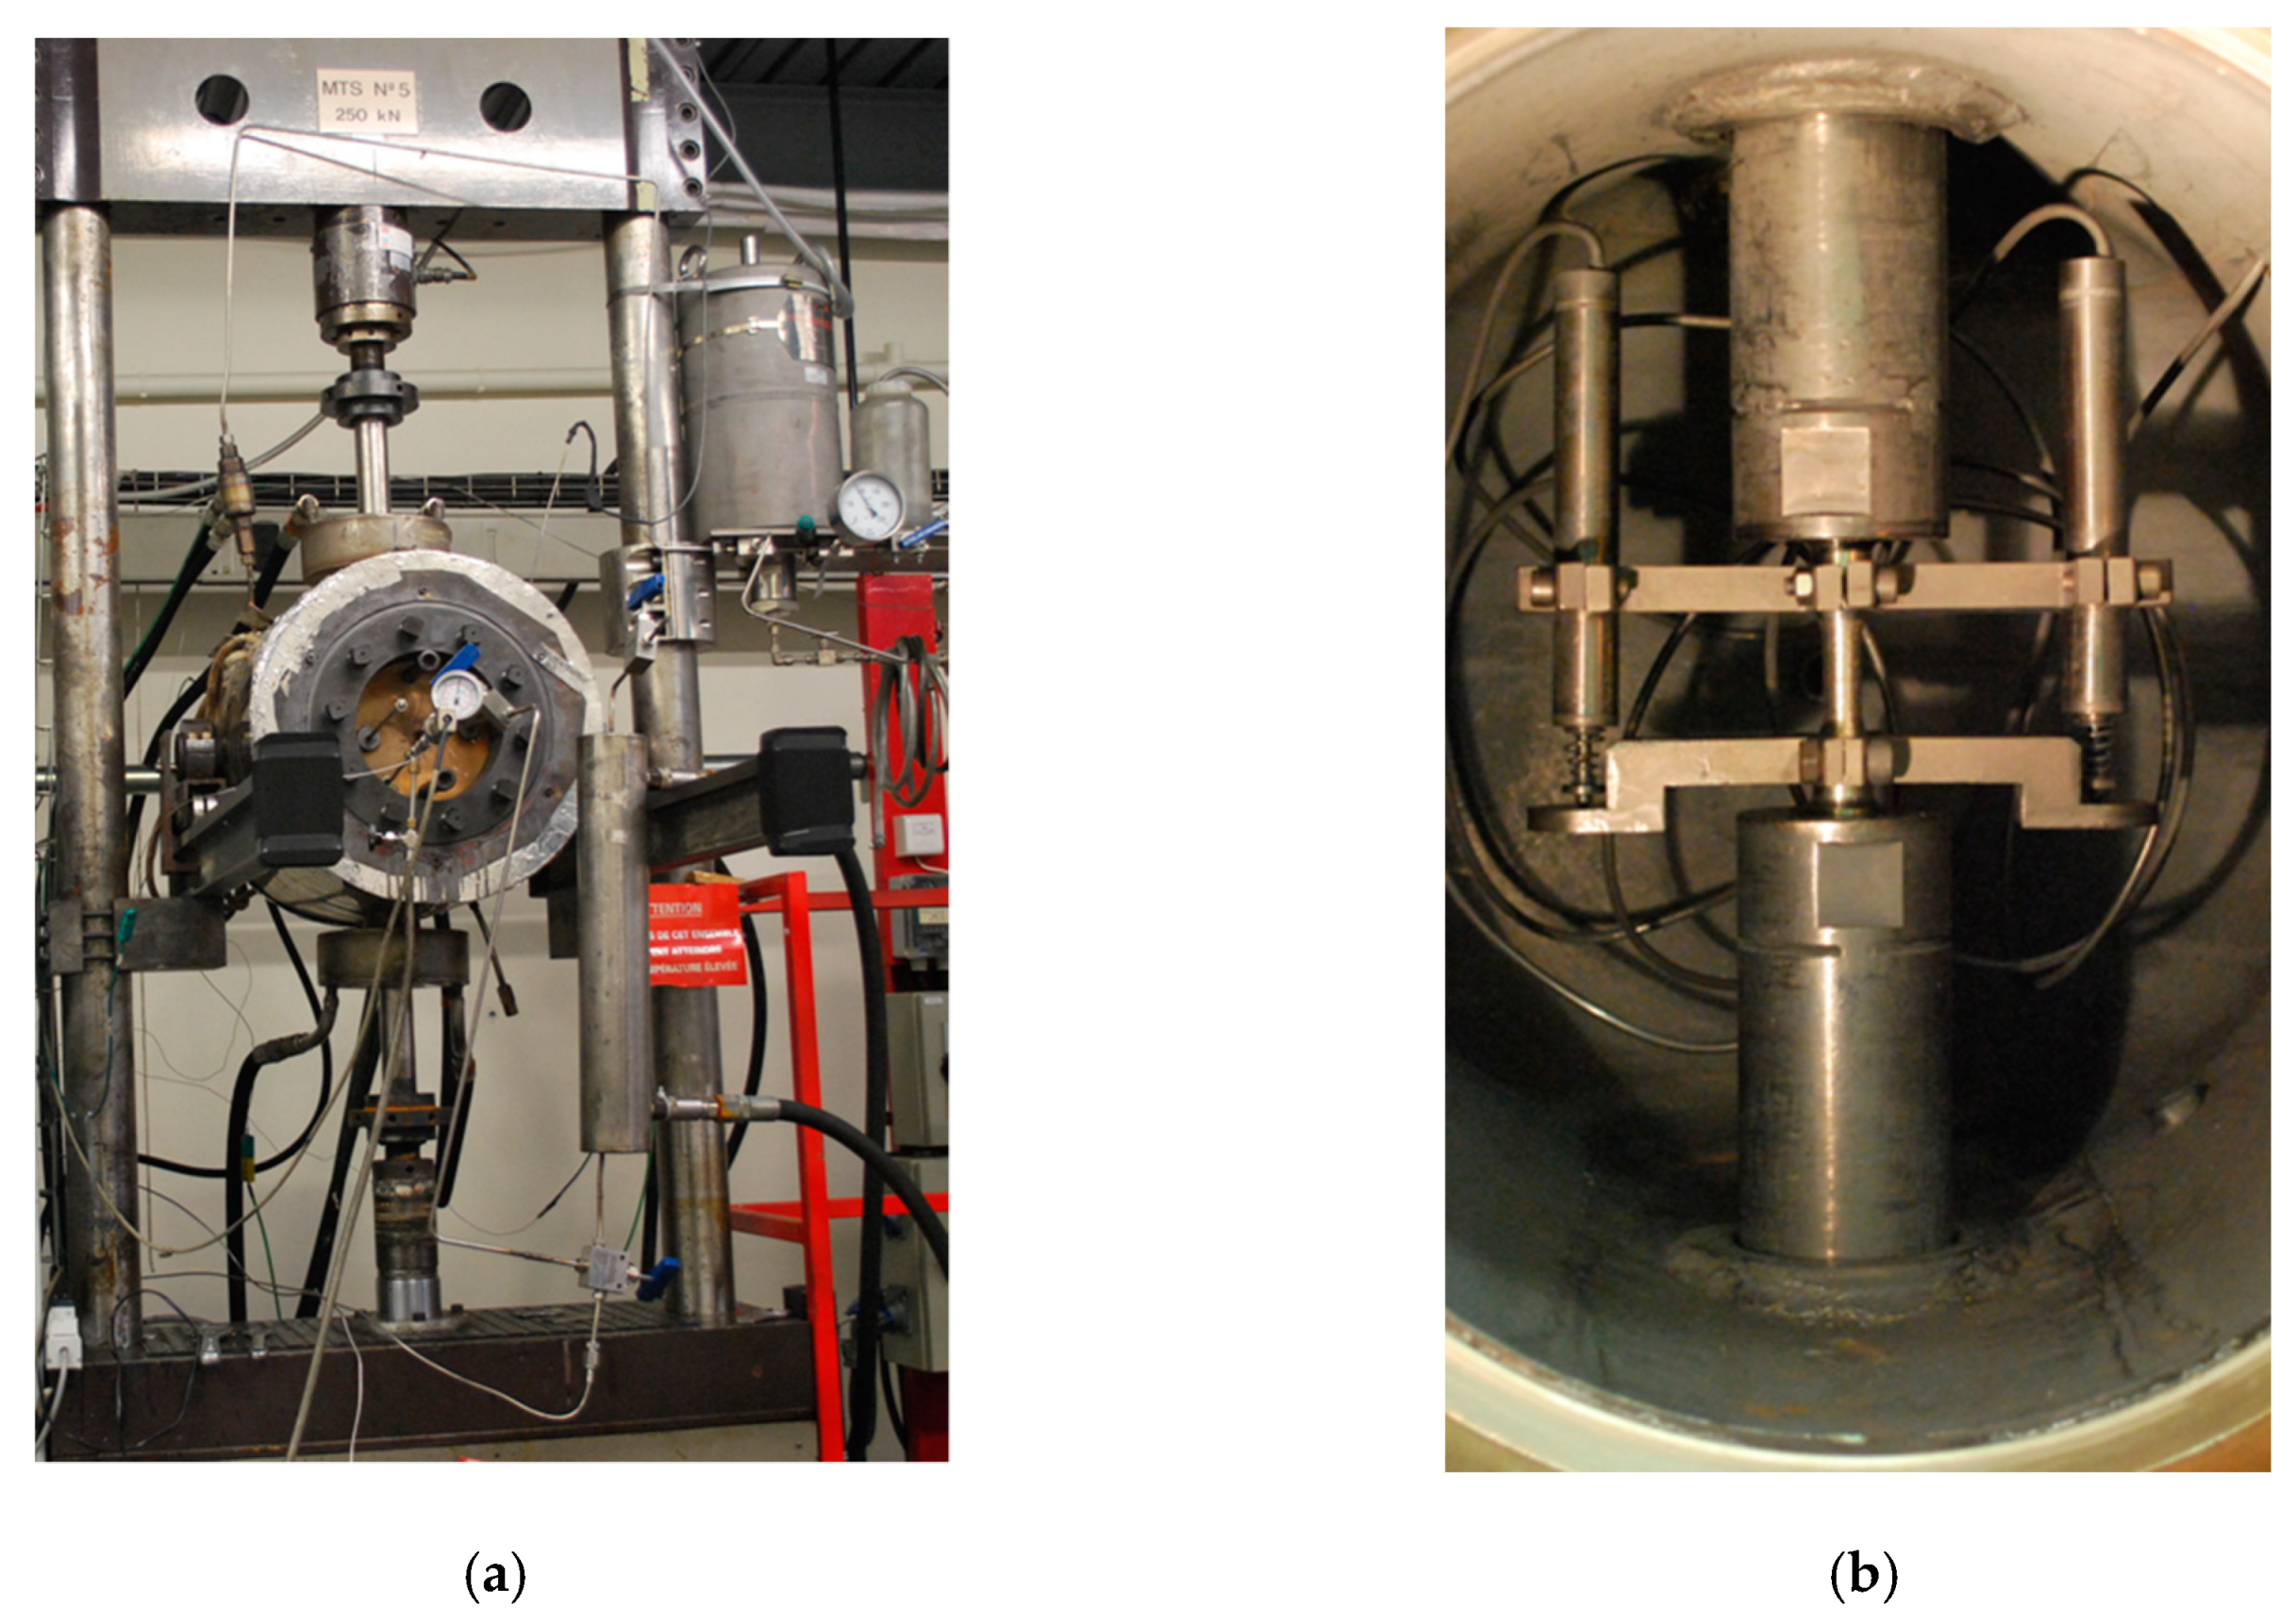
2.2. Test Procedures

LCF testing were performed in air at 300 °C using an electromechanical INSTRON 1362 machine (Instron, Norwood, MA, USA). For tests in simulated PWR primary water environment, a MTS (MTS, Eden Prairie, MN, USA) servohydraulic loadframe equipped with a pressure vessel which enables a maximum pressure of 140 bars and a temperature of 300 °C was used (Figure 2a). The simulated PWR water environment is characterized by:
-
Dissolved oxygen content: lower than 0.01 ppm;
-
Hydrogen: 25–35 cc (STP)/kg PWR water;
-
Cl and F: lower than 0.05 ppm;
-
B: ~1000 ppm (adjusted by boric acid additions);
-
Li: quantity needed for adjustment of pH (~2 ppm);
-
PH: [7,8,9,10]; and
-
Conductivity: 2–40 μS/cm.
These conditions are controlled in a loop and the PWR water is introduced in the pressure vessel mounted on the loadframe.
Push-pull tests (Rε = −1, where Rε denotes the ratio between the minimum and the maximum strain) were performed under total axial strain control with a total strain amplitude of ±0.6%. Strain was controlled using two linear variable differential transformers (LVDT, RDP LIN 56, DP Electronics Ltd., Wolverhampton, UK) measuring the displacement between flanges placed on specimen shoulders as shown in Figure 2b. This remote control of deformation requires a prior calibration to relate the displacement imposed at the level of the flanges via the LVDT sensor and the deformation on the gauge length of the testpiece.
Reference tests were conducted with a triangular waveshape at different strain rates. Additional tests were also performed using complex signals noted SIS A and SIS B.
The SIS A signal is representative of the loading conditions induced by water mixture in a tee junction as presented in the introduction. As shown in Figure 3a, this SIS A signal, with a total period of 840 s, can be divided in five elementary segments (Figure 3a) characterized by a duration and a mean strain rate as listed in Table 2. Four segments are characterized by a positive strain rate and a strain range corresponding to one quarter of the total strain range while the last segment corresponds to the unloading part of the fatigue cycle, associated with a negative strain rate. Since the strain range is identical but the strain rate is varying, the duration of the segments varies too.
In order to examine in more details, the influence of this loading signal and in particular of the slowest part (segment 4), different combinations of these elementary segments have been considered in previous studies [15,16,17]. The results indicated that the signals where the longest segment 4 is applied in tension, that means with a positive deformation, are more damaging than the signals where this slow strain rate segment is applied in the compressive part of the cycle, that means with a negative deformation [12]. In the present study, only the so-called SIS B signal, presented in Figure 3b, will be considered in addition to the SIS A signal. The comparison presented in Figure 3c with the associated stress response indicates that one of the major differences between the two signals resides in the duration of the cycle part with a positive strain, which is much larger in the case of the SIS B signal.
As it has been previously pointed out [9], the passage of the moving rod within the autoclave along with an efficient sealing are delicate to ensure without friction along the load axis. Since the load cell is located outside the autoclave, such frictions may slightly disrupt the measurement of the load. This can explain some discrepancies in the stress amplitudes between tests performed in air and in PWR simulated environment. However, it must be kept in mind that the value of the applied strain amplitude is not affected and is the same in air and in PWR environment. To analyze the effect of the loading signal on the stress response, the results from tests conducted in the air environment can be considered as the more reliable.
Tests were conducted to failure or intentionally interrupted after selected number of cycles in order to assess the damage in terms of crack density, crack depth and crack front shape. For the first type of tests, the fatigue life, noted N5, corresponds here to the number of cycles required to detect a decrease of 5% in the quasi-stabilized cyclic stress response. This criterion was selected principally in order to be consistent with existing internal databases. However, it must be noted that, given the 9 mm diameter of the specimen, the number of cycles to conduct the specimen to failure can be slightly superior of 100 to 1000 cycles, depending on the loading conditions. For the second type of tests, namely interrupted tests, after the achievement of requested LCF cycles at 300 °C, the specimens were fatigued to failure in air at room temperature under stress-control (Rσ = 0.2, where Rσ denotes the ratio between minimum and maximum stress) at high frequency (10 Hz). The main objective of this last step is twofold: the first one is to achieve failure as rapidly as possible, the second one is to prevent any damage on fracture surfaces prior to observations by applying a positive stress ratio. A stress amplitude of Δσ/2 = 100 MPa was first applied until failure or 6 × 10⁶ cycles at most. When necessary, this amplitude was then increased to Δσ/2 = 120 MPa. SEM analyses of the fracture surfaces were finally conducted. Differences in fracture surfaces morphology in LCF and HCF periods allows then to provide data of both the crack depth and the crack front shape of the largest cracks as a function of the number of cycles applied during the LCF nominal solicitations.

3. Results

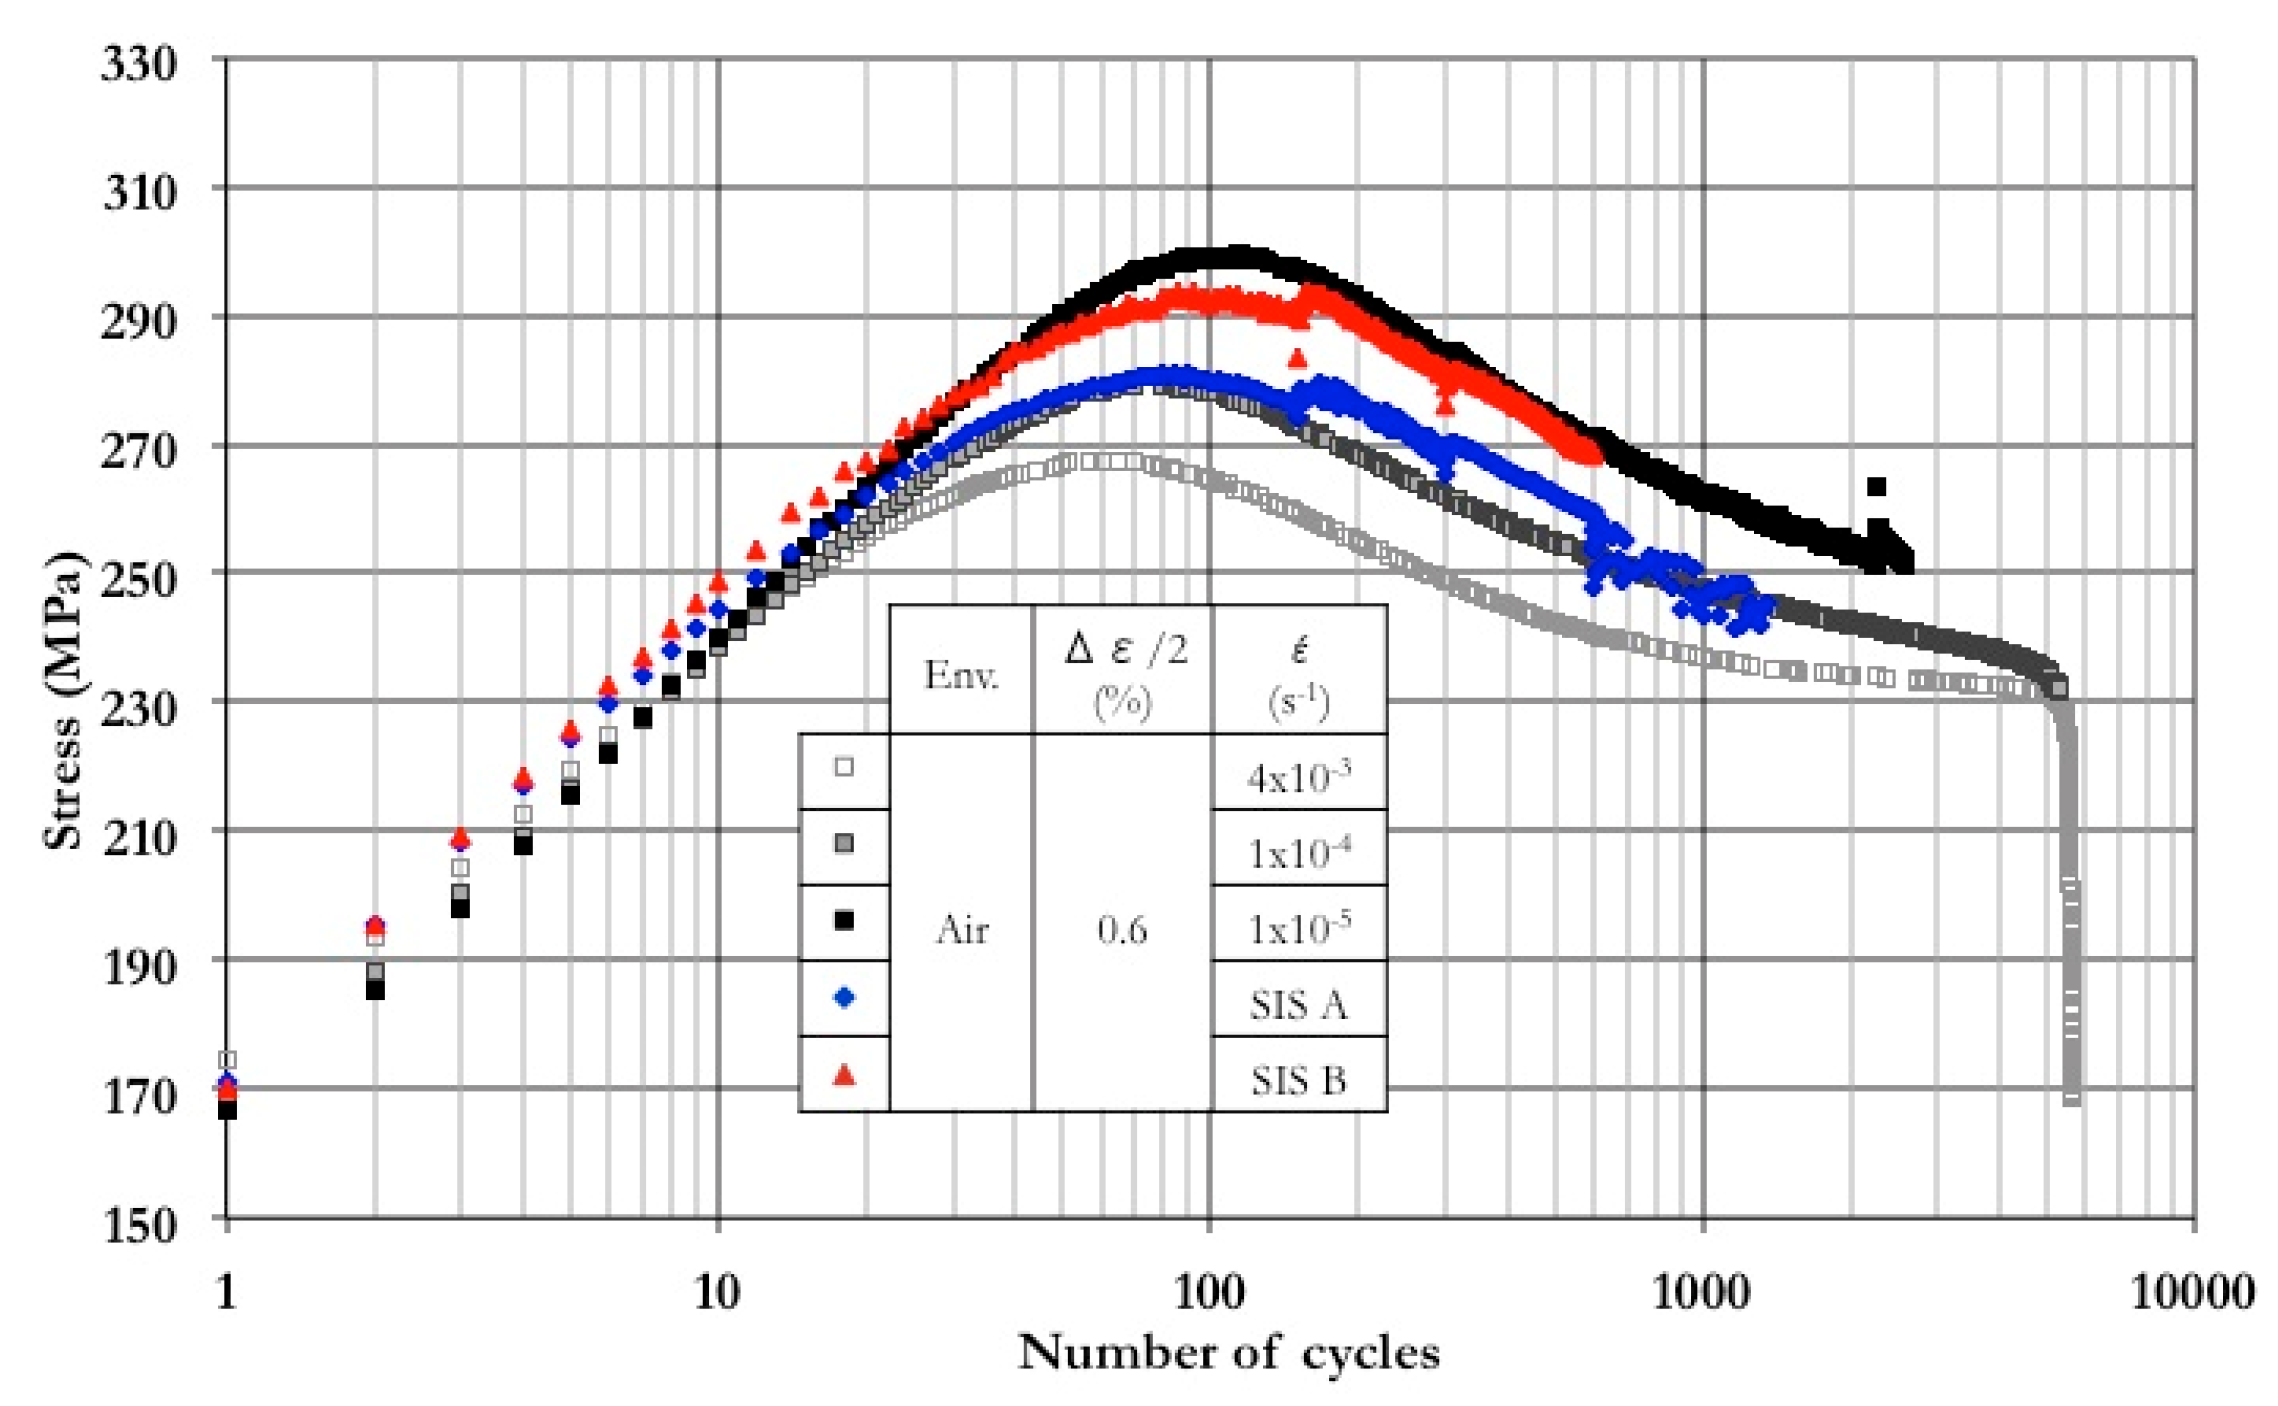
3.1. Influence of Strain Rate and/or Complex Loading on Cyclic Behavior and Fatigue Life in Air

Figure 4 presents the variation of the cyclic peak stress as a function of the number of cycles for the loading conditions considered in air. It is worth noticing that the estimated duration of tests to failure using complex signals with a long period was so high in this environmental condition that it was decided to interrupt the tests after 1350 cycles. Moreover, the presence of a Portevin-Le Chatelier effect was noticed during the slowest strain rate part (segment 4) of both SIS signals. Concerning the tests using standard triangular waveshape, those performed at the intermediate and the highest strain rates were conducted until failure while the one carried out at the slowest strain rate was stopped before failure, after 2500 cycles, because of the very long duration of the test in such condition. For triangular waveshape tested specimens, the analysis of the peak stress response indicates a shift of the peak hardening towards higher number of cycles when the strain rate is reduced and more generally an increase in the cyclic stress response associated with DSA. The intrinsic effect of the strain rate on fatigue life and behavior has been previously shown by de Baglion [11] on the basis of experiments performed in vacuum on the same material. Indeed, the results obtained in air are already influenced by interactions between fatigue and environmental effects [18].
It can be observed from Figure 4 that the stresses associated with the SIS A signal are close to the ones recorded using a triangular signal with a strain rate of 1 × 10⁻⁴ s−1, while the SIS B signal induces a cyclic stress response similar to the one observed with a triangular signal at 1 × 10⁻⁵ s−1. The DSA phenomenon, in term of enhanced cyclic hardening, is thus particularly effective when the positive slow strain rate is applied in tension, i.e., with a positive deformation. This result is, however, not in agreement with the findings reported in [3] which indicate no difference in peak hardening in light water reactor (LWR) environment.
Samples from interrupted tests were fatigued to failure under load control at high frequency. The residual number of cycles to failure, NR, can be considered as a damage indicator, using the assumption that, for a same stress amplitude during HCF loading, the lower the Nr value, the higher the damage extend after the 1350 initial LCF cycles. The values reported in Table 3 indicate a higher damage induced by the SIS B signal. The fracture surfaces were then carefully examined, with a special attention to the initiation area as exemplified in Figure 5. The damage has been quantitatively assessed by determining the maximum crack depth, the surface crack length of this main crack and the total cracked area on the fracture surface. These results, reported in Table 3, confirm the enhanced damaging effect of the SIS B signal, regardless of the parameter under consideration. Additionally, it should be mentioned that the crack shape features generated under these complex waveshapes are not much different from those of cracks produced using triangular signals with a constant strain rate of 1 × 10⁻⁴ and 1 × 10⁻⁵ s−1. On that basis and due to the limited number of data obtained under complex signals, it will be assumed in the following that the variation of the crack aspect ratio during the propagation in the case of complex signals is the same than in the case of these two triangular signals [9].
Since no data from tests interrupted at 1350 cycles were available for triangular signals, the maximum crack depths measured after 1350 cycles for SIS signals are compared in Figure 6 to macroscopic crack growth laws established for triangular signals [9] on the basis of interrupted tests. The curves presented are obtained by fitting all the data from tests to failure and interrupted test by integrating a Paris law-type crack growth equation as explained in [9]. It is thus confirmed that while the crack depth by applying the SIS A signal is nearly similar to that obtained with crack growth laws associated to various strain rates, the crack depth for the SIS B signal is significantly higher.
Additional views at higher magnification of the fracture surfaces are presented in Figure 7 for SIS A and in Figure 8 for SIS B. It can be seen that the general aspect of these surfaces is similar, with the formation of large planar facets reminiscent of those observed under a triangular signal with a strain rate of 1 × 10⁻⁵ s−1. In addition, striations can be distinguished at small crack depth. However, it has to be noticed that since the variation in striation spacing covered during 1350 cycles is too narrow, these data will not be considered in the following.

3.2. Influence of Strain Rate and/or Complex Loading on Cyclic Behavior and Fatigue Life in the PWR Environment

Figure 9 presents the peak stress versus the number of cycles for different loading conditions (triangular signals with different strain rates and complex signals) in the PWR environment. By comparing with the data presented in Figure 4, it can be seen that for a given triangular signal, the peak stress is nearly the same while the fatigue life is significantly lower in PWR. As regards complex signals, in the case of the SIS B signal, the stress response is extremely similar to the one observed in air while with SIS A signal a significant discrepancy is noticed. However, as pointed out before, the load measurement via a load cell which is placed outside the pressure vessel during the tests in PWR medium can be affected by the frictions along the loading rod, in particular at slow strain rate. Nevertheless, it is worth noticing that the applied strain amplitude is not affected.
Apart from this discrepancy, the cyclic stress response generated by SIS signals is intermediate between those obtained using triangular signals at 1 × 10⁻⁴ and 1 × 10⁻⁵ s−1, confirming the observations in air.
The fatigue lives determined in PWR environment using complex signals are N5 = 1200 cycles for SIS A and N5 = 440 cycles for SIS B. Therefore, the longer fatigue life obtained with the SIS A signal seems consistent when compared with the results in air presented in the previous section and indicating a less extend of damage with the SIS A signal. These trends are furthermore in agreement with similar data previously obtained on a different grade of 304L [12,17], even though the fatigue resistance of these two alloys are different.
In order to grain a deeper insight into the influence of the strain rate and load signal on the development of fatigue damage, additional tests interrupted in the early stage of the fatigue life have been carried out in this environment. The conditions and the corresponding results are given in Table 4.
For the test interrupted after 300 cycles with the SIS A signal, since no failure was achieved after 6,858,800 cycles under a load amplitude of 100 MPa, the stress amplitude has been raised to a value of 120 MPa (indicated by *); 1,045,800 additional cycles were still required at this higher amplitude to achieve failure, which is indicative of a lower extend of damage introduced during the initial 300 cycles in this loading condition. General views of the corresponding fracture surfaces are presented in Figure 10. It is first noticed that the number of initiation sites is lower using complex signals than with triangular signals. Damage has been quantified further by using the same parameters than in air. The comparison after 300 cycles once again indicates a higher damage induced by SIS B with respect to SIS A, regardless of the characteristic damage parameter under consideration. Apart from a lower value of the cracked area, the damage after 300 cycles using SIS B signal is actually close to the one obtained after 600 cycles with SIS A.
When comparing the results on crack depth as a function of the number of cycles as reported in Figure 11, it can be seen that the damage generated by SIS A signal is in between the damage corresponding to a triangular signal with a strain rate of 4 × 10⁻³ and 1 × 10⁻⁵ s−1 while the SIS B generated damage is similar to that of the triangular signal with a strain rate of 1 × 10⁻⁴ s−1. A similar ranking of the severity of the different signals is obtained by considering the cracked area. These observations suggest the following ranking in terms of severity:
D SIS B ~ D 10 4 > D 10 5 > D SIS A > D 4 × 10 3
where D represents the damage as characterized by the crack depth or the cracked area and the subscript the type of signal or the strain rate in the case of triangular signals.
This analysis confirms that in PWR environment the fatigue damage induced by the SIS B signal is more important than with SIS A signal. It is thus determined that, more than the average strain rate, the location in the signal of slow strain rate segments is a key parameter.

4. Discussion and Analysis

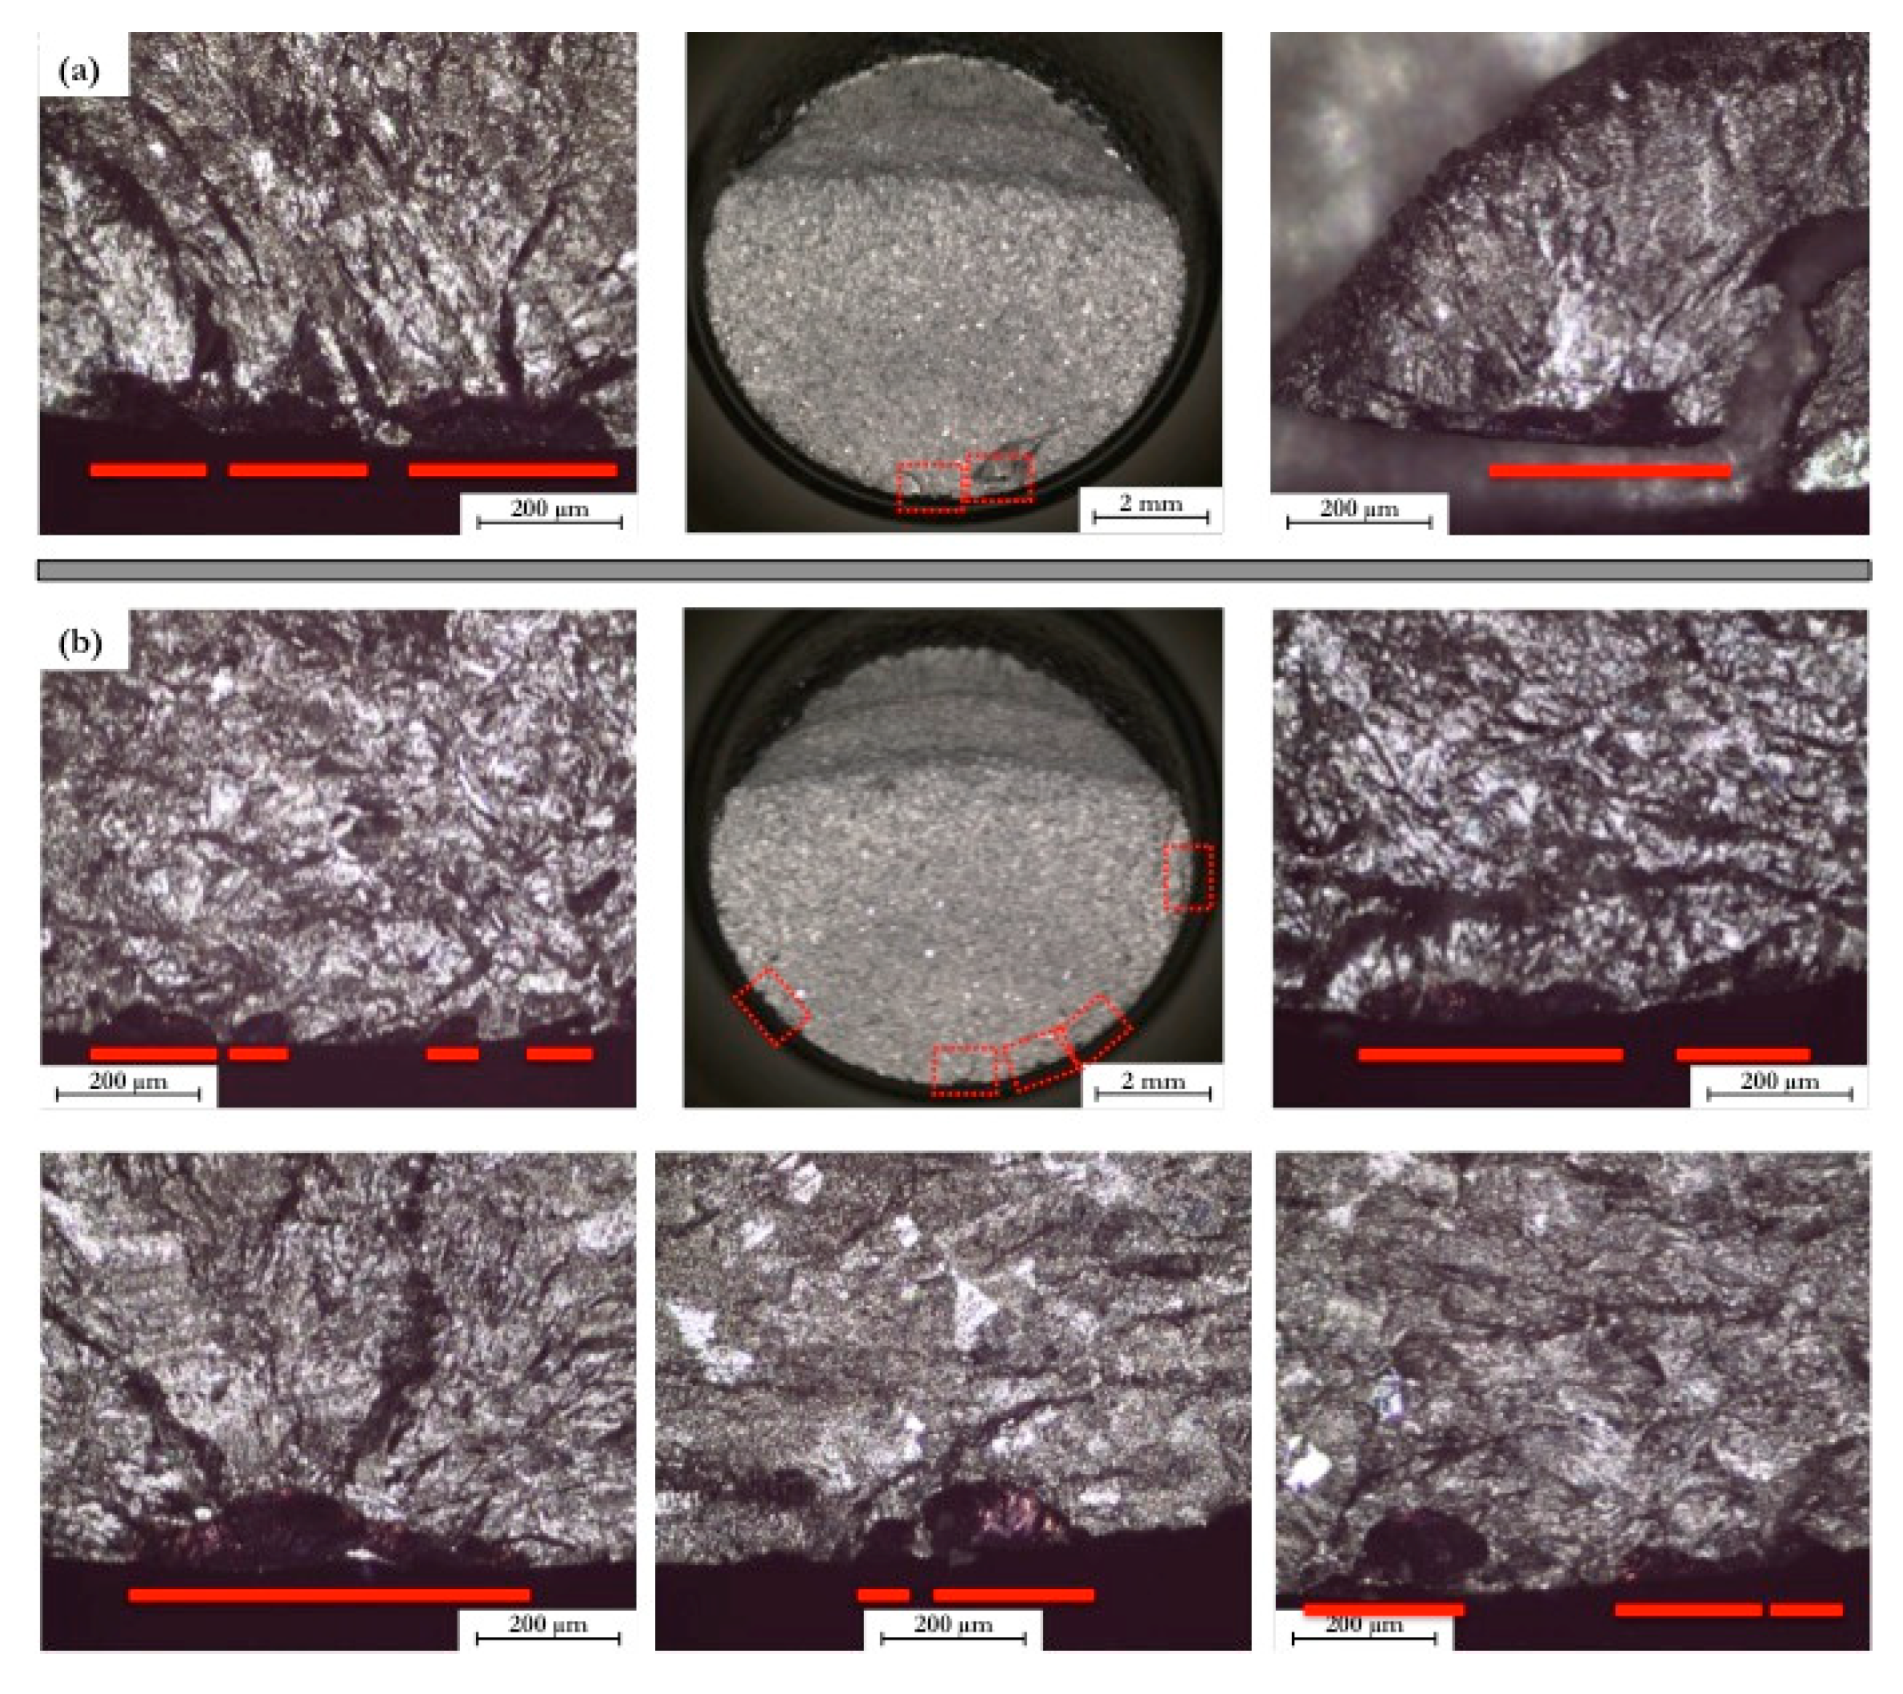
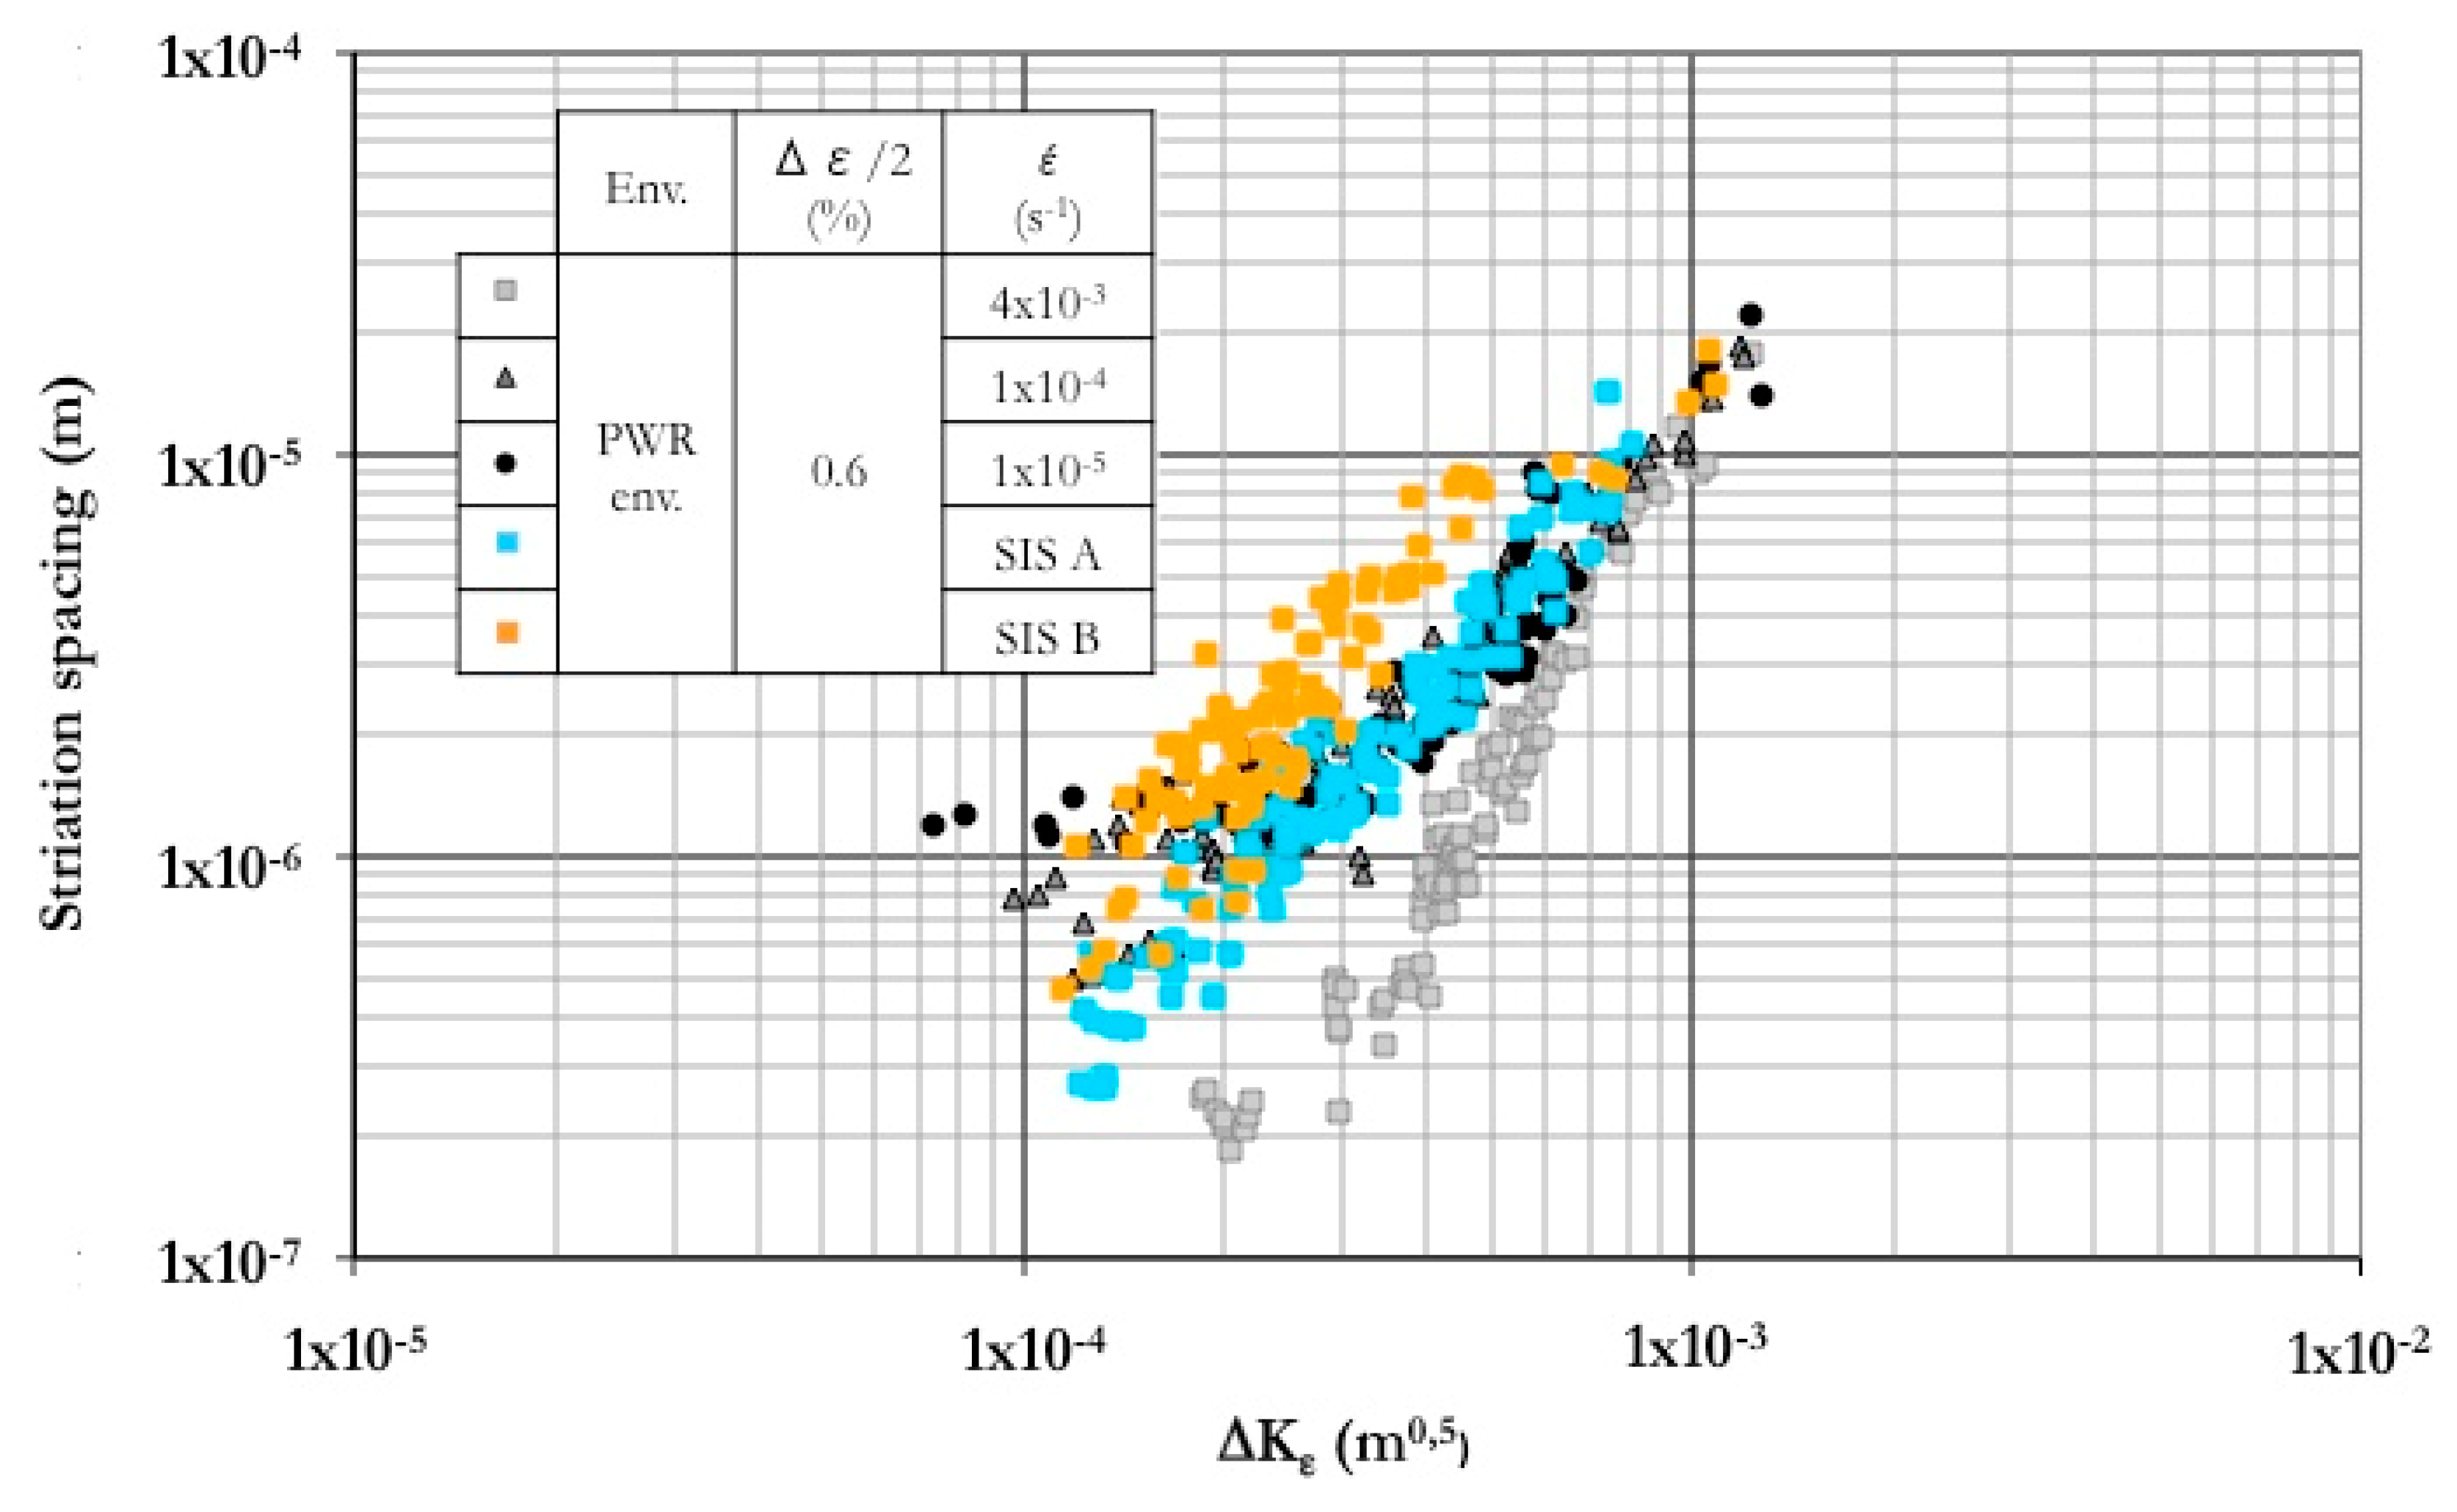
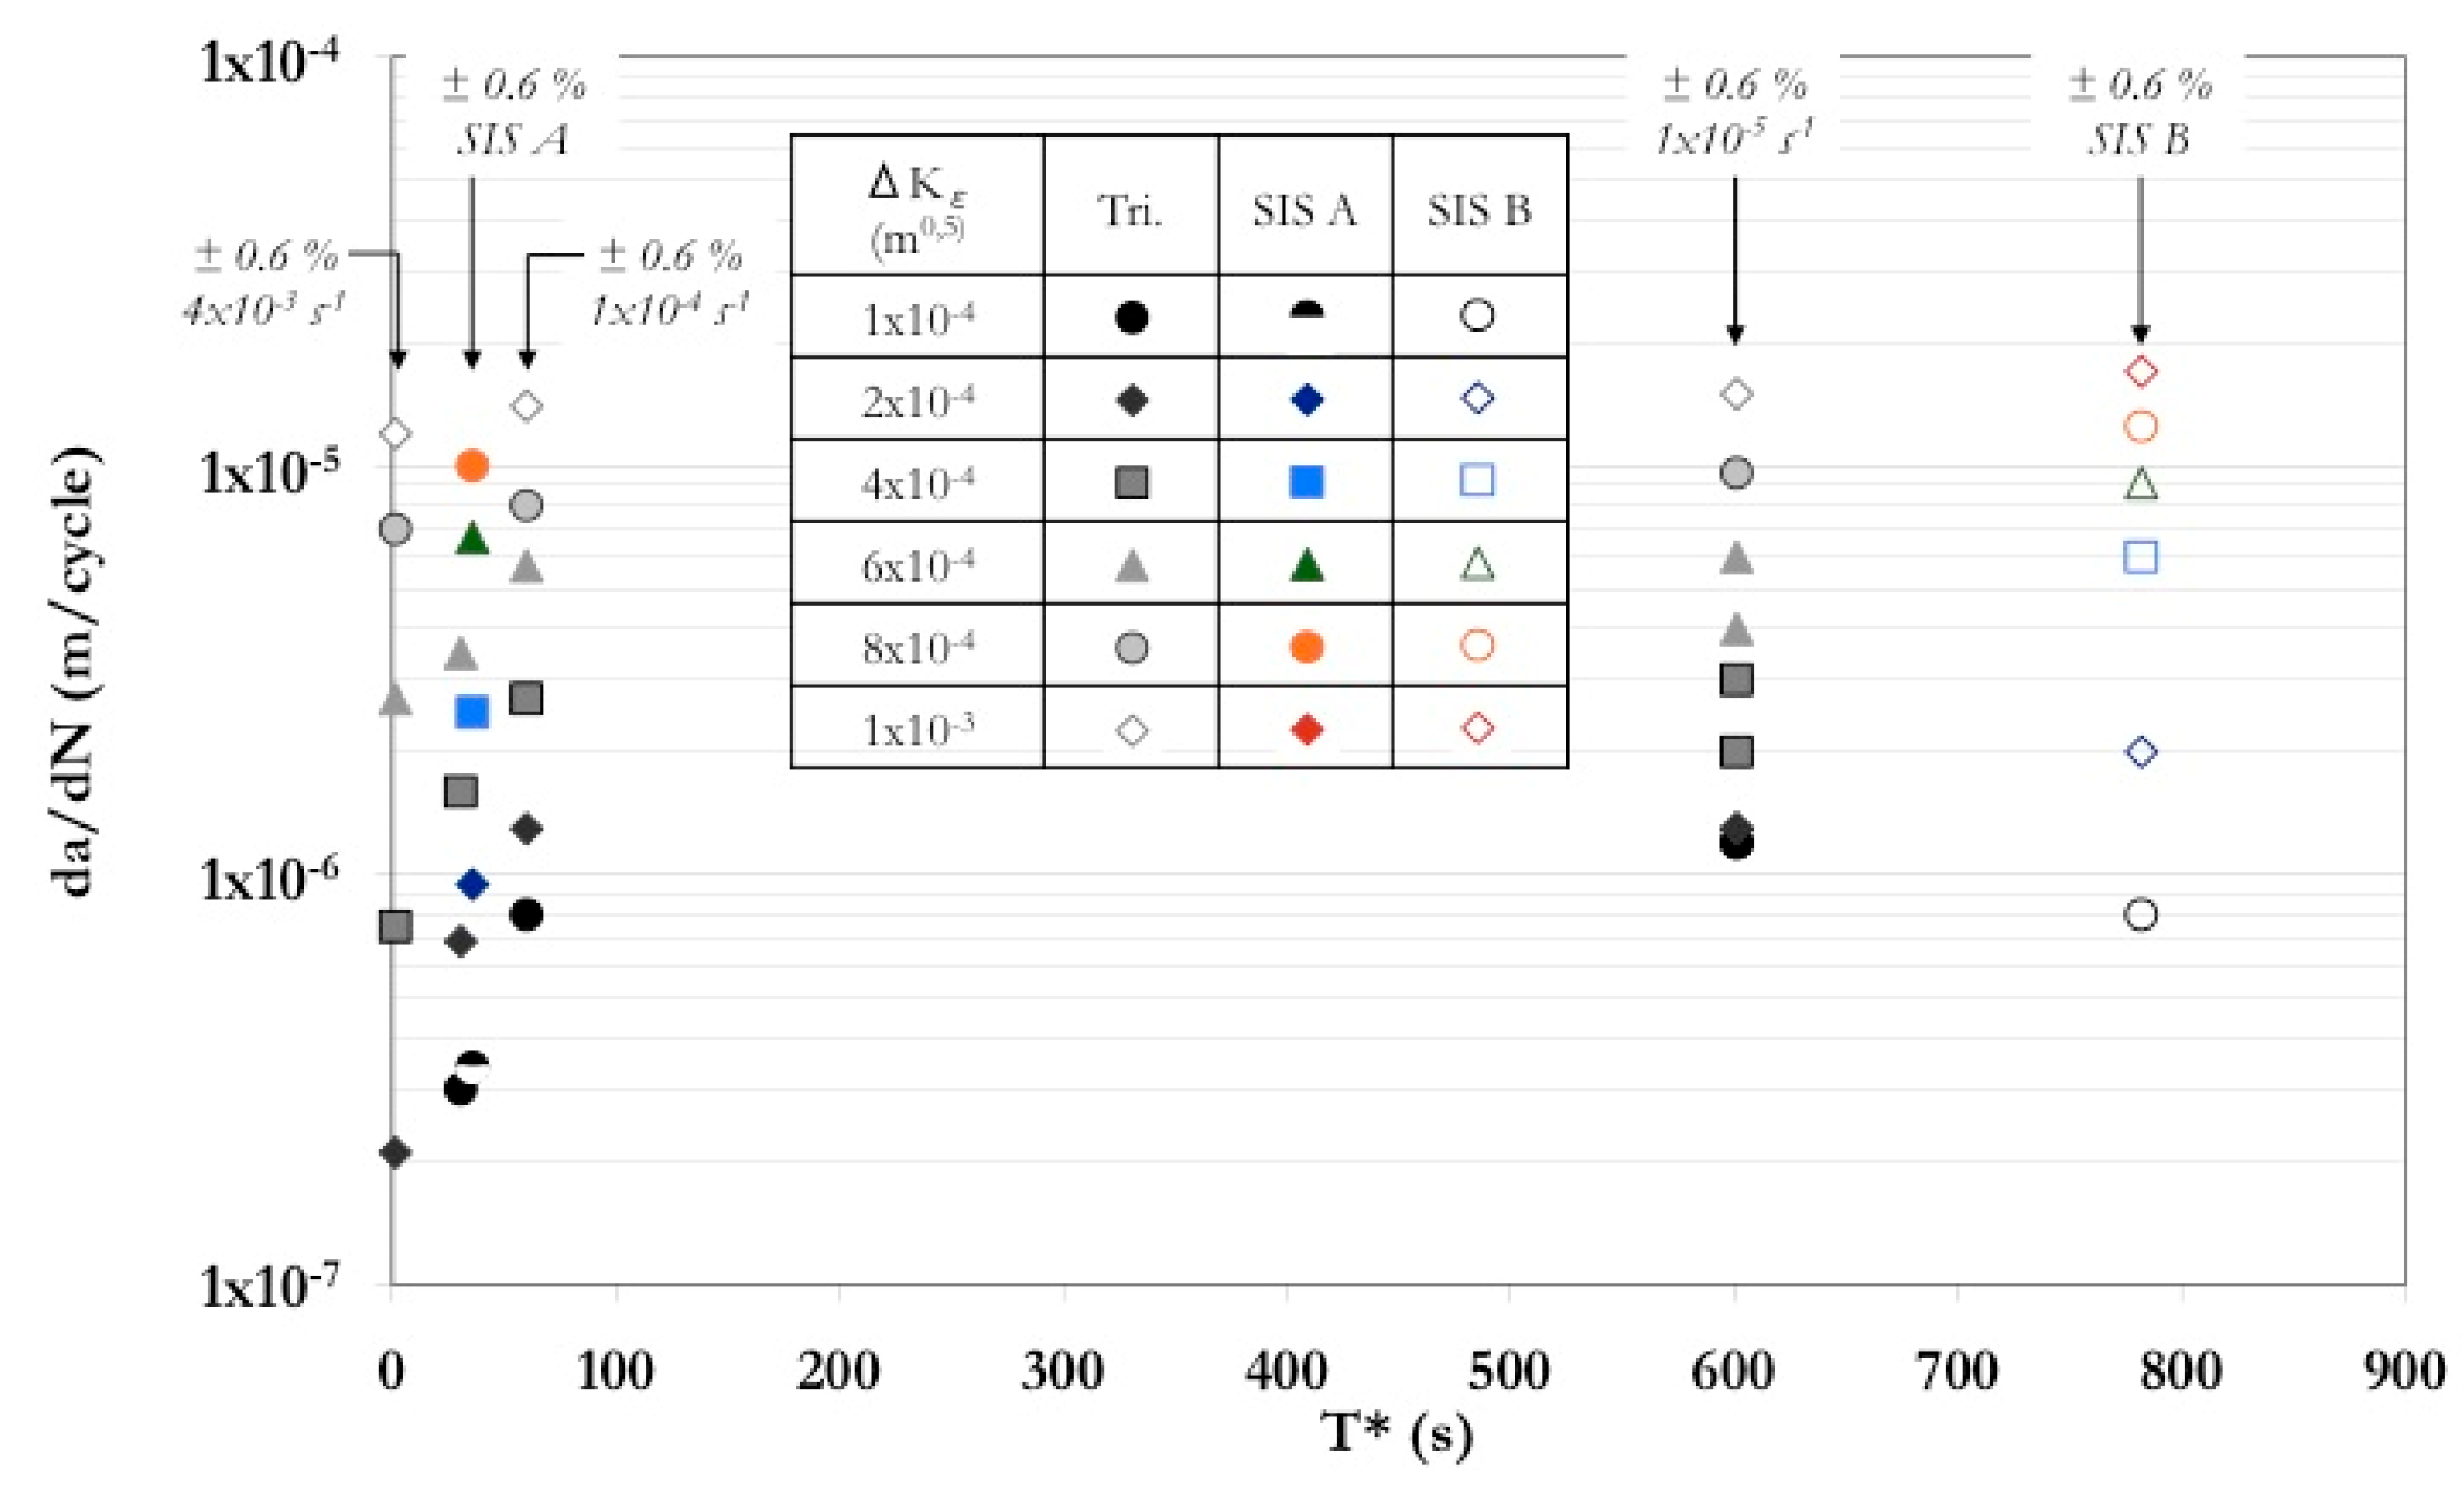
4.1. Analysis of the Propagation Stage

The general aspect of the fracture surfaces of specimens using SIS A and SIS B signals in the PWR environment is presented in Figure 12. Similarly to that observed in the air environment, the surfaces produced by SIS A and SIS B signals in PWR medium are extremely close to each other and not much different from the surfaces obtained by using a triangular signal at a strain rate of 1 × 10⁻⁵ s−1, all exhibiting a planar aspect. With such complex signals, striations can, however, be observed at smaller crack depths and the corresponding cracked areas are larger. Accordingly, striation spacing measurements can, therefore, be plotted in Figure 13 as a function of the strain intensity factor Δ K ε [9,19,20]: Δ K ε = F ( a , b ) × Δ ε t × ( π × a ) 1 2 , where a is the crack depth, b the surface length, and F(a,b) is a geometrical correction factor as defined in linear fracture mechanics. Indeed, as detailed in a previous paper [9], it was shown that the growth of the main crack during LCF in air as in simulated PWR conditions is properly accounted for by the use of the strain intensity factor range Δ K ε as a crack driving force parameter, according to the original proposal of Kamaya [20]. Moreover, in PWR water, the striation spacing can be equated to the average crack growth rate per cycle, which is not the case in air at 300 °C [9]. One can notice that the spacing with SIS B is larger than with SIS A signal, indicating a higher growth rate. In fact, the spacings measured for SIS A signal are similar to those obtained with a triangular signal at a strain rate of 1 × 10⁻⁴ s−1 or 1 × 10⁻⁵ s−1 while the spacings associated with SIS B signal are the largest. This suggests that the differences in damage or fatigue life might be attributed to the initiation and micro-propagation stages. In addition, the two slopes characteristics of crack growth curves established for triangular signals cannot be clearly identified in the case of SIS A and SIS B signals. The fatigue lives of specimen tested in simulated PWR environment can be estimated on the basis of these data as it has been previously done for tests carried out using triangular signals [9], by integrating the corresponding da/dN = C × ΔKεm power-law equation between an initial crack length of 20 μm and a final crack length of 3 mm. The results are given in Table 5. It can be noticed that the agreement between calculation and experimental data is fair. This supports the fact that striation spacing actually corresponds to the crack advance during one cycle for these complex signals also in the PWR environment.

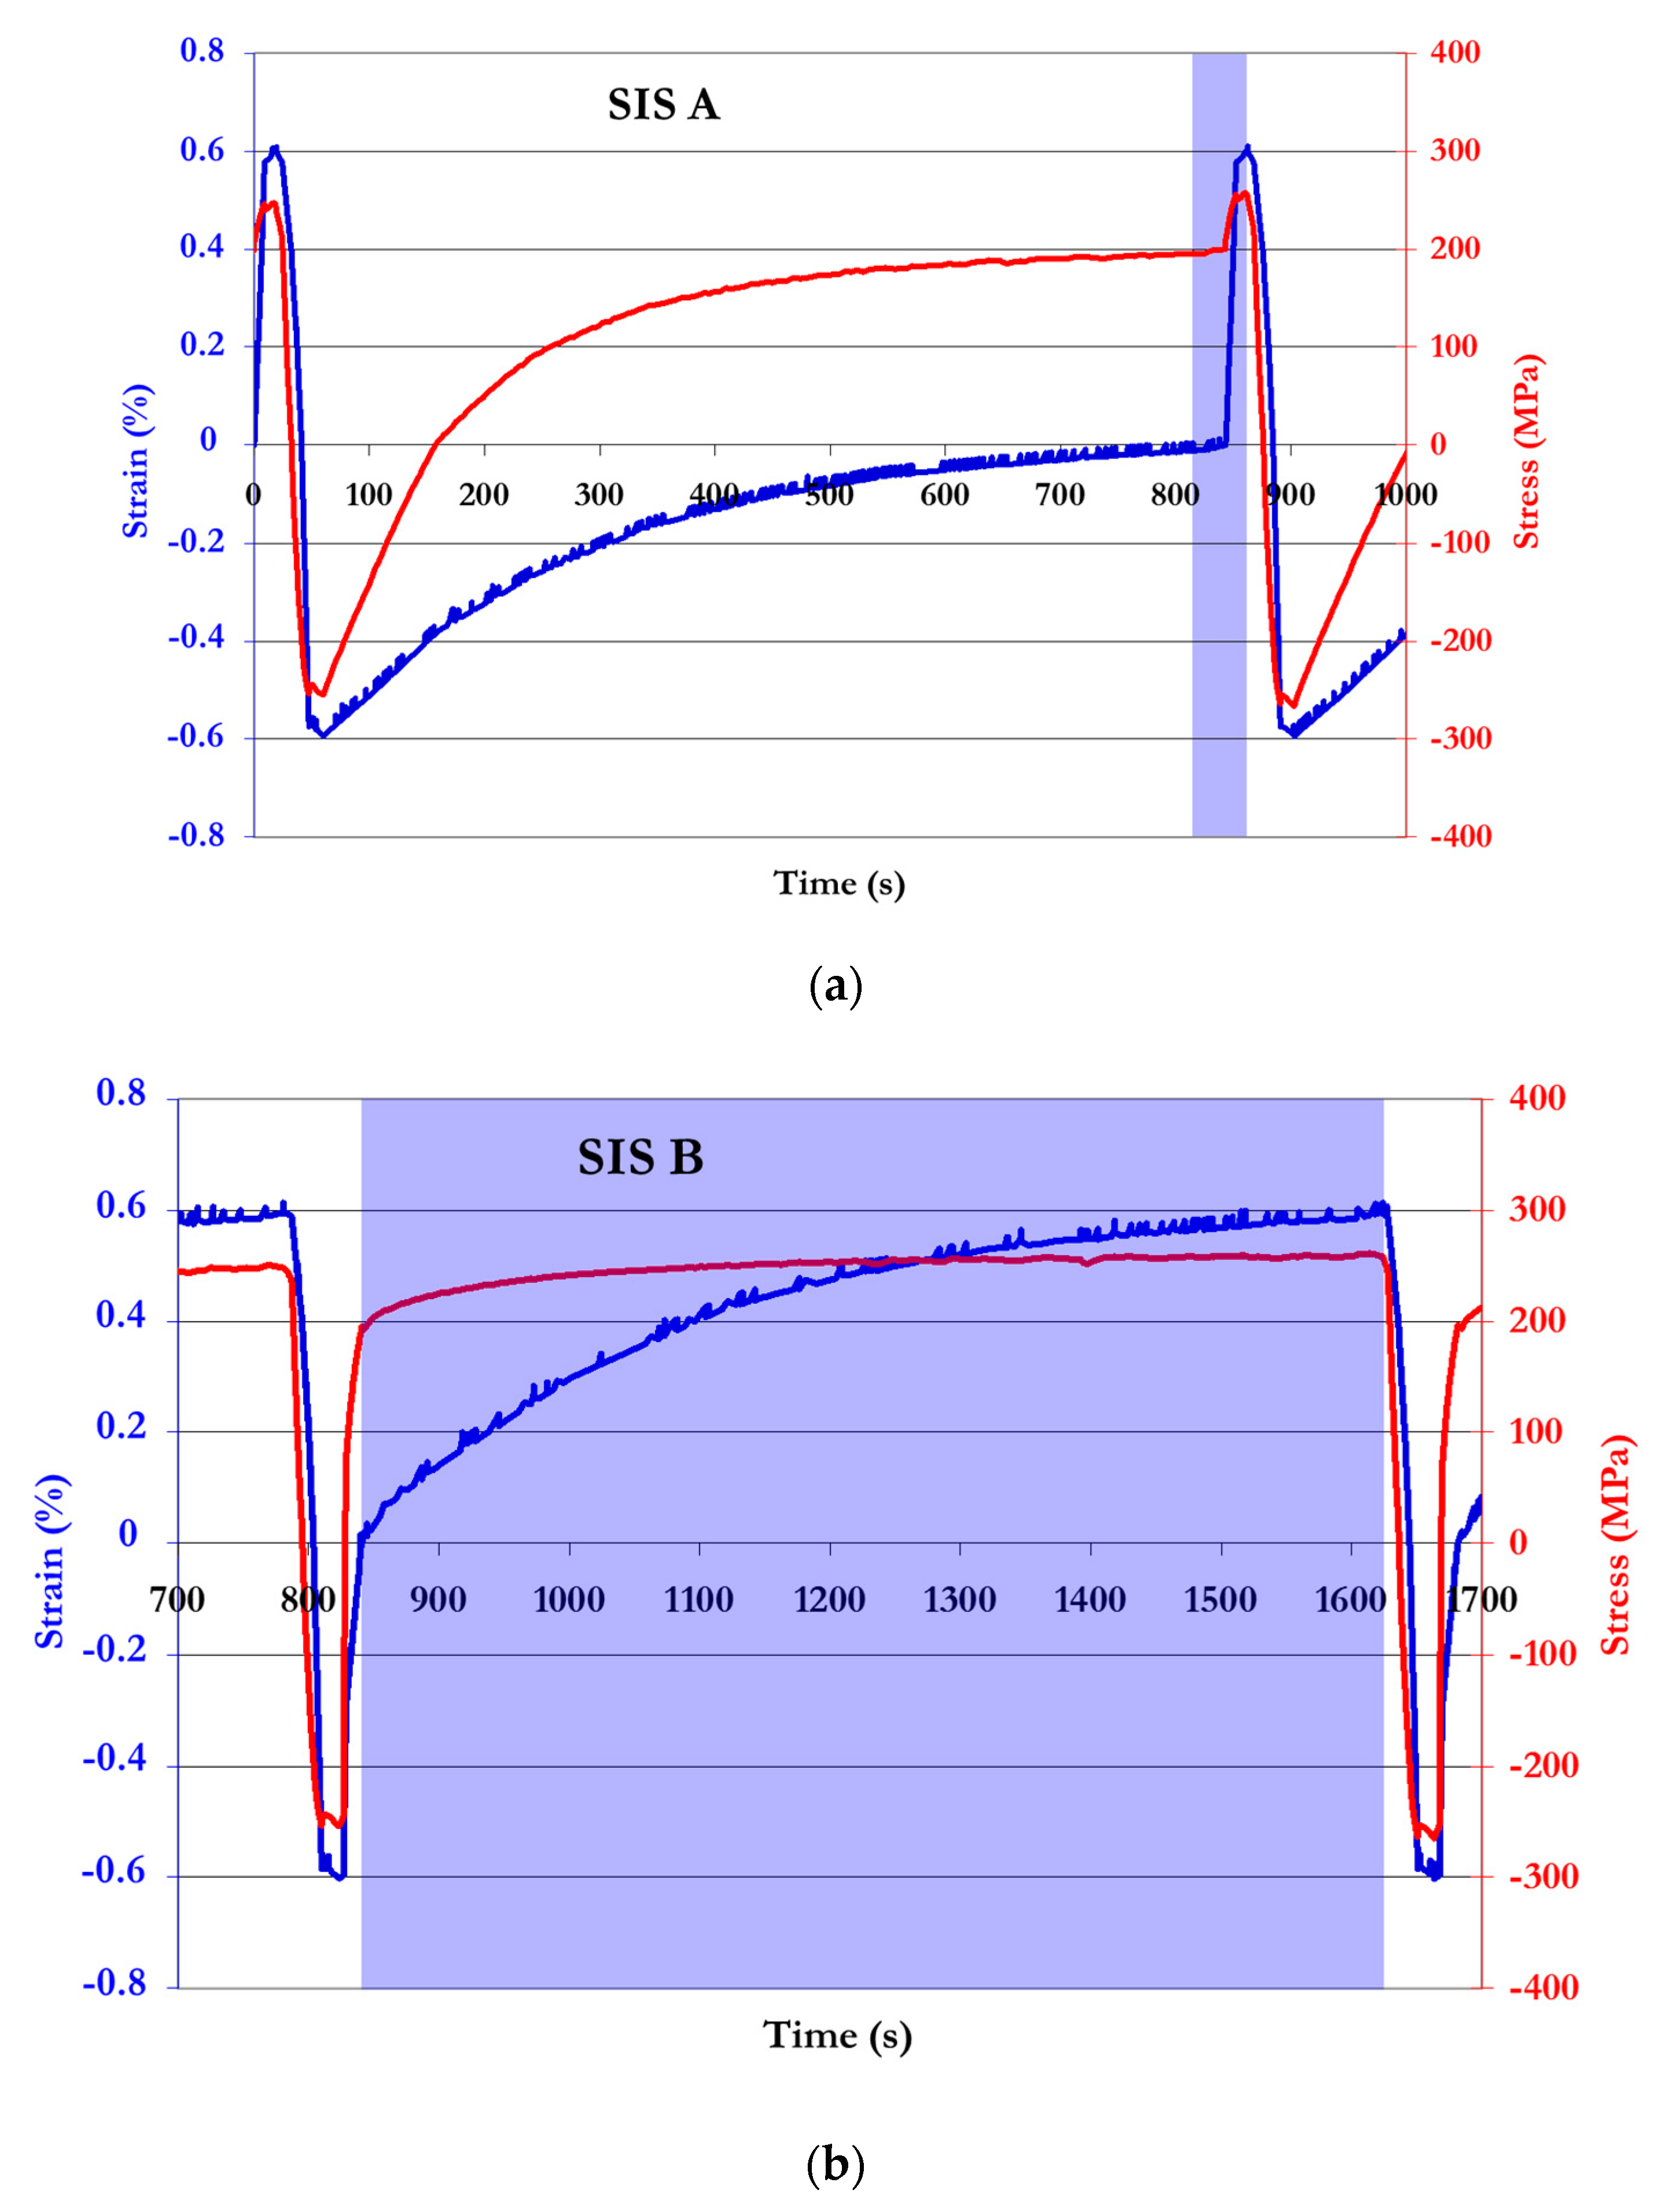
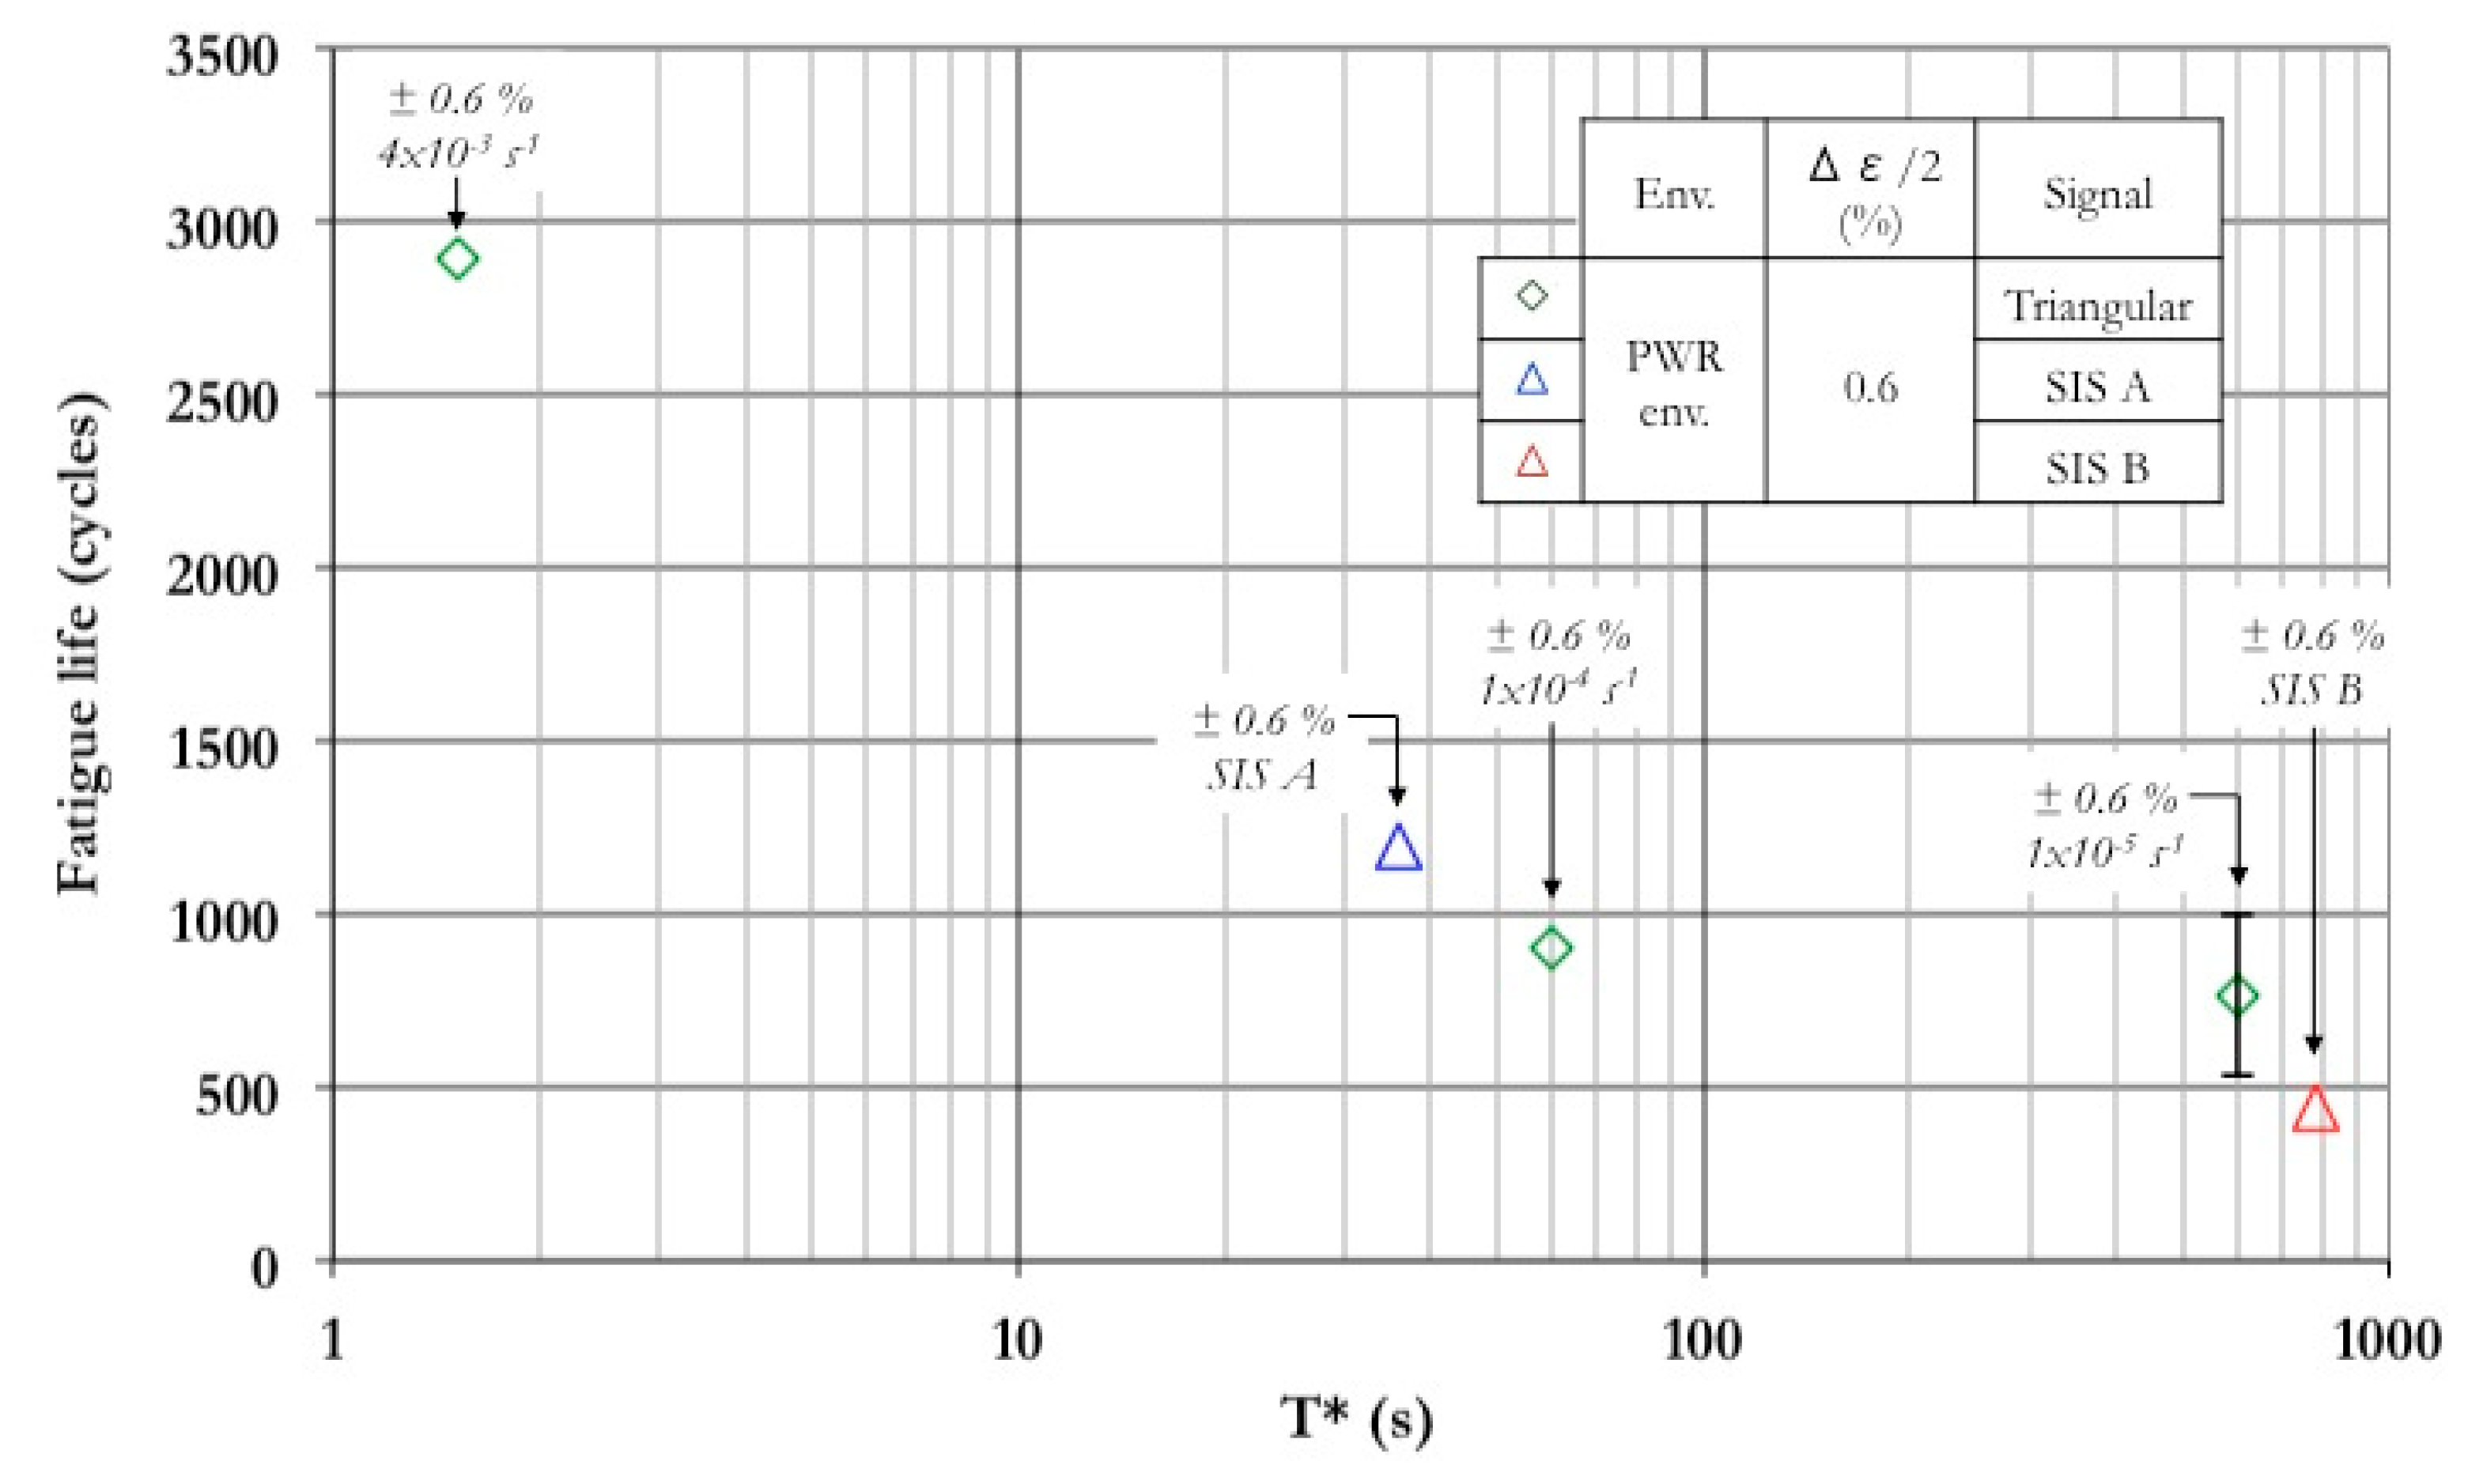
4.2. Analysis of the Influence of the Signal Shape on Fatigue Crack Growth in a PWR Environment

The results obtained in vacuum have evidenced an intrinsic effect of strain rate which induces higher crack growth rates and a reduction in fatigue lives when the strain rate decreases [12]. In a PWR environment, the growth rates and consequently the fatigue lives are additionally conditioned by the action of environmentally-assisted fatigue crack growth mechanisms. Thus, decreasing the strain rate from 4 × 10⁻³ s−1 to 1 × 10⁻⁴ s−1 in vacuum induces a life reduction by a ratio equal to 1.3, while this ratio is equal to 3.2 in the PWR environment. Such an enhanced environmental effect at slow strain rate can be at least partly attributed to a longer exposure of the crack tip to PWR water [21]. However, isolating the respective influence of the numerous factors controlling the growth rate is made particularly difficult by the fact that the variation of certain parameters, such as strain amplitude or strain rate not only affects the exposure duration, but also the intrinsic response of the material as previously discussed. The situation is even more complicated when considering complex signals since the strain rate varies during one cycle. The next section constitutes a first attempt to tackle this issue.
In order to evidence a possible time-controlled crack growth regime, different authors [22,23,24] have proposed to relate the crack advance during one cycle to the rise time TR, i.e., the duration of the part of the loading cycle characterized by a positive strain rate. This type of approach was originally applied by Shack and Kassner [25] to account for fatigue behavior of stainless steels in LWR environments. The use of the TR parameter was justified by considering that environment affects crack propagation only when the crack is opening, that means during the rising strain part ( ε ˙ > 0 ) of the fatigue cycle. This was supported by the results of tests performed under saw-tooth signals in BWR environment. In Figure 14, the growth rates estimated from striation spacings, are plotted as a function of the TR parameter for selected values of the strain intensity factor range Δ K ε calculated as indicated in [24], from data obtained with triangular signals at different strain rates (4 × 10⁻³, 1 × 10⁻⁴, 1 × 10⁻⁵ s−1) and total strain amplitudes (0.3 and 0.6%). It can be seen that at low Δ K ε value, the crack growth rates increase as the TR value is increased up to TR~175 s. Beyond this value, a saturation in the crack growth enhancement is noticed. Such a saturation is almost immediately reached at high Δ K ε value. It is noteworthy that, when considering triangular signals, the different times are always proportional. As a consequence the ranking of the different signals in terms of crack growth enhancement will be independent of the part of the signal considered for the definition of T*. Additionally, the TR parameter cannot account for the differences observed in crack growth rates between SIS A and SIS B signals since its value, calculated on the same straining segments, is identical in both cases.
Therefore, in the present study, a different approach in identifying a characteristic time, noted T*, was developed in order to account for the influence of PWR environment under complex signals. The T* parameter is here considered to represent the time during one fatigue cycle where environment is actually affecting the crack growth process. In a first step, it is assumed that the effective environment action takes place only during the rising straining part of the cycle. However, from the work by Tsutumi et al. [2] this time would depend on a threshold strain ε th that would control the interactions between crack tip deformation and environmental effects. Indeed, they have performed tests in PWR environment on a 316NG stainless steel by using complex signals consisting in different combinations of fast and slow loading stages during one fatigue cycle. Their results [2] indicate that under a certain threshold in terms of strain noted εth, deforming the material with a slow or a fast strain rate has no effect on growth rates as well as on fatigue lives. For a value of the total strain amplitude of 0.6%, this εth threshold value is equal to −0.2% while it is equal to 0% when the strain amplitude is reduced to 0.3%. Thus, the environment would enhance the crack growth rate only when ε > ε th .
However, applying this value to the data collected in the present study does not provide a proper description of the crack growth rates as a function of strain rate and load signal. This is the reason why it was decided to apply an inverse method in order to identify the value of the strain threshold εth* and the characteristic time T* pertaining to the experimental conditions (material, load signal, etc.). Indeed, as shown in Figure 15, a small variation in the εth* value close to 0 has a very large impact in terms of relative values on the corresponding T* in the case of the SIS A signal which is in any case small, while the much larger value associated with SIS B is almost unaffected by a such a small variation in the εth* value. This value was tuned by a “trail-and-error” procedure and finally identified as: εth* = −0.0065%. In the following, crack growth rate and fatigue life data will be analyzed along this εth* value and associated T* values. In Figure 16 the crack growth rates measured at selected values of ΔKε are plotted as a function of the T* parameter. It can be seen that while the tendency already noticed with the TR parameter for triangular signals is still observed, the data corresponding to SIS A and SIS B signals become consistent with this type of analysis using T*, which means higher crack growth rates with SIS B than with SIS A signal for a given value of ΔKε. More importantly, this diagram suggests that the environmentally-induced fatigue crack growth enhancement is controlled by the T* parameter, in relation with the exposure of the crack tip to the PWR environment, until this enhancement achieves a kind of saturation with a plateau for T* > 50 s.
This characteristic time defined by the T* parameter can furthermore be considered to analyze the fatigue lives in PWR environment under different loading conditions. Such an analysis is performed in Figure 17 where the fatigue lives obtained for triangular and SIS signals appear to be well ordered with the variation in T* values, i.e., the longer T*, the lower the life. Moreover, consistently to what was noticed on crack growth rate data, a significant decay in fatigue resistance is noticed for T* < 50 s while the fatigue life remains almost unaffected at higher values.
Hence it has been shown that the use of the characteristic time T* accounts for the differences noticed in fatigue lives and crack growth rates between both SIS A and SIS B signals, which is not the case when considering other characteristic times, like the cycle period or the total time spent in tension loading TR, which are identical for both SIS signals. By its present definition, the characteristic time T* is similar to the one proposed by Tsutsumi et al. [2] in the case of slow-fast-fast (SFF) and fast-slow-fast (FSF) signals tested on 316NG steel. This differs, however, by the value of the deformation threshold εth*, which could be due to differences in the stress-strain behaviors of these alloys and/or in their susceptibility to the PWR environment effects. Thus, the effective time T* during which the material is exposed to environmental effects has been defined from a deformation threshold εth* which has been identified at −0.0065% of strain. This finding is consistent with observations by Vormwald and Seeger [26] who have shown that under large-scale yielding conditions, the crack opening can actually be connected to a deformation threshold located in the negative strain part of the cycle. Thus, experimental measurements of this opening deformation would be necessary to further assess the signification of this εth* parameter which has been fitted to experimental data so far. Furthermore, it is here assumed in a first analysis that this εth* threshold does not depend on the strain amplitude because of the limited data at different amplitudes.
Finally, a saturation in environmental effects has been noticed on fatigue lives as on growth rates for T* > 50 s (Figure 16 and Figure 17). This response in terms of crack growth rates and fatigue lives might be related to a saturation of one of the sequential elementary steps involved in environmentally-assisted crack growth [27], namely transport to the crack tip, adsorption, surface reactions and repassivation, absorption of atoms produced by surface reactions, and diffusion. Critical experiments are still required to gain further insights into the kinetics of these different processes.

5. Summary and Conclusions

In this study, the influence of complex load signals (SIS A and SIS B) on the LCF resistance of a 304L austenitic stainless steel has been investigated in relation with the occurrence of the strain rate variations during the loading cycle, with a special attention paid to environmental effects by comparing damage observed in air and in a simulated PWR water environment.
In particular, the analysis of the LCF tests using both SIS signals has evidenced differences in the stress-strain behavior engendered by the two signals. Indeed, as evidenced under triangular signals, dynamic strain ageing intervenes at low strain rates, and as a consequence influences the stress-strain response depending on the signal considered. A classification of the severity of the different signals has furthermore been established on the basis of the fatigue life results and detailed observations of the cracking features on the samples. More particularly, it is shown that the SIS B signal is more damaging than SIS A in air and in PWR environment. Additionally, striation spacing measurements indicate that this is mainly due to higher fatigue crack growth rates.
As what more specifically concerns the interplay between intrinsic strain-rate effects and time-dependent mechanisms during environmentally-assisted cracking in PWR environment, a threshold strain (εth* = −0.0065%) has been identified. Below this threshold, it is assumed that cracks are not fully opened, so that the PWR environment cannot affect the growth process. Reciprocally, a characteristic time T*, corresponding to the duration where environment effectively assists the growth of open cracks has been introduced. It is then shown that the large difference in the T* values between SIS A and SIS B signals indeed accounts for the difference noticed in growth rates and consequently in fatigue lives in accordance with the effect of strain rate. Furthermore, it is shown that for T* values lower than 50 s, the crack growth enhancement is proportional to the T* value, while a saturation in environmental assistance is noticed above 50 s.
Further studies will aim in elucidating the environmentally-assisted cracking mechanisms controlling these effects and precise the signification of the T* characteristic time.

Author Contributions

Conceptualization: J.M., G.H. and L.B.; Methodology: J.M., G.H., T.P. and L.B.; Investigation: T.P.; Data curation: T.P., J.M., G.H., and L.B.; Writing—original draft preparation: G.H. and T.P.; Writing—review and editing: J.M., G.H., T.P. and L.B.; Project administration: J.M., G.H. and L.B.

Funding

This research received no external funding.

Acknowledgments

The authors thank Framatome for the financial support and the technical center of Framatome in Le Creusot for tests in PWR water environment.

Conflicts of Interest

The authors declare no conflict of interest.

References

  1. Chopra, O.K.; Shack, W.J. The effect of lwr coolant environments on the fatigue life of reactor materials. In Proceedings of the ASME 2006 Pressure Vessels and Piping/ICPVT-11 Conference, Vancouver, BC, Canada, 23–27 July 2006; American Society of Mechanical Engineers: New York, NY, USA, 2006; pp. 191–204. [Google Scholar]
  2. Tsutsumi, K.; Dodo, T.; Kanasaki, H.; Nomoto, S.; Minami, Y.; Nakamura, T. Fatigue behavior of stainless steel under conditions of changing strain rate in PWR primary water. In Pressure Vessel and Piping Codes and Standards; ASME: New York, NY, USA, 2001; pp. 135–141. [Google Scholar]
  3. Higuchi, M.; Sakaguchi, K.; Nomura, Y. Effects of strain holding and continuously changing strain rate on fatigue life reduction of structural materials in simulated lwr water. In Proceedings of the ASME 2007 Pressure Vessels and Piping Conference, San Antonio, TX, USA, 22–26 July 2007; American Society of Mechanical Engineers: New York, NY, USA, 2007; pp. 123–131. [Google Scholar]
  4. Huin, N. Environmental Effect on Cracking of an 304L Austenitic Stainless Steels in PWR Primary Environtment under Cyclic Loading. Ph.D. Thesis, ISAE-ENSMA National School of Mechanics and Aerotechics-Poitiers, Poitiers, France, 2013. [Google Scholar]
  5. Atkinson, J.D.; Forrest, J.E. Factors influencing the rate of growth of fatigue cracks in rpv steels exposed to a simulated PWR primary water environment. Corros. Sci. 1985, 25, 607–631. [Google Scholar] [CrossRef]
  6. Alain, R.; Violan, P.; Mendez, J. Low cycle fatigue behavior in vacuum of a 316L type austenitic stainless steel between 20 and 600 °C: 1. Fatigue resistance and cyclic behavior. Mater. Sci. Eng. A 1997, 229, 87–94. [Google Scholar] [CrossRef]
  7. Gerland, M.; Alain, R.; Saadi, B.A.; Mendez, J. Low cycle fatigue behaviour in vacuum of a 316L-type austenitic stainless steel between 20 and 600 °C: 2. Dislocation structure evolution and correlation with cyclic behaviour. Mater. Sci. Eng. A 1997, 229, 68–86. [Google Scholar] [CrossRef]
  8. Mannan, S.L. Role of dynamic strain-aging in low-cycle fatigue. Bull. Mater. Sci. 1993, 16, 561–582. [Google Scholar] [CrossRef]
  9. Poulain, T.; Mendez, J.; Henaff, G.; de Baglion, L. Analysis of the ground surface finish effect on the lcf life of a 304L austenitic stainless steel in air and in PWR environment. Eng. Fract. Mech. 2017, 185, 258–270. [Google Scholar] [CrossRef]
  10. Petitjean, S. Influence de l’état de surface sur le comportement en fatigue à grand nombre de cycles de l’acier inoxydable austénitique 304L. Ph.D. Thesis, Université de Poitiers, Poitiers, France, 2003. [Google Scholar]
  11. De Baglion, L.; Mendez, J. Low cycle fatigue behavior of a type 304L austenitic stainless steel in air or in vacuum, at 20 °C or at 300 °C: Relative effect of strain rate and environment. Procedia Eng. 2010, 2, 2171–2179. [Google Scholar] [CrossRef]
  12. De Baglion, L.; Mendez, J.; Le Duff, J.-A.; Lefrancois, A. Influence of PWR primary water on lcf behavior of type 304L austenitic stainless steel at 300 °C—comparison with results obtained in vacuum or in air. In Proceedings of the ASME 2012 Pressure Vessels and Piping Conference, Toronto, ON, Canada, 15–19 July 2012; American Society of Mechanical Engineers: New York, NY, USA, 2012; pp. 463–472. [Google Scholar]
  13. Huin, N.; Tsutsumi, K.; Couvant, T.; Henaff, G.; Mendez, J. Fatigue life of the strain hardened austenitic stainless steel in simulated pressurized water reactor primary water. J. Press. Vessel Technol. 2014, 136, 031405. [Google Scholar] [CrossRef]
  14. Tsutsumi, K.; Huin, N.; Couvant, T.; Henaff, G.; Mendez, J.; Chollet, D. Fatigue life of the strain hardened austenitic stainless steel in simulated PWR primary water. In Proceedings of the ASME 2012 Pressure Vessels and Piping Conference, Toronto, ON, Canada, 15–19 July 2012; American Society of Mechanical Engineers: New York, NY, USA, 2012; pp. 155–164. [Google Scholar]
  15. Le Duff, J.A.; Lefrancois, A.; Vernot, J.P. Effects of surface finish and loading conditions on the low cycle fatigue behavior of austenitic stainless steel in PWR environment comparison of LCF test results with NUREG/CR-6909 life estimations. In Proceedings of the ASME 2008 Pressure Vessels and Piping Conference; Chicago, IL, USA, 27–31 July 2008, American Society of Mechanical Engineers: New York, NY, USA, 2008; pp. 453–462. [Google Scholar]
  16. Le Duff, J.A.; Lefrancois, A.; Vernot, J.P. Effects of surface finish and loading conditions on the low cycle fatigue behavior of austenitic stainless steel in PWR environment for various strain amplitude levels. In Proceedings of the ASME 2009 Pressure Vessels and Piping Conference, Prague, Czech Republic, 26–30 July 2009; American Society of Mechanical Engineers: New York, NY, USA, 2009; pp. 603–610. [Google Scholar]
  17. Le Duff, J.A.; Lefrancois, A.; Vernot, J.P.; Bossu, D. Effect of loading signal shape and of surface finish on the low cycle fatigue behavior of 304L stainless steel in PWR environment. In Proceedings of the ASME 2013 Pressure Vessels and Piping Conference, Paris, France, 14–18 July 2013; American Society of Mechanical Engineers: New York, NY, USA, 2013; pp. 233–241. [Google Scholar]
  18. Mendez, J. On the effects of temperature and environment on fatigue damage processes in ti alloys and in stainless steel. Mater. Sci. Eng. A 1999, 263, 187–192. [Google Scholar] [CrossRef]
  19. Boettner, R.C.; Laird, C.; McEvily, A.J. Crack nucleation and growth in high strain-low cycle fatigue. Trans. AIME 1965, 233, 379–387. [Google Scholar]
  20. Kamaya, M. Low-cycle fatigue crack growth prediction by strain intensity factor. Int. J. Fatigue 2015, 72, 80–89. [Google Scholar] [CrossRef]
  21. Sakaguchi, K.; Nomura, Y.; Suzuki, S.; Tsutsumi, K.; Kanasaki, H.; Higuchi, M. Effect of factors on fatigue life in PWR water environment. In Proceedings of the ASME 2006 Pressure Vessels and Piping/ICPVT-11 Conference, Vancouver, BC, Canada, 23–27 July 2006; American Society of Mechanical Engineers: New York, NY, USA, 2006; pp. 103–111. [Google Scholar]
  22. Shoji, T.; Takahashi, H.; Suzuki, M.; Kondo, T. A new parameter for characterizing corrosion fatigue crack growth. J. Eng. Mater. Technol. 1981, 103, 298–304. [Google Scholar] [CrossRef]
  23. Tice, D.R. Assessment of environmentally assisted cracking in PWR pressure vessel steels. Int. J. Press. Vessels Pip. 1991, 47, 113–126. [Google Scholar] [CrossRef]
  24. Gilman, J.D. Further development of a model for predicting corrosion fatigue crack growth in reactor pressure vessel steels. J. Press. Vessel Technol. 1987, 109, 340–346. [Google Scholar] [CrossRef]
  25. Schack, W.J.; Kassner, T.F. Review of Environmental Effects on Fatigue Crack Growth of Austenitic Stainless Steel; Argonne National Laboratory: Argonne, IL, USA, 1994. [Google Scholar]
  26. Vormwald, M.; Seeger, T. The consequences of short crack closure on fatigue crack growth under variable amplitude loading. Fatigue Fract. Eng. Mater. Struct. 1991, 14, 205–225. [Google Scholar] [CrossRef]
  27. Wei, R.P.; Simmons, G.W. Recent progress in understanding environment-assisted fatigue crack growth. Int. J. Fract. 1981, 17, 235–247. [Google Scholar] [CrossRef]
Figure 1. Variation of strain and stress during one cycle of the SIS A signal.
Metals 09 00197 g001
Figure 2. PWR test rig (a) general view of the autoclave and loadframe, and (b) close view of the specimen equipped with LVDT sensors for strain control.
Metals 09 00197 g002
Figure 3. Presentation of the complex signals (a) SIS A, (b) SIS B, and (c) comparison of the two signals with the stress response.
Metals 09 00197 g003
Figure 4. Peak stress as a function of the number of cycles in air with triangular signals at different strain rates and with SIS A and SIS B signals.
Metals 09 00197 g004
Figure 5. Fracture surfaces with details of the initiation area in test in air at Δεt/2 = 0.6% interrupted after 1350 cycles using the (a) SIS A signal and (b) SIS B signal.
Metals 09 00197 g005
Figure 6. Crack depth as a function of the number of cycles derived from interrupted tests for different loading conditions, namely, triangular signals with different strain rates, SIS A, and SIS B signals in air.
Metals 09 00197 g006
Figure 7. SEM observations of the fracture surfaces produced in air using the SIS A signal.
Metals 09 00197 g007
Figure 8. SEM observations of the fracture surfaces produced in air using the SIS B signal.
Metals 09 00197 g008
Figure 9. Peak stress as a function of the number of cycles with triangular signals at different strain rates and with SIS A and SIS B signals in the PWR environment.
Metals 09 00197 g009
Figure 10. Fracture surfaces and details of the initiation zone obtained from interrupted tests in PWR environment (a) SIS A, 300 cycles, (b) SIS A, 600 cycles, and (c) SIS B, 300 cycles.
Metals 09 00197 g010
Figure 11. Comparison of the measured crack depths during interrupted tests for different loading conditions.
Metals 09 00197 g011
Figure 12. Fracture surfaces from interrupted tests in PWR environment (a) SIS A and (b) SIS B. The dotted lines correspond with the crack front at the transition between LCF and HCF loadings.
Metals 09 00197 g012
Figure 13. Striation spacing as a function of the strain intensity factor range Δ K ε for different signals in PWR environment.
Metals 09 00197 g013
Figure 14. Fatigue crack growth rates as a function of the TR parameter for selected Δ K ε values.
Metals 09 00197 g014
Figure 15. Representation of the T* time in the SIS A and in SIS B signals.
Metals 09 00197 g015
Figure 16. Fatigue crack growth rates plotted as a function of the T* parameter for selected Δ K ε values.
Metals 09 00197 g016
Figure 17. Fatigue lives in the PWR environment as a function of the T* parameter.
Metals 09 00197 g017
Table 1. Tensile properties of the CLI cast 304L stainless steel.
L DirectionT Direction
20 °C300 °C20 °C300 °C
Yield strength
σy 0.2 (MPa)
214130224133
Ultimate Tensile strength (MPa)592414593409
Tensile Elongation A%57395739
Reduction in section area Z%84788175
Table 2. Description of the five elementary segments composing the SIS A signal.
Segment 1Segment 2Negative Strain RateSegment 3Segment 4
Duration (s)101040140640
Mean strain rate (s−1)3.00 × 10−43.00 × 10−43.00 × 10−41.88 × 10−54.84 × 10⁻⁶
Table 3. Quantitative damage measurements for tests in air interrupted after 1350 cycles with SIS A and SIS B signals.
SignalNR (Cycles)Maximum Crack Depth (μm)Surface Crack Length (μm)Cracked Area (μm2)
SIS A2,163,000923050.20
SIS B654,6001295800.26
Table 4. Quantitative damage measurements from interrupted tests with SIS A and SIS B signals in the PWR environment.
SignalNLCF (Cycles)NR (Cycles)Maximum Crack Depth (μm)Surface Crack Length (μm)Cracked Area (μm2)
SIS A3006,858,800
(+1,045,800 *)
690.100.02
600472,4003600.750.23
SIS B300483,2003620.590.18
Table 5. Estimated fatigue lives as compared to experimental data for fatigue testing with SIS A and SIS B signals in PWR environment (The value of C is determined for da/dN expressed in m/cycle and ΔKε in m1/2).
Fatigue Crack Growth Law ParametersNp (20 μm to 3 mm) (Cycles)N5 (Cycles)
CM
SIS A121.969521200
SIS B0.841.54452440

