3. Results and Discussion
The particle sizes of YSZ were not homogeneous.
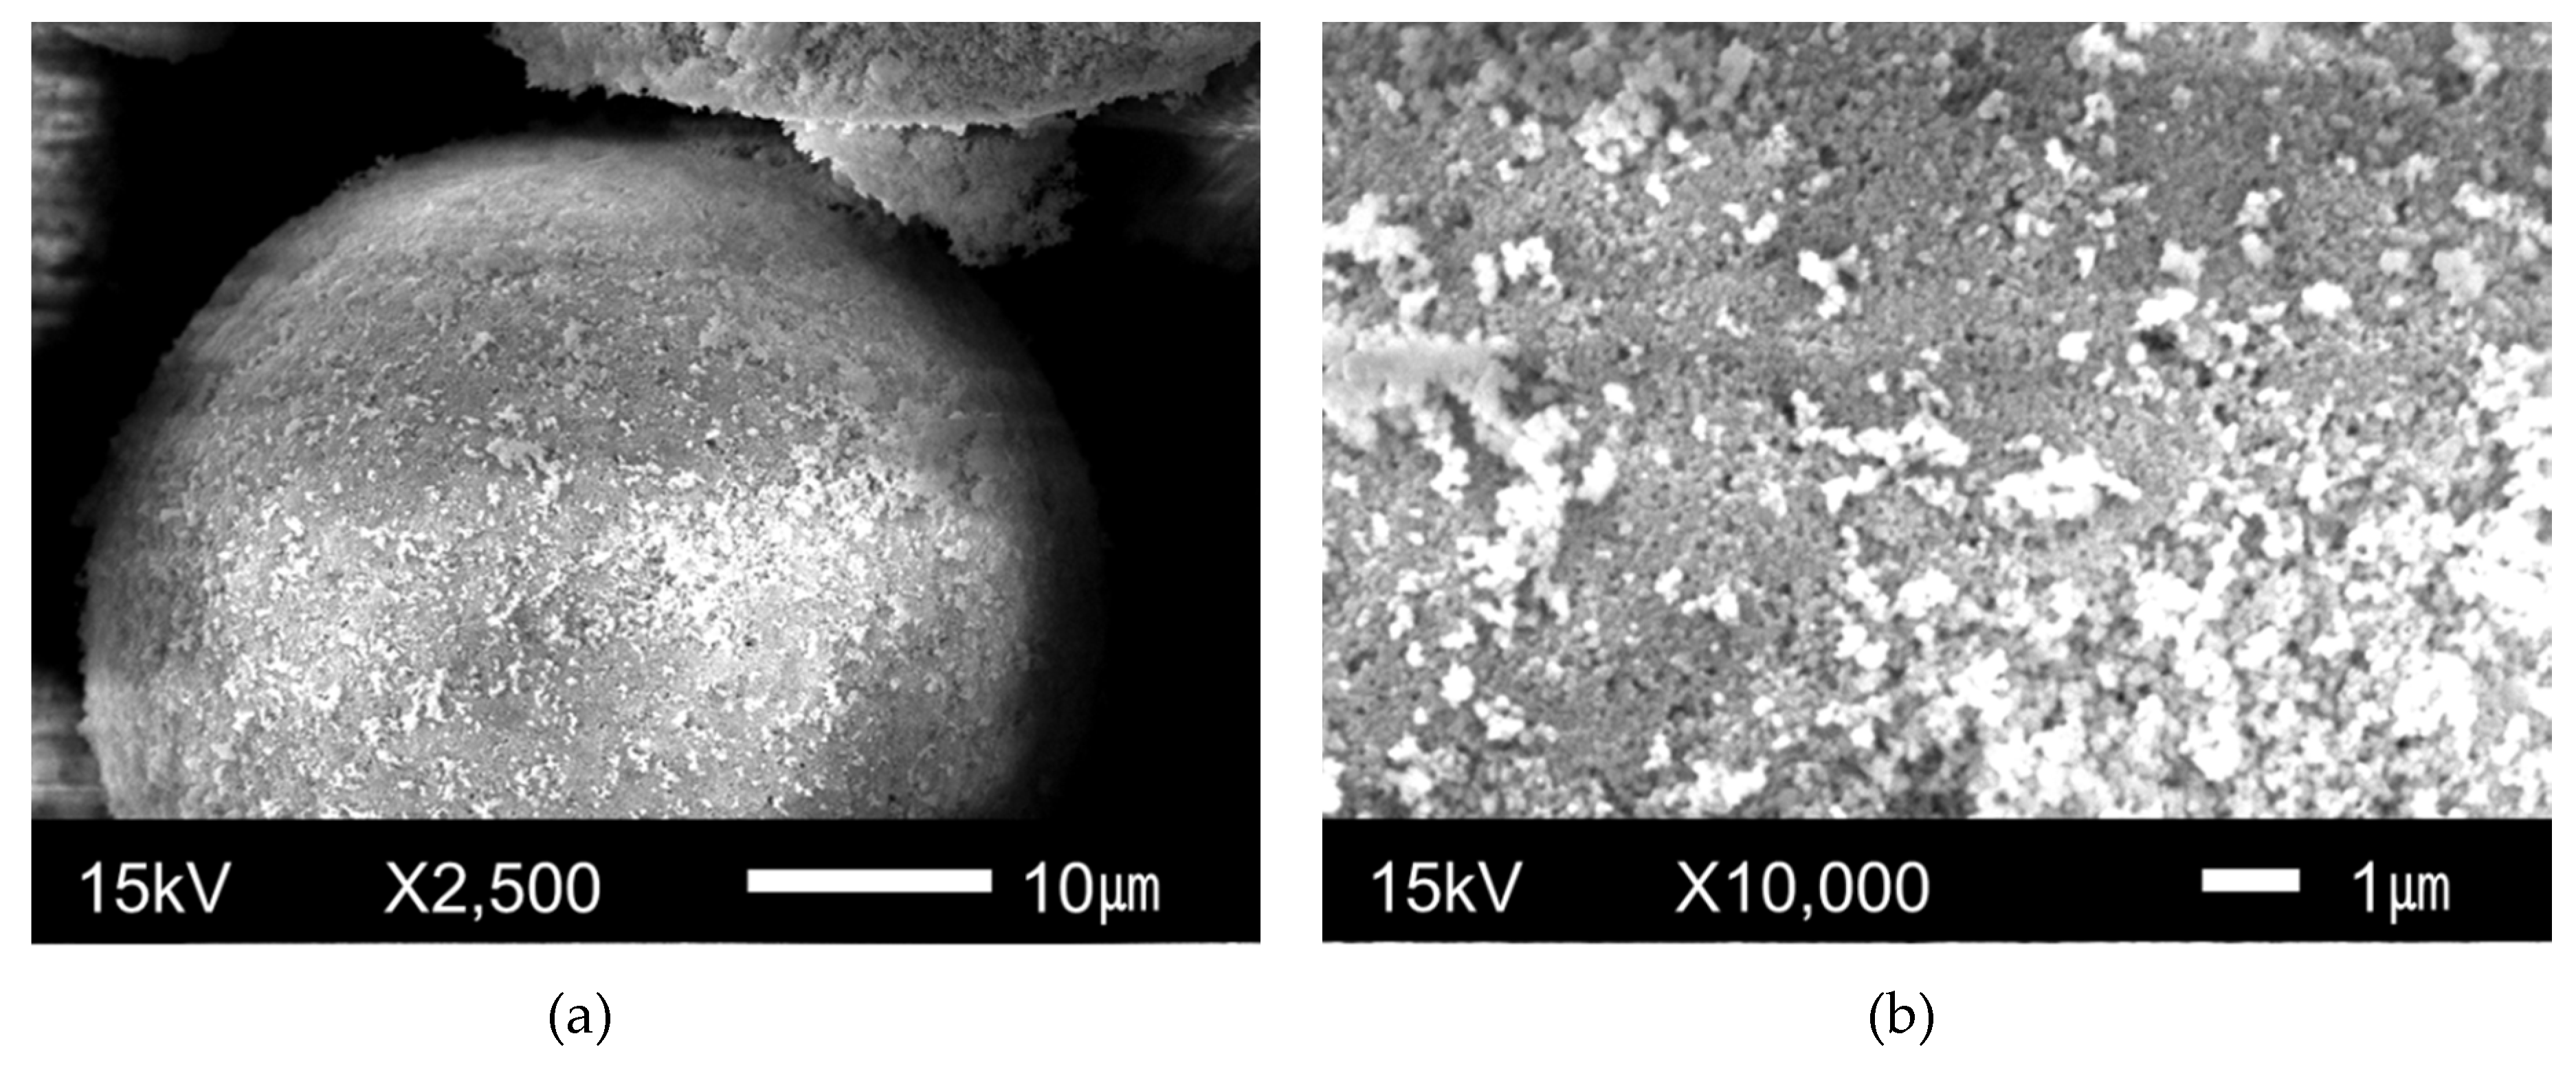
Figure 1 shows the microstructures of YSZ observed by SEM at two different magnifications. The shape of the particles was spherical and the surfaces of the particles were not smooth. The particles appeared to consist of fine particles.
The SEM micrographs at different magnifications of Mg + YSZ + Ni + graphene after grinding in hydrogen atmosphere are shown in
Figure 2. The particle sizes were not homogeneous. The surfaces of the particles were relatively smooth. The particles of this sample were much smaller than those of YSZ. The added YSZ was pulverized during grinding in hydrogen atmosphere. The pulverized YSZ, together with Ni and graphene, is believed to have made the particles of the sample finer.
Figure 3 shows the XRD pattern of Mg + YSZ + Ni + graphene after grinding in hydrogen atmosphere. The background of the XRD pattern was quite high and the peaks in the XRD pattern are slightly broad, showing that the sample was quite noncrystalline. A large quantity of β-MgH
2 with small quantities of Mg, γ-MgH
2, YSZ, Ni, graphene, and MgO was found. The reaction of Mg with H
2 during grinding in hydrogen atmosphere formed β-MgH
2 (a low pressure form of magnesium hydride) and γ-MgH
2 (a high pressure form of magnesium hydride). β-MgH
2 has a tetragonal structure and γ-MgH
2 has an orthorhombic structure of the α-PbO
2 type. γ-MgH
2 usually forms in high hydrogen pressure. The treatment of the sample in air for XRD pattern obtainment is believed to have led to the adsorption of oxygen on the particle surfaces, which are very reactive. This adsorbed oxygen is thought to have reacted with Mg to form MgO. The amount of hydrogen absorbed in the as-prepared Mg + YSZ + Ni + graphene sample was measured after putting the sample into the Sieverts-type hydride formation and decomposition apparatus. The quantity of hydrogen absorbed in this sample was 4.28 wt%.
A sample with a composition of 95 wt% Mg + 5 wt% graphene (designated as Mg + graphene) was prepared under conditions similar to those used for preparing Mg + YSZ + Ni + graphene. A TEM image of the as-prepared Mg + graphene and Raman spectra of graphene and the as-prepared Mg + graphene are shown in
Figure 4. Raman spectrum measurements were carried out with an NTEGRA Raman microscope (NT-MDT Spectrum Instruments, Moscow, Russia) with a laser excitation wavelength of 532 nm. The TEM image of the as-prepared Mg + graphene (
Figure 4a) showed that graphene was partly broken after milling with the pre-milled Mg. The Raman spectrum of the graphene used in the present study showed D, G, and 2D peaks, which are concerned with graphene. The Raman shifts of D, G, and 2D peaks for graphene were 1355, 1584, and 2713 cm
−1, respectively. The ratio of intensities of D and G peaks,
ID/IG, for graphene was 0.846. It was reported by Ferrari et al. [
27] that the shape and intensity of the 2D peak of graphene were very different from those of bulk graphite which consists of two components 2D
1 and 2D
2. Ferrari et al. also reported that the graphene D peak is a single sharp peak, whereas in graphite a band consisting of two peaks D
1 and D
2 [
27] is seen. The Raman spectrum in
Figure 4b shows that the material used in this work was not graphite, but graphene. It was reported that
IG/
I2D is about 0.3 in a single layer, increases linearly until quintuple layers, and is saturated in more than sextuple layers [
28]. The graphene used in the present study (
Figure 4b) had
IG/
I2D of 1.253, showing that the graphene used in this work was multilayer graphene. Hodkiewicz et al. [
29] reported that the D peak is known as the disorder band or the defect band and the intensity of the D peak is directly proportional to the level of defects in the sample. It was reported by Rusi and Majid [
30] that increments of
ID/
IG can be attributed to an increase in defects on the surface of the sample that were produced in the course of synthesis. The ratio of intensities of D and G peaks,
ID/
IG, for the as-prepared Mg + graphene was 1.255. The increase in
ID/
IG after grinding in hydrogen atmosphere of graphene with the pre-milled Mg showed that the number of defects of graphene increased, indicating that graphene was partly broken after grinding in hydrogen atmosphere with the pre-milled Mg.
Figure 5 shows the TEM micrographs at various magnifications and a selected area electron diffraction (SAED) pattern of Mg + YSZ + Ni + graphene after grinding in hydrogen atmosphere. The particles had a large number of defects on the surfaces. The surfaces of the particles were undulated. The particles consisted of fine particles. Particles were covered with carbon layers of graphene. Graphene was observed to be partly broken. The SAED pattern of Mg + YSZ + Ni + graphene after grinding in hydrogen atmosphere exhibited that of a polycrystalline structure and revealed the presence of β-MgH
2 and γ-MgH
2 phases. The interplanar spacings of 0.25, 0.15, and 0.12 nm were for the 101, 310, and 202 planes of β-MgH
2, respectively. The interplanar spacings of 0.21 nm was for the 112 plane of γ-MgH
2.
The amount of hydrogen absorbed by the sample, Ha, and the amount of hydrogen released by the sample, Hd, were both defined using the sample weight as a standard. Ha and Hd were expressed in the unit of wt% H. The initial hydride formation rate (wt% H/min) was calculated by dividing the amount of hydrogen absorbed for 2.5 min by 2.5. The initial hydride decomposition rate (wt% H/min) was calculated by dividing the amount of hydrogen released for 2.5 min by 2.5.
Changes in the
Ha vs. time
t curve in 12 bar H
2 and the
Hd vs.
t curve in 1.0 bar H
2 at 573 K, with the cycle number,
n, for Mg + YSZ + Ni + graphene are presented in
Figure 6. From the first cycle, the initial hydride formation rate was very high and the amount of hydrogen absorbed for 60 min,
Ha (60 min), was very large. As
n increased from one to two, the initial hydride formation rate decreased very slightly and from
n = 2 to
n = 4, the initial hydride formation rate increased very slightly. The initial hydride formation rates at
n = 1–4 were very similar. The
Ha (60 min) decreased from
n = 1 to
n = 4. Mg + YSZ + Ni + graphene absorbed 4.32 wt% H for 10 min and 7.11 wt% H for 60 min at
n = 1 and absorbed 4.39 wt% H for 10 min and 6.12 wt% H for 60 min at
n = 3.
Table 1 shows the variations in
Ha with time
t at 573 K in 12 bar H
2 at
n = 1–4 for Mg + YSZ + Ni + graphene. At
n = 1, the initial hydride decomposition rate was quite high and the amount of hydrogen released for 60 min,
Hd (60 min), was quite large. As
n increased from one to three, the initial hydride decomposition rate increased and the initial hydride decomposition rate decreased from
n = 3 to
n = 4. The
Hd (60 min) decreased from
n = 1 to
n = 4. Mg + YSZ + Ni + graphene released 1.65 wt% H for 10 min and 5.02 wt% H for 60 min at
n = 1 and released 1.99 wt% H for 10 min and 4.74 wt% H for 60 min at
n = 3.
Table 2 shows the variations in
Hd with
t at 573 K in 1.0 bar H
2 at
n = 1–4 for Mg + YSZ + Ni + graphene.
Figure 6 shows that the activation of Mg + YSZ + Ni + graphene was finished at
n = 3. An efficient hydrogen storage capacity was defined as the amount of hydrogen absorbed for 60 min. Mg + YSZ + Ni + graphene had a high, efficient hydrogen storage capacity over 7 wt% (7.11 wt%) at
n = 1.
Variations in the
Ha vs.
t curve in 12 bar H
2 and the
Hd vs.
t curve in 1.0 bar H
2 at
n = 1, with temperature (573 K, 593 K, and 623 K), for Mg + YSZ + Ni + graphene are shown in
Figure 7. The initial hydride formation rates at 573 K and 593 K were quite high. With the increase in temperature from 573 K to 593 K, the initial hydride formation rate increased. As the temperature increased from 593 K to 623 K, the initial hydride formation rate decreased. The main phase of Mg + YSZ + Ni + graphene was Mg. The equilibrium plateau pressures of the MgH
2 system are 1.61 bar, 2.87 bar, and 6.38 bar at 573 K, 593 K, and 623 K, respectively [
31]. The driving force for hydride formation reaction is the gap between the applied hydrogen pressure (12 bar in this work) and the equilibrium plateau pressure. The driving forces for hydride formation reaction at 573 K, 593 K, and 623 K are 10.39 bar, 9.13 bar, and 5.62 bar, respectively. The relatively small driving force for hydride formation reaction at 623 K is believed to have decreased the initial hydride formation rate with the increase in temperature from 593 K to 623 K, probably because the effect of the driving force decrease is larger than that the effect of the temperature increase from 593 K to 623 K.
Ha (60 min) at 573 K was the largest, followed by
Ha (60 min) values at 593 K and 623 K in decreasing order. The initial hydride decomposition rates at 573 K, 593 K, and 623 K were quite high. As the temperature increased from 573 K to 593 K, and then to 623 K, the initial hydride decomposition rate increased. The equilibrium plateau pressures of the MgH
2 system are 1.61 bar, 2.87 bar, and 6.38 bar at 573 K, 593 K, and 623 K, respectively [
31]. The driving force for hydride decomposition reaction is the gap between the equilibrium plateau pressure and the applied hydrogen pressure (1.0 bar in this work). The driving forces for hydride decomposition reaction at 573 K, 593 K, and 623 K are 0.61 bar, 1.87 bar, and 5.38 bar, respectively. The increases in the driving force and the reaction temperature are believed to have increased the initial hydride decomposition rate as the temperature increased from 573 K to 593 K, and then to 623 K.
Hd (60 min) at 593 K was the largest, followed by those at 623 K and 573 K in decreasing order. The smaller
Hd (60 min) at 623 K compared to
Hd (60 min) at 593 K was caused by the smaller
Ha (60 min) at 623 K compared to
Ha (60 min) at 593 K before the measurements for the hydride decomposition reaction.
The microstructures observed by SEM at different magnifications of Mg + YSZ + Ni + graphene dehydrided at the 4th hydride formation–decomposition cycle are presented in
Figure 8. The sample did not have a homogeneous particle size. The particle sizes of this sample were similar to, but very slightly larger than, those of the sample after grinding in hydrogen atmosphere (
Figure 2). Maintenance at a relatively high temperature (593 K) during hydride formation–decomposition cycling is thought to have caused the sintering of particles and led to the very slight increase in the particle sizes.
The XRD pattern of Mg + YSZ + Ni + graphene dehydrided at the 4th hydride formation–decomposition cycle at 593 K is shown in
Figure 9. The sample had a large quantity of Mg and small quantities of MgO and β-MgH
2. Very small amounts of C, Mg
2Ni, and YSZ were also observed. The treatment of the sample in air for XRD pattern obtainment is believed to have led to the adsorption of oxygen on the particle surfaces, which are very reactive. This adsorbed oxygen is thought to have reacted with Mg to form MgO. Graphene was changed to carbon after hydride formation–decomposition cycling. Mg
2Ni is thought to have been formed by the reaction of Mg with Ni. The γ-MgH
2, which was observed after grinding under hydrogen atmosphere, is believed to have been transformed to β-MgH
2 during hydride formation–decomposition cycling. The peaks in the XRD pattern were sharp, and the background of the XRD pattern was very high, showing that the crystallinity of the sample was good. The sample, which was quite noncrystalline after grinding in hydrogen atmosphere, became crystalline.
Mg had large particles that were smooth with a few cracks [
31].
Figure 4 and
Figure 5 show that Mg + YSZ + Ni + graphene after grinding in hydrogen atmosphere had fine particles and defects.
Figure 4 shows that graphene after grinding in hydrogen atmosphere was partly broken. The grinding in hydrogen atmosphere of Mg with graphene, Ni, and YSZ is thought to have pulverized graphene, Ni, and YSZ. The grinding in hydrogen atmosphere of Mg with graphene, Ni, and YSZ is also believed to have produced imperfections on the particle surfaces and inside the particles, exposed the clean surfaces of Mg particles, and made the Mg particles smaller. These effects make easy the nucleation of hydrides for hydride formation reaction and the nucleation of solid solutions of hydrogen with Mg and Mg
2Ni for hydride decomposition reaction, make Mg particles highly reactive, and reduce the distance of hydrogen atom diffusion in Mg particles.
As mentioned above, since oxides are brittle, they can be easily crushed during grinding in mills. The added YSZ and/or their particles crushed during grinding can assist the particles of magnesium and magnesium hydride (MgH2) to become smaller. The addition of YSZ is thus deemed to have increased the initial hydride formation and decomposition rates, Ha (60 min), and Hd (60 min).
Since the thermal conductivity of graphene is relatively high and the specific surface area of graphene is large (2630 m
2/g) [
25], the addition of graphene can make heat to be rapidly transferred and dispersed and the particles to be well separated and isolated. The addition of graphene is thus believed to have increased the initial hydride formation and decomposition rates,
Ha (60 min), and
Hd (60 min).
Mg
2Ni is reported to absorb hydrogen more rapidly than Mg, and the hydride of Mg
2Ni, Mg
2NiH
4, is reported to release hydrogen more rapidly than MgH
2 [
6]. It is thought that the formed Mg
2Ni contributed to increasing the hydride formation rate of Mg + YSZ + Ni + graphene. At 573 K in 1.0 bar H
2, the driving forces for the hydride decomposition reaction of Mg and Mg
2Ni, which are related to the gap between the equilibrium plateau pressures and the applied hydrogen pressure (1.0 bar H
2 in this work), are 1.56 bar and 3.14 bar, respectively [
32,
33]. The rapid nucleation of the Mg
2Ni-H solid solution in Mg + YSZ + Ni + graphene due to the relatively large driving force is believed to have led to the high initial hydride decomposition rate of Mg + YSZ + Ni + graphene.
The
Ha vs.
t curves at 573 K in 12 bar H
2 for Mg, Mg + graphene, a sample with a composition of 95 wt% Mg + 2.5 wt% Ni + 2.5 wt% graphene (designated as Mg + Ni + graphene), and Mg + YSZ + Ni + graphene at
n = 1 are shown in
Figure 10. Mg and Mg + Ni + graphene samples were also made in a way similar to Mg + YSZ + Ni + graphene. Mg did not absorb hydrogen. Mg + graphene, Mg + Ni + graphene, and Mg + YSZ + Ni + graphene had much higher initial hydride formation rates and much larger
Ha (60 min) than Mg, indicating that the addition of YSZ, Ni, and/or graphene considerably increased the initial hydride formation rate and
Ha (60 min) of Mg. The initial hydride formation rate of Mg + YSZ + Ni + graphene was very slightly higher than that of Mg + Ni + graphene, and the
Ha (60 min) was very slightly larger than that of Mg + Ni + graphene. The
Ha vs.
t curves of Mg + YSZ + Ni + graphene and Mg + Ni + graphene were very similar. The initial hydride formation rates of Mg + YSZ + Ni + graphene and Mg + Ni + graphene were considerably higher than that of Mg + graphene. The
Ha (60 min) of Mg + YSZ + Ni + graphene and Mg + Ni + graphene were considerably larger than that of Mg + graphene. These results proved that the addition of Ni and/or YSZ to Mg + graphene considerably increased the initial hydride formation rate and
Ha (60 min) of Mg + graphene.
Figure 11 shows the
Hd vs.
t curves at 573 K in 1.0 bar H
2 for Mg, Mg + graphene, Mg + Ni + graphene, and Mg + YSZ + Ni + graphene at
n = 1. Mg did not release hydrogen. Mg + graphene had a slightly higher initial hydride decomposition rate and a slightly larger
Ha (60 min) than Mg, showing that the addition of graphene slightly increased the initial hydride decomposition rate and
Hd (60 min) of Mg. The initial hydride decomposition rate of Mg + graphene was low, and the
Hd (60 min) of Mg + graphene was small. The initial hydride decomposition rate of Mg + YSZ + Ni + graphene was higher than that of Mg + Ni + graphene, and the
Hd (60 min) of Mg + YSZ + Ni + graphene was larger than that of Mg + Ni + graphene. The initial hydride decomposition rates of Mg + YSZ + Ni + graphene and Mg + Ni + graphene were considerably higher than that of Mg + graphene. The
Hd (60 min) of Mg + YSZ + Ni + graphene and Mg + Ni + graphene were considerably larger than that of Mg + graphene. These results show that the addition of Ni to Mg + graphene considerably increased the initial hydride decomposition rate and
Hd (60 min) of Mg + graphene, and the addition of YSZ to Mg + Ni + graphene considerably increased the initial hydride decomposition rate and
Hd (60 min) of Mg + Ni + graphene.
The microstructures observed by SEM of Mg + graphene, Mg + Ni + graphene, and Mg + YSZ + Ni + graphene after grinding in hydrogen atmosphere are exhibited in
Figure 12. Mg + graphene had relatively large particles, and the particles of Mg + graphene had smooth surfaces with some cracks. The particle sizes of Mg + Ni + graphene and Mg + YSZ + Ni + graphene were not homogeneous, and their large particles had small particles on their surfaces. Mg + YSZ + Ni + graphene had the smallest particles, followed by Mg + Ni + graphene and Mg + graphene in increasing order.
The addition of Ni and Ni + YSZ greatly increased the initial hydride formation rate and
Ha (60 min) of Mg + graphene (
Figure 10). The addition of Ni and Ni + YSZ greatly increased the initial hydride decomposition rate and
Hd (60 min) of Mg + graphene (
Figure 11).
The rapid nucleation of the Mg2Ni-H solid solution in Mg + Ni + graphene and Mg + YSZ + Ni + graphene due to the large driving force is believed to have led to higher initial hydride decomposition rates of Mg + Ni + graphene and Mg + YSZ + Ni + graphene than those of Mg + graphene and Mg. The addition of YSZ also elevated the initial hydride decomposition rate and Hd (60 min) compared to Mg + Ni + graphene.
Mg + YSZ + Ni + graphene had the smallest particles, followed by Mg + Ni + graphene, Mg + graphene, and Mg in increasing order (
Figure 12). The order of particle size agreed well with those of the initial hydride decomposition rate and
Hd (60 min): Mg + YSZ + Ni + graphene had the highest initial hydride decomposition rate and the largest
Hd (60 min), followed by Mg + Ni + graphene, Mg + graphene, and Mg in decreasing order.
The order of particle size also agreed well with those of the initial hydride formation rate and Ha (60 min): Mg + YSZ + Ni + graphene had the highest initial hydride formation rate and the largest Ha (60 min), followed by Mg + Ni + graphene, Mg + graphene, and Mg in decreasing order. The initial hydride formation rates and Ha (60 min) of Mg + YSZ + Ni + graphene and Mg + Ni + graphene were very similar. It is believed that in 12 bar H2 which exerts a large driving force for hydride formation reaction at 573 K, Mg + YSZ + Ni + graphene and Mg + Ni + graphene had high nucleation rates, which led to similar high initial hydride formation rates and similar large Ha (60 min) values.
Mg + YSZ + Ni + graphene had a high, efficient hydrogen storage capacity over 7 wt% (7.11 wt%) at
n = 1. At
n = 1 and after activation (
n = 3), Mg + YSZ + Ni + graphene had relatively high initial hydride formation and decomposition rates. At 573 K and
n = 3, Mg + YSZ + Ni + graphene had an initial hydride formation rate of 1.76 wt% H/min in 12 bar H
2 and an initial hydride decomposition rate of 0.22 wt% H/min in 1.0 bar H
2.
Figure 6 shows that, however, Mg + YSZ + Ni + graphene had a relatively poor cycling performance. A study on the improvement of the cycling performance of Mg + YSZ + Ni + graphene will be done in the future.


