Article

Simultaneous Increase of Electrical Conductivity and Hardness of Al–1.5 wt.% Mn Alloy by Addition of 1.5 wt.% Cu and 0.5 wt.% Zr

1
Department of Metal Forming, National University of Science and Technology MISiS, 4 Leninsky pr., 119049 Moscow, Russia
2
Laboratory of Physic and Chemistry of Barothermic Processes, Baikov Institute of Metallurgy and Materials Science, 49 Leninsky pr., 119991 Moscow, Russia
*
Author to whom correspondence should be addressed.
Metals 2019, 9(12), 1246; https://doi.org/10.3390/met9121246
Submission received: 26 October 2019 / Revised: 17 November 2019 / Accepted: 19 November 2019 / Published: 21 November 2019
(This article belongs to the Special Issue Aluminum Alloys and Aluminum Matrix Composites)

Abstract

:
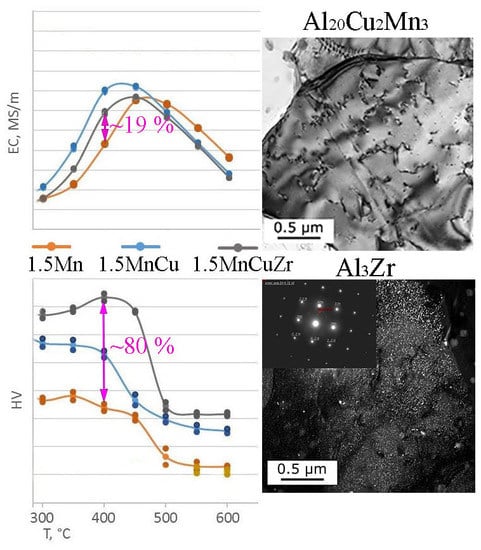
The effect of Cu and Zr additions and annealing temperature on electrical conductivity and hardness of the Al–1.5 wt.% Mn alloy in the form of as-cast ingots and cold rolled sheets has been investigated. It is shown that due to the formation of low alloyed aluminum solid solution and Al20Cu2Mn3 and Al3Zr (L12) phase nanoparticles, the 1.5MnCuZr alloy is superior to the base 1.5Mn alloy both in the hardness (up to two times) and electrical conductivity (up to 30%) after metal processing and annealing. A new alloy can be considered as a replacement for existing 6201 type conductive alloys.

Graphical Abstract

1. Introduction

Wrought AA3003 type aluminum alloys containing 1%–1.5% Mn are characterized by high manufacturability (in particular, in the manufacture of sheet metal) and good corrosion resistance [1,2,3,4]. Due to the manganese addition their strength is higher in comparison with unalloyed aluminum (1xxx series). On the other hand, manganese dissolved in aluminum solid solution (referred to as (Al)) significantly reduces their electrical conductivity (EC) [5,6,7]. Annealing of aluminum–manganese alloys leads to the precipitation of Al6Mn dispersoids from (Al) and, as a result, a decrease in the concentration of Mn in (Al). This process significantly increases the EC, but it still remains too low. Therefore, alloys of the 3xxx series are not considered as conductive, although the presence of submicron size dispersoids significantly increases the recrystallization temperature and therefore the permissible operating temperatures [8,9,10,11] compared to unalloyed aluminum. It should be noted that the interest to heat-resistant conductor alloys has increased significantly in recent years [12,13,14,15]. Their production is a difficult task since it requires the achievement of difficultly combinable properties (electrical conductivity, strength, heat resistance and high manufacturability). Alloys with the addition of zirconium are the most suitable for solving this problem [16,17,18,19]. This element (usually in an amount of 0.3%–0.4%) is an effective hardener in aluminum alloys due to the formation of Al3Zr (L12) phase secondary precipitates, which are less than 10 nm in diameter [20,21]. These nanoparticles are formed during annealing via decomposition of the supersaturated as-cast (Al). This feature allows for a significant increase in the strength of aluminum alloys by simple annealing (below 450 °C), i.e., without additional heat treatment, including quenching in water. However, the strength of the alloys does not exceed 250 MPa, which is lower than that of the 6xxx alloys that are also used as conductive materials. However, these alloys soften when heated to above 200 °C; therefore, they cannot be considered as heat-resistant. It was shown [22] that for the experimental alloy containing 1.5% Cu, 1.5% Mn and Zr, an ultimate tensile strength (UTS) of about 600 MPa can be obtained in a wire. This result is largely due to the presence of Al20Cu2Mn3 dispersoids in the structure (based on reported models in literatures [23,24], the Al20Cu2Mn3 phase has orthorhombic, Ccmm crystal lattice structure with a = 2.411 nm, b = 1.251 nm and c = 0.771 nm [24]). A more complete decomposition of the aluminum solid solution and the formation of the corresponding Mn and Cu containing nano-sized dispersoids can provide for the creation of conductive alloys with an improved combination of EC, strength and heat resistance.
It is shown earlier [5] that the addition of Cu into the base Al–1% Mn binary alloy can significantly increase the EC. The influence of copper on the electrical conductivity is highly dependent on the annealing mode, which can be explained by a complex change in the concentration of Cu and Mn in (Al) during heating. The greatest effect was observed in alloys containing 1%–3% Cu after annealing at 400–450 °C. Such studies were not carried out for wrought semi-finished products. It should be noted that copper at up to ~1.5 wt.% has little effect on the as-cast structure since most of it dissolves in (Al). Therefore, such alloys do not require homogenization since their ductility is high in as-cast state (i.e., they have a high manufacturability during metal forming) [25,26].
Based on the above, the purpose of this work is to study the effect of Cu and Zr additions and annealing temperature on electrical conductivity and hardness of the Al–1.5 wt.% Mn alloy in the form of as-cast ingots and cold rolled sheets.

2. Materials and Methods

The main subjects of the experimental study were 3 Mn-containing alloys: binary (Al–1.5% Mn), ternary (Al–1.5% Mn–1.5% Cu) and quaternary (Al–1.5% Mn–1.5% Cu–0.5%Zr). Al–1.5% Cu binary alloy was also prepared as a reference alloy. All the four alloys (referred to as 1.5MnCu, 1.5MnCuZr, 1.5Mn and 1.5Cu, respectively) were studied in the form of ingots and cold rolled sheets. The melting was carried out in an electric resistance furnace (GRAFICARBO S.r.l., Casalpusterlengo Loc. Zorlesco (LO), Italy) based on high purity aluminum (99.99%) and corresponding master alloys. The casting temperatures were ~750 °C for alloys without Zr and ~900 °C for the 1.5MnCuZr alloy. The chemical composition of the experimental alloy, according to spectral analysis (electron microprobe analysis—EMPA, OXFORD Aztec, Oxford Instruments, Oxfordshire, UK), is given in Table 1.
By using laboratory rolls of VEM-3SM (JMO, St. Petersburg, Russia), sheets with a thickness of 2 mm were obtained at room temperature from the ingots (the reduction ratio was 80%). Additionally, to assess the manufacturability and hardening, some of these sheets were rolled to 0.5 mm and 0.1 mm (reduction ratios of 95% and 99%, respectively). Samples cut from the ingots and the sheets were annealed in a stepwise mode in the temperature range from 200 to 600 °C with a step of 50 °C and 3 h exposure at each step (referred to as F200–F600 for ingots and CR200–CR600 for cold rolled sheets). The stepwise mode allows us to carry out all studies of the influence of heating temperatures on one sample. This method was both informative and economical for the Al alloys, which hardened due to the nanoparticles of the L12 phase [27]. At each step, the electrical conductivity and hardness (HV) were measured for the ingots and the sheets. EC values were determined by the eddy current method with the help of a VE-26NP eddy structure scope (CJSC Research institute of introscopy SPEKTR, Moscow, Russia), using pure aluminum (99.99%) as a reference for each measurement. Vickers hardness was determined using a DUROLINE MH-6 hardness tester (METKON Instruments Inc., Bursa, Turkey) with a load of 1 kgf and a dwell time of 10 s.
The microstructure was examined with optical microscopy (OM, Olympus GX51, ITX Corporation, Tokyo, Japan), transmission electron microscopy (TEM, JEM-2100, JEOL Ltd., Tokyo, Japan), scanning electron microscopy (SEM, TESCAN VEGA 3, Tescan Orsay Holding, Brno, Czech Republic) and electron microprobe analysis (EMPA, OXFORD Aztec, Oxford Instruments, Oxfordshire, UK).
To calculate the phase composition of alloys (fractions of phases and chemical composition of (Al)), we used Thermo-Calc software (database TTAL5) [28].

3. Results

3.1. Computational and Experimental Analysis of The Evolution of The Microstructure

The results of metallographic analysis showed that the 1.5Mn binary alloy, as expected, has a single-phase structure, i.e., all manganese was dissolved in (Al), which was also confirmed by EMPA data (Table 2). In all the copper containing alloys a small amount of uniformly distributed eutectic inclusions of the Al2Cu phase was revealed (Figure 1a). As follows from Table 2, most of the copper was included in (Al). Segregation of manganese (in Mn-containing alloys) is insignificant (Figure 1b) and the concentration of copper (in Cu-containing alloys) is slightly higher at the boundaries of the dendritic cells (Figure 1c). Most of the zirconium in the 1.5MnCuZr alloy, as follows from the EMPA results (Table 2), is dissolved in (Al). Only a few primary crystals of the Al3Zr phase were found (Figure 1d).
In general, the as-cast structure of the ternary and quaternary alloys is characterized by a small number of eutectic inclusions of the Al2Cu phase. This type of structure suggests a high deformation plasticity of the alloys [29,30]. Cold rolling of the ingots (to 0.1 mm thickness) confirmed this assumption. On the other hand, the high concentration of manganese in (Al) determined the low electrical conductivity of all the Mn-containing alloys (Table 2), which had significantly lower EC than the reference 1.5 Cu alloy and pure aluminum (37.8 MS/m). It should be noted that the effect of manganese on electrical conductivity was incomparably higher than that for the copper. Dissolution of zirconium in the aluminum solid solution (Al) (Figure 1d) led to an additional relatively weak decrease in electrical conductivity (Table 2). A quantitative analysis of the contribution of each element to electrical conductivity would be discussed in the next section.
Electrical conductivity is known to be one of the most sensitive characteristics to the composition of (Al) [31]. For a preliminary assessment of the structural changes occurring during annealing in the Mn-containing alloys, the equilibrium phase composition was calculated at temperatures of 200–600 °C (Table 3). According to the calculation, the main difference between them is that manganese must precipitate from (Al) in the binary alloy in the form of Al6Mn dispersoids while in the ternary and quaternary alloys it will precipitate in the form of Al20Cu2Mn3 phase. With increasing temperature, the equilibrium concentrations of Mn, Cu and Zr in (Al) increase, and the number of phases containing these elements decreases. Since the cast structure is characterized by strongly supersaturated (Al) (i.e., it is non-equilibrium), its change during annealing was assumed to be rather complicated (mainly for the 1.5MnCu and 1.5MnCuZr alloys). This is due to various processes: the decomposition of supersaturated (Al) with the formation of dispersoids, the dissolution of eutectic inclusions of the Al2Cu phase, and a decrease in microdritic segregation. Since all the manganese in the as-cast state is dissolved in (Al), the following phases should form as dispersoids: Al6Mn (in the 1.5Mn alloy) and Al20Cu2Mn3 (in the 1.5MnCuZr and 1.5MnCuZr alloys, respectively) [23]. In contrast, the concentrations of manganese and copper in (Al), as well as that of Zr in the 1.5MnCuZr alloy, should increase with increasing temperature [22,27]. However, since the concentration of these elements in (Al) in the as-cast structure was significantly higher than that in the equilibrium state, the approximation to the calculated values was only possible at temperatures for which the diffusion of alloying elements was sufficiently high.

3.2. Hardness and Electrical Conductivity Analysis

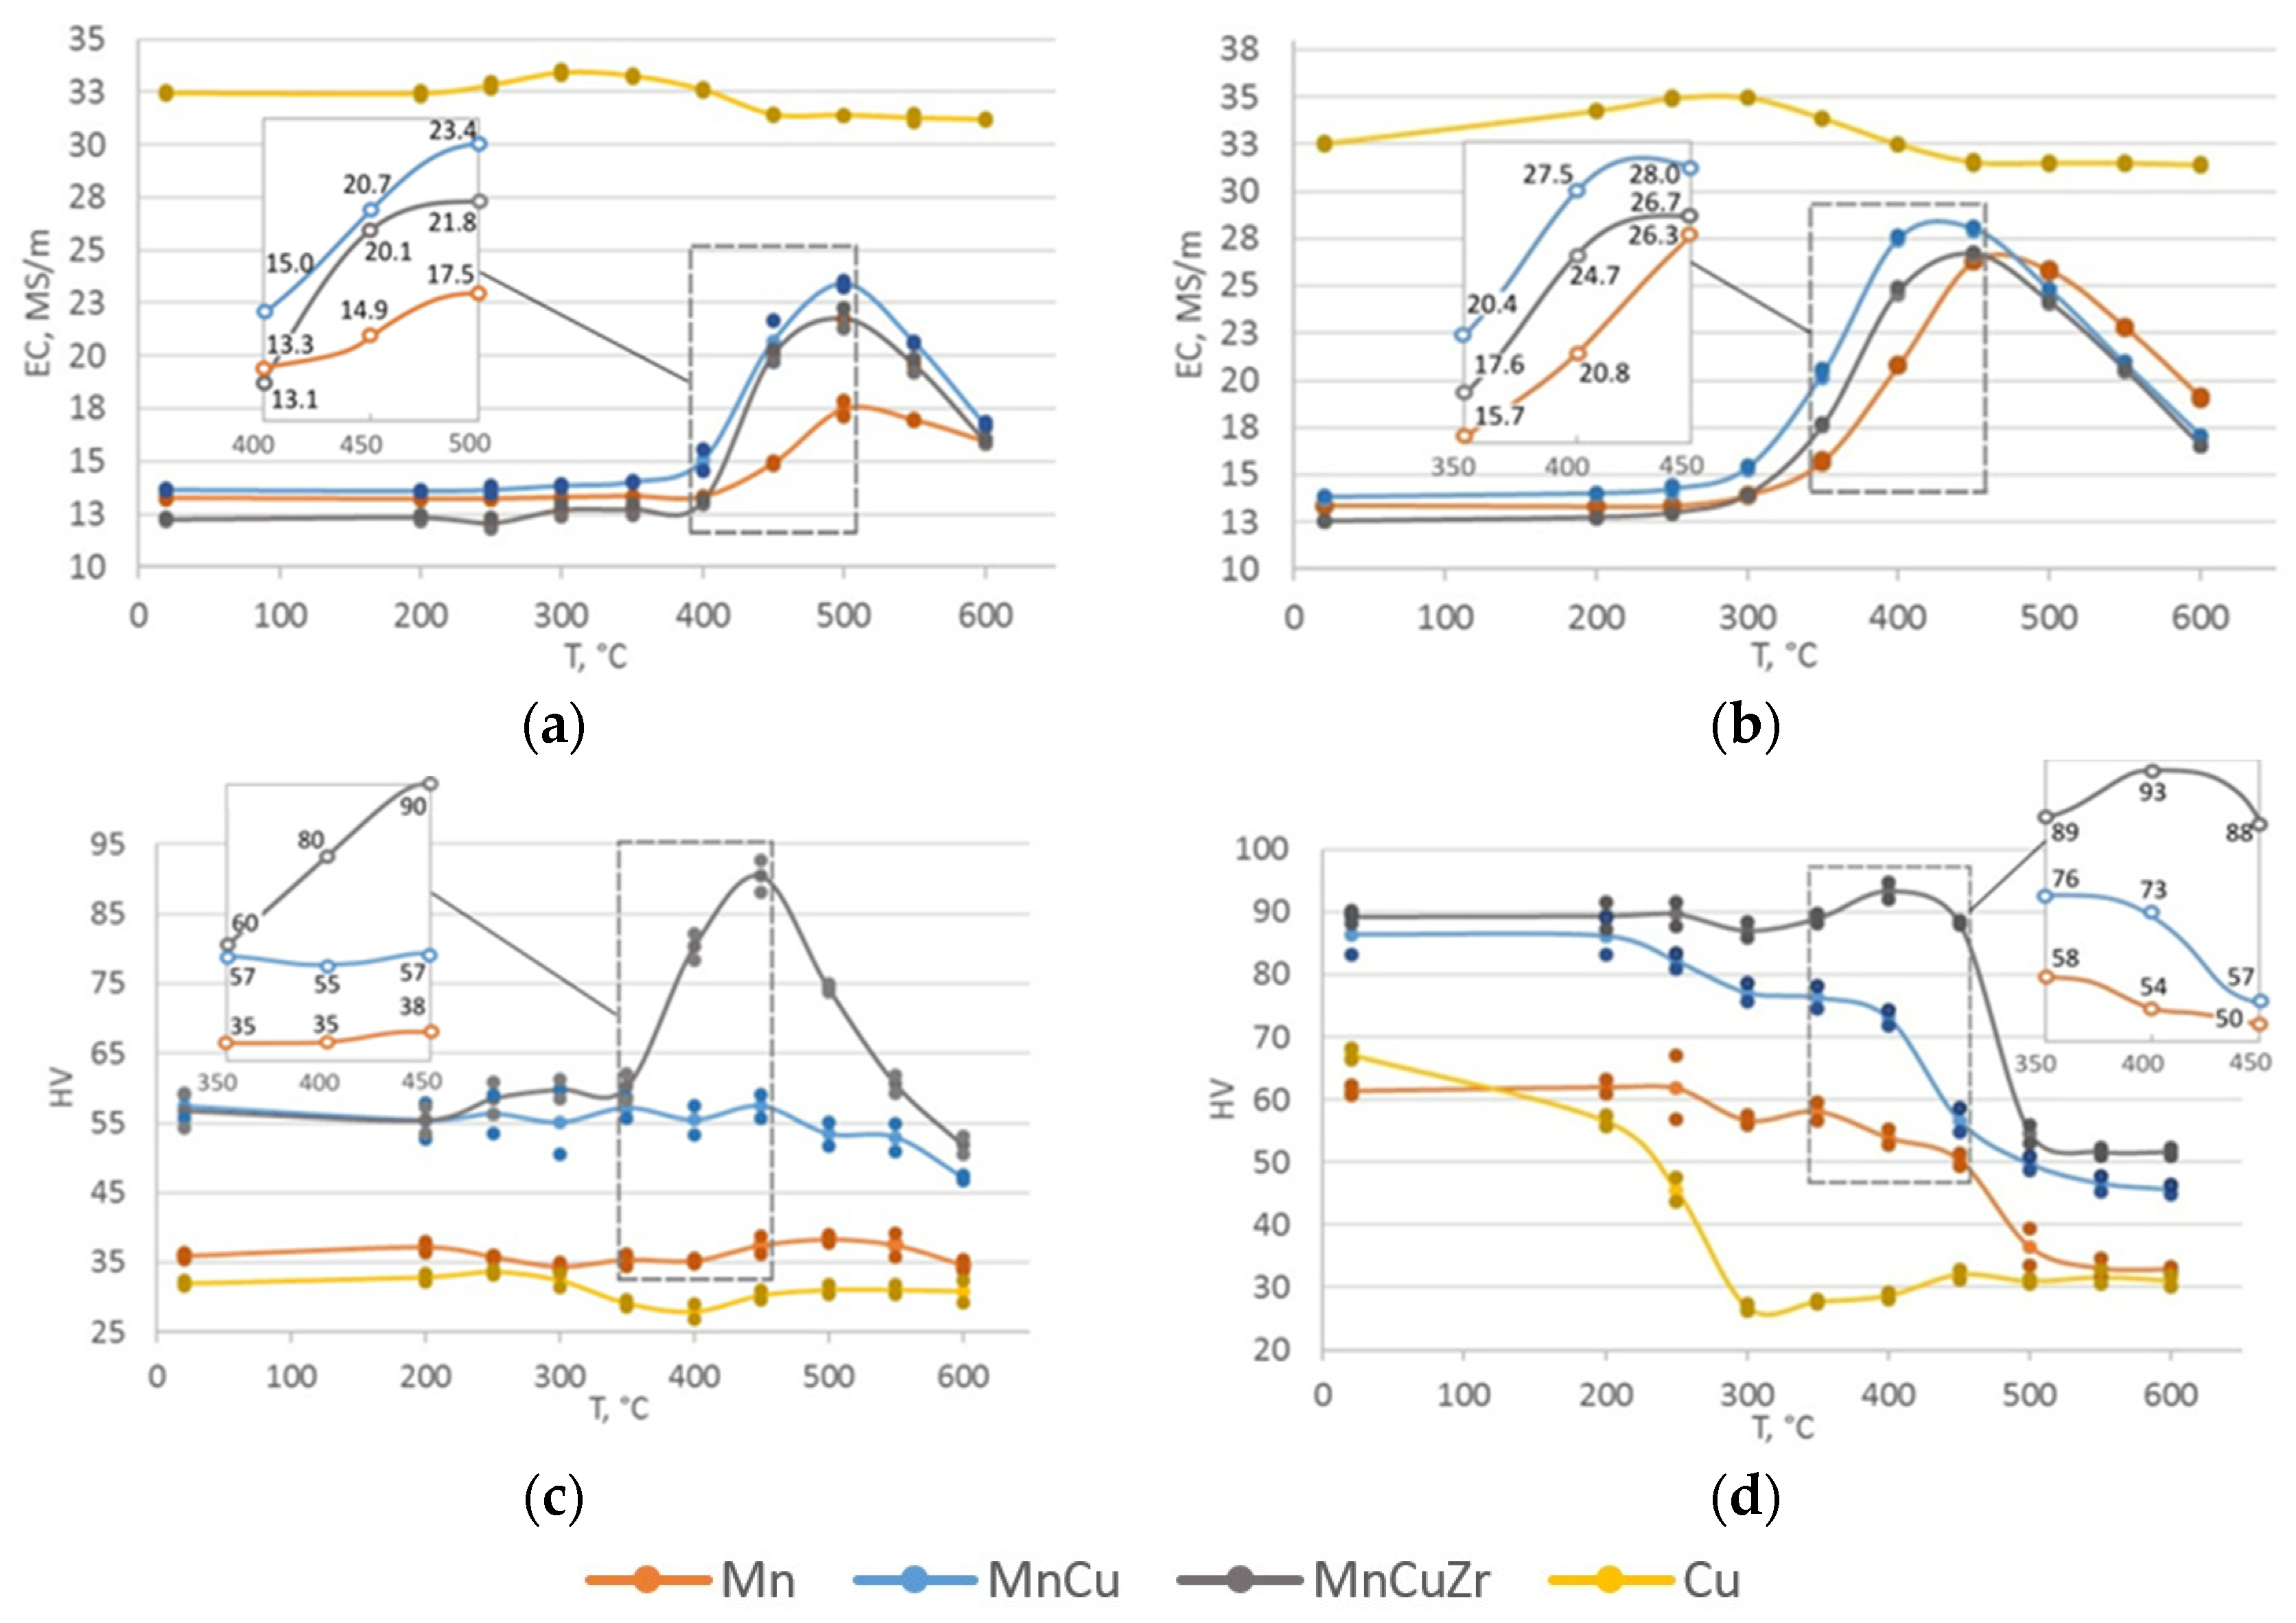
As can be seen from Figure 2a,b, in the initial state when (Al) was highly alloyed (Table 2), the ingots and the cold-rolled sheets of Mn-containing alloys differed but slightly in the EC. As can be seen, cold rolling had almost no effect on EC. Taking into account that the electric conductivities for both cast and annealed at 200 °C ingots were equal, the possibility of natural aging for these alloys could be completely excluded (Figure 2a). During annealing at up to 300 °C, the situation remained almost unchanged, which means a slight decomposition of (Al). However, a further increase in temperature led to significant differences. In particular, a significantly sharper increase in the EC of the 1.5MnCu and 1.5MnCuZr alloys was observed. For the ingots, the maximum difference was reached at 500 °C (state F500) while for the sheets it was at 400 °C (state CR400). It should be noted that the maximum values of SEC for the sheets were noticeably higher than those for the ingots. This can be explained by the effect of plastic deformation (i.e., a high dislocation density) leading to a higher decomposition rate of (Al). During a further increase in the annealing temperature, the difference in EC decreased. The electrical conductivity of 1.5Cu reference alloy changed but slightly.
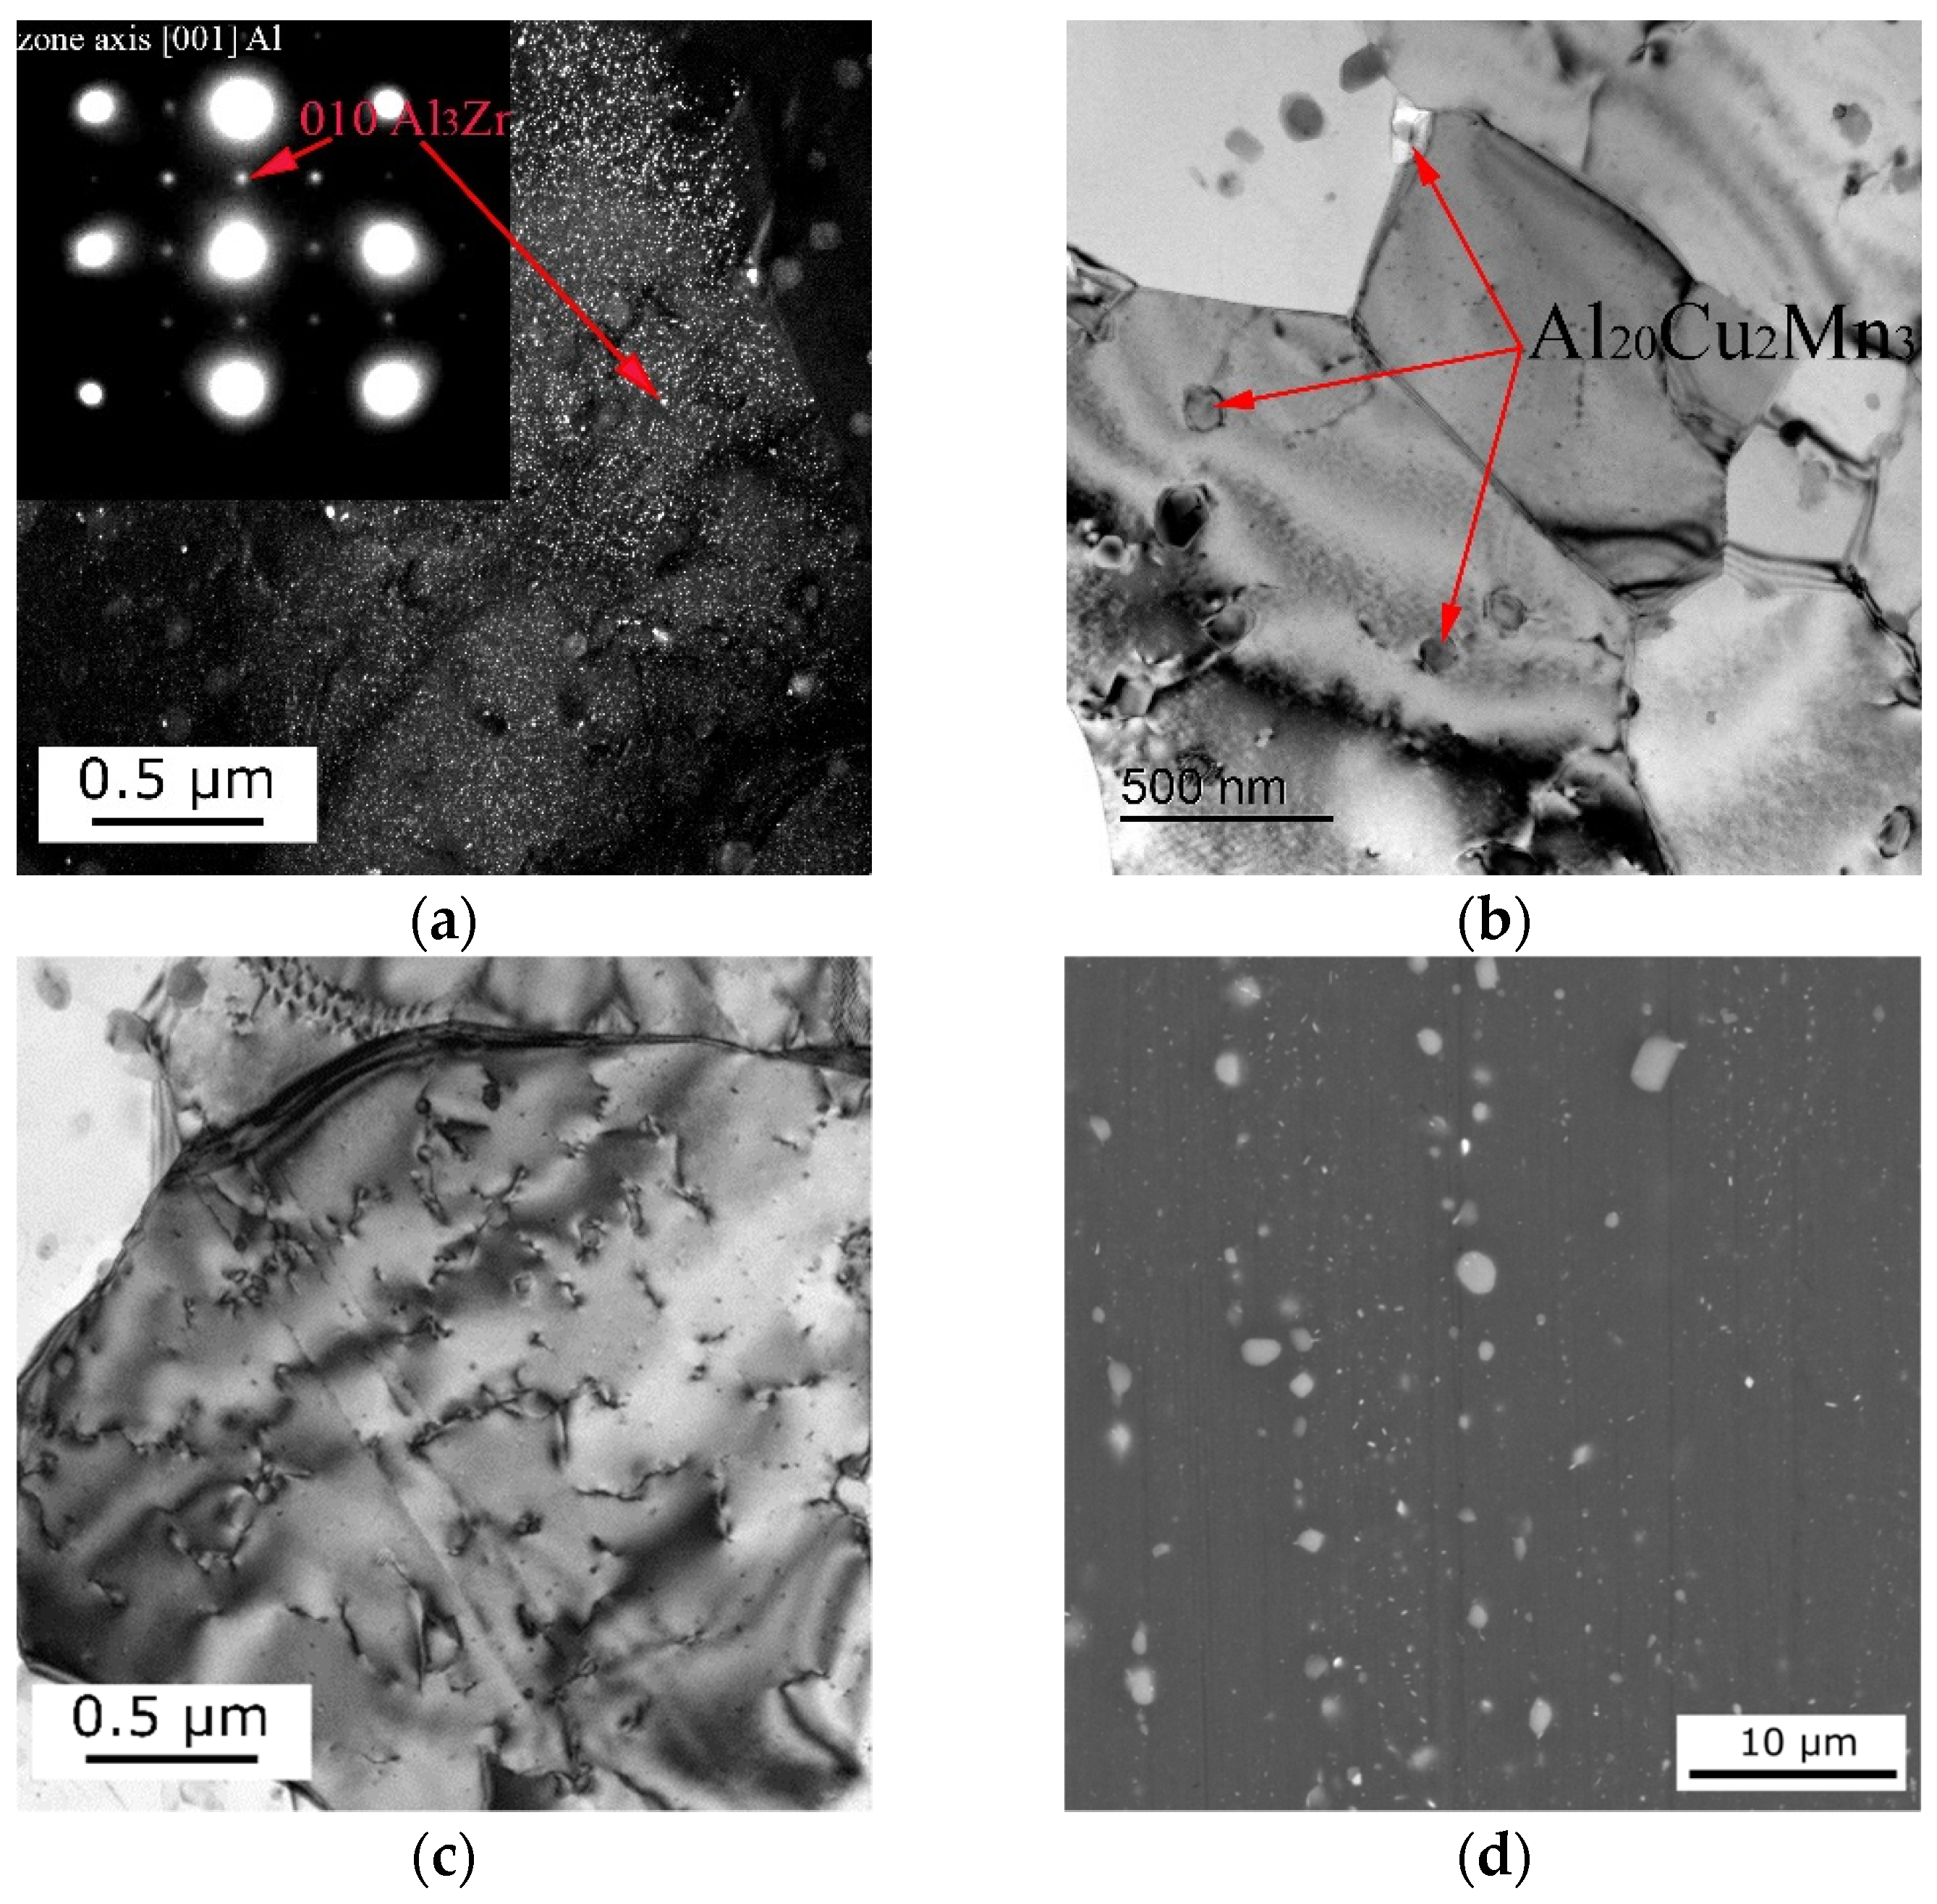
The temperature dependences of the hardness of the ingots shown in Figure 2c demonstrate the strengthening effect of the zirconium addition after annealing at 400–500 °C. The hardness of the 1.5MnCuZr alloy in the F450 state was more than two times that of the binary alloys. Cold rolling led to approximately the same strain hardening of the alloys (about 30 HV), i.e., the difference between them remained the same as in the as-cast state (Figure 2d). The most significant difference is observed between the alloys after annealing at 300–450 °C. The hardness of the 1.5Cu reference alloy decreased after heating to above 250 °C and at 300 °C it was only 30 HV. The presence of dispersoids in the other alloys substantially increased the softening threshold. As in the case of ingots, the alloy with the addition of zirconium had the highest resistance to softening. In particular, this resistance in the CR400 state of the 1.5MnCuZr alloy was almost two times than that of the 1.5Mn binary alloy. The higher heat resistance of this alloy was accounted for by the presence of dispersoids, which prevent recrystallization [32,33,34]. In particular, dark field TEM Figure 3a shows the presence of a high fraction of nanoscale dispersoids, which, in agreement with the obtained SADP (selected area diffraction pattern), corresponded to the Al3Zr phase with L12 structural type having a characteristic cube-on-cube orientation relationship with the matrix. TEM analysis also revealed the presence of Al20Cu2Mn3 phase dispersoids with a length of 100 nm (Figure 3b). As can be seen from Figure 3c, the observed dispersoids were detected at dislocations and grain boundaries, which confirms their high pinning ability during high-temperature annealing. It should be emphasized that Al3Zr-L12 dispersoids had superior pinning ability, which was well confirmed by the results in Figure 3d. In particular, the hardness of a ternary alloy without zirconium began to gradually decrease starting at an annealing temperature of 250 °C. The observed result was associated with the coarsening of Al20Cu2Mn3 phase dispersoids (Figure 3d), which led to a decrease in the pinning ability, resulting in the development of recrystallization processes. On the other hand, the hardness of the quaternary alloy remained almost unchanged up to an annealing temperature of 450 °C (Figure 2d). This was due to the increased thermal stability of the nanoscale Al3Zr-L12 dispersoids, the volume fraction of which (according to the calculation results) at 0.4 wt.% Zr could reach 0.6%.

4. Discussion

Any alloying of pure metals is known to cause a decrease in the EC. To assess the contribution of various factors to the EC of the studied alloys, the equation below is proposed:
EC = Q(Al)·(EC0–KMn∙CMn–KCu·CCu – KZr∙CZr)·K0,
where EC and EC0—electrical conductivity of alloy and pure aluminum (99.99%) correspondingly, MS/m;
  • Q(Al)—volume fraction of (Al) in alloy;
  • CMn, CCu and CZr—concentrations of Mn, Cu and Zr in (Al) correspondingly, wt.%;
  • KMn, KCu and KZr—coefficients of EC decrease per 1 wt.% of Mn, Cu and Zr in (Al) correspondingly;
  • K0—empirical constant.
The parameters CMn, CCu, CZr and Q(Al) were calculated using Thermo-Calc software. The coefficients KMn and KCu were evaluated by comparing the EC of pure aluminum and the as-cast 1.5Mn and 1.5Cu alloys (Table 2). They were 16.5 and 0.8, respectively. The value of KZr according to [27] was 12.6, and the empirical constant was estimated to be 0.84 by processing of the experimental and calculated data.
Comparison between the experimental (obtained for the sheets) and calculated EC at different temperatures is illustrated with the dependences shown in Figure 4. These dependences show that at high annealing temperatures, starting from 450 °C, there was a good agreement between the calculated and experimental EC for all the Mn-containing alloys. With decreasing temperature, the difference between the calculated and experimental values increased, which could be attributed to insufficient exposure times for achieving the equilibrium composition (Al).
The higher values of electrical conductivity of the 1.5MnCu and 1.5MnCuZr alloys (compared to the base alloy 1.5Mn) after annealing at 350–400 °C could be accounted for by the influence of copper on the increase in the decomposition rate of the (Al) solid solution. Thus, an increase in the holding time during annealing at these temperatures could lead to equalization of EC between the alloys. However, in this case we should expect a stronger softening than for a 3-h exposure. Taking into account that, according to the requirements of IEC 62004: 2007, the maximum heating temperature for heat-resistant wires is 400 °C (AT4), the CR400 mode is the most indicative for comparing the test alloys. In this state, the 1.5MnCuZr alloy was superior to the 1.5Mn alloy both in the hardness (by 80%, see Figure 2d) and in the electrical conductivity (by 19%, see Figure 2b).
In summary, based on the data obtained, we could conclude that the 1.5MnCuZr quaternary model alloy was promising as the basis for the development of conductive alloys with high strength and heat resistance. These alloys could replace existing alloys of the Al–Mg–Si system (type 6201) [35]. Their advantage over the latter alloys was that they did not require homogenization, solution treatment and water quenching, which often leads to instability of properties, as well as their resistance to heating above 200 °C, while the electrical conductivity of both new and 6201 type alloys were at a close level.

5. Conclusions

By using experimental and calculation methods, the effect of copper (1.5 wt.%) and zirconium (0.5 wt.%) additives on the electrical conductivity and hardness of ingots and cold-rolled sheets of model aluminum alloys containing 1.5 wt.% Mn were analyzed.
It was found that the entire amount of manganese, as well as most of copper and zirconium, dissolved in the aluminum solid solution during solidification, which allowed both high alloy processability during cold rolling and the formation of Al20Cu2Mn3 (instead of Al6Mn in base alloy) and Al3Zr dispersoids during annealing.
It is shown that the addition of copper and zirconium after annealing at 400–450 °C of ingots and sheets allowed both to increase the hardness and electrical conductivity in comparison with the base binary alloy. Presumably, this could be associated with the acceleration of the aluminum solution decomposition, which led to a decrease in the concentration of Mn in (Al) and formation of dispersoids with high pinning ability.
A calculation model of the dependence of electrical conductivity as a function of the phase composition was proposed. It is shown that the proposed model was in a good agreement with the experimental values obtained on cold-rolled sheets annealed at temperatures above 450 °C.
Based on the results obtained, the Al–1.5% Mn–1.5% Cu–0.5% Zr model alloy was promising as the basis for the development of high-strength and heat-resistant conductive alloys as an alternative to the existing conductive alloys of the 6xxx series.

Author Contributions

N.B. developed the main idea and methodology of experimental study. T.A. performed thermodynamic calculations using the Thermo-Calc program. N.K. performed SEM and EMPA structural analysis and heat treatment of experimental samples. K.T. measured the hardness and conductivity of the experimental samples. The obtained calculated and experimental results were analyzed by the team of authors.

Funding

This work was financially supported by the Ministry of Education and Science of the Russian Federation (Project No. 11.7172.2017/8.9).

Acknowledgments

The main results were obtained by using the equipment of the Department of metal forming, National University of Science and Technology MISiS, Moscow, Russia.

Conflicts of Interest

The authors declare no conflict of interest.

References

  1. Hatch, J.E. (Ed.) Aluminum: Properties and Physical Metallurgy; ASM International: Materials Park, OH, USA, 1984; pp. 48–64. [Google Scholar]
  2. Zhao, Q.; Zhang, H.; Qiu, F.; Jiang, Q.C. Strain-induced precipitation kinetics during non-isothermal annealing of Al-Mn alloys. J. Alloy Compd. 2018, 735, 2275–2280. [Google Scholar] [CrossRef]
  3. Li, Y.J.; Arnberg, L. Quantitative study on the precipitation behavior of dispersoids in DC-cast AA3003 alloy during heating and homogenization. Acta Mater. 2003, 51, 3415–3428. [Google Scholar] [CrossRef]
  4. Zhen, L.; Zhang, Z.; Chen, X.G. Effect of magnesium on dispersoid strengthening of Al−Mn−Mg−Si (3xxx) alloys. Trans. Nonferrous Met. Soc. China 2016, 26, 2793–2799. [Google Scholar]
  5. Belov, N.A.; Alabin, A.N.; Yakovev, A.A. Influence of copper on the formation of cast microstructure of aluminum alloys containing 1% (wt.) Mn. Tsvetnyye Met. 2014, 7, 66–72. (In Russian) [Google Scholar]
  6. Tadeusz, A.K.; Piwowarska, M.; Uliasz, P. Studies on the process of heat treatment of conductive AlZr alloys obtained in various productive processes. Arch. Metal. Mater. 2011, 56, 687–692. [Google Scholar]
  7. Du, Q.; Poole, W.J.; Wells, M.A.; Parson, N.C. Microstructure evolution during homogenization of Al–Mn–Fe–Si alloys: Modeling and experimental results. Acta Mater. 2013, 61, 4961–4973. [Google Scholar] [CrossRef]
  8. Robson, J.D.; Hill, T.; Kamp, N. The Effect of hot deformation on dispersoid evolution in a model 3xxx alloy. Mater. Sci. Forum 2014, 794, 697–703. [Google Scholar] [CrossRef]
  9. Chen, S.P.; Kuijpers, N.C.W.; van der Zwaag, S. Effect of microsegregation and dislocations on the nucleation kinetics of precipitation in aluminium alloy AA3003. Mater. Sci. Eng. A 2003, 341, 296–306. [Google Scholar] [CrossRef]
  10. Zhen, L.; Zhang, Z.; Chen, X.G. Improvement in the mechanical properties and creep resistance of Al-Mn-Mg 3004 alloy with Sc and Zr addition. Mater. Sci. Eng. A 2018, 729, 196–207. [Google Scholar]
  11. Polmear, I.J. Light Alloys. From Traditional Alloys to Nanocrystals, 4th ed.; Butterworth-Heinemann: Oxford, UK, 2006; pp. 129–130. [Google Scholar]
  12. ASTM B941-16. Standard Specification for Heat Resistant Aluminum-Zirconium Alloy Wire for Electrical Purposes; ASTM International: West Conshohocken, PA, USA, 2016; pp. 1–4. [Google Scholar]
  13. Osuch, P.; Walkowicz, M.; Knych, T.; Dymek, S. Impact of the direct ageing procedure on the age hardening response of Al-Mg-Si 6101 alloy. Materials 2018, 11, 1239. [Google Scholar] [CrossRef]
  14. Cubero-Sesin, J.M.; Arita, M.; Horita, Z. High strength and electrical conductivity of Al-Fe alloys produced by synergistic combination of high-pressure torsion and aging. Adv. Eng. Mater. 2015, 17, 1792–1803. [Google Scholar] [CrossRef]
  15. Mogucheva, A.A.; Zyabkin, D.V.; Kaibyshev, R.O. Effect of annealing on the structure and properties of aluminum alloy Al-8% MM. Met. Sci. Heat Treat. 2012, 53, 450–454. [Google Scholar] [CrossRef]
  16. Standard specification. International Alloy Designations and Chemical Composition Limits for Wrought Aluminum and Wrought Aluminum Alloys; The Aluminum Association Publications: Arlington, VA, USA, 2015; pp. 1–38. [Google Scholar]
  17. Yuan, W.; Liang, Z. Effect of Zr addition on properties of Al-Mg-Si aluminum alloy used for all aluminum alloy conductor. Mater. Des. 2011, 32, 4195–4200. [Google Scholar] [CrossRef]
  18. Orlova, T.S.; Mavlyutov, A.M.; Latynina, T.A.; Ubyivovk, E.V.; Murashkin, M.Y.; Schneider, R.; Gerthsen, D.; Valiev, R.Z. Influence of severe plastic deformation on microstructure strength and electrical conductivity of aged Al-0.4Zr (wt.%) alloy. Rev. Adv. Mater. Sci. 2018, 55, 92–101. [Google Scholar] [CrossRef]
  19. Knipling, K.E.; Karnesky, R.A.; Lee, C.P.; Dunand, D.C.; Seidman, D.N. Precipitation evolution in Al–0.1Sc, Al–0.1Zr and Al–0.1Sc–0.1Zr (at.%) alloys during isochronal aging. Acta Mater. 2010, 58, 5184–5195. [Google Scholar] [CrossRef]
  20. Çadırl, E.; Tecer, H.; Sahin, M.; Yılmaz, E.; Kırındı, T.; Gündüz, M. Effect of heat treatments on the microhardness and tensile strength of Al–0.25 wt.% Zr alloy. J. Alloy Compd. 2015, 632, 229–237. [Google Scholar] [CrossRef]
  21. Lefebvre, W.; Danoix, F.; Hallem, H.; Forbord, B.; Bostel, A.; Marthinsen, K. Precipitation kinetic of Al3(Sc,Zr) dispersoids in aluminium. J. Alloys Compd. 2009, 470, 107–110. [Google Scholar] [CrossRef]
  22. Belov, N.A.; Korotkova, N.O.; Akopyan, T.K.; Pesin, A.M. Phase composition and mechanical properties of Al–1.5%Cu–1.5%Mn–0.35%Zr(Fe,Si) wire alloy. J. Alloys Compd. 2019, 782, 735–746. [Google Scholar] [CrossRef]
  23. Feng, Z.Q.; Yang, Y.Q.; Huang, B.; Li, M.H.; Chen, Y.X.; Ru, J.G. Crystal substructures of the rotation-twinned T (Al20Cu2Mn3) phase in 2024 aluminum alloy. J. Alloys Compd. 2014, 583, 445–451. [Google Scholar] [CrossRef]
  24. Mondolfo, L.F. Aluminum Alloys: Structure and Properties; Butterworths: London, UK, 1976; pp. 255–258. [Google Scholar]
  25. Chen, Z.; Chen, P.; Li, S. Effect of Ce addition on microstructure of Al20Cu2Mn3 twin phase in an Al–Cu–Mn casting alloy. Mater. Sci. Eng. A 2012, 532, 606–609. [Google Scholar] [CrossRef]
  26. Chen, Z.; Pei, C.; Ma, C. Microstructures and mechanical properties of Al-Cu-Mn alloy with La and Sm addition. Rare Metals 2012, 31, 332–335. [Google Scholar] [CrossRef]
  27. Belov, N.A.; Alabin, A.N.; Matveeva, I.A.; Eskin, D.G. Effect of Zr additions and annealing temperature on electrical conductivity and hardness of hot rolled Al sheets. Trans. Nonferrous Met. Soc. China 2015, 25, 2817–2826. [Google Scholar] [CrossRef]
  28. Thermo-Calc Software–Computational Materials Engineering. Available online: http://www.thermocalc.com (accessed on 7 October 2019).
  29. Zhang, Y.; Li, F.; Luo, Z.; Zhao, Y.; Xia, W.; Zhang, W. Effect of applied pressure and ultrasonic vibration on microstructure and microhardness of Al—5.0Cu alloy. Trans. Nonferrous Met. Soc. China 2016, 26, 2296–2303. [Google Scholar] [CrossRef]
  30. Zoeller, T.L.; Sanders, T.H., Jr. The rate of solidification and the effects of local composition on the subsequent nucleation of Al20Cu2Mn3 dispersoid phase in Al-4Cu-0.3Fe-0.4Mn-0.2Si alloys. J. Phys. IV Fr. 2004, 120, 61–68. [Google Scholar]
  31. Valiev, R.Z.; Murashkin, M.Y.; Sabirov, I. A nanostructural design to produce high-strength Al alloys with enhanced electrical conductivity. Scripta Mater. 2014, 76, 13–16. [Google Scholar] [CrossRef]
  32. Vlach, M.; Stulikova, I.; Smola, B.; Kekule, T.; Kudrnova, H.; Kodetova, V.; Ocenasek, V.; Malek, J.; Neubert, V. Annealing effects in hot-deformed Al-Mn-Sc-Zr alloys. Metal. Mater. 2015, 53, 295. [Google Scholar] [CrossRef]
  33. Vlach, M.; Cizeka, J.; Smola, B.; Stulikova, I.; Hruska, P.; Kodetova, V.; Danisa, S.; Tanprayoon, D.; Neubert, V. Influence of dislocations on precipitation processes in hot-extruded Al–Mn–Sc–Zr alloy. Int. J. Mater. Res. 2018, 109, 583. [Google Scholar] [CrossRef]
  34. Vlach, M.; Stulikova, I.; Smola, B.; Piesova, J.; Cisarova, H.; Danis, S.; Plasek, J.; Gemma, R.; Tanprayoon, D.; Neuber, V. Effect of cold rolling on precipitation processes in Al–Mn–Sc–Zr alloy. Mat. Sci. Eng. A 2012, 548, 27–32. [Google Scholar] [CrossRef]
  35. Yuan, W.; Liang, Z.; Zhang, C.; Wei, L. Effects of La addition on the mechanical properties and thermal-resistant properties of Al–Mg–Si–Zr alloys based on AA 6201. Mater. Des. 2012, 34, 788–792. [Google Scholar] [CrossRef]
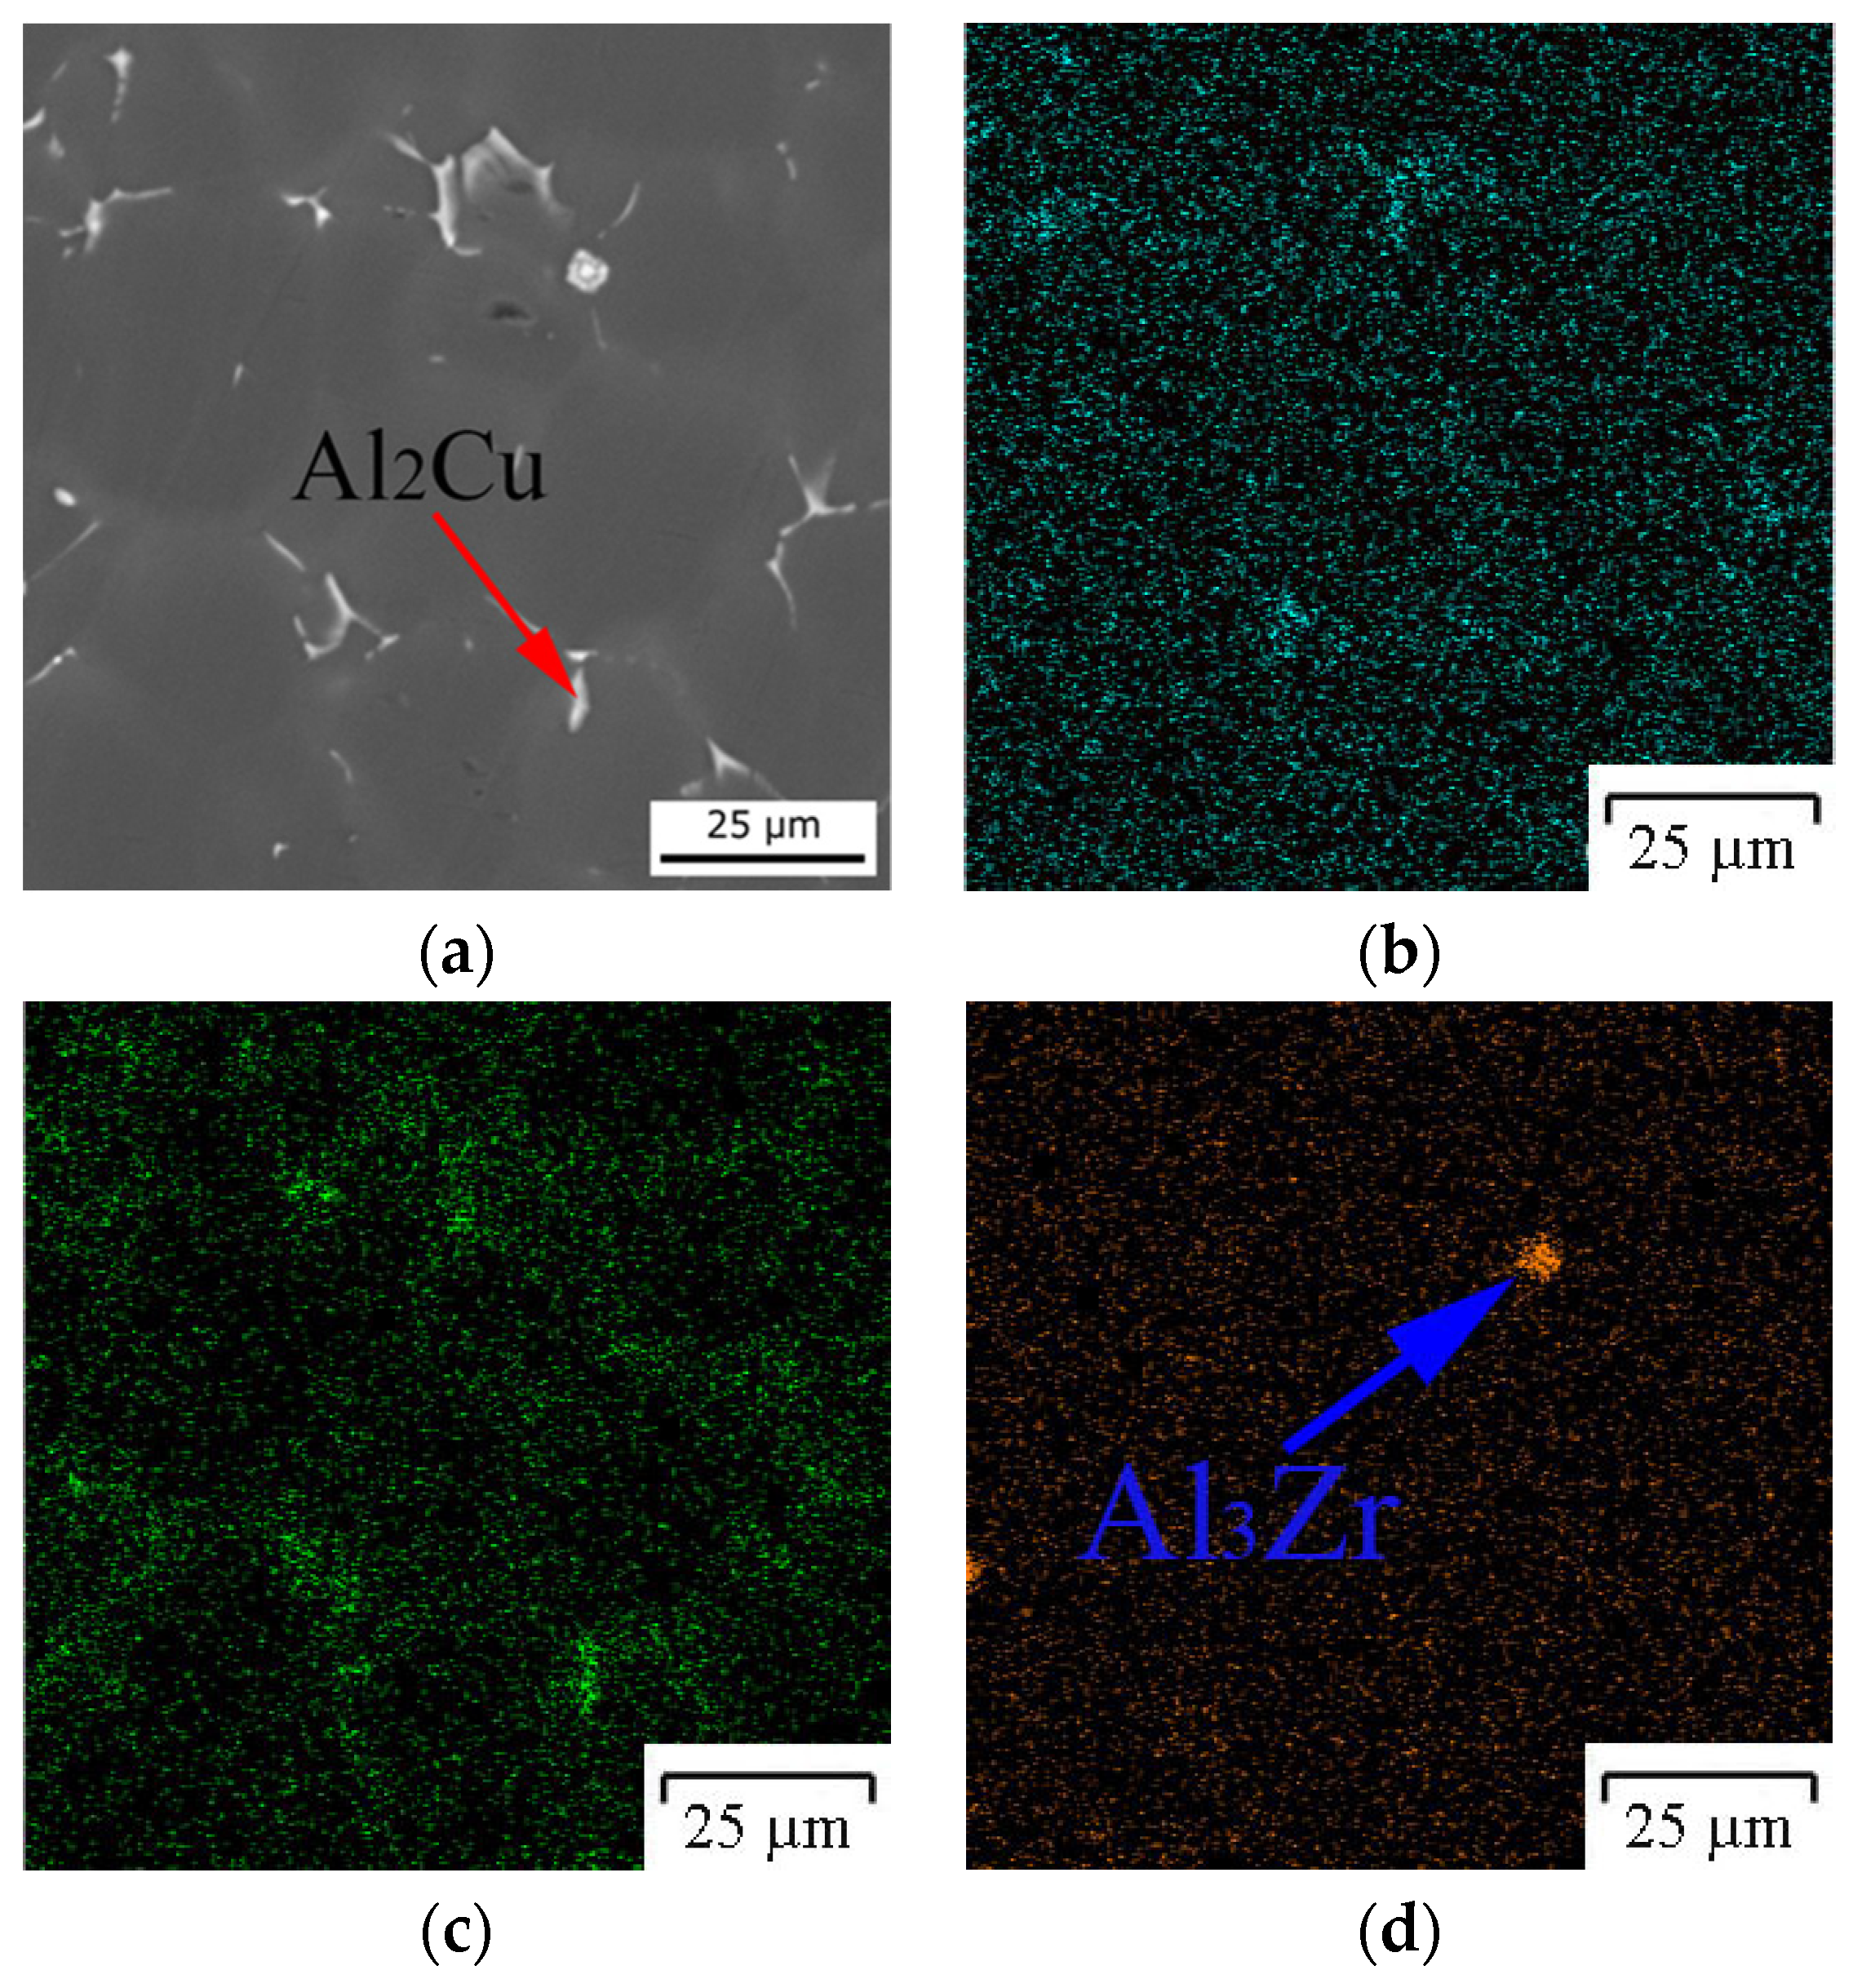
Figure 1. Microstructure (a) of electron microprobe analysis (EMPA) mapping (bd) for alloy1.5MnCuZr, as-cast ingot, (a) SEM for mapping, (b) Mn, (c) Cu and (d) Zr.
Metals 09 01246 g001
Figure 2. Electrical conductivity (a,b) and hardness (c,d) and vs. temperature curves for experimental alloys: (a,c) ingots and (b,d) cold rolled sheets. A measurement error for SEC values: ±0.22 MS/m for as-cast samples and ±0.08 MS/m for rolled samples. A measurement error for hardness values: ±2 HV for as-cast and rolled samples.
Metals 09 01246 g002
Figure 3. Dispersoids of Al3Zr (a,c) and Al20Cu2Mn3 (b,c) in cold rolled alloy 1.5MnCuZr after annealing: (ac) at 400 °C (state CR400), TEM and (d) at 600 °C (state CR600), SEM. (a) Dark field and diffraction patterns and (b,c) bright field.
Metals 09 01246 g003
Figure 4. Calculated (according Equation (1)) and experimental values of electrical conductivity for cold rolled sheets of alloys (a) 1.5Mn, (b) 1.5MnCu and (c) 1.5MnCuZr.
Metals 09 01246 g004
Table 1. Chemical compositions of experimental alloys.
Alloy DesignationConcentrations, wt.% (at.)
CuMnFeSiZrAl
1.5Mn-1.57 ± 0.03 (0.78)0.04 ± 0.03 (0.03)0.00 ± 0.02 (0.00)-Balance
1.5Cu1.64 ± 0.05 (0.70)-0.03 ± 0.03 (0.01)0.00 ± 0.02 (0.00)-
1.5MnCu1.61 ± 0.05 (0.70)1.39 ± 0.03 (0.69)0.06 ± 0.03 (0.03)0.00 ± 0.02 (0.00)-
1.5MnCuZr1.61 ± 0.05 (0.70)1.37 ± 0.03 (0.69)0.17 ± 0.03 (0.08)0.00 ± 0.02 (0.00)0.55 ± 0.06 (0.17)
Table 2. Compositions of aluminum solid solution and electrical conductivity (EC) in the as-cast state.
AlloyConcentration in (Al), wt.% (at.)EC, MS/m
MnCuZrFeSi
1.5Mn1.52 ± 0.12 (0.76)--0.04 ± 0.10 (0.02)0.01 ± 0.08 (0.01)13.3
1.5Cu-1.17 ± 0.16 (0.48)-0.03 ± 0.10 (0.02)0.02 ± 0.08 (0.02)32.4
1.5MnCu1.39 ± 0.11 (0.69)1.30 ± 0.16 (0.57)-0.02 ± 0.10 (0.01)0.01 ± 0.08 (0.01)13.7
1.5MnCuZr1.18 ± 0.11 (0.56)1.04 ± 0.16 (0.43)0.39 ± 0.21 (0.11)0.05 ± 0.10 (0.03)0.01 ± 0.08 (0.01)12.2
Table 3. Calculated data on the phase composition of 1.5Mn and 1.5MnCu alloys at various temperatures.
T, °CAlloyThe Fraction of Phases, vol.%Concentrations in (Al), wt.%
Al6MnAl20Cu2Mn3Al2CuMnCu
2000Cu6.19--<0.01-
1.5Cu-7.010.82<0.010.10
2500Cu6.17--<0.01-
1.5Cu-6.990.60<0.010.24
3000Cu6.12--0.02-
1.5Cu-6.960.200.010.47
3500Cu6.01--0.05-
1.5Cu-6.87-0.030.60
4000Cu5.80--0.11-
1.5Cu-6.64-0.070.64
4500Cu5.43--0.21-
1.5Cu-6.19-0.170.71
5000Cu4.83--0.37-
1.5Cu-5.54-0.330.82
5500Cu3.93--0.60-
1.5Cu-4.33-0.560.99
6000Cu2.53--0.93-
1.5Cu-2.78-0.861.22