Article

Effect of the Average Energy on WC Grain Growth of WC-10Co-4Cr Composite by Laser Cladding

by
Enrique A. López-Baltazar
1,2,*,
Haideé Ruiz-Luna
3,
Víctor H. Baltazar-Hernández
2,
José Jorge Ruiz-Mondragón
4,
Juansethi Ibarra-Medina
5,6 and
Juan Manuel Alvarado-Orozco
5
1
CIATEQ, Manufactura Avanzada Sede Aguascalientes, Aguascalientes 20358, Mexico
2
Materials Science and Engineering Program, Universidad Autónoma de Zacatecas, Zacatecas 98000, Mexico
3
CONACYT-Universidad Autónoma de Zacatecas, Zacatecas 98000, Mexico
4
Corporación Mexicana de Investigación en Materiales SA de CV, Coahuila 25290, Mexico
5
Centro de Ingeniería y Desarrollo Industrial, Queretaro 76125, Mexico
6
Dirección de Cátedras-CONACYT, Consejo Nacional de Ciencia y Tecnología (CONACYT), Ciudad de Mexico 03940, Mexico
*
Author to whom correspondence should be addressed.
Metals 2019, 9(12), 1245; https://doi.org/10.3390/met9121245
Submission received: 25 October 2019 / Revised: 16 November 2019 / Accepted: 19 November 2019 / Published: 21 November 2019

Abstract

:
In the present study, the microstructure evolution of WC-10Co-4Cr powder deposited on AISI-SAE 1020 steel substrate by laser cladding was evaluated, considering the effect of average energy per unit area. Single tracks were obtained by employing a Yb: YAG laser system with selected processing parameters. All samples were sectioned in the transverse direction for further characterization of the cladding. Results showed that dilution lay within 15% and 25%, whereas porosity was measured below 12%. According to microstructural analyses, considerable grain growth is developed within the central area of the cladding (namely, the inner region); additionally, the development of a triangular and/or polygonal morphology for WC particles along with a clear reduction in hardness was observed when employing a high average energy. It is worth noting that, in spite of the rapid thermal cycles developed during laser cladding of WC-10Co-4Cr, grain growth is attributed to a coalescence mechanism due to complete merging of WC into larger particles. Finally, the presence of small round or ellipsoidal particles within the inner region of the cladding suggested that non-merged particles occurred due to both an inhomogeneous dispersion and the lack of faced-shaped WC particles.

1. Introduction

WC-10Co-4Cr composite or alloy is widely used for coating applications in aeronautics, mining, construction, and heavy machinery industries [1,2]. In general, WC-Co-Cr based coatings are characterized by having high hardness and high wear, erosion, and corrosion resistance [3,4].
Laser cladding (LC) is an industrial manufacturing process that produces dense, crack-free, and low-porosity coatings with excellent bonding properties [5,6]. It has been established that the key processing parameters in LC are the laser power, the scanning speed, and the powder feeding rate, which strongly influence the geometrical characteristics of LC tracks, including aspects such as dilution, width, and wetting angle [7,8,9]. With the purpose of establishing a relationship among three different processing parameters, that is, laser power, scanning speed and laser spot diameter, the concept of average energy (Ea) [10], also called average energy per unit area [8,10,11], specific energy [12,13,14,15,16], effective energy [13,17,18] and/or energy density [10,19,20,21,22], is frequently used in the literature; thereby, Ea is basically set by adjusting the corresponding parameters.
WC-Co alloys have been commonly deposited utilizing laser cladding [7,8,10,11,23,24,25]. For example, it has been observed that laser power has a predominant effect on the LC WC-12Co alloy coating characteristics. Hence, the clad height, width, and the penetration depth are strongly correlated to laser power; conversely, laser power is not directly related to the wetting angle [8,24].
WC-8Co alloy has been deposited by employing two different protective gases (i.e., Ar and N2); dilution results had almost no effect, whereas porosity and cracks were minimized when using Ar gas shielding [7]. Multilayered LC of WC-12Co alloy was deposited using a pulsed Nd: YAG laser source; it was inferred that a minimum Ea value is required to avoid discontinuous clads and minimize dilution [9,10]. However, so far, nobody has investigated the influence of the Ea on the geometrical characteristics and porosity particularly for WC-10Co-4Cr alloy deposited on low carbon steel substrate by LC.
It is important to mention that the growth of WC particles during LC of WC-Co alloys has been hardly reported in the literature [7,11]. For instance, WC feedstock ranging in size between 1–2 µm was reported to grow by twenty times [11]. In addition, it was stated that growth of WC particles is related to the agglomeration of the original phases [7]. On the other hand, WC-10Co-4Cr alloy has been deposited using a CO2 LC system onto stainless steel substrates; although the macrostructure of the transverse cross-section, porosity content and hardness were reported, the growth of WC particles was not mentioned [23]. It is worth noting that the growth mechanism of the WC particles in WC-Co-Cr coatings during LC deposition, that is, short heating and cooling time, has not been reported so far.
The aim of this work is to evaluate the influence of the average energy per unit area (Ea) on the geometrical characteristics, porosity, microstructure and hardness evolution in Yb: YAG laser cladding of WC-10Co-4Cr alloy deposited on AISI 1020 steel. In particular, this work focused on investigating the effect of Ea on the growth mechanism of the WC particles during rapid thermal cycles.

2. Materials and Methods

A commercial WC-10Co-4Cr powder with a particle size of −45 to +11 μm (Eutectic Castolin, Edo. Mexico, Mexico) was used as feedstock material. A low cost, commercially available, and widely used AISI-SAE 1020 (AHMSA, Monclova, Coahuila, Mexico) steel properly utilized when toughness and hard wearing surface are main requirements, was employed as a substrate having the form of a plate with dimensions of 76 × 25 × 6 mm. A 4kW Yb: YAG laser system Trumpf TruDisk 6002™ (TRUMPF, Queretaro, Mexico) equipped with a powder-feeder and laser workstation was used for single track deposition as shown in Figure 1. A defocused laser beam of 3.8 mm with a pulse duration of 0.014 s and a frequency of 50 Hz were used. Argon was employed as the carrier and shielding gas. Preliminary experiments were carried out in order to determine the final process parameters; these are shown in Table 1.
It is important to recall that the concept of average energy (Ea) involves important processing parameters in the LC technique [10] as indicated below:
E a = E f v D
where E is the laser energy per pulse [J], f is the laser pulse frequency [Hz], v is the scan speed [mm/s], D is the laser spot size [mm], whereby Ef denotes the laser power. It is worth mentioning that Ea engages the effective area irradiated by the laser beam (i.e., laser spot size) and can be set accordingly. Hence, the calculated Ea for the different samples has been primarily focused on the variation of the laser power, as indicated in Table 1.
Single clad tracks were sectioned in the transverse direction and prepared by metallographic techniques. The geometrical features (i.e., penetration depth, height, width, wetting angle), porosity percentage, and particle size (i.e., using Feret diameter technique) were measured in three different samples by image analysis using the software Image-Pro Plus™ (Version 3.0, Media Cybernetic, Saltillo, Coahuila, Mexico). It is worth mentioning that dilution was calculated according to [13]
D % = b h + b
where b is the penetration depth (mm) and h is the height (mm).
The microstructure was characterized using a Mira3 Tescan™ (TESCAN, Saltillo, Coahuila, Mexico) field emission scanning electron microscope equipped with an energy-dispersive X-ray spectrometer (EDS) XFlash Detector 6|60 Bruker™ (Bruker, Saltillo, Coahuila, Mexico). Tracks were analyzed with a D8Advance Bruker™ (Bruker, Zacatecas, Zacatecas, Mexico) by X-ray diffraction (XRD) using diffractometer with Cu-Kα radiation. Microhardness measurements were recorded along the transversal cross-section of the cladded samples using a HVM Shimadzu™ (Shimadzu, Zacatecas, Zacatecas, Mexico) hardness tester with an applied load of 300 g and dwell time of 15 s.

3. Results and Discussion

3.1. Microstructure and Phases

The influence of average energy per unit area (Ea) on both porosity content and dilution are shown in Figure 2. Results reveal an overall porosity content below 12% where the sample porosity is reduced when increasing Ea (Figure 2a); accordingly, the sample with Ea39 showed the lowest porosity content of about 3.8%. It is worth mentioning that the predominant parameter which reduces the generation of pores is the laser power (i.e., logically by increasing Ea), owing to the lower amount of gas trapped within the molten metal and due to a longer solidification time [26,27].
On the contrary, dilution increases with increasing Ea (Figure 2b); for example, it was 15%, 23% and 25% for Ea24, Ea32 and Ea39, respectively. It has been established that an acceptable range for dilution in WC-Co is within 10–45% for a single clad track [8,26]; accordingly, acceptable values for dilution are obtained in this work.
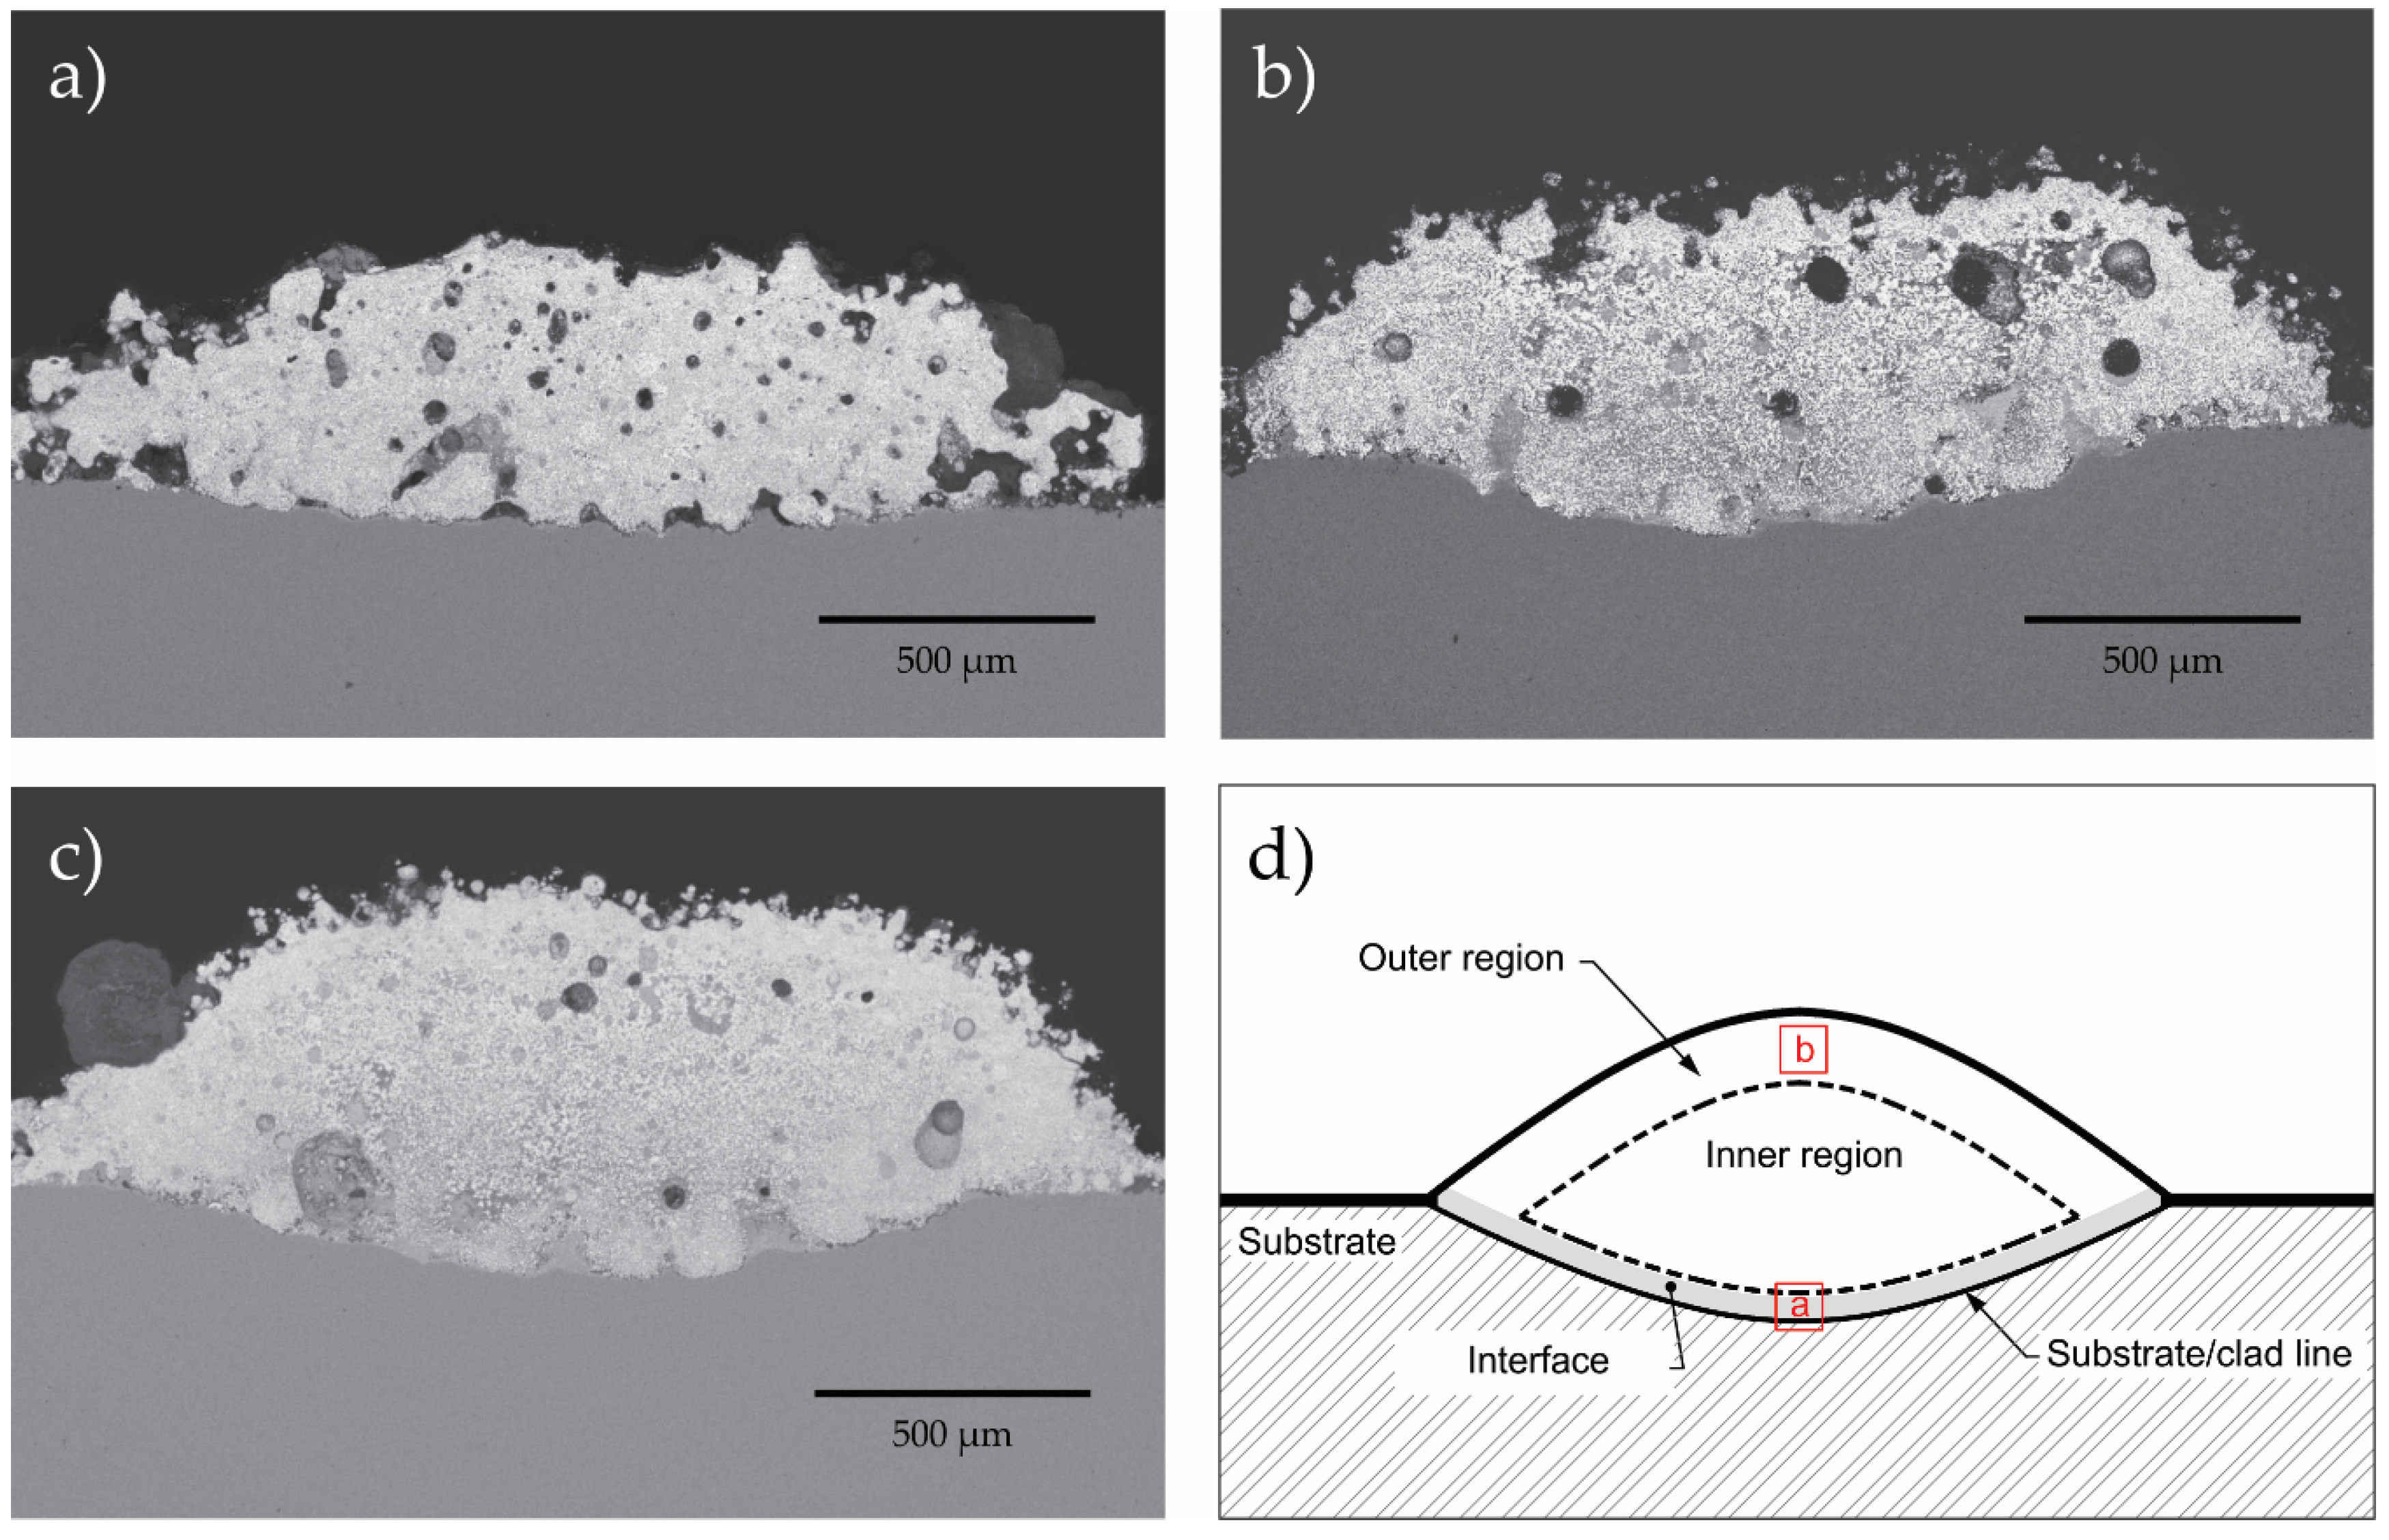
Figure 3 shows the transverse cross-section micrographs of the single clad track samples for (a) Ea24, (b) Ea32, and (c) Ea39. Results show that the single clad width with dimensions ranging from 2.0 to 2.3 mm is consistently observed in all samples.
According to the abovementioned results, the cladding characteristics encountered here (i.e., porosity, dilution, and width) are an indication of a highly dense and well-bonded clad tracks [28] without any presence of cracks.
The transverse cross-section of a single clad has been analyzed in three different regions, namely, interface (next to the substrate/clad line), outer region, and inner region, as schematically illustrated in Figure 3d. Detailed analysis of the resultant microstructure for each of the abovementioned regions is discussed in the following paragraphs.
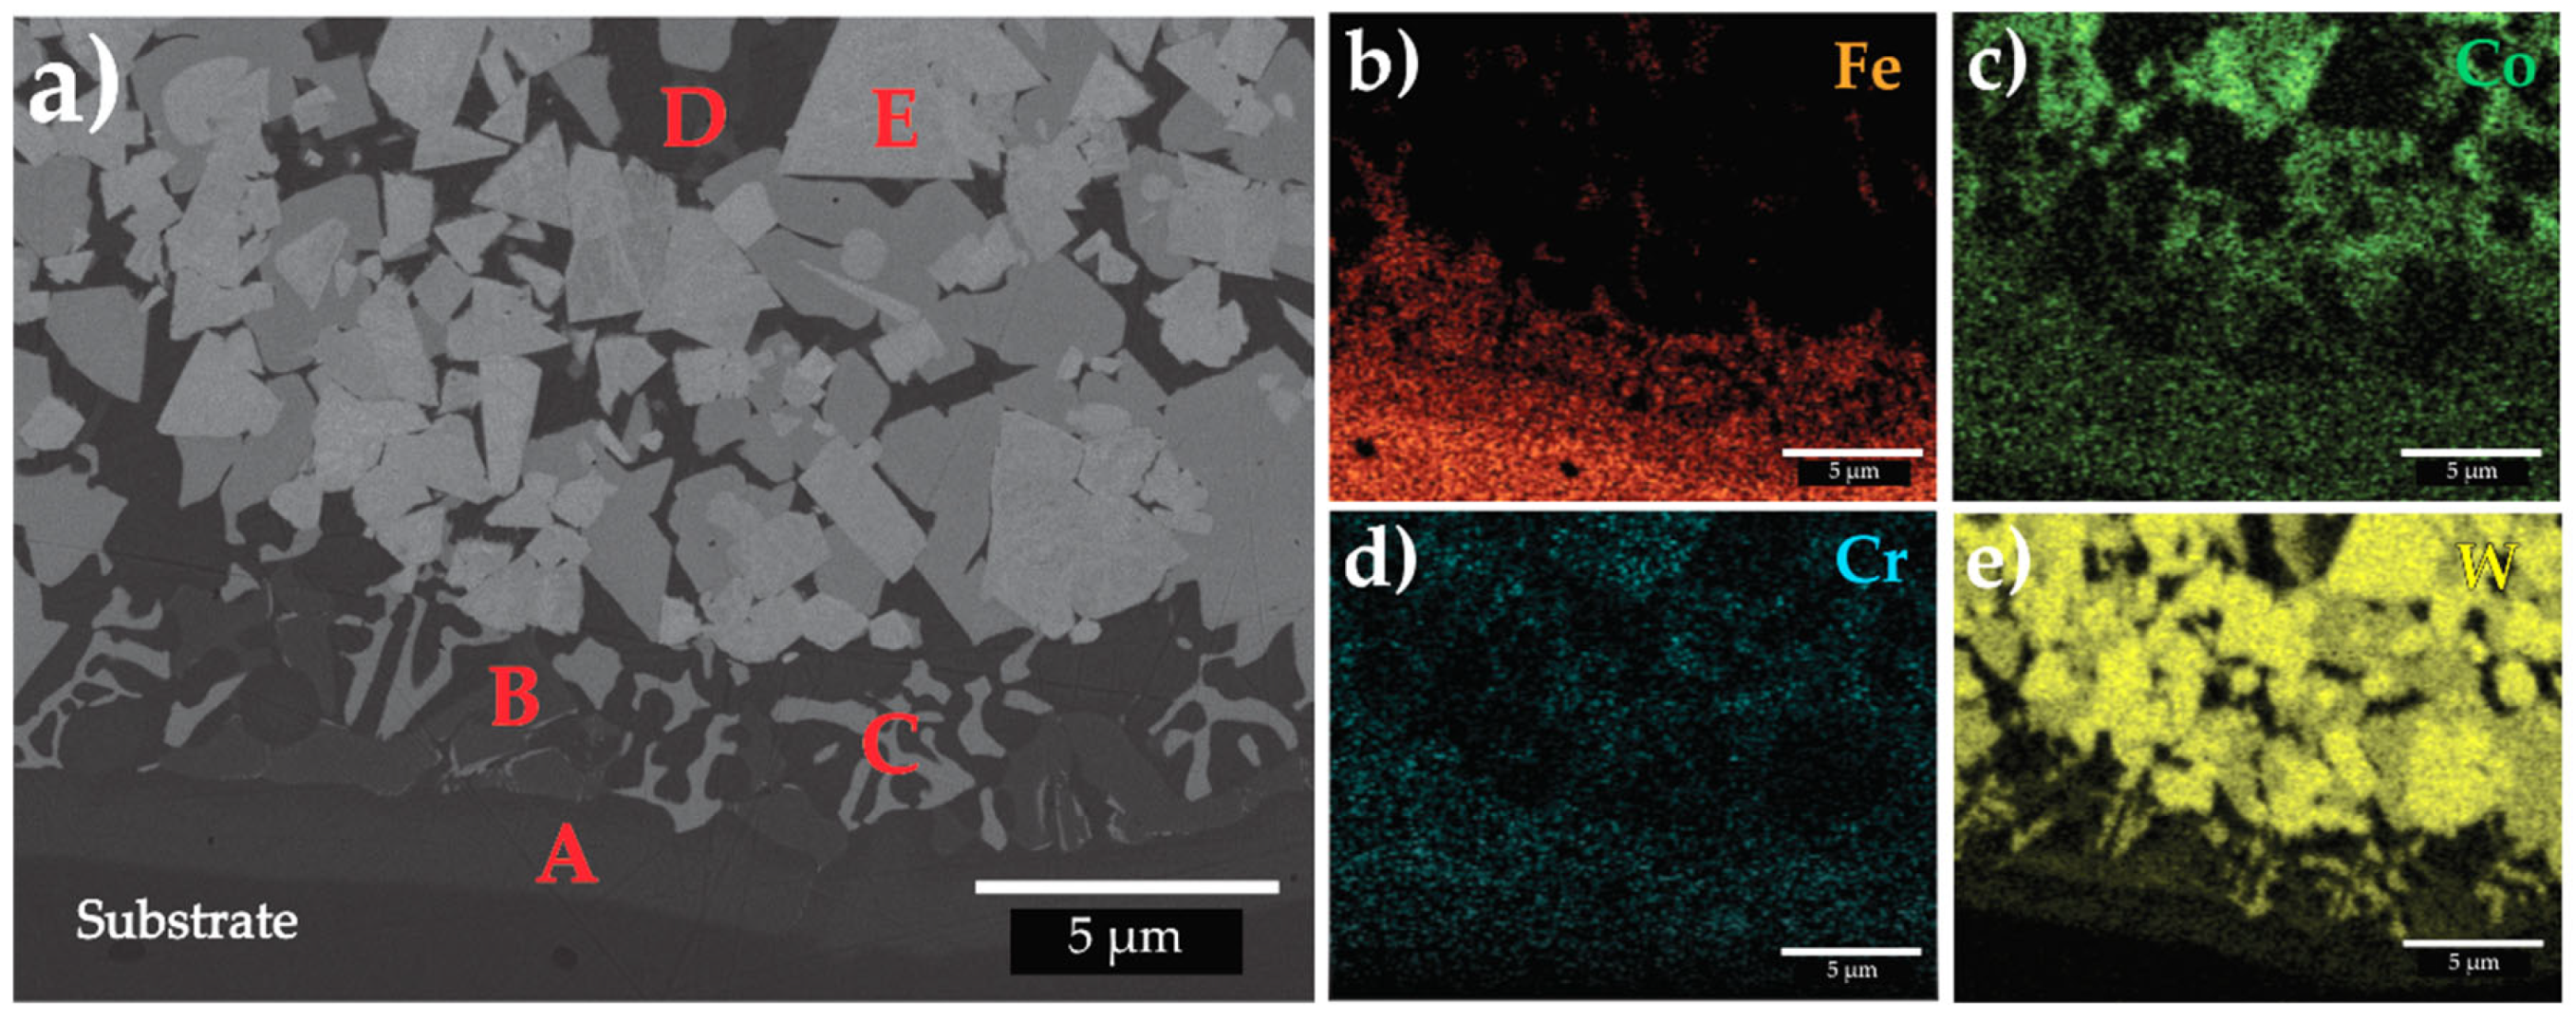
A representative microstructure of the interface (taken as indicated by the position of the rectangular inset labeled as “a” in Figure 3d) for all conditions is shown in Figure 4a. The interface microstructure is composed of a planar grain growth, which is extended from the substrate/clad line up to approximately 1 to 2 µm into the clad (labeled as A); a eutectic carbides zone (labeled as B), presumably formed by M6C carbide type [26]. It was reported earlier that formation of eutectic carbides is related to dilution effect with the substrate; the higher the dilution, the higher the formation of phases containing iron thus decreasing the formation of carbides [11,29]. In addition, a mixture of relatively fine columnar dendrites is also observed (labeled as C). Furthermore, the corresponding Co–Cr bonding phase (D) and WC particles (E) are clearly distinguished as we move away from the interface, being this distance a function of the processing parameters. For example, the bonding phase in Ea24 sample was located at approximately 13 µm, whereas Ea32 and Ea39 samples were about 21 µm and 34 µm, respectively. It is worth mentioning that the extent of the interface described earlier increased with dilution; hence, the Ea39 sample that resulted in higher dilution was also observed with the largest extension of the interface region.
An EDS-mapping analysis conducted on the interface is shown in Figure 4b–e. The Fe-map distribution (Figure 4b) within the interface logically resulted owing to a proper mixing with the substrate chemistry. Indeed, the concentration of Fe is higher next to the substrate and this is reduced if moving towards the coating interior. On the other hand, Co and Cr (Figure 4c,d) are properly mixed along with the interface. By comparing Figure 4b or Figure 4e; there exists a rich region containing a large amount of W areas which corresponds to the bright particles (labeled as E) observed in Figure 4a; hence, it is inferred that those bright particles correspond to WC.
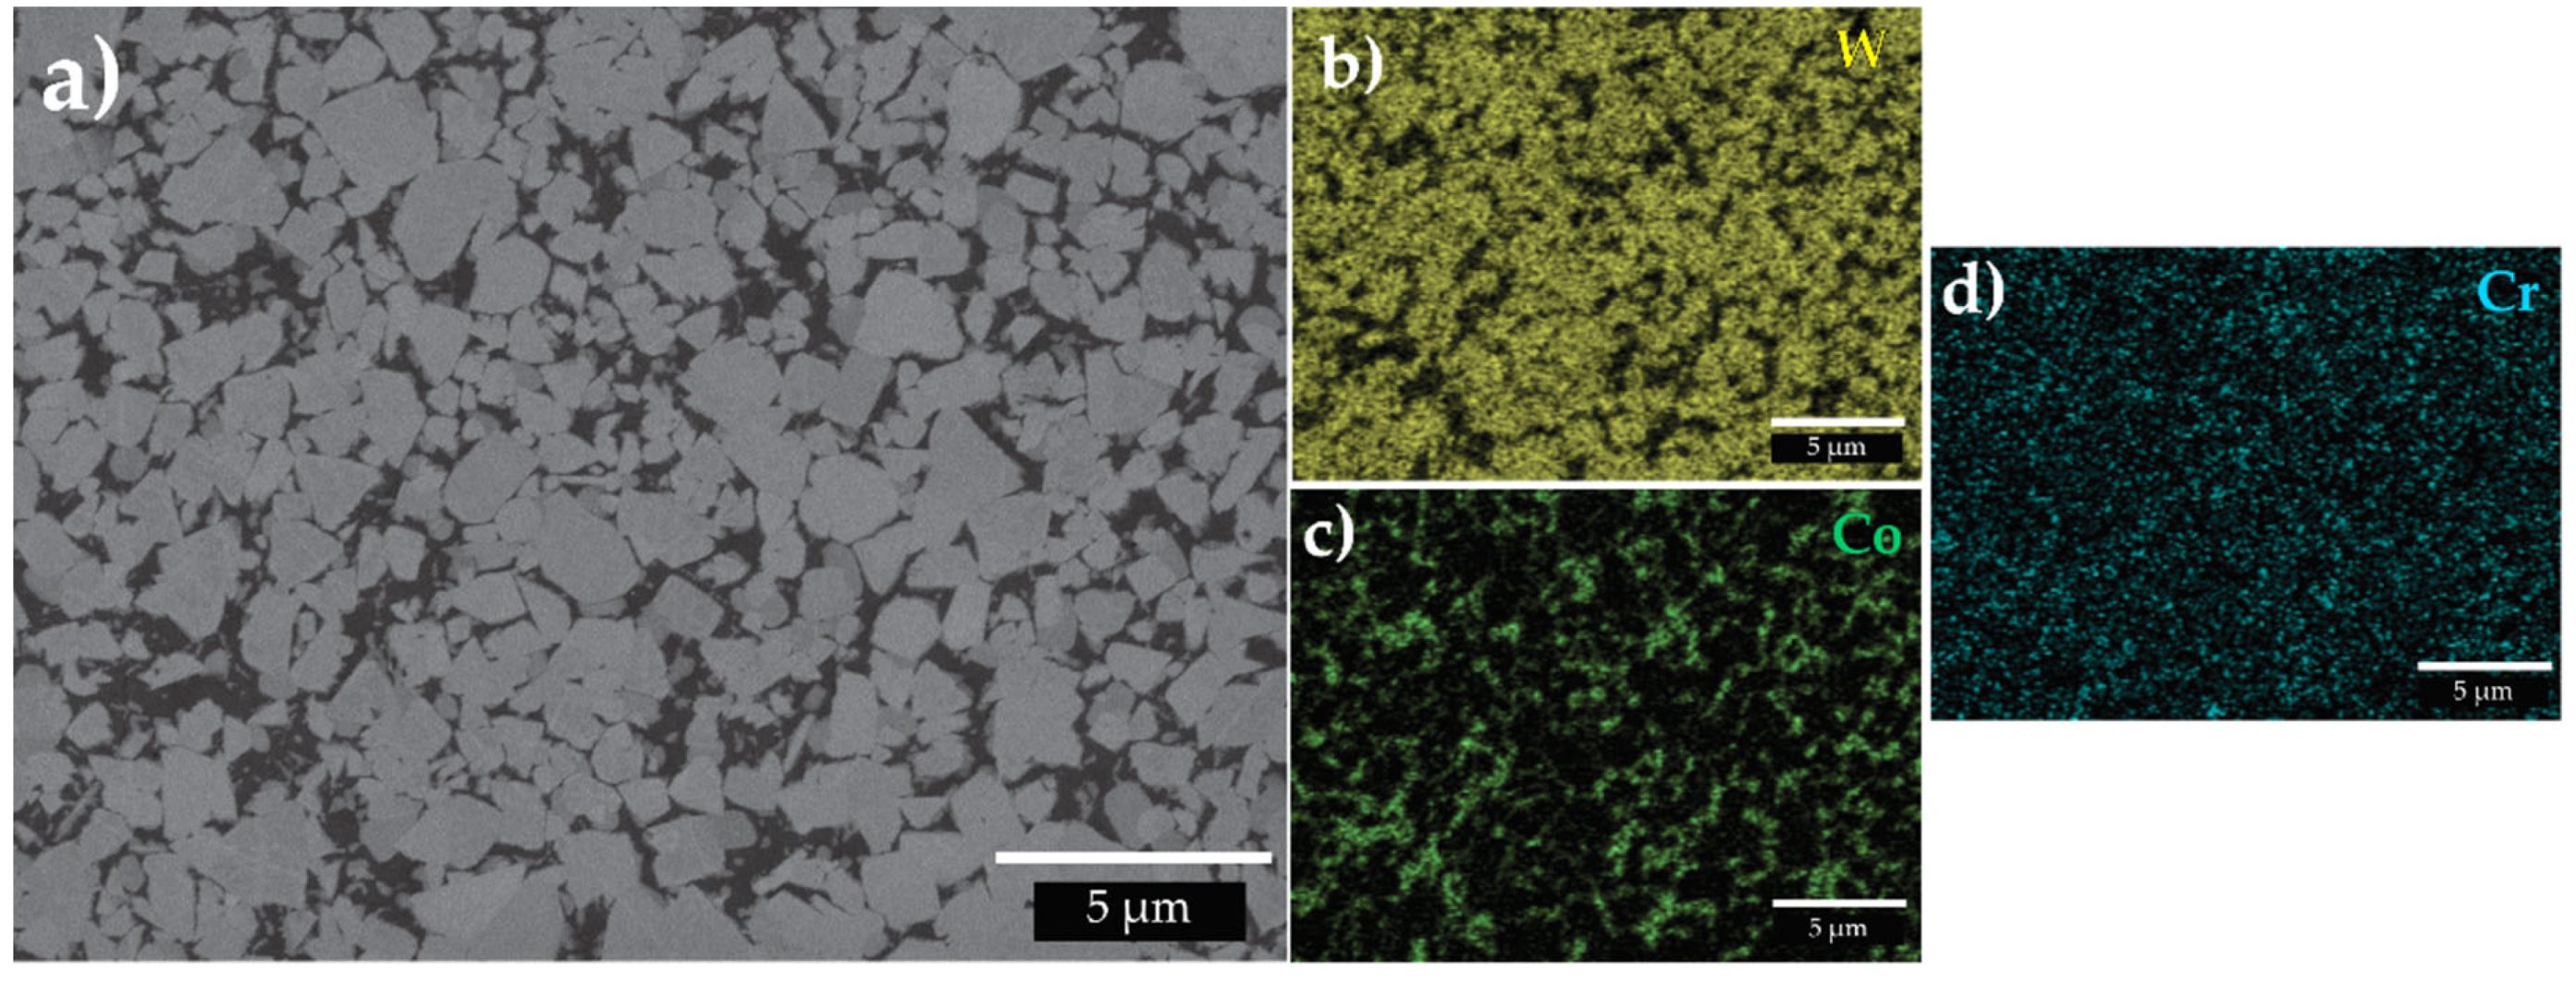
Figure 5a shows the outer region microstructure (taken as indicated by the position of the square inset labeled as “b” in Figure 3d) composed of a continuous binder matrix of Co and Cr (dark region) along with WC particles (light areas) retaining the original feedstock particle size and morphology (1.0 µm in average). The EDS-mapping analysis of this region is shown in Figure 5b–d. Results confirmed the WC particles’ distribution, as well as the Co and Cr binder concentration.
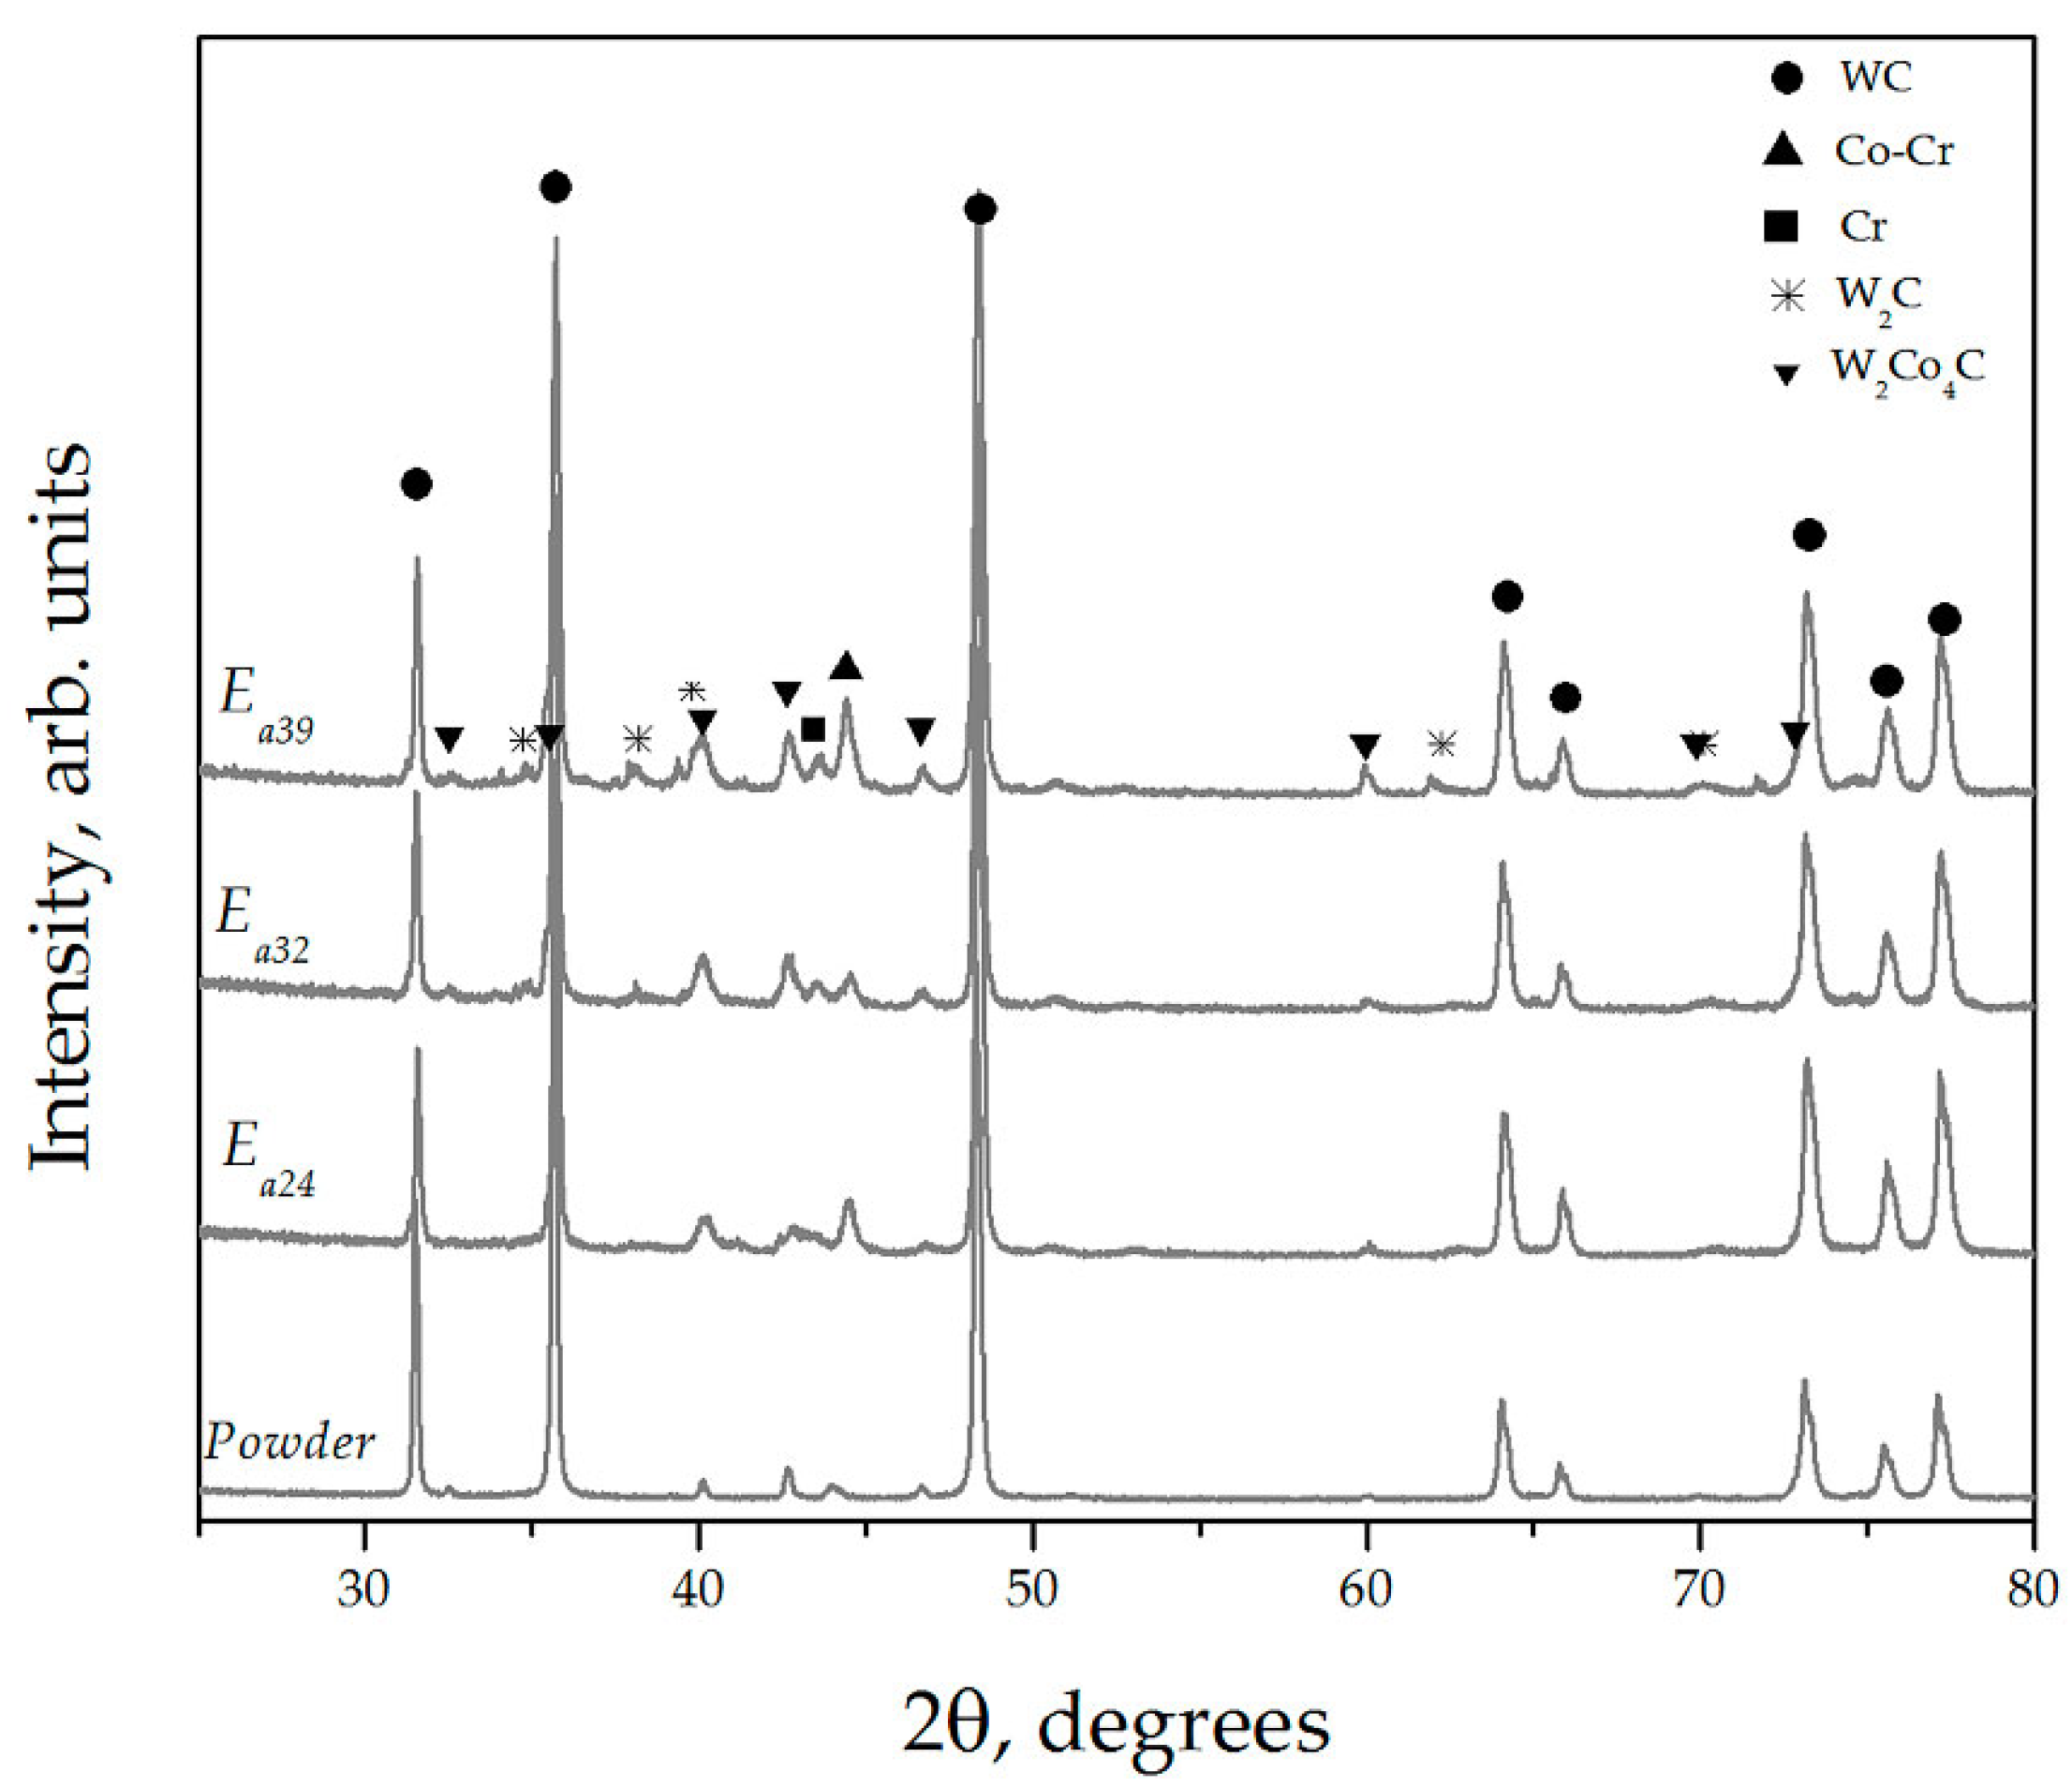
X-ray diffraction patterns at the WC-10Co-4Cr clad-track surface corresponding to the samples Ea39, Ea32, and Ea24 are shown in Figure 6. The corresponding X-ray pattern of the feedstock powder is also included as a reference. The results show that WC is the main phase present for all LC processing conditions; XRD patterns also show the corresponding Co–Cr binder phase peaks, metallic Cr, and W2Co4C phases. Traces of W2C are only detected in samples deposited using an average energy per unit area of 32 and 39 J/mm2; this could occur due to the higher values of Ea during deposition and the longer times needed for heat dissipation.

3.2. Hardness

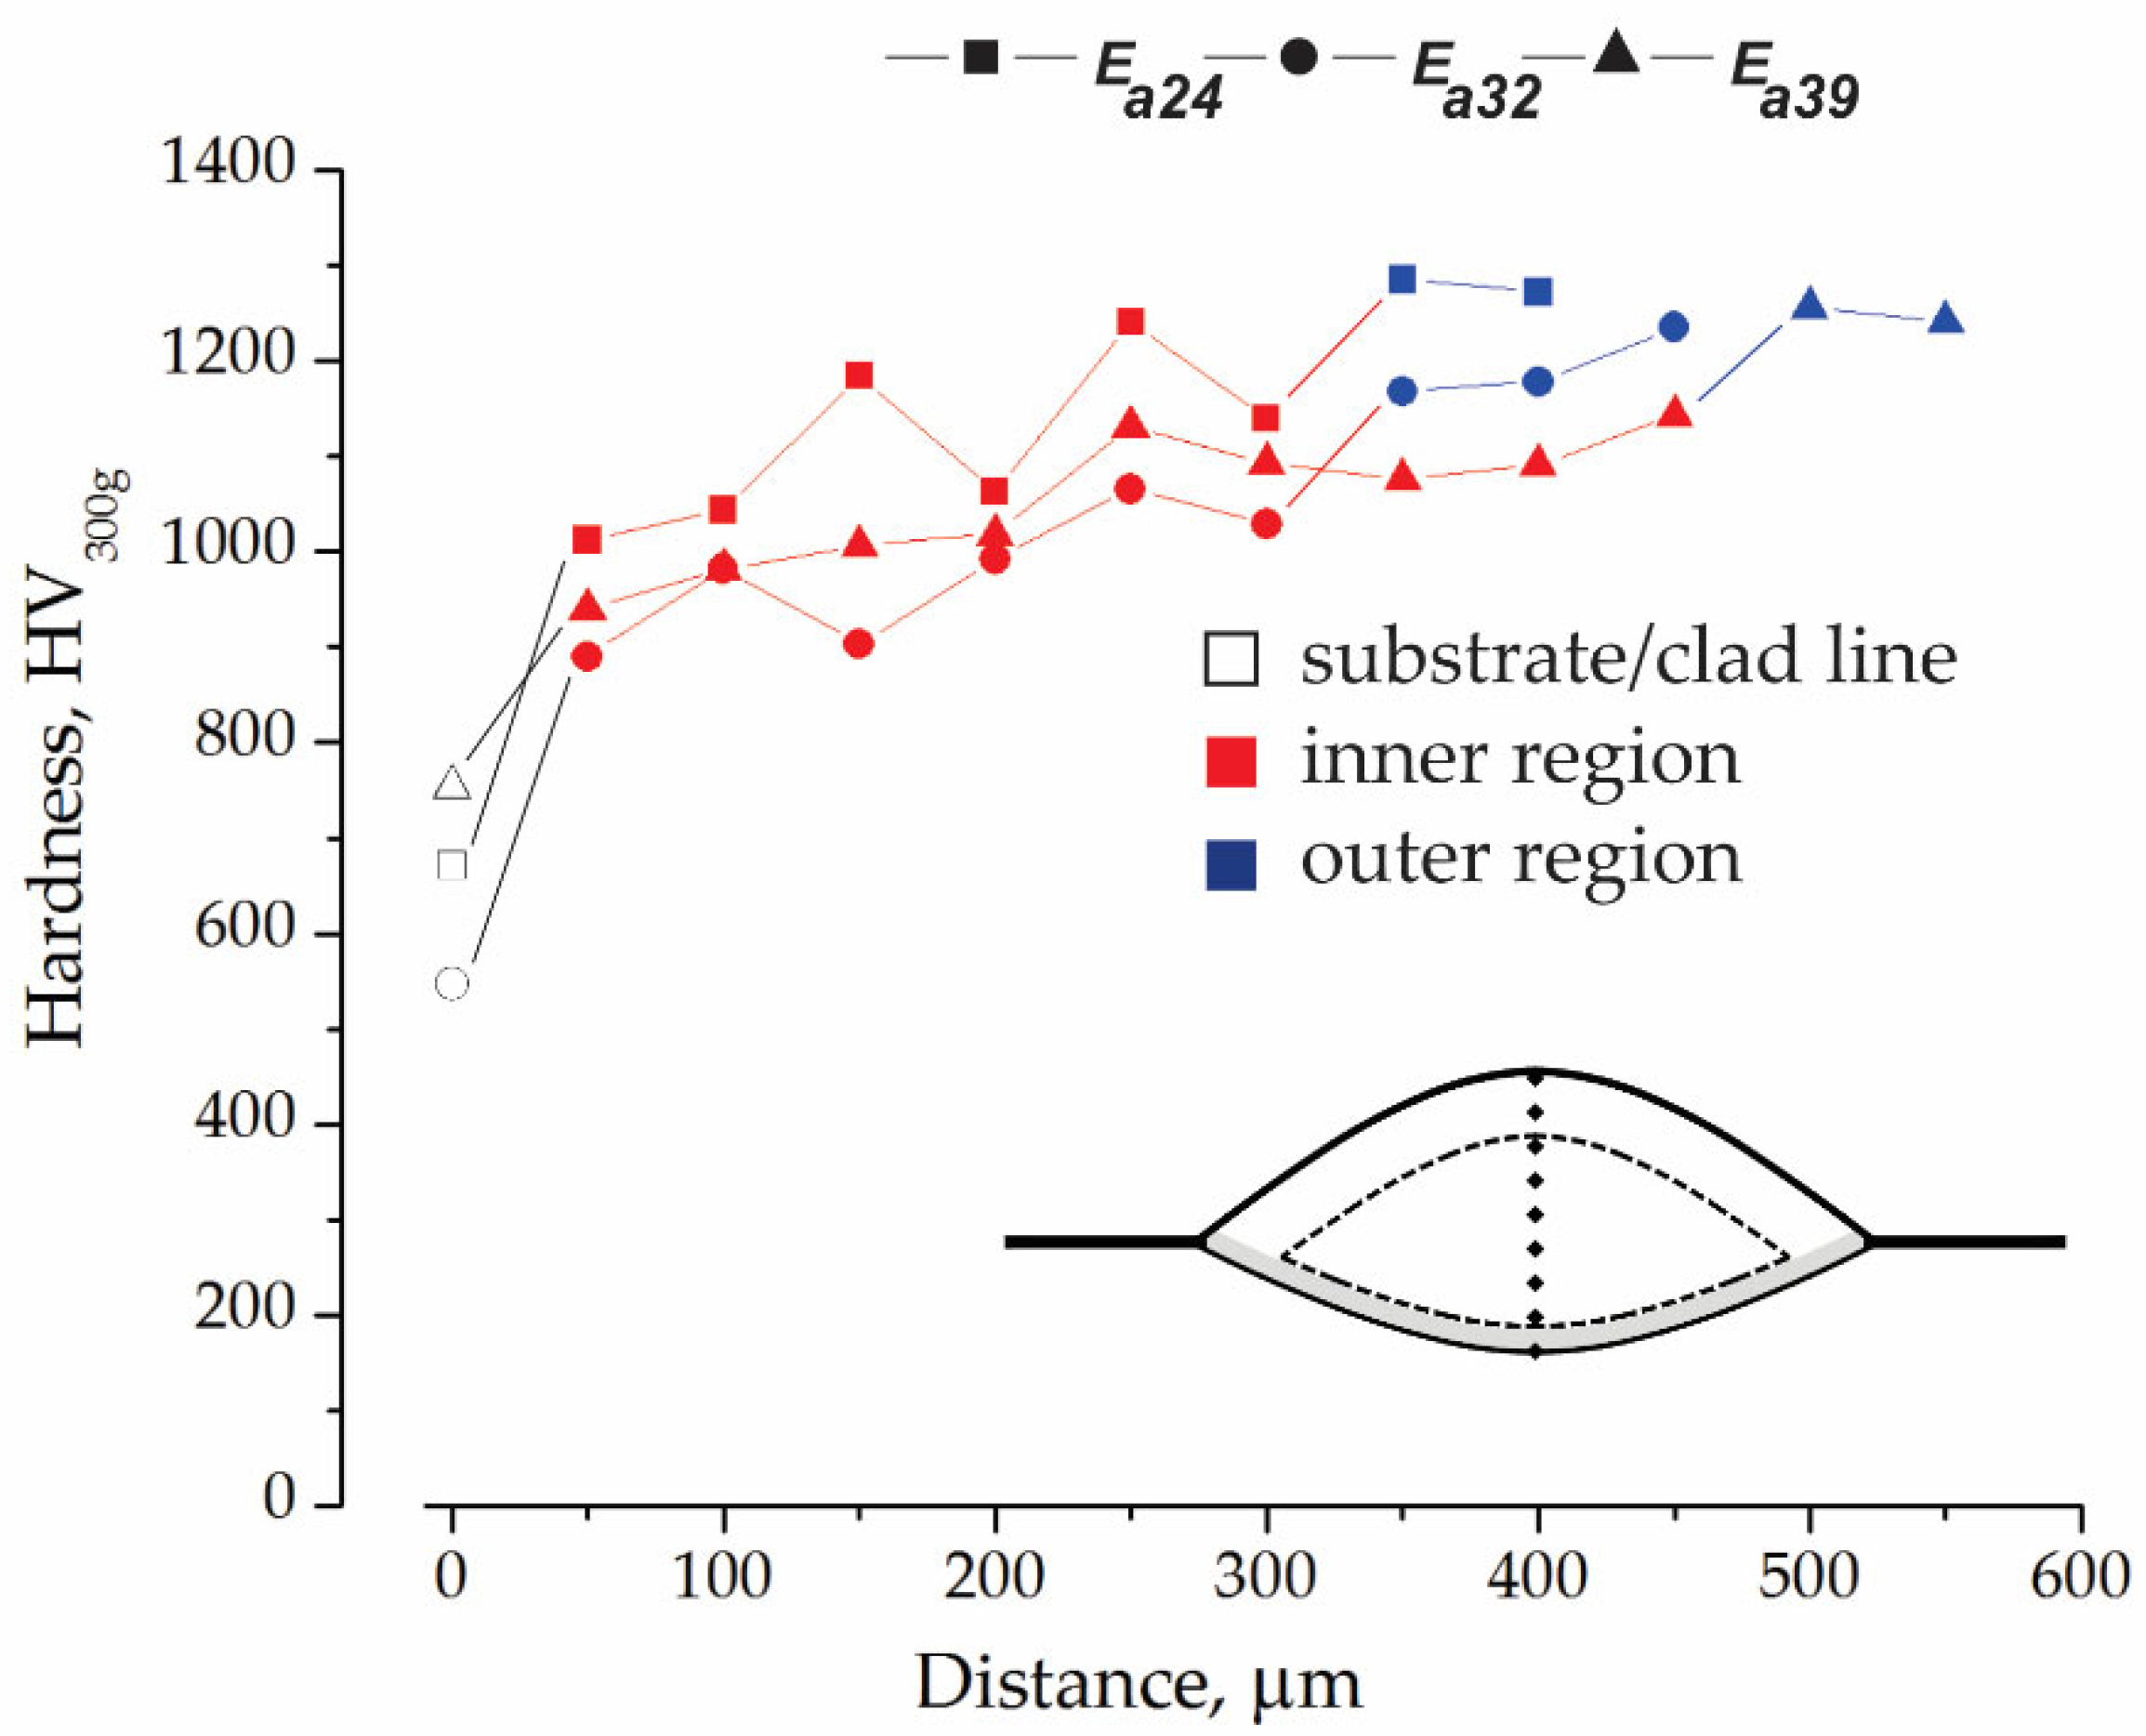
Figure 7 shows the Vickers hardness profile measured along the cross-section of the cladding zone as schematically illustrated in the inset. The substrate/clad line corresponds to zero distance at the abscissa. Higher average hardness values were obtained for the sample deposited at Ea24. On the contrary, lower average hardness values are observed at the Ea32 and Ea39 processing conditions. At the inner region of the clad track (Figure 3d), the average hardness values for Ea24 sample reach up to 1114 HV, while for the other samples the hardness reached a maximum value of 1015 HV. The measured hardness at the outer region tend to be similar in all conditions thus reaching about 1193 HV.

3.3. Effect of the Averange Energy

The interface and the outer regions were similar in terms of their microstructural characteristics for all evaluated samples. On the other hand, this section presents the effect that Ea has on the WC-10Co-4Cr deposits in the inner region.
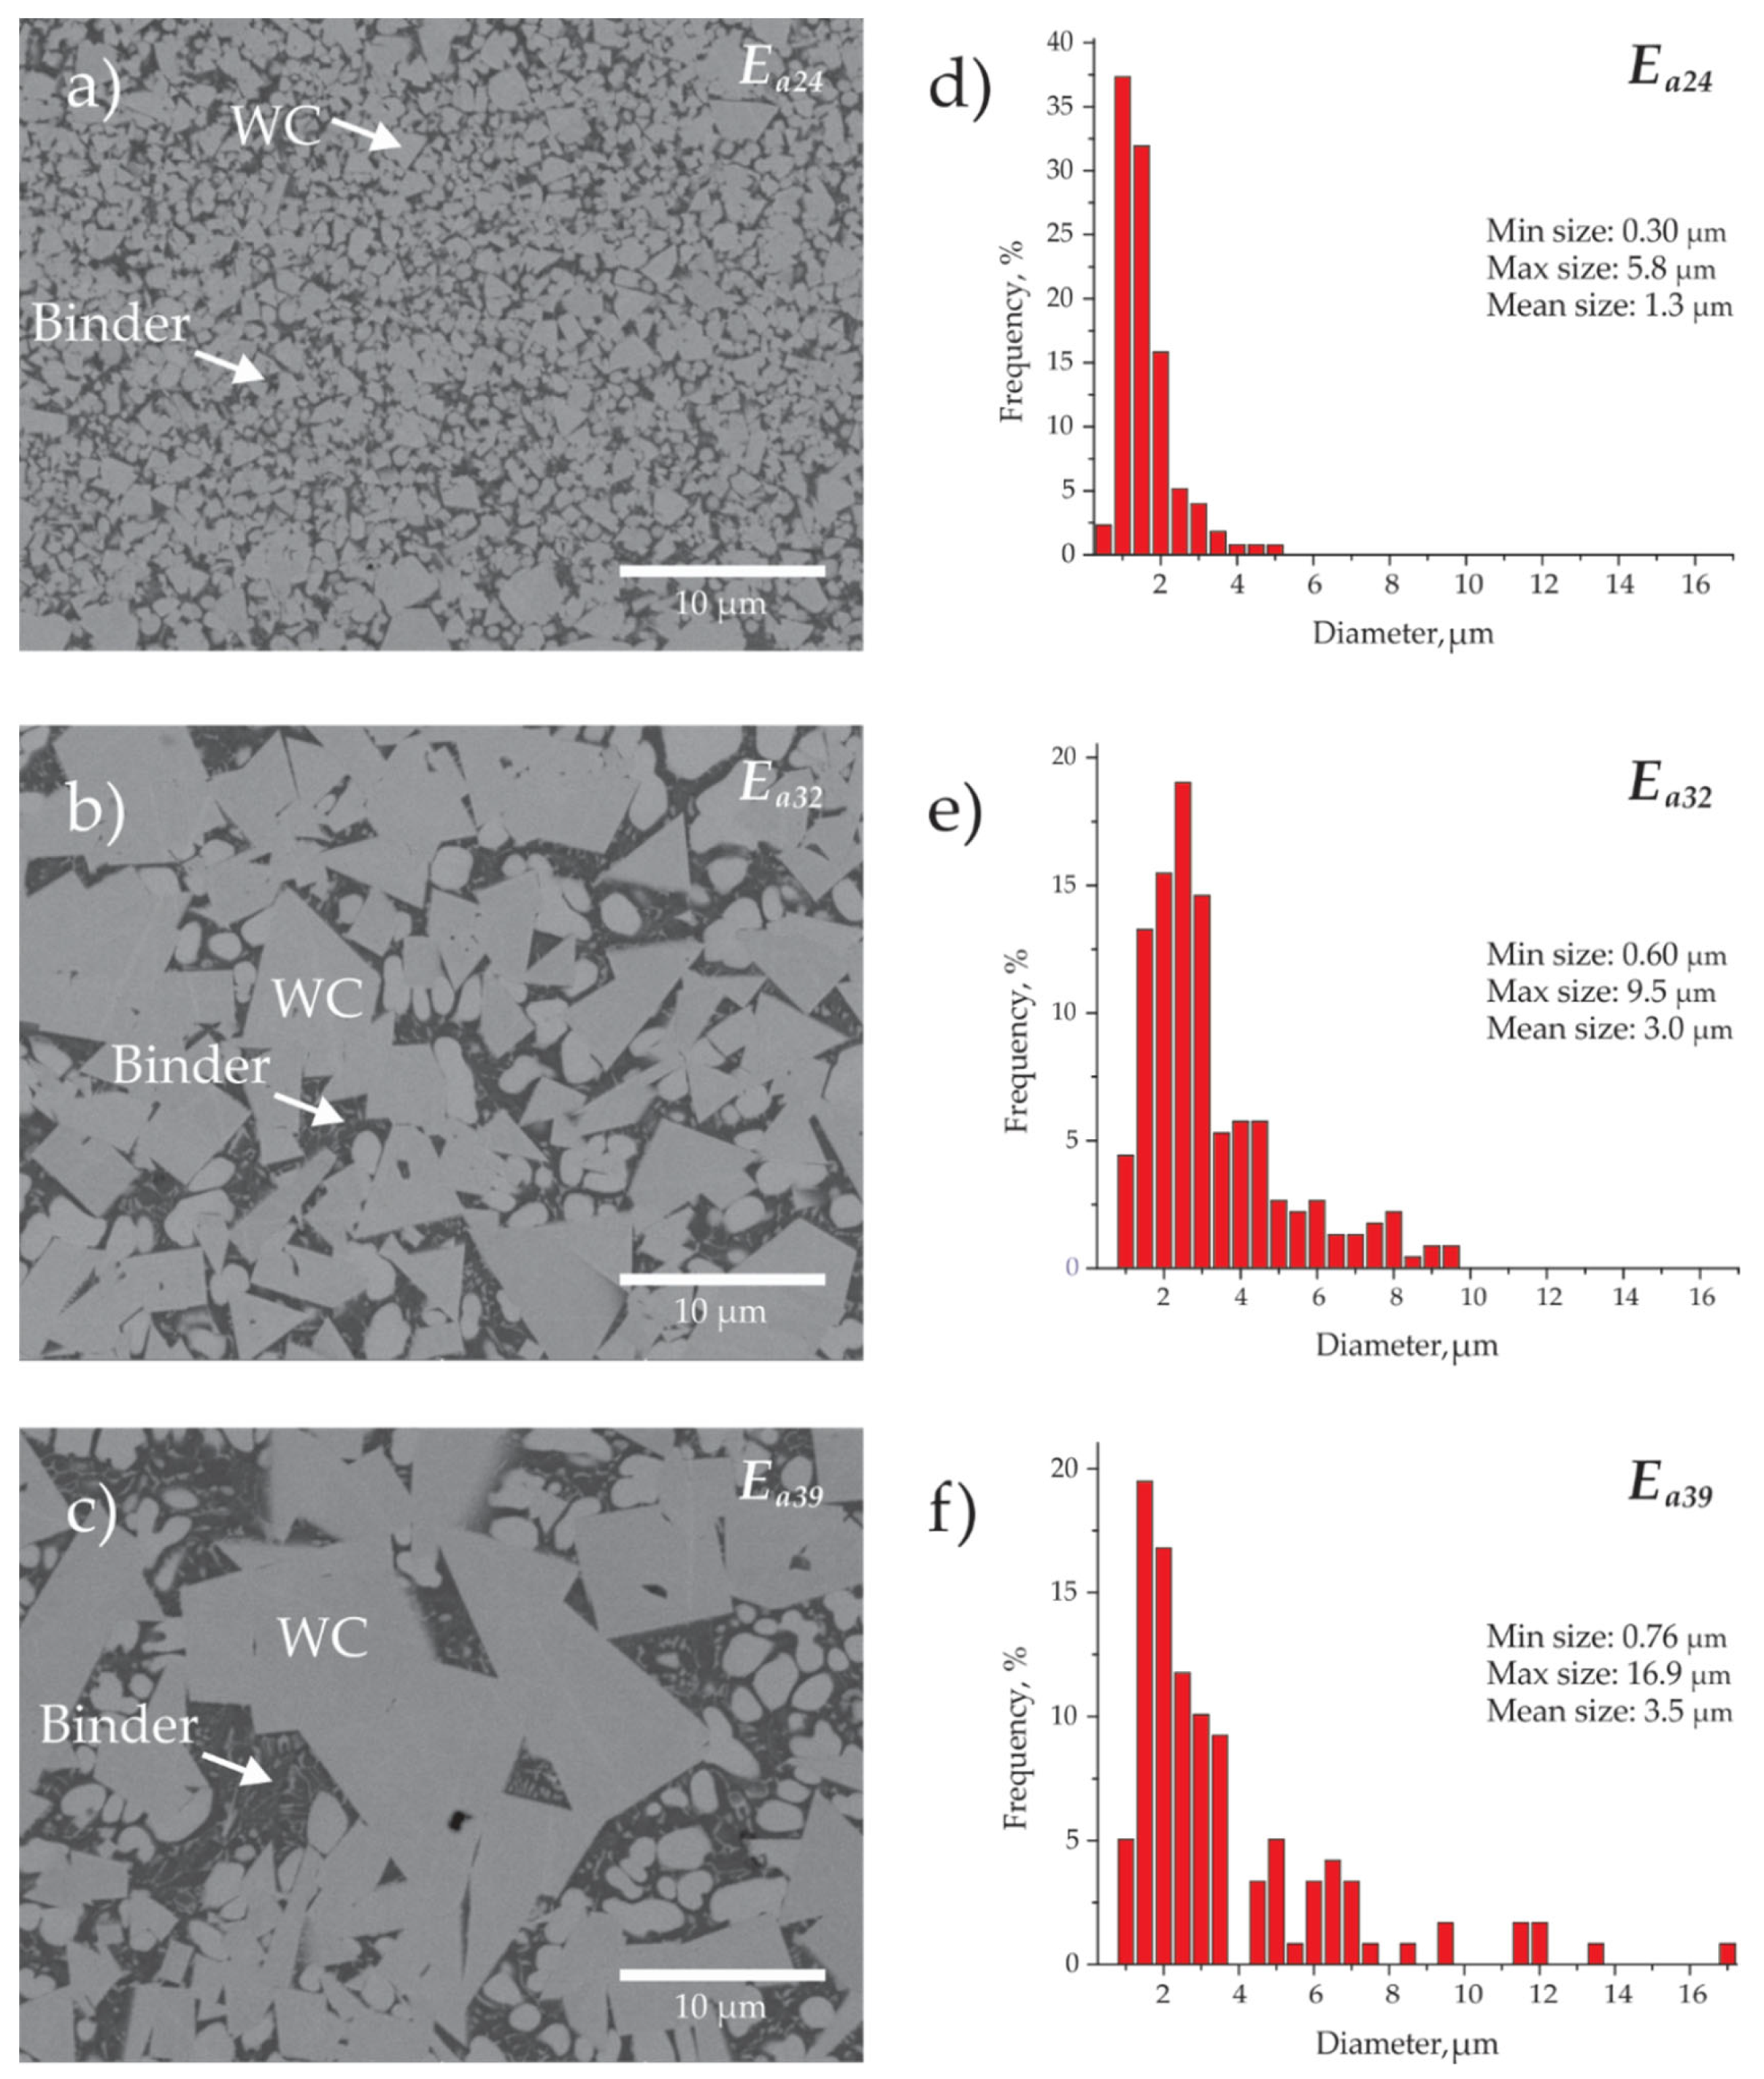
Figure 8a–c summarized the metallographic analysis of the inner region of the clad at different values of Ea. The average WC-grain size and the distribution frequency plots are shown in Figure 8d–f. The resultant clad microstructure is composed of WC particles (light gray phase) and Co-Cr alloy binder phase (dark gray phase). As noticed, WC-grain morphology and size varied significantly with Ea; for example, at relatively low Ea (24 J/mm2), the microstructure consists of a predominant uniform distribution of fine WC grains with an average size of about 1.3 µm, which are homogeneously surrounded by the Co-Cr binder phase (Figure 8a). For an Ea = 32 J/mm2 increase, a heterogeneous microstructure is obtained; a considerable large fraction of WC grain growth having an angular morphology and average grain size of 3.0 µm is developed, as shown in Figure 8b,e. Similarly, an increase of Ea = 39 J/mm2 resulted in larger WC grains with an average grain size up to 3.5 µm having a predominant triangular and/or polygonal morphology (Figure 8c). It is important to mention that the average grain size of WC particles in the original feedstock powder is about 1.0 µm; consequently, the Ea24 exhibited almost barely WC grain growth having a relative homogenous particle size as compared to the original feedstock powder. However, when Ea reaches 32 J/mm2, a considerable grain growth of almost three times is achieved. Moreover, for Ea32 and Ea39 conditions, the increase in WC grain size covered an inner region area of approximately 34% and 51%, respectively. These results are in agreement with the hardness values shown in Figure 7, where the higher hardness values were obtained for the Ea24 condition which corresponds to the smaller grain size (Figure 8), whereas the samples that resulted with the higher WC grain size (Ea32 and Ea39) showed reduced hardness values.
Coalescence is a process where small neighboring particles (or grains) merge to form larger particles; this process occurs if high enough contiguous areas are in contact between two or more existing WC grains, leading to the elimination of contiguous grain boundaries if sufficient activation energy is provided [30,31,32]. This contiguity may be favored due to different conditions, including incomplete wetting of WC particles in the liquid phase, low binder phase content, inhomogeneous dispersion of WC particles in the liquid phase, similar preferred orientation between WC grains, faced shaped WC particles, and even grain rotation [26,32,33,34,35,36].
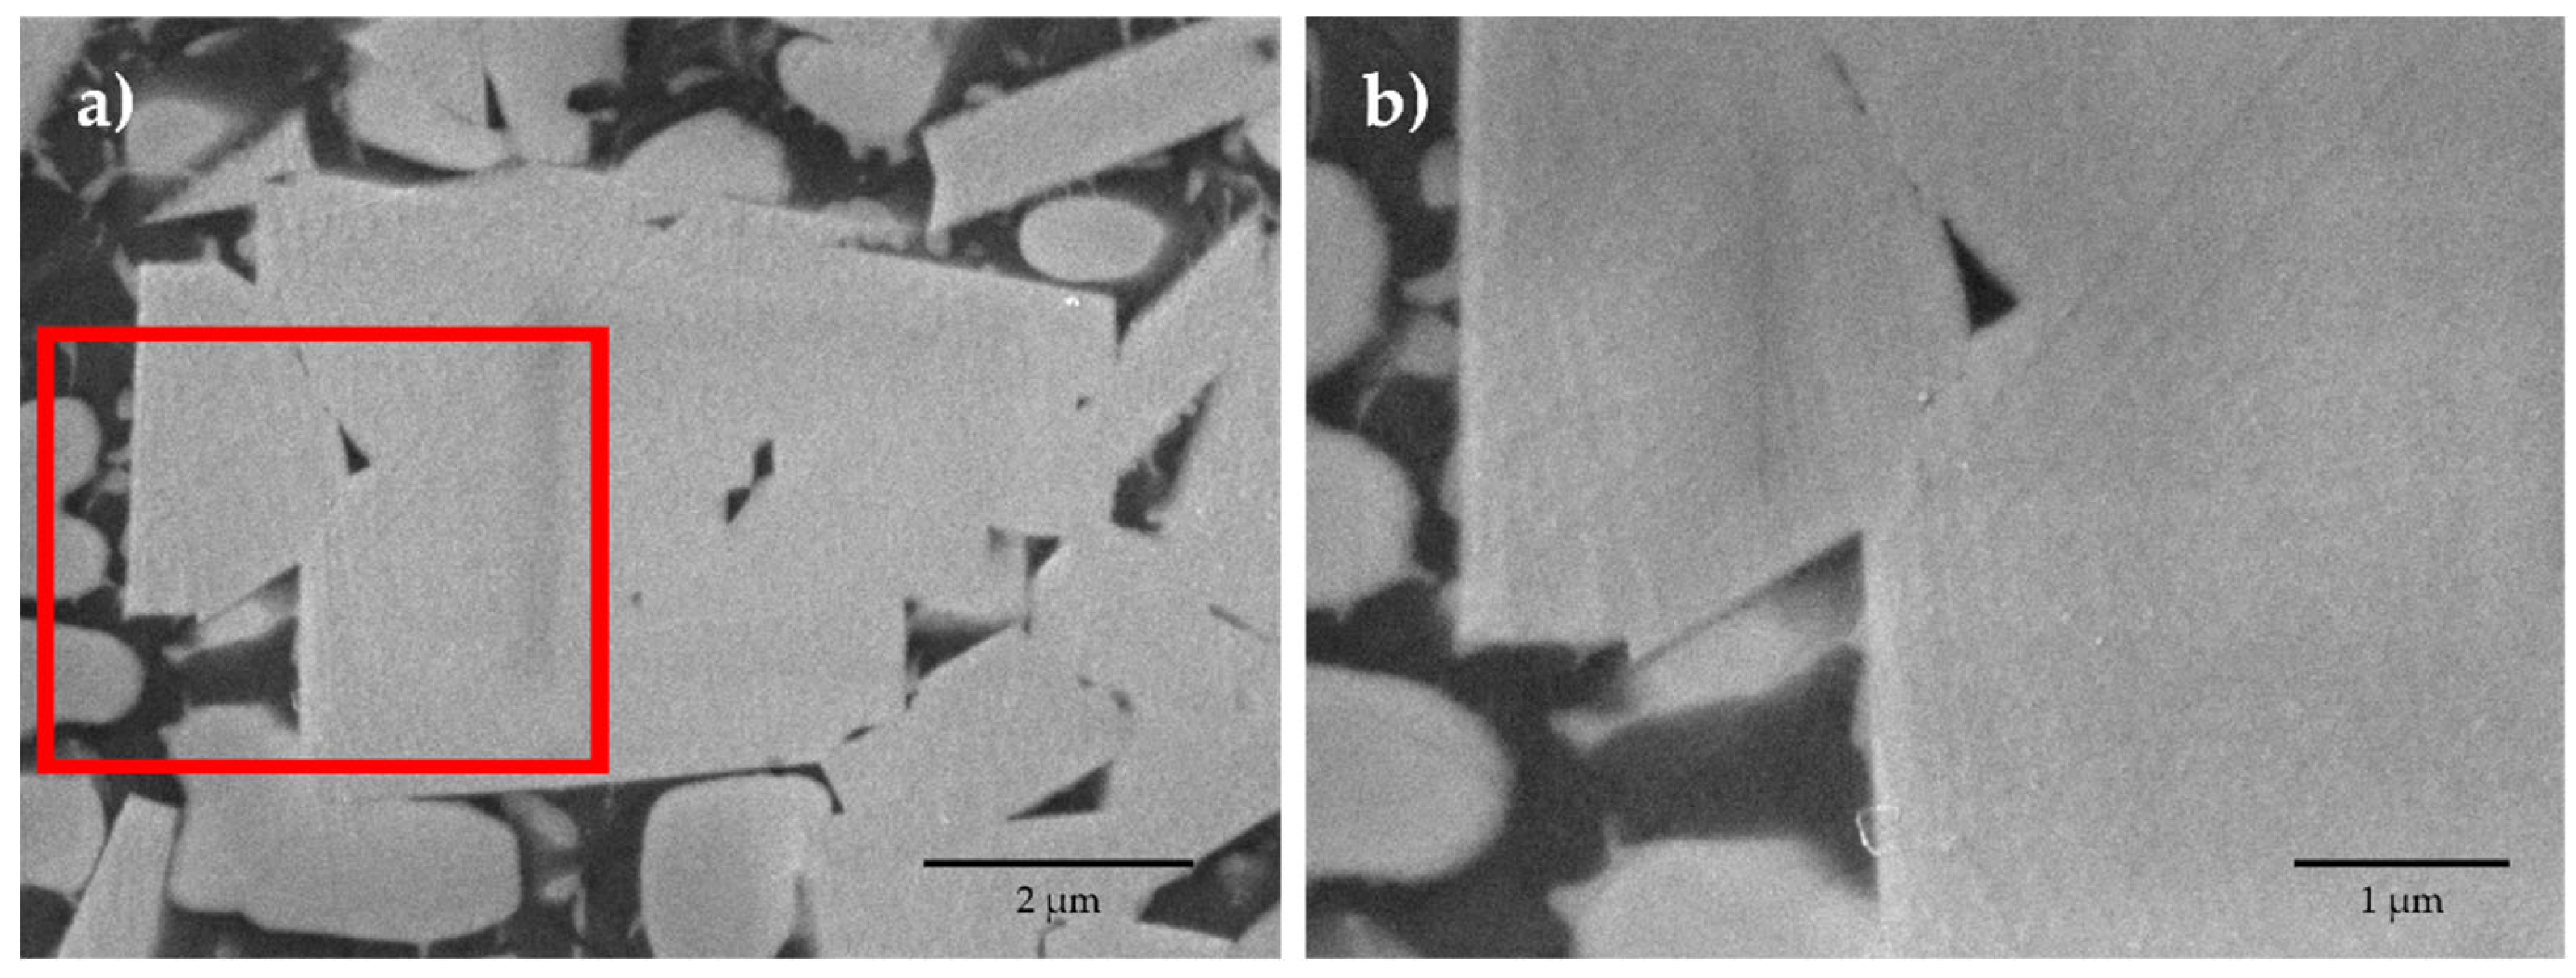
Despite the fact that LC is a short thermal cycle process with rapid heating and cooling rates (short thermal cycle), the WC-grain growth is associated with the thermal accumulation at the inner zone of the WC-10Co-4Cr clad-tracks, as shown in Figure 8b,c. Figure 9a shows the inner zone at the highest Ea where contacting grains have coalesced via grain boundary elimination where the remnant pores between grains suggested that coalescence occurred at the grain boundaries. A higher magnification image is provided in Figure 9b, as taken from the marked rectangle from Figure 9a. Larger WC grain size is observed for the Ea39 condition as shown in Figure 8c; this further confirms that the higher Ea employed, the greater the time required to release the thermal accumulation and the higher the possibility for coalescence to occur; hence, under both Ea32 and Ea39 conditions, coalescence is clearly developed, whereas in the case of the Ea24 condition, coalescence is almost non-existent.
It has been documented that during sintering processing, WC solid grains fully develop a truncated rectangular, triangular, polygonal shape or near-hexagonal prisms due to longer times of exposition and being held at a high temperature, which leads to complete coalescence [32,37,38].
In this work, the morphology change of WC grains into triangular and/or polygonal shapes was incomplete; additionally, many other grains exhibited rounded or ellipsoidal morphology, thus suggesting that the equilibrium or usual morphology of solid grains found in sintering processing, was not reached here during LC deposition due to the heating and cooling rates were too short to complete this process [39,40]. The presence of rounded or ellipsoidal grains suggests that WC particles did not reach conditions for further coalescence as a result of different reasons, including an inhomogeneous dispersion of particles, a lack of faced shaped particles, perhaps to a restricted grain rotation of WC particles, and possibly to non-preferred orientation. Furthermore, rounded or ellipsoidal particles are quite similar in terms of size and morphology as compared to the original particles before LC (feedstock powder); this confirms that some WC particles did not merge due to the rapid thermal cycles.
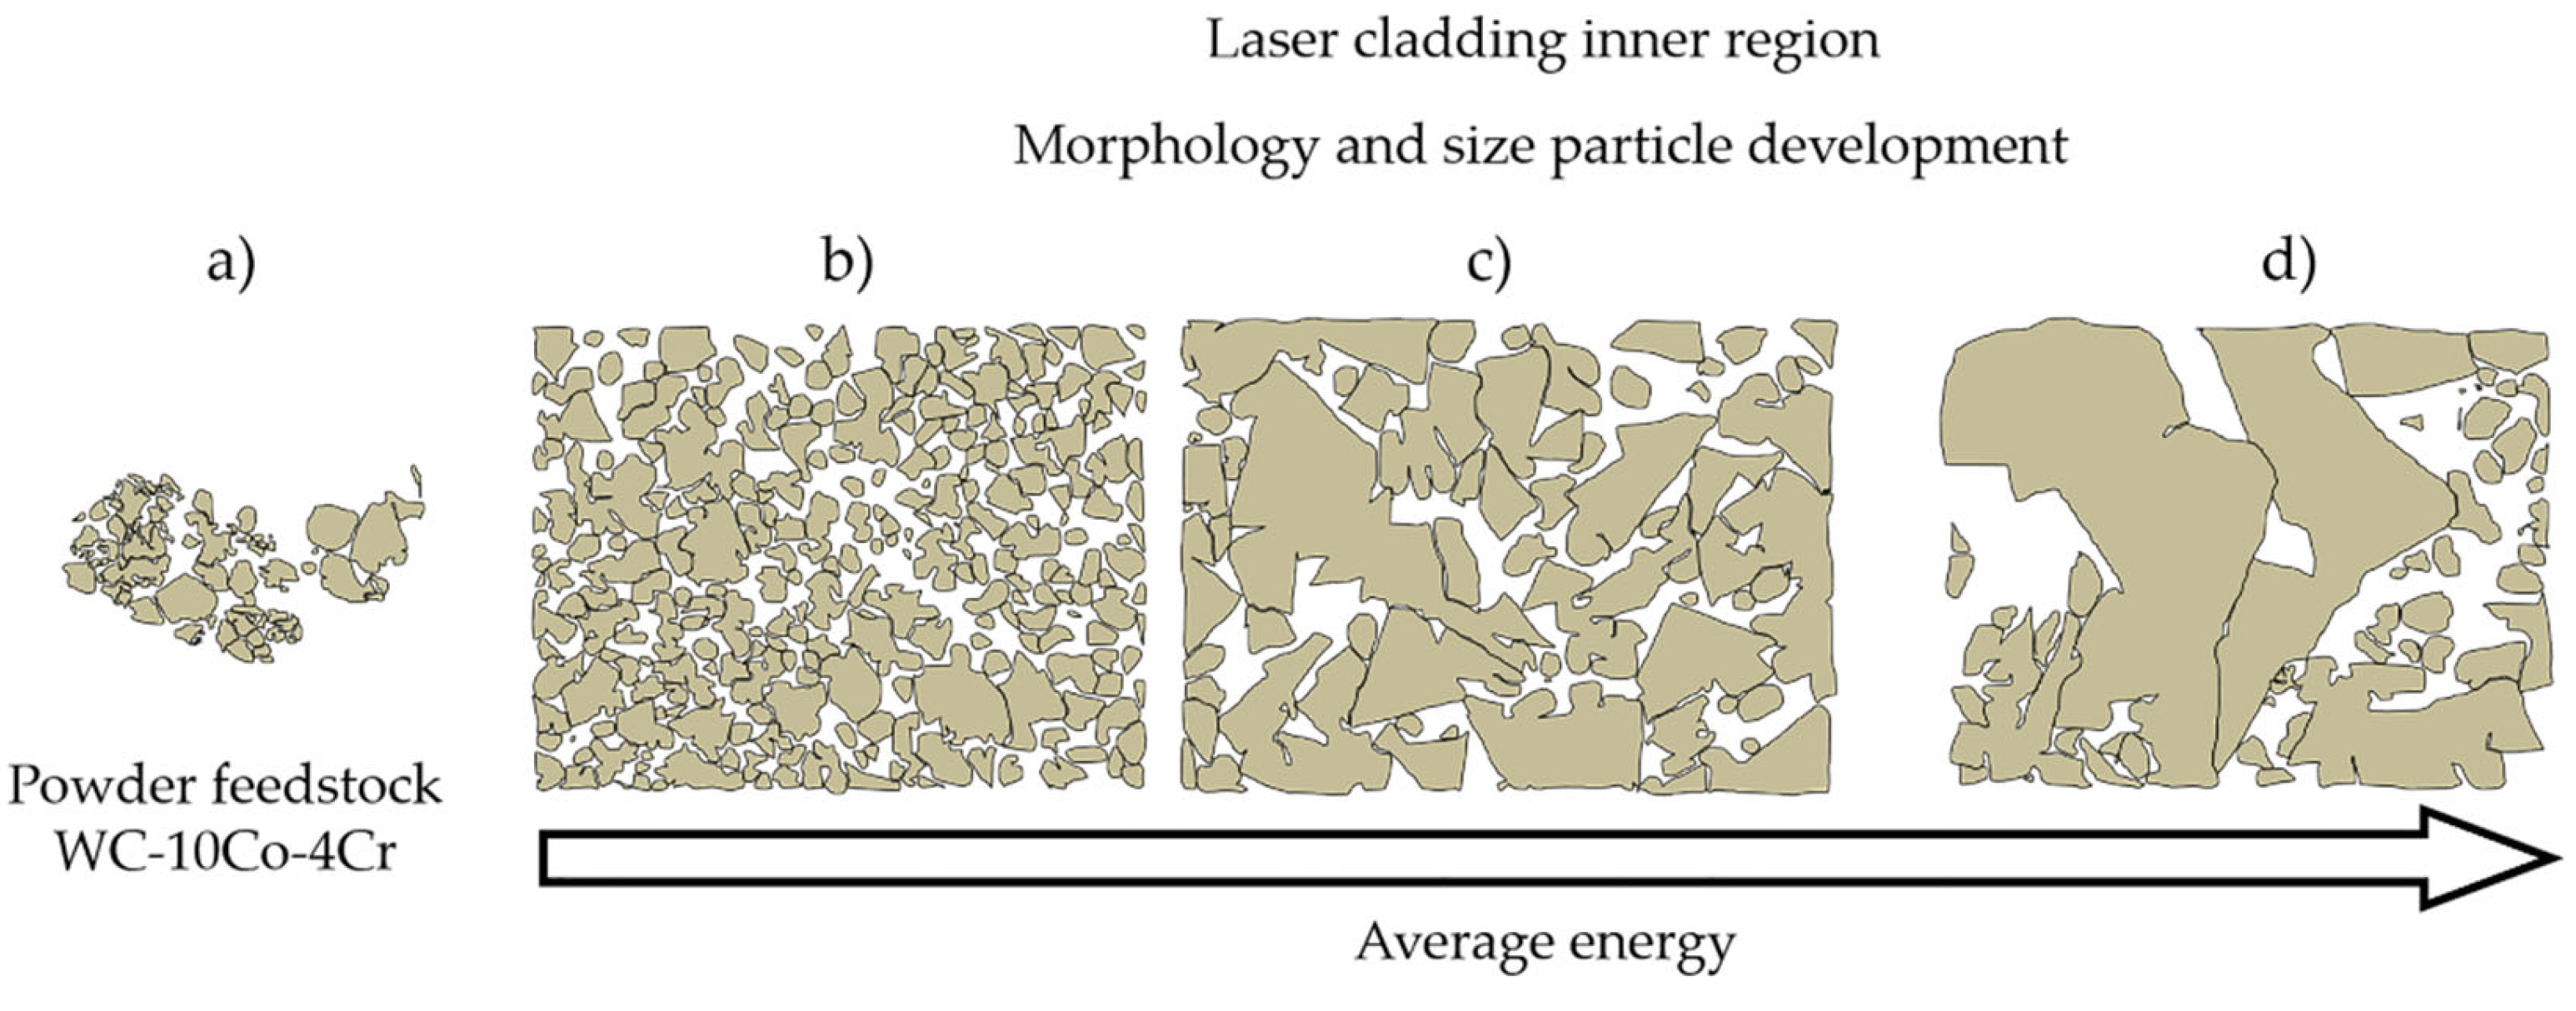
The schematic provided in Figure 10 represents the sequence of WC grain growth as the average energy increases. The morphology and size of the WC particles in the powder is illustrated in Figure 10a. When low average energy is used, WC particles remain almost unaltered and acceptable cladding is obtained (see schematic in Figure 10b); as the average energy increases (Figure 10c,d), WC particle growth is evident and the morphology develops a triangular and/or polygonal shape owing to coalescence. As previously discussed, coalescence is the mechanism responsible for grain growth of WC during LC of WC-10Co-4Cr. Again, the remaining rounded and ellipsoidal particles did not merge to each other; however, the presence of these particles is due to partial solubility of W/C within the Co-Cr binder phase; it is believed that the Co-Cr binder phase melts completely while the WC grains may not totally melt but experience partial surface dissolution in the molten pool.

4. Conclusions

This research work aims on evaluating the influence of the average energy on the geometrical characteristics, microstructure and hardness of WC-10Co-4Cr alloy deposited on AISI 1020 steel by Yb: YAG laser cladding. With the purpose of addressing a detailed analysis of the results, the clad zone has been conveniently divided into the interface, outer region, and inner region. Therefore, the following conclusions are obtained:
  • Results indicated that upon an average energy value of Ea = 24 J/mm2; the porosity was about 11%, whereas the dilution value remained at 15%, thus being acceptable values for both porosity and dilution.
  • The microstructure development at the interface was consistent for all conditions; it was composed of a planar grain growth, with presence of eutectic carbides and a mixture of fine columnar dendrites; however, the higher the average energy, the larger the extension of the interface. Whereas the microstructure of the outer region revealed the presence of the Co-Cr binder along with WC particles retaining the original feedstock particle size and morphology.
  • Considerable grain growth occurred at the inner region of the clad, particularly when employing high average energy (i.e., above 32 J/mm2); WC grain growth increased by three times compared to the original powder particle size. Additionally, the morphology of the growth WC particles developed a triangular and/or polygonal shape.
  • A complete merge of small neighboring grains into larger particles and presence of residual pores between partially delimited WC particle boundaries is observed at the inner region; hence, the grain growth is attributable to a coalescence mechanism. Further, the presence of rounded and ellipsoidal WC particles suggested partial solubility of W and C within the Co-Cr binder phase; hence, those particles did not merge (lack of coalescence) due to inhomogeneous dispersion and the lack of faced shaped particles.
  • Hardness at the inner region resulted in higher values upon the low average energy condition (i.e., 24 J/mm2), indeed, being the sample with barely observable grain growth; on the contrary, evident grain growth and considerable lower hardness was observed upon higher average energy condition (i.e., above 32 J/mm2).

Author Contributions

Conceptualization-data curation, E.A.L.-B.; E.A.L.-B. and V.H.B.-H.; Formal analysis, V.H.B.-H. and J.J.R.-M.; Investigation, E.A.L.-B. and H.R.-L.; Methodology, E.A.L.-B., H.R.-L., V.H.B.-H., J.J.R.-M., J.I.-M. and J.M.A.-O.; Validation, E.A.L.-B.; Writing—original draft, E.A.L.-B. and V.H.B.-H.; Writing—review and editing, J.I.-M. and J.M.A.-O.

Funding

Enrique A. López Baltazar wants to thank the Mexican National Council on Science and Technology (Conacyt) for the financial support during this research project. This research was funded by Universidad Autónoma de Zacatecas, CIDESI and COMIMSA, México. This project was partially funded by CONACYT AEM Project 275781.

Acknowledgments

Haideé Ruiz-Luna wants to thank the program Cátedras-Conacyt and the projects no. 254731-INFRA-2015 and 270613-INFRA-2016. Juansethi Ibarra-Medina is commissioned as a CONACYT Research Fellow at the Center for Engineering and Industrial Development (CIDESI) (Project: Catedras 2017 - num. 57). Juansethi Ibarra-Medina also acknowledges the Conacyt Consortium in Additive Manufacturing (CONMAD) for the use of experimental facilities for this work.

Conflicts of Interest

The authors declare no conflict of interest.

References

  1. Kumari, K.; Anand, K.; Bellacci, M.; Giannozzi, M. Effect of microstructure on abrasive wear behavior of thermally sprayed WC–10Co–4Cr coatings. Wear 2010, 268, 1309–1319. [Google Scholar] [CrossRef]
  2. Méndez-Medrano, K.O.; Martínez-González, C.J.; Alvarado-Hernández, F.; Jiménez, O.; Baltazar-Hernández, V.H.; Ruiz-Luna, H. Microstructure and Properties Characterization of WC-Co-Cr Thermal Spray Coatings. J. Miner. Mater. Charact. Eng. 2018, 6, 482–497. [Google Scholar] [CrossRef]
  3. Wood, R.J.K.; Herd, S.; Thakare, M.R. A critical review of the tribocorrosion of cemented and thermal sprayed tungsten carbide. Tribol. Int. 2018, 119, 491–509. [Google Scholar] [CrossRef]
  4. Zhang, S.-H.; Cho, T.-Y.; Yoon, J.-H.; Fang, W.; Song, K.-O.; Li, M.-X.; Joo, Y.-K.; Lee, C.G. Characterization of microstructure and surface properties of hybrid coatings of WC–CoCr prepared by laser heat treatment and high velocity oxygen fuel spraying. Mater. Charact. 2008, 59, 1412–1418. [Google Scholar] [CrossRef]
  5. Lian, G.; Zhang, Y.; Zhang, H.; Huang, X.; Chen, C.; Jiang, J. Investigation of Geometric Characteristics in Curved Surface Laser Cladding with Curve Path. Metals 2019, 9, 947. [Google Scholar] [CrossRef]
  6. Haldar, B.; Saha, P. Identifying defects and problems in laser cladding and suggestions of some remedies for the same. Mater. Today Proc. 2018, 5, 13090–13101. [Google Scholar] [CrossRef]
  7. Valsecchi, B.; Previtali, B.; Vedani, M.; Vimercati, G. Fiber Laser Cladding with High Content of WC-Co Based Powder. Int. J. Mater. Form. 2010, 3, 1127–1130. [Google Scholar] [CrossRef]
  8. Erfanmanesh, M.; Abdollah-Pour, H.; Mohammadian-Semnani, H.; Shoja-Razavi, R. An empirical-statistical model for laser cladding of WC-12Co powder on AISI 321 stainless steel. Opt. Laser Technol. 2017, 97, 180–186. [Google Scholar] [CrossRef]
  9. Toyserkani, E.; Khajepour, A.; Corbin, S. 3-D finite element modeling of laser cladding by powder injection: Effects of laser pulse shaping on the process. Opt. Lasers Eng. 2004, 41, 849–867. [Google Scholar] [CrossRef]
  10. Paul, C.P.; Alemohammad, H.; Toyserkani, E.; Khajepour, A.; Corbin, S. Cladding of WC–12 Co on low carbon steel using a pulsed Nd:YAG laser. Mater. Sci. Eng. A 2007, 464, 170–176. [Google Scholar] [CrossRef]
  11. Erfanmanesh, M.; Shoja-Razavi, R.; Abdollah-Pour, H.; Mohammadian-Semnani, H. Influence of using electroless Ni-P coated WC-Co powder on laser cladding of stainless steel. Surf. Coat. Technol. 2018, 348, 41–54. [Google Scholar] [CrossRef]
  12. Pekkarinen, J.; Kujanpää, V.; Salminen, A. Laser cladding with scanning optics: Effect of power adjustment. J. Laser Appl. 2012, 24, 032003. [Google Scholar] [CrossRef]
  13. Toyserkani, E.; Khajepour, A.; Corbin, S.F. Laser Cladding, 1st ed.; CRC Press: Boca Raton, FL, USA, 2005. [Google Scholar] [CrossRef]
  14. Amine, T.; Newkirk, J.W.; Liou, F. An investigation of the effect of direct metal deposition parameters on the characteristics of the deposited layers. Case Stud. Therm. Eng. 2014, 3, 21–34. [Google Scholar] [CrossRef]
  15. Peng, L.; Taiping, Y.; Sheng, L.; Dongsheng, L.; Qianwu, H.; Weihao, X.; Xiaoyan, Z. Direct laser fabrication of nickel alloy samples. Int. J. Mach. Tools Manuf. 2005, 45, 1288–1294. [Google Scholar] [CrossRef]
  16. Wu, X.; Zhu, B.; Zeng, X.; Hu, X.; Cui, K. Critical state of laser cladding with powder auto-feeding. Surf. Coat. Technol. 1996, 79, 200–204. [Google Scholar] [CrossRef]
  17. Emamian, A.; Corbin, S.F.; Khajepour, A. Effect of laser cladding process parameters on clad quality and in-situ formed microstructure of Fe–TiC composite coatings. Surf. Coat. Technol. 2010, 205, 2007–2015. [Google Scholar] [CrossRef]
  18. Ya, W.; Pathiraj, B.; Liu, S. 2D modelling of clad geometry and resulting thermal cycles during laser cladding. J. Mater. Process. Technol. 2016, 230, 217–232. [Google Scholar] [CrossRef]
  19. Antony, K.; Arivazhagan, N. Studies on energy penetration and marangoni effect during laser melting process. J. Eng. Sci. Technol. 2015, 10, 509–525. [Google Scholar]
  20. Kumar, L.J.; Nair, C.G.K. Laser metal deposition repair applications for Inconel 718 alloy. Mater. Today Proc. 2017, 4, 11068–11077. [Google Scholar] [CrossRef]
  21. Corbin, S.F.; Toyserkani, E.; Khajepour, A. Cladding of an Fe-aluminide coating on mild steel using pulsed laser assisted powder deposition. Mater. Sci. Eng. A 2003, 354, 48–57. [Google Scholar] [CrossRef]
  22. Fu, F.; Zhang, Y.; Chang, G.; Dai, J. Analysis on the physical mechanism of laser cladding crack and its influence factors. Optik 2016, 127, 200–202. [Google Scholar] [CrossRef]
  23. Angelastro, A.; Campanelli, S.L.; Casalino, G.; Ludovico, A.D. Optimization of Ni-Based WC/Co/Cr Composite Coatings Produced by Multilayer Laser Cladding. Adv. Mater. Sci. Eng. 2013, 2013, 1–7. [Google Scholar] [CrossRef]
  24. Balla, V.K.; Bose, S.; Bandyopadhyay, A. Microstructure and wear properties of laser deposited WC–12%Co composites. Mater. Sci. Eng. A 2010, 527, 6677–6682. [Google Scholar] [CrossRef]
  25. Zhang, P.; Pang, Y.; Yu, M. Effects of WC Particle Types on the Microstructures and Properties of WC-Reinforced Ni60 Composite Coatings Produced by Laser Cladding. Metals 2019, 9, 583. [Google Scholar] [CrossRef]
  26. Yang, Y.; Man, H.C. Microstructure evolution of laser clad layers of W-C-Co alloy powders. Surf. Coat. Technol. 2000, 132, 130–136. [Google Scholar] [CrossRef]
  27. Zhou, C.; Zhao, S.; Wang, Y.; Liu, F.; Gao, W.; Lin, X. Mitigation of pores generation at overlapping zone during laser cladding. J. Mater. Process. Technol. 2015, 216, 369–374. [Google Scholar] [CrossRef]
  28. Costa, L.; Felde, I.; Réti, T.; Kálazi, Z.; Colaço, R.; Vilar, R.; Verő, B. A Simplified Semi-Empirical Method to Select the Processing Parameters for Laser Clad Coatings. Mater. Sci. Forum 2003, 414–415, 385–394. [Google Scholar] [CrossRef]
  29. Zhou, S.; Zeng, X. Growth characteristics and mechanism of carbides precipitated in WC–Fe composite coatings by laser induction hybrid rapid cladding. J. Alloys Compd. 2010, 505, 685–691. [Google Scholar] [CrossRef]
  30. Morton, C.W.; Wills, D.J.; Stjernberg, K. The temperature ranges for maximum effectiveness of grain growth inhibitors in WC–Co alloys. Int. J. Refract. Met. Hard Mater. 2005, 23, 287–293. [Google Scholar] [CrossRef]
  31. Wang, X.; Fang, Z.Z.; Sohn, H.Y. Grain growth during the early stage of sintering of nanosized WC–Co powder. Int. J. Refract. Met. Hard Mater. 2008, 26, 232–241. [Google Scholar] [CrossRef]
  32. Kumar, V.; Fang, Z.Z.; Wright, S.I.; Nowell, M.M. An Analysis of Grain Boundaries and Grain Growth in Cemented Tungsten Carbide Using Orientation Imaging Microscopy. Metall. Mater. Trans. A 2006, 37, 599–607. [Google Scholar] [CrossRef]
  33. Borgh, I.; Hedström, P.; Persson, T.; Norgren, S.; Borgenstam, A.; Ågren, J.; Odqvist, J. Microstructure, grain size distribution and grain shape in WC–Co alloys sintered at different carbon activities. Int. J. Refract. Met. Hard Mater. 2014, 43, 205–211. [Google Scholar] [CrossRef]
  34. Warren, R.; Waldron, M.B. Microstructural Development During the Liquid-Phase Sintering of Cemented Carbides, I. Wettability and Graing Contact. Symp. Role Surf. Prop. Powder Metall. 1972, 15, 166–201. [Google Scholar] [CrossRef]
  35. Fang, Z.; Maheshwari, P.; Wang, X.; Sohn, H.Y.; Griffo, A.; Riley, R. An experimental study of the sintering of nanocrystalline WC–Co powders. Int. J. Refract. Met. Hard Mater. 2005, 23, 249–257. [Google Scholar] [CrossRef]
  36. Kishino, J.; Nomura, H.; Shin, S.G.; Matsubara, H.; Tanase, T. Computational study on grain growth in cemented carbides. Int. J. Refract. Met. Hard Mater. 2002, 20, 31–40. [Google Scholar] [CrossRef]
  37. Lee, H.R.; Kim, D.J.; Hwang, N.M.; Kim, D.Y. Role of Vanadium Carbide Additive during Sinteing of WC-Co: Mechanism of Grain Growth Inhibition. J. Am. Ceram. Soc. 2003, 86, 152–154. [Google Scholar] [CrossRef]
  38. Zhong, Y.; Zhu, H.; Shaw, L.L.; Ramprasad, R. The equilibrium morphology of WC particles—A combined ab initio and experimental study. Acta Mater. 2011, 59, 3748–3757. [Google Scholar] [CrossRef]
  39. Gu, D.D.; Meiners, W.; Wissenbach, K.; Poprawe, R. Laser additive manufacturing of metallic components: Materials, processes and mechanisms. Int. Mater. Rev. 2013, 57, 133–164. [Google Scholar] [CrossRef]
  40. Zhong, M.; Liu, W. Laser surface cladding: The state of the art and challenges. Proc. Inst. Mech. Eng. Part C J. Mech. Eng. Sci. 2010, 224, 1041–1060. [Google Scholar] [CrossRef]
Figure 1. Experimental setup for the laser cladding process.
Metals 09 01245 g001
Figure 2. Influence of average energy per unit area (Ea) on (a) porosity content, and (b) dilution.
Metals 09 01245 g002
Figure 3. Cross-section macrographs of single-cladding samples: (a) Ea24, (b) Ea32 and (c) Ea39, (d) schematic indicating various regions within the single-cladding.
Metals 09 01245 g003
Figure 4. (a) Representative microstructure of the interface region; EDS mapping concentration for (b) Fe, (c) Co, (d) Cr and (e) W, for sample Ea39.
Metals 09 01245 g004
Figure 5. Outer region (a) representative microstructure. EDS mapping concentration for (b) W, (c) Co and (d) Cr.
Metals 09 01245 g005
Figure 6. XRD patterns of the powder feedstock and the laser cladding samples deposited using different average energy.
Metals 09 01245 g006
Figure 7. Microhardness profile of the clad for Ea24, Ea32, and Ea39.
Metals 09 01245 g007
Figure 8. Microstructure at the inner region for Ea conditions (a) Ea24, (b) Ea32 and (c) Ea39. Distribution frequency WC particle size (d) Ea24, (e) Ea32 and (f) Ea39.
Metals 09 01245 g008
Figure 9. (a) WC coalescence at the inner region for Ea39, (b) higher magnification image taken from the marked rectangle in (a).
Metals 09 01245 g009
Figure 10. Sequence of WC grain growth (a) powder feedstock, (b) Ea24, (c) Ea32 and (d) Ea39.
Metals 09 01245 g010
Table 1. Yb: YAG Laser operational parameters and calculated average energy per unit area.
Sample IDLaser Energy Per Pulse (J)Scan Speed (mm/s)Powder Feed Rate (g/s)Shielding Gas Flow (L/min)Carrier Gas Flow (L/min)Ea (J/mm2)
Ea2418100.42201824
Ea3224100.42201832
Ea3930100.42201839