Article

A Phenomenological Mechanical Material Model for Precipitation Hardening Aluminium Alloys

1
Chair of Materials Science, Faculty of Mechanical Engineering and Marine Technology, University of Rostock, 18059 Rostock, Germany
2
Competence Centre CALOR, Department Life, Light & Matter, Faculty of Interdisciplinary Research, University of Rostock, 18059 Rostock, Germany
*
Author to whom correspondence should be addressed.
Metals 2019, 9(11), 1165; https://doi.org/10.3390/met9111165
Submission received: 25 September 2019 / Revised: 14 October 2019 / Accepted: 21 October 2019 / Published: 29 October 2019
(This article belongs to the Special Issue Numerical Modelling and Simulation of Metal Processing)

Abstract

:
Age hardening aluminium alloys obtain their strength by forming precipitates. This precipitation-hardened state is often the initial condition for short-term heat treatments, like welding processes or local laser heat treatment to produce tailored heat-treated profiles (THTP). During these heat treatments, the strength-increasing precipitates are dissolved depending on the maximum temperature and the material is softened in these areas. Depending on the temperature path, the mechanical properties differ between heating and cooling at the same temperature. To model this behavior, a phenomenological material model was developed based on the dissolution characteristics and experimental flow curves were developed depending on the current temperature and the maximum temperature. The dissolution characteristics were analyzed by calorimetry. The mechanical properties at different temperatures and peak temperatures were recorded by thermomechanical analysis. The usual phase transformation equations in the Finite Element Method (FEM) code, which were developed for phase transformation in steels, were used to develop a phenomenological model for the mechanical properties as a function of the relevant heat treatment parameters. This material model was implemented for aluminium alloy 6060 T4 in the finite element software LS-DYNA (Livermore Software Technology Corporation).

1. Introduction

Heat treatments are used to influence the mechanical properties of metallic materials. The material properties during and after heat treatment are dependent on different heat treatment parameters. Numerical heat treatment simulation offers the possibility of predicting process results, such as temperature gradients, mechanical properties, residual stress or distortion, in the heat-treated component. By using numerical simulation, process understanding can be further improved by simulating intermediate states, which are very difficult or impossible to measure experimentally. At the same time, the experimental effort for optimizing process parameters can be reduced by numerical simulation.
Precipitation-hardening aluminium alloys achieve their strengths through fine particles in the aluminium matrix. Different stable and metastable secondary phases can be formed or dissolved as a function of the temperature during the short-term heat treatment of precipitation-hardened states. Thus, the precipitation state, and therefore, the mechanical properties, change during short-term heat treatment. In heat treatment simulation, modelling the quenching of steels [1,2,3,4] and aluminium alloys [5,6,7,8] has been the subject of intensive research and is now used in many industrial applications [9]. In addition, numerical descriptions of the heat treatment processes are also used to simulate various manufacturing processes such as welding steels [10], aluminium alloys [11] or induction hardening [12]. Heat treatment simulation of the short-time heat treatments used for tailored heat-treating blanks (THTB) [13,14] and profiles (THTP) for aluminium has not yet been performed. These short-term heat treatments, which locally heat material areas using a laser, are characterized by very high heating rates of several 100 Ks−1, almost no soaking at peak temperature and subsequent cooling at a few 10 Ks−1. These short-term heat treatments can be used to intentionally soften local areas of semi-finished components and, thus, create a tailored strength layout. By tailoring the strength layout, the forming limits can be extended for subsequent forming. To further advance the development of THTP, a linked heat treatment and bending simulation can be used.
The mechanical properties of an aluminium alloy during a short-time heat treatment depend on the current temperature and the maximum heat treatment temperature. As a result, the mechanical properties during heating differ from those during cooling [15]. Currently, there is no material model for the mechanical properties of aluminium alloys depending on temperature and temperature path. For steels, this problem is solved using the mixture rules of different coarse phases like ferrite, pearlite, austenite, martensite, bainite, etc. [16]. For precipitation-hardened aluminium alloys with fine precipitates, this approach does not work at first glance. For aluminium alloys, some material models have also been developed. However, these are designed for special areas such as quench simulation [5,6,7] or ageing simulation [17,18]. However, these quench simulation material models can provide only temperature-dependent flow curves, while the ageing models only describe the change in mechanical properties during ageing. The mechanical properties as a function of the relevant parameters during short-time heat treatment cannot provide both types of models. Material models were also developed for producing tailored heat-treated semi-finished products [13,14]. However, these material models were developed for forming simulations and provide the mechanical properties at room temperature depending on the maximum temperature during heat treatment. The mechanical properties at elevated temperatures, as required in a heat treatment simulation, cannot be provided.
In this work, an efficient phenomenological material model is developed, which is based on the mixture rules of imaginary phases. Empirical-phenomenological model approaches provide simple descriptions of the material behavior as a function of the process parameters.

2. Materials and Methods

2.1. Examined Aluminium Alloy
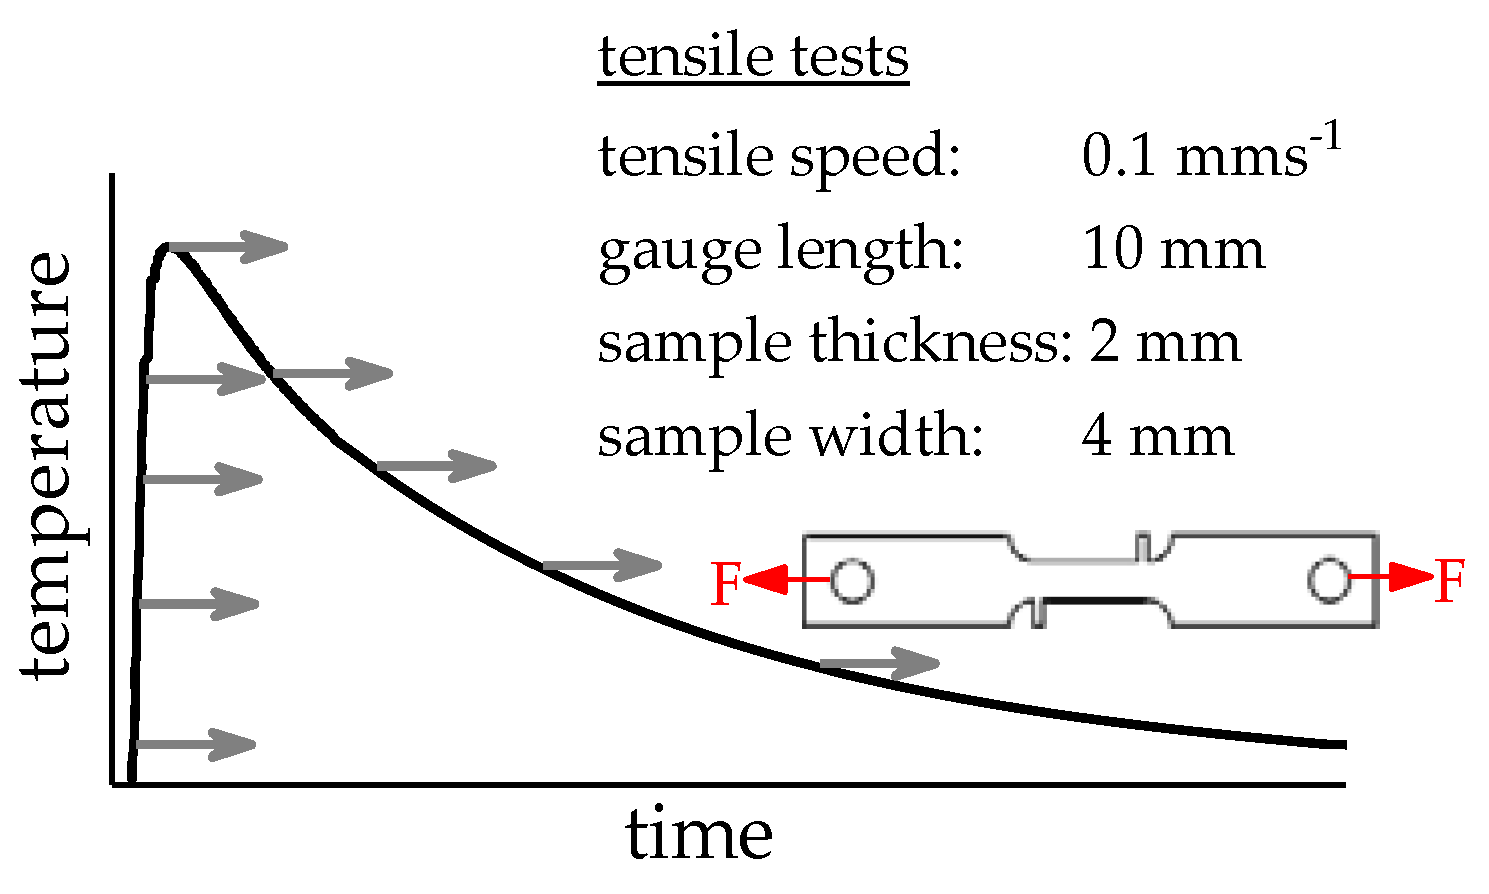
The material model was developed using the precipitation hardening aluminium alloy EN AW-6060 in the natural aged state (T4). As a base material, a 20 mm × 20 mm × 2 mm hollow quadratic extrusion profile was used. The chemical composition of the investigated alloy is given in Table 1.

2.2. Database Used

The precipitation and dissolution behavior of the alloy was recorded in previous work by direct [19] and indirect [20] differential scanning calorimetry (DSC) over a wide range of heating rates. The continuous time-temperature dissolution diagram of the alloy EN AW-6060 T4 can be derived from the DSC results. This diagram shows the temperature ranges at which a certain precipitation or dissolution reaction dominates depending on the heating rate. Figure 1 shows the continuous time-temperature dissolution diagram of the investigated alloy, EN AW-6060 T4.
Figure 2 shows a DSC heating curve at 1 Ks−1, together with 0.2% yield strength and tensile strength after heating tensile specimens to different maximum temperatures followed by overcritical quenching [21]. The results indicate that the endothermic peak B, which is interpreted as the dissolution of clusters and GP-Zones [22], is accompanied by a significant decrease in strength. The exothermic peak c + d, which is considered to be the precipitation of the β’’ and β’ phases [23], leads to a renewed increase in strength. The subsequent endothermic peak E, is considered to be the dissolution of the β’’ and β’ precipitates [24], with further material softening.
Short-term laser heat treatment, as well as recording time-temperature profiles, was carried out at the Institute of Manufacturing Technology of the University of Erlangen-Nürnberg [25]. Laser heat treatment is characterized by a high heating rate of up to several 100 Ks−1, with no soaking at the maximum temperature and a relatively slow, non-linear, cooling with a few 10 Ks−1. The investigated time-temperature courses are shown in Figure 3.
These time-temperature profiles were imitated in a quenching and deformation dilatometer, interrupted at defined temperatures and tensile tests were carried out immediately at these temperatures in the same device [15]. The schematic measurement plan of the thermo-mechanical analysis, with the major parameters of the tensile test, is shown in Figure 4.
It can be seen in Figure 5 that the strength of the alloy decreases during heating with increasing temperature. During subsequent cooling, the strength increases again with decreasing temperature. The mechanical properties during heat treatment with a 180 °C maximum temperature are identical during heating and cooling and only dependent on temperature, as shown in Figure 5A. Up to this temperature, no permanent softening of the material has taken place. In short-term heat treatment with a 250 °C maximum temperature, the strength during cooling does not increase to the same extent as it decreased during heating. The mechanical properties at a certain temperature are, therefore, not identical during heating and cooling, as shown in Figure 5B. The same behavior is evident in the short-term heat treatments at 300 °C and 400 °C maximum temperatures, as seen in Figure 5C,D. For a purposeful simulation of short-term heat treatment, these mechanical properties dependencies must be implemented in a material model.

3. Material Model Development
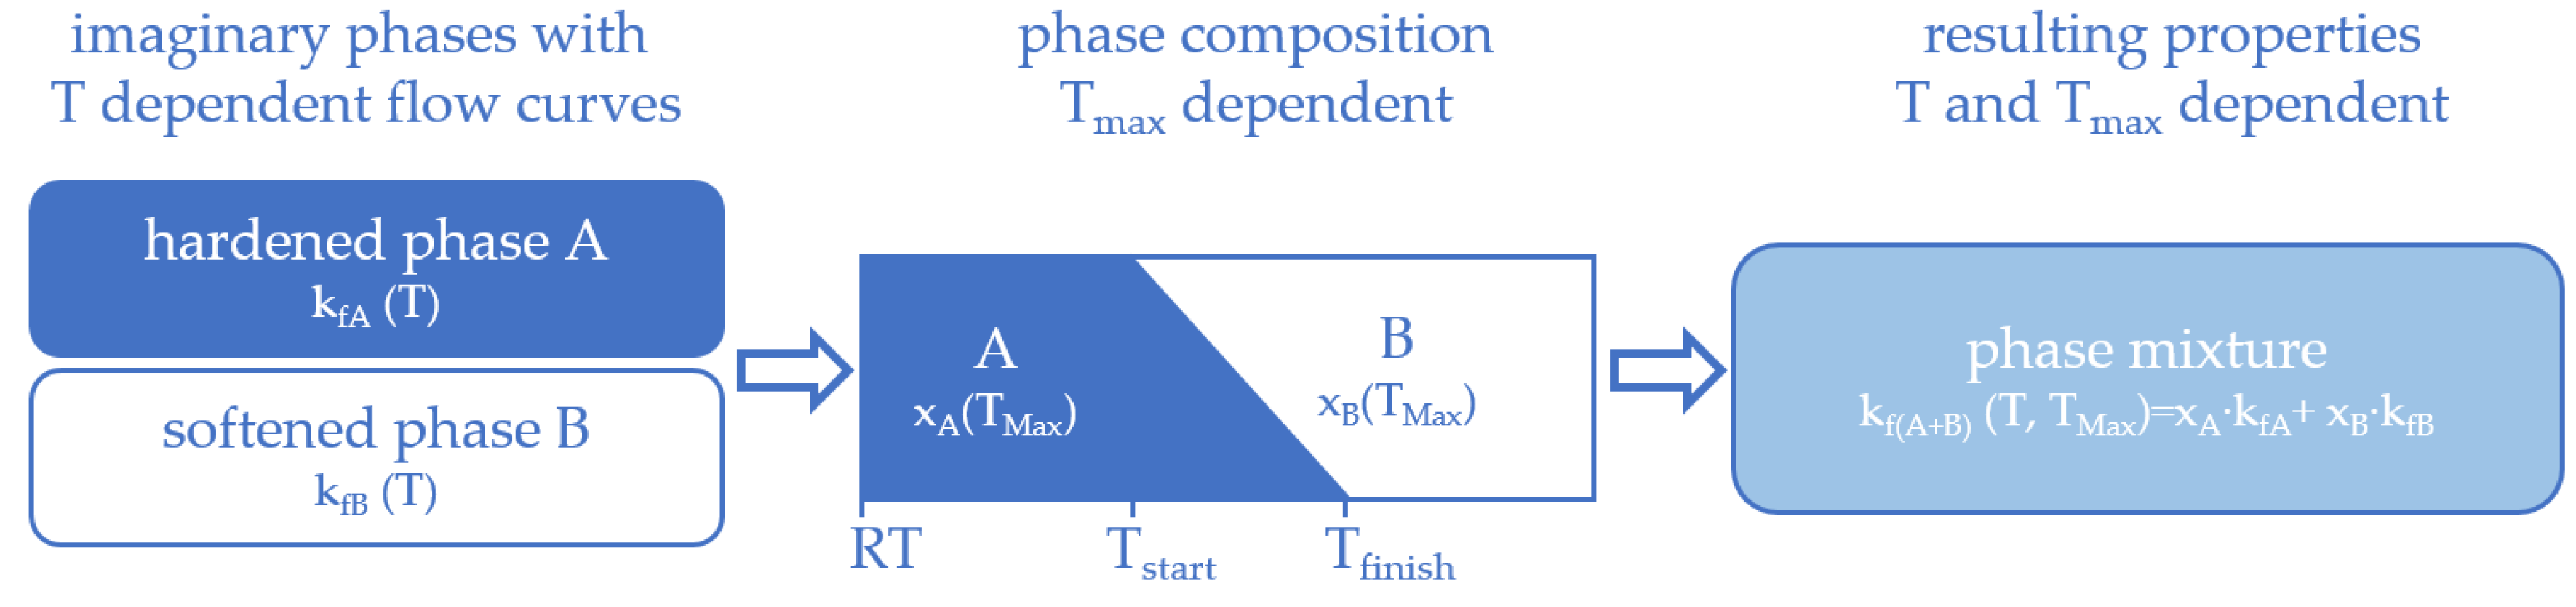
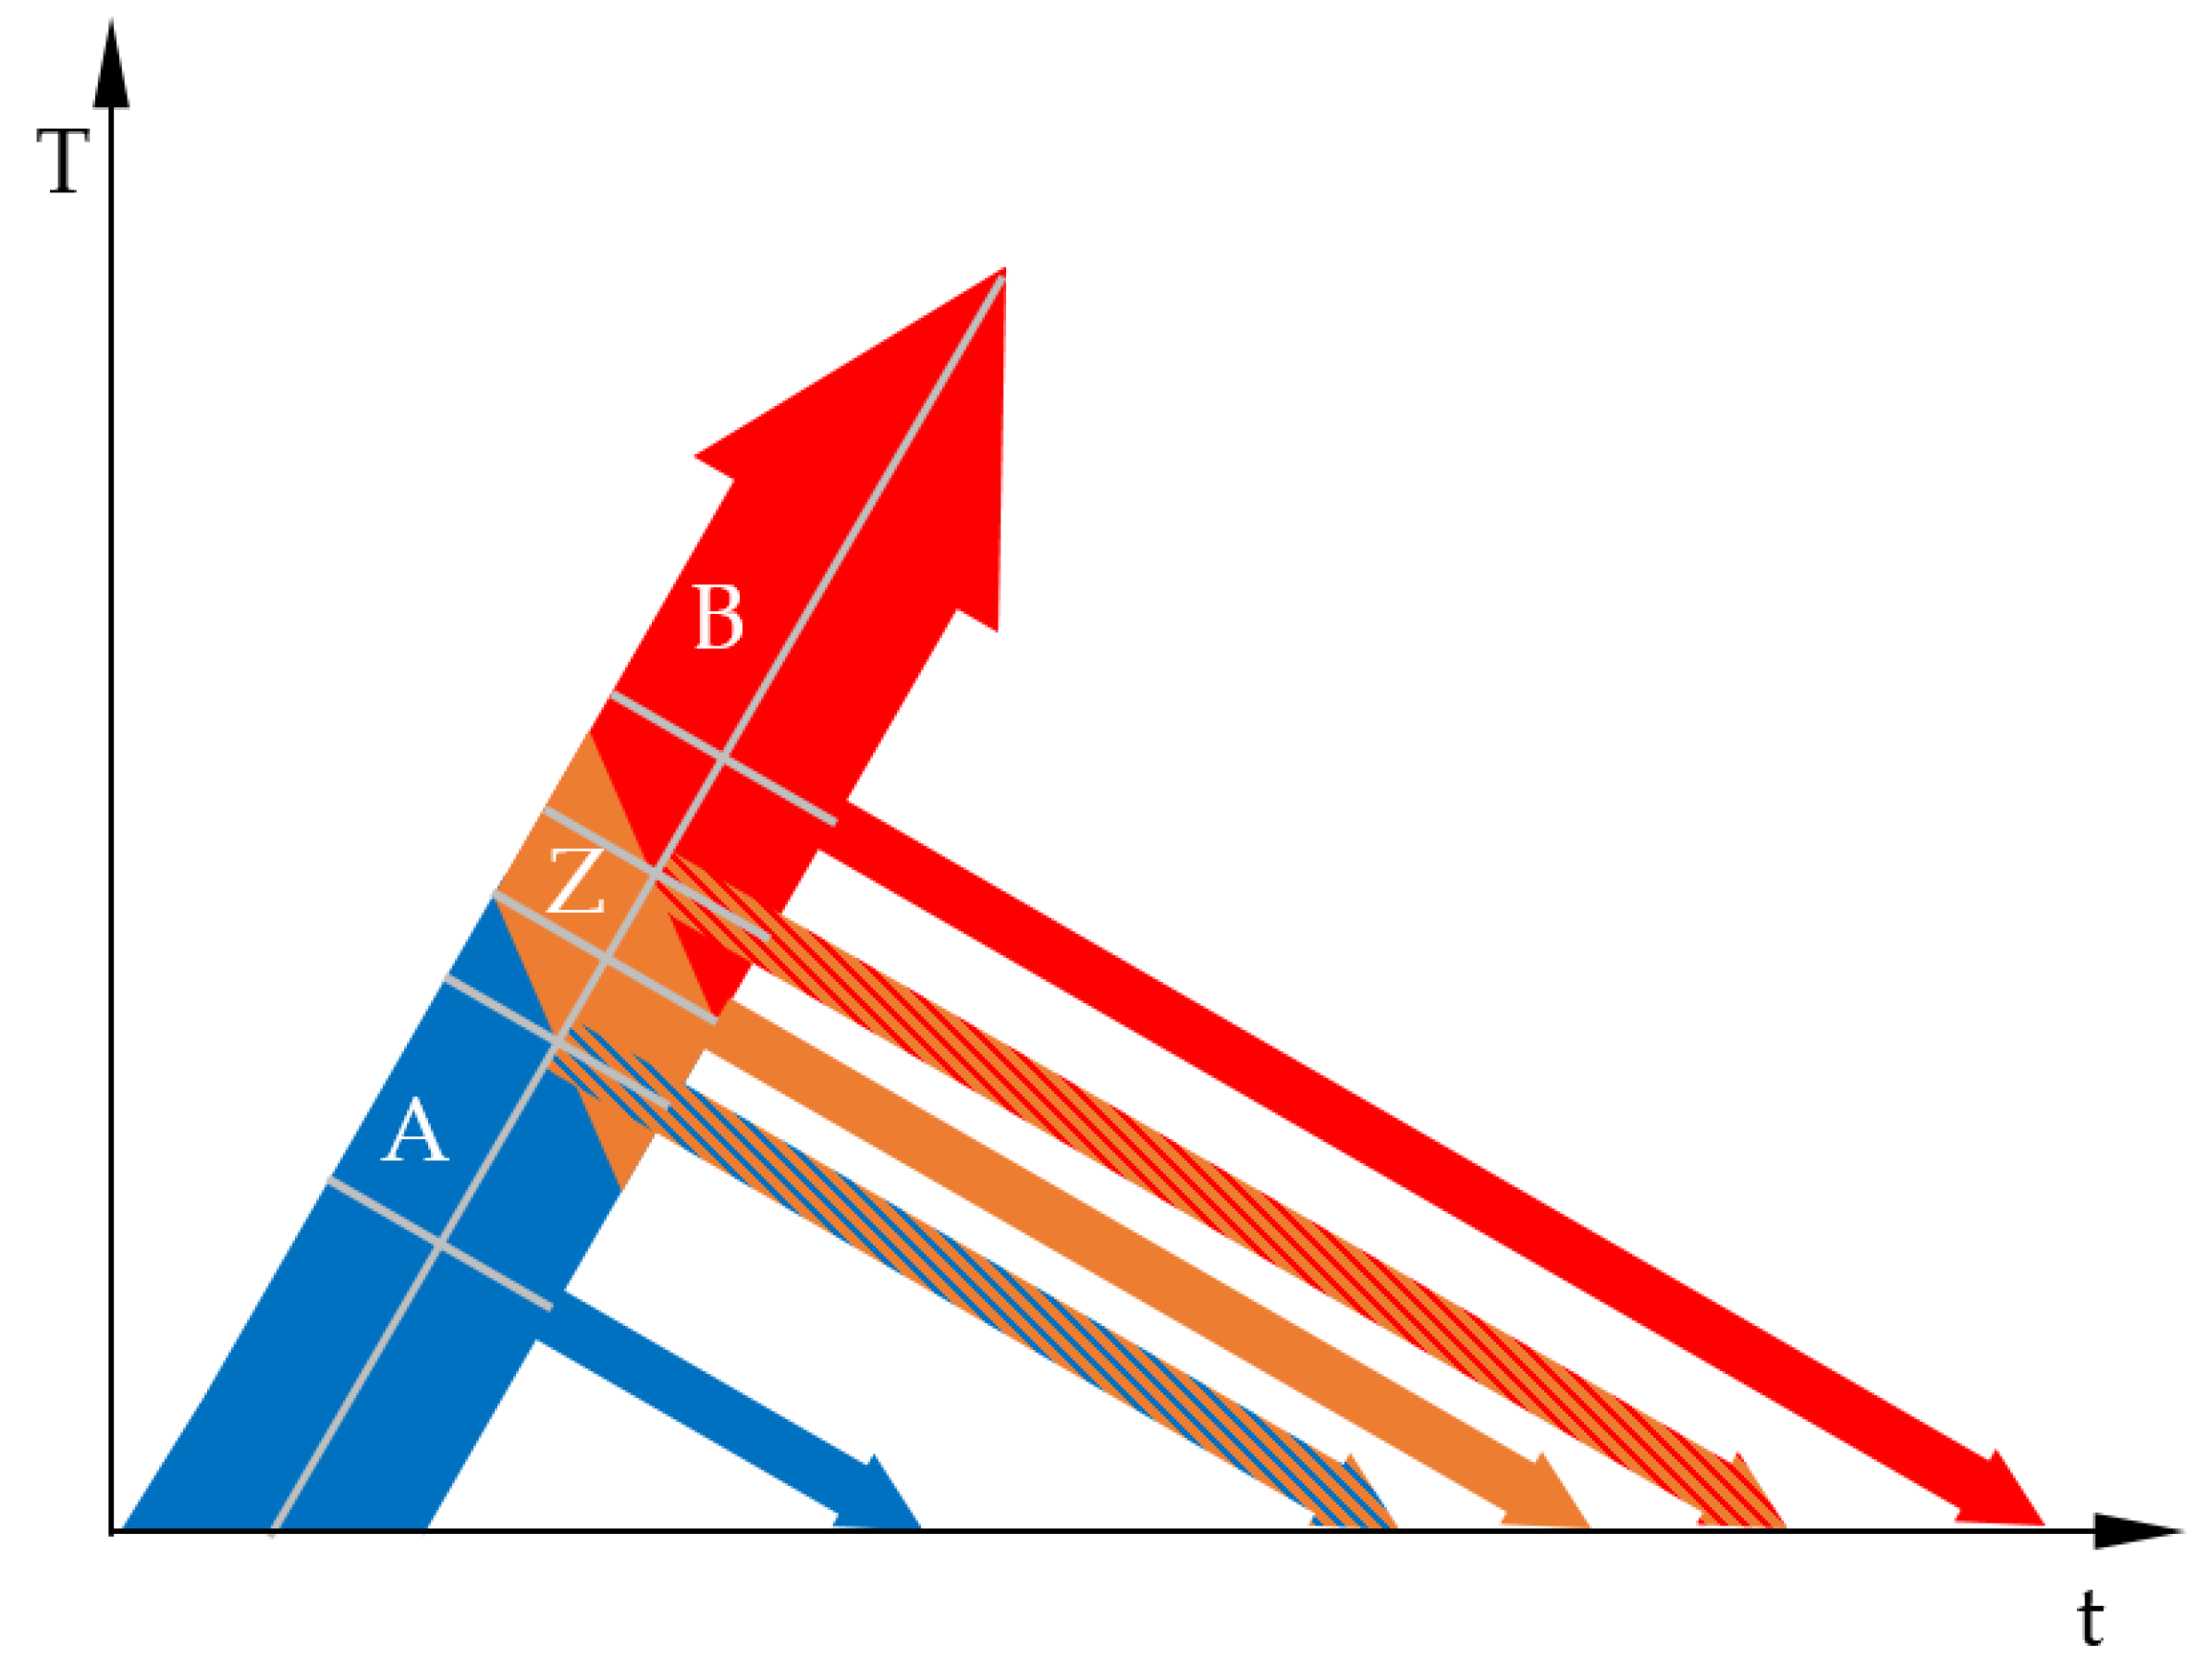
3.1. The Basic Idea

We developed a phenomenological mechanical material model for precipitation hardening aluminium alloys, which can describe flow curves as a function of the actual temperature and the peak temperature of the heat treatment. The basic idea was to define the precipitation-hardened initial state as an imaginary hardened phase (A) and the state in which the strength-increasing precipitates were dissolved as an imaginary softened phase (B). These individual phases can be assigned temperature-dependent flow curves.
From a defined starting temperature (Tstart), the imaginary hardened phase (A) is transformed into the imaginary softened phase (B) as a function of the temperature during heating. This transformation is completed at a defined finish temperature (Tfinish). At temperatures between the start and finish temperature, a phase mixture of an imaginary hardened and an imaginary softened phase exists, as shown in Figure 6. At temperatures above the final temperature, the material consists of the softened phase (B). Through developing the material model, it has been found that the accuracy of the model can be increased by introducing an intermediate phase (Z) between the hardened phase (A) and the softened phase (B), see Figure 7. During cooling, no phase transformations are permitted. The resulting mechanical properties of the material state are defined by linearly mixing the mechanical properties of the occurring phases. The schematic of the implemented phase transformation during heat treatment is shown in Figure 7.
The following simplifications are assumed in the model:
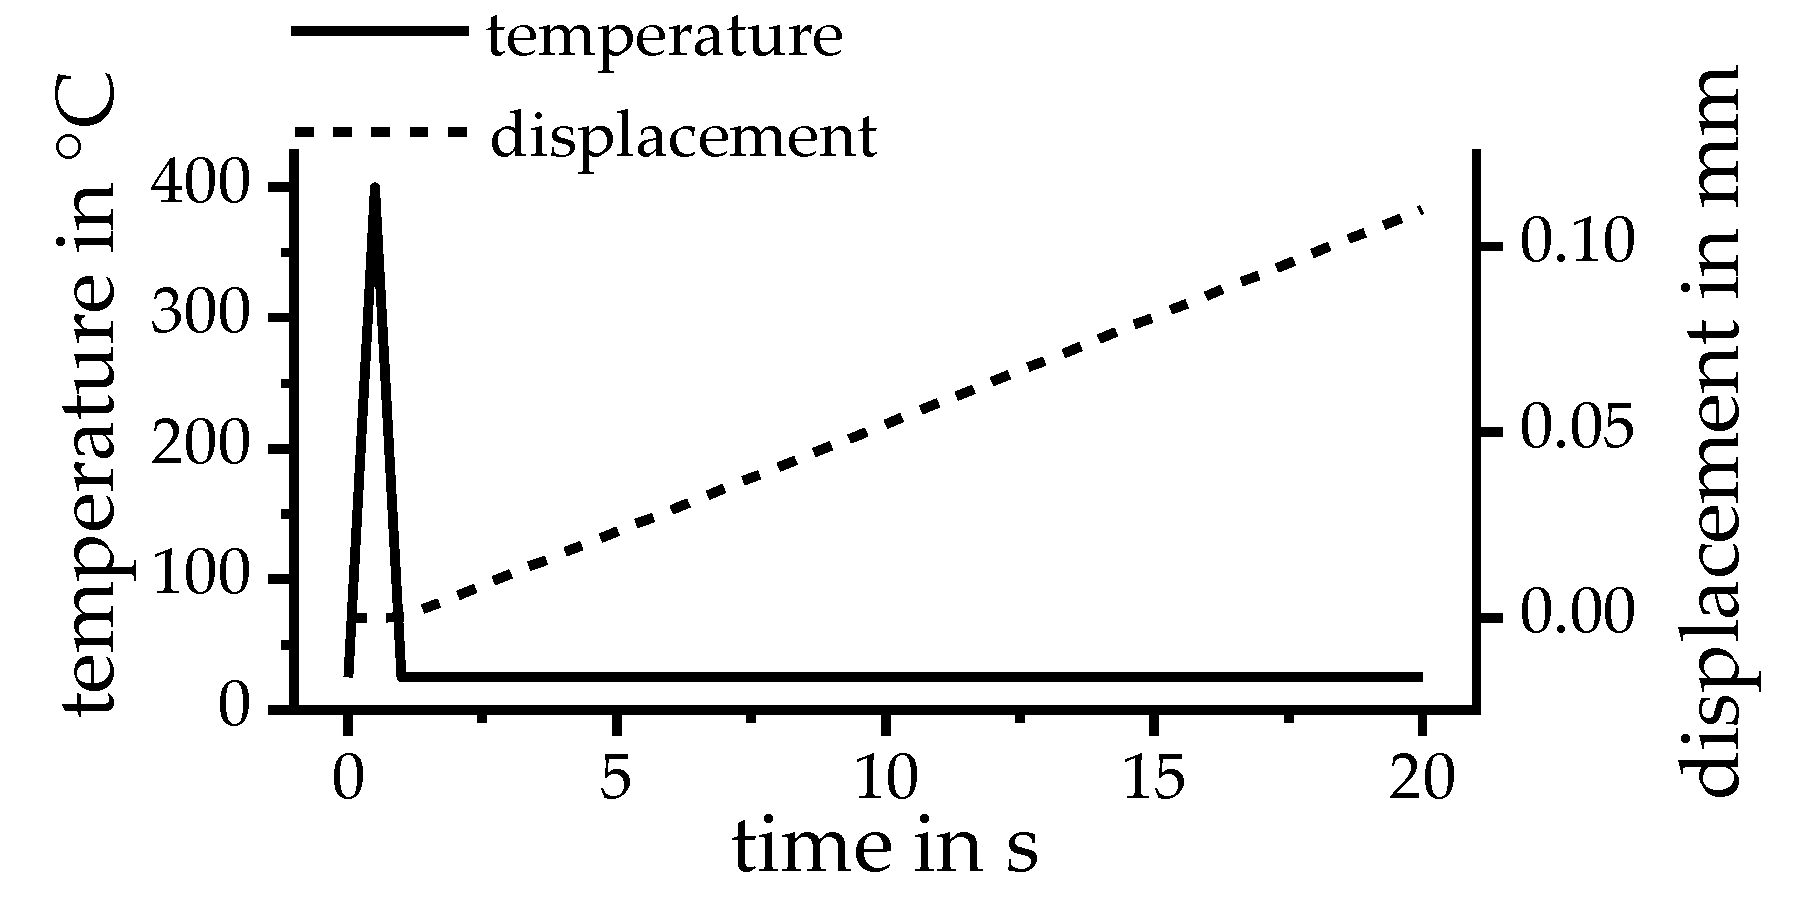
  • The influence of the heating and cooling rate was not considered. Typical heating and cooling rates for short-term laser heat treatment were chosen.
  • During cooling, no precipitation reaction took place. This assumption is realistic, as the critical cooling rate of alloy 6060 is far below the cooling rates of short-term laser heat treatment.
  • Quenching followed directly after reaching the maximum temperature. There was no isothermal soaking.
  • The influence of the strain rate on the mechanical properties was not considered.
  • The maximum plastic strains were 10%.
  • The influence of ageing after short-time heat treatment was not considered. The model was valid for the as-quenched state.

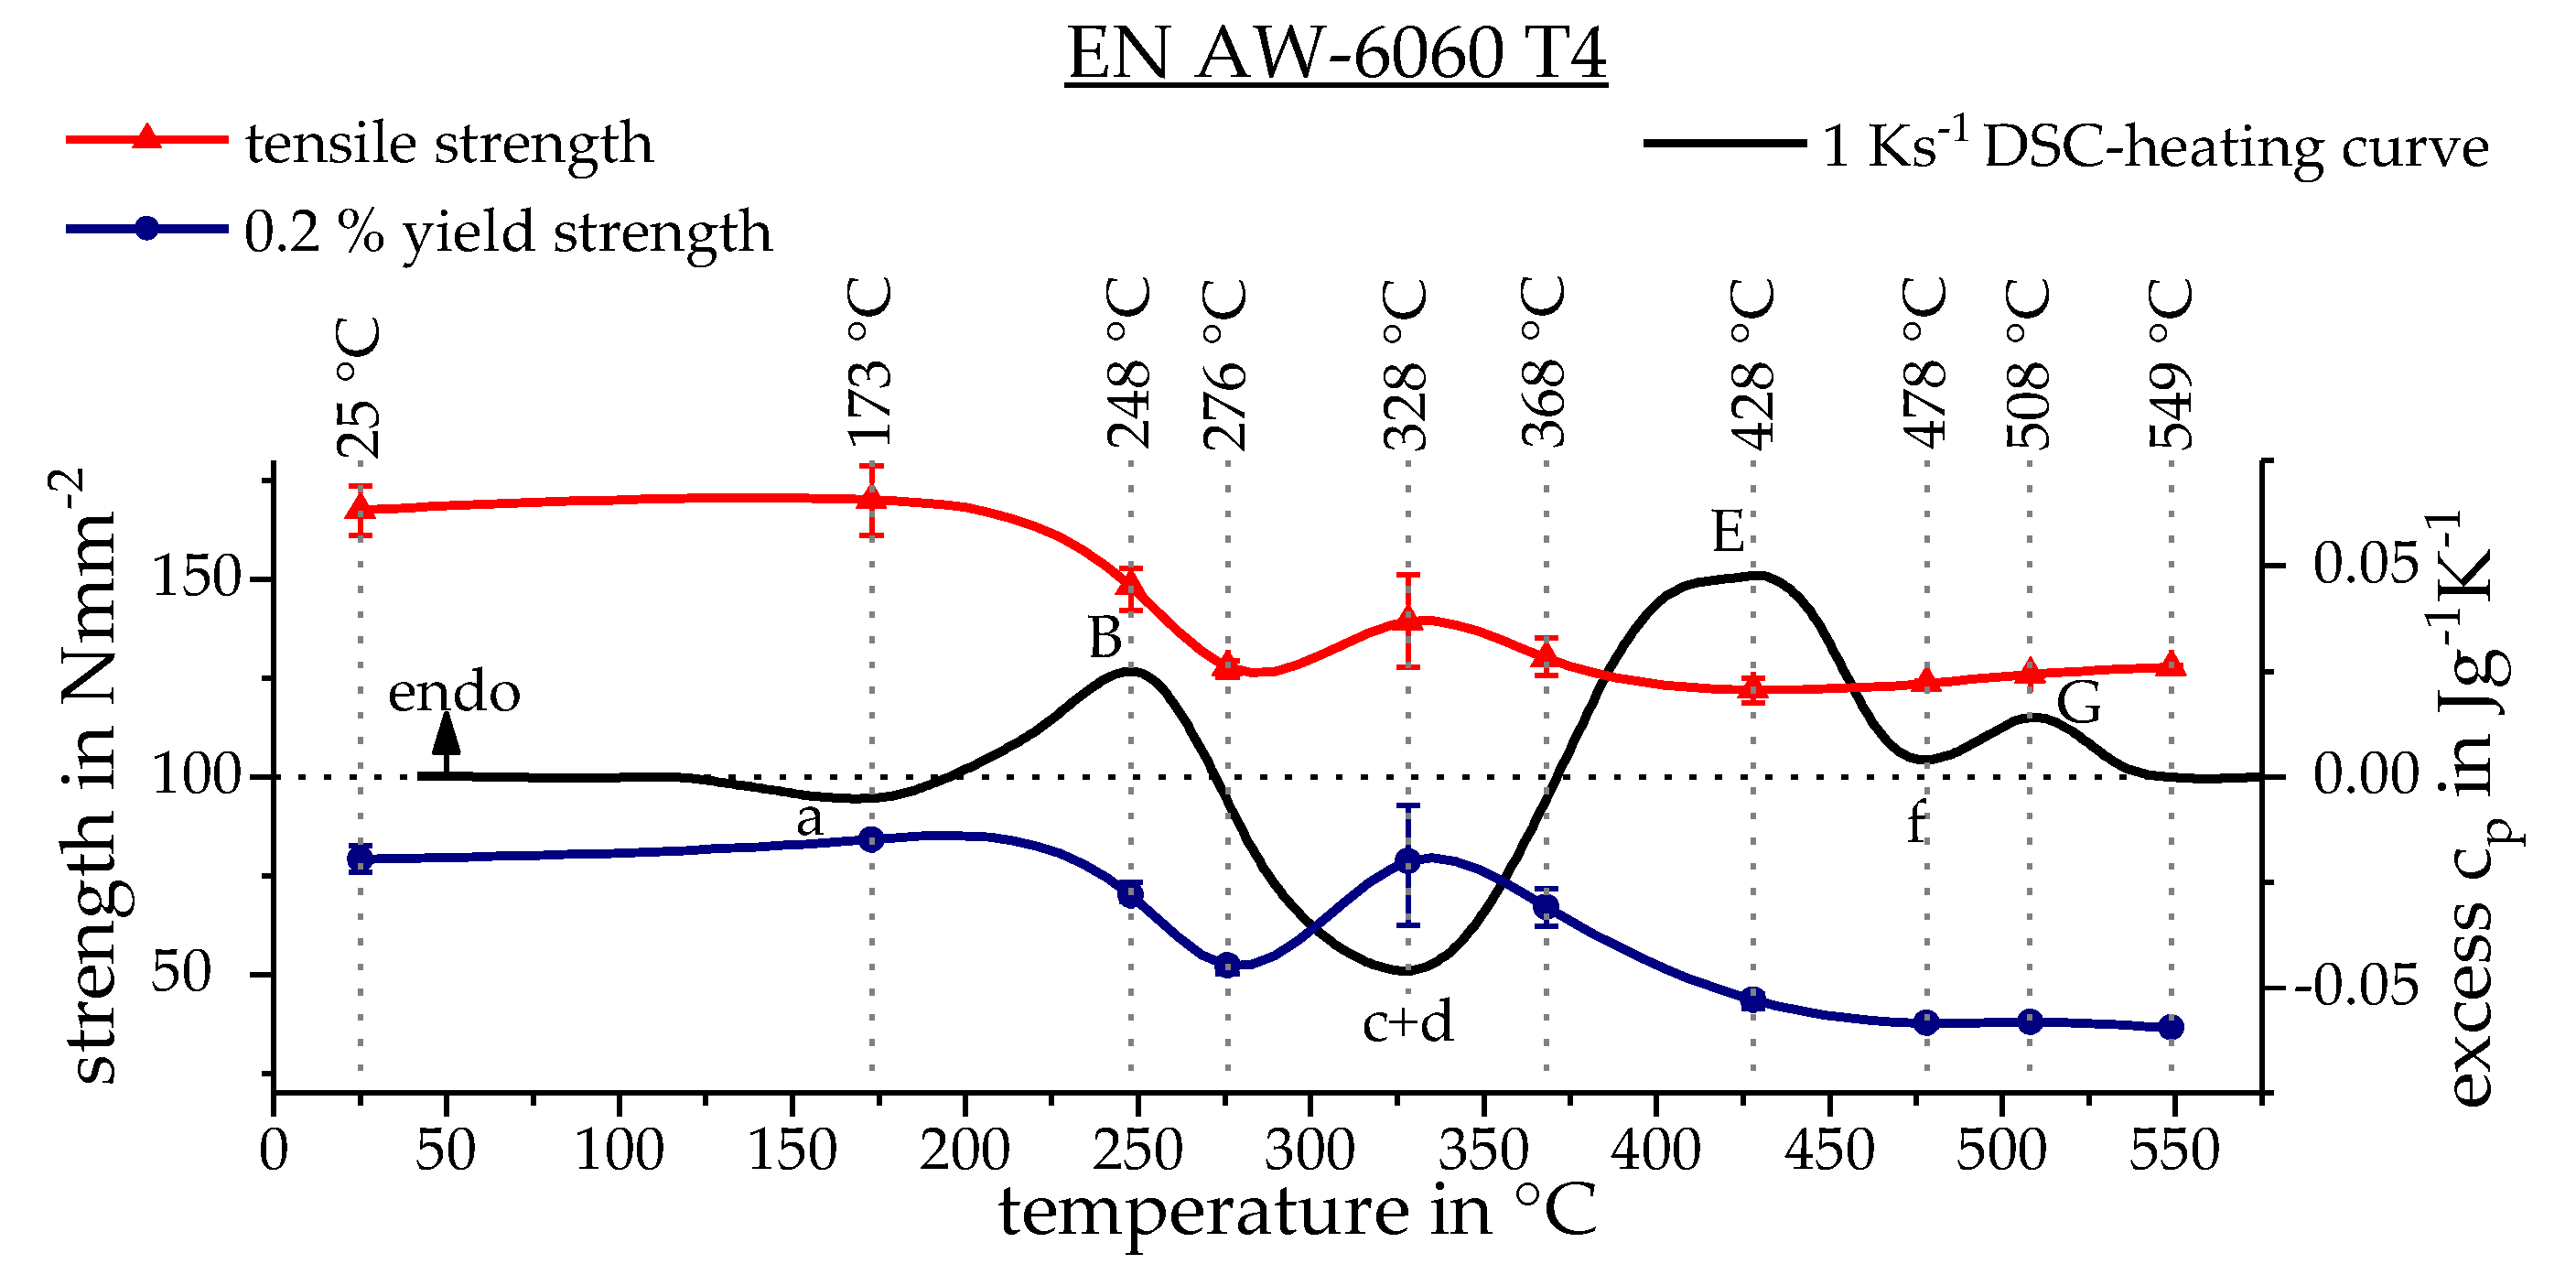
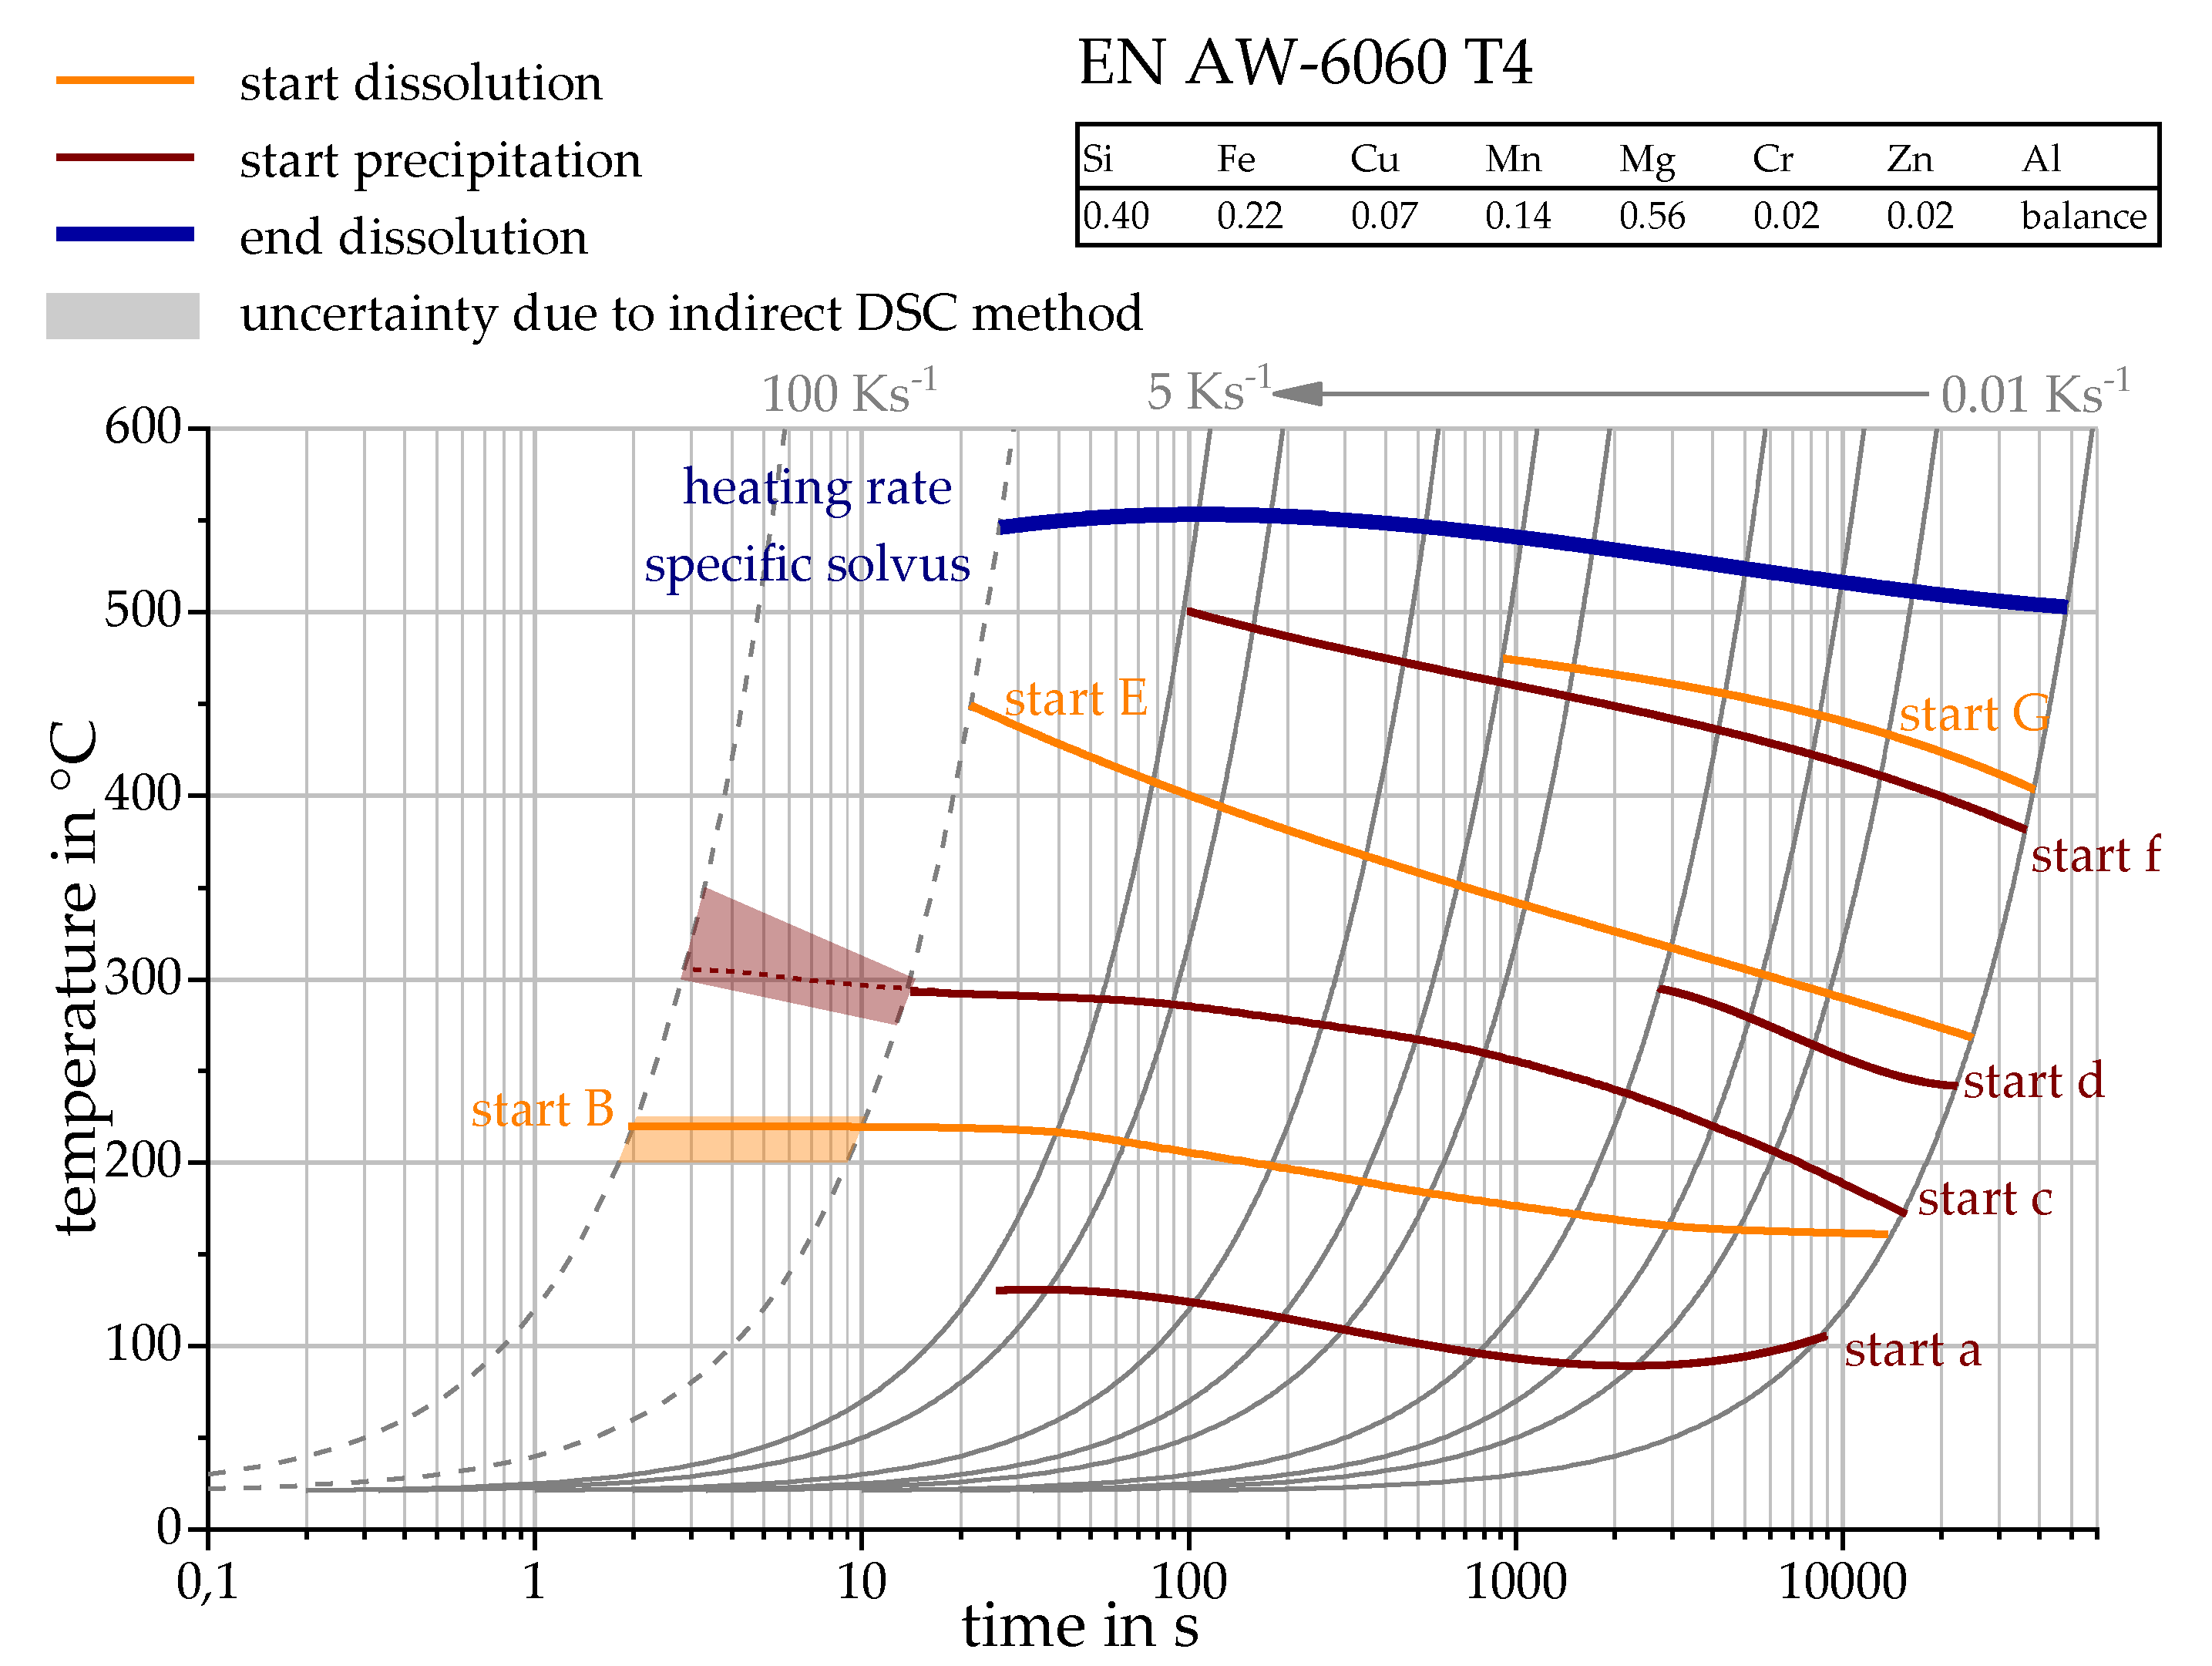
3.2. Determination of the Phase Transformation Temperatures

To adapt the material model to the investigated alloy, the phase transformation temperature ranges must be determined. This was performed based on the continuous heating dissolution diagram (Figure 1) and mechanical results (Figure 5). Figure 5A shows that the mechanical properties of the heating and cooling step did not differ for short-term heat treatment up to a peak temperature of 180 °C. Figure 1 shows that the clusters and GP-zones of the initial state start to dissolve between 200 °C and 225 °C at a high heating rate of 100 Ks−1. Thus, it was determined that the imaginary hardened phase (A) was completely present up to a maximum temperature of 212.5 °C. At higher temperatures, phase (A) continuously transformed into the intermediate phase (Z). At a maximum temperature of 250 °C, the material consisted only of the imaginary intermediate phase (Z). It can be seen in Figure 1 that at a heating rate of 100 Ks−1, the dissolution of the cluster and GP-zones was completed at 300 °C. This is also reflected in the mechanical properties, as shown in Figure 5C,D. For this reason, it is assumed that the simulated phase transformation Z to B is completed at 300 °C. The properties above this peak temperature are described by phase (B). Figure 8 shows the implemented temperature transformation ranges of the imaginary phases.

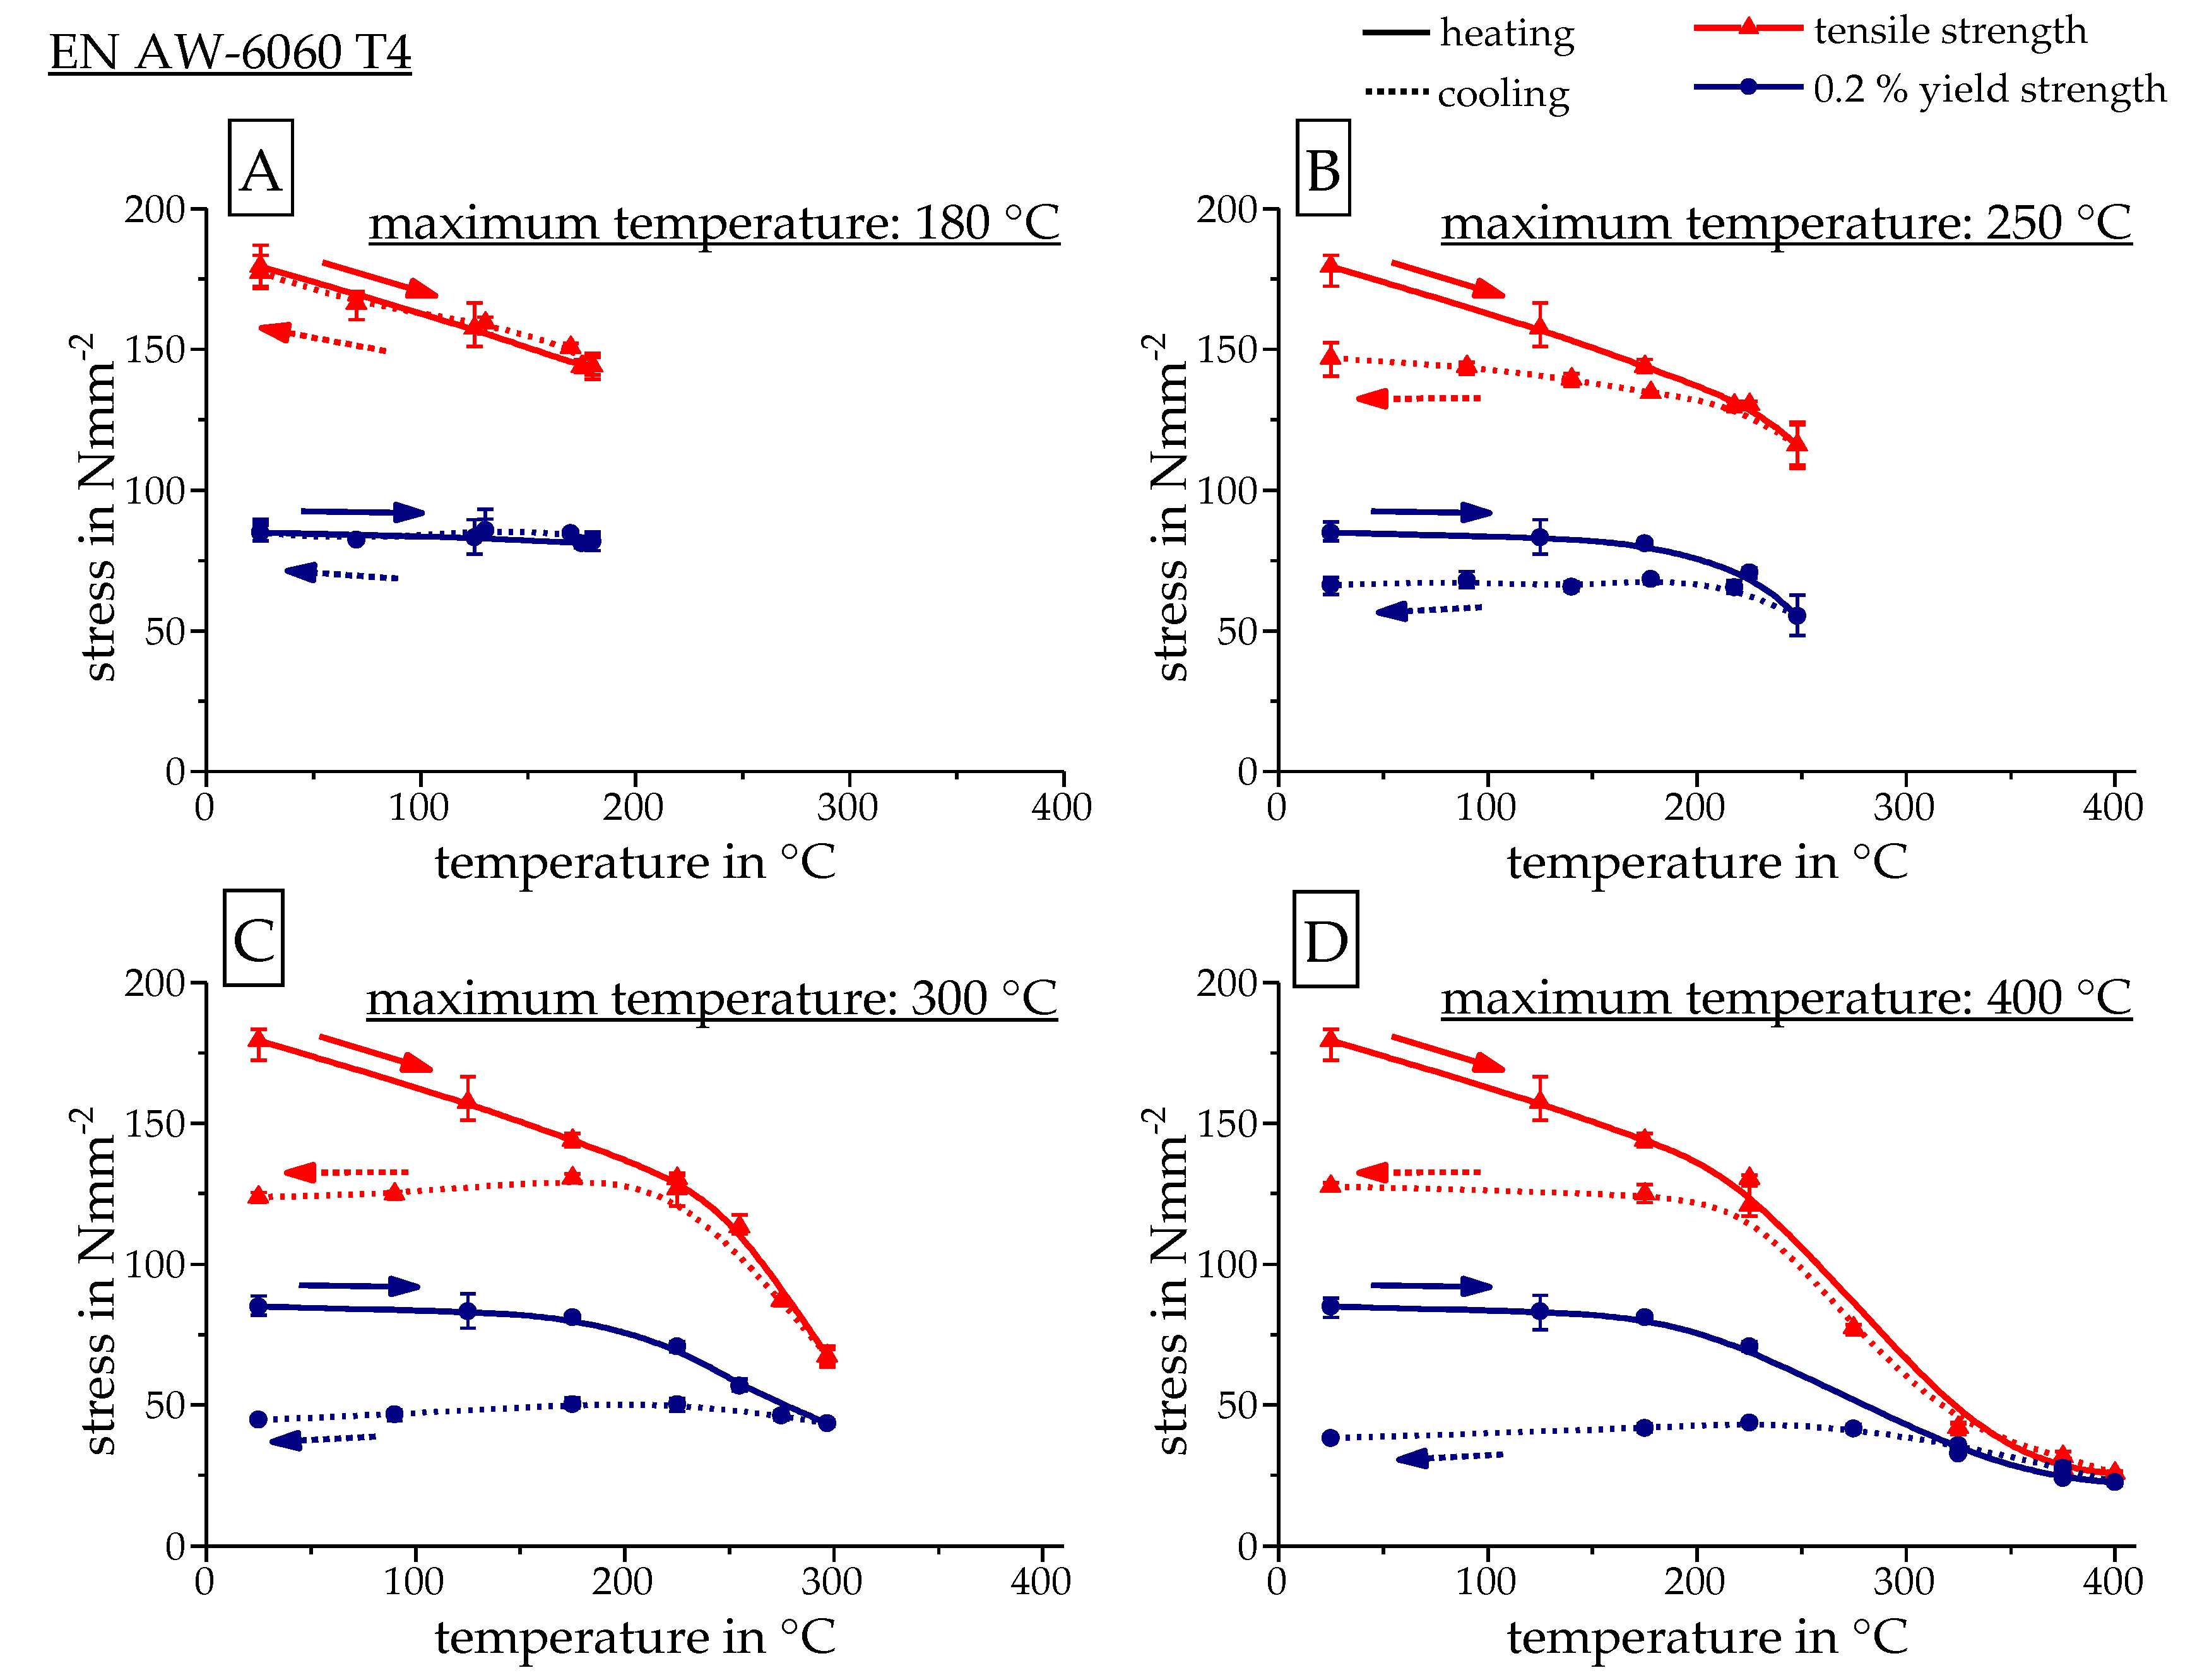
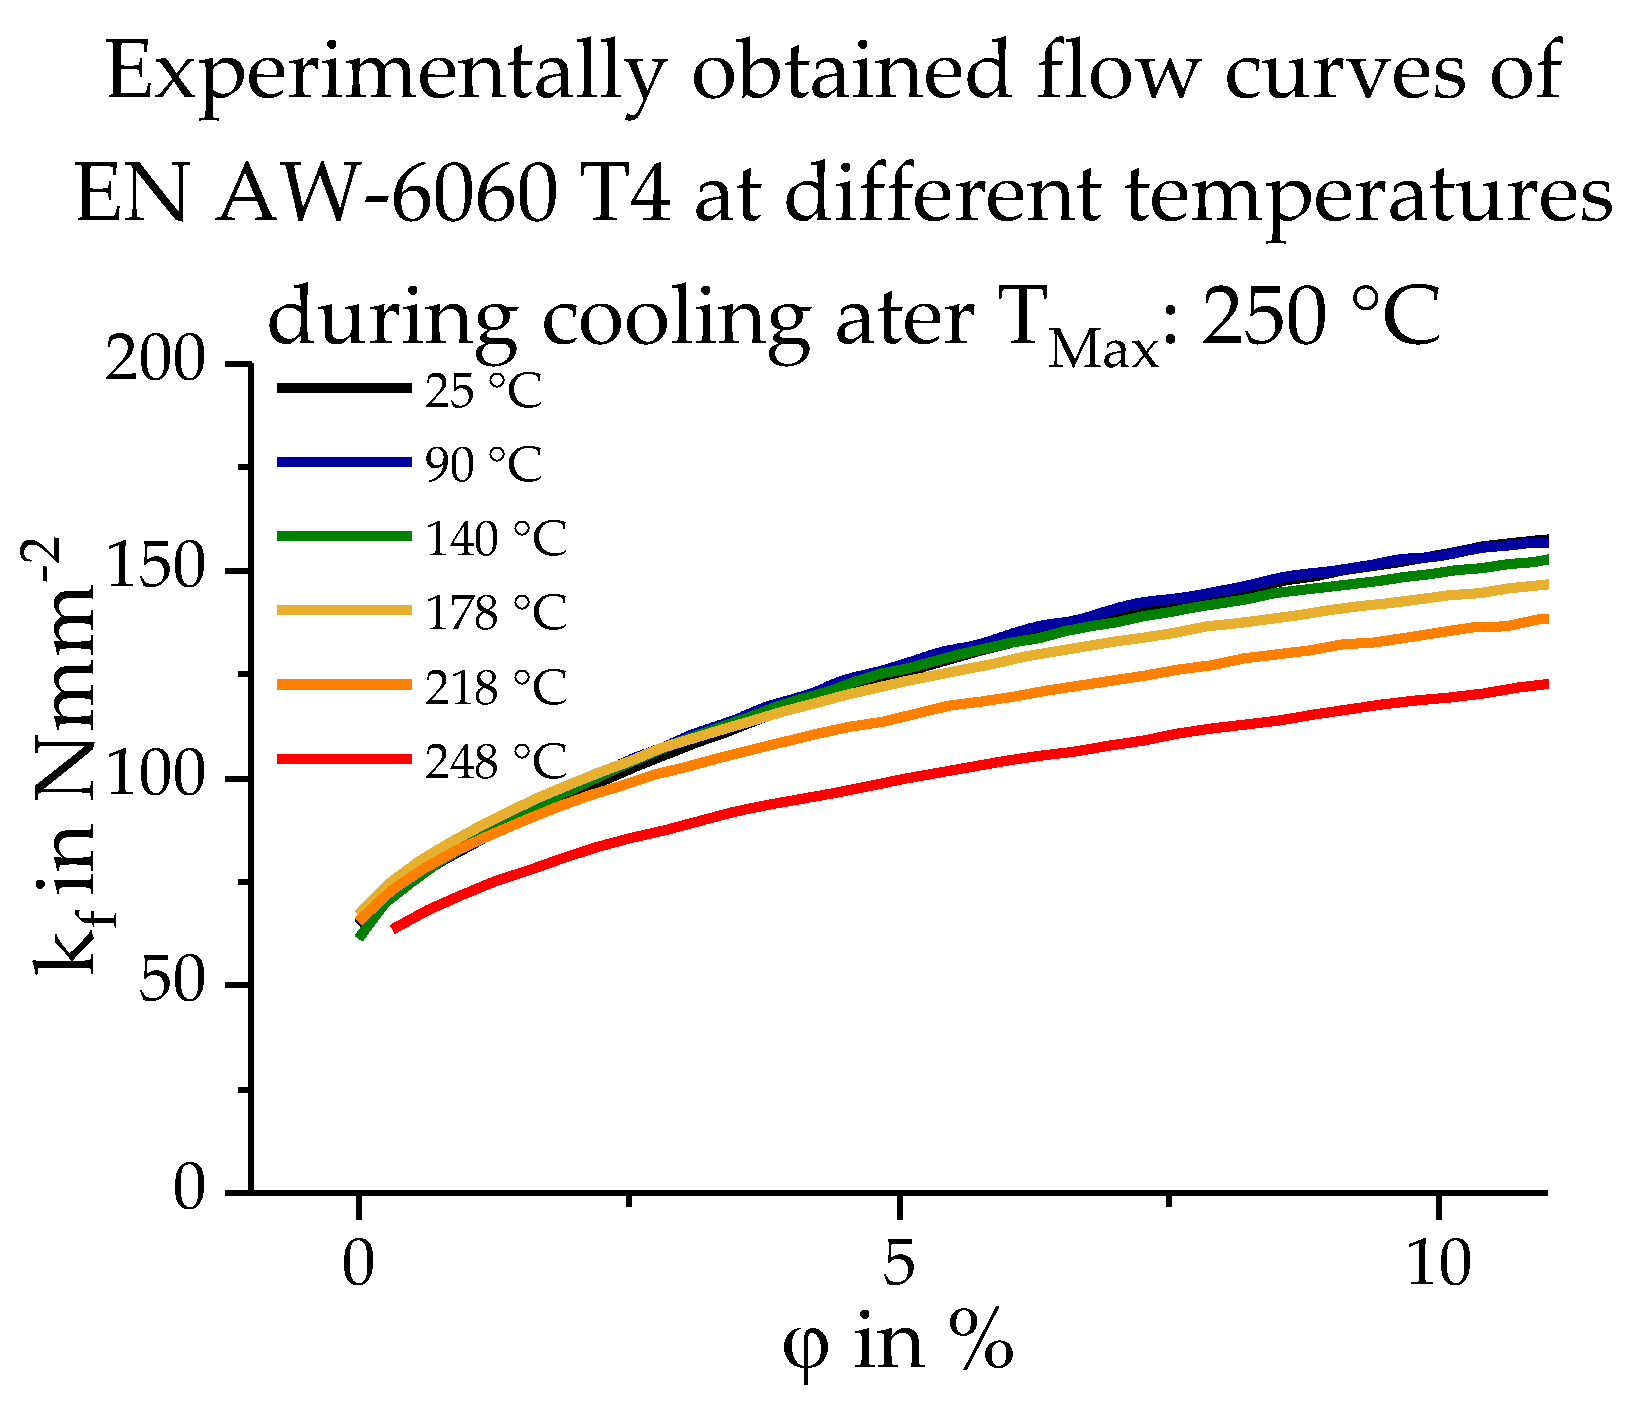
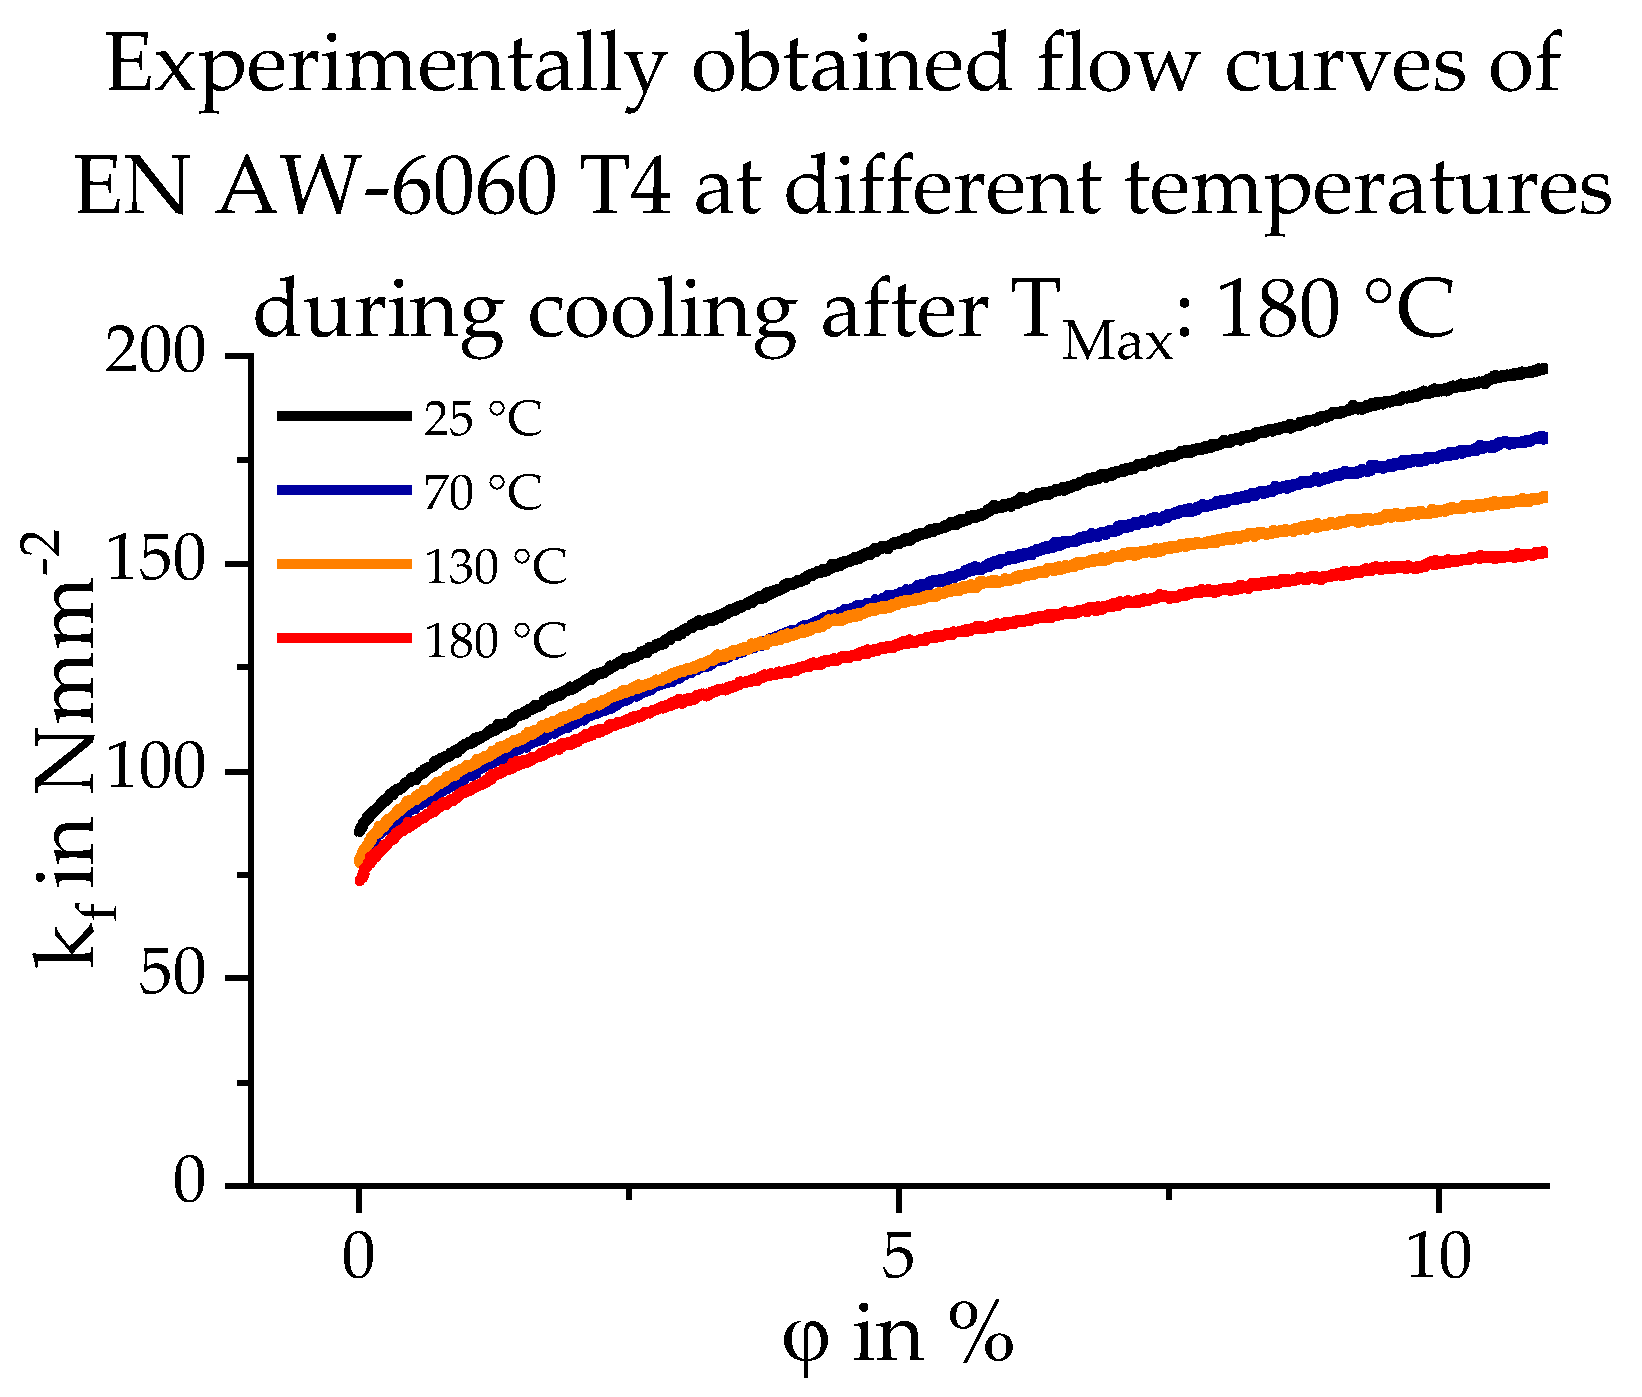
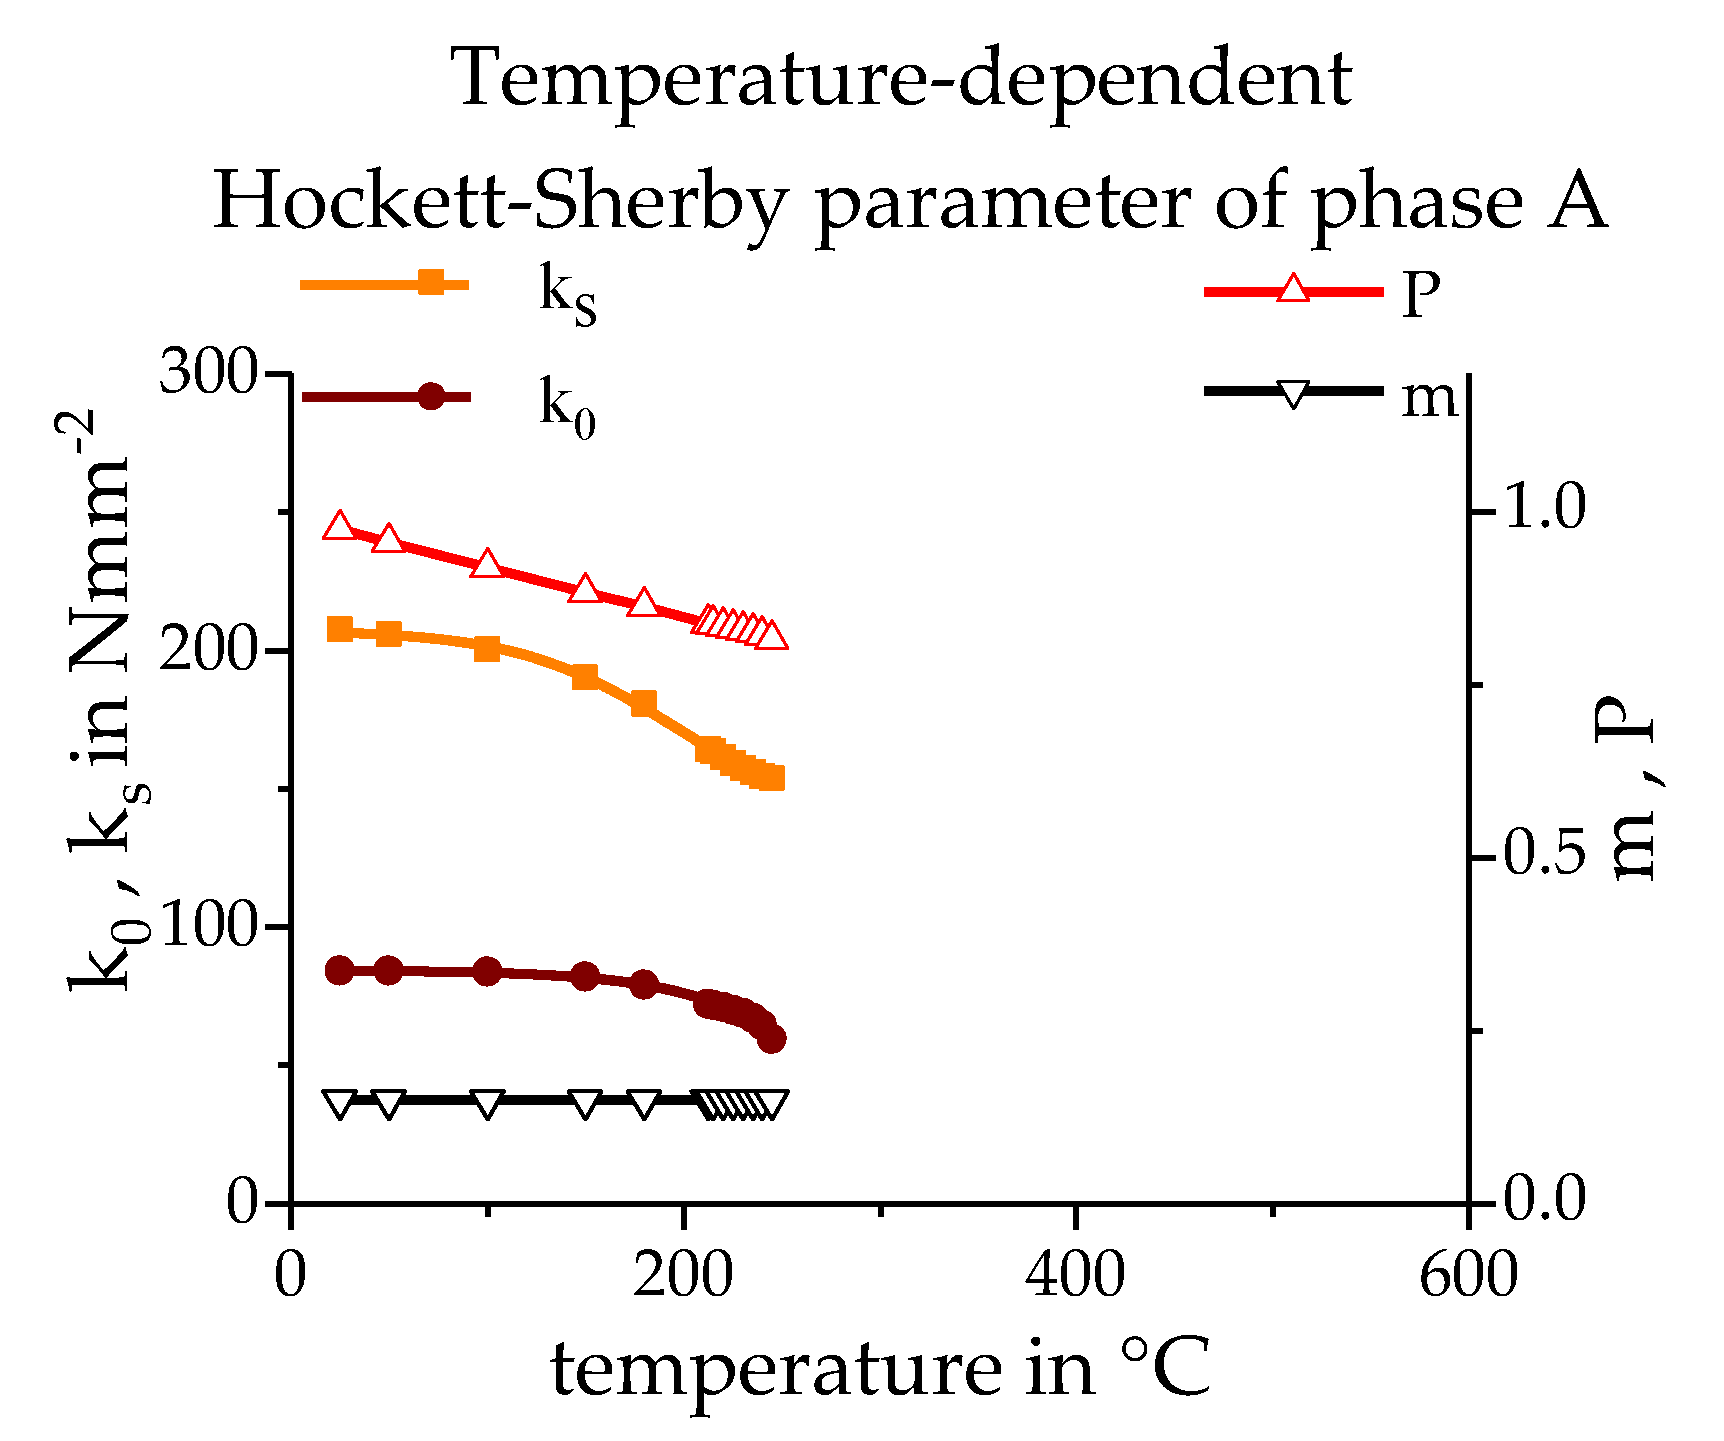
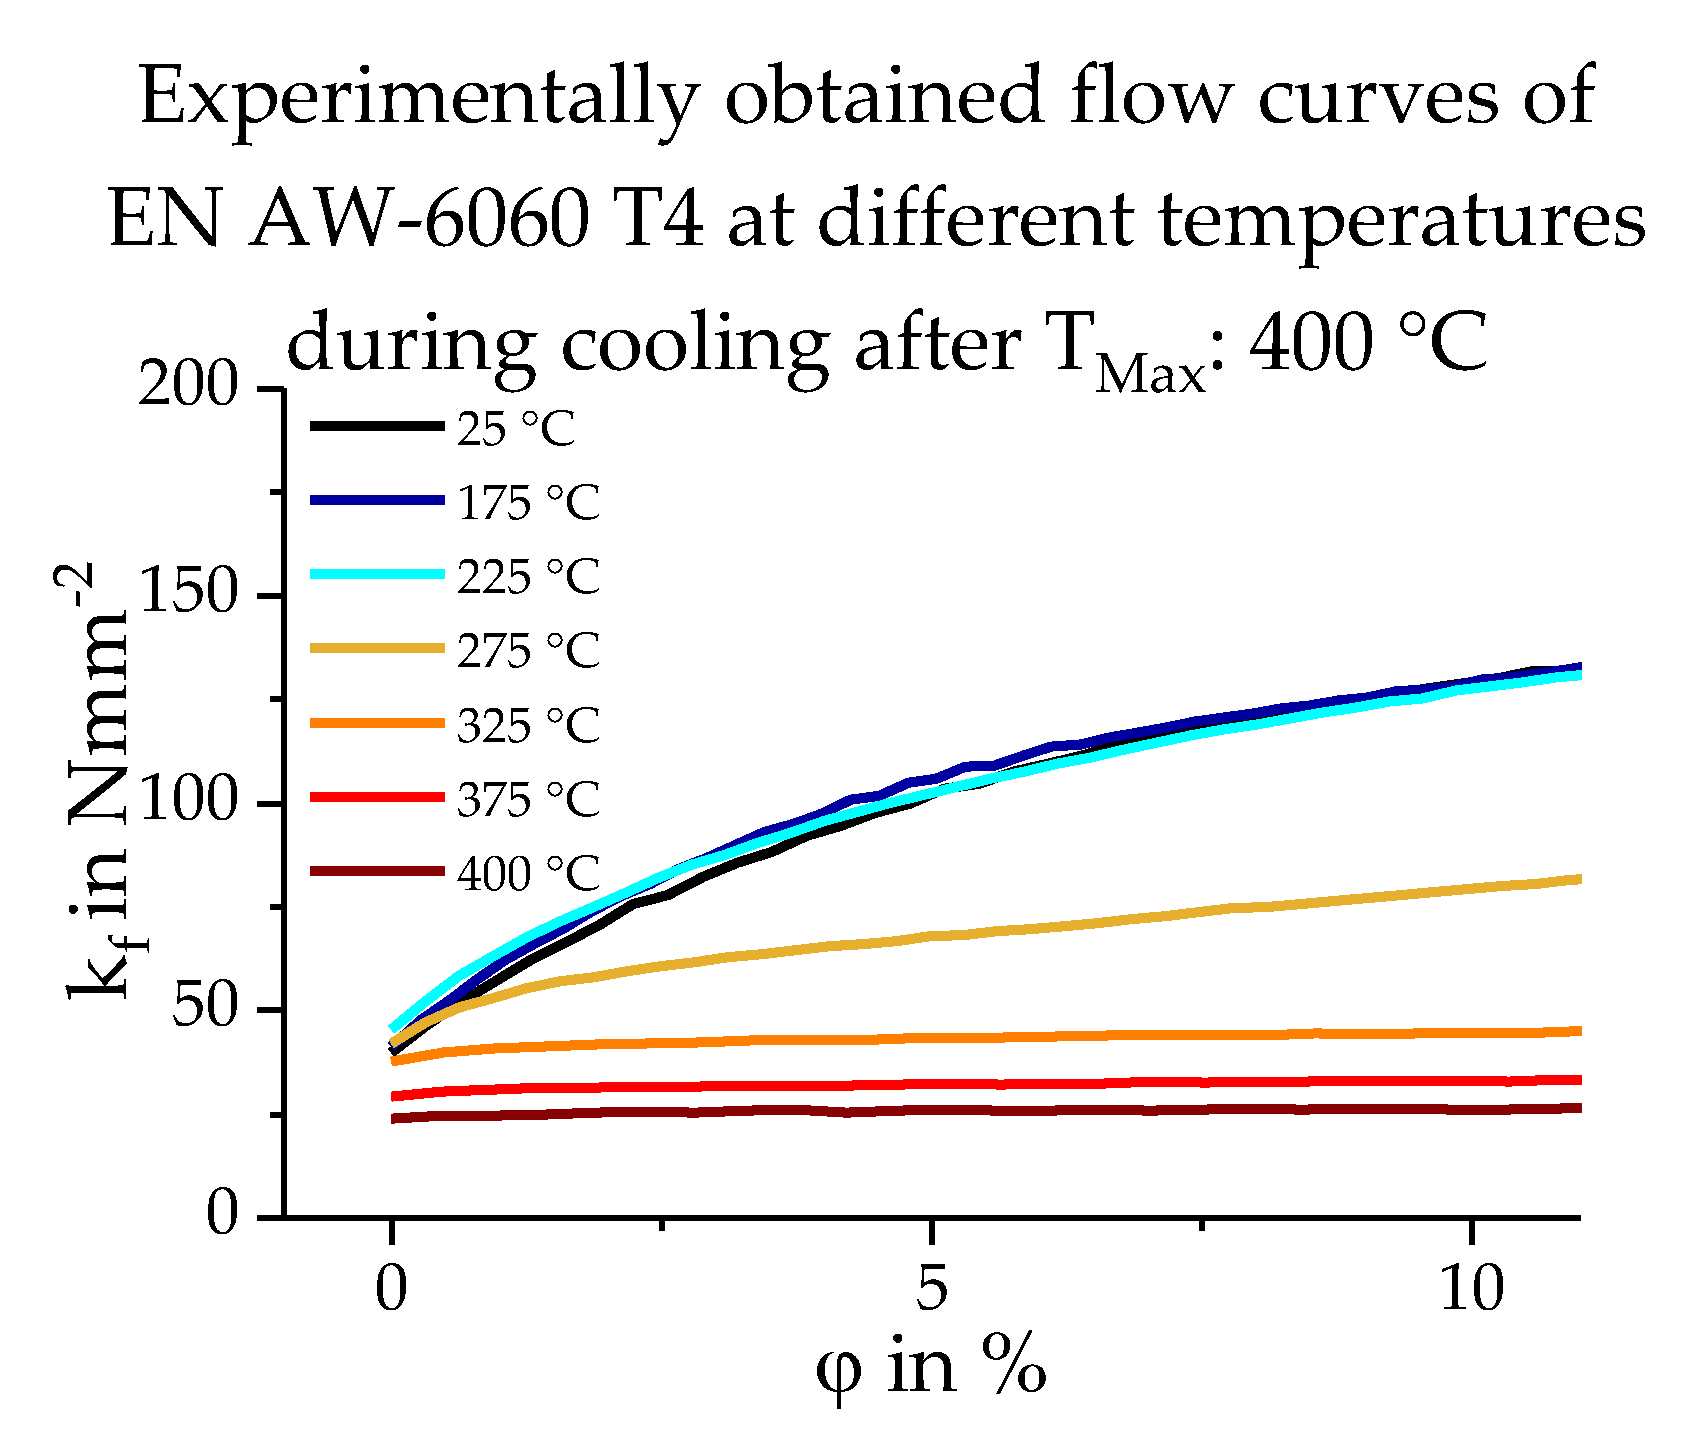
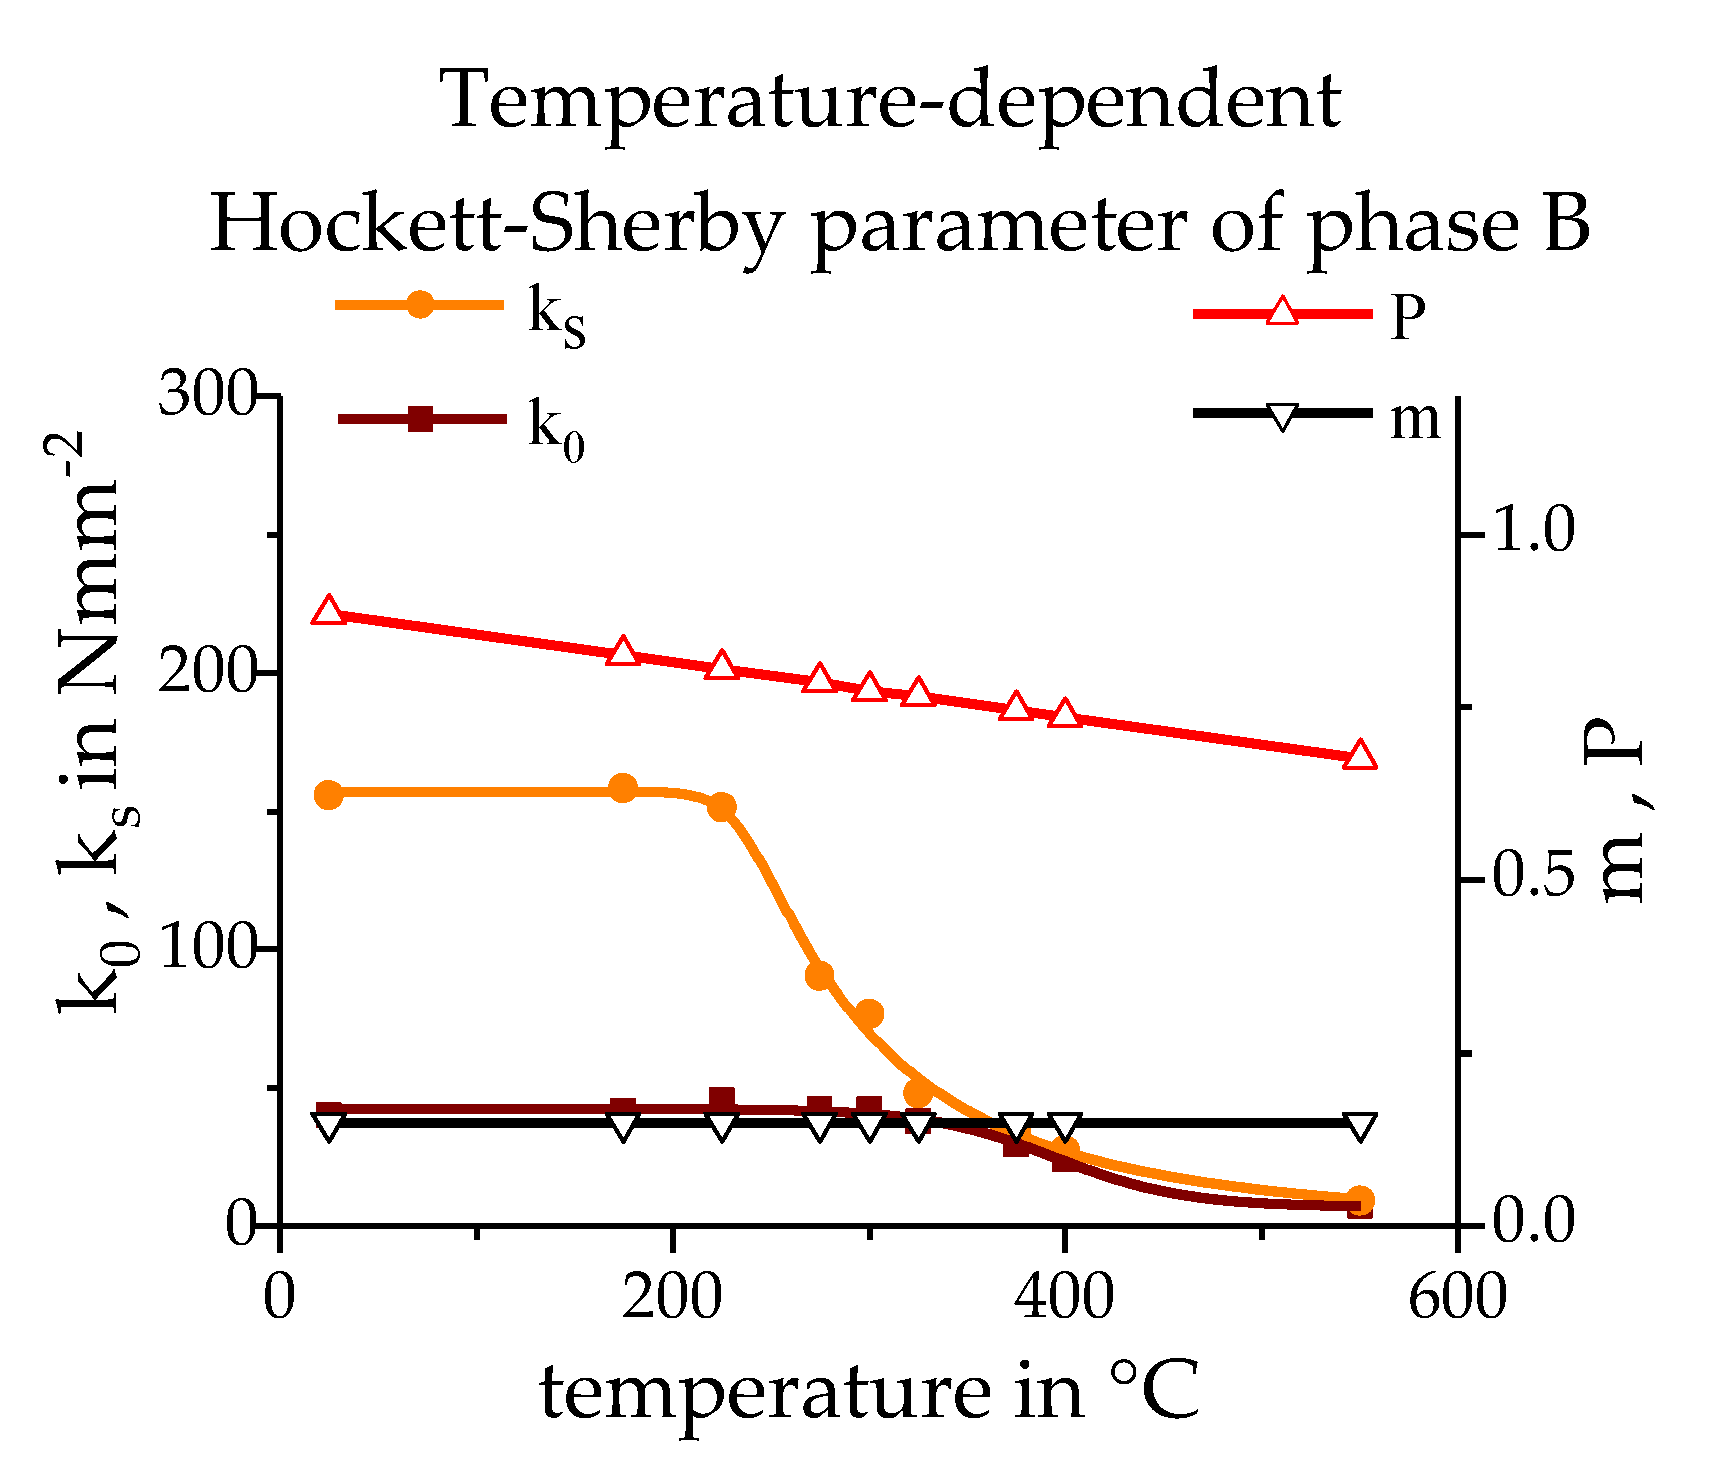
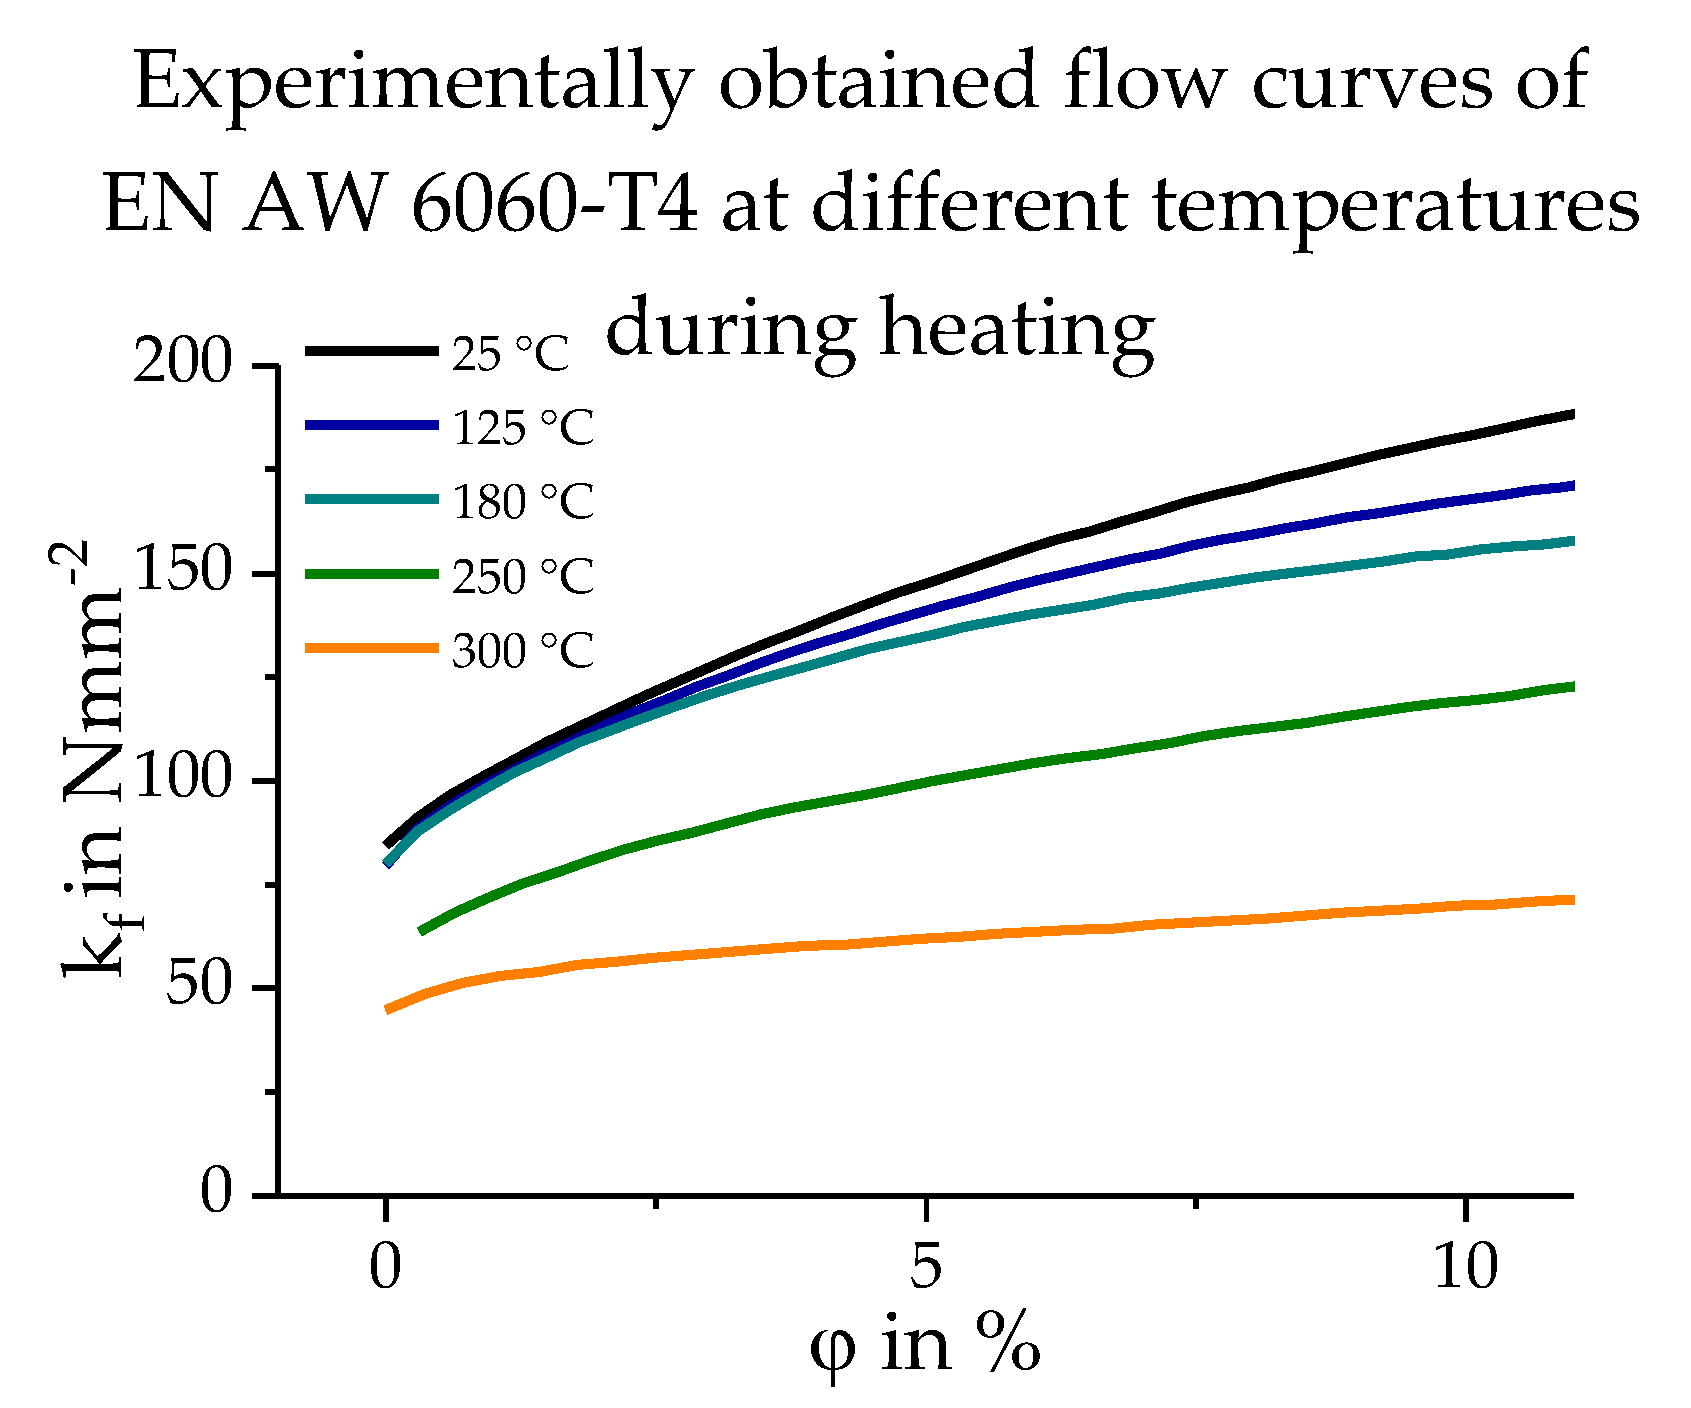
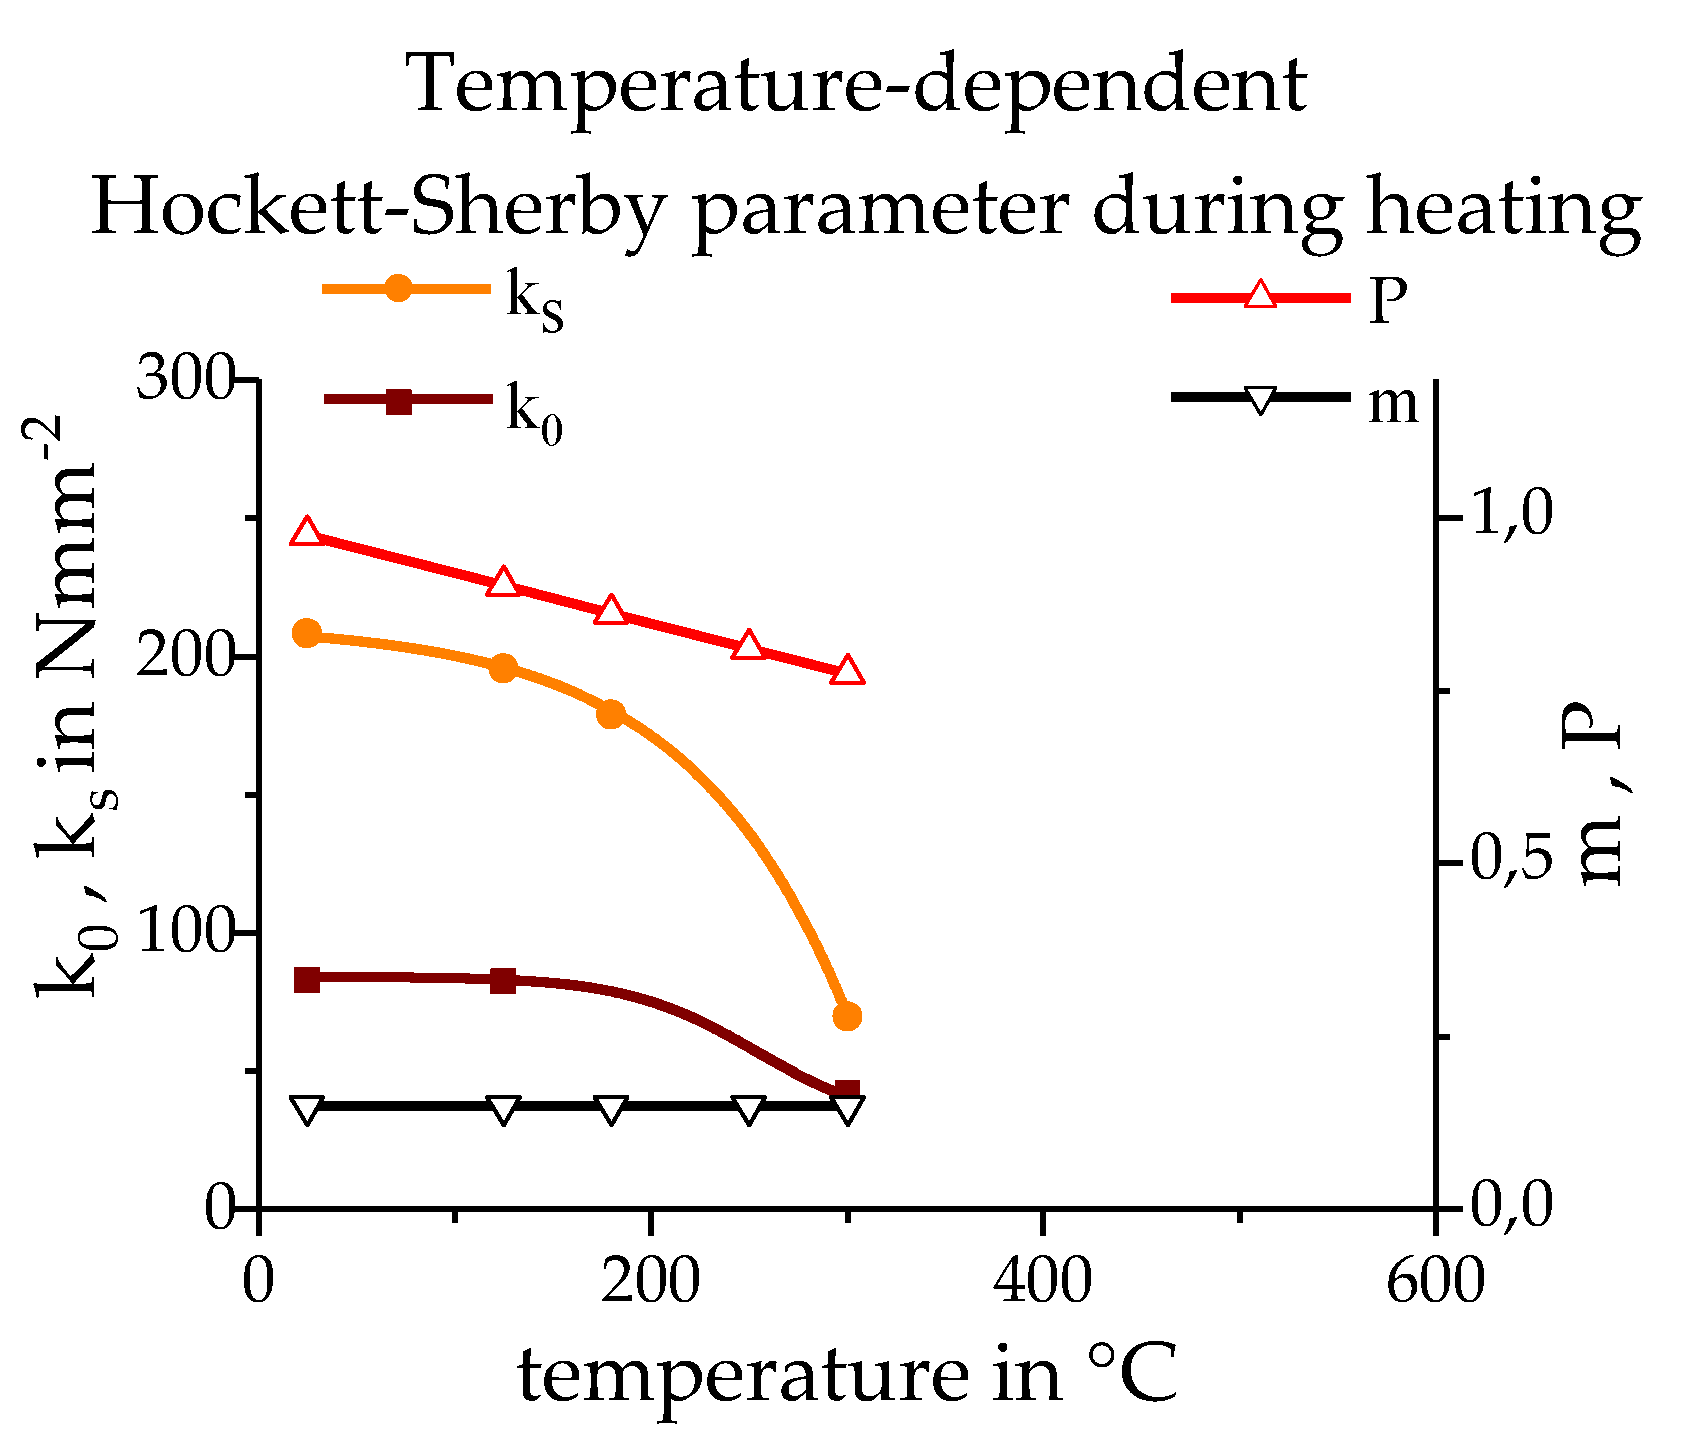
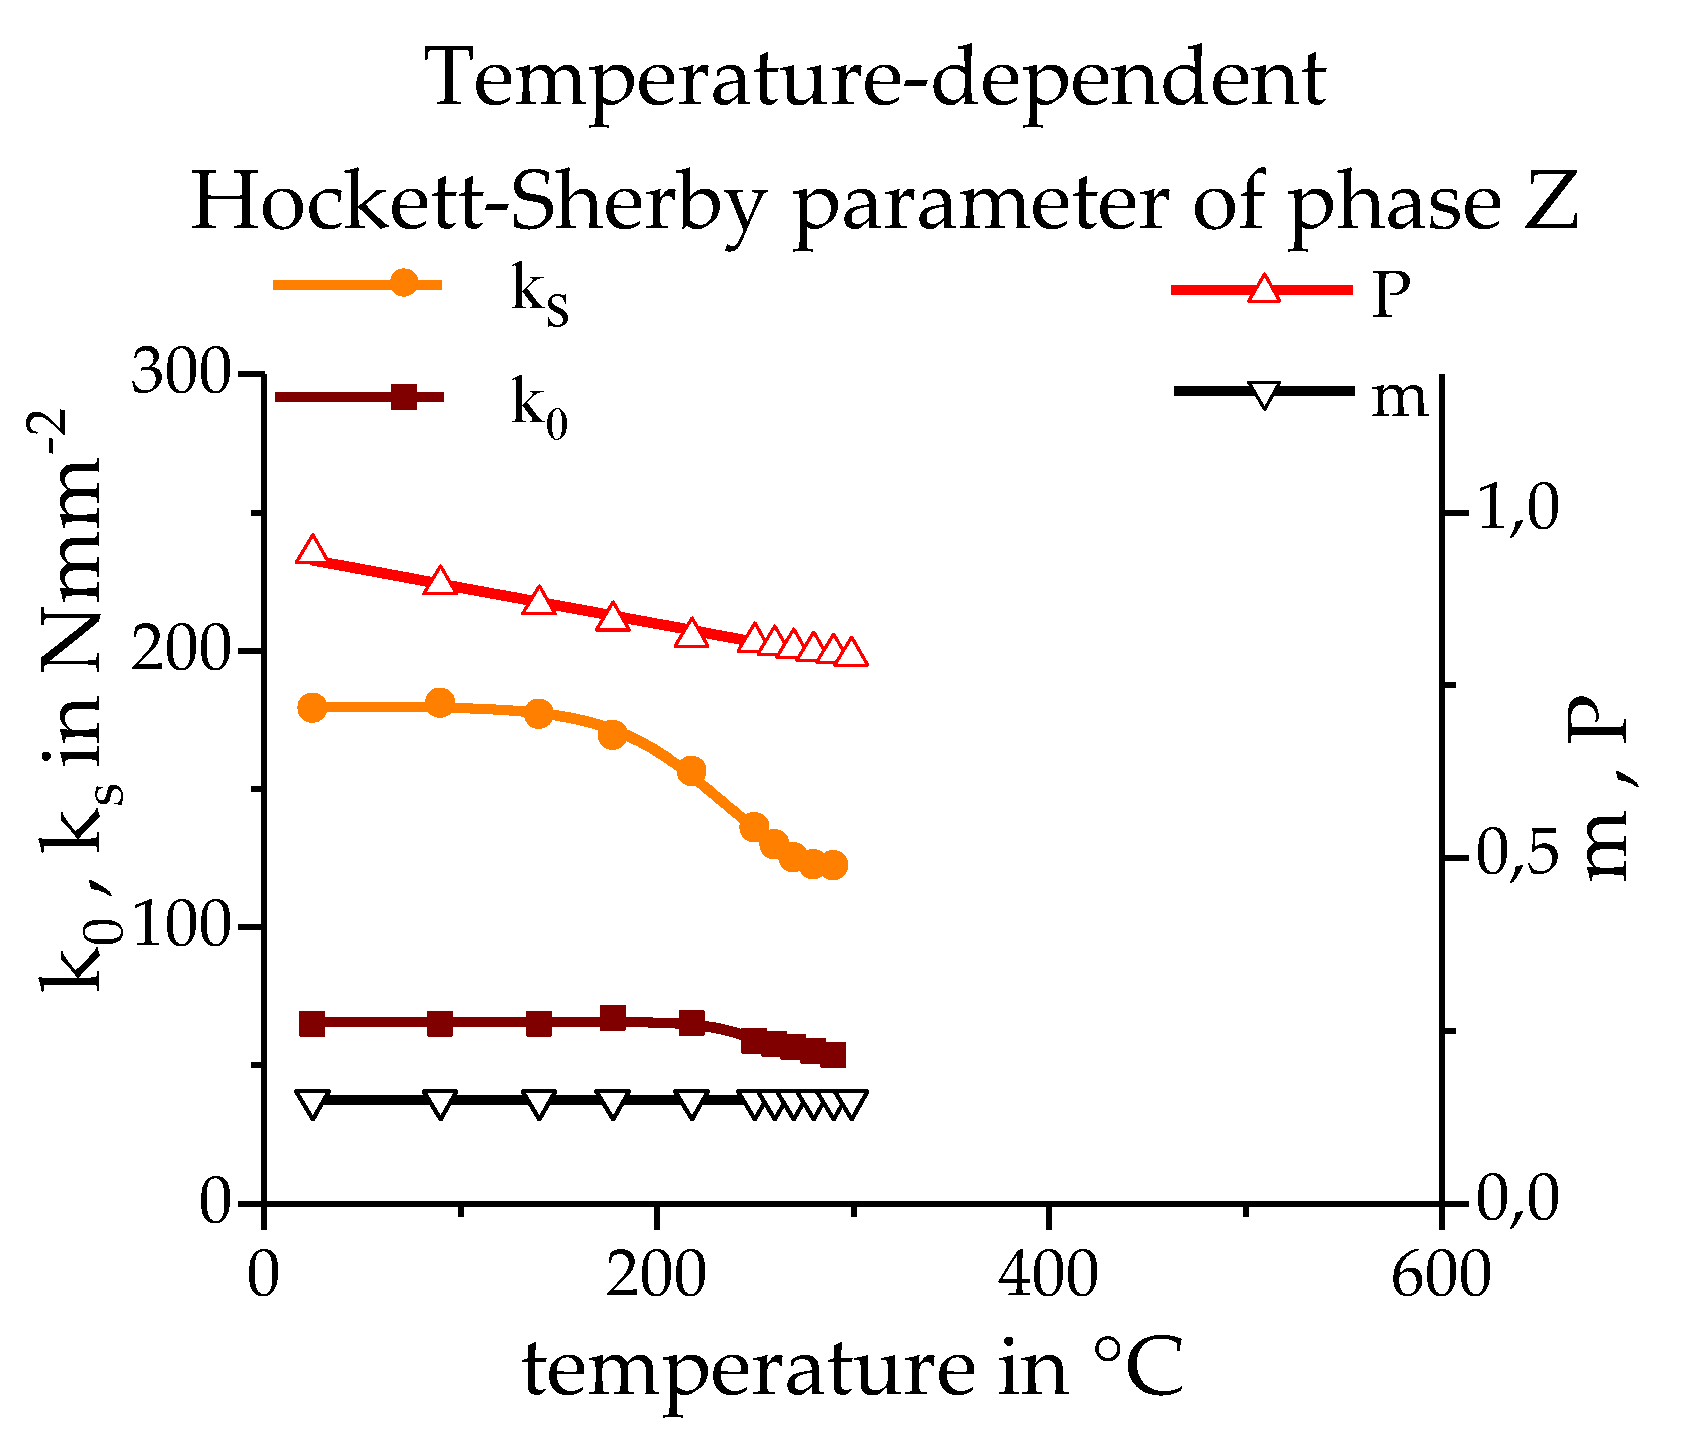
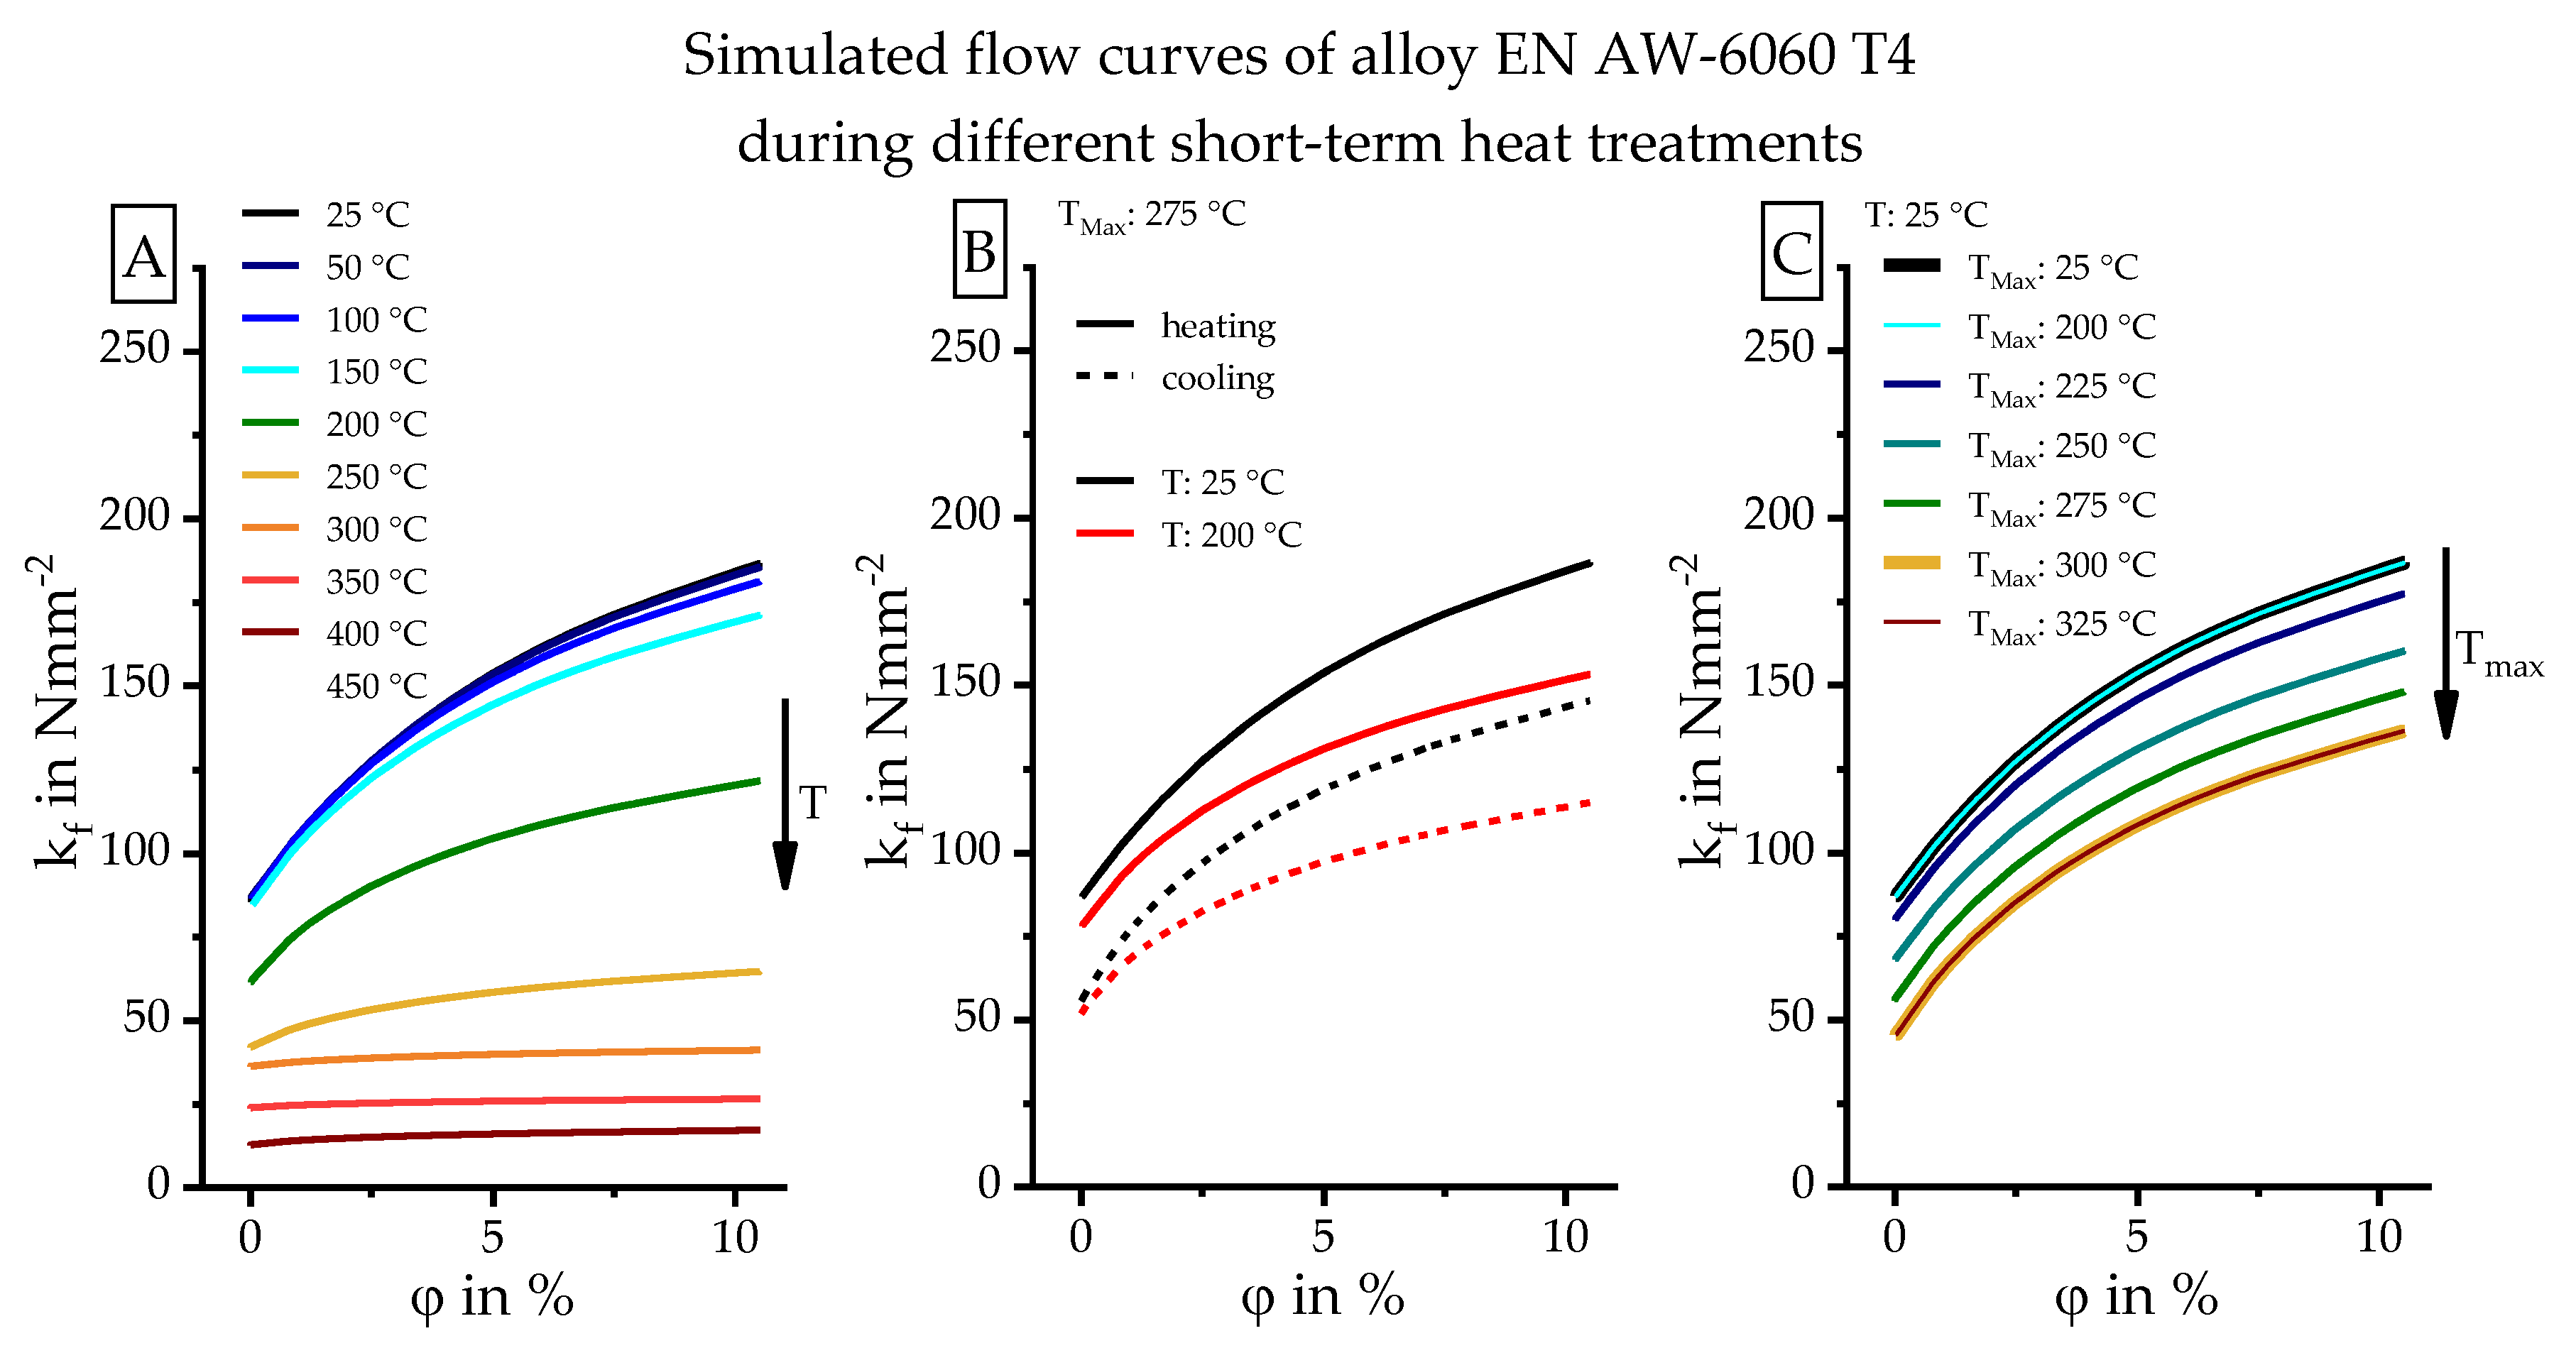
3.3. Calculating the Resulting Flow Curves

The basis for the mechanical properties of individual phases is experimental stress–strain curves after different short-term heat treatments (Figure 5). For the thermo-mechanical simulation, flow curves are required as input data (true stress; kf vs. logarithmic plastic strain; φ). Experimentally obtained flow curves were converted into a temperature-dependent mathematical description. The flow curves of face-centered cubic metals, like aluminium alloys, can be described well by the Hockett–Sherby [26] relationship, see Equation (1).
k f ( φ ) = k s e m φ P ( k s k 0 )
This equation contains four parameters, the initial flow stress (k0), the saturation stress (ks) and the hardening exponents, m and P. These parameters were adapted to the experimentally determined flow curves, using OriginPro 2018. By adapting the parameters to the flow curves at different temperatures, the Hockett–Sherby parameters of a phase can be derived over the existence range of this phase.
The Hockett–Sherby parameters of the imaginary phase (B) can be obtained over the entire temperature range directly from the experimental flow curves. The experimental basis for the temperature-dependent flow curves of the imaginary softened phase (B) is the experimentally obtained flow curves during cooling after the 400 °C maximum temperature, see Figure 9, and an additional tensile test at 550 °C. The flow curves are shown in the following figures as true stress kf vs. logarithmic plastic strain φ. The points in Figure 10 show the Hockett–Sherby parameters for phase (B), which were derived from the experimental data. These parameters from the experimental data can be fit via linear or nonlinear mathematical functions.
In the temperature range between 212.5 °C and 300 °C, the mechanical properties were represented by an imaginary phase mixture, A + Z respectively Z + B, as shown in Figure 8. The resulting flow curve (kf) can be described using Equation (2), taking into account the phase proportions of the existing phases (xi) and the flow curves of the individual phases (kfi). The phase proportions were calculated via a phase transformation model as a function of temperature (Section 3.3), while the individual phases were assigned to temperature-dependent flow curves.
k f = i = 1 n x i k f i
The resulting flow curves during the heating of the imaginary phase mixture A + Z respectively Z + B can be determined experimentally by the tensile tests performed during heating. Figure 11 shows the experimentally obtained flow curves of the imaginary phase mixture A + Z respectively Z + B at various temperatures during heating. The points in Figure 12 show the Hockett–Sherby parameters while heating alloy EN AW-6060, which were derived from the experimental data. The points were fit by mathematical formulas, which allows the Hockett–Sherby parameters to be determined for all temperatures during heating.
The simulated microstructure after a 250 °C maximum temperature consists entirely of phase (Z). The temperature-dependent flow curves and the Hockett–Sherby parameter of phase (Z) can thus be determined from tensile tests during cooling after a short-time heat treatment with a 250 °C maximum temperature, as seen in Figure 13 and Figure 14.
As can be seen in Figure 8, phase (Z) is transformed into phase (B) up to a 300 °C maximum temperature. Thus, temperature-dependent flow curves of phase (Z) up to 300 °C are necessary. By definition, the experimentally determined flow curves during heating between 250 °C and 300 °C represent the resulting mechanical properties of phase mixture (Z) and (B). As already described, the temperature-dependent flow curves of phase (B) can be calculated over the entire temperature range. The flow curves of phase (Z) in the interval between 250 °C and 300 °C can thus be determined by the experimentally determined resulting flow curves (kfres) from the phase mixture of (Z) and (B) during heating, as well as the experimentally determined flow curves of phase (B) (kfB) using Equation (3).
k f Z ( T ) = k f r e s ( T ) x B ( T ) · k f B ( T ) x Z ( T )
The phase proportions of the phases are given by the temperatures and can be calculated from the phase transformation (Section 3.3). Figure 14 shows the Hockett–Sherby parameters determined for phase (Z) in its entire existence temperature range from 300 °C to room temperature.
The experimental database for phase (A) provided the tensile tests performed during the short-time heat treatment with a 180 °C maximum temperature, see Figure 15. The same procedure for determining temperature-dependent Hockett–Sherby parameters (Figure 16) was performed for phase (A) from the imaginary phase mixture A + Z.
The presented procedure makes it possible to adjust the Hockett–Sherby parameters for each phase. As a result, flow curves can be calculated for each phase at any temperature in the temperature range of phase existence.

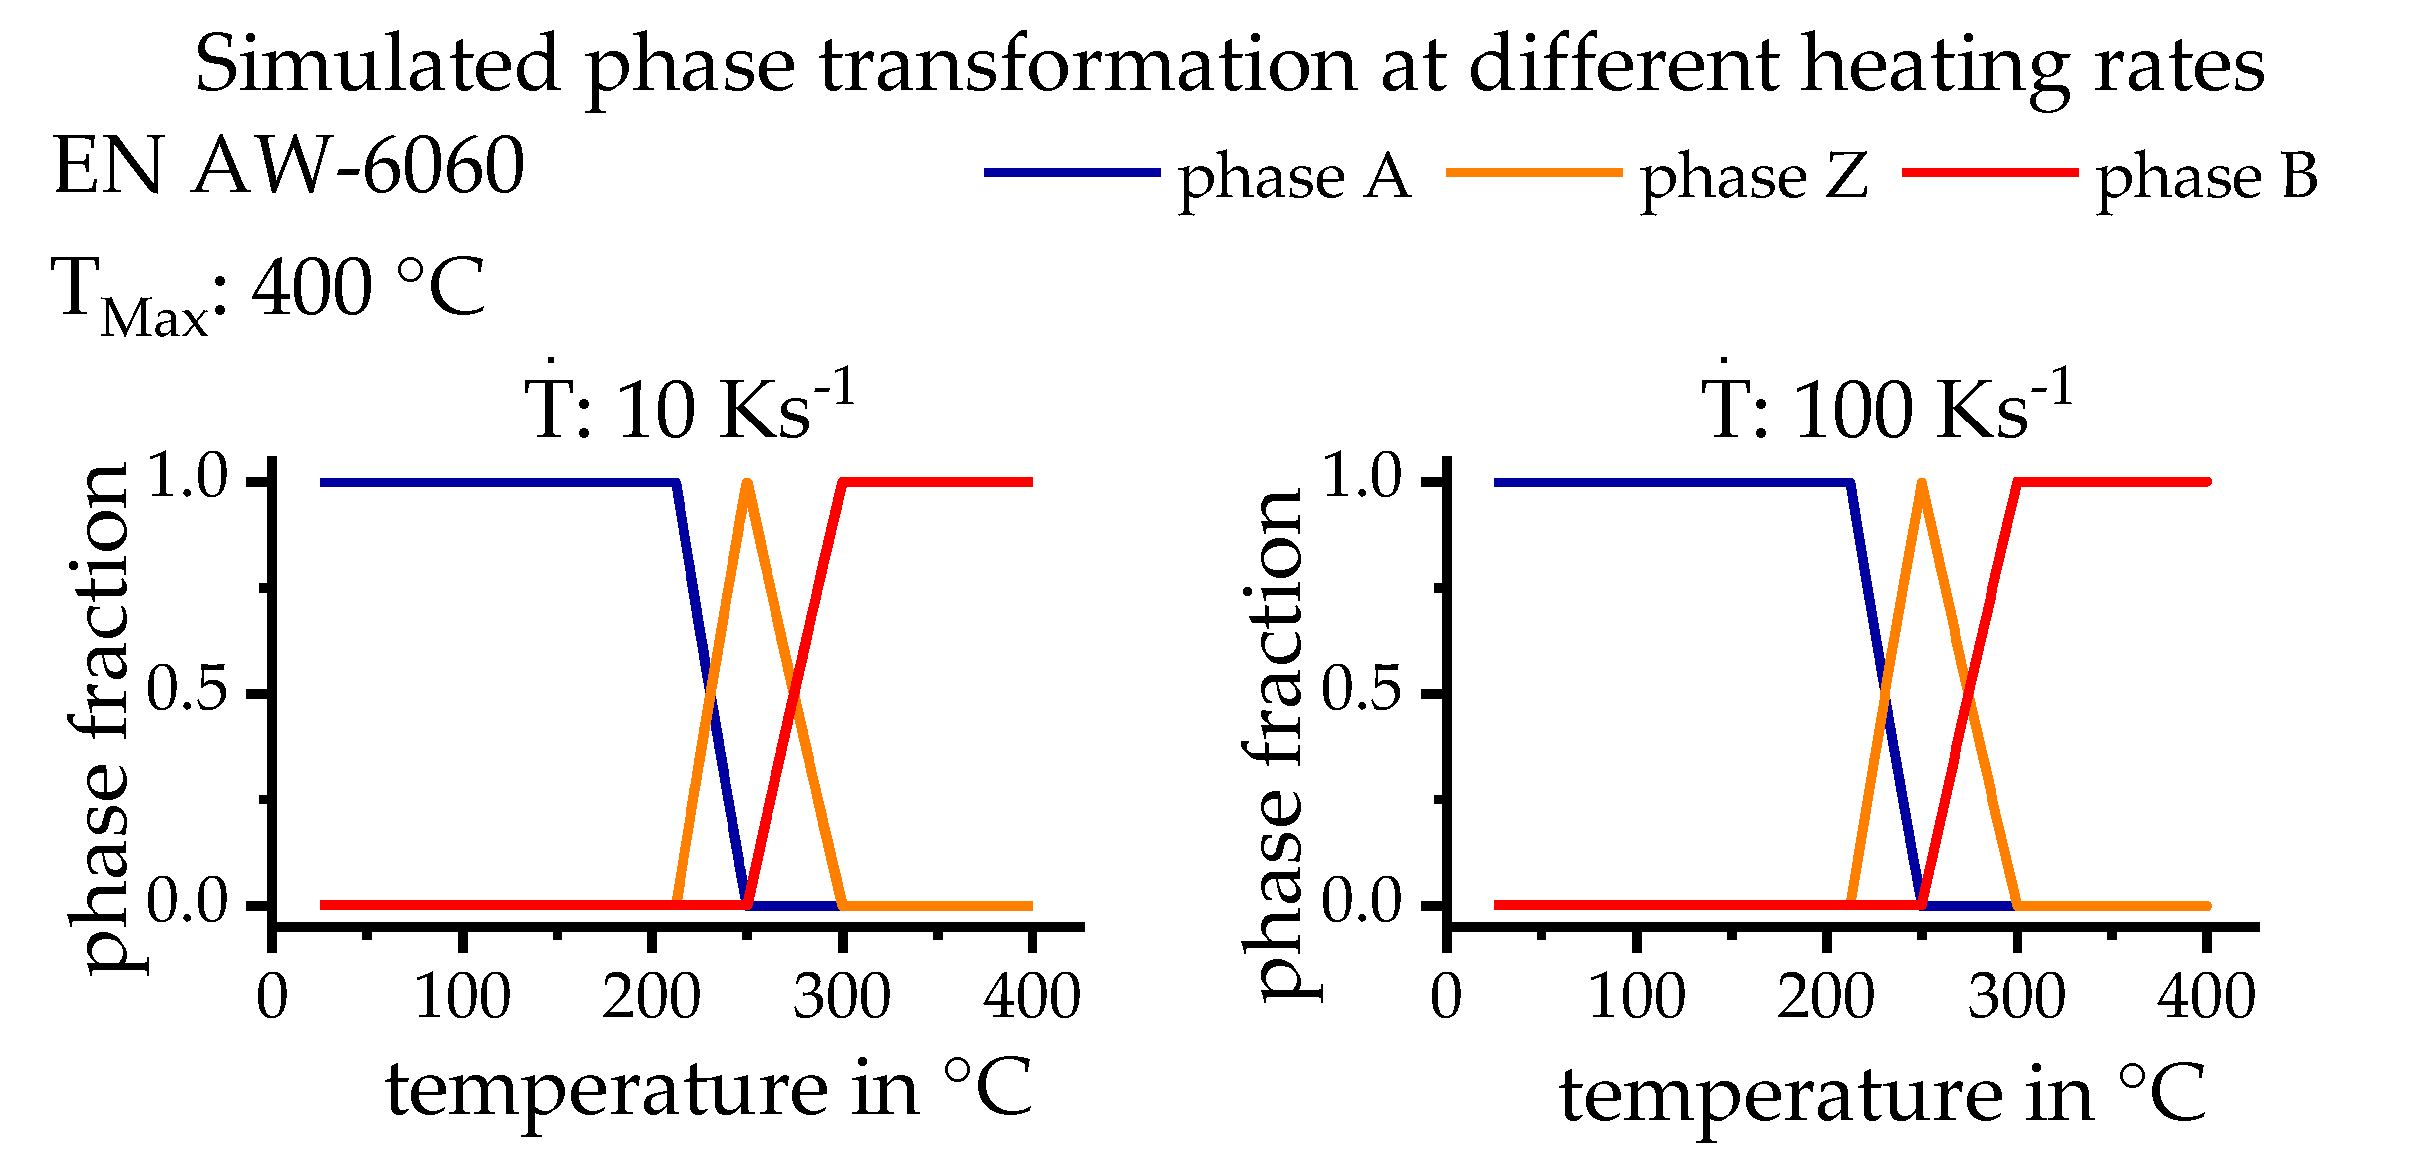
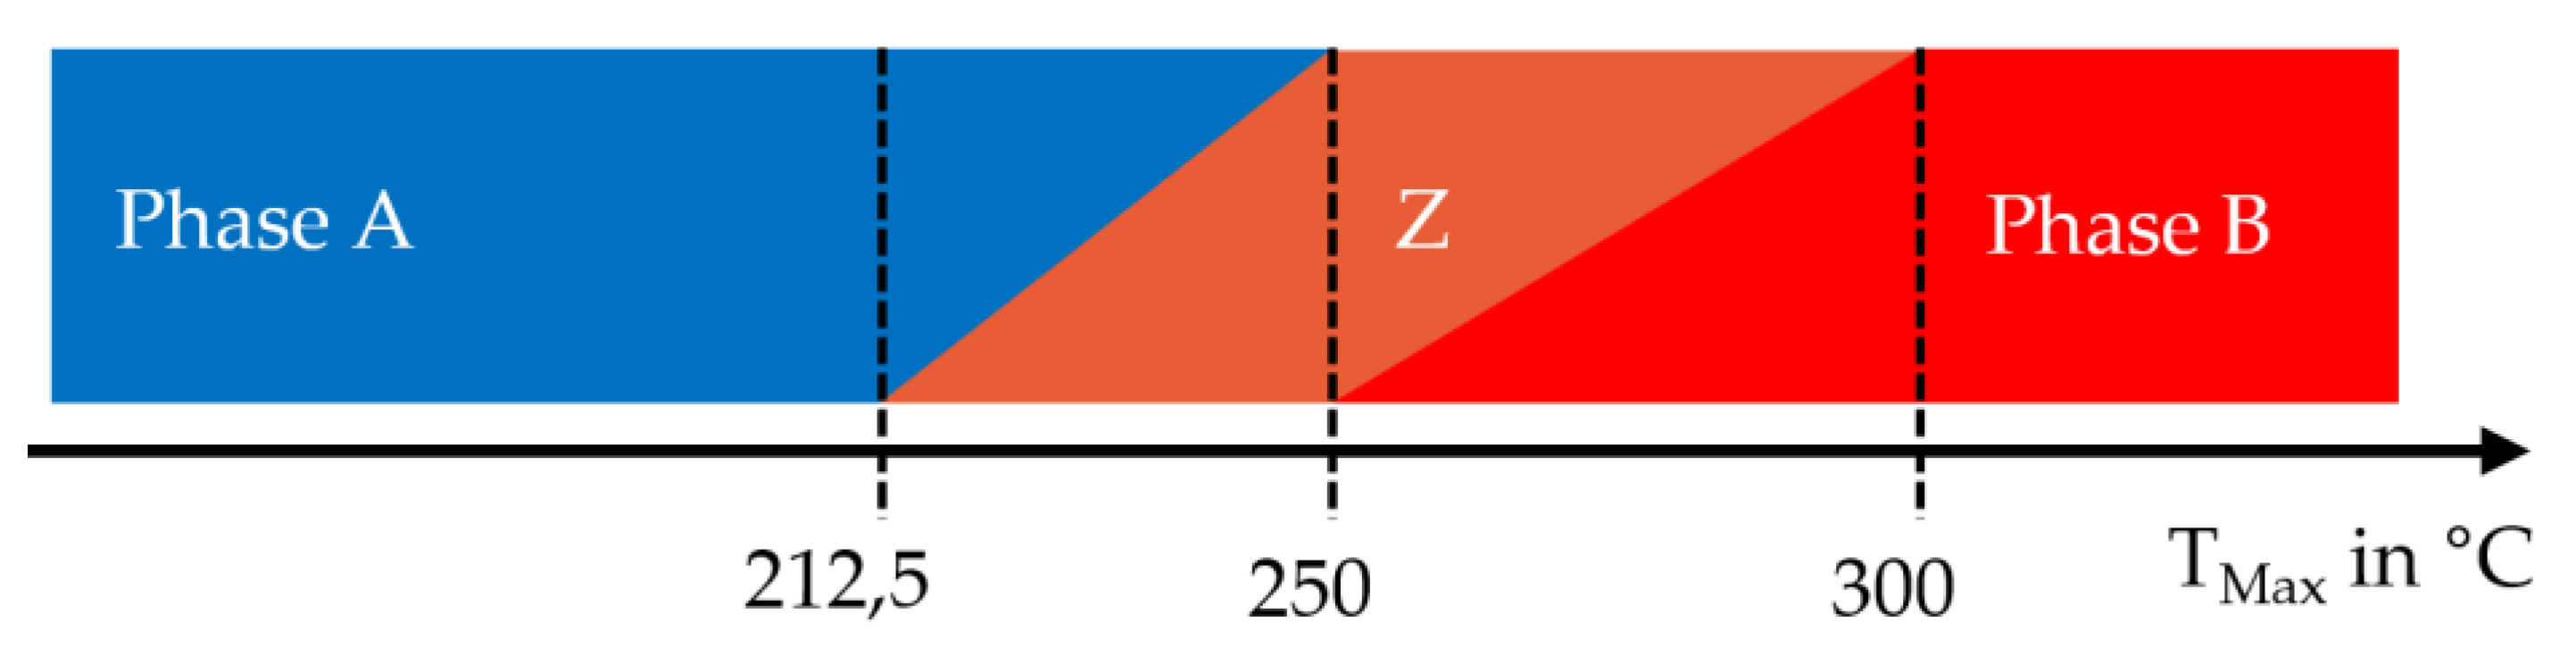
3.4. Phase Transformation

According to the model in Figure 6, we have chosen simplified linear transformations of imaginary phases A → Z and Z → B in the specified temperature ranges. Corresponding to the continuous heating dissolution diagram in Figure 1, we have further assumed no dependence of phase transformations on heating rate in the relevant range of approximately 10 Ks−1 to 100 Ks−1. Figure 17 shows the phase fractions during a simulated heating up to 400 °C. It becomes clear that an entire linear transformation of the individual phases was achieved as a function of temperature, considering the defined start and end temperatures of the transformations.

3.5. Simulation Model
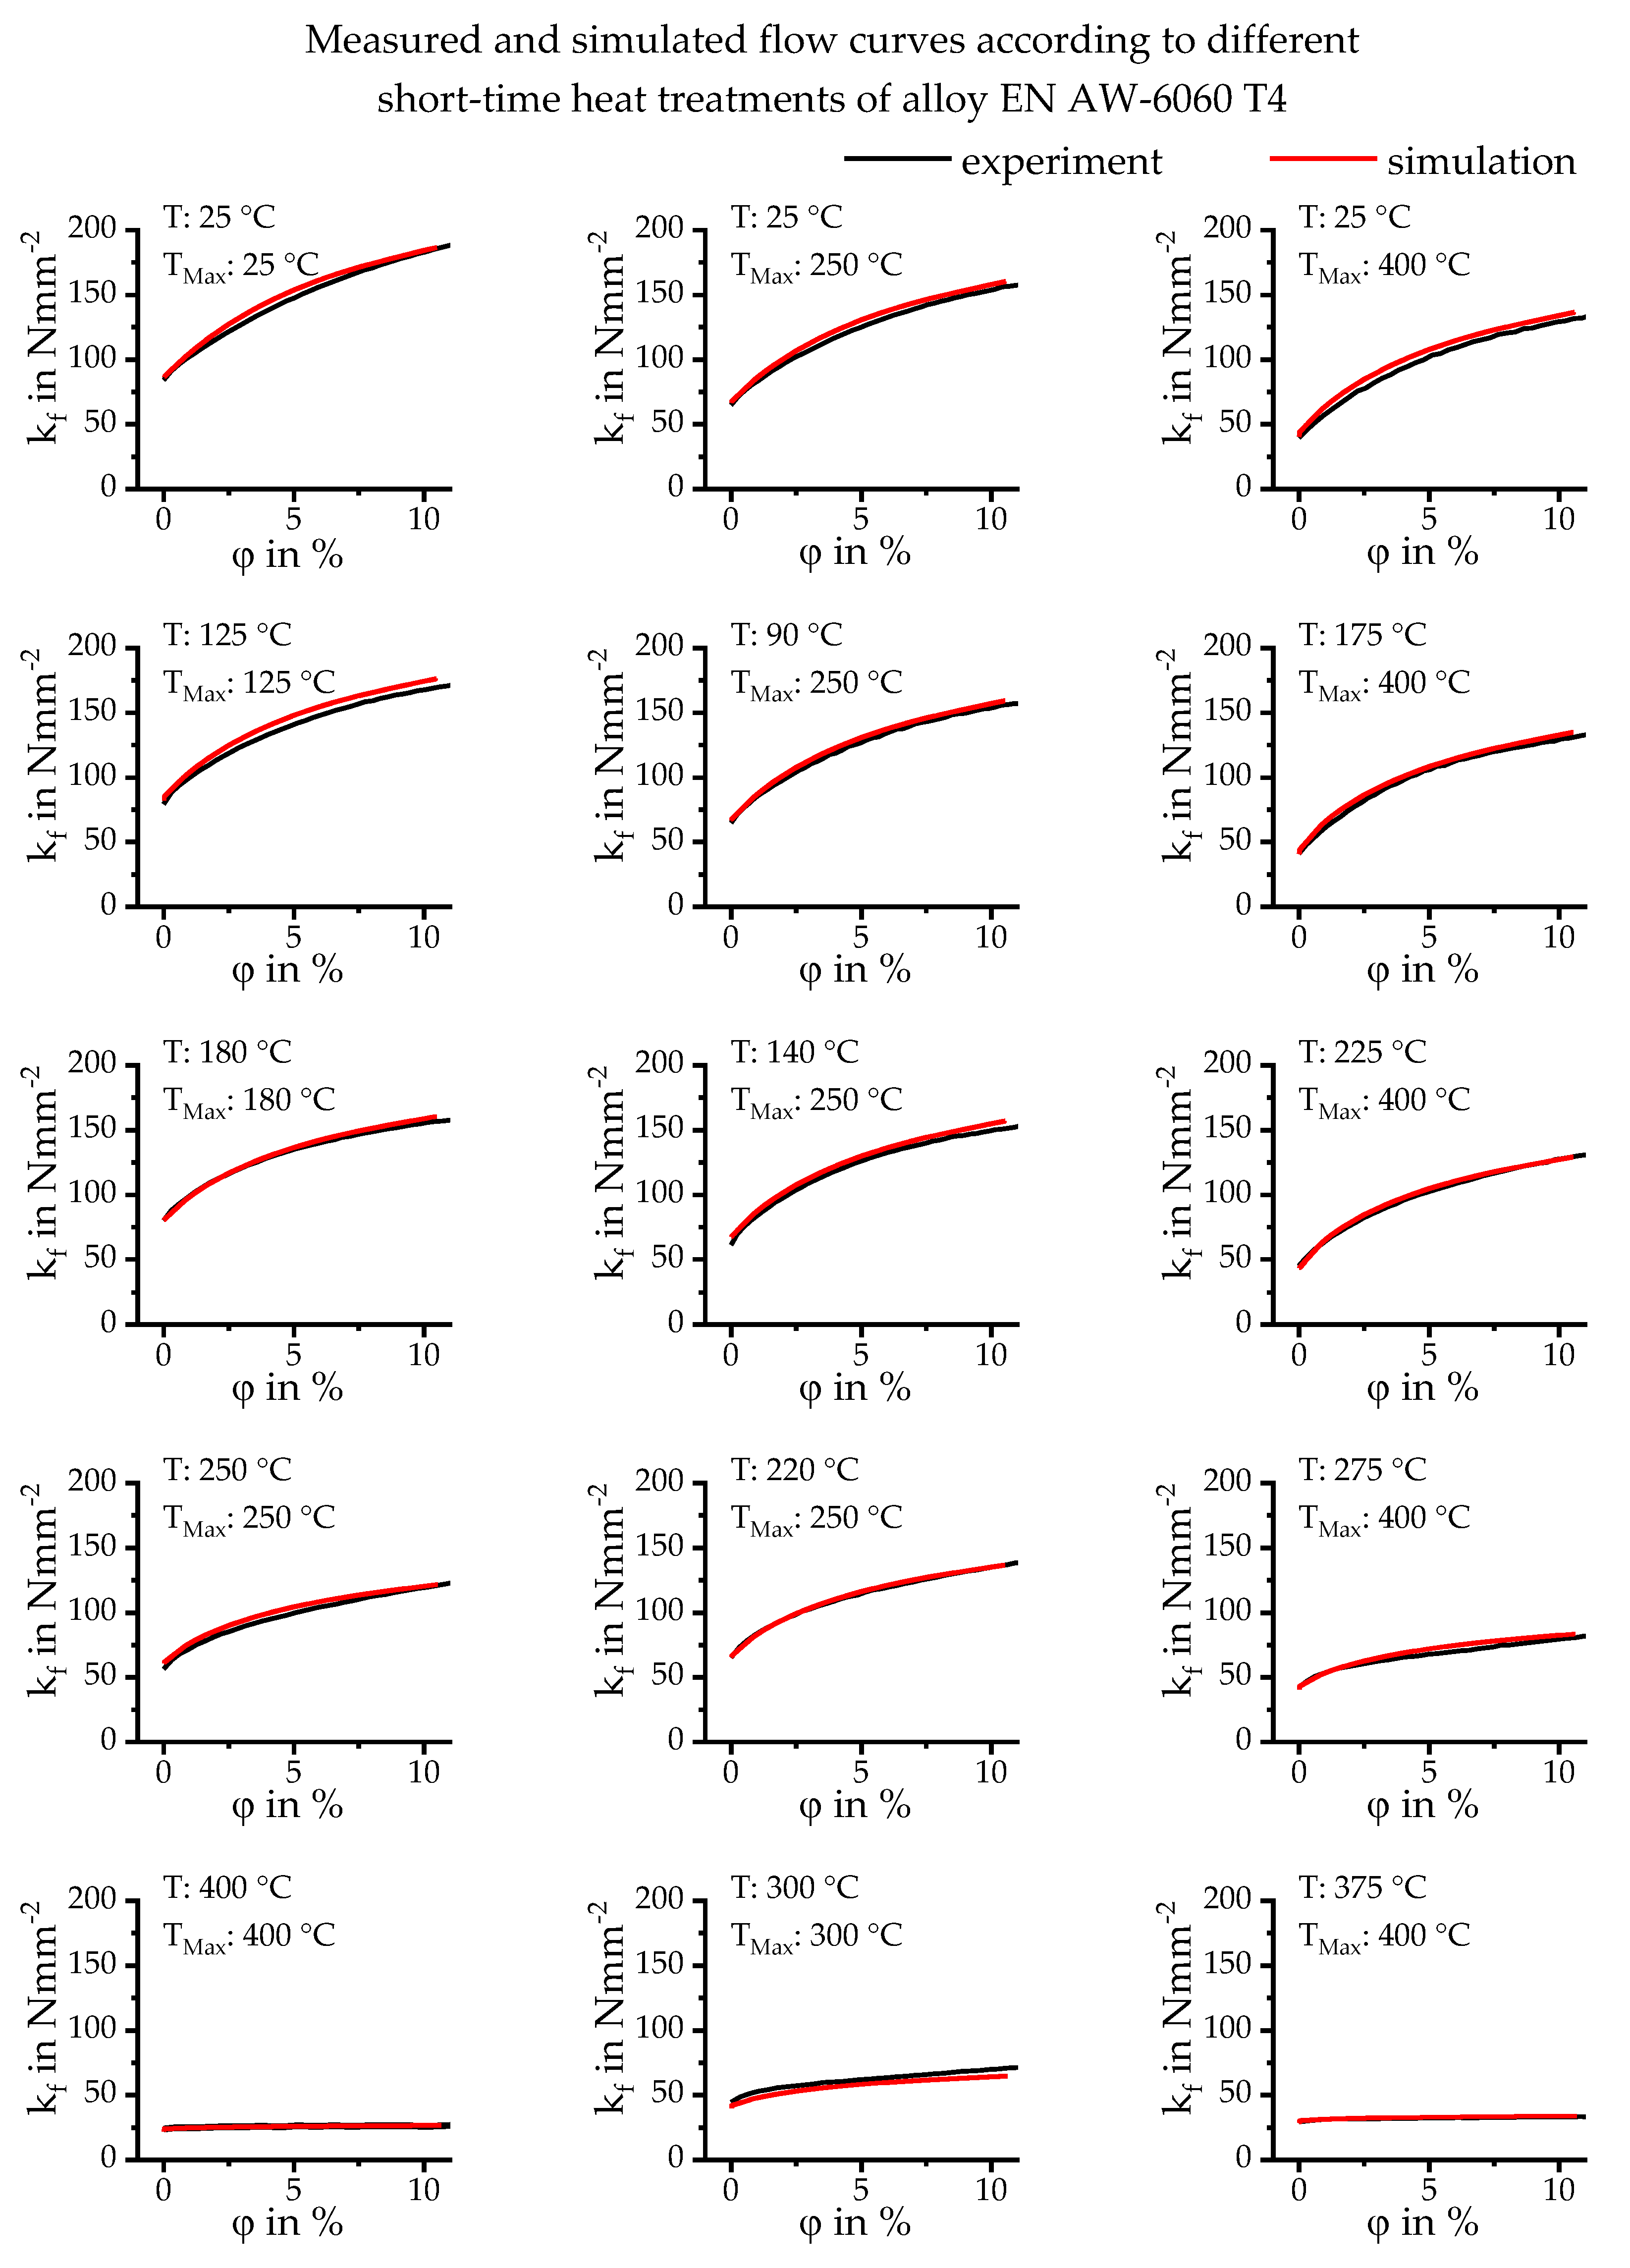
The simulation model was implemented using the finite element software LS DYNA (Livermore Software Technology Corporation). The material model MAT_GENERALIZED_PHASECHANGE was released in software version R9.0.1 of LS DYNA (August 2016). It is used to model phase transformations in metallic materials and the associated changes in material properties. Up to 24 individual phases that transform into each other can be defined. The transformation can be defined for heating or cooling [27]. The phase transformation laws according to Koistinen–Marburger, Johnson–Mehl–Avrami–Kolmogorov (JMAK), and Kirkaldy and Oddy are predefined in the keywords.
A simple geometric model was used to verify the phenomenological mechanical material model for precipitation hardening aluminium alloys. The simulation model consisted of a single cube-shaped solid element with a 1 mm edge length. This element was subjected to a defined temperature profile to simulate heat treatment. The element was firmly clamped on one side by boundary conditions. The nodes on the other side were loaded with a predetermined displacement. Thermal expansion was not considered during this simulation to prevent thermally induced deformation.
Figure 18 illustrates an example time-temperature profile and the time-displacement course used. The time-temperature curve was varied in both the maximum temperature and in the temperature during deformation, in different individual simulations. The time-displacement curve remained constant during all individual simulations. The simulated flow curves were then compared with experimental data.
In the keywords in LS-DYNA, the Hockett–Sherby parameters were not entered directly. The representation of the flow curves via the Hockett–Sherby parameters serves only to calculate an associated flow curve for each phase at any temperature. In LS-DYNA, the flow curves were assigned to a temperature in tabular form for each phase. In the presented material model, a flow curve was tabulated every 25 K for each phase.

4. Results

The experimental and the simulated flow curves during different short-time heat treatments of alloy EN AW-6060 are shown in Figure 19. The experimentally determined flow curves shown represent the average of at least three individual measurements. The true stress over the plastic strain was plotted. The flow curves clearly show that our phenomenological mechanical material model for precipitation hardening aluminium alloys agrees very well with the experiments.
Figure 20 highlights some applications of the model. Figure 20A shows that the material model can provide temperature-dependent flow curves during heating. Strength decreases with increasing temperature, comparable to Figure 5. Figure 20B shows that the simulated flow curves during heating and cooling run differently. By heating to 275 °C, the material is softened. The flow curves after cooling to 200 °C and 25 °C are therefore significantly below the flow curves from heating to the same temperatures. Figure 20C shows that the flow curves at the same current temperature (here 25 °C) depend on the maximum temperature of the previous short-time heat treatment. A short heating to 200 °C does not cause softening and conforms to the flow curve of the initial state. Up to 300 °C, the material is softened, and the strength decreases with the increasing maximum temperature. Above the 300 °C maximum temperature, the material is maximally softened, and the flow curves do not change any further.
The developed material model can provide flow curves that depend on both the current temperature and the previous maximum temperature, and distinguish between heating and cooling. The developed material model thus takes into account the essential influencing factors of a short-term heat treatment on the mechanical properties and is therefore, suitable for the coupled thermal, metallurgical, and mechanical simulation of such a heat treatment. In this case, metallurgical does not mean the real nm-sized precipitation processes in Al-alloys, but a feasible macroscopic approach based on imaginary phases.

5. Conclusions

The two main influencing factors for softening aluminium alloys during short-term heat treatment are the current temperature and the previous maximum temperature [21]. Until now, no material model can describe the mechanical properties as a function of the current temperature and the previous maximum temperature during the short-term heat treatment and can also differentiate between heating and cooling. In this work, a phenomenological mechanical material model was developed for precipitation hardening aluminium alloys. In this model, the real hardening behavior of aluminium alloys, which depends on nm-sized precipitates, was not considered. Instead, the mechanical properties were defined by a mixture of different imaginary phases comparable to coarse phase mixtures in steels. The initial precipitation-hardened state was defined as an imaginary hardened phase (A). During short-term heat treatment, precipitates were dissolved, and the material was softened. This state was defined as an imaginary softened phase (B). Between the hardened phase (A) and the softened phase (B), an imaginary intermediate phase (Z) was defined. These phases transformed into each other during heating depending on the temperature. During cooling, no further phase transformation was assumed. The individual phases were assigned to temperature-dependent flow curves. Due to the phase composition as a function of the maximum temperature and the temperature-dependent flow curves of the individual phases, the developed material model can calculate a flow curve for each current temperature and each previous maximum temperature.
The material model was developed for calculating the mechanical properties during typical short-term heat treatments. For this reason, the following factors deviating from short-term heat treatment conditions were not considered in the material model—heating and cooling rate, strain rate and subsequent natural ageing. In principle, these factors can be considered in the model, but need an even broader experimental database.
The presented material model with the imaginary phases can be adapted to different age hardening aluminum alloys. For this purpose, the flow curves of the corresponding phases, as well as the transformation temperatures of the individual phases must be adapted to the alloy.
The model was implemented in the finite element software LS-DYNA using the keyword MAT_GENERALIZED_PHASECHANGE. The laser short-time heat treatment of Al-alloys can be simulated with this material model. Residual stresses and distortions can be calculated and handed over to a subsequent forming simulation, to realize a through process simulation.

Author Contributions

H.F., L.V.K., M.R. and O.K. conceived and designed the experiments; H.F. performed the experiments and analysed the data, L.V.K. implemented the model; H.F., L.V.K., M.R., and O.K. discussed and interpreted the results together; H.F. wrote the paper.

Funding

This research was funded by the German Research Foundation (DFG), within the scope of the research project Improvement of formability of extruded aluminium profiles by a local short-term heat treatment (DFG KE616/22-2).

Conflicts of Interest

The authors declare no conflict of interest.

References

  1. Mackerle, J. Finite element analysis and simulation of quenching and other heat treatment processes. Comput. Mater. Sci. 2003, 27, 313–332. [Google Scholar] [CrossRef]
  2. Oliveira, W.P.; de Savi, M.A.; Pacheco, P.M.C.L.; de Souza, L.F.G. Thermomechanical analysis of steel cylinders quenching using a constitutive model with diffusional and non-diffusional phase transformations. Mech. Mat. 2010, 42, 31–43. [Google Scholar] [CrossRef]
  3. Deng, X.; Ju, D. Modeling and simulation of quenching and tempering process in steels. Phys. Procedia 2013, 50, 368–374. [Google Scholar] [CrossRef]
  4. Carlone, P.; Palazzo, G.S.; Pasquino, R. Finite element analysis of the steel quenching process: Temperature field and solid-solid phase change. Comput. Math. Appl. 2010, 59, 585–594. [Google Scholar] [CrossRef]
  5. Reich, M.; Kessler, O. Numerical and experimental analysis of residual stresses and distortion in different quenching processes of aluminum alloy profiles. In ASM International; Quenching Control and Distortion; ASM International: Chicago, OH, USA, 2012; pp. 563–574. [Google Scholar]
  6. Reich, M.; Schöne, S.; Kessler, O.; Nowak, M.; Grydin, O.; Nürnberger, F.; Schaper, M. Simulation of gas and spray quenching during extrusion of aluminium alloys. Key Eng. Mater. 2010, 424, 57–64. [Google Scholar] [CrossRef]
  7. Yang, X.; Zhu, J.; Nong, Z.; Lai, Z.; He, D. FEM simulation of quenching process in A357 aluminum alloy cylindrical bars and reduction of quench residual stress through cold stretching process. Comput. Mater. Sci. 2013, 69, 396–413. [Google Scholar] [CrossRef]
  8. Wang, M.J.; Gang, Y.A.N.G.; Huang, C.Q.; Bin, C.H.E.N. Simulation of temperature and stress in 6061 aluminum alloy during online quenching process. Trans. Nonferrous Met. Soc. China 2014, 24, 2168–2173. [Google Scholar] [CrossRef]
  9. Felde, I.; Simsir, C. Simulation trends in quenching technology for automotive components. Int. Heat Treat. Surf. Eng. 2014, 8, 42–48. [Google Scholar] [CrossRef]
  10. Deng, D.; Kiyoshima, S. FEM prediction of welding residual stresses in a SUS304 girth-welded pipe with emphasis on stress distribution near weld start/end location. Comput. Mat. Sci. 2010, 50, 612–621. [Google Scholar] [CrossRef]
  11. Donati, L.; Troiani, E.; Proli, P.; Tomesani, L. FEM analysis and experimental validation of friction welding process of 6xxx alloys for the prediction of welding quality. Mater. Today Proc. 2015, 2, 5045–5054. [Google Scholar] [CrossRef]
  12. Hömberg, D.; Liu, Q.; Montalvo-Urquizo, J.; Nadolski, D.; Petzold, T.; Schmidt, A.; Schulz, A. Simulation of multi-frequency-induction-hardening including phase transitions and mechanical effects. Finite Elem. Anal. Des. 2016, 121, 86–100. [Google Scholar] [CrossRef]
  13. Geiger, M.; Merklein, M.; Vogt, U. Aluminum tailored heat treated blanks. Prod. Eng. 2009, 3, 401–410. [Google Scholar] [CrossRef]
  14. Kahrimanidis, A.; Lechner, M.; Degner, J.; Wortberg, D.; Merklein, M. Process design of aluminum tailor heat treated blanks. Materials 2015, 8, 8524–8538. [Google Scholar] [CrossRef] [PubMed]
  15. Fröck, H.; Graser, M.; Reich, M.; Lechner, M.; Merklein, M.; Kessler, O. Linked Heat Treatment and Bending Simulation of Aluminium Tailored Heat Treated Profiles. In Proceedings of the 4th World Congress on Integrated Computational Materials Engineering; Mason, P., Fisher, C.R., Glamm, R., Manuel, M.V., Schmitz, G.J., Singh, A.K., Strachan, A., Eds.; Springer: Cham, Germany, 2017; pp. 237–248. [Google Scholar]
  16. Chen, X.; Xiao, N.; Li, D.; Li, G.; Sun, G. The finite element analysis of austenite decomposition during continuous cooling in 22MnB5 steel. Modell. Simul. Mater. Sci. Eng. 2014, 22, 65005. [Google Scholar] [CrossRef]
  17. Esmaeili, S.; Lloyd, D.J.; Poole, W.J. Modeling of precipitation hardening for the naturally aged Al-Mg-Si-Cu alloy AA6111. Acta Mater. 2003, 51, 3467–3481. [Google Scholar] [CrossRef]
  18. Esmaeili, S.; Lloyd, D.J.; Poole, W.J. A yield strength model for the Al-Mg-Si-Cu alloy AA6111. Acta Mater. 2003, 51, 2243–2257. [Google Scholar] [CrossRef]
  19. Fröck, H.; Graser, M.; Reich, M.; Lechner, M.; Merklein, M.; Kessler, O. Influence of short-term heat treatment on the microstructure and mechanical properties of EN AW-6060 T4 extrusion profiles: Part, A. Prod. Eng. 2016, 10, 383–389. [Google Scholar] [CrossRef]
  20. Fröck, H.; Reich, M.; Milkereit, B.; Kessler, O. Scanning rate extension of conventional DSCs through indirect measurements. Materials 2019, 12, 1085. [Google Scholar] [CrossRef]
  21. Fröck, H.; Graser, M.; Milkereit, B.; Reich, M.; Lechner, M.; Merklein, M.; Kessler, O. Precipitation behaviour and mechanical properties during short-term heat treatment for tailor heat treated profiles (THTP) of aluminium alloy 6060 T4. Mat. Sci. Forum 2016, 877, 400–406. [Google Scholar] [CrossRef]
  22. Murayama, M.; Hono, K. Pre-precipitate clusters and precipitation processes in Al-Mg-Si alloys. Acta Mater. 1999, 47, 1537–1548. [Google Scholar] [CrossRef]
  23. Tsao, C.S.; Chen, C.Y.; Jeng, U.S.; Kuo, T.Y. Precipitation kinetics and transformation of metastable phases in Al-Mg-Si alloys. Acta Mater. 2006, 54, 4621–4631. [Google Scholar] [CrossRef]
  24. Edwards, G.A.; Stiller, K.; Dunlop, G.L.; Couper, M.J. The precipitation sequence in Al-Mg-Si alloys. Acta Mater. 1998, 46, 893–3904. [Google Scholar] [CrossRef]
  25. Fröck, H.; Graser, M.; Reich, M.; Lechner, M.; Merklein, M.; Kessler, O. Influence of short-term heat treatment on the microstructure and mechanical properties of EN AW-6060 T4 extrusion profiles—Part, B. Prod. Eng. 2016, 10, 391–398. [Google Scholar] [CrossRef]
  26. Hockett, J.E.; Sherby, O.D. Large strain deformation of polycrystalline metals at low homologous temperatures. J. Mech. Phys. Solids 1975, 23, 87–98. [Google Scholar] [CrossRef]
  27. Loose, T.; Klöppel, T. An LS-DYNA material model for the consistent simulation of welding forming and heat treatment. In Proceedings of the 11th Int Seminar Numerical Analysis of Weldability, Seggau, Austria, 28 September 2015. [Google Scholar]
Figure 1. Continuous heating dissolution diagram of EN AW-6060 T4 [20].
Metals 09 01165 g001
Figure 2. Continuous heating DSC curve of EN AW-6060 T4 at 1 Ks−1 correlated with the 0.2% yield and tensile strength after heating tensile specimens to different maximum temperatures followed by overcritical quenching. Experiments described in [21].
Metals 09 01165 g002
Figure 3. Recorded temperature courses of different laser heat treatments, described in [25].
Metals 09 01165 g003
Figure 4. Schematic measurement plan of the thermo-mechanical analysis, with the major parameters of the tensile test. Described in more detail in [15].
Metals 09 01165 g004
Figure 5. Mechanical properties (0.2% yield and tensile strength) during various short-term heat treatments. Experiments described in [15].
Metals 09 01165 g005
Figure 6. Schematic approach for an empirical-phenomenological material model of precipitation hardening aluminium alloys.
Metals 09 01165 g006
Figure 7. Schematic of the implemented phase transformation during heat treatment.
Metals 09 01165 g007
Figure 8. Schematic temperature transformation ranges of the imaginary phases for alloy 6060 T4.
Metals 09 01165 g008
Figure 9. Experimentally obtained flow curves of EN AW-6060 T4 alloy at different temperatures during cooling after the 400 °C maximum temperature, phase (B).
Metals 09 01165 g009
Figure 10. Temperature-dependent Hockett–Sherby parameters of phase (B).
Metals 09 01165 g010
Figure 11. Experimentally obtained flow curves of imaginary phase mixture A + Z respectively Z + B for alloy EN AW-6060 T4 at different temperatures during heating at 100 Ks−1.
Metals 09 01165 g011
Figure 12. Temperature-dependent Hockett–Sherby parameters of imaginary phase mixture A + Z respectively Z + B during heating.
Metals 09 01165 g012
Figure 13. Experimentally obtained flow curves of alloy EN AW-6060 T4 at different temperatures during cooling after a 250 °C maximum temperature (phase Z).
Metals 09 01165 g013
Figure 14. Temperature-dependent Hockett–Sherby parameters of phase (Z).
Metals 09 01165 g014
Figure 15. Experimentally obtained flow curves of alloy EN AW-6060 T4 at different temperatures during cooling after a 180 °C maximum temperature (phase A).
Metals 09 01165 g015
Figure 16. Temperature-dependent Hockett–Sherby parameters of phase (A).
Metals 09 01165 g016
Figure 17. Simulated phase transformations at different heating rates up to 400 °C.
Metals 09 01165 g017
Figure 18. Exemplary time-temperature and time-displacement graph for checking the simulated transformation behavior and the resulting properties.
Metals 09 01165 g018
Figure 19. Measured and simulated flow curves of alloy EN AW-6060 T4 during different heat treatments.
Metals 09 01165 g019
Figure 20. Simulated flow curves of alloy EN AW-6060 T4 during various short-time heat treatments. (A) During heating to different temperatures; (B) Distinction heating/cooling to 25 °C and 200 °C after TMax: 275 °C; (C) At 25 °C according to different maximum temperatures.
Metals 09 01165 g020
Table 1. Mass fraction of the alloying elements in the investigated alloy.
AlloyMass Fraction in %
SiFeCuMnMgCrZnAl
OES EN AW-6060 T40.400.220.070.140.560.020.02balance
DIN EN 573-3 (6060)0.3–0.60.1–0.3≤0.1≤0.10.35–0.6≤0.05≤0.15balance

