Article

Analysis of Melt-Pool Behaviors during Selective Laser Melting of AISI 304 Stainless-Steel Composites

by
Daniyal Abolhasani
1,2,
S. M. Hossein Seyedkashi
2,
Namhyun Kang
3,
Yang Jin Kim
1,
Young Yun Woo
1 and
Young Hoon Moon
1,*
1
School of Mechanical Engineering, Pusan National University, Busan 46241, Korea
2
Department of Mechanical Engineering, University of Birjand, Birjand 97175-376, Iran
3
School of Material Science and Engineering, Pusan National University, Busan 46241, Korea
*
Author to whom correspondence should be addressed.
Metals 2019, 9(8), 876; https://doi.org/10.3390/met9080876
Submission received: 29 June 2019 / Revised: 20 July 2019 / Accepted: 6 August 2019 / Published: 8 August 2019
(This article belongs to the Special Issue Numerical Modelling and Simulation of Metal Processing)

Abstract

:
The melt-pool behaviors during selective laser melting (SLM) of Al2O3-reinforced and a eutectic mixture of Al2O3-ZrO2-reinforced AISI 304 stainless-steel composites were numerically analyzed and experimentally validated. The thermal analysis results show that the geometry of the melt pool is significantly dependent on reinforcing particles, owing to the variations in the melting point and the thermal conductivity of the powder mixture. With the use of a eutectic mixture of Al2O3-ZrO2 instead of an Al2O3 reinforcing particle, the maximum temperature of the melt pool was increased. Meanwhile, a negligible corresponding relationship was observed between the cooling rate of both reinforcements. Therefore, it was identified that the liquid lifetime of the melt pool has the effect on the melting behavior, rather than the cooling rate, and the liquid lifetime increases with the eutectic ratio of Al2O3-ZrO2 reinforcement. The temperature gradient at the top surface reduces with the use of an Al2O3-ZrO2 reinforcement particle due to the wider melt pool. Inversely, the temperature gradient in the thickness direction increases with the use of an Al2O3-ZrO2 reinforcement particle. The results of melt-pool behaviors will provide a deep understanding of the effect of reinforcing particles on the dimensional accuracies and properties of fabricated AISI 304 stainless-steel composites.

Graphical Abstract

1. Introduction

Austenitic stainless steels can find more applications if their strength is improved. Hence, some studies have investigated the reinforcement of stainless steel matrices via the selective laser melting (SLM) process [1,2]. Reinforcing can be achieved through the use of Al2O3 to produce a metal matrix composite that exhibits high mechanical properties, in addition to high corrosion and wear resistance. However, Al2O3 particle has very high melting temperatures and very low thermal conductivities, which result in a very high thermal gradient during the process, causing high local stresses and crack formation [3]. The use of a eutectic mixture of Al2O3 and ZrO2 powders decreases the melting temperature of Al2O3 from 2313 K to about 2133 K [3,4]. If an optimum volume can be identified for the samples reinforced with a eutectic mixture of Al2O3-ZrO2, it can be a good alternative to strengthen the AISI 304 stainless steel.
To provide a deep understanding in relation to composites reinforced with alumina particles, this paper presents an innovative numerical study dealing with melt-pool behaviors during selective laser melting (SLM) of Al2O3-reinforced and a eutectic mixture of Al2O3-ZrO2-reinforced AISI 304 stainless-steel composites. As is well known, the dimensional accuracies and properties of fabricated composite parts are significantly dependent on the melt-pool behaviors [2,3,4].
SLM is a manufacturing technique to construct three-dimensional parts in which a high-power density laser is used to melt and fuse metallic powders [4,5,6,7]. Compared with other traditional techniques, laser processing typically does not require mechanical tooling and therefore exhibits high flexibility [8,9,10,11,12]. In SLM, the energy density should be sufficient to ensure both the melting of the powder and the bonding of the underlying substrate. If the bonds between the scan tracks and layers are weak, defects such as cracks may be generated [13,14,15,16]. The trapped gas in the melt pool can increase the number of pores in SLM-fabricated parts. Additionally, the reduction in solubility of the element during the rapid melting and cooling process can cause detrimental defects [17]. Schleifenbaum et al. [18] found that with the increase in the laser power, the rate of material evaporation and the incidence of spattering increased. These defects should be prevented by identifying appropriate process parameters of the SLM process.
The prediction of the temperature evolution in SLM is commonly performed using the finite-element (FE) method or statistical approaches. The temperature and stress fields in samples of 90W-7Ni-3F and 316L stainless steels were predicted by Zhang et al. [19] and Hussein et al. [20]. Dai and Shaw [21] simulated the transient temperature, as well as the thermal and residual stress fields. Kundakcioglu et al. [22] performed transient thermal modeling of laser-based Additive Manufacturing (AM) for 3D freeform structures.
In the case of composites, AlMangour et al. [23] presented a simulation model for predicting the temperature evolution of the melt pool of TiC/SUS316L samples. Shi et al. [24] investigated the effects of the laser power and scan speed on the melting and solidification mechanisms during SLM of TiC/Inconel718 via a simulation approach. Li et al. [1] investigated the microstructural and mechanical properties of Al2O3/316L stainless-steel metal-matrix composites (MMCs) fabricated via SLM through experimental and numerical methods.
The aforementioned studies focused on a single reinforcement particle in the case of SLM of a metal matrix composite. They did not consider an SLM composite with binary-phase reinforcement, such as a eutectic mixture. The thermal cycle in the SLM process increases the complexity of the material melting and thermal behavior, if new combinations of the reinforcements are applied [25]. The melting temperature of the powder mixture is an important microstructural feature in the thermal process, as it affects the final temperature of the surface during the heating or cooling of the melt pool. No detailed analysis involving the 3D FE modeling of a selective-laser-melted part, including the metal matrix and binary-phase reinforcement and its relationship with the geometric features of the melt pool during the process, has been performed.
In this study, a eutectic mixture of Al2O3 and ZrO2 powder particles was added to AISI 304 stainless steel as the metal-matrix media in a set of numerical simulation runs, incorporating experimental runs as validation tests. The use of a eutectic mixture of Al2O3 and ZrO2 powders reduces the melting temperature of Al2O3 particles. Hence, for a better understanding of the results, both sets of parts modeled with various weight percentages of Al2O3 and Al2O3-ZrO2 particles were considered.
For this investigation, the melt-pool dimensions and the thermal evolution of AISI 304-Al2O3 and AISI 304-Al2O3-ZrO2 SLM composites were simulated, and the predicted thermal results were described.

2. Materials and SLM System

In this study, the eutectic mixture was prepared using powders containing 58.5 wt% Al2O3 and 41.5 wt% ZrO2, corresponding to the eutectic point of the Al2O3-ZrO2 binary phase diagram [4], with the reinforcement content within the AISI 304 stainless-steel powder as the metal matrix. An experiment was performed using an SLM system with a continuous-wave, ytterbium fiber laser (IPG YLR-200, IPG Photonics, Burbach, Germany), as shown in Figure 1. The maximum available power of 200 W at 6 A was used, and the laser scanning was controlled using a scanner (hurrySCAN®20, SCANLAB, Puchheim, Germany). Argon gas was used as a shielding gas to prevent oxidation in the melt pool. The layering bar spread the powder, and the build cylinder moved vertically to control the powder-bed height. During the numerical and experimental runs, a 30-μm-thick layer of powder mixture was used. The laser spot diameter was fixed at 80 μm. The laser power and scanning velocity were selected after conducting a large number of preliminary experiments associated with the single-line formation tests.
The laser power and scan speed were 200 W and 732 mm/s, respectively. For comprehensive comparison, various weight percentages of Al2O3 and the eutectic mixture of Al2O3-ZrO2 were employed in the reinforcing experiments, as shown in Table 1.

3. FE Modeling

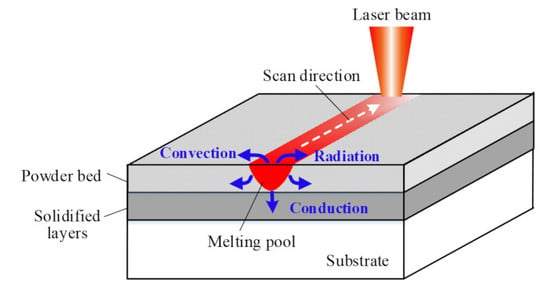
3.1. Physical Description of Model

A 3D model was developed, and the ABAQUSTM commercial software (version 6-14, Dassault Systems, Providence, RI, USA) was utilized to simulate volumetric laser energy deposition with a Gaussian distribution. A schematic of the SLM process, which shows the interactions between the laser beam and powder bed, as well as the melting-pool dimensions and solidification, is presented in Figure 2a. A square composite powder layer with dimensions of 7 mm × 7 mm × 0.030 mm was placed on a stainless-steel substrate. The powder bed was meshed with eight-node linear hexahedral elements with a size of 70 × 10−6 m that were distributed uniformly throughout the powder-bed model, as shown in Figure 2b. The sweep method was used to mesh the substrate and accurately capture the flux distribution of the moving laser beam.

3.2. Initial Governing Equation

In the powder-bed additive layer manufacturing system with a moving laser source, the heat-transport equation for 3D Cartesian coordinate systems is expressed as follows [22]:
ρ · C p · T t   =   x ( k · T x )   +   y ( k · T y )   +   z ( k · T z )   +   ρ · C p · v · T x   +   Q ,
where T is the temperature (K), ρ is the density (kg/m3), Cp is the specific heat (J/(kg∙K)), k is the thermal conductivity (W/m K), and ∇ is the differential or gradient operator. Q is the rate of internal energy conversion per unit volume (referred to as the source term, W/m3).
The corresponding boundary condition was [20]:
T z   =   h k ( T     T 0 )   +   ε   ϐ k ( T 4     T 0 4 ) ,
where T is the surface temperature of the powder bed, z is the axis perpendicular to the powder surface, h = 200 [26] is the forced-convection heat-transfer coefficient (W/m2 K) due to argon gas, ε = 0.8 is the emissivity of the heated surface, and ϭ = 5.6703 × 10⁻⁸ W/m2K4 is the Stefan–Boltzmann constant.

3.3. Heat-Source Model

The travel distance of the laser beam into the powder media (z), which is schematically presented in Figure 2c, can be modeled using a volumetric heat source (Q(x, y, z)) [27]:
Q ( x ,   y ,   z )   =   ( 1     R )   ɳ   A   P π r 0 2   e x p ( ɳ ( x 2 + y 2 ) r 0 2 ) e x p ( 1 d   z ) ,
where R is the surface reflectivity of the powder mixture, and ɳ is a shape parameter of the heat-flux distribution, ɳ = 2. A is the laser-absorption coefficient of the irradiated surface and it was modified during numerical validation. P is the laser power (W), r 0 is the laser-beam radius (m), x and y are the Cartesian coordinates at the surface, and z is the Cartesian coordinate perpendicular to the powder bed. d is the penetration depth equal to 40 µm for the SLM process [27].
The surface reflectivity of the powder mixture (R) is expressed as follows [25,28]:
R   =   i = 1 n R ( i )   β ( i )   w ( i ) ρ ( i ) i = 1 n β ( i )   w ( i ) ρ ( i ) ,
Here, in accordance with the three components utilized in this study (AISI 304, Al2O3, and ZrO2), n is 3; i is a subscript referring to a specific mixture component; R(i) is the surface reflectance of component i; β(i) is the extinction coefficient of component i, ρ(i) is the density of component i, and w(i) is the weight percentage of component i in the mixture.
The extinction coefficient β is defined as [29]:
β   =   3   ( 1 ϕ ) 2   ϕ   D ,
where ϕ is the porosity of the bed, and D is the average particle diameter of the powder. The powder density was calculated using the following equation [26]:
ρpowder = (1 – ϕ) ρbulk,
The laser-absorption coefficient of a powder bed with a Gaussian distribution (Apowder) was estimated using the absorption coefficient of the bulk material (Abulk) [30]:
Apowder = 0.0413 + 2.89Abulk – 5.36A2bulk + 4.50A3bulk,
The values of A in Equation (3) were calculated according to the linear rule of mixtures [31]:
A = w1·A1 + w2·A2 + w3·A3,
where w1, w2, and w3 represent the volumetric contents of the three components in the mixture, and A1, A2, and A3 represent the absorption coefficients of the components ( i = 1 3 w i = 1 , 0 ˂ A ˂ 1). The final values of A applied in Equation (3) were obtained through numerical validations, as discussed in Section 4.1.
The parameters presented in Table 2 were obtained from the material supplier and previous works [26,32], as well as an online source. Then, the corresponding values were calculated using Equations (4)–(8).

3.4. Physical Properties of Materials

The values of k are expressed by the following equations [29,31,33], where T is the temperature and the superscripts s and m correspond to “solidus” and “melting”, respectively.
k = { for   AISI   304 ,   T   <   T s   : k p o w d e r =   k b u l k ( 1 ϕ ) n ,   n = 4 for   Al 2 O 3   and   ZrO 2 ,   T   <   T s   : k   p o w d e r k a t m   =   1     1     ϕ   ( 1 +   ϕ   k r a d k a t m )   +   1     ϕ   ( 2 1   k a t m k b u l k   ( 1 1   k a t m k b u l k   ln ( k b u l k k a t m ) 1 ) +     k r a d k a t m ) , for   all   components ,   T s   <   T   <   T m : k   =   ( k 0   b u l k   ( T m )   k 0   p o w d e r   ( T s ) T m   T s   ( T     T s ) +   k 0   p o w d e r     ( T s ) ) × 10 3 for   mixture , T   <   T s , T s   <   T   <   T m   :   k m i x t u r e = w 1 k 1 + w 2 k 2 + w 3 k 3 for   mixture ,   T T m : k m i x t u r e =   k 1 ( k 2   ( 1 + 2 w 2 ) k 1 ( 2 w 2 2 ) k 1 ( 2 + w 2 )   k 2 ( 1 w 2 ) )   ,     w 2   <   w 1   , k 1   =   k 1   b u l k , k 2   =   k 2   b u l k
Here, Katm is the thermal conductivity of the ambient atmosphere and is 0.018 for argon gas; ϕ is the porosity of the powder bed; k0 is the thermal conductivity at the ambient temperature; Krad is the thermal conductivity due to the radiation among the particles in the powder bed and is evaluated as in [29]:
Krad = 4F·бT3·D,
where F = 1/3 is the view factor; б is the Stefan–Boltzmann constant; T is the temperature; and D is the average particle diameter of the powder.
C p = { for   all   components ,     T s   <   T   <   T m   : C p =   C p 0 +   ( 1 ( T m   T s ) π   e ( T   T m T m   T s ) )   ×   L   for   mixture ,     T   <   T s ,   T s   <   T   <   T m   : C p m i x t u r e = w 1 C p 1 + w 2 C p 2 + w 3 C p 3 for   mixture ,   T T m ;   C p   of   mixture   was   not   available   ,
Here, Cp0 is the specific heat capacity at the ambient temperature, L is the latent heat of melting, and Cp1, Cp2, and Cp3 are the specific heat capacities of the three components [33].
ρ = { for   AISI   304 ,   T   <   T s   : ρ =   ρ 1 for   Al 2 O 3   and   ZrO 2 ,   T   <   T s   :   ρ = ρ 0 for   all   components ,   T s   <   T   <   T m   :   ρ = ( 1 T T s T m T s ) ρ 0 + ( T T s T m T s ) ρ   0   b u l k for   mixture ,    T   <   T s ,   T s   <   T   <   T m   :   ρ m i x t u r e = w 1 ρ 1 + w 2   ρ 2 + w 3   ρ 3 for   mixture ,     T T m :   ρ m i x t u r e = w 1   ρ b u l k   1 + w 2   ρ b u l k   2 + w 3   ρ b u l k   3 ,
Here, ρ1, ρ2 and ρ3 are the densities of the 304 stainless-steel, Al2O3 and ZrO2 powder components, respectively. ρ0 is the density of the powder component at the ambient temperature [31,33,34]. Note that ρpowder = ρbulk when ϕ = 0 at the melting point.
The phase change was included in the model by using the definition of the latent heat of melting. The Ts of the component with the lowest value (1615 K for AISI 304 stainless steel) and the Tm of the component with the highest value were used for the mixture when simulating composite parts. The solution-dependent state variables of the three fields (powder, solid, and liquid) were based on the density of the mixture (ρ) using a User Defined Field (USDFLD) subroutine.

4. Results and Discussion

To analyze melt-pool behaviors, cross-sectional views of the melt pools obtained from experimental and numerical models are compared first. Additional simulation results are then presented to exhibit the temperature effects on the liquid lifetime of the melt pools. The effect of temperature gradient on microstructural features is also discussed.

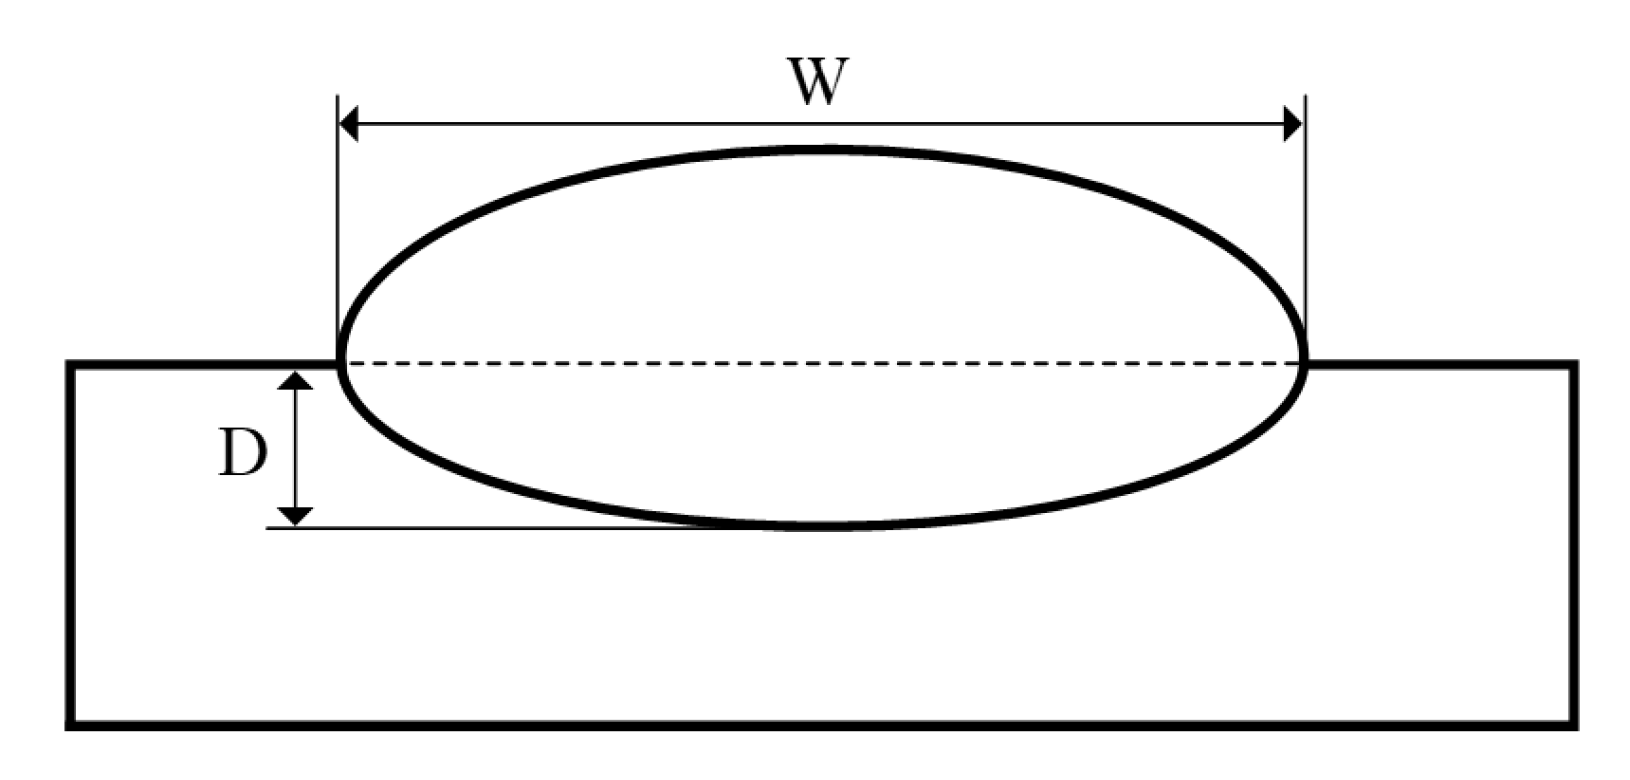
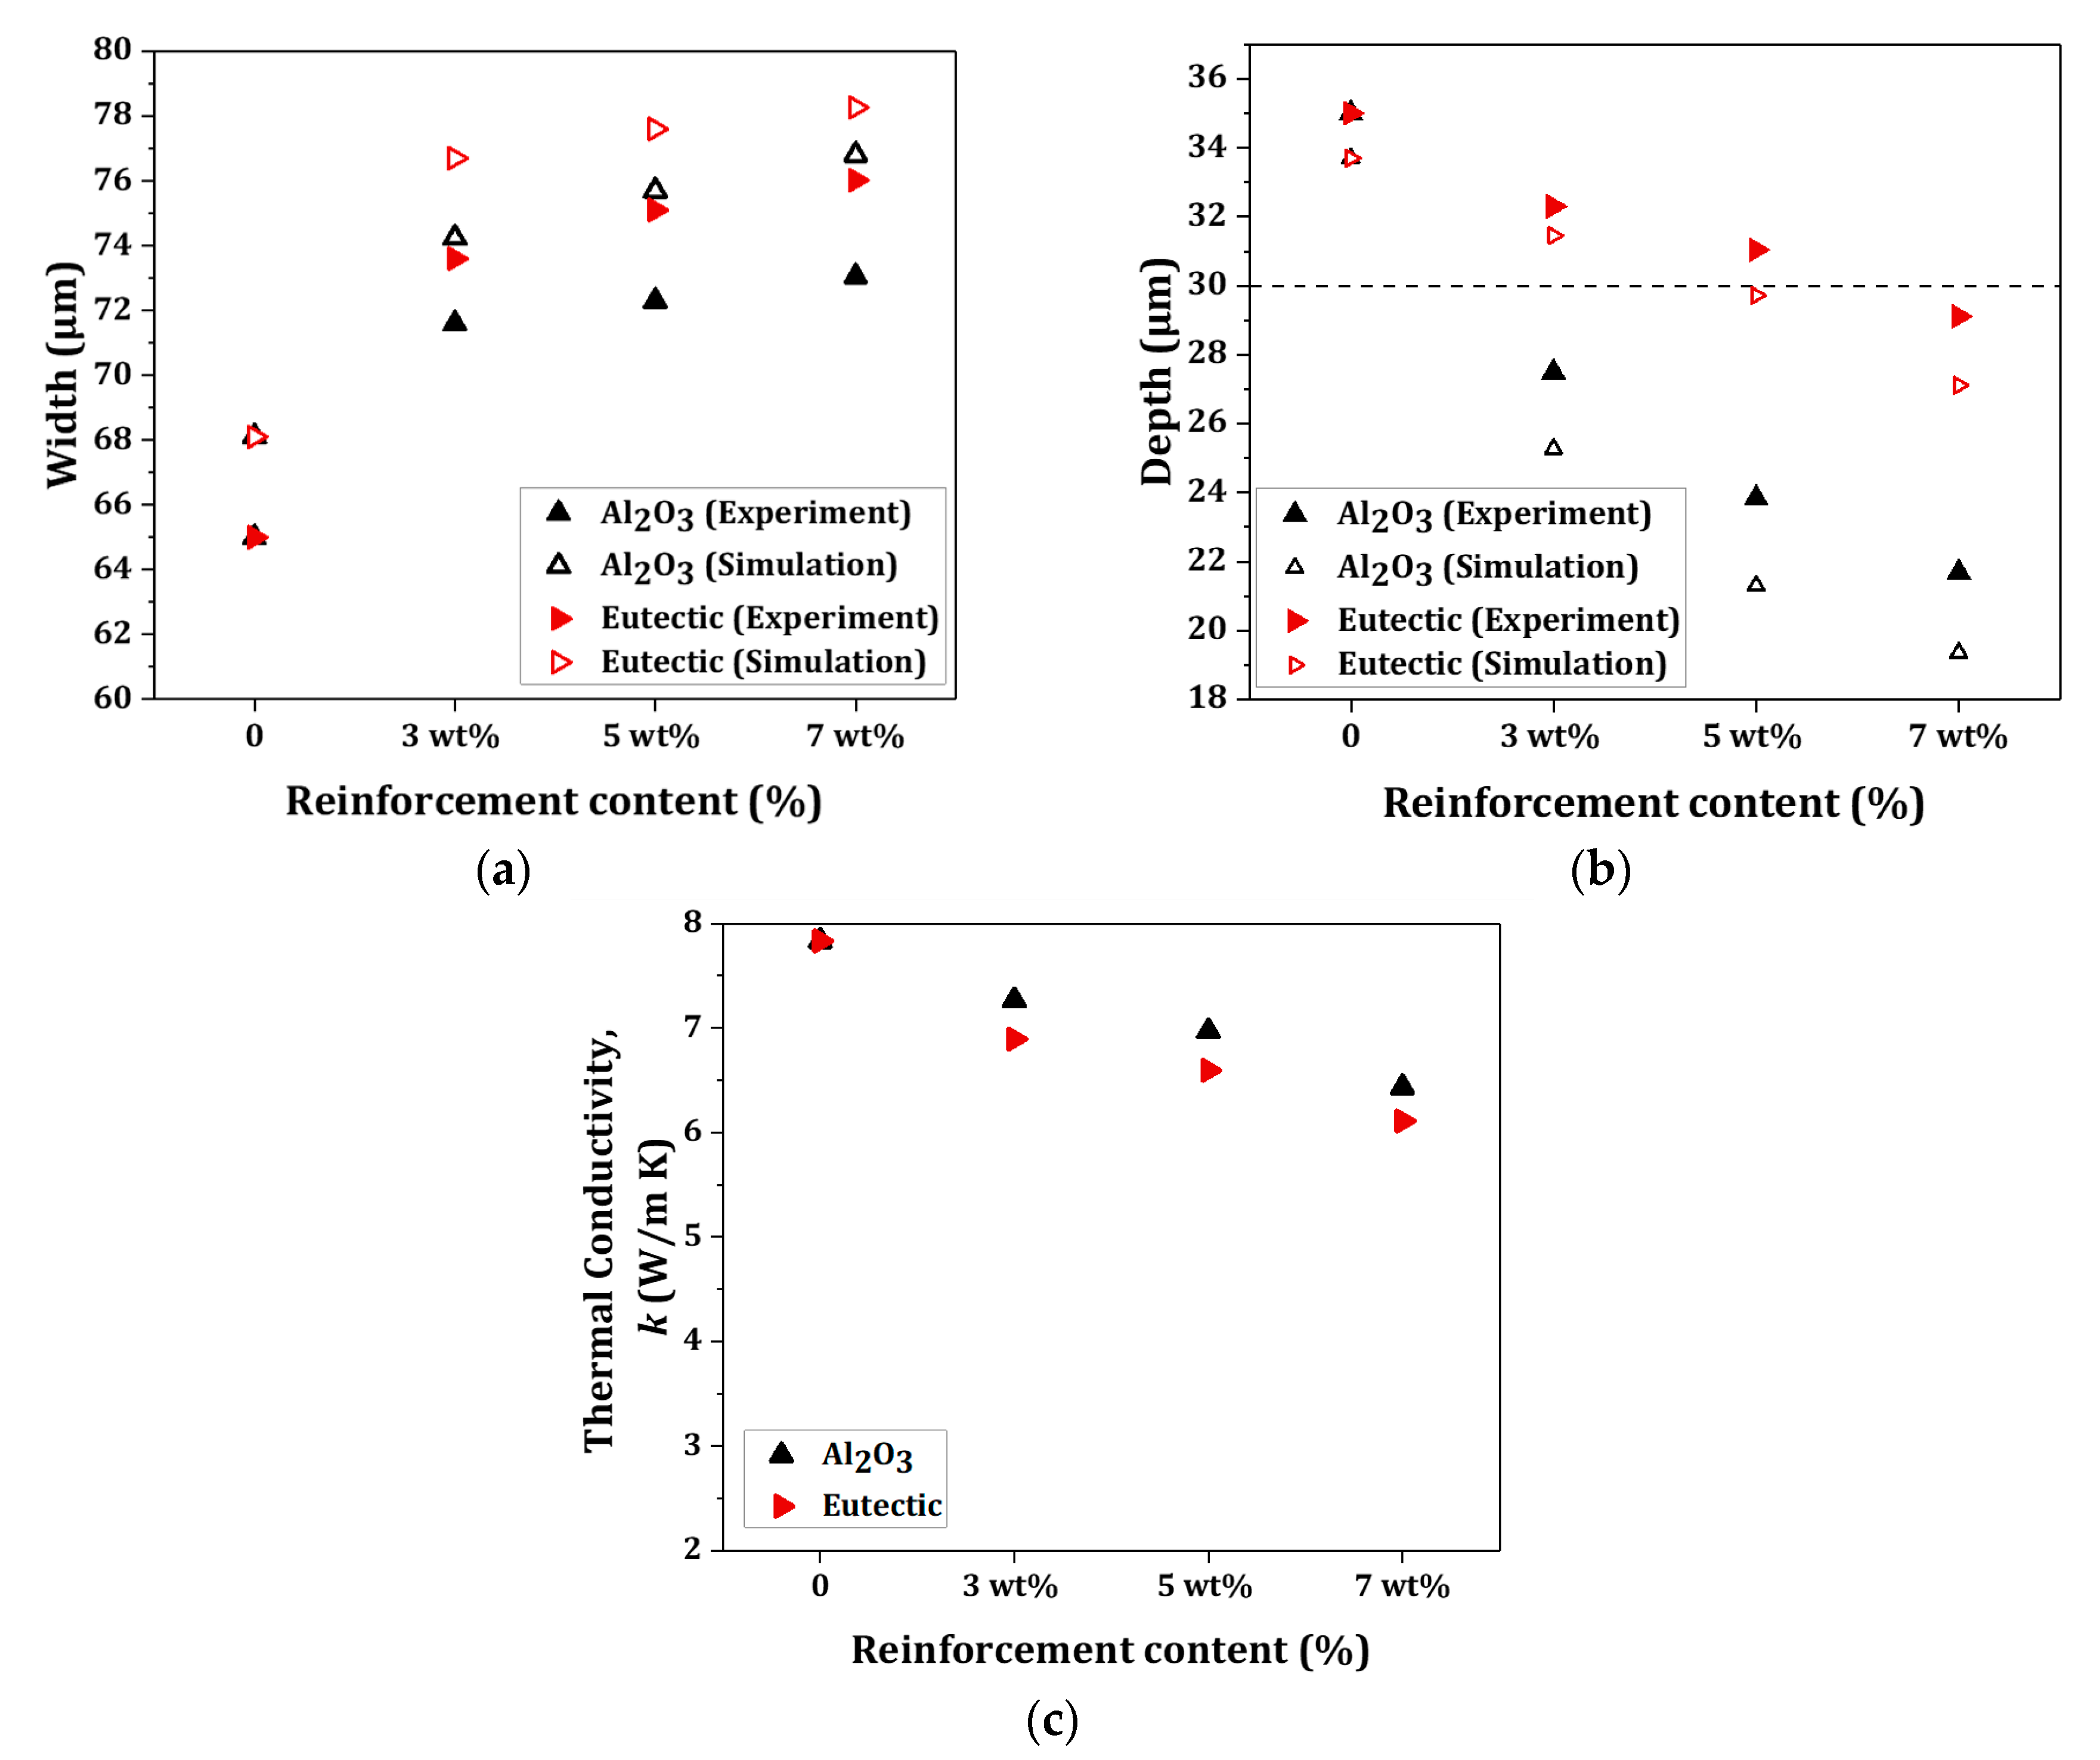
4.1. Numerical Validation and Melt-Pool Characterization

To reduce the simulation time, the single track of conditions presented in Table 1 was modeled. The numerical model was validated using the calculated dimensions of the melt pool and compared with the experimental results of the single-line formation test. Image processing was performed on the cross-sectional optical micrograph to evaluate the melt-pool morphology, as shown in Figure 3.
The melt-pool boundary was distinguished by the melting-temperature line of the numerical-simulation thermal field. Thus, the width and depth of the numerical melt pool were compared with the average width and depth of the experimental melt pool.
Through numerical validation, the best results for the melt-pool dimensions were obtained by changing the absorption coefficient (A) of the mixture. The experimental and numerical cross-sections of three samples—pure AISI 304, 3 wt% Al2O3, and 3 wt% Al2O3-ZrO2 (eutectic mixture)—are shown in Figure 4a–f. The black lines in the cross-section of the simulated conditions represent the melt-pool boundaries, which are the melting temperatures, i.e., 1670 K for pure AISI 304, 2313 K for Al2O3 reinforced, and 2133 K for the eutectic mixture reinforced samples [4].
The experimental and numerical melt pools exhibited similar shapes. The width and depth of the melt pools under the conditions listed in Table 1 are plotted in Figure 5a,b, respectively. The two reinforced composites exhibited slight differences in width, and the width of the melt pool was smaller for the pure AISI 304 sample. As thermal conduction is the most influential factor for the melt pool [29], the results are attributed to the lower thermal conductivity in the reinforced samples compared with the pure AISI 304, as shown in Figure 5c at 800 K. The Al2O3-reinforced composite exhibited the smallest melt-pool depth among the samples, as it had the highest melting point, making it difficult for the molten powders to penetrate deep inside the melting pool. The larger melt-pool width and depth for the eutectic-reinforced sample compared with the Al2O3-reinforced sample at each weight percentage are attributed to the reduction in the melting point, along with the reduction in the thermal conductivity.

4.2. Temperature Distribution and Liquid Lifetime

The variation of the temperature with the time needed for scanning a single path during the process, with different weight percentages of reinforcement contents, is explored. The center point of the top surface shown in Figure 6a is considered for plotting the corresponding temperature-time profiles shown in Figure 6b. Figure 6c,d also exhibit the maximum temperature of the top surface and melt-pool lifetime reaching to 300 K for each condition, respectively. As the eutectic mixture of Al2O3-ZrO2 is replaced with the Al2O3 reinforcing particle, the maximum temperature is increased significantly due to the reduction in the thermal conductivity and latent heat of the mixture. Also according to Figure 6b, concerning the slope of the cooling curve as the cooling rate, this rate decreased especially in the cases with 7 wt% of reinforcement particles. The simulation results show that as the reinforcement content increases, the cooling rate decreases. The main factor affecting the maximum temperature in various weight percentages of a specific reinforcement in the simulations is identified to be the absorption coefficient. The absorption coefficient of the mixtures was calculated using Equation (8) and exhibited a decreasing trend when increasing a reinforcement content, as is shown in Figure 6e. It is important to note that the cooling rate, i.e., the slope of the cooling curve of Al2O3 and Al2O3-ZrO2 systems upon each weight percentage of the reinforcing particle, showed a negligible discrepancy. From the cooling step in simulation runs, the liquid lifetime of the melt pool is distinguished. From Figure 6d, it can be seen that the liquid lifetime increases with the use of a eutectic ratio of Al2O3-ZrO2 reinforcement. Meanwhile, it also rises as the reinforcement content increases. Because the gas atoms are released from the lattice in the heat-affected zone, yielding a longer liquid lifetime in samples with a high weight percentage of reinforcement, e.g., 7 wt%, may result in the formation of a higher amount of gas. It is reported that this phenomenon may cause the formation of porosity in SLM-produced parts [35]. This was explored by multi-line formation tests shown in Figure 7, where the presence of cracks is evident in the reinforced sample with 7 wt% Al2O3-ZrO2, seen in Figure 7f. On the other hand, a short liquid lifetime of the melt pool combined with a lower temperature, observed in the sample with 3 wt% Al2O3, is detrimental for wetting the farther gaps of powders, which generated some inter-gaps, as observed in Figure 7a. This can also be observed in Figure 5b, in which in the sample with 3 wt% Al2O3 is shown, and the depth of the melt pool cannot reach to the powder bed thickness indicated by the dashed line, i.e., 30 µm. This can be expanded to other reinforced samples with Al2O3 particles, where lower temperatures and shorter liquid lifetimes are seen compared with reinforced samples with eutectic mixtures. An appropriate weight percentage of the reinforcement particle of Al2O3 or the eutectic mixture of Al2O3-ZrO2 plays an important role in the SLM process of AISI 304 stainless-steel composites. In the case of 3 wt% Al2O3-ZrO2, the formation of an uneven surface, as observed in Figure 7d, is the reason for which it is not regarded as an optimum condition. A proper temperature to melt the particles with appropriate liquid lifetime and melt-pool depth was achieved using a 3 wt% eutectic mixture. Considering a more moderate condition for liquid lifetime, however, the sample of 5 wt% eutectic mixture shows a reasonable trend, as indicated by Figure 6b–d and Figure 7e. From the above observation and discussion, it is evident that the melt-pool lifetime has an effect on the melting behavior, rather than the cooling rate.

4.3. Temperature Gradient

As SLM is an unsteady-state process, temperature gradients along surface direction and thickness direction are unavoidable. The heating and solidification during the process will alter the temperature gradient. This affects the microstructural features, such as grain morphology, grain size and its size distribution, as well as residual stress accumulation due to a large temperature gradient. In general, the unstable material flow, warpage and delamination between fabricated layers are detrimental results of process-induced stresses [36,37,38].
The slope of the curve of temperature distribution presents the temperature gradient of the material [20]. Figure 8a,b show the effects of reinforcement contents on the temperature distribution along the Y-direction at the top surface and Z-direction, or thickness direction, during SLM of Al2O3/Al2O3-ZrO2, AISI 304 systems. With the use of an Al2O3-ZrO2 reinforcement system, the temperature gradient at the top surface reduces. This can be recognized in Figure 8a by reducing the slope of the curve of temperature distribution compared with those of Al2O3 systems with similar weight percentages of reinforcement content. The generation of a wider melt pool, seen in Figure 5a, or the observation of a larger temperature distribution, seen in Figure 6b, are responsible for this observation. In Figure 8b, the temperature gradient in the thickness direction (Z-direction) of the melt pool is larger in Al2O3-ZrO2-reinforced composites than those of Al2O3-reinforced composites. The temperature at the bottom area of the powder bed, shown on a vertical dashed line in Figure 8b, yields higher magnitudes in Al2O3-ZrO2 reinforced samples, but the slope of the plot or temperature gradient in the powder bed is higher compared with Al2O3 samples. When a large temperature gradient in the thickness direction is accompanied by a larger depth of the melt pool, as seen in Figure 5b, this may imply a larger dissipation of laser energy through the pre-fabricated layers or metal substrate. So, it can exert a larger liquid flow in the melt pool in Al2O3-ZrO2 samples.
Liquid flow in the melt pool is an important issue in processes related to molten metals. The free surface energy, which is changed by local heating or cooling, is used to drive liquid metal. However, the term “free surface energy” is not commonly used in regard to liquids and refers to the “gradient in the surface tension” [39]. Thus, the thermal creep in different directions can be obtained by applying a temperature gradient to the surfaces, because heating a surface causes the surface tension to decrease or increase. Inhomogeneities in the gradient of the temperature of a liquid surface generate forces related to the Marangoni effect. This effect can typically be defined as a dimensionless number (M) in the characterization of flows, as indicated by Equation (13) [39].
M   =   | d γ d T | × | d T d i | × L 2 μ   α ,
Here, /dT is the surface-tension gradient or surface-tension temperature coefficient (N m−1 K−1), dT/di is the temperature gradient (K m−1) along a specific direction of i, L is the characteristic length (m), µ is the dynamic viscosity (N m−2 s), and α is the thermal diffusivity (m2 s−1). The characteristic length (L) can be considered in processes involving melting, such as welding and AM, for generating deep penetration of surfactants, joints, or additives. For evaluating the convection of the minimum length between the highest temperature (Tmax) and the lowest temperature (Tmin = 300) along the melt-pool depth, as schematically shown in Figure 8c, the horizontal dashed line drawn at 300 K in Figure 8b can illustrate this length. Following the points of minimum temperatures in the Z-direction on the horizontal dashed line in this figure, for all the models the distance between the points of the maximum and minimum temperatures (L) decreased with the increase in the reinforcement content within the metal matrix. The decrease in the maximum temperature at the top surface observed in Figure 6c may be related to the decrease in the distance between the points of the maximum and minimum temperatures, i.e., L. However, a significant discrepancy is observed between, e.g., 3 wt% Al2O3-reinforced and 3 wt% eutectic-reinforced samples and so on. From a numerical viewpoint, this may be due to the higher melting temperature and hence the smaller melt-pool depth in the Al2O3-reinforced sample, as previously discussed. Because the thermocapillary (Marangoni) convection always flows from a lower-surface tension region to a higher-surface tension region [39], the larger temperature gradient in each direction causes a larger Marangoni convection in that direction. As a result, when applying the Al2O3 reinforcement particle, the Marangoni flow at the top surface increases, which may benefit processes such as surface alloying/hardening. While using the Al2O3-ZrO2 reinforcement particle, the Marangoni flow at the thickness direction increases, which can benefit processes such as 3D-printing. The micro-hardness measurements of the multi-layered samples were investigated at different locations, as shown in Figure 8d, based on the American Society for Testing and Materials (ASTM) E384-16 standard. Figure 8e illustrates that with the use of reinforcement particles, an improvement in the micro-hardness of the fabricated parts is achieved. However, it can be seen that the discrepancy between the micro-hardness of Al2O3-reinforced samples and the eutectic ratio of Al2O3-ZrO2 reinforced samples becomes narrower at the top layer, indicating an improvement in reinforcement particles’ distribution towards the surface in Al2O3-reinforced samples.

5. Conclusions

Melt-pool behaviors during selective laser melting (SLM) of Al2O3-reinfored and a eutectic mixture of Al2O3-ZrO2-reinforced AISI 304 stainless-steel composites were analyzed both numerically and experimentally, and the following conclusions are drawn.
(1)
A 3D FE model for the SLM of Al2O3-reinforced and eutectic Al2O3-ZrO2-reinforced AISI 304 steel composite powders was developed and successfully employed to compare the effects of the reinforcing materials on the melt-pool behaviors.
(2)
The width and depth of the melt pool were larger for the eutectic-reinforced sample, which is mainly attributed to the reduction in the melting point and thermal conductivity in this sample. With the use of the eutectic Al2O3-ZrO2 instead of the Al2O3 reinforcing particle, the maximum temperature is increased due to the reduction in the thermal conductivity and latent heat of the mixture.
(3)
As the reinforcement content increases, the cooling rate decreases. The liquid lifetime of the melt pool has the effect on the melting behavior, rather than the cooling rate, and the liquid lifetime increases with the use of a eutectic ratio of Al2O3-ZrO2 reinforcement. An average and moderate condition for the liquid lifetime was identified to be 5 wt% for the eutectic mixture.
(4)
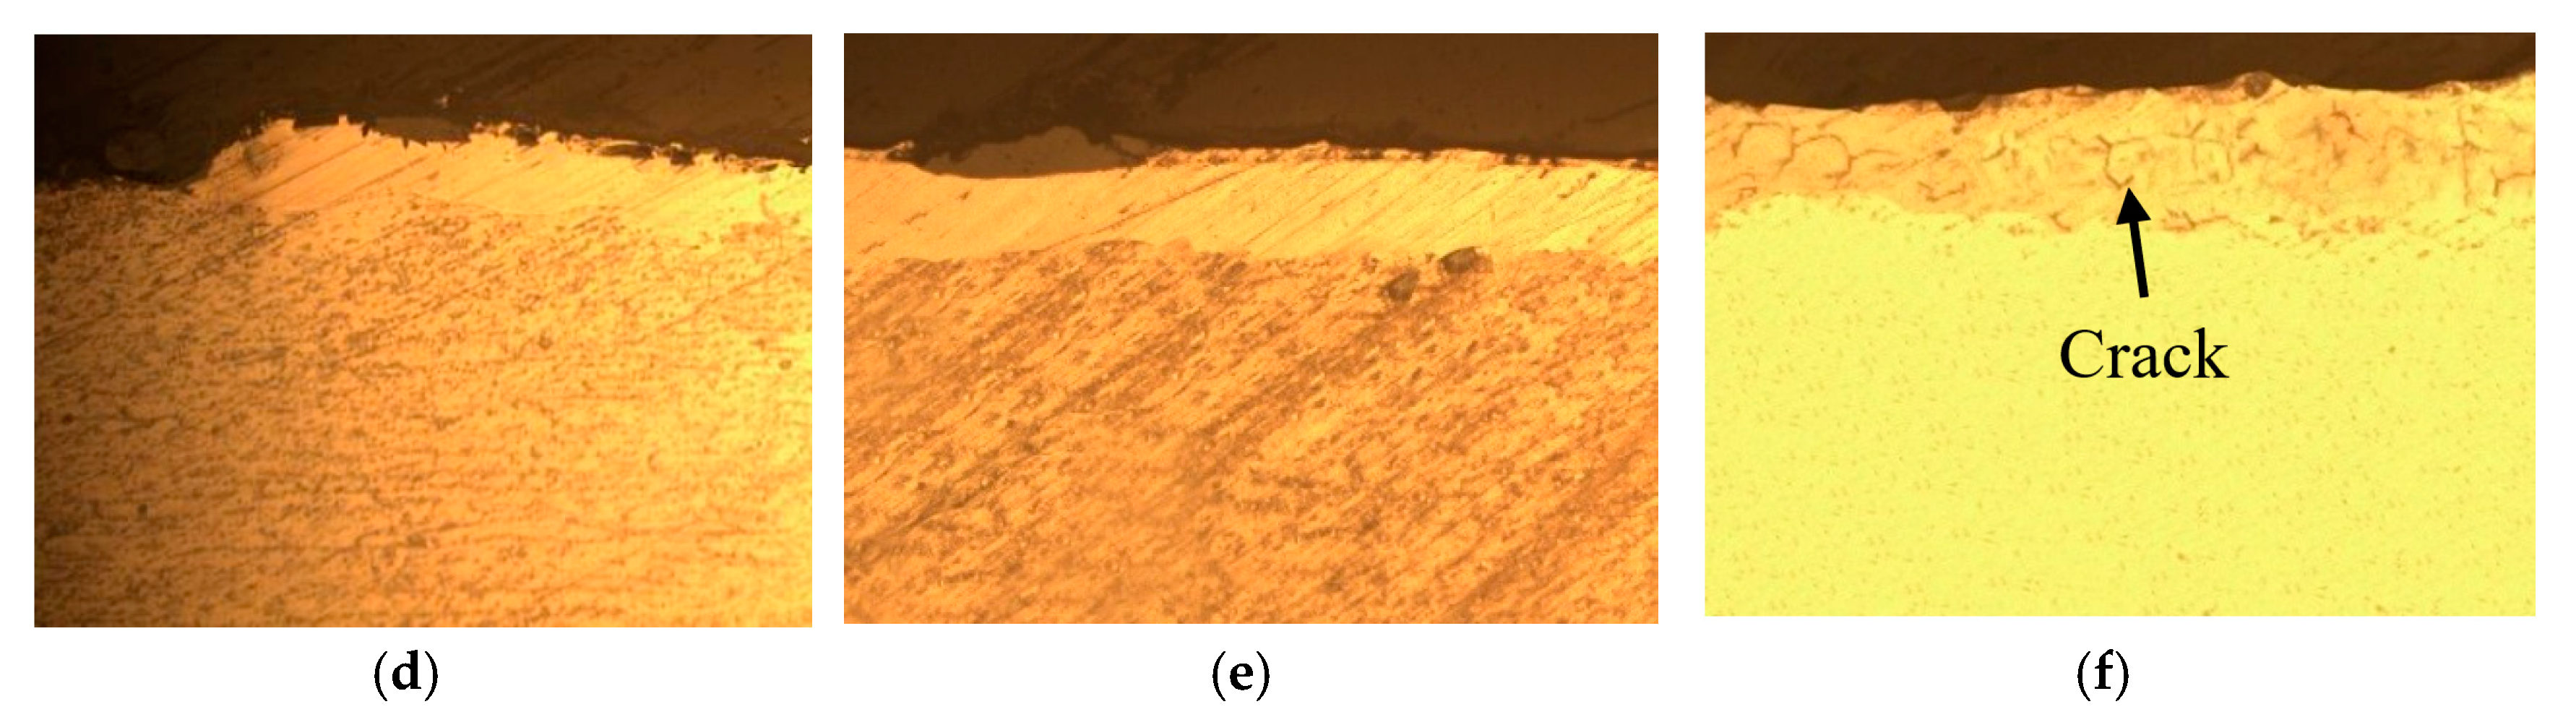
With the use of a eutectic Al2O3-ZrO2 reinforcing particle, the temperature gradient at the top surface reduces compared with the Al2O3-reinforced sample, due to a wider melt pool and a larger temperature distribution. This led to a narrower discrepancy between the micro-hardness of Al2O3-reinforced samples and the eutectic ratio of Al2O3-ZrO2-reinforced samples at the top layer, indicating an improvement in reinforcement particles’ distribution towards the surface in Al2O3-reinforced samples. The molten-pool behaviors and the thermal evolution of AISI 304 stainless-steel composites during the selective laser melting process will provide a deep understanding of the effect of reinforcing particles on the shape accuracies and properties of fabricated products.

Author Contributions

Conceptualization, Y.J.K.; Investigation, D.A. and Y.Y.W.; Methodology, S.M.H.S.; Supervision, Y.H.M.; Validation, N.K.

Funding

This work was supported by a National Research Foundation of Korea (NRF) grant (No. 2012R1A5A1048294) funded by the Korean Government (Ministry of Science, ICT and future Planning).

Conflicts of Interest

The authors declare no conflict of interest.

References

  1. Li, X.; Willy, H.J.; Chang, S.; Lu, W.; Herng, T.S.; Ding, J. Selective laser melting of stainless steel and alumina composite: Experimental and simulation studies on processing parameters, microstructure and mechanical properties. Mater. Des. 2018, 145, 1–10. [Google Scholar] [CrossRef]
  2. AlMangour, B.; Grzesiak, D.; Yang, J.M. Selective laser melting of TiC reinforced 316L stainless steel matrix nanocomposites: Influence of starting TiC particle size and volume content. Mater. Des. 2016, 104, 141–151. [Google Scholar] [CrossRef]
  3. Yves-Christian, H.; Jan, W.; Wilhelm, M.; Konrad, W.; Reinhart, P. Net shaped high performance oxide ceramic parts by selective laser melting. Physics Procedia 2010, 5, 587–594. [Google Scholar] [CrossRef]
  4. Wilkes, J.; Hagedorn, Y.C.; Meiners, W.; Wissenbach, K. Additive manufacturing of ZrO2-Al2O3 ceramic components by selective laser melting. Rapid Prototyp. J. 2013, 19, 51–57. [Google Scholar] [CrossRef]
  5. Jang, J.H.; Joo, B.D.; Van Tyne, C.J.; Moon, Y.H. Characterization of deposited layer fabricated by direct laser melting process. Met. Mater. Int. 2013, 19, 497–506. [Google Scholar] [CrossRef]
  6. Hwang, T.W.; Woo, Y.Y.; Han, S.W.; Moon, Y.H. Fabrication of mesh patterns using a selective laser-melting process. Appl. Sci. 2019, 9, 1922. [Google Scholar] [CrossRef]
  7. Joo, B.D.; Jang, J.H.; Lee, J.H.; Son, Y.M.; Moon, Y.H. Selective laser melting of Fe-Ni-Cr layer on AISI H13 tool steel. Trans. Nonferrous Met. Soc. China 2009, 19, 921–924. [Google Scholar] [CrossRef]
  8. Altan, T.; Lilly, B.; Yen, Y.C.; Altan, T. Manufacturing of dies and molds. CIRP Ann. 2001, 50, 404–422. [Google Scholar] [CrossRef]
  9. Kim, S.Y.; Joo, B.D.; Shin, S.; Van Tyne, C.J.; Moon, Y.H. Discrete layer hydroforming of three-layered tubes. Int. J. Mach. Tools Manuf. 2013, 68, 56–62. [Google Scholar] [CrossRef]
  10. Karnati, S.; Zhang, Y.; Liou, F.F.; Newkirk, J.W. On the feasibility of tailoring copper–nickel functionally graded materials fabricated through laser metal deposition. Metals 2019, 9, 287. [Google Scholar] [CrossRef]
  11. Han, S.W.; Woo, Y.Y.; Hwang, T.W.; Oh, I.Y.; Moon, Y.H. Tailor layered tube hydroforming for fabricating tubular parts with dissimilar thickness. Int. J. Mach. Tools Manuf. 2019, 138, 51–65. [Google Scholar] [CrossRef]
  12. Abazari, H.D.; Seyedkashi, S.M.H.; Gollo, M.H.; Moon, Y.H. Evolution of microstructure and mechanical properties of SUS430/C11000/SUS430 composites during the laser-forming process. Met. Mater. Int. 2017, 23, 865–876. [Google Scholar] [CrossRef]
  13. Zhao, J.R.; Hung, F.Y.; Lui, T.S.; Wu, Y.L. The relationship of fracture mechanism between high temperature tensile mechanical properties and particle erosion resistance of selective laser melting Ti-6Al-4V alloy. Metals 2019, 9, 501. [Google Scholar] [CrossRef]
  14. Hwang, T.W.; Woo, Y.Y.; Han, S.W.; Moon, Y.H. Functionally graded properties in directed-energy-deposition titanium parts. Opt. Laser Technol. 2018, 105, 80–88. [Google Scholar] [CrossRef]
  15. Jang, J.H.; Lee, J.H.; Joo, B.D.; Moon, Y.H. Flow characteristics of aluminum coated boron steel in hot press forming. T. Nonferr. Metal. Soc. 2009, 19, 913–916. [Google Scholar] [CrossRef]
  16. Seo, D.M.; Hwang, T.W.; Moon, Y.H. Carbonitriding of Ti-6Al-4V alloy via laser irradiation of pure graphite powder in nitrogen environment. Surf. Coat. Technol. 2019, 363, 244–254. [Google Scholar] [CrossRef]
  17. King, W.; Anderson, A.T.; Ferencz, R.M.; Hodge, N.E.; Kamath, C.; Khairallah, S.A. Overview of modelling and simulation of metal powder bed fusion process at Lawrence Livermore National Laboratory. Mater. Sci. Technol. 2015, 31, 957–968. [Google Scholar] [CrossRef]
  18. Schleifenbaum, H.; Meiners, W.; Wissenbach, K.; Hinke, C. Individualized production by means of high power selective laser melting. CIRP J. Manuf. Sci. Technol. 2010, 2, 161–169. [Google Scholar] [CrossRef]
  19. Zhang, D.Q.; Cai, Q.Z.; Liu, J.H.; Zhang, L.; Li, R.D. Select laser melting of W–Ni–Fe powders: Simulation and experimental study. Int. J. Adv. Manuf. Technol. 2010, 51, 649–658. [Google Scholar] [CrossRef]
  20. Hussein, A.; Hao, L.; Yan, C.; Everson, R. Finite element simulation of the temperature and stress fields in single layers built without-support in selective laser melting. Mater. Des. 2013, 52, 638–647. [Google Scholar] [CrossRef]
  21. Dai, K.; Shaw, L. Thermal and mechanical finite element modeling of laser forming from metal and ceramic powders. Acta Mater. 2004, 52, 69–80. [Google Scholar] [CrossRef]
  22. Kundakcioglu, E.; Lazoglu, I.; Rawal, S. Transient thermal modeling of laser-based additive manufacturing for 3D freeform structures. Int. J. Adv. Manuf. Technol. 2016, 85, 493–501. [Google Scholar] [CrossRef]
  23. AlMangour, B.; Grzesiak, D.; Cheng, J.; Ertas, Y. Thermal behavior of the molten pool, microstructural evolution, and tribological performance during selective laser melting of TiC/316L stainless steel nanocomposites: Experimental and simulation methods. J. Mater. Process. Technol. 2018, 257, 288–301. [Google Scholar] [CrossRef]
  24. Shi, Q.; Gu, D.; Xia, M.; Cao, S.; Rong, T. Effects of laser processing parameters on thermal behavior and melting/solidification mechanism during selective laser melting of TiC/Inconel 718 composites. Opt. Laser Technol. 2016, 84, 9–22. [Google Scholar] [CrossRef]
  25. Wang, L.; Jue, J.; Xia, M.; Guo, L.; Yan, B.; Gu, D. Effect of the Thermodynamic behavior of selective laser melting on the formation of in situ oxide dispersion-strengthened aluminum-based composites. Metals 2016, 6, 286. [Google Scholar] [CrossRef]
  26. Fan, Z.; Lu, M.; Huang, H. Selective laser melting of alumina: A single track study. Ceram. Int. 2018, 44, 9484–9493. [Google Scholar] [CrossRef] [Green Version]
  27. Vastola, G.; Zhang, G.; Pei, X.Q.; Zhang, Y.W. Modeling the microstructure evolution during additive manufacturing of Ti6Al4V: A comparison between electron beam melting and selective laser melting. JOM 2016, 68, 1370–1375. [Google Scholar] [CrossRef]
  28. Gusarov, A.V.; Kruth, J.P. Modelling of radiation transfer in metallic powders at laser treatment. Int. J. Heat Mass Transfer 2005, 48, 3423–3434. [Google Scholar] [CrossRef]
  29. Sih, S.S.; Barlow, J.W. The prediction of the emissivity and thermal conductivity of powder beds. Part. Sci. Technol. 2004, 22, 427–440. [Google Scholar] [CrossRef]
  30. Boley, C.D.; Mitchell, S.C.; Rubenchik, A.M.; Wu, S.S.Q. Metal powder absorptivity: Modeling and experiment. Appl. Optics. 2016, 55, 6496. [Google Scholar] [CrossRef]
  31. Angle, J.P.; Wang, Z.; Dames, C.; Mecartney, M.L. Comparison of two-phase thermal conductivity models with experiments on dilute ceramic composites. J. Am. Ceram. Soc. 2013, 96, 2935–2942. [Google Scholar] [CrossRef]
  32. Spierings, A.B.; Dawson, K.; Heeling, T.; Uggowitzer, P.J.; Schäublin, R.; Palm, F.; Wegener, K. Microstructural features of Sc-and Zr-modified Al-Mg alloys processed by selective laser melting. Mater. Des. 2017, 115, 52–63. [Google Scholar] [CrossRef]
  33. Loh, L.E.; Chua, C.K.; Yeong, W.Y.; Song, J.; Mapar, M.; Sing, S.L.; Liu, Z.H.; Zhang, D.Q. Numerical investigation and an effective modelling on the Selective Laser Melting (SLM) process with aluminium alloy 6061. Int. J. Heat Mass Transfer 2015, 80, 288–300. [Google Scholar] [CrossRef]
  34. Mishra, A.K.; Aggarwal, A.; Kumar, A.; Sinha, N. Identification of a suitable volumetric heat source for modelling of selective laser melting of Ti6Al4V powder using numerical and experimental validation approach. Int. J. Adv. Manuf. Technol. 2018, 99, 2257–2270. [Google Scholar] [CrossRef]
  35. Jeon, T.J.; Hwang, T.W.; Yun, H.J.; Van Tyne, C.J.; Moon, Y.H. Control of porosity in parts produced by a direct laser melting process. Appl. Sci. 2018, 8, 2573. [Google Scholar] [CrossRef]
  36. Jeon, C.H.; Han, S.W.; Joo, B.D.; Van Tyne, C.J.; Moon, Y.H. Deformation analysis for cold rolling of Al-Cu double layered sheet by physical modeling and finite element method. Met. Mater. Int. 2013, 19, 1069–1076. [Google Scholar] [CrossRef]
  37. Gordon, W.A.; Van Tyne, C.J.; Moon, Y.H. Axisymmetric extrusion through adaptable dies—Part 1: Flexible velocity fields and power terms. Int. J. Mech. Sci. 2007, 49, 86–95. [Google Scholar] [CrossRef]
  38. Gordon, W.A.; Van Tyne, C.J.; Moon, Y.H. Axisymmetric extrusion through adaptable dies—Part 3: Minimum pressure streamlined die shapes. Int. J. Mech. Sci. 2007, 49, 104–115. [Google Scholar] [CrossRef]
  39. AlMangour, B.; Grzesiak, D.; Borkar, T.; Yang, J.M. Densification behavior, microstructural evolution, and mechanical properties of TiC/316L stainless steel nanocomposites fabricated by selective laser melting. Mater. Des. 2018, 138, 119–128. [Google Scholar] [CrossRef]
Figure 1. Selective laser melting (SLM) system: (a) Experimental setup; (b) Schematic illustration.
Metals 09 00876 g001
Figure 2. (a) Schematic showing the thermal behavior of the powder bed under laser irradiation. (b) 3D finite-element (FE) model. (c) Schematic showing the transfer of laser radiation into the powder bed.
Metals 09 00876 g002
Figure 3. Schematic showing the dimensions of the melt pool. W and D represent the width (µm) and depth (µm), respectively.
Metals 09 00876 g003
Figure 4. Cross-sectional views of the experimental and numerical models: (a,b) pure AISI 304; (c,d) 3 wt% Al2O3; (e,f) 3 wt% Al2O3-ZrO2. (NT11: Nodal Temperature).
Metals 09 00876 g004aMetals 09 00876 g004b
Figure 5. (a) Cross-section width and (b) depth of the experimental and numerical models. (c) Thermal conductivity (k) of the mixtures at 800 K.
Metals 09 00876 g005
Figure 6. (a) Center point on the top surface chosen for plotting the (b) Temperature-time curves. (c) Results for the maximum temperatures of the reinforced samples. (d) Liquid lifetimes. (e) The final estimations of the absorption coefficients.
Metals 09 00876 g006
Figure 7. Optical micrographs showing the multi-line formation test results. Al2O3-reinforced samples of: (a) 3 wt%., (b) 5 wt%., and (c) 7 wt%. Al2O3-ZrO2 reinforced samples of: (d) 3 wt%., (e) 5 wt%., and (f) 7 wt%.
Metals 09 00876 g007aMetals 09 00876 g007b
Figure 8. Temperature distribution. (a) Along the Y- direction at the top surface. (b) Along the Z-direction, i.e., thickness direction. (c) Definition of the distance between the points of the maximum and minimum temperatures (L). (d) The locations for measuring the micro-hardness. (e) Measurements of micro-hardness at different conditions and locations.
Metals 09 00876 g008aMetals 09 00876 g008b
Table 1. Numerical and experimental runs.
Ex. No.wt% of Al2O3wt% of Al2O3-ZrO2wt% of 304SS
100100%
23%-97%
35%-95%
47%-93%
5-3%97%
6-5%95%
7-7%93%
Table 2. Parameters used for obtaining the values of the surface reflectivity (R) and absorption coefficient (A) of the powder mixture.
PowderR(i)D(i) (m)ϕ(i)ρbulk (kg/m3)ρpowder (kg/m3)Apowder
AISI 3040.4620 × 10−60.2579005861.80.604
Al2O30.793 × 10−60.65397015800.173
ZrO20.821 × 10−60.21600047400.266

