Article

Effect of Process Parameters on Residual Stresses, Distortions, and Porosity in Selective Laser Melting of Maraging Steel 300

1
Centre for Rapid Prototyping and Manufacturing, Department of Mechanical and Mechatronic Engineering, Central University of Technology, Free State, 20 President Brand Street, Bloemfontein 9300, South Africa
2
Laboratory for Advanced Manufacturing, Department of Industrial Engineering, Stellenbosch University, Corner Joubert and Banghoek Street, Stellenbosch 7602, South Africa
*
Author to whom correspondence should be addressed.
Metals 2019, 9(10), 1042; https://doi.org/10.3390/met9101042
Submission received: 23 August 2019 / Revised: 9 September 2019 / Accepted: 11 September 2019 / Published: 25 September 2019
(This article belongs to the Special Issue Advances in Selective Laser Melting)

Abstract

:
Selective laser melting (SLM) is one of the most well-known additive manufacturing methods available for the fabrication of functional parts from metal powders. Although SLM is now an established metal additive manufacturing technique, its widespread application in industry is still hindered by inherent phenomena, one of which is high residual stresses. Some of the effects of residual stresses–such as warping and thermal stress-related cracking–cannot be corrected by post processing. Therefore, establishing input process parameter combinations that result in the least residual stress magnitudes and related distortions and/or cracking is critical. This paper presents the influence of laser power, scanning speed, and layer thickness on residual stresses, distortions and achievable density for maraging steel 300 steel parts in order to establish the most optimum input parameter combinations. An analysis of the interdependence between process outcomes shows that high residual stress magnitudes lead to high dimensional distortions in the finished parts, whilst porous parts suffer relatively lower residual stresses and associated distortions.

1. Introduction

Selective laser melting (SLM) is a layer-wise additive manufacturing process in which a high-energy laser beam is used to selectively melt a thin layer of metal powder according to an input CAD model. SLM has recorded immense progress with regard to manufacturing capabilities for complex geometries, thin walls and minute geometric features. Despite this progress, inherent process challenges persist, and these should be overcome in order to increase the commercial uptake of the technology. Presently, residual stresses pose a major setback to the success of SLM. As the name suggests, these stresses remain in a component once the material has come to equilibrium with the environment [1]. These stresses can be classified as micro and macro residual stresses. The difference within the microstructure of a material due to presence of different phases or constituents in that material gives rise to micro stresses. On the other hand, macro stresses extend over ranges that are much larger compared to the grain size [2,3]. The mechanisms of residual stresses in SLM are well explained in [4]. The major effects of residual stresses include form and dimensional deviations [5], delamination, stress-induced cracking [6,7] and accelerated crack growth, which leads to early fatigue failure [8,9]. Warping distortions and cracking are irreversible by post-processing techniques such as stress relief heat treatment. Residual stress-induced warping that occurs during the build process can impede the smooth movement of the coater blade, often leading to the premature termination of the process. Therefore, it becomes critical to understand the effect of different input parameters on residual stresses and distortions in order to effectively mitigate the negative impact of these stresses. Optimizing process parameters is critical in maintaining acceptable finished part quality as well as reducing manufacturing and post-processing costs.
Some of the factors that influence residual stresses include scanning patterns [10,11], scan vector lengths [10,12], scan vector angles [7], rotation angles between layers [12], part geometry [13], material type [14], support types [10], and preheating conditions [6,15]. Manipulating one or more of the above factors can significantly reduce residual stresses and their negative effects. For example, baseplate preheating is an effective method for managing residual stresses. Unfortunately, many SLM machines in use cannot integrally accommodate baseplate preheating. In most of the previous studies, high tensile residual stresses near the surface have been reported for parts built using SLM, for example in the SLM of titanium alloys [8], stainless steels [16], aluminum alloys, etc. However, some studies for tool steel alloys have reported compressive stress near the surface of the specimens. Yan et al. [17] studied residual stresses and microstructure in the SLM of H13 tool steel. The as-built samples exhibited high compressive stresses in the range of 940 to 1420 MPa. In another study of residual stresses in parts produced by SLM, compressive XRD residual stress of 263 MPa was recorded for 18Ni(300) maraging steel [14]. Although residual stresses in SLM have been widely studied, a deeper insight into the correlation between input parameters and residual stresses is still required. A previous study indicates that the most important parameters in SLM are laser power, layer thickness, and scanning speed [18]. Hanzl et al. [19] also observed that the laser power and scanning speed have the most significant effect on the physical and mechanical properties of SLM manufactured parts. Investigations of the effect of processing parameters in selective laser melting have been studied by Campanelli et al. [20], Thijs et al. [21], Gu et al. [22], and Delgado et al. [23], among others. Wu et al. [12] carried out an investigation of the effect of laser parameters on residual stress-related distortions. However, in all the studies relating to the effect of these process parameters, their influence on porosity, residual stresses, and distortions has not been studied simultaneously. It has been suggested in the literature that pores have a relaxing effect on residual stresses [7,12,24]. Therefore, understanding the interdependencies between process outcomes is critical for process planning. Thus, this paper presents an analysis of the effect of process parameters on residual stresses, distortions, and porosity, as well as the interdependencies between the process outcomes.

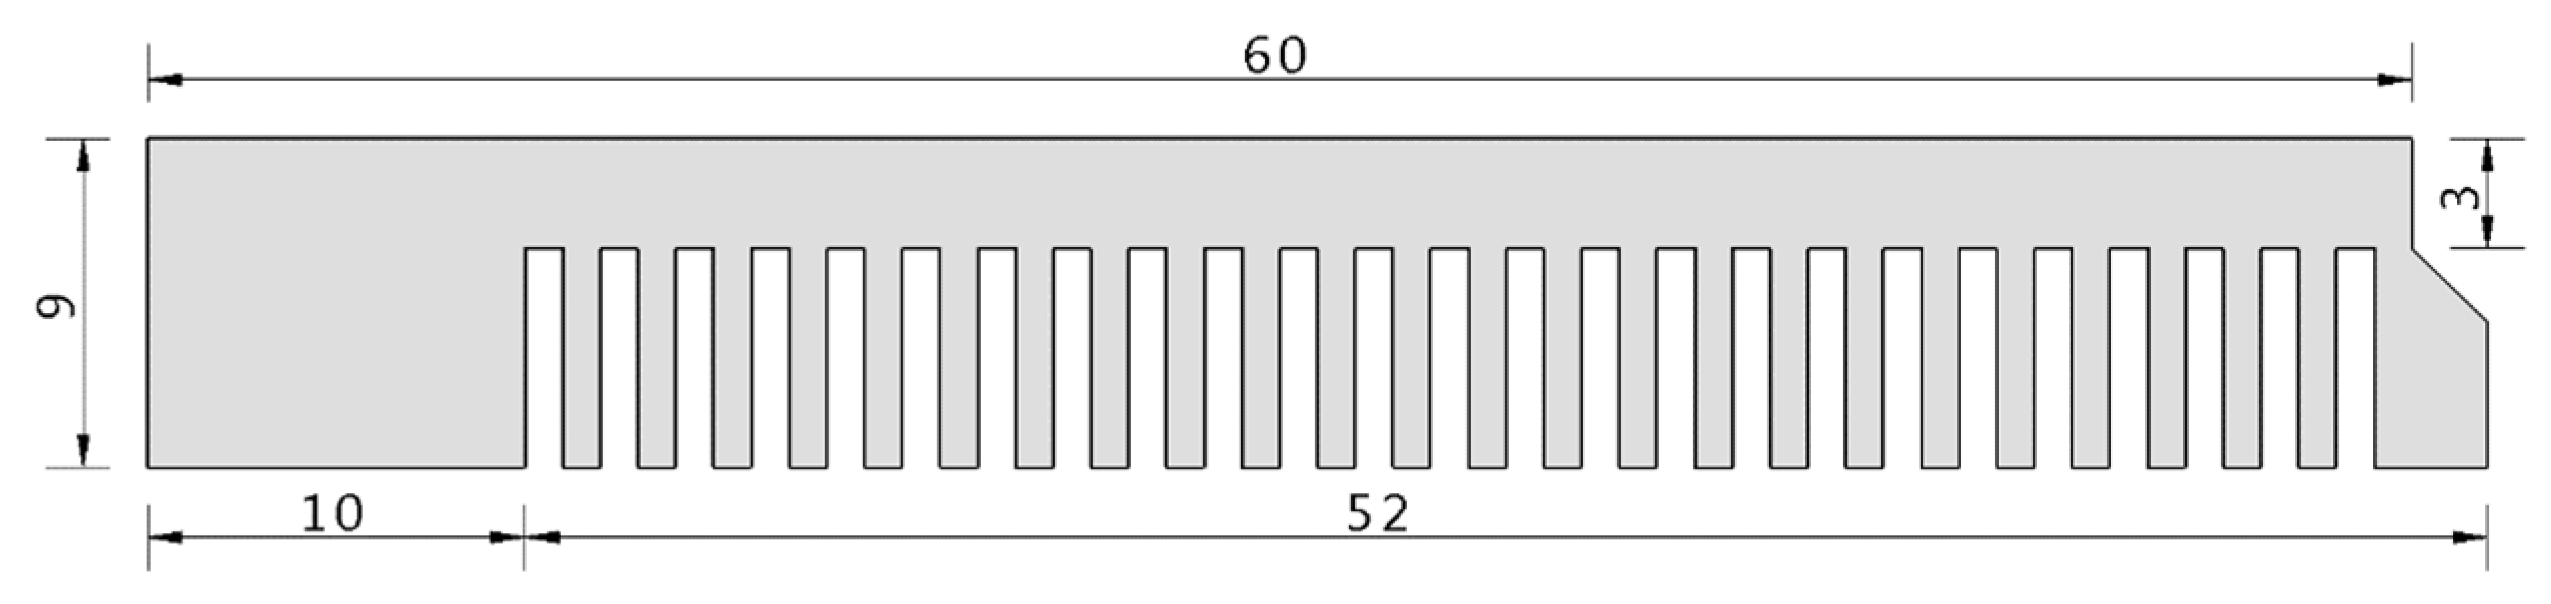
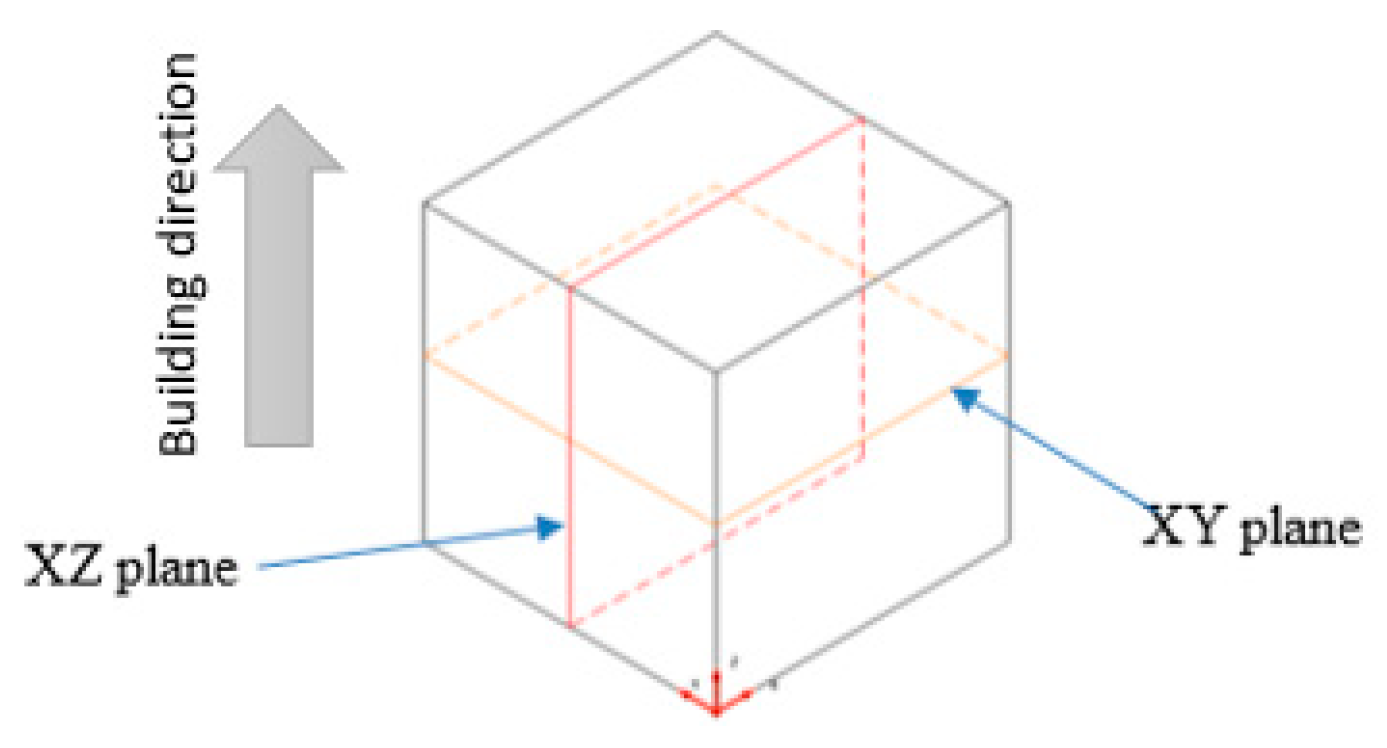
2. Materials and Methods

An experimental study was conducted to understand the influence of process parameters–that is laser power, scanning speed, and layer thickness–as these have been identified to have a critical effect on the values of residual stresses [18,19]. The experimental design allows for an investigation of the influence of input parameters on the process response as well as an analysis of the interrelationships between the responses. A full factorial design of experiments was used to investigate the influence of laser power, scanning speed, and layer thickness on porosity, residual stresses, and distortions. Gas-atomized maraging steel 300 powder from Praxair Surface Technologies, Indianapolis, USA, was used to build the specimens. The specimens were manufactured under a nitrogen gas environment on the M2 Laser Cusing (Concept Laser GmbH, Lichtenfels, Germany) as well as the EOSINT M280 (EOS GmbH, Krailling, Germany) machines. The M2 Laser Cusing system employs the island scanning strategy with 5 × 5 mm sub-divisions. In line with the operating ranges of the M2 Laser Cusing system primarily used, laser power ranging between 80–180 W was investigated in steps of 20 W, whilst nine levels of scanning speed between 200–1000 mm/s were studied in steps of 100 mm/s. The powder layer thickness was varied from 30 µm to 45 µm, with a constant hatch spacing of 105 µm for all the various parameter combinations. The focal spot size was maintained at 110 µm. On the other hand, the EOSINT M280 system utilizes a stripe hatch strategy with a spot size of 100 µm. The hatch distance was also set to 100 µm. All the other manufacturing parameters used for the EOSINT M280 system were the same as those for the M2 Laser Cusing machine.
Cube samples with 10-mm sides were built for residual stress and porosity investigation. This size of the samples, which was also used by Vrancken [25], is convenient for both residual stress and density measurement using, respectively, X-ray diffraction and the Archimedes density methods, which were selected for this study. For distortion analysis, single-arm cantilevers with geometry shown in Figure 1 were built. Cantilevers easily deform in the presence of residual stresses, and have been widely used in the literature for distortion investigation in selective laser melting [5,10,24,26,27,28]. Besides cantilever geometries, thin metal sheets can also be used since they easily deform, allowing the deformation to be conveniently measured [29,30]. Preliminary findings on porosity and distortions have been published elsewhere by the authors [31]. In this research, samples were fabricated from maraging steel 300, which is also commonly designated as 18Ni(300) or 1.2709. Maraging steel 300 has excellent fracture toughness and is widely applied for hot work tooling applications such as the manufacture of injection molding inserts and hot sheet metal-forming tools. The yield strength of as-built maraging steel 300 is 950 MPa [32].
The Archimedes method was used to calculate the relative densities of the specimens manufactured under the various process parameters. Then, porosity was determined by computing the difference between the theoretical and the measured relative densities. The Archimedes density test method is well described in [33]. The samples were weighed in air as well as distilled water at 20 °C temperature and standard pressure with the aid of a precision scale. The theoretical density of maraging steel 300 was taken as 8.1 g/cm3 which is in line with related literature [9,34]. An important consideration when measuring density using this method is to ensure that no open pores exist that would allow the penetration of water into the specimens [35]. Open pores can easily be detected by observation of air bubbles during immersion of the specimen into the water, and such samples must be sealed [33]. One limitation with the Archimedes method is that it cannot provide information about the size or distribution of internal pores. Therefore, further to the Archimedes density tests, 2D optical microscopy of sectioned and polished specimens was also performed to inspect the internal pores associated with the different parameter combinations. The cubes were sectioned along the planes shown in Figure 2.
Residual stress measurement was conducted using the X-ray diffraction (XRD) technique. The XRD method is non-destructive, and is widely used to measure surface stresses in SLM-manufactured components. Although in-depth residual stress evaluation is preferred, the cost of performing such measurements is usually prohibitive, particularly when evaluating for multiple parts such as in this research. Nevertheless, since the highest stress magnitudes are usually concentrated near the surfaces of SLM built parts, analyzing only the surface is considered adequate. The principle of the XRD method, which rides on Bragg’s law of constructive interference as well as the generalized Hooke’s law, is described in [2,36]. In this study, a ProtoXRD X-ray diffractometer (Figure 3) equipped with two detectors was used to determine the Fe-α {211} lattice deformations at 25 kV and 4 mA. The X-ray anode tube used was Cr K-α with a wavelength of 2.291 Å. The rest of the diffraction parameters are shown in Table 1. The sin2ψ method was used to calculate the stress. Details of this method can be found in [36]. Each sample was evaluated for residual stress at the center of the top surface.
Distortion measurements were accomplished by taking contour profiles of the cantilevers using a bridge-type Mitutoyo coordinate measurement machine and comparing the profiles to the original CAD model. A slow measurement speed of 5 mm/s was chosen in order to minimize the errors and delays that could arise from collisions. The separation between the supports on the cantilevers is 1 mm; therefore, a probe diameter of more than 1 mm would be necessary, to avoid the probe getting stuck in the spaces between the supports. For this reason, a 2-mm probe was selected. Cantilever geometries exhibit significant distortion variation along the geometry’s length rather than across the width. Similar measurements by Safronov et al. [37] show this trend. Therefore, the measurement of distortion in this paper was done along the line of symmetry of the cantilevers.

3. Results and Discussion

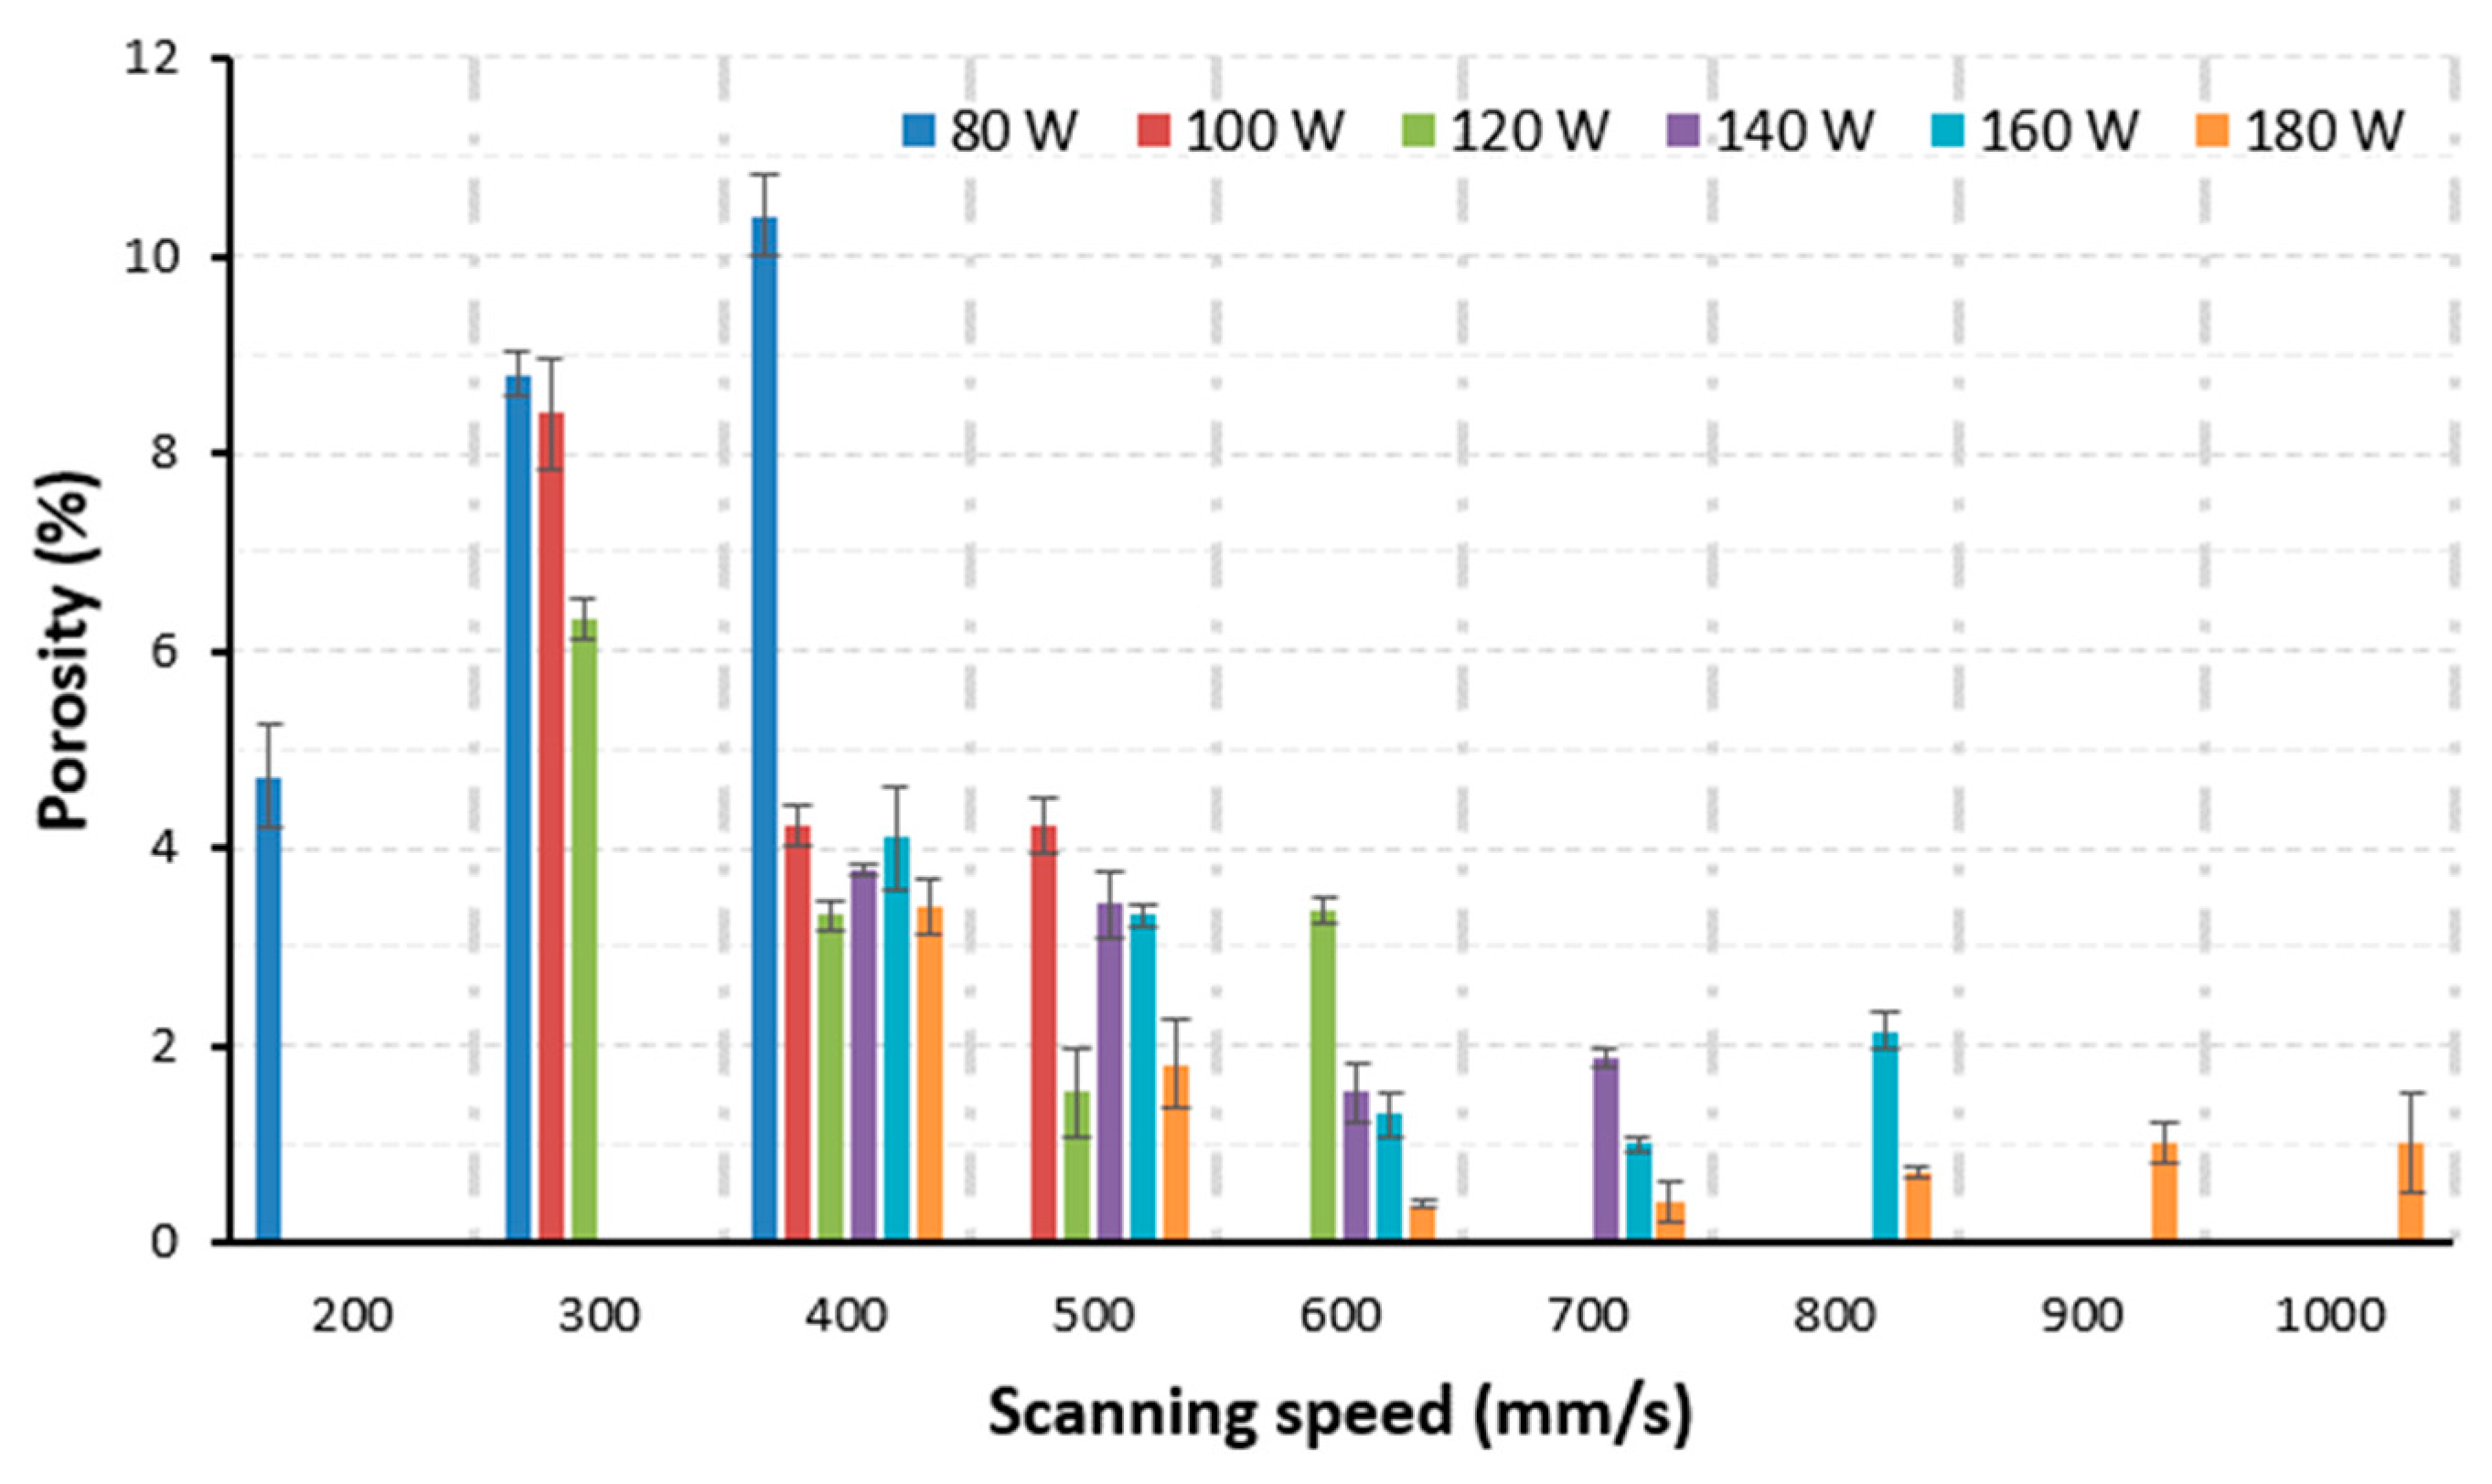
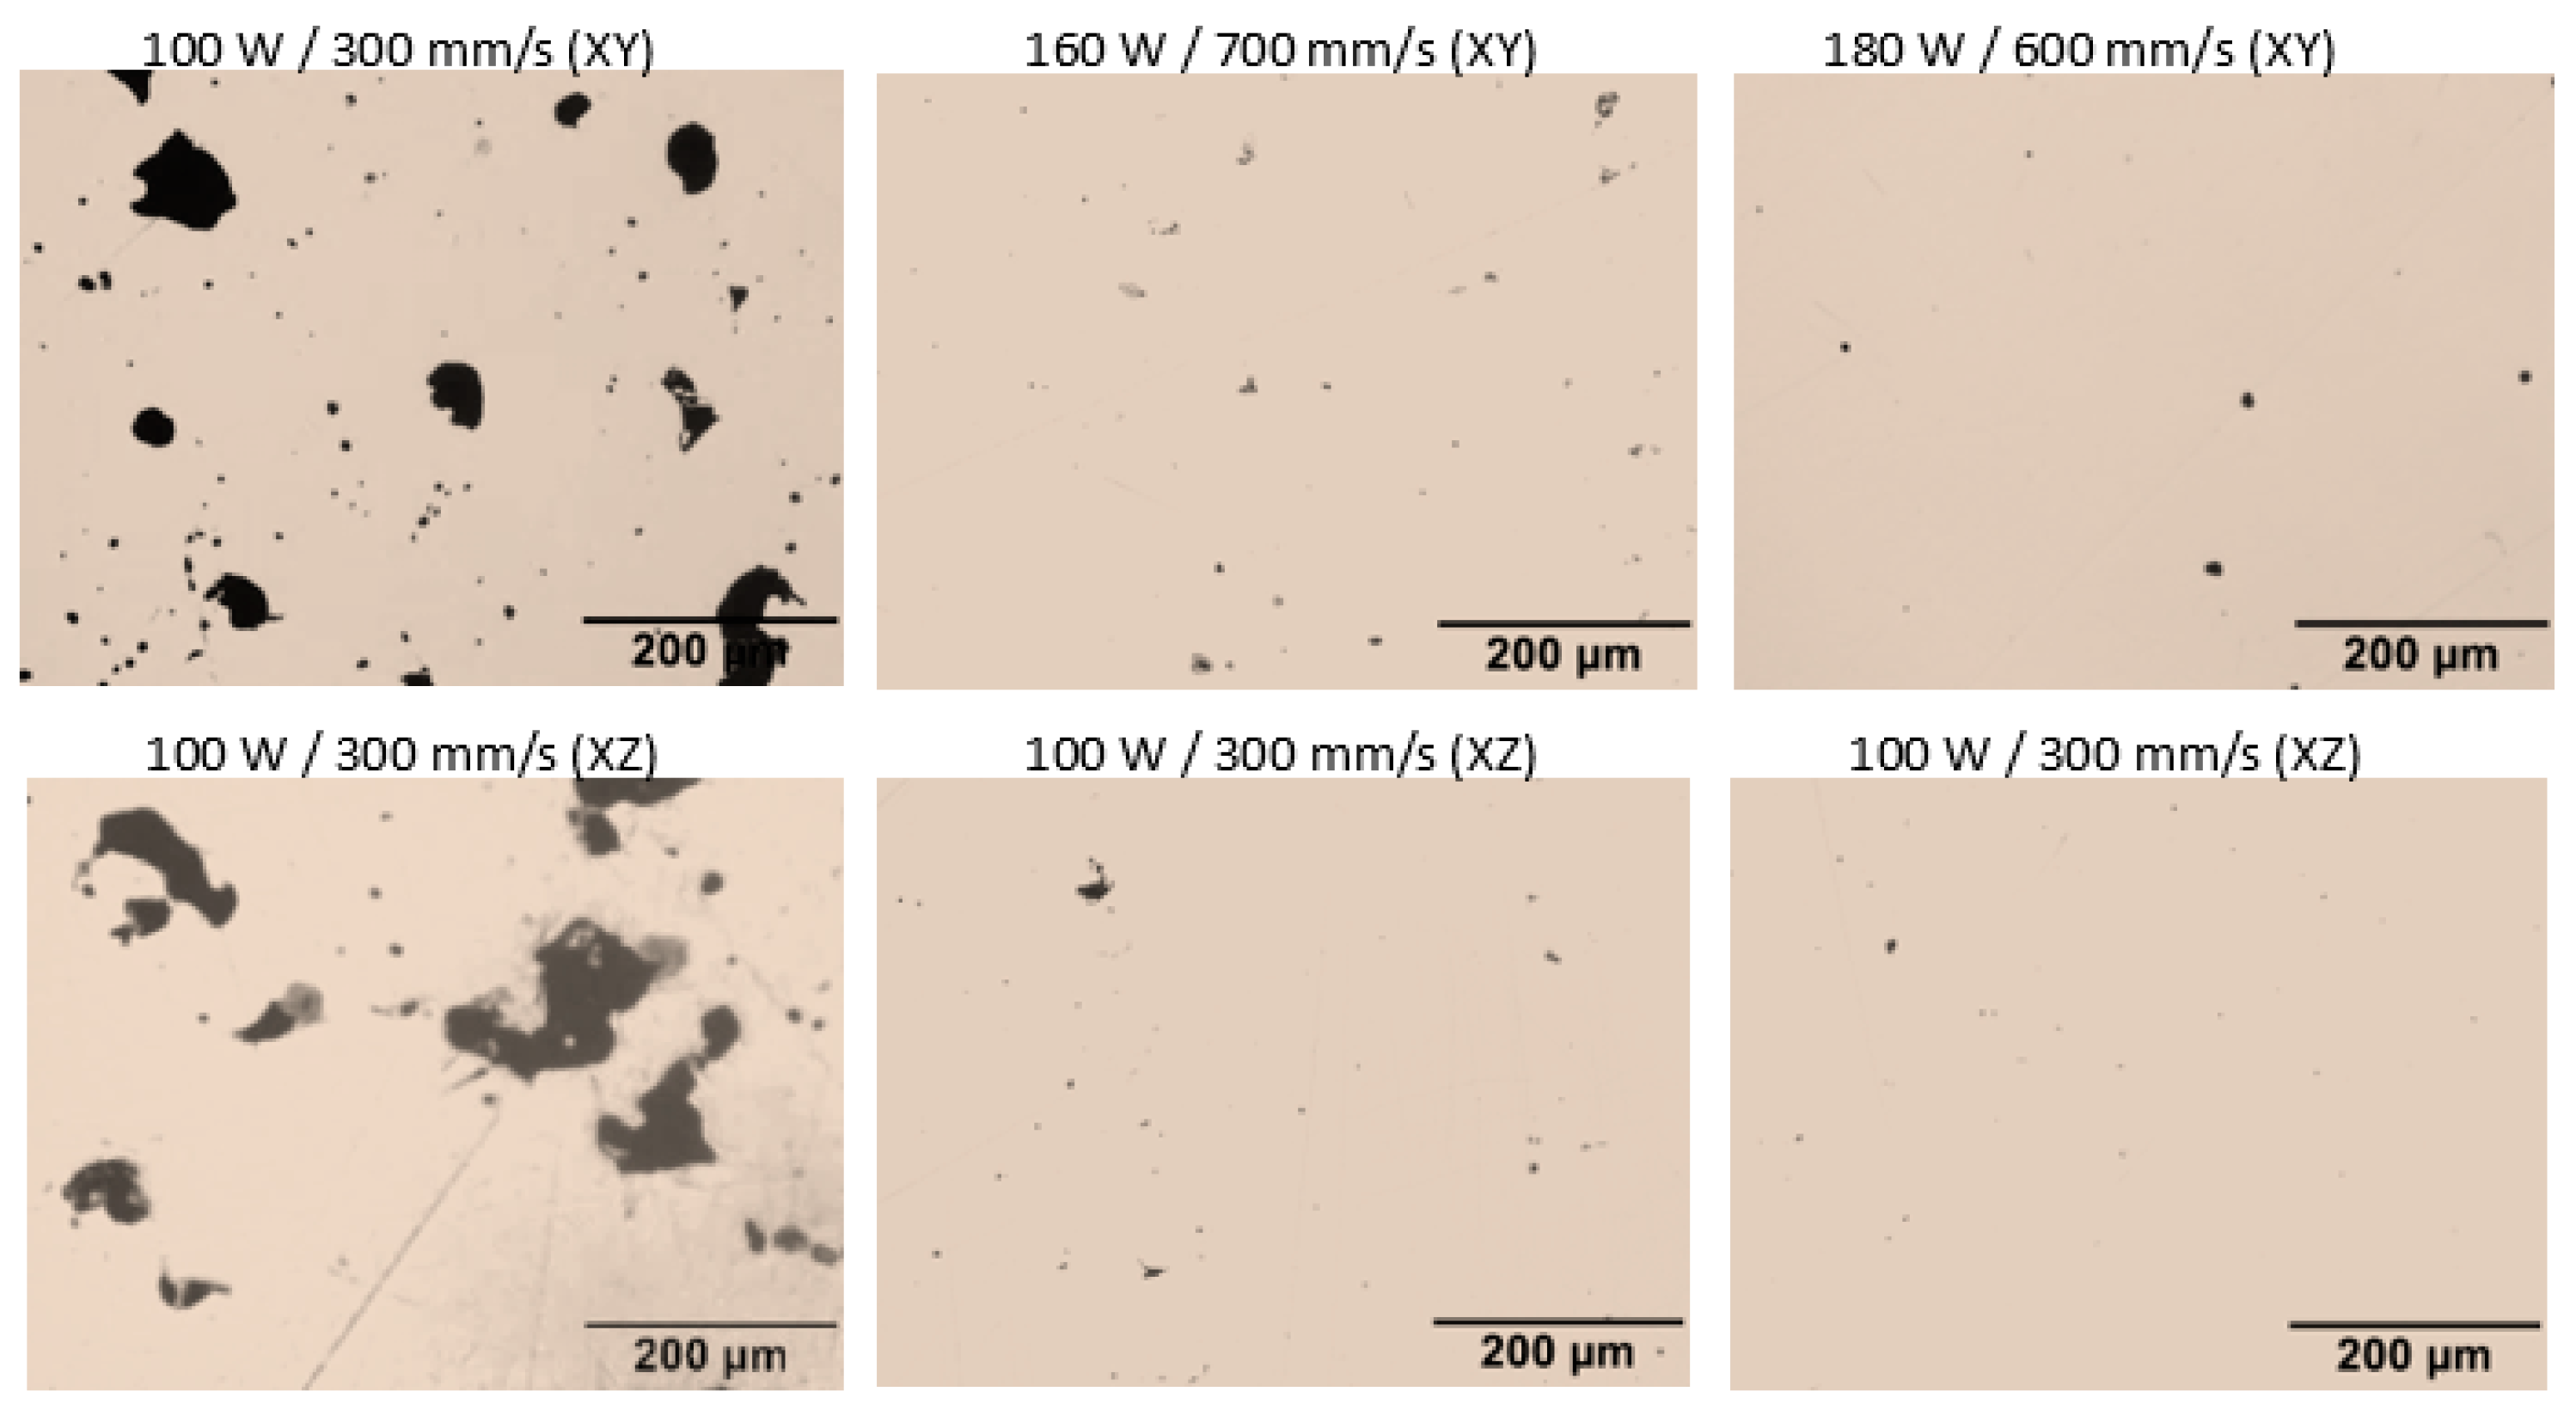
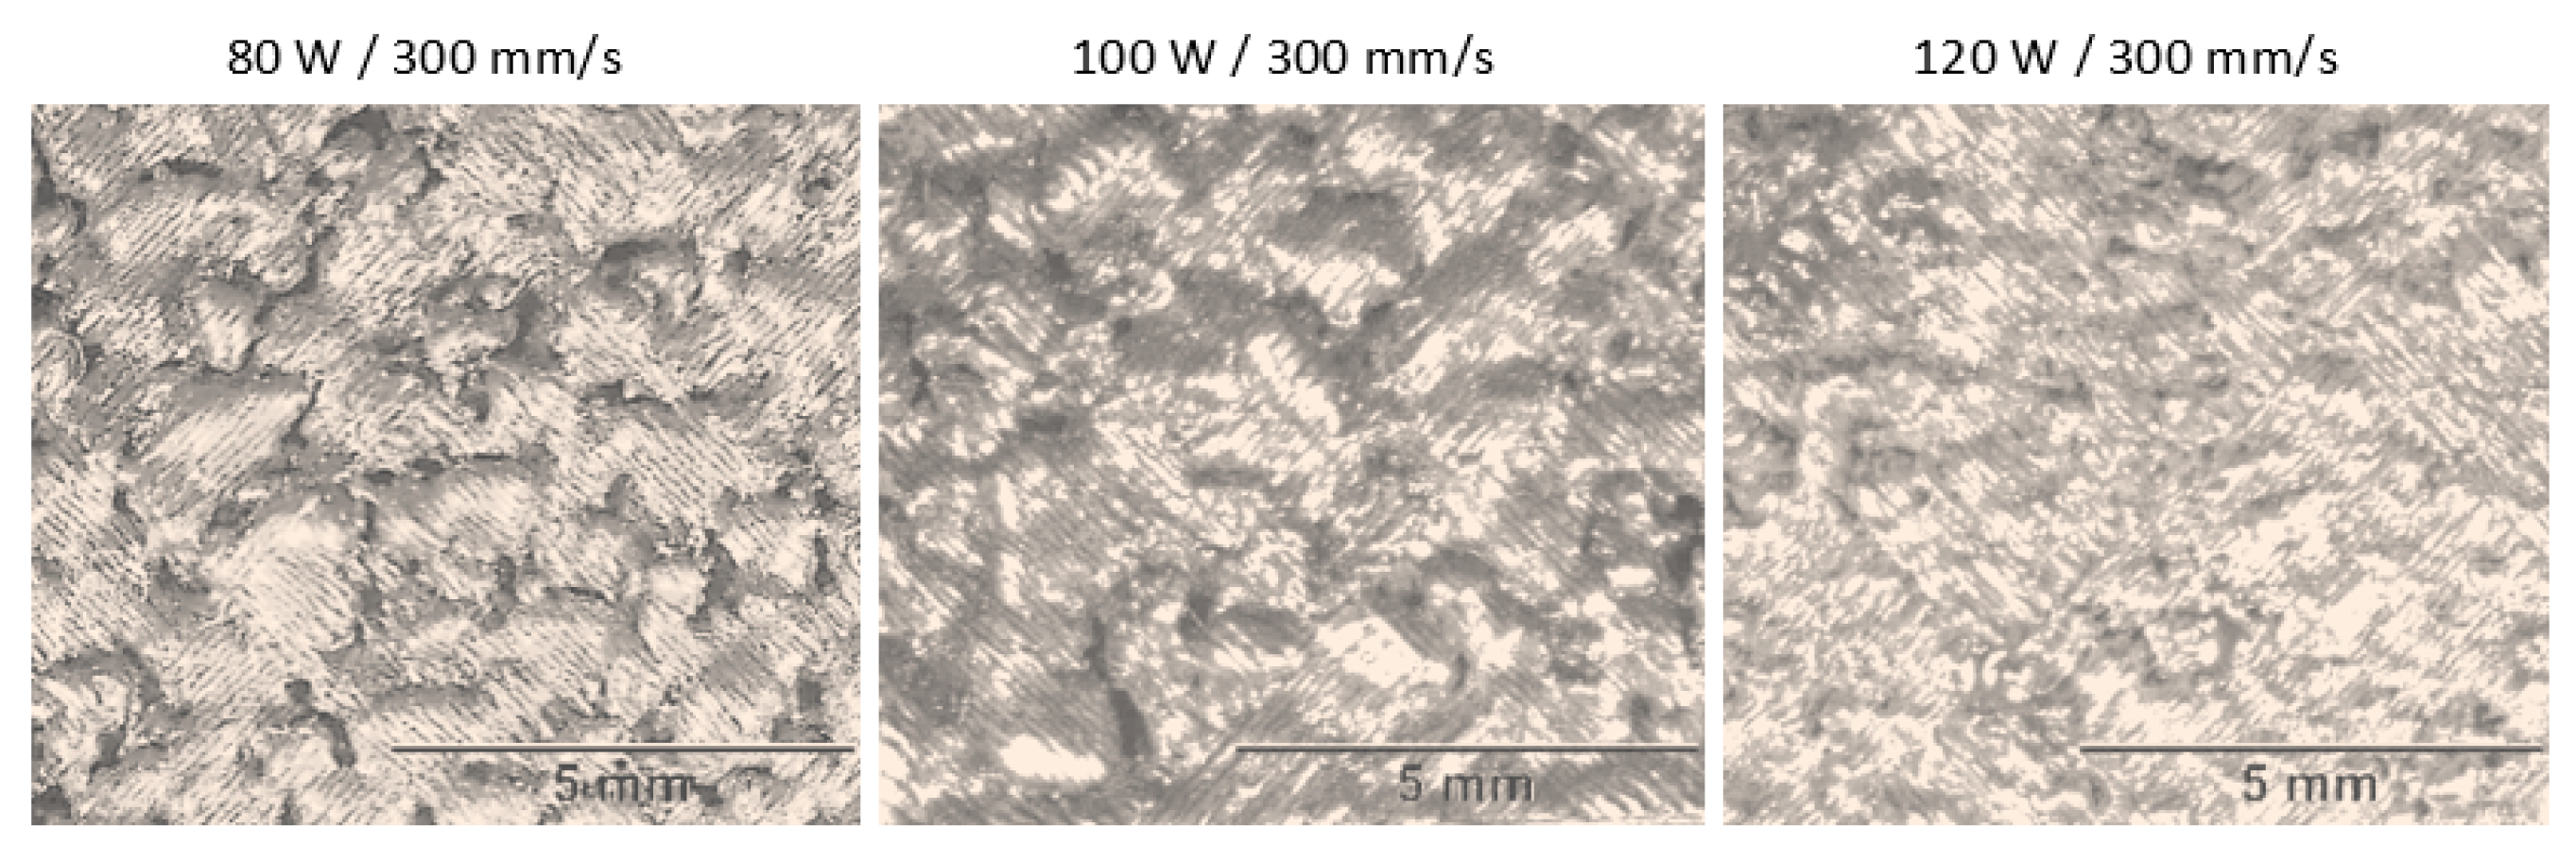
3.1. Influence of Process Parameters on Porosity

The porosity results for samples built on the M2 Laser Cusing system are illustrated in Figure 4. High values of porosity were recorded for the lowest laser power of 80 W at 300 mm/s and 400 mm/s respectively. Laser power of 180 W yielded the least porosity of 0.39% for a scanning speed of 600 mm/s. The general trend is that the relative density increases as the scanning speed is gradually increased to some optimum value, above which this relative density begins to decline. The optimum scanning speed that coincides with the least porosity is unique to the laser power being used, with other parameters such as spot size and hatch distance held constant. For example, when scanning with 180 W, the optimum speed that results in the least porosity is 600 mm/s. Above or below this scanning speed, porosity tends to increase. The increase in porosity on either side of the optimum scanning speed is due to a mismatch between the laser power and scanning speed, which leads to either balling, insufficient melting, and poor metallurgical bonding (for higher scanning speeds), or over-heating (for lower scanning speeds). These scenarios lead to undesirable porosity, which reduces the part strength [38,39]. For the tested range, scanning speeds lower than the optimum scanning speed contribute to significantly higher porosity than those above it (Figure 4).
Optical microscope images were taken across (XY) and along (XZ) the building directions of the cube specimens. The concentration of pores (represented by the dark spots) in the microscope images shown in Figure 5 is consistent with the porosity results from the Archimedes test. In Figure 5, the concentration and size of pores is higher for the 100 W/300 mm/s compared to the 160 W/700 mm/s and 180 W/600 mm/s ones. The pores for the 100 W/300 mm/s specimen have diameters of up to 200 µm, compared to a maximum of only 15 µm for the 180 W/600 mm/s specimen.
Compared to the 30-µm layer, most of the samples manufactured using the 45-µm layer thickness did not build well; both the density specimens and the cantilevers. Surface images of some of the samples manufactured from the 45-µm layer thickness are shown in Figure 6. The density results show porosity of more than 5% for most of these samples. The maximum available power of the SLM equipment used cannot sufficiently melt this layer thickness, thus the observed comparatively higher porosity. The surface finish was so poor that most of the samples could not be considered for residual stress evaluation with XRD. However, both layer thicknesses yielded comparable relative densities at 180 W and 600 mm/s, that is 99.6% and 99.4% respectively, for 30-µm and 45-µm layer thicknesses. Likewise, the mean relative densities from the 30-µm and 45-µm layer thicknesses were also quite similar (approximately 98.5% for both) at 180 W and 500 mm/s. The porosity results for both layer thicknesses at the same levels of laser power and scanning speed are presented in Table 2.

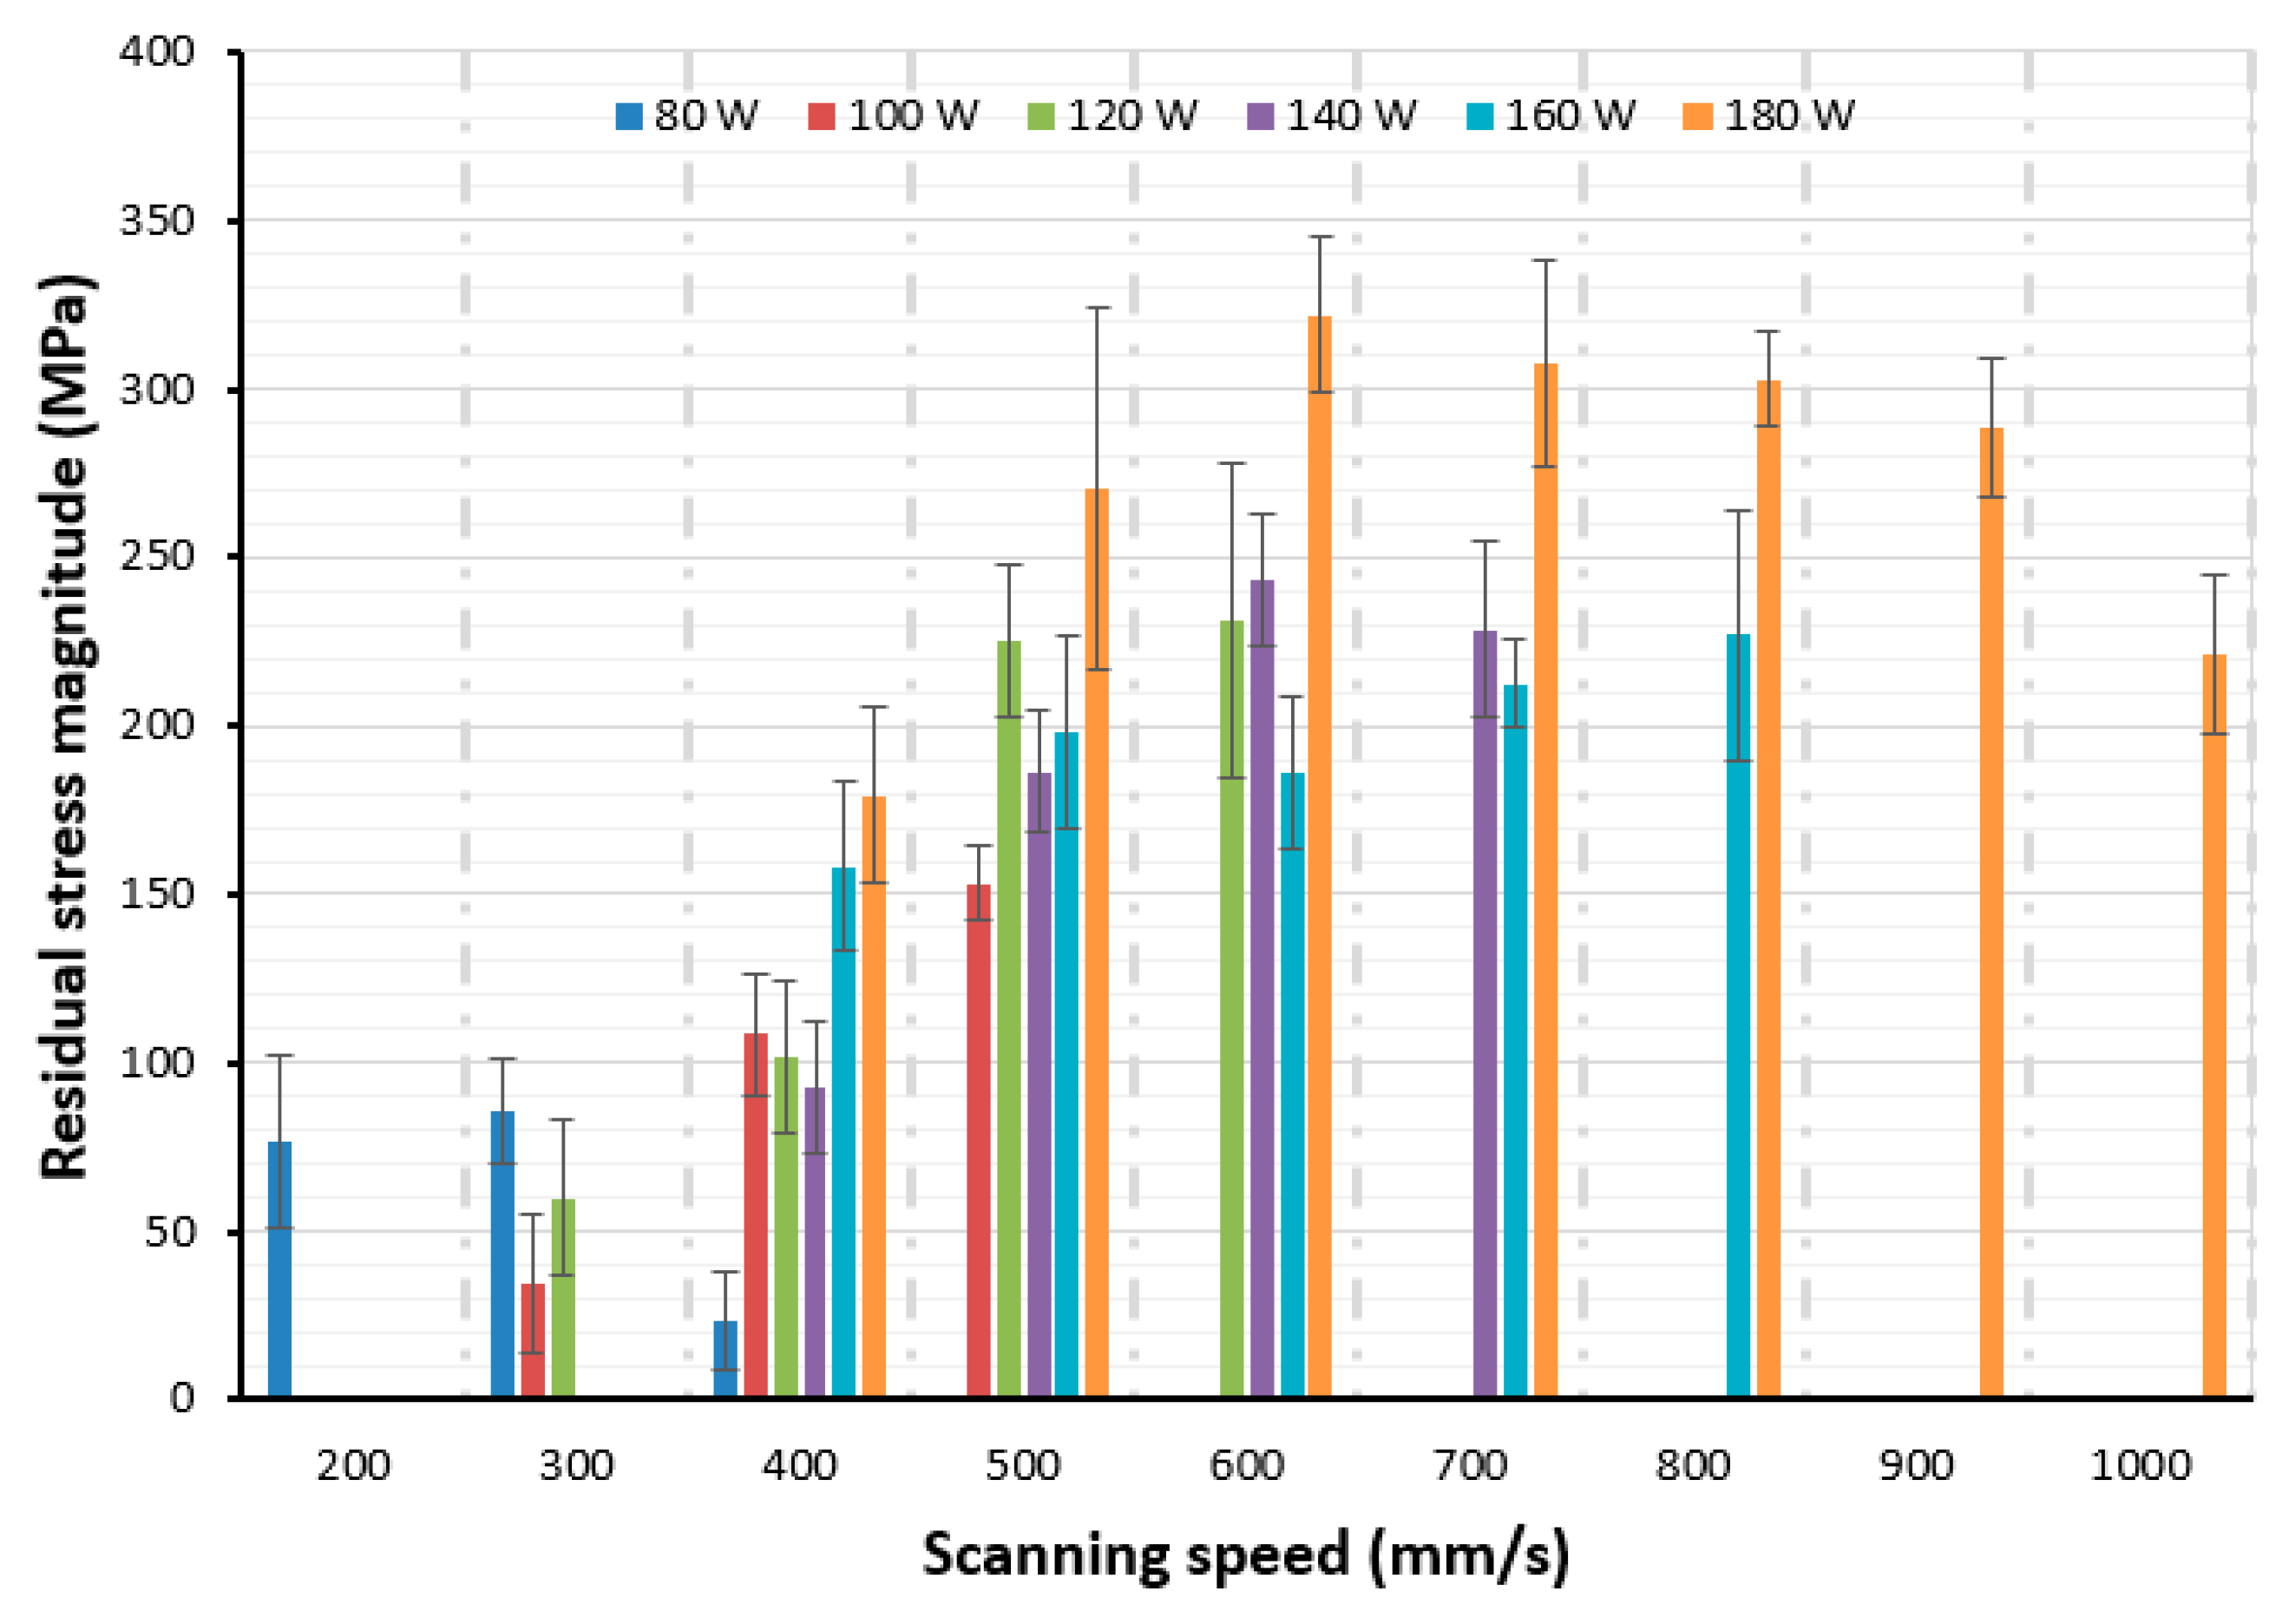
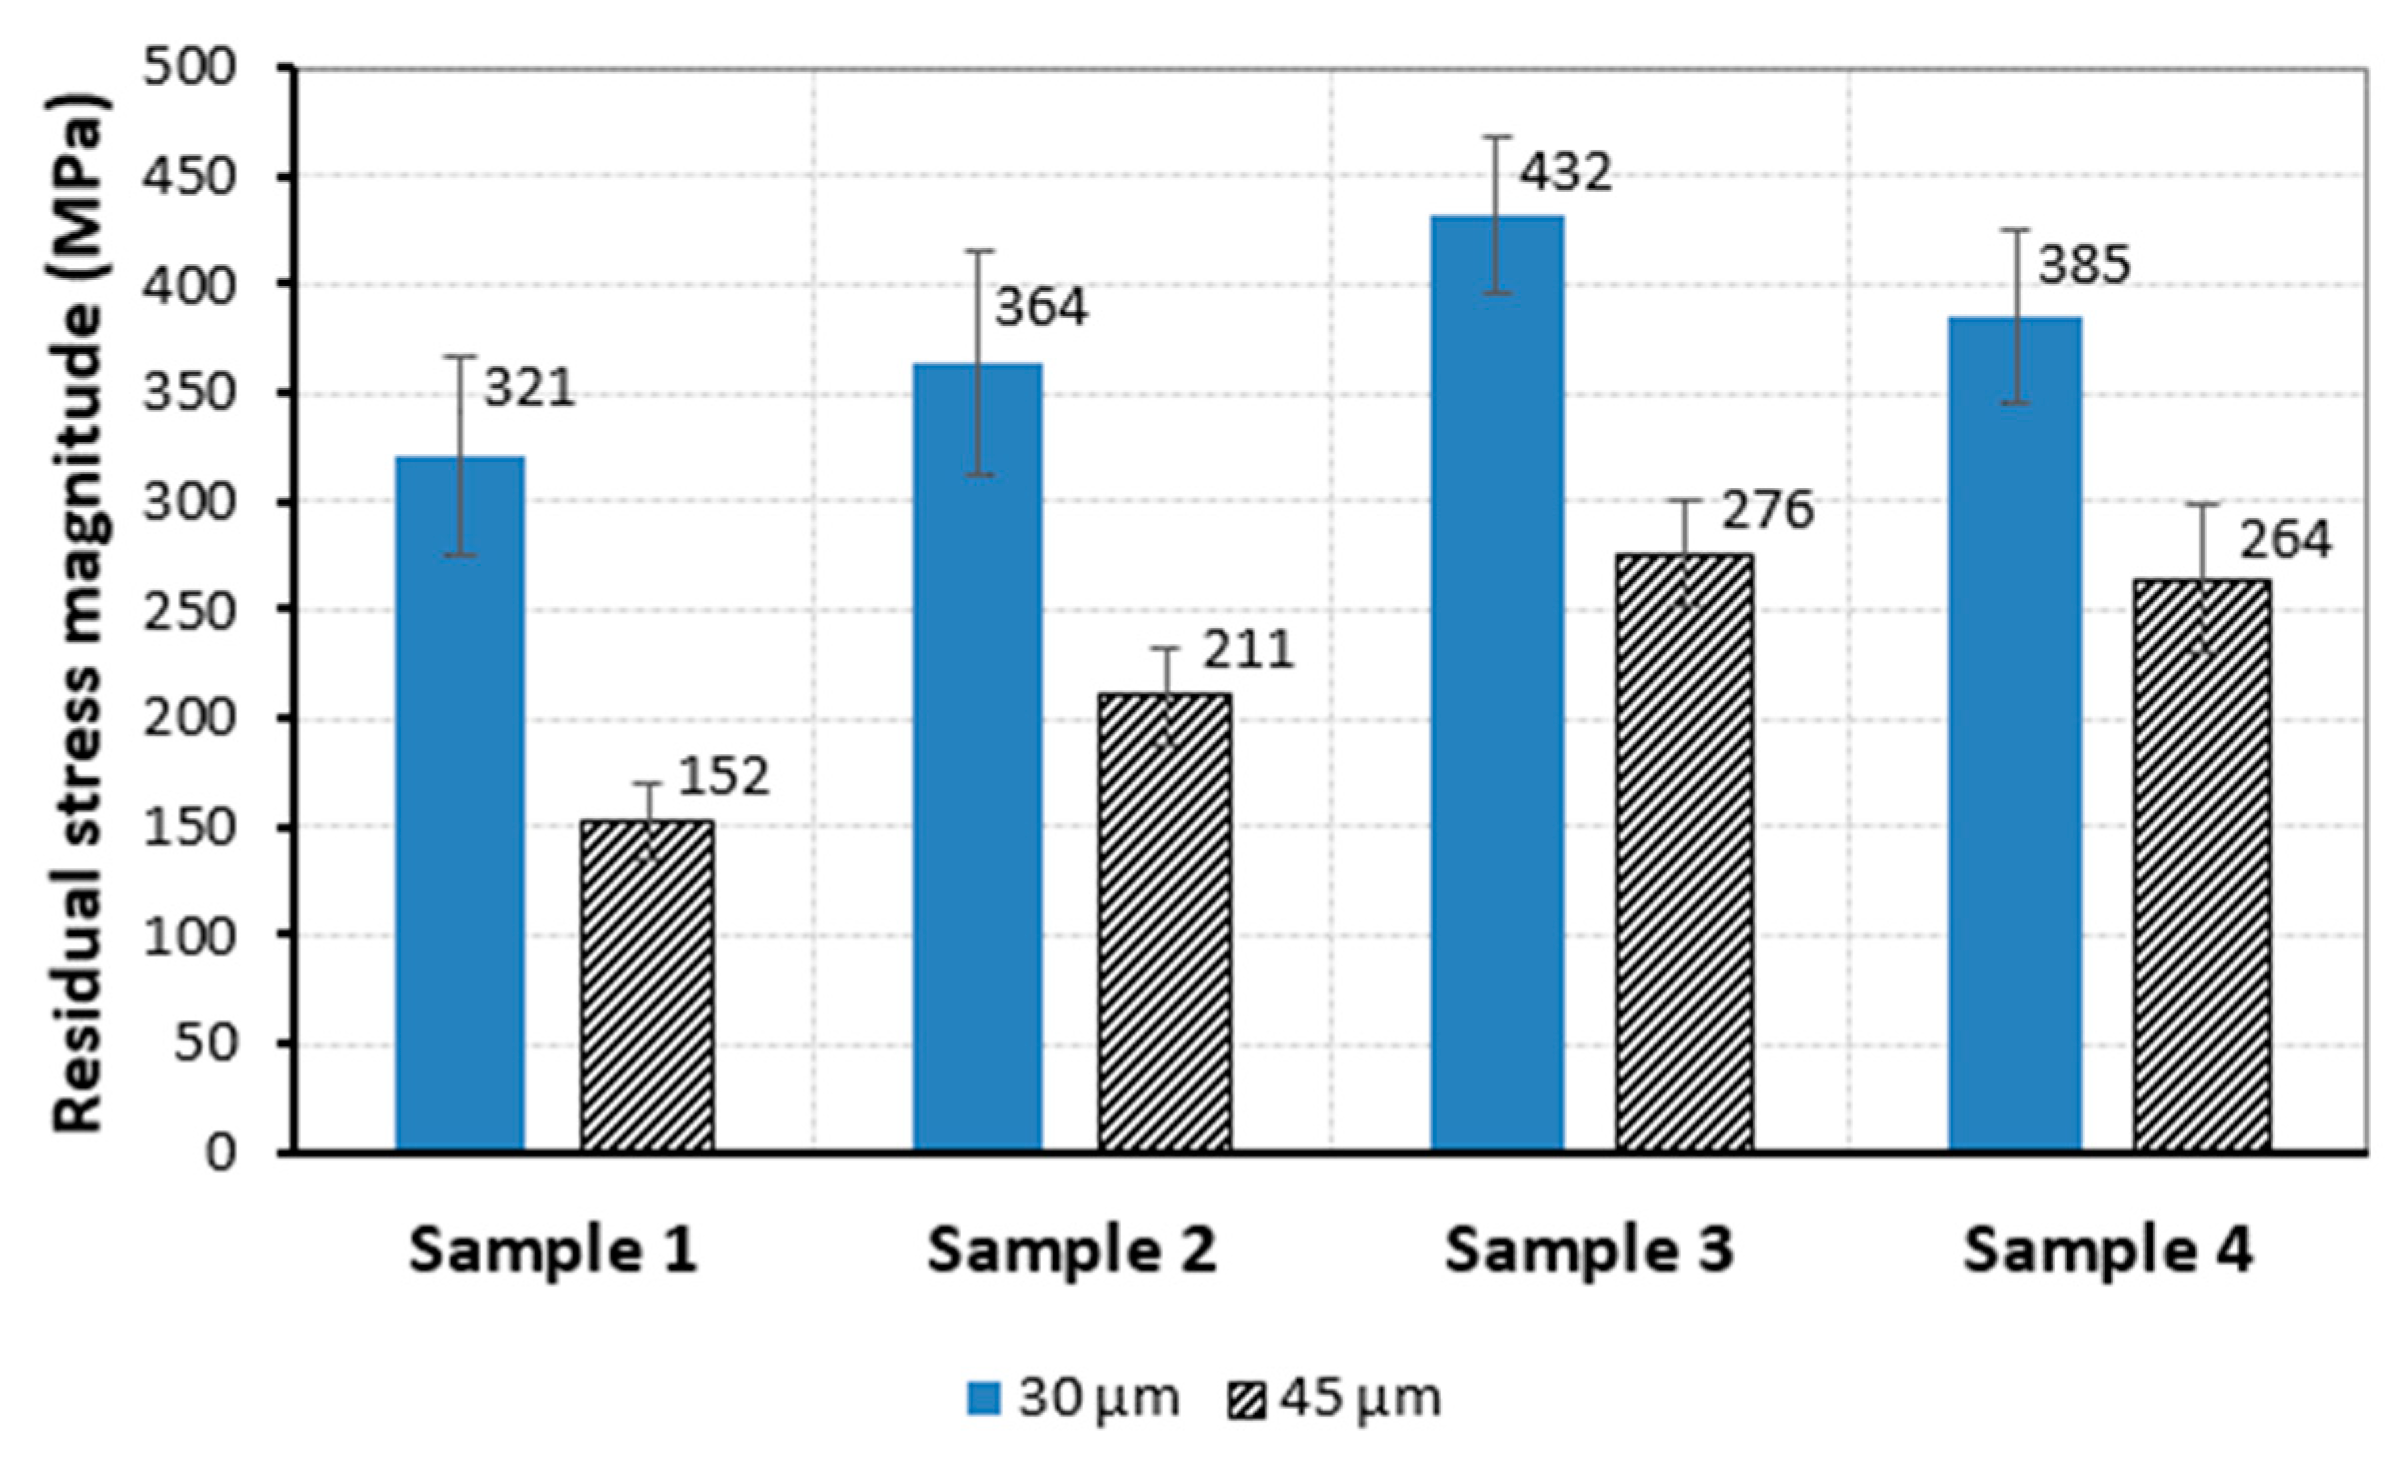
3.2. Influence of Process Parameters on Residual Stresses

All the samples built from the 30-µm layer thickness were evaluated for residual stresses. However, only seven specimens from 45-µm layer were considered for residual stress evaluation, because the rest had a very poor surface finish that would impact on the accuracy of residual stress measurements. Such specimens would require deeper grinding or machining, which is not recommended in XRD stress evaluation, as this can alter the residual stress state of the specimen [36]. The residual stress was compressive at the surface for all the evaluated process parameter combinations. In other publications such as [14,17,40,41], the same material (maraging steel) has been found to exhibit compressive surface stresses as well. The compressive state of the stresses is due to the martensitic transformation and contraction that occurs during SLM of tool steel. However, the existence of compressive residual stresses does not mean an absence of tensile stresses in these specimens. In fact, the concept of residual stress is a “balancing act” in which tensile stresses are compensated by compressive stresses somewhere within the component [37]. Neutron diffraction investigations done elsewhere by the authors revealed that there existed tensile stress magnitudes just below 2 mm of the surface for this material [42]. Compressive residual stresses between 14–322 MPa were recorded for the various process parameter combinations studied.
The lowest residual stress magnitudes were measured for specimens fabricated using low laser power and low scanning speeds, that is, 80–100 W and 200–400 mm/s. The stresses increase in magnitude as both laser power and scanning speed are increased into the intermediate and higher ranges, as shown in Figure 7 for the 30-µm layer. High laser power contributes to steep thermal gradients, and high scanning speed increases the cooling rate–both scenarios lead to high thermal stresses. However, the effect of both extremes (too low or too high laser power or scanning speed) on porosity and, effectively, residual stresses, cannot be ignored, since porosity might lead to stress relaxation. The lowest combination of laser power and scanning speed (80 W/200 mm/s) yielded a compressive residual stress magnitude of 77 MPa, while the highest laser power and scanning speed (180 W/1000 mm/s) resulted in a much higher stress magnitude of 221 MPa. For 160 W, the residual stresses increase steadily from 158 MPa to 227 MPa when the scanning speed is increased from 400 mm/s to 800 mm/s. For 180 W, residual stresses increase from 179 MPa at 400 mm/s to a maximum value of 322 MPa at 600 mm/s before steadily declining to 221 MPa when the scanning speed is increased to 1000 mm/s. Samples built from the 45-µm powder layer had generally lower residual stress magnitudes compared to the 30-µm layer samples. The highest residual stress magnitude found for the 45-µm layer thickness was 256 MPa, corresponding to 180 W and 600 mm/s.
A comparative summary of the residual stresses for samples manufactured using identical laser power and scanning speed values for the two layer thicknesses considered is given in Table 3, from which a general decrease of residual stress magnitude is observed when the layer thickness is increased from 30 to 45 µm. The general decline in residual stress magnitudes can be attributed to reduced power density for the 45-µm layer. A study by Ali et al. [43] shows that thicker layers reduce both temperature gradients and cooling rates, resulting in an accompanying reduction in residual stresses.
To confirm the residual stress results for the two powder layer thicknesses studied, more cube specimens were built from the same laser power, scanning speed, and hatch distance settings, but at two different layer thicknesses–that is, 30 µm and 45 µm. For this verification exercise, four samples for each layer thickness were built on an EOSINT M280 machine. Laser power and scanning speed values were set to 180 W and 600 mm/s respectively, since these parameters resulted in the highest relative density for both layer thicknesses for the M2 Laser Cusing system experiments. Achievement of near full density is one of the key goals of SLM. Evaluation of the stresses was performed before the specimens were separated from the baseplates in order to avoid any possible relaxation and/or redistribution of residual stress upon wire cutting. From the results given in Figure 8, the mean residual stress magnitude decreases from 376 MPa to 226 MPa when the layer thickness is increased from 30 to 45 µm at the same settings of laser power (180 W) and scanning speed (600 mm/s). These results show a similar trend to those found for samples built on the M2 Laser Cusing machine. This demonstrates that increasing the layer thickness from 30 to 45 µm reduces the residual stress magnitudes in maraging steel 300 manufactured through SLM. This decline in the stress magnitude is also expected to result in a reduction of stress-related distortions in SLM parts.

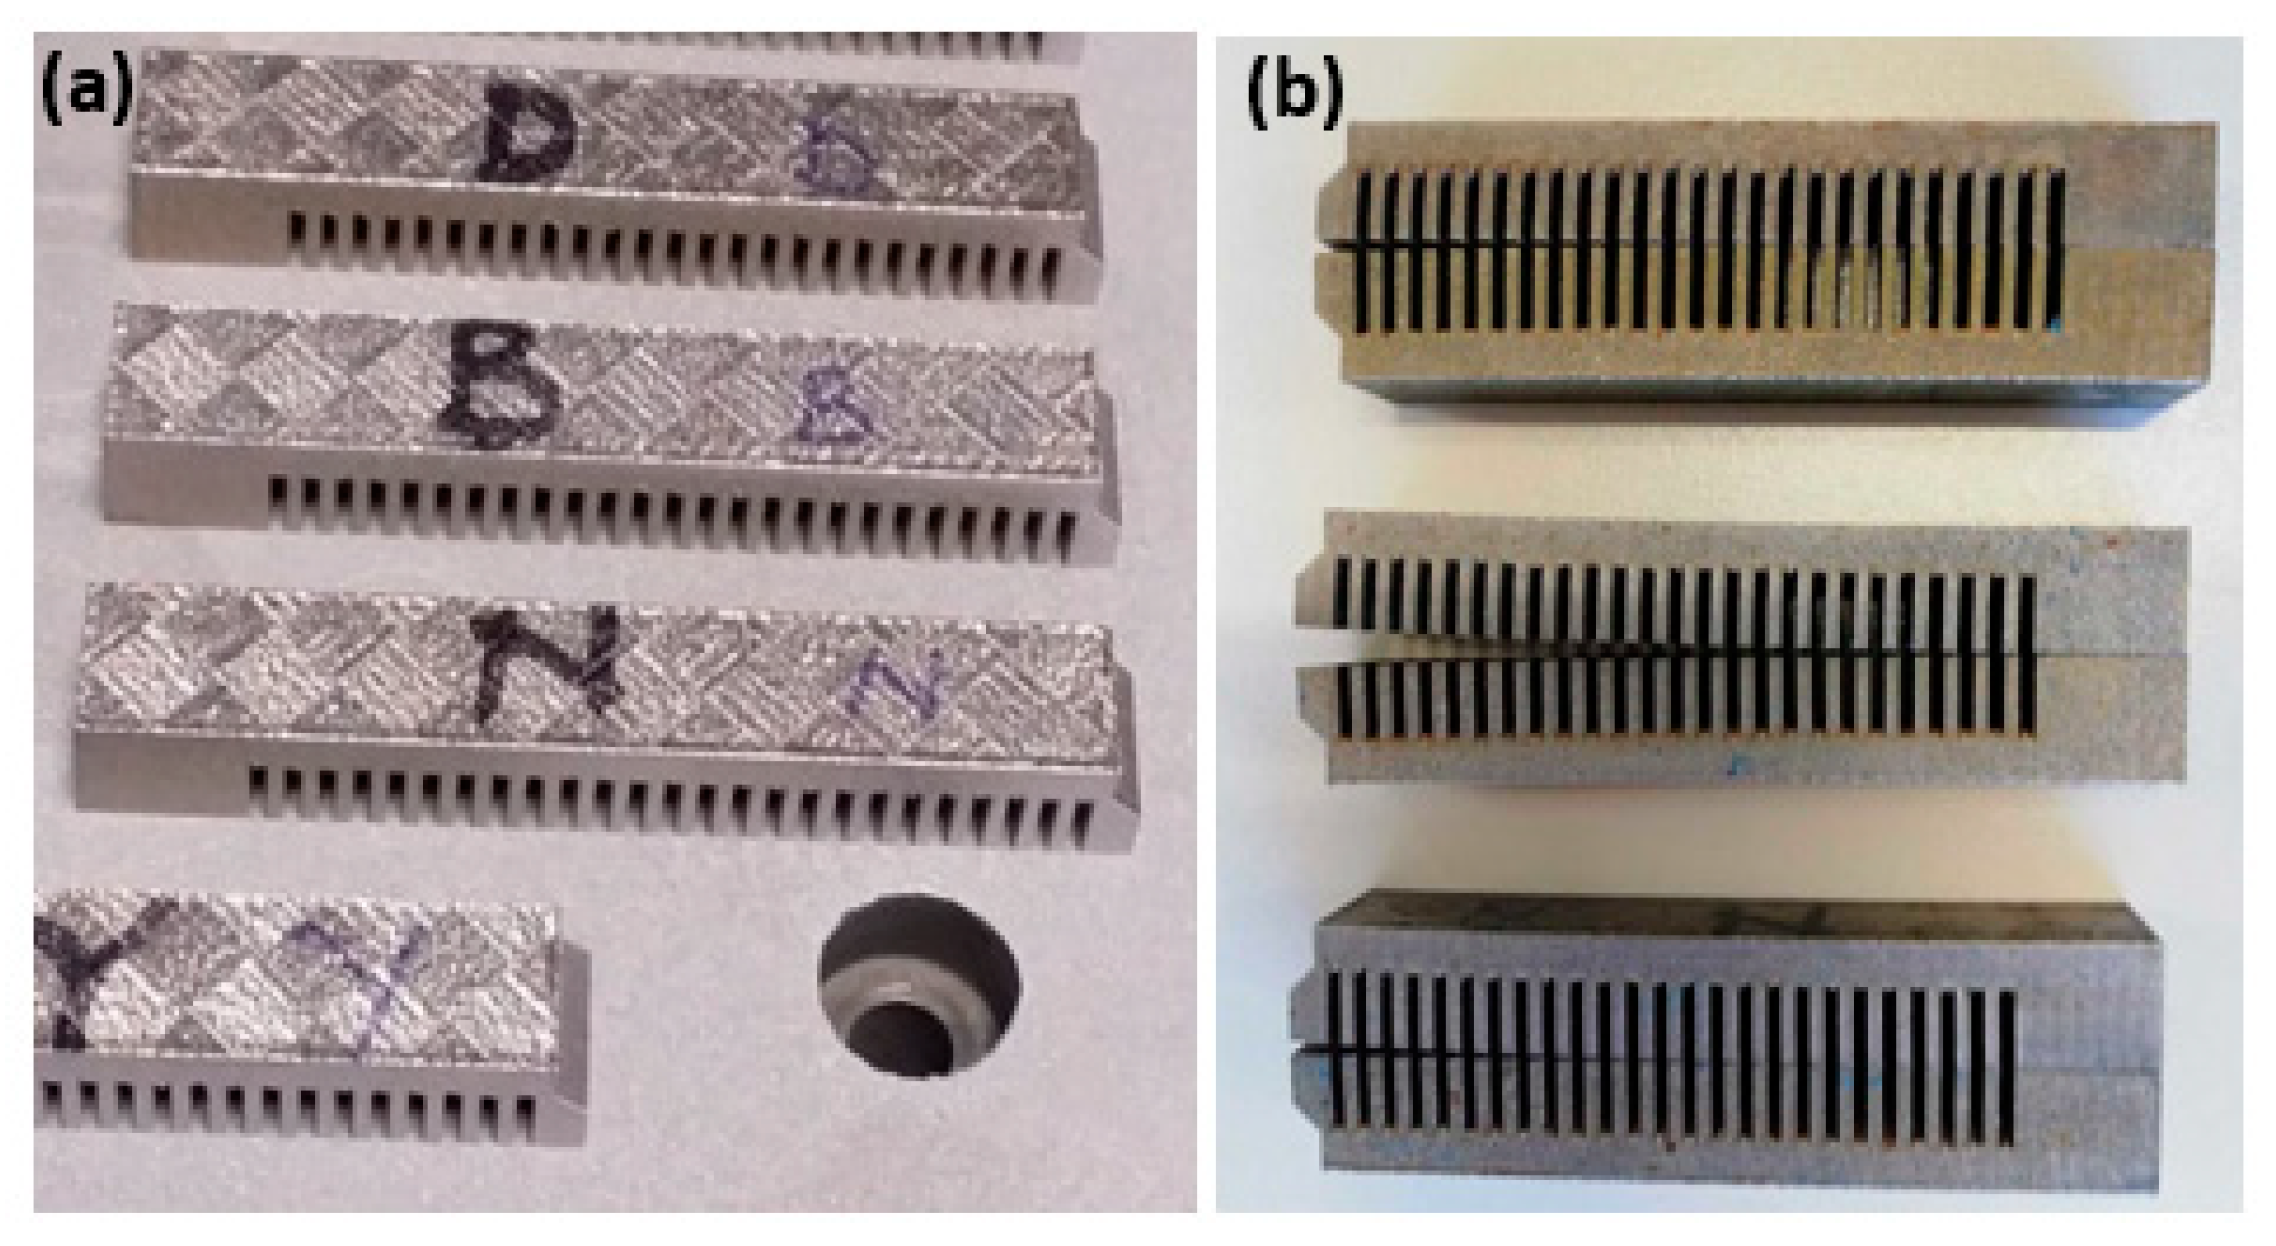
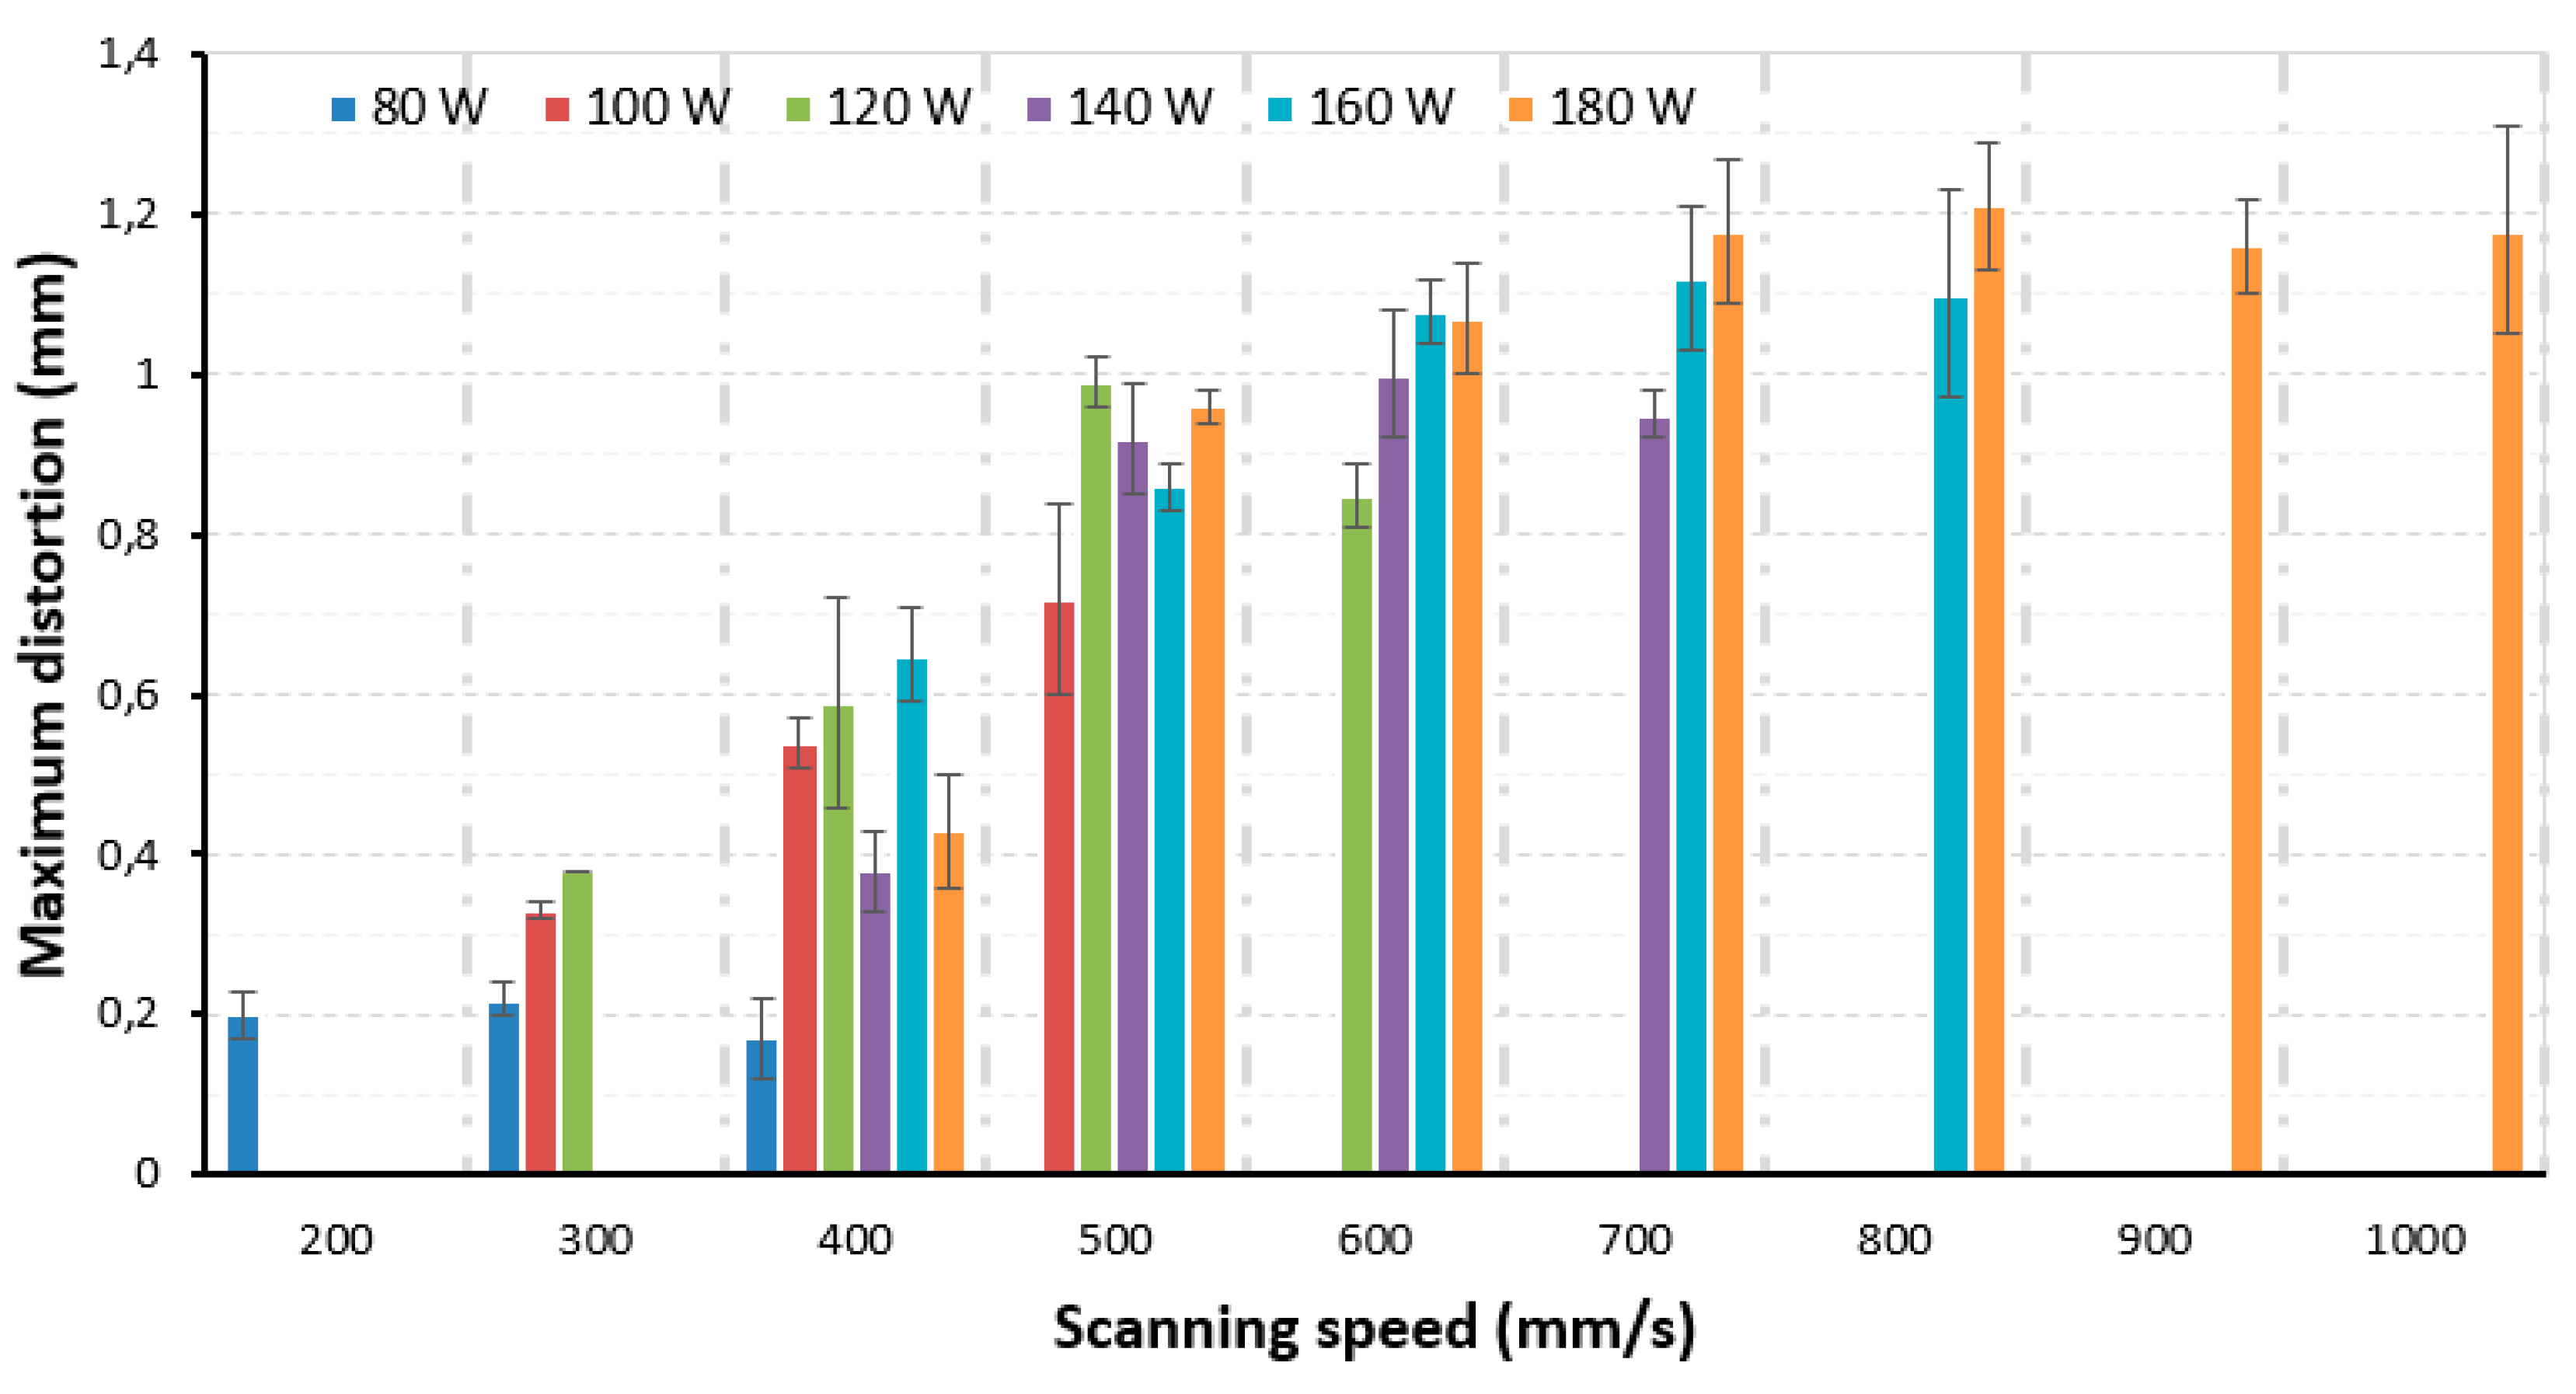
3.3. Influence of Process Parameters on Distortions

The built cantilevers remained attached to the baseplate without deforming, as shown in Figure 9a. However, upon separating the cantilevers from the baseplate, most of the cantilevers underwent noticeable warping distortion, which increased with distance from the “rigid” base of the cantilevers. The actual distortion was measured based on the deviation of the profile of the bottom (cut) surface of the cantilevers in order to negate the effects of the surface roughness of the top surface on the measurement accuracy. However, only the maximum distortion values were considered. As expected, these maximum distortions occurred at the “free” end of the cantilevers. The profile of the cantilever suggests a tensile stress rather than the compressive stress reported for the surface. However, it must be emphasized that the compressive stress found on the surface of the cubes for corresponding process parameters as those used for cantilevers is not responsible for the observed distortion. Rather, the profile suggests that a net tensile stress exists in the specimens.
The influence of laser power and scanning speed on distortions is shown in Figure 10. Generally, distortions initially increase to a maximum before steadily declining as the scanning speed and laser power are increased. The two input parameters directly influence the localized temperature gradients. At 180 W and 30 µm, the distortion increases from 0.4 mm at 400 mm/s to 1.2 mm at 800 mm/s. This trend can be attributed to the decrease in porosity that tends to increase residual stresses as the scanning speed is increased for this range of parameters. Similar behavior is observed for the other laser power/scanning speed combinations, except where the laser power was 100 W, possibly because this power level was only investigated with a maximum scanning speed of 500 mm/s. It is expected that scanning speeds higher than 500 mm/s would have resulted in diminishing distortion.
If the scanning speed is continually increased, the period of interaction of the laser beam and powder bed is reduced, thus hindering the full melting of the metal powders. In turn, this yields an increase in porosity, which also contributes to residual stress relaxation and an accompanying reduction of distortion. The interdependency between porosity and residual stresses and distortions is discussed later in Section 3.5. For every level of laser power, there exists an accompanying optimum scanning speed that results in the highest density. Unfortunately, parameters that lead to the achievement of high density also contribute to higher magnitudes of residual stresses. The trend of results for the 30-µm and 45-µm powder layer experiments is quite similar. For cantilevers built from the 45-µm layer thickness, the distortion increases from 0.07 mm to 0.58 mm when the scanning speed is increased from 400 mm/s to 600 mm/s at 180 W. A comparative summary of the distortions experienced by cantilevers manufactured at similar laser power and scanning speed values for the layer thicknesses considered is given in Table 4. As seen from this summary, much lower distortions were measured for cantilevers built from the 45-µm layer.

3.4. Summary of Influence of Layer Thickness on Process Outcomes

Increasing the layer thickness from 30 µm to 45 µm drastically reduces distortions to almost 0 mm for most of the investigated cases, as shown in Table 4. However, this is accompanied by very high porosity of more than 5% for the bulk of the parameter combinations considered. Despite the generally high porosity that is associated with the 45-µm layer, an optimum point was found at 180 W and 600 mm/s, at which the 45-μm layer thickness yields a relative density of 99.4%, which is comparable to that obtained using the 30-μm powder layer thickness (99.6%). At this point (180 W and 600 mm/s), the average distortion decreased to 0.58 mm for the 45-µm layer compared to 1.07 mm for the 30-µm layer. This presents an opportunity for the faster fabrication of tool steel parts on the SLM equipment used by shifting to a thicker powder layer (45 μm) from the default 30 μm, whilst, better still, reducing both residual stresses and distortion. The reduced building time further results in manufacturing cost reduction without compromising on the product quality with respect to residual stresses, porosity, and distortion. Shifting from 30-μm to 45-μm layer thickness reduces the number of slices by 33.3%, and a corresponding reduction in production time can be estimated in line with the production time and cost models found in Rickenbacher et al. [44], Schröder et al. [45], and Fera et al. [46].

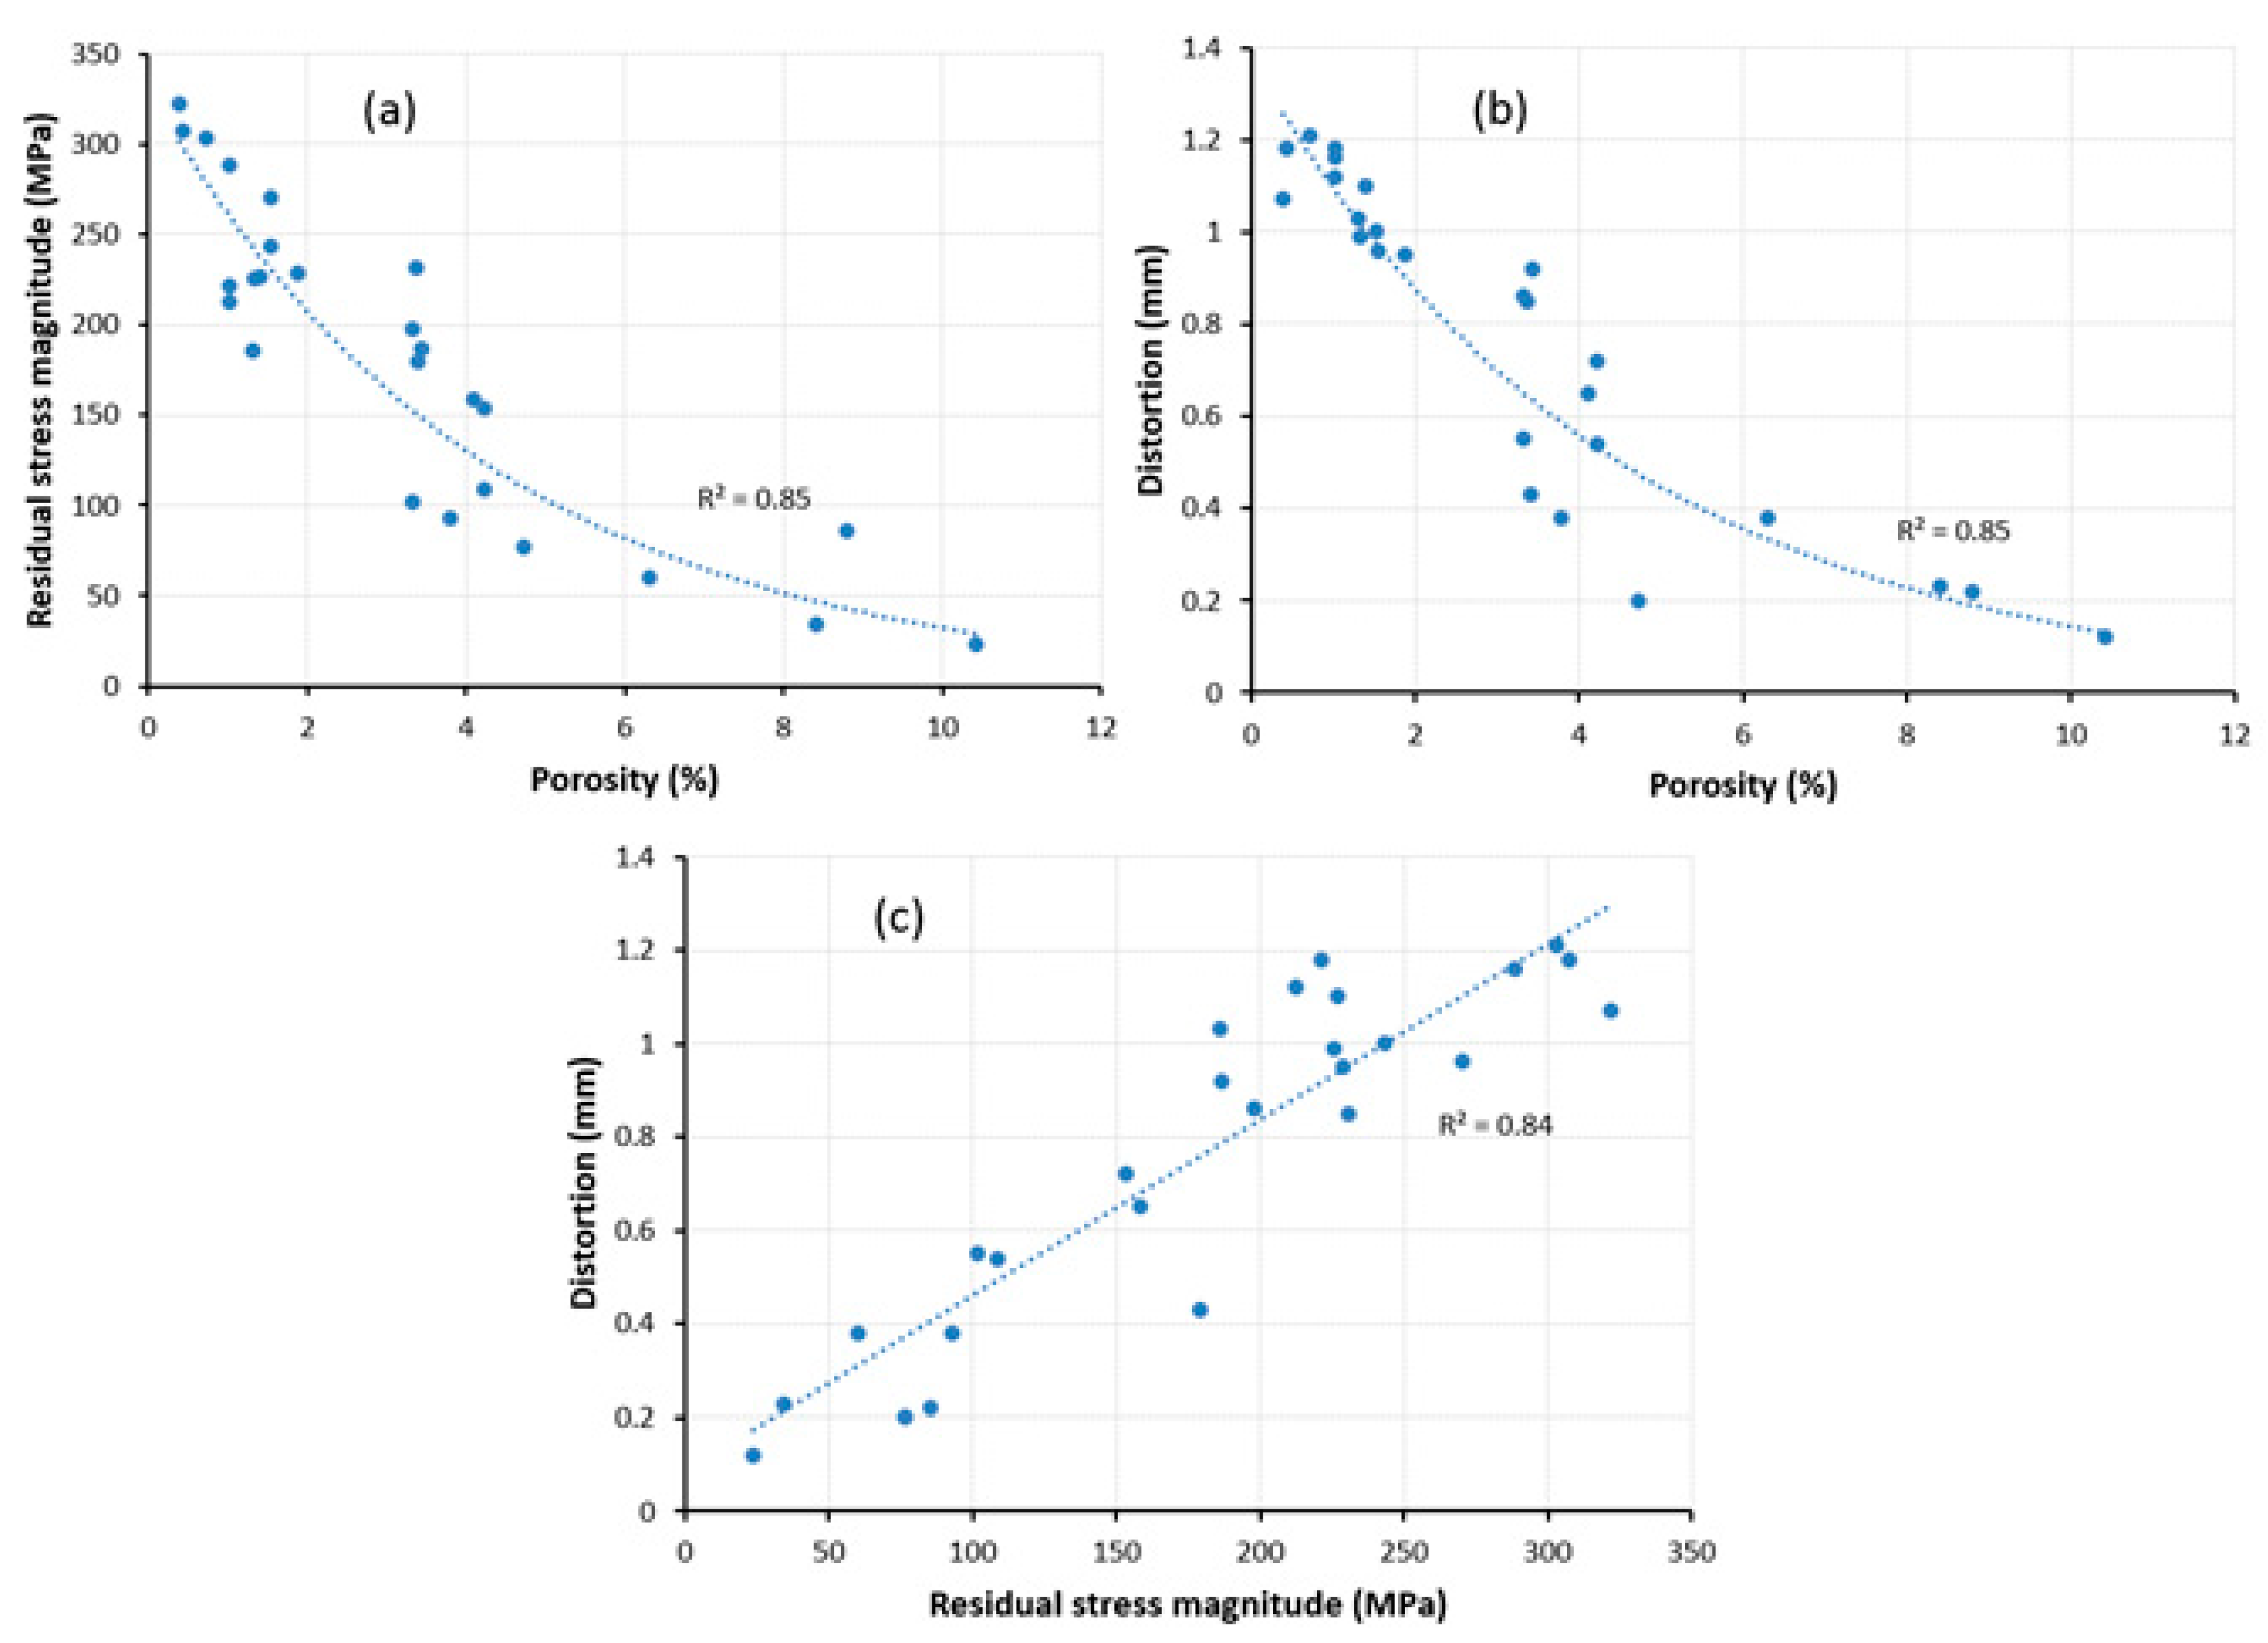
3.5. Interdependence between Process Responses

Process parameters that contributed to high density also contributed to the high cantilever distortions. It is also readily clear that porous parts suffer lower residual stresses compared to their less porous counterparts. To understand the correlations existing between these responses (porosity, residual stresses, and distortions), three further interrelationships between the process outcomes were investigated namely: porosity versus residual stresses, porosity versus distortions, and residual stresses versus distortions. The scatter plot in Figure 11a shows that pores indeed have the effect of relaxing residual stresses. The highest residual stress magnitude of 322 MPa corresponds to the lowest porosity of 0.39%, whereas the highest porosity (10.42%) is associated with the lowest residual stress of 23 MPa. The R2 value of 0.85 shows closeness between the data and fitted regression. The residual stress relaxation effect of pores in turn results in diminished distortion. The higher the porosity, the less distortion the cantilevers experience. The influence of porosity on distortion is shown in Figure 11b. Process parameters that yielded low residual stresses resulted in very little cantilever distortions, whereas parameters that contributed to higher residual stresses also, generally, contributed to higher cantilever distortions, as shown in Figure 11c. Within the 0.95 confidence interval, a very strong statistical correlation of 0.91 exists between residual stress and distortion magnitudes.
As discussed earlier, parameters that lead to high porosity result in lower residual stresses and distortions. The main factor in determining residual stresses remains thermal gradients. However, it is also evident that porosity relaxes these stresses. However, the target of SLM is to produce non-porous parts, except in some cases where some porosity may be required, especially in the manufacture of biomedical implants. The reduction of residual stresses in situ, without compromising on the part density, remains a challenge up to this day. Process conditions that minimize residual stresses during the SLM process also minimize the warping distortion of the finished parts. Whereas residual stresses can be reduced by post-process heat treatment, distortions that occur during the process cannot. An alternative could be to adopt process parameters that yield slightly porous, distortion-free and residual stress-free parts whose density would have to be increased by appropriate heat treatment. The optimization of one or more of these process outcomes should be approached with care, bearing in mind the effect that such optimization could have on the other process responses.

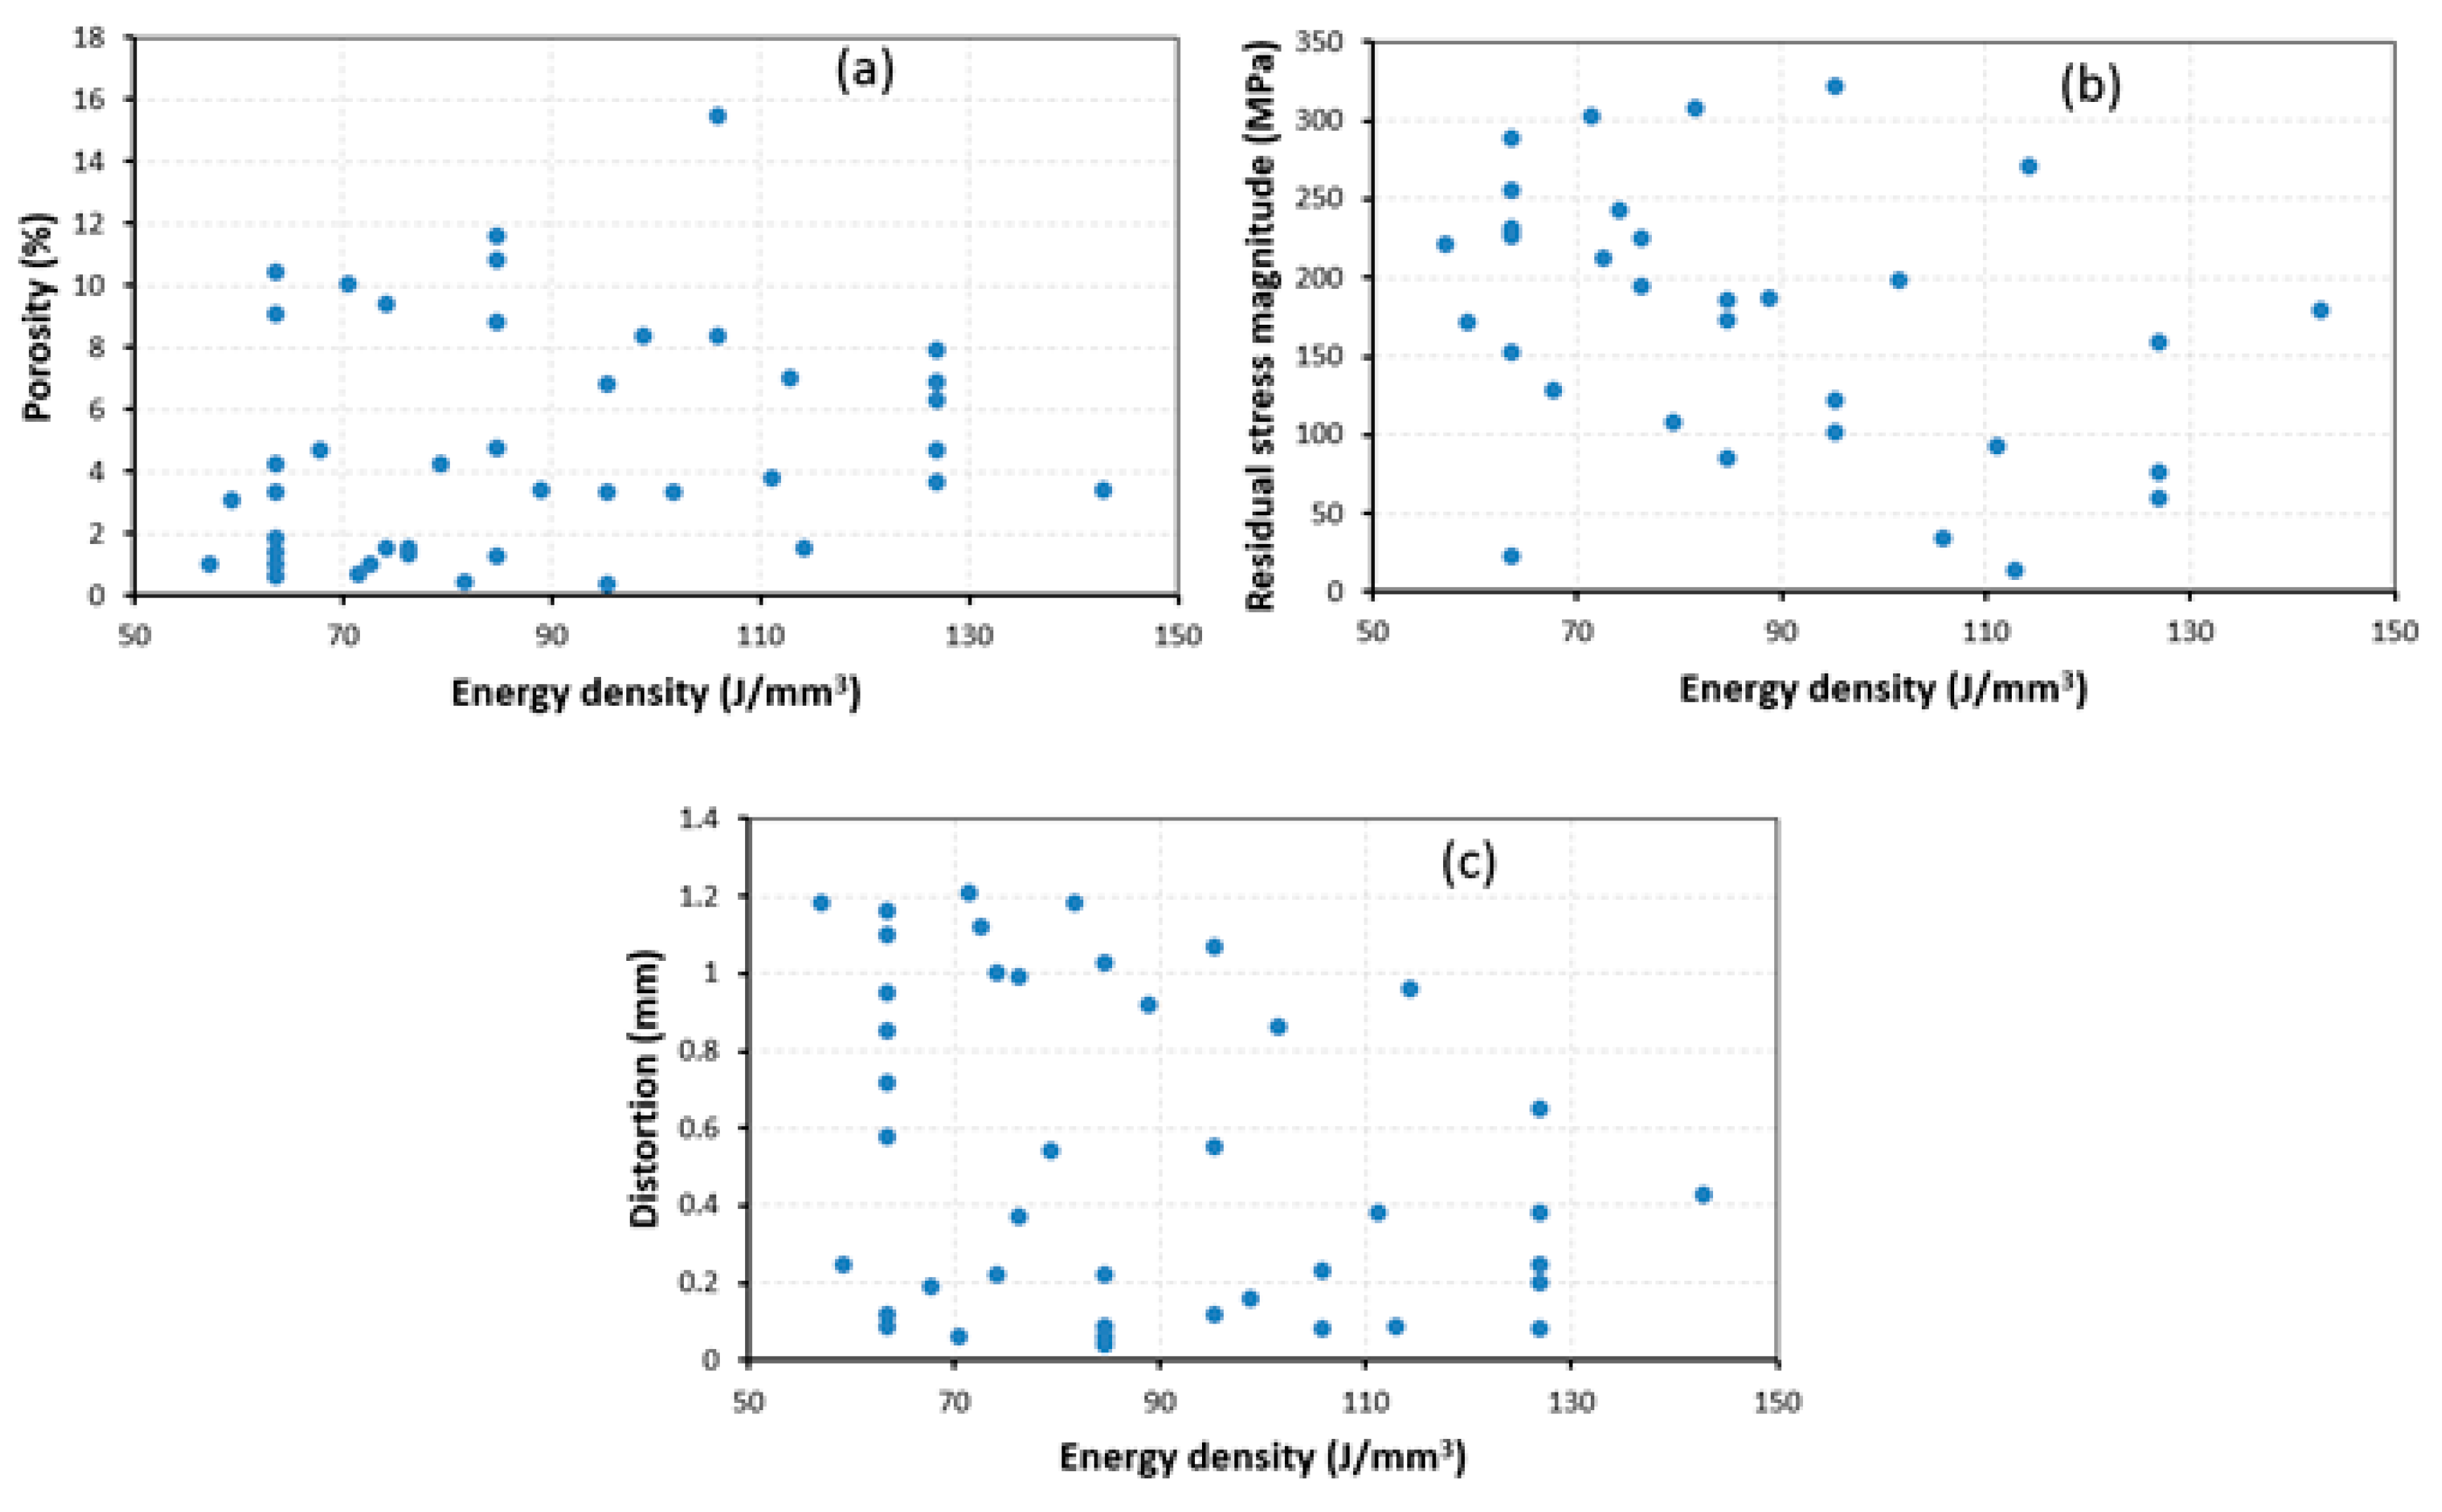
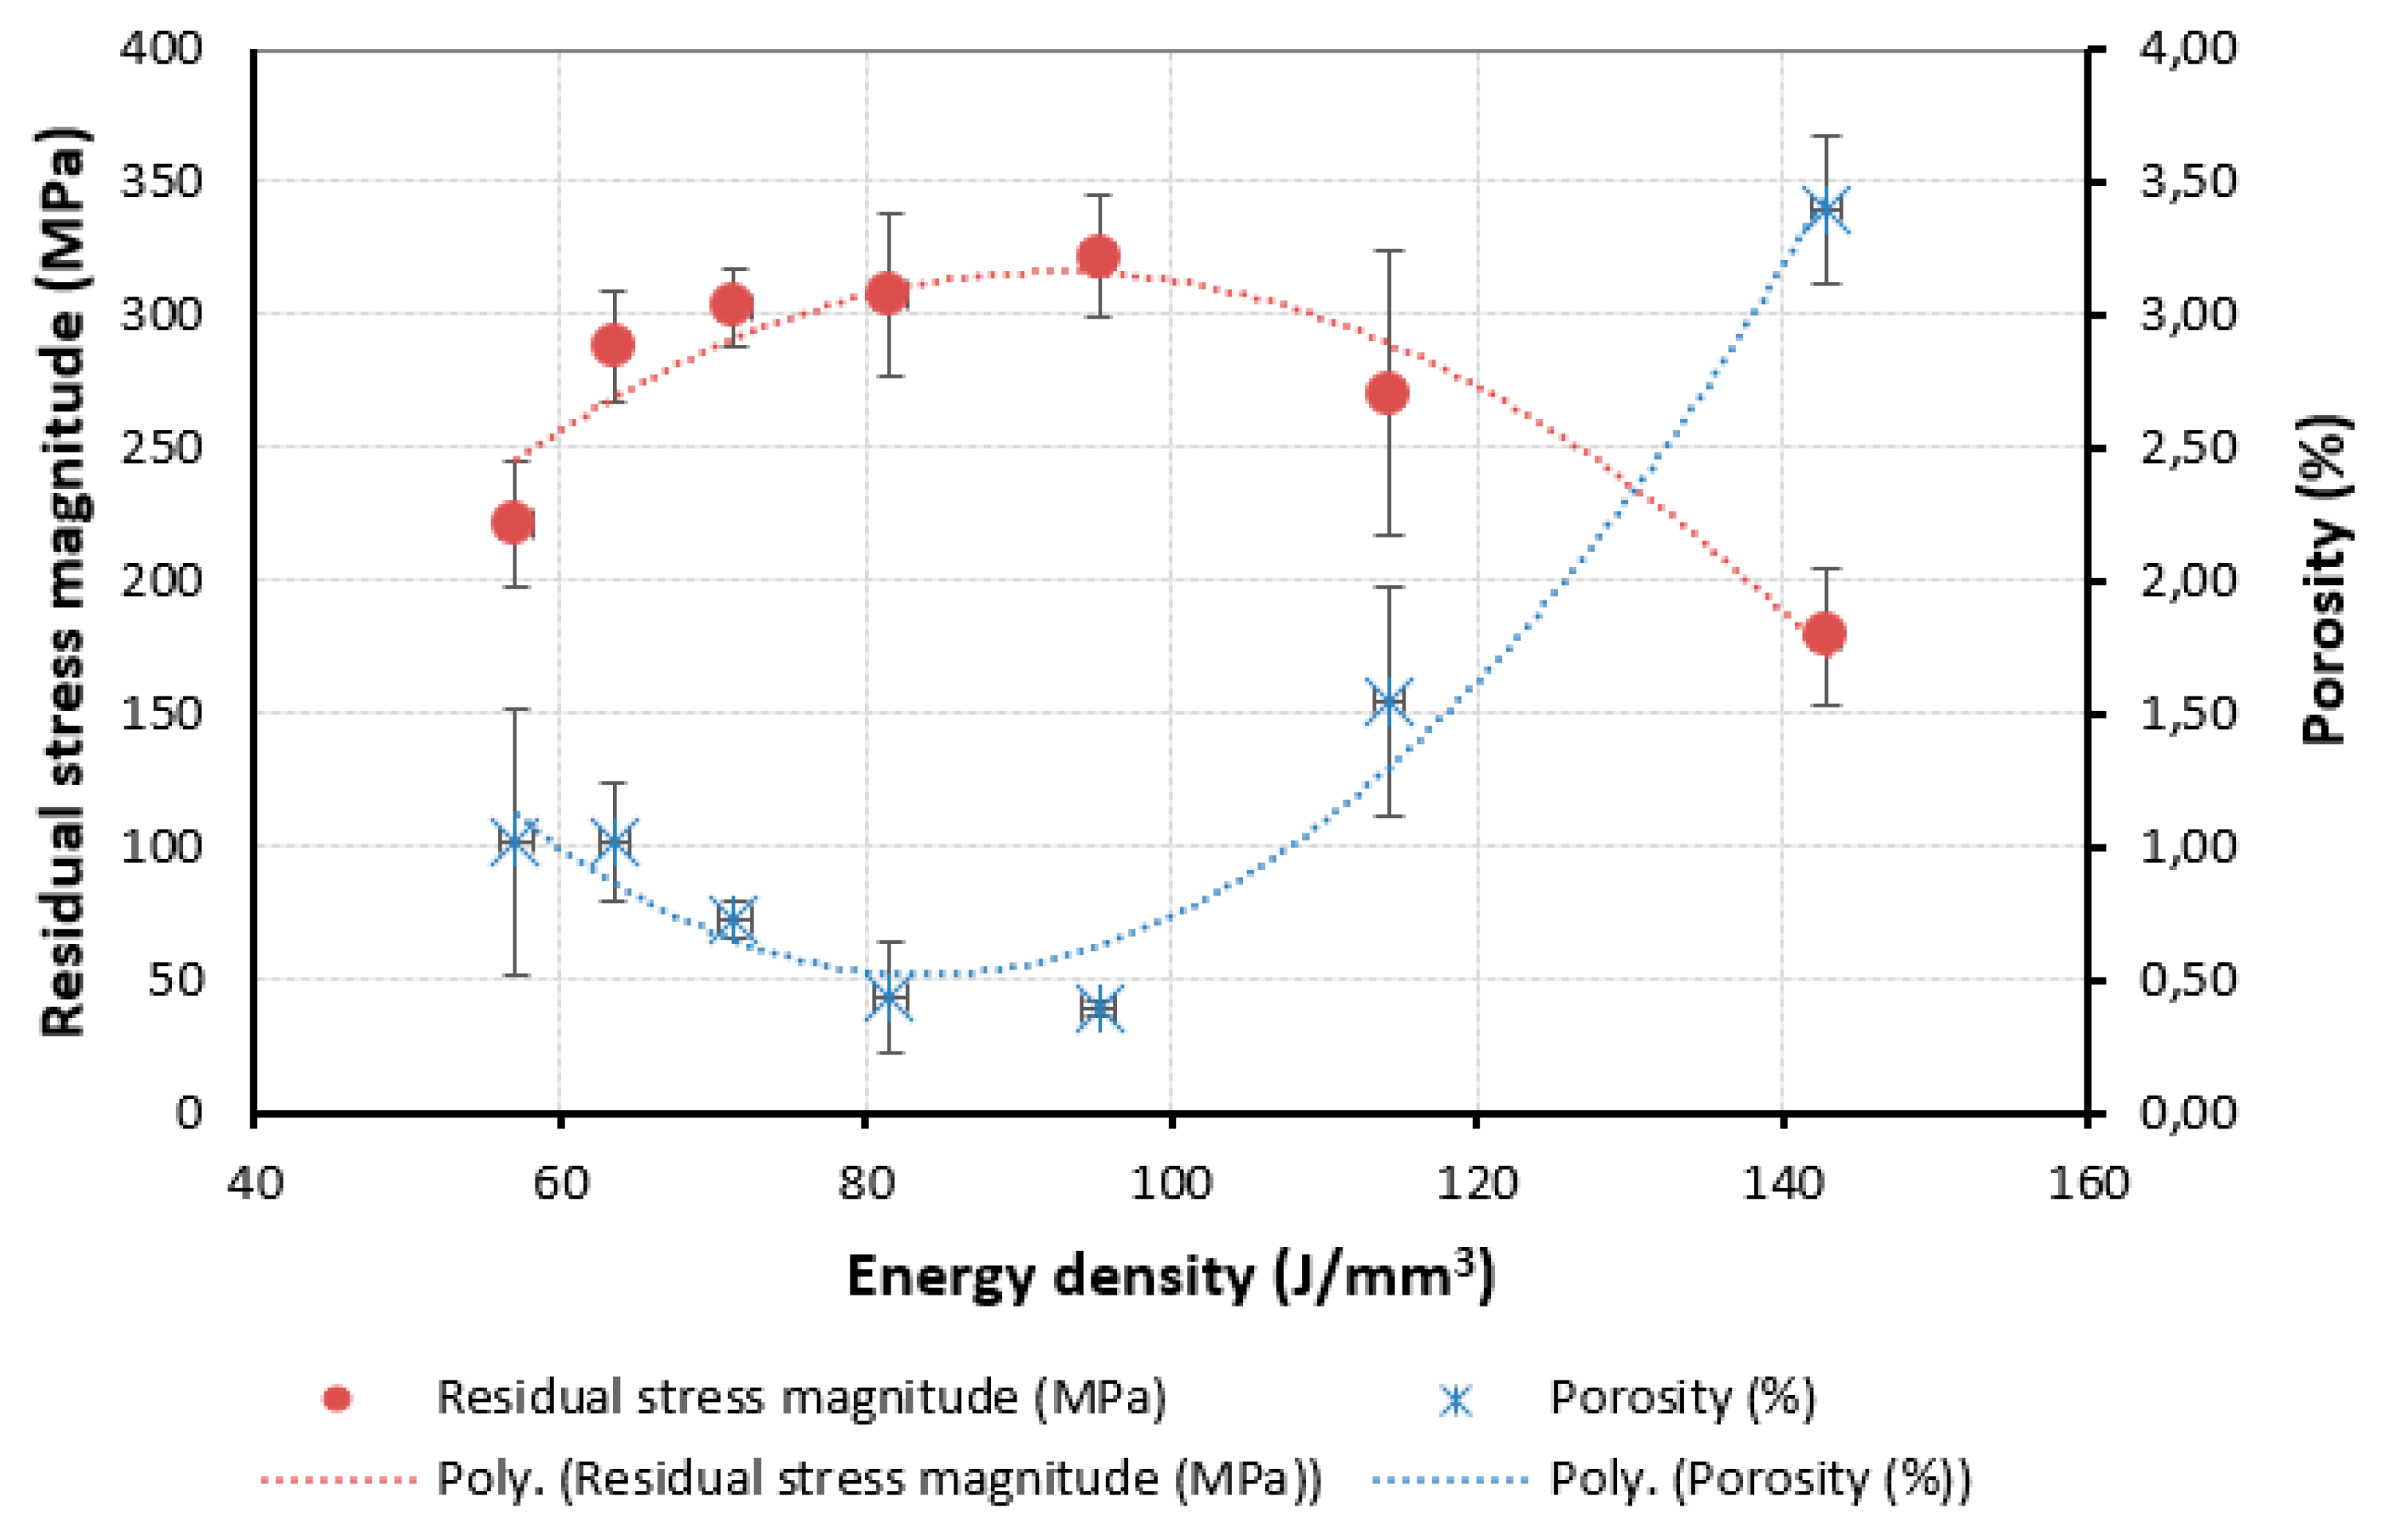
3.6. Influence of Energy Density in SLM

Energy density can be computed from Equation (1), where P is the laser power, v is the scanning speed, h represents the hatch distance and t represents the powder layer thickness. In this paper, the hatch spacing was held constant; therefore, only the laser power, scanning speed, and layer thickness contributed to the energy density. When parameters are varied simultaneously, there is no observable influence of energy density on any of the responses (porosity, residual stresses, and distortions), as shown in Figure 12. Thus, energy density cannot be used to explain or account for the differences in the observed process outcomes. This also shows that laser power and scanning speed do not have the same weighted effect on the process. Similar observations were made by Prashanth et al. [47], who suggested that the energy density equation might need modification.
E = P v . h . t
Statistical analysis of all the experimental results presented earlier in Figure 12 shows that, indeed, the energy density quantity does not have a significant influence on the process outcomes, as shown in the summary in Table 5. Even though the p-value shows a statistical significance of energy density on distortion (p = 0.001), the R-squared values are too weak, showing that the observed variation in distortions cannot be confidently attributed to energy density.
However, the energy density has a clear effect on process outcome when only one parameter is varied whilst the others are held constant, for example varying laser speed at a fixed laser power of 180 W and layer thickness of 30 µm. The effect of energy density on porosity for this scenario is shown in Figure 13. For energy density of 57 J/mm3, a corresponding porosity value of 1.02% is observed. The porosity gradually decreases to 0.72%, 0.43% and 0.39% when the energy density is increased to 71 J/mm3, 82 J/mm3 and 95 J/mm3 respectively. The optimum energy density level for laser power 180 W is around 95 J/mm3 because when this value is exceeded, porosity increases significantly to 1.55% and 3.40% for 114 J/mm3 and 143 J/mm3 energy density values, respectively. At low energy density, there is insufficient energy to melt the powder; hence, the porosity is higher than when the energy density is increased to an optimum value. Beyond the optimum value, the energy density becomes excessive, leading to overheating. This, ultimately, promotes porosity. Considering a scenario whereby only the scanning speed is varied whilst all other parameters are held constant, residual stresses decrease on either side of the optimum energy density (95 J/mm3) coinciding with maximum achievable relative density. As shown in Figure 13, the maximum residual stress value is 322 MPa at 95 J/mm3. The lowest energy density value (57 J/mm3) contributes to 221 MPa, whereas for the maximum energy density of 143 J/mm3, 179 MPa residual stress value is observed. The reduction of the residual stresses when energy density is either too low or too high is attributed to the associated porosity, which has the effect of relaxing residual stresses.

4. Conclusions

The influence of process parameters on porosity, residual stresses, and distortion has been studied. Furthermore, the interdependence of the process outcomes has been investigated and the following conclusions can be drawn:
  • Increasing laser power and scanning speed gives rise to steep thermal gradients which, in turn, lead to increase in residual stress magnitudes and the corresponding distortions.
  • High porosity in SLM parts can occur due to overheating or insufficient heating. Excessive heat can lead to over-melting, whereas insufficient heat leads to poor interlayer bonding.
  • Strong interrelationships exist between the process outcomes, that is, porosity, residual stresses, and distortions. Therefore, the optimization of one or more of these process outcomes should be approached with care, bearing in mind the effect that such optimization could have on the other responses.
  • Increasing the layer thickness results in a decline in both residual stresses and distortions, although an accompanying increase in unwanted porosity is also observed. The decrease in residual stress magnitude can be attributed to a reduced thermal energy input and cooling rate.
  • If parameters vary simultaneously, energy density has no bearing at all on all process outcomes, and cannot be used as a predictor of the outcome. However, the findings also show a clear correlation between energy density and the process responses if only one parameter is varied at a time.
To fully understand the nature and distribution of residual stresses in tooling steels, future work will focus on investigating the effect of microstructure on residual stress evolution in the SLM of maraging steel 300. This has the potential to provide deeper insight into the compressive stress nature of the surfaces of maraging steel parts made by SLM.

Author Contributions

Conceptualization, L.M.; methodology, L.M., I.Y., and S.M., software, L.M. and I.Y.; validation, L.M., I.Y., and S.M.; formal analysis, L.M., I.Y., and S.M.; investigation, L.M., I.Y., and S.M.; resources, I.Y. and S.M.; data curation, L.M.; writing—original draft preparation, L.M.; writing—review and editing, L.M., I.Y., and S.M.; visualization, L.M.; supervision, I.Y. and S.M.; project administration, I.Y. and S.M.; funding acquisition, I.Y.

Funding

This research was funded by the Department of Science and Technology and National Research Foundation of South Africa (Grant No. 97994).

Acknowledgments

The authors thank the South African Research Chairs Initiative of the Department of Science and Technology and National Research Foundation of South Africa (Grant No. 97994). Also, the authors express gratitude to the staff at Nelson Mandela University (NMU) for their assistance with XRD residual stress measurement.

Conflicts of Interest

The authors declare no conflict of interest.

References

  1. Papadakis, L.; Loizou, A.; Risse, J.; Bremen, S.; Schrage, J. A computational reduction model for appraising structural effects in selective laser melting manufacturing. Virtual Phys. Prototyp. 2014, 9, 17–25. [Google Scholar] [CrossRef]
  2. Kandil, F.A.; Lord, J.D.; Fry, A.T.; Grant, P.V. A Review of Residual Stress Measurement Methods-A Guide to Technical Selection; Report MATC (A) 4; NPL: Teddington, UK, 2001. [Google Scholar]
  3. Cheng, X.; Prask, H.J.; Gnaeupel-Herold, T.; Luzin, V.; Fisher, J.W. Neutron diffraction measurements for residual stresses in AL-6XN stainless steel welded beams. In Neutron Diffraction; Khidirov, I., Ed.; IntechOpen: Rijeka, Croatia, 2012; pp. 25–48. [Google Scholar]
  4. Mercelis, P.; Kruth, J. Residual stresses in selective laser sintering and selective laser melting. Rapid Prototyp. J. 2006, 12, 254–265. [Google Scholar] [CrossRef]
  5. Zaeh, M.F.; Branner, G. Investigations on residual stresses and deformations in selective laser melting. Prod. Eng. 2010, 4, 35–45. [Google Scholar] [CrossRef]
  6. Kempen, K.; Thijs, L.; Vrancken, B.; Buls, S.; Van Humbeek, J.; Kruth, J.-P. Lowering thermal gradients in selective laser melting by pre-heating the baseplate. In Proceedings of the Solid Freeform Fabrication Symposium, Austin, TX, USA, 12–14 August 2013. [Google Scholar]
  7. Kruth, J.-P.; Deckers, J.; Yasa, E.; Wauthle, R. Assessing and comparing influencing factors of residual stresses in selective laser melting using a novel analysis method. Proc. Inst. Mech Eng. Part. B J. Eng. Manuf. 2012, 226, 980–991. [Google Scholar] [CrossRef]
  8. Leuders, S.; Thöne, M.; Riemer, A.; Niendorf, T.; Tröster, T.; Richard, H.A.; Maier, H.J. On the mechanical behaviour of titanium alloy TiAl6V4 manufactured by selective laser melting: Fatigue resistance and crack growth performance. Int. J. Fatigue 2013, 48, 300–307. [Google Scholar] [CrossRef]
  9. Becker, T.; Dimitrov, D. The achievable mechanical properties of SLM produced maraging steel 300 components. Rapid Prototyp. J. 2016, 22, 487–494. [Google Scholar] [CrossRef]
  10. Töppel, T.; Müller, B.; Hoeren, K.P.J.; Witt, G. Eigenspannungen und verzug bei der additiven fertigung durch laserstrahlschmelzen. Schweiss. und Schneid. 2016, 68, 176–186. [Google Scholar]
  11. Jhabvala, J.; Boillat, E.; Antignac, T.; Glardon, R. On the effect of scanning strategies in the selective laser melting process. Virtual Phys. Prototyp. 2010, 5, 99–109. [Google Scholar] [CrossRef]
  12. Wu, A.S.; Brown, D.W.; Kumar, M.; Gallegos, G.F.; King, W.E. An experimental investigation into additive manufacturing-induced residual stresses in 316L stainless steel. Metall. Mater. Trans. A Phys. Metall Mater. Sci. 2014, 45, 6260–6270. [Google Scholar] [CrossRef]
  13. Casavola, C.; Campanelli, S.L.; Pappalettere, C. Preliminary investigation on distribution of residual stress generated by the selective laser melting process. J. Strain Anal. Eng. Des. 2009, 44, 93–104. [Google Scholar] [CrossRef]
  14. Vrancken, B.; Wauthle, R.; Kruth, J.-P.; Van Humbeeck, J. Study of the influence of material properties on residual stress in selective laser melting. In Proceedings of the Solid Freeform Fabrication Symposium, Austin, TX, USA, 12–14 August 2013; pp. 393–407. [Google Scholar]
  15. Roberts, I.A. Investigation of residual stresses in the laser melting of metal powders in additive layer manufacturing. Ph.D. Thesis, University of Wolverhampton, Wolverhampton, UK, 2012. [Google Scholar]
  16. Yadroitsev, I.; Yadroitsava, I. Evaluation of residual stress in stainless steel 316L and Ti6Al4V samples produced by selective laser melting. Virtual Phys. Prototyp. 2015, 10, 67–76. [Google Scholar] [CrossRef]
  17. Yan, J.J.; Zheng, D.L.; Li, H.X.; Jia, X.; Sun, J.F.; Li, Y.L.; Qian, M.; Yan, M. Selective laser melting of H13: Microstructure and residual stress. J. Mater. Sci. 2017, 12476–12485. [Google Scholar] [CrossRef]
  18. Yadroitsev, I.; Yadroitsava, I.; Bertrand, P.; Smurov, I. Factor analysis of selective laser melting process parameters and geometrical characteristics of synthesized single tracks. Rapid Prototyp. J. 2012, 18, 201–208. [Google Scholar] [CrossRef]
  19. Hanzl, P.; Zetek, M.; Bakša, T.; Kroupa, T. The influence of processing parameters on the mechanical properties of SLM parts. Procedia Eng. 2015, 100, 1405–1413. [Google Scholar] [CrossRef]
  20. Campanelli, S.L.; Contuzzi, N.; Angelastro, A.; Ludovico, A.D. Capabilities and performances of the selective laser melting process. New Trends Technol. Devices Comput. Commun. Ind. Syst. 2010, 233–252. [Google Scholar] [CrossRef]
  21. Thijs, L.; Verhaeghe, F.; Craeghs, T.; Van Humbeeck, J.; Kruth, J.-P. A study of the microstructural evolution during selective laser melting of Ti-6Al-4V. Acta Mater. 2010, 58, 3303–3312. [Google Scholar] [CrossRef]
  22. Gu, H.; Gong, H.; Pal, D.; Rafi, K.; Starr, T.; Stucker, B. Influences of energy density on porosity and microstructure of selective laser melted 17- 4PH stainless steel. In Proceedings of the Solid Freeform Fabrication Symposium, Austin, TX, USA, 12–14 August 2013; pp. 474–479. [Google Scholar] [CrossRef]
  23. Delgado, J.; Ciurana, J.; Rodríguez, C.A. Influence of process parameters on part quality and mechanical properties for DMLS and SLM with iron-based materials. Int. J. Adv. Manuf. Technol. 2012, 60, 601–610. [Google Scholar] [CrossRef]
  24. Yadroitsava, I.; Yadroitsev, I. Residual stress in metal specimens produced by direct metal laser sintering. In Proceedings of the Solid Freeform Fabrication Symposium, Austin, TX, USA, 12–14 August 2015; pp. 614–625. [Google Scholar] [CrossRef]
  25. Vrancken, B. Study of residual stresses in selective laser melting. Ph.D. Thesis, KU Leuven, Leuven, Belgium, 2016. [Google Scholar]
  26. Buchbinder, D.; Meiners, W.; Pirch, N.; Schrage, K.W. Investigation on reducing distortion by preheating during manufacture of aluminum components using selective laser melting. J. Laser Appl. 2014, 26, 012004. [Google Scholar] [CrossRef]
  27. Papadakis, L.; Loizou, A.; Risse, J.; Schrage, J. Numerical computation of component shape distortion manufactured by Selective Laser Melting. Procedia CIRP 2014, 18, 90–95. [Google Scholar] [CrossRef]
  28. Neugebauer, F.; Keller, N.; Ploshikhin, V.; Feuerhahn, F.; Köhler, H. Multi scale FEM simulation for distortion calculation in additive manufacturing of hardening stainless steel. In Proceedings of the International Workshop on Thermal Forming and Welding Distortion, Bremen, Germany, 9–10 April 2014; Volume 104. [Google Scholar]
  29. Li, C.; Fu, C.H.; Guo, Y.B.; Fang, F.Z. A multiscale modeling approach for fast prediction of part distortion in selective laser melting. J. Mater. Process. Technol. 2016, 229, 703–712. [Google Scholar] [CrossRef]
  30. Mugwagwa, L.; Dimitrov, D.; Matope, S.; Yadroitsev, I. Evaluation of the impact of scanning strategies on residual stresses in selective laser melting. Int. J. Adv. Manuf. Technol. 2019, 102, 2441–2450. [Google Scholar] [CrossRef]
  31. Mugwagwa, L.; Dimitrov, D.; Matope, S.; Yadroitsev, I. Influence of process parameters on residual stress related distortions in selective laser melting. Procedia Manuf. 2018, 21, 92–99. [Google Scholar] [CrossRef]
  32. Concept Laser. Heat Treatment CL50WS; Version 3; Concept Laser GmbH: Lichtenfels, Germany, 2010. [Google Scholar]
  33. Spierings, A.B.; Schneider, M.; Eggenberger, R. Comparison of density measurement techniques for additive manufactured metallic parts. Rapid Prototyp. J. 2011, 17, 380–386. [Google Scholar] [CrossRef]
  34. Yasa, E.; Kempen, K.; Kruth, J. Microstructure and mechanical properties of Maraging Steel 300 after selective laser melting. In Proceedings of the Solid Freeform Fabrication Symposium, Austin, TX, USA, 12–14 August 2010; pp. 383–396. [Google Scholar]
  35. Slotwinski, J.A.; Garboczi, E.J.; Hebenstreit, K.M. Porosity measurements and analysis for metal additive manufacturing process control. J. Res. Natl. Inst. Stand. Technol. 2014, 119, 494. [Google Scholar] [CrossRef]
  36. Fitzpatrick, M.E.; Fry, A.T.; Holdway, P.; Kandil, F.A.; Shackleton, J.; Suominen, L. Determination of residual stresses by X-ray diffraction. Meas. Good Pract. Guid. 2005, 52, 1–68. [Google Scholar]
  37. Safronov, V.A.; Khmyrov, R.S.; Kotoban, D.V.; Gusarov, A.V. Distortions and residual stresses at layer-by-layer additive manufacturing by fusion. J. Manuf. Sci. Eng. 2016, 139, 031017. [Google Scholar] [CrossRef]
  38. Mazur, M.; Brincat, P.; Leary, M.; Brandt, M. Numerical and experimental evaluation of a conformally cooled H13 steel injection mould manufactured with selective laser melting. Int. J. Adv. Manuf. Technol. 2017, 93, 881–900. [Google Scholar] [CrossRef]
  39. Kruth, J.-P.; Froyen, L.; Van Vaerenbergh, J.; Mercelis, P.; Rombouts, M.; Lauwers, B. Selective laser melting of iron-based powder. J. Mater. Process. Technol. 2004, 149, 616–622. [Google Scholar] [CrossRef]
  40. Cottam, R.; Wang, J.; Luzin, V. Characterization of microstructure and residual stress in a 3D H13 tool steel component produced by additive manufacturing. J. Mater. Res. 2014, 29, 1978–1986. [Google Scholar] [CrossRef]
  41. Mertens, R.; Vrancken, B.; Holmstock, N.; Kinds, Y.; Kruth, J.-P.; Van Humbeeck, J. Influence of powder bed preheating on microstructure and mechanical properties of H13 tool steel SLM parts. Phys. Procedia 2016, 83, 882–890. [Google Scholar] [CrossRef]
  42. Mugwagwa, L.; Dimitrov, D.; Matope, S.; Venter, A.M. Residual stress distributions within components manufactured using selective laser melting. In Proceedings of the 18th International RAPDASA Conference, Durban, South Arica, 8–10 November 2017; pp. 153–164. [Google Scholar]
  43. Ali, H.; Ghadbeigi, H.; Mumtaz, K. Processing parameter effects on residual stress and mechanical properties of selective laser melted Ti6Al4V. J. Mater. Eng. Perform. 2018, 27, 4059–4068. [Google Scholar] [CrossRef] [PubMed]
  44. Rickenbacher, L.; Spierings, A.; Wegener, K. An integrated cost-model for selective laser melting (SLM). Rapid Prototyp. J. 2013, 19, 208–214. [Google Scholar] [CrossRef]
  45. Schröder, M.; Falk, B.; Schmitt, R. Evaluation of cost structures of additive manufacturing processes using a new business model. Procedia CIRP 2015, 30, 311–316. [Google Scholar] [CrossRef]
  46. Fera, M.; Fruggiero, F.; Costabile, G.; Lambiase, A.; Pham, D.T. A new mixed production cost allocation model for additive manufacturing (MiProCAMAM). Int. J. Adv. Manuf. Technol. 2017, 92, 4275–4291. [Google Scholar] [CrossRef]
  47. Prashanth, K.G.; Scudino, S.; Maity, T.; Das, J.; Eckert, J. Is the energy density a reliable parameter for materials synthesis by selective laser melting? Mater. Res. Lett. 2017, 5, 386–390. [Google Scholar] [CrossRef] [Green Version]
Figure 1. Cantilever geometry used for distortion study (dimensions in mm).
Metals 09 01042 g001
Figure 2. Sectioning planes for optical microscopy.
Metals 09 01042 g002
Figure 3. XRD residual stress measurement.
Metals 09 01042 g003
Figure 4. Variation of porosity with scanning speed and laser power at 30-µm layer thickness.
Metals 09 01042 g004
Figure 5. Optical images for selected process parameter combinations across (XY) and along (XZ) the building direction.
Metals 09 01042 g005
Figure 6. Poor surface finishes for some of the parts built from the 45-µm layer thickness.
Metals 09 01042 g006
Figure 7. Variation of residual stress magnitude with laser power and scanning speed (30-µm layer).
Metals 09 01042 g007
Figure 8. Residual stress magnitude comparison for 30-µm and 45-µm layer thicknesses at 180 W and 600 mm/s for samples manufactured on the EOSINT M280 machine.
Metals 09 01042 g008
Figure 9. (a) Undistorted parts before separation from baseplate, and (b) distortion of parts relative to each other after separation from the baseplate.
Metals 09 01042 g009
Figure 10. Effect of scanning speed and laser power on distortions at 30-µm layer thickness.
Metals 09 01042 g010
Figure 11. SLM interdependencies: (a) porosity–residual stresses, (b) porosity–distortions, and (c) residual stresses–distortions at 30 µm.
Metals 09 01042 g011
Figure 12. Scatter plots of the effect of energy density on (a) porosity, (b) residual stress magnitude, and (c) distortions for the layer thicknesses studied.
Metals 09 01042 g012
Figure 13. Effect of energy density on (a) porosity and (b) residual stresses.
Metals 09 01042 g013
Table 1. XRD parameters used.
ParameterSpecification
Aperture diameter (focus)1 mm
2θ (Bragg angle)156.41o
ψ-tilt−33o to 33o
Number of steps9
S1−1.28 × 10⁻⁶ MPa−1
½S25.72 × 10−6 MPa−1
Table 2. Porosity comparison for the layer thicknesses studied.
Laser Power (W)Scanning Speed (mm/s)Porosity at 30 µm (%)Porosity at 45 µm (%)
802004.73 ± 0.5210.81 ± 0.37
1003008.41 ± 0.5610.07 ± 0.35
1203006.31 ± 0.2011.61 ± 0.06
1204003.32 ± 0.159.12 ± 0.39
1404003.79 ± 0.069.41 ± 0.40
1405003.44 ± 0.343.07 ± 0.37
1604004.10 ± 0.514.76 ± 0.31
1605003.32 ± 0.104.69 ± 0.19
1804003.40 ± 0.286.82 ± 0.80
1805001.55 ± 0.171.52 ± 0.00
1806000.39 ± 0.030.65 ± 0.15
Table 3. Comparison of residual stress magnitudes for the layer thicknesses studied.
Laser Power (W)Scanning Speed (mm/s)Residual Stress Magnitude at 30 µm (MPa)Residual Stress Magnitude at 45 µm (MPa)
140500187 ± 18172 ± 57
160400158 ± 25173 ± 22
160500198 ± 29129 ± 31
180400179 ± 26122 ± 14
180500270 ± 54195 ± 30
180600322 ± 23256 ± 21
Table 4. Distortion comparison for the layer thicknesses studied.
Laser Power (W)Scanning Speed (mm/s)Distortion at 30 µm (mm)Distortion at 45 µm (mm)
802000.20 ± 0.030.04 ± 0.00
1003000.23 ± 0.010.06 ± 0.05
1203000.38 ± 0.000.09 ± 0.06
1204000.55 ± 0.130.09 ± 0.03
1404000.38 ± 0.050.22 ± 0.07
1405000.92 ± 0.070.25 ± 0.02
1604000.65 ± 0.060.06 ± 0.04
1605000.86 ± 0.030.19 ± 0.06
1804000.43 ± 0.070.07 ± 0.02
1805000.96 ± 0.020.37 ± 0.03
1806001.07 ± 0.070.58 ± 0.02
Table 5. Statistical analysis of the effect of energy density on SLM outcomes.
ResponseMultiple R2 (%)Adjusted R2 (%)Predicted R2 (%)p-Value
Porosity5.01.10.0000.271
Residual stresses11.57.80.0000.090
Distortion35.632.925.70.001

