Abstract
High-pressure torsion has been used to obtain the ultra-fine grained (UFG) state with a high specific area of grain boundaries (GBs) in Al-Zn, Al-Mg, Cu-Ag, Cu-Co, and Cu-Ni solid solutions with face-centered cubic (fcc) lattices. The UFG samples were heated in a differential scanning calorimeter (DSC). Small endothermic peaks in the DSC curves were observed in the one-phase solid-solution area of the respective phase diagrams, i.e., far away from the bulk solidus and solvus lines. A possible explanation of these endothermic peaks is based on the hypothesis of phase transformations between GB complexions. This hypothesis has been supported by observations with transmission electron microscopy and electron backscattering diffraction. The new lines of GB phase transformations have been constructed in the Al-Zn, Al-Mg, Cu-Ag, Cu-Co, and Cu-Ni bulk phase diagrams.
1. Introduction
Phase transformations can take place not only in the volume of a material (as 3D transformations) but also on free surfaces or in the interphase boundaries (IBs) and grain boundaries (GBs). Such unusual phase transformations in GBs were theoretically discovered for the first time by Cahn [1] and later by Ebner and Saam [2]. Different reviews discuss the experimental works done after the predictions of References [1,2], and various aspects of GB phase transitions have been studied [3,4,5,6,7,8,9,10,11,12,13]. As one of the important results of these works, the new additional lines of GB phase transformations appeared in conventional 3D-phase diagrams [14,15,16,17,18,19,20,21,22,23,24,25,26,27]. It was quite simple to study the GB phase transformations in the two-phase (or multiphase) regions of the bulk phase diagrams. Important examples of such phase transformations are the GB wetting–dewetting ones [8,28,29,30,31,32]. The thickness of a layer of a GB wetting phase is not small, about a few micrometers. In other words, the second phase wetting for a GB is nothing other than a “normal” bulk phase. However, the GB itself disappears after transition from partial to complete wetting. Therefore, the transition from incomplete to complete GB wetting is indeed a GB transition because a GB ceases to exist after the transition. The GB wetting transformations are easy to observe even when using optical microscopy [33,34,35]. The GB phase transitions were also observed in the one-phase regions of the conventional 3D-phase diagrams. Thus, the GB premelting or prewetting can take place in the bulk solid solution [8,18,36,37,38,39,40,41,42,43,44,45]. In the case of premelting or prewetting, the GBs can contain a few-nanometers-thin layer of a second phase which can be stable in GB but cannot be thermodynamically stable in bulk [18,46,47,48]. Such intergranular films (or IGFs) are not easy to observe, mainly because they are very thin (a few nanometers). Therefore, experimental methods for the investigation of such IGFs only became available recently. These include, for example, high-resolution transmission electron microscopy (HRTEM) in the aberration-corrected microscopes [17,47,49,50,51,52] as well as three-dimensional atom probe tomography (APT) [10,48,53,54].
Quite frequently the GB phase transitions occur above room temperature (RT). As a result, one needs to quench the sample to study it further with the aid of HRTEM or 3-D APT. However, one cannot be sure that the GB structure after quenching is the same as before quenching. It is more complicated to quench the high-temperature structure of metallic alloys than that of nitrides or oxides [9,23,55,56,57,58,59,60,61,62,63]. Therefore, it is easy to understand why the thin IGFs were first observed in silicon nitride [64]. The quenching of metallic alloys seldom allows the “freezing” of high-temperature IGFs or their transformed remnants [10,22,24,47,48,65,66,67,68]. In the meantime, different kinds of GB phases or IGFs have been discovered together with respective GB transformations [18,19,20,62,66,67,69,70,71,72]. According to the work of S.J. Dillon et al. [73] GB phases or IGFs are called GB complexions [11,17,18,21,22,44,47,62,63,67,72,73,74,75,76,77,78,79]. We have to underline here the subtle differences between the terms “GB phases”, “IGFs”, “GB complexions” and respective GB transitions, on the one hand, and the GB transformations with the participation of the bulk phase, such as GB wetting transofrmations, on the other hand.
Advantageously, if one cannot quench the GB complexions to RT to study them ex-situ, one can investigate GB phase transformations indirectly. This can be performed because the GB complexions and GB transformations manifest themselves in changes in GB properties. In turn, the GB properties influence the properties of the polycrystal as a whole [54,80,81]. These changes in properties make it possible to exploit in-situ studies. In other words, for the measurements at actual temperatures of GB transitions. For example, one can measure the GB migration rate [23,82,83,84]. The discontinuities in the Arrhenius plots of GB mobilities mark the GB phase transitions. Usually, a GB containing a liquid-like IGF becomes more mobile in comparison with a “dry” one, such as, for example, Al/Al GBs doped with Ga [84]. Similarly, changes in GB diffusivity can be observed [85,86,87,88]. For example, the tracer self-diffusion of copper and bismuth are drastically (by about two orders of magnitude) accelerated when Cu/Cu GBs obtain the liquid-like Bi-rich premelting layer [88]. Another important example is the chemical zinc diffusion along individual GBs in Fe-Si bicrystals with various silicon contents [86,87]. The GB diffusivity of zinc is accelerated by about two orders of magnitude when a GB in doped iron becomes the premelting layer. GB faceting/roughening and GB energy [60,78,89,90,91,92,93,94], as well as GB sliding [95,96,97,98,99], are also very sensitive to the formation of thin IFs. For example, at the point of GB premelting transition in a Cu-Bi system, the first derivative of GB energy has a break [91]. This, thus, directly demonstrates that the GB premelting transition is of the first order. The GB faceting in a Cu-Bi system also follows this change [93].
Thus, due to the GB phase transformations, the GBs can become very ductile [100,101,102] or very brittle [103,104,105]. The ductility increases if the GB phase is plastic and serves as a kind of lubricant for the abutting grains [100,101,102]. If the GB layers are brittle as in Ni-Bi alloys, superalloys or molybdenum alloys [103,104,105], the overall brittleness of the polycrystal increases as well. GB phase transformations can also lead to a change in GB segregation [49,50,51,53,66,70,74,104,105,106,107,108]. The most prominent and investigated examples are the (already mentioned) Cu-Bi and Ni-Bi alloys or oxides, such as ytterbium-doped magnesium aluminate spinel.
One can also investigate the GB-controlled properties of polycrystals, such as creep [100], or superductility [109,110,111,112,113,114,115,116,117,118,119]. The UFG alloy becomes superductile if the thin film of a liquid-like phase lubricates the GB, for example, in ternary Al-Zn-Mg alloys close to the bulk liquidus lines [115,116,117,118,119]. However, the superductility also appears if the GB phase is solid [109,110,111,112,113,114]. It only needs to be ductile enough to lubricate the GB between abutting matrix grains (like zinc-rich layers between aluminum grains) [109,110,111,112,113,114]. In any case, the mechanical properties of the GB phase strongly influence the overall strength of a material [76,120,121,122]. Since GB layers influence the mobility of individual GBs, they also change the migrational ability of the GB ensemble in a polycrystal and, thus, the grain growth [54,56,57,58,59,63,75,76,79,80,83,106,123,124,125,126,127,128,129,130]. Most pronounced here is the transition from normal to abnormal grain growth (i.e., from single modal to the bi- or multimodal distribution of grain size). Similarly, the presence of liquid-like GB layers can increase the diffusion permeability of individual GBs. If the portion of such GBs in a polycrystal is high enough (and the percolation threshold is exceeded), the rate of densification during sintering can significantly increase [26,57,81,131,132,133,134,135,136]. If the GBs possess low electric conductivity and their portion is high (again, the percolation threshold is exceeded) the overall conductivity of the polycrystal decreases [9,95,137,138,139,140,141]. On the other hand, the polycrystal can become ferromagnetic (for example, nanograined zinc oxide) if the amount of “magnetic” GBs is high enough [142,143,144]. The graphene-modified GB complexion in skutterudite can improve the thermal conductivity [145] similar to GB layering transitions [69].
The phase transitions between bulk phases can be endo- or exothermal. As a result, they can be observed and investigated by thermal methods, such as differential scanning calorimetry (DSC) [146,147]. In fine-grained (or better in ultrafine-grained (UFG)) polycrystals, the specific area of GBs can be very high. In addition, the specific volume of GB films in such materials is not low when compared with the total volume. As a result, one can measure the thermal effect of GB phase transitions with the aid of a DSC [114,148,149,150]. DSC also permits to observe the indications of GB phase transformations in nanocrystalline ceramics [151,152,153,154,155,156,157,158,159,160]. The GB phase transformations can also lead to abnormal grain growth and radical changes in the GB character distribution [54,56,57,58,59,63,75,76,79,80,83,106,123,124,125,126,127,128,129,130,151,154,155,156,157,158,159].
Therefore, the goal of this work is to study GB phase transformations and GB complexions (i) in-situ; (ii) in poorly quenchable metallic alloys; (iii) deep in the solid-solutions area (i.e., removed from the solidus or solvus lines); (iv) by comparing the samples with low and high specific area of GBs; and (v) by the use of thermal effect of such transformations and abnormal grain growth. The choice of alloys (Al-Zn, Al-Mg, Cu-Co, Cu-Ag, and Cu-Ni) is primarily related to the wide technological application of these materials, such as aircraft construction, mechanical engineering, construction, as well as for solid oxide fuel cells interconnect material.
2. Experimental
Aluminum alloys (Al-20 wt.% Zn, Al-10 wt.% Mg) and copper alloys (Cu-2.2 wt.% Co, Cu-4.9 wt.% Co, Cu-77 wt.% Ni, Cu-2.8 wt.% Ag, Cu-4 wt.% Ag, Cu-5 wt.% Ag, Cu-6.5 wt.% Ag) were manufactured of highly pure components (5N5 Al, 5N Zn, 4N5 Mg, 5N Cu, 5N Ag, 4N5 Ni, and 5N Co) using vacuum induction melting (Institute of Solid State Physics, Chernogolovka, Russia) in the form cylindrical ingots with a diameter of 10 mm. For further research, disks with a thickness of 3.5 and 0.7 mm were cut from the ingots by spark erosion. The 0.7 mm thick disks were subjected to the high-pressure torsion (HPT) after chemical etching using a custom-built computer controlled HPT device (W. Klement GmbH, Lang, Austria) at room temperature at a pressure of 5 GPa (5 torsions, 1 rpm). After HPT, the grain size in the samples became very fine (see Figure 1). All samples for structural and calorimetric investigations were cut from the deformed disks at a distance of 3 mm from the sample centre in the HPT-treated samples. The samples were heated in the differential scanning calorimeter (DSC 404 F1 Pegasus, Netzsch and Du Pont 910, TA Instruments (New Castle, UK) from room temperature to melting point at a rate of 10 K/min. After heating the samples were cooled in the calorimeter to room temperature at the rate of about 10 K/s. After HPT, the Cu-77 wt.% Ni samples were sealed in the evacuated quartz ampoules (residual pressure of 10−4 Pa) and annealed at 600 °C, 3 h; 750 °C, 2 h, and 900 °C, 1 h. The grain structure of the annealed Cu-77 wt.% Ni samples was studied with the aid of the electron backscattering diffraction (EBSD) (FEI, Hillsboro, OR, USA) technique. EBSD maps and misorientation angle charts were obtained using FEI QUANTA 3D FEG scanning microscope equipped with EBSD TSL hardware at the acceleration voltage of 20 kV and tilt angle of 70°. Post-processing of the acquired data was performed by the use of TSL OIM Analysis 7.30 software. Transmission electron microscopy (TEM) (TECNAI, Hillsboro, OR, USA) investigations were conducted using a TECNAI G2 F20 microscope at an accelerating voltage of 200 kV. Prior inspection of the obtained material was carried out also using an FEI E-SEM XL30 scanning electron microscope equipped with EDAX Genesis energy-dispersive X-ray spectrometer (EDS) (FEI, Hillsboro, OR, USA). X-ray diffraction (Philips, Manchester, UK) (the XRD patterns were obtained using Bragg-Brentano geometry in a powder diffractometer Philips X’Pert with Cu-Kα radiation). The detailed microstructure studies were performed by the use of TECNAI G2 FEG super TWIN (200 kV) transmission electron microscope (TEM) equipped with an energy dispersive X-ray (EDS) spectrometer manufactured by EDAX (FEI, Hillsboro, OR, USA). The thin foils for TEM observation were prepared by a twin-jet polishing technique using an electrolyte D2 manufactured by Struers company.
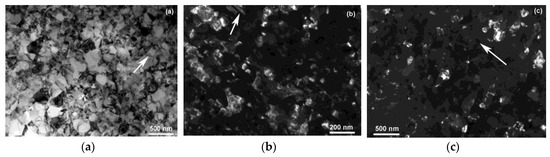
Figure 1.
Transmission electron microscope (TEM) micrographs of samples after high-pressure torsion (HPT)-treatment and before heating in differential scanning calorimeter (DSC) calorimeter. (a) Cu-5 wt.% Co, bright field; (b) Cu-2.8 wt.% Ag, dark field; (c) Cu-77 wt.% Ni, dark field. Some microtwins are shown by the arrows.
3. Results
Figure 2 shows the bulk phase diagrams of the eutectic systems Al-Zn (Figure 2a), Al-Mg (Figure 2b), Cu-Ag (Figure 2e), peritectic system Cu-Co (Figure 2c), and system Cu-Ni with continuous raw solid solutions and a decomposition dome at low temperature (Figure 2d) [161]. Vertically arranged experimental points correspond to the compositions Al-20 wt.% Zn (Figure 2a), Al-10 wt.% Mg (Figure 2b), Cu-2.2 wt.% Co, Cu-4.9 wt.% Co (Figure 2c), Cu-77 wt.% Ni (Figure 2d), Cu-2.8 wt.% Ag, Cu-4 wt.% Ag, Cu-5 wt.% Ag, Cu-6.5 wt.% Ag (Figure 2e).
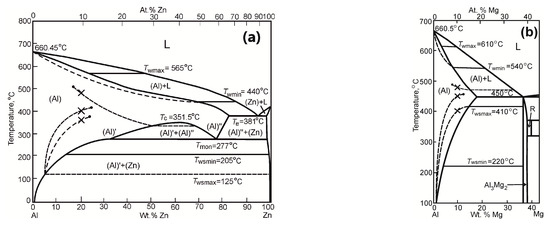
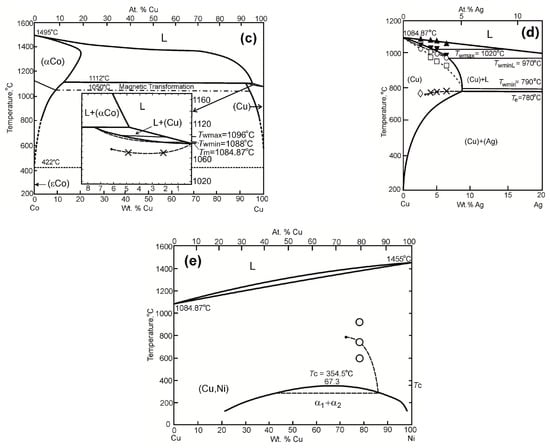
Figure 2.
The bulk phase diagrams of the systems (a) Al-Zn; (b) Al-Mg; (c) Cu-Co; (d) Cu-Ag; and (e) Cu-Ni with lines of bulk phase transitions [151]. Tw—grain boundaries (GB) wetting phase transformation by liquid phase, Tws—GB wetting phase transformation by solid phase.
In Figure 3 the temperature dependences of the heat flow (DSC curves) are shown for the Al-20 wt.% Zn, Al-10 wt.% Mg, and Cu-4.9 wt.% Co alloys before and after HPT-treatment. After HPT, the grain size in Al-based alloys was about 500 nm [109,113,162], and in Cu-based alloys, it was 150–300 nm [163]. Before HPT, the Al-based alloys contained the supersaturated (Al) solid solution and, respectively, the particles of Zn or Al2Mg3 intermetallic phase [109,113,162]. The Cu-Co alloys contained supersaturated (Cu) solid solution and particles of Co [163] before HPT. After HPT, the composition of a solid solution and amount of the second phase changed slightly, but the mean effect important for this work was the grain refinement. The heating of these ultra-fine grained (UFG) HPT-treatment samples in a DSC apparatus led to the growth of grains up to about 30–50 μm. The grain size in the coarse-grained (CG) as-cast samples studied for comparison was between 0.1 and 5 mm. Thus, we compared the heat flow in samples with a low and high specific area of grain boundaries.
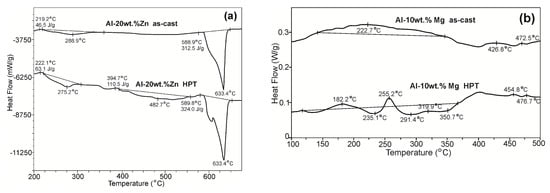
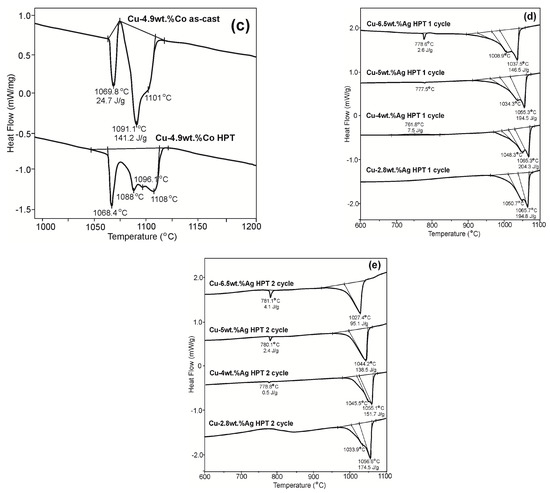
Figure 3.
Temperature dependences of the heat flow (DSC curves) for alloys: (a) Al-20 wt.% Zn; (b) Al-10 wt.% Mg; (c) Cu-4.9 wt.% Co before and after HPT-treatment; (d,e) Cu-2.8 wt.% Ag, Cu-4 wt.% Ag, Cu-5 wt.% Ag, Cu-6.5 wt.% Ag after HPT-treatment, first heating (d) and second heating (e).
DSC curves in Figure 3 have a complex shape with overlapping peaks. We used the standard procedure for the quantification of the DSC curves [164] (these procedures are also included in the quantification of the software of modern DSC equipment). According to this approach, the position of the deep minimum (peak) corresponds to the melting temperature, i.e., the liquidus temperature in the bulk phase diagram. The position of this deep minimum (peak) can be slightly influenced by the heating rate. Therefore, we used the same heating rate in all experiments. The onset temperature of the peak corresponds to the point of intersection of the tangent drawn through the inflexion point of the curve with the extrapolated baseline. The baseline is a virtual line drawn through the interval in which the phase transition occurs.
For the Al-20 wt.% Zn alloy (Figure 3a) small endothermic peaks are observed in the DSC curves between 350 to 500 °C. These peaks are more pronounced in the samples after HPT-treatment, i.e., in samples with smaller grain size containing, therefore, more grain boundaries than CG samples. The temperature of these endothermic peaks is shown by the crosses in Figure 2a. We can observe that they are “deep” in the single-phase solid-solution region (Al) of the Al-Zn the bulk phase diagram (Figure 2a). Figure 4a,b shows microstructures of the Al-20 wt.% Zn alloy after annealing in DSC calorimeter and subsequent rapid cooling. The CG sample was annealed at T = 350 °C and UFG sample (obtained by the HPT-treatment) at T = 320 °C. In both samples, the precipitates of the second phase with a zinc content up to 33 wt.% Zn are visible in the GBs.
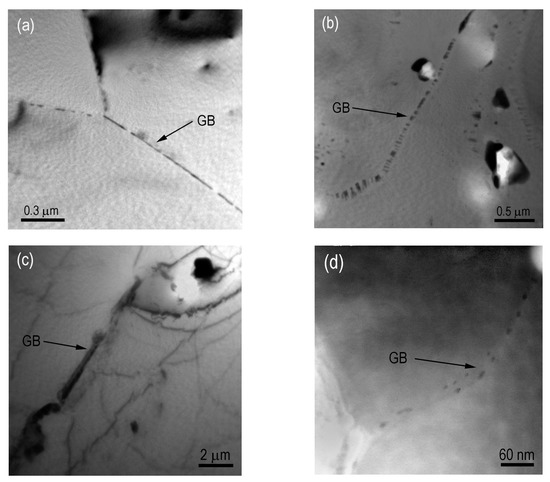
Figure 4.
TEM micrographs: (a) Al-20 wt.% Zn alloy before HPT-treatment at T = 350 °C; (b) Al-20 wt.% Zn alloy after HPT-treatment at T = 320 °C; (c) Al-10 wt.% Mg before HPT-treatment at T = 400 °C; (d) Al-10 wt.% Mg alloy after HPT-treatment at T = 400 °C.
In the CG and UFG samples of the Al-10 wt. % Mg alloy, we also observed several small endothermic peaks in the DSC curves (Figure 3b) above 400 °C. These endothermic peaks are also more pronounced in UFG samples (obtained by HPT) when compared with their CG counterparts. The position of these peaks is shown by crosses in the Al-Mg phase diagram (Figure 2b). Similar to the Al-Zn system, these points are “deep” in the single-phase (Al) region of the phase diagram. In Figure 4c,d, the TEM micrographs for CG and UFG samples of Al-10 wt.% Mg alloy are shown. These CG and UFG samples were annealed in DSC spectrometer at T = 400 °C (i.e., close to that of the DSC peaks) and quickly cooled. GBs both in the CG and UFG samples contain fine precipitates of Al3Mg2 phase [31,148].
The DSC curves for CG and UFG Cu-Co alloys (Figure 3c) contain a pronounced additional peak for all samples at around T = 1070 °C (also denoted by crosses in the single-phase region of the Cu-Co phase diagram, Figure 2c). Figure 3c shows the DSC curves for the CG and UFG samples of Cu-4.9 wt.% Co alloy. The DSC curve of CG sample was decomposed into three endothermic peaks (at temperatures of 1069.8 °C, 1091.1 °C, and 1101 °C), and the DSC curve for UFG sample was decomposed into four peaks (at temperatures 1068.4 °C, 1088.2 °C, 1095.9 °C, and 1108.2 °C). The peaks in the DSC curves of CG sample (at T = 1091.1 °C and 1101 °C) and UFG sample (at T = 1095.9 °C and 1108.2 °C) correspond to the phase transformations occurring in the bulk in the two-phase region L + (Cu). The second peak (at T = 1088.2 °C) on the DSC curve of UFG sample lies below the line of the bulk solidus and corresponds to the melting of GBs. We assume that the first peaks (at T = 1069.8 °C and 1068.4 °C) in both DSC curves correspond to the precipitates of the second phase (Co) as evidenced indirectly by the data obtained in Reference [164].
The DSC curves for UFG Cu-2.8 wt. % Ag, Cu-4 wt.% Ag, Cu-5 wt.% Ag and Cu-6.5 wt.% Ag alloys are shown in Figure 3d. These UFG samples were heated to complete melting, then cooled and heated again to complete melting. The DSC curves for the second heating are shown in Figure 3e. Differently from the UFG samples in the first heating, they were coarse-grained and contained fewer GBs. The endothermal melting peak in all UFG samples had a complicated form and can be interpreted as consisting of two or even three overlapping peaks. The respective tangents are shown by thin lines. The DSC curves for the second heating, i.e., for coarse-grained samples, are more simple when compared with DSC curves for UFG samples. We can see that only the curves for Cu-5 wt.% Ag and Cu-6.5 wt.% Ag alloys have complicated melting peaks and the curves for the other two alloys (with less silver) do not. The tangents in the main melting peak correspond to the liquidus and solidus temperature and coincide well with each other for the first and second heating with only a couple of degrees difference. The respective points are shown in the Cu-Ag phase diagram (Figure 2e) with up- and down- full triangles. The additional melting peaks are more pronounced in the UFG samples and lie at about 10–30 °C below the bulk solidus line. They are shown in the Cu-Ag phase diagram (Figure 2e) by open circles and squares. The difference between bulk and GB solidus increases with increasing silver content from ~10 °C to ~30 °C (Figure 3d and Figure 2e).
The DSC curves for UFG and CG Cu-5 wt.% Ag and Cu-6.5 wt.% Ag alloys contain a small endothermic peak at around T = 778 °C (Figure 3d,e). The DSC curve for the Cu-4 wt.% Ag alloy contains such a peak in the second heating (Figure 3e). This peak is not visible in both the DSC curves for UFG Cu-2.8 wt. % Ag alloy. These peaks are denoted by crosses in the single-phase region of the Cu-Ag phase diagram (Figure 2e and Figure 3d). The thermal effect of this peak increases with increasing silver content.
The UFG samples of Cu-77 wt.% Ni alloy were annealed at 600 °C, 3 h; 750 °C, 2 h, and 900 °C, 1 h). Unique grain color maps acquired by EBSD technique (Figure 5a,c,e) show the resultant grain structure after extensive grain growth. Micrographs in Figure 5a,c permit to observe that the distribution of small and large grains is not uniform. It indicates abnormal grain growth in the sample. The mean grain size is 1.6, 6.8, and 18.3 μm respectively. Numerous flat twin (or Σ3) GBs are clearly visible on the maps. Figure 5b,d,f show the misorientation angle charts for these polycrystals based on unique grain color maps. These polycrystals have about 0.3–0.7% of GBs with low misorientation angle (i.e., below 5°). The number of GBs with a misorientation angle between 5° and 58° fluctuates from 72% at 600 °C, 3 h through 55% at 750 °C, 2 h to 33% at 900 °C for 1 h. The high peaks at 60° correspond to the twin (or Σ3) GBs. It can be seen that at 600 °C the fraction of Σ3 GBs is below 30%, while between 750 °C and 900 °C it suddenly increases above 60%.
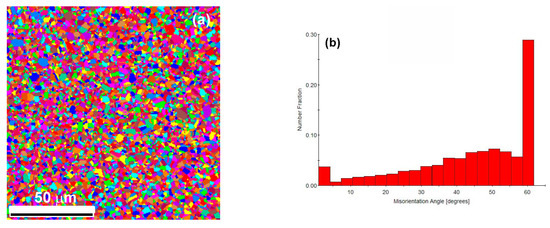
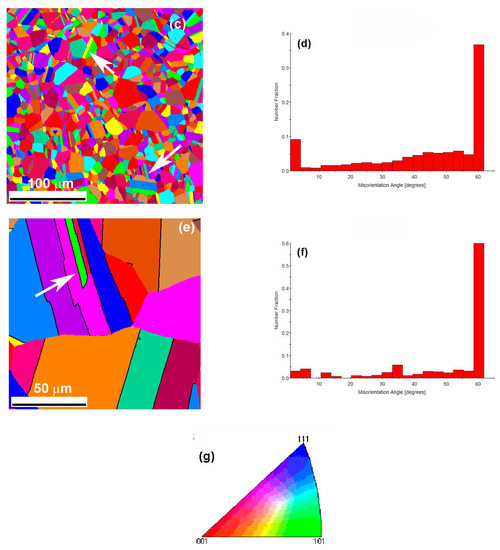
Figure 5.
Unique grain color maps (a,c,e) and corresponding misorientation angle charts (b,d,f) acquired from the Cu-77 wt.% Ni alloy after HPT and subsequent annealing at (a,b) 600 °C, 3 h; (c,d) 750 °C, 2 h; and (e,f) 900 °C, 1 h. Step size in all cases 500 nm. In Figure 5c, the distribution of CSL Σ3 boundaries is clearly visible. Two Σ3 GBs (flat twins) are shown by arrows. (g) Color indexing orientation triangle.
4. Discussion
When one considers the conventional phase diagrams for three-dimensional phases, one does not expect any phase transformations in a single-phase region (like α solid solution). However, if one includes the grain boundaries (GBs) and their triple junctions (GB TJs), one can observe in GBs and GB TJs the thin layers (or thin channels) of the second phase. This is not stable in the bulk, and only one phase can exist (see, for example, References [8,45,68,114,148,149,150] and references therein). Most frequently the thin layers (or thin channels) of a metastable second phase are observed in GBs (or GB TJs) in the proximity of a solidus or solvus lines in a bulk phase diagram. Nevertheless, more recently one can find in the literature multiple indications of unusual phenomena which can take place removed from the solidus or solvus lines, in other words, “deep” in the solid-solution area. Thus, (i) an Al-based alloy can exhibit the anomalous superductility around 400 °C [165]; (ii) the additional peaks appear in the DSC curves of the fine-grained Al-Mg alloys. These peaks were observed in a solid-solution region of the Al-Mg phase diagram [166,167]; and (iii) preliminary heat treatment in a single-phase region can modify the hardening and softening behavior of the UFG Al-Zn alloys during plastic deformation at room temperature [168]. This unusual behavior has been observed in UFG materials and, thus, can be due to the various GB phase transformations which could take place also in the one-phase area of a bulk phase diagram far away from solvus or solidus lines.
Let us start the discussion with Al-Zn alloys. In the Al-Zn system, numerous GB phase transitions have been observed. Historically, first, the transition between complete and incomplete GB wetting has been observed in the (Al) + L two-phase area of the Al-Zn phase diagram (where L means the liquid phase or melt and (Al) means the solid solution) [28]. In this two-phase area of the Al-Zn phase diagram, the (Al) solid solution exists in equilibrium with the melt. The completely wetted (Al)/(Al) GBs appear first above Twmin = 440 °C. The respective tie-line at this temperature Twmin is shown in Figure 2a (thin solid line). The low index “min” means that this is the minimal temperature where the first (Al)/(Al) GBs completely wetted by the Al + Zn melt appear in the studied polycrystals. With increasing temperature, the amount of completely wetted (Al)/(Al) GBs continuously increases and reaches the maximum of 100% at Twmax = 565 °C [28]. Above this temperature Twmax, all GBs in the studied polycrystals are completely wetted by the liquid phase. Using DSC, one can observe the thermal effects of GB wetting phase transition [148]. It is important to note that this GB wetting phase transition in Al-Zn alloys is of the first order. Particularly, this fact reflects itself in temperature dependence of the GB contact angle ϑ. The plot of the temperature dependence of contact angle between GB and melt is convex. Moreover, its first derivative has a discontinuity (or break) at Tw. In other words, the temperature dependence of ϑ has two different tangents at Tw. Nevertheless, the GB wetting phase transitions of the second order (or continuous transitions) also exist. They have been also observed in the Al-Zn system, but in the two-phase (Zn) + L area of the Al-Zn phase diagram [29]. In case of continuous GB wetting transition, the temperature dependence of ϑ is concave, and its first derivative has no discontinuity at Tw. In other words, the ϑ(T) dependence has only one tangent at Tw.
The GB wetting phase transitions are marked by the horizontal tie-lines in a two-phase “solid + liquid” area of a bulk phase diagram. These tie-lines should have a continuation in the one-phase solids-solution area of a phase diagram called GB solidus line. Such GB solidus also exists in the (Al) area of the Al-Zn phase diagram. It is shown in Figure 2a by the dotted line. It starts from the bulk solidus at Twmin = 440 °C and finishes at the melting point of aluminum. Between bulk solidus and GB, the grain boundaries possess the thin layer of a liquid-like phase [68,88,169,170,171,172,173,174,175]. The GB solidus (also called the premelting transition line) has been observed experimentally by TEM [68]. In this work, the GB structure has been compared in polycrystalline samples quenched from the temperature above and below the bulk solidus. The GB premelting transition can also be observed using DSC. Thus, the GB melting in UFG or nanocrystalline samples starts earlier than in the bulk [68,114,176,177]. These data permit one to estimate the position of GB solidus in Al-Zn alloys.
The polycrystals containing a thin liquid-like layer in GBs become very ductile. For example, the unusual superplasticity with maximal elongation of up to 2500% has been observed in the Al-Zn-Mg UFG polycrystals [115,116,117,118,119]. This phenomenon appeared in the very narrow temperature interval below the solidus line. With increasing content of magnesium and zinc, the high superductility disappears [115,116,117,118,119]. Both superplasticity itself and the narrow (temperature and concentration) interval of its existence are unexplained. Only the observation of the GB wetting transition in Al-Zn, Al-Mg and in Al-Zn-Mg alloys gives the key to understanding this phenomenon [109,110,111,112,113,114,115,116,117,118,119,176,177]. Namely, when the GB wetting transitions take place in the two-phase (Al,Mg,Zn) + L area of the phase diagram, then the respective wetting tie-lines continue the into the (Al,Mg,Zn) solid–solution area with GB solidus lines. Therefore, between bulk and GB solidus, the grain boundaries contain thin liquid-like layers which ensure the high plasticity [109,110,111,112,113,114,178].
Another class of GB phase transitions is also observed in the Al-Zn alloys. In this case a GB can be completely (or partially) wetted by a second solid phase instead of a liquid one. The thermodynamics of this wetting transition are similar to that for the liquid phase. In other words, a continuous layer of a second phase (no matter, liquid or solid) substitutes a grain boundary if the GB energy σGB is higher than the energy 2σSL of two solid/liquid boundaries or the energy 2σαβ of two boundaries between two solid phases α and β. The GB wetting transition by a second solid phase has been observed for the first time in the Al-Zn system [179,180]. It takes place in the (Al) + (Zn) two-phase area of the Al-Zn binary phase diagram where the Al-rich (Zn) solid solution is in equilibrium with the Zn-rich (Al) solid solution. It is just below the (Al) + (Zn) eutectic point at Te = 381°C (see Figure 2a). The important difference between GB wetting by a liquid phase and by a second solid phase is that the kinetics of a latter are very slow in comparison with the first. For example, one needs to wait hundreds of hours to observe how the continuous (Al) GB layer between two (Zn) grains transforms into a chain of lenticular particles instead of the few minutes needed to equilibrate liquid phase layers between solid grains. The percentage of boundaries between (Zn) grains completely wetted by the (Al) face-centered cubic (fcc) solid phase increases from zero at TwminZn = 283 °C up to about 30% at eutectic point Te = 381 °C.
A similar transformation in (Al)/(Al) GBs proceeds in the (Al’) + (Zn) area of the Al-Zn binary phase diagram below the temperature of monotectoid decomposition Tmon = 277 °C (see Figure 2a) [150,179,181]. In this case, the (Al’)/(Al’) GBs between grains of (Al’) solid solution with low zinc content could be completely wetted by a layer of the second solid phase (Zn). Differently from the previous case, the percentage of such GBs increases with decreasing temperature. The first (Al’)/(Al’) GBs completely wetted by a continuous layer of the second solid phase (Zn) appear below Twsmin = 205 °C. The portion of (Al)/(Al) GBs completely wetted by the second solid phase (Zn) increases with decreasing temperature. It becomes 100% at nearly Twsmax = 125 °C. Unfortunately, it is not easy to measure Twsmax because the equilibration of a microstructure runs extremely slowly below 200 °C. However, it is possible to apply HPT to accelerate the mass-transfer in the (Al’) + (Zn) alloys [182,183]. This is possible due to the high amount of non-equilibrium vacancies appearing during HPT. After HPT of Al-Zn alloys, it was possible to observe the so-called pseudoincomplete (or pseudopartial) GB wetting [113,184,185]. In this case, the few nanometer thin Zn-rich layer exists in the (Al)/(Al) GBs parallel with a non-zero contact angle between (Zn) particles and GBs. After HPT treatment of Al-Zn alloys, about one-third of (Al)/(Al) GBs contain such thin Zn-rich layer [113]. We discussed above that the thin liquid-like GB layers close to the bulk solidus lines are the reason for the superplasticity of UFG Al-based alloys [109,110,111,112,113,114,115,116,117,118,119]. Similarly, the thin solid Zn-rich layers in the solid Al-Zn UFG polycrystals appeared after HPT leads to their high ductility [109,110,111,112,113,114,186]. The pseudoincomplete GB wetting in the Al-Zn polycrystals is not surprising. For example, the GB wetting in the Al-Zn alloys can be continuous or discontinuous [29]. The theory predicts that the line of the discontinuous GB transitions from complete to incomplete wetting can divide into two lines; one of first and one of second order transformation. In this case, the area of pseudoincomplete GB wetting should arise between these two lines [187,188,189,190,191,192,193,194,195,196,197,198,199].
It is clear that the tie-lines of GB phase transformations existing in the (Al) + (Zn) two-phase area of the Al-Zn binary phase diagram could have a continuation into one-phase solid–solution (Al) area. By crossing of these lines, the peaks in DSC curves would appear. The small endothermic peaks observed in DSC curves (Figure 3a) could indicate the presence of such GB lines. We have drawn them between the bulk solvus line and two lower experimental DSC as crosses in Figure 3a. By drawing such GB lines in the bulk phase diagram, we have to remember some important circumstances. When the first evidence of the presence of GB phase transformations appeared, these experimental findings are discussed in terms of transitions “pure (or dry) GB → few nanometer thin GBF → thick GB layer of bulk phase”. Later, it has been shown that the variety of possible GB states (called complexions) is much richer (see for example References [17,19,20,21,22,23,24,25,26,27,87,169,170]). One can imagine the transitions from clean GB to single-layer GBF, then to bi-layer, tri-layer etc. [17,19,20,21,22,23,24,25,26,27] Some of these transition lines can finish not only at the lines of bulk transitions but also in critical points in the middle of one-phase area of a bulk phase diagram [17,19,20,23,27,87].
We would propose a similar explanation also for the two lower DSC peaks observed in the Al-Mg alloy (Figure 2b and Figure 3b). In the (Al) + Al3Mg2 two-phase area of the Al-Mg binary phase diagram, the transition from partial to complete wetting of (Al)/(Al) GBs by the second solid phase Al3Mg2 takes place [150,200]. At Twsmin = 220 °C all (Al)/(Al) GBs are incompletely wetted by the Al3Mg2 layers. Differently from the Al-Zn alloys, the percentage of completely wetted (Al)/(Al) GBs increases with increasing temperature and reaches 100% at Twsmax = 410 °C. The continuations of GB wetting tie-lines into (Al) area of the Al-Mg phase diagram could explain the observation of two lower small endothermic peaks observed in DSC curves (Figure 3b). These hypothetic continuations are shown by thin dotted lines. As in the case of Al-Zn alloys, these new lines can be due to different GB complexion transitions and may also finish in a critical point [17,19,20,21,22,23,24,25,26,27,87,169,170].
The conventional wetting of (Al)/(Al) GBs by the melt was also observed in the Al-Mg alloys (Figure 2b) [148,176,201,202]. The respective tie-lines at Tmin = 540 °C and Tmax = 610 °C are shown in the Al-Mg phase diagram (Figure 2b). The upper endothermic peak observed in the DSC curves (Figure 3b) is below the Tmin = 540 °C. However, the tie-line at Tmin = 540 °C marks the formation of macroscopically thick continuous GB layer of a liquid phase. Following the discussion in Reference [20], we can suppose that the formation of other (less thick) GB complexions can take place below Tmin. Therefore, we may draw another tie-line in the (Al) + L area below Tmin = 540 °C and construct its continuation into the one-phase area of solid solution (Al) (see Figure 3b). Such continuation can also finish at the bulk solidus (as in References [37,39,42,173,174,175] or with a critical point as in References [17,19,20,23,27,87].
In the Al-Zn binary phase diagram, a very interesting two-phase area exists between Tmon = 277 °C and Tc = 351.5 °C (see Figure 2a). Below the critical point at Tc = 351.5 °C, the single fcc (Al) solid solution decomposes into two fcc solid solutions, namely a Zn-pour (Al’) and a Zn-rich (Al”) one. The seminal work of Cahn [1] discusses such phase diagrams with critical points. Cahn noticed that in the critical point the difference between the two phases, as (Al’) and (Al”) in our case, disappears. Therefore, the energy of interphase boundary 2σα’α” tends to zero by approaching to Tc from below. It means that the phase (Al”) should wet the (Al’)/(Al’) GB close enough to Tc. Such a hypothetical (dotted) tie-line is drawn in Figure 2a in the (Al’) + (Al”) area. According to Cahn’s prediction, the tie-line in the (Al’) + (Al”) area should continue in the (Al’) one-phase area and finish in a critical point [1]. We have drawn such a (dotted) line through the upper cross which marks the upper small endothermic peak observed in DSC curves (Figure 3a). However, it is not the only unique possible construction to explain the upper point. The Al-Zn system opens many possibilities to construct the lines for GB complexions transitions [17,19,20,21,22,23,24,25,26,27,87,169,170].
Moreover, it is known [203] that the bulk phase diagram of Al-Zn can be more complex than the diagram presented in the handbook [161]. Thus, Krishna Rao et al. observed a metastable phase in the Al-50 wt.% Zn alloy in the single-phase (Al) region at 400 °C [204]. This phase had a trigonal structure with space group m and unit cell period a = 0.2852 nm and c = 0.685 nm. In addition, A. Sandoval-Jimenez et al. observed the phase with a triclinic structure in the Al-78.2 wt.% Zn alloy [205]. This means that in a single-phase region (Al), the metastable phases can exist. In the Al-Mg system there were also observed several metastable phases [167,203,206,207].
The Cu-Ag phase diagram (Figure 2e) is a eutectic one similar to the Al-Zn phase diagram. The (Cu)/(Cu) GBs can be either completely or incompletely wetted by the Ag-rich liquid phase. The first high-angle (Cu)/(Cu) GBs completely wetted by the Ag-rich melt appear above Twmin = 790 °C [208]. The Twmin = 790 °C is very close to the Cu-Ag eutectic temperature Te = 779 °C [161]. Above Twmax = 1020 °C, all high-angle (Cu)/(Cu) GBs are completely wetted by the Ag-rich melt [208]. Later, it has been found that above Twmax = 1020 °C, the low-angle GBs (with the energy below that of the high-angle GBs) start to be completely wetted by the liquid phase [208]. The tie-lines of GB wetting phase transitions (thin solid lines) in the (Cu) + L two-phase area of the Cu-Ag phase diagram are shown in Figure 2e.
Similar to the Al-Zn and Al-Mg phase diagram, these tie-lines of GB wetting phase transitions could continue in the (Ag) one-phase area as the lines of GB premelting. Indeed, the DSC curves for UFG Cu-2.8 wt. % Ag, Cu-4 wt.% Ag, Cu-5 wt.% Ag, and Cu-6.5 wt.% Ag alloys contain additional peaks below the bulk solidus, similar to the Al-Zn and Al-Zn-Mg alloys [68,109,110,111,112,113,114,176,177,178]. Moreover, we can determine in each DSC curve for UFG samples one strong (open circles) and possibly one weak peak (open squares) below the bulk solidus (full down-triangles). This could be an indication of different kinds of GB complexions below the bulk solidus line. The DSC curves for the second heating, i.e., for coarse-grained samples, are more simple in comparison with DSC curves for the UFG samples. We can see that in case of the second heating, only the DSC curves for Cu-5 wt.% Ag and Cu-6.5 wt.% Ag alloys have a complicated melting peak and the curves for the other two alloys (with less silver) do not. The tangents in the main melting peak correspond to the liquidus and solidus temperature and coincide well with each other for the first and second heating with only a few degrees difference. The respective points are shown in the Cu-Ag phase diagram (Figure 2e) with up- and down- full triangles. The additional melting peaks are more pronounced in the UFG samples and lie at about 10–30 °C below the bulk solidus line and are shown in the Cu-Ag phase diagram (Figure 2e) by open circles and squares. The difference between bulk and GB solidus increases with increasing silver content from ~10 °C to ~30 °C (Figure 3d and Figure 2e). The peaks observed in the DSC curves (Figure 3d,e) close to 778 °C are shown by crosses. Open diamond shows that such a peak is not present at 2.8 wt.% Ag. Seven hundred and seventy-eight degrees Celsius is very close to Te = 779 °C, but, nevertheless, is slightly below it. What is the possible reason for these peaks?
The GB segregation in Cu-Ag alloys has been analyzed in several papers on numerical computation. In particular, it has been predicted the transition from monolayer to multilayer, silver segregation can take place in (Cu)/(Cu) GBs, or even to the thick premelting Ag layer [209,210,211,212]. In Reference [72], a series of discontinuous GB layering transitions has been numerically investigated for the Cu-Ag alloys. They are associated with GB segregation in a lattice–gas model of a binary Cu-Ag alloy. The Monte-Carlo simulations of the [001]-axis symmetric tilt Σ5 (310) GB in Cu-Ag alloys have been performed in References [210,211,212]. In References [213,214], the effective Ising model (mean-field theory) has been applied to the Cu-Ag system. These works predicted the first order monolayer-to-multilayer phase transition in the first layers near the GB plane. Such GB phase transition can be considered as a generalized Fowler-Guggenheim one. It can flow by the formation of a thick prewetting GB layer [215]. The role of Bi, Na, and Ag as substitutional impurities in the Σ5 (310) [001] symmetric tilt (Cu)/(Cu) GB has been analysed [216]. These first-principles calculations explained why bismuth can cause the embrittlement of (Cu)/(Cu) GBs and silver cannot.
Thus, we may suppose that similar to the Al-Zn and Al-Mg systems, a kind of GB complexion transition takes place at 778 °C in the one phase (Cu) area of the Cu-Ag phase diagram (Figure 2e). This may be the transition from one-layer to the multilayer GB segregation. We mark this transition in the Cu-Ag phase diagram (Figure 2e) by the thin dotted line. However, the observed thermal effect of this GB transition decreases with decreasing Ag content and becomes completely invisible at 2.8 wt.% Ag (Figure 3d). Therefore, the dotted line in the (Cu) area finishes with a critical point between 2 and 4 wt.% Ag. In the two-phase (Cu) + (Ag) area of the Cu-Ag phase diagram, the composition of (Cu) and (Ag) solid solution is constant at constant temperature. Therefore, the dotted line of GB complexion transition continues in the two-phase (Cu) + (Ag) area as a horizontal tie-line at 778 °C.
The Cu-Co phase diagram is a peritectic transition in the Cu-rich side. In this case, Co content in the solid solution is higher than that in the liquid phase as long as we consider the two-phase solid + liquid area of the Cu-Co phase diagram. However, it has been observed that this cobalt-poor melt can completely wet the (Cu)/(Cu) GBs [32]. We constructed the GB solidus line (or GB premelting line) just below the bulk solidus line (dotted line in Figure 2) using the DSC data [177]. The new data on GB DSC peaks are marked by two crosses. They lie well below the GB solidus line. We would explain them by the (not observed before) GB complexions transition. The respective hypothetical line of such transition is also drawn in Figure 2d. Zhevnenko et al. studied the creep of the Cu-Co solid solutions close to the bulk solidus [164,217,218,219]. Zhevnenko et al. found a sudden break in the temperature dependences of creep rate even lower than the DSC points shown by crosses in Figure 2d. These breaks can also be due to the GB complexions transition.
In Figure 4c, dislocations are visible in the TEM. Actually, the dislocations can also enhance the area for precipitation and provide alterations to the wetting conditions. They can, themselves, be incompletely or completely wetted by the second phase. In the first case, a chain of droplets (or particles) form along the dislocation. In the latter case, the continuous “tube” of a melt or a second solid phase can form along the dislocation. If the dislocations can build low-angle GBs, the temperature of wetting transition for them differs from that for the high-angle GBs [208]. From the wetting point of view, there is some similarity between dislocations and another line defect—namely GB triple junctions [30].
The presence of GBFs (or more general—GB complexions) strongly influences the grain growth as well as GB character distribution in oxides and metallic alloys [54,56,57,58,59,63,75,76,79,80,83,106,123,124,125,126,127,128,129,130,151,152,153,154,155,156,157,158,159,160]. It has been known for a long time that impurities can shift the borders between GBs with special and general structure and properties [142,143,220,221]. The GB complexions enriched by the impurities form, most likely, in the GBs with high energy (also called general GBs) [79] and, less likely, in coincidence GBs with dense and nearly perfect structure [123]. During grain growth, the competition between various GBs with different mobilities takes place [23,151,152,153,154,155,156,157,158,159,160]. Moreover, the micrographs in Figure 5a,c permit to observe that the distribution of small and large grains is not uniform. It indicates that the grain growth in the sample is abnormal, at least, in some locations. Therefore, if we have the lines of GB complexion transition in a bulk phase diagram, the portion of most perfect GBs Σ3 (or twin GBs) can serve as an indirect indication for such GB phase transformations. The Cu-Ni system is quite promising for the observation of these GB complexion transitions. The Cu-Ni phase diagram (Figure 2d) contains at high temperatures, the continuous raw of fcc solid solution. However, below the critical point, Tc = 354.5 °C, these solid solutions decompose into Cu-rich and Ni-rich ones. Similar to the Al-Zn system, following Cahn’s idea [1], one can expect that under the decomposition dome, close enough to the critical point Tc the phase (Cu) should wet the (Ni)/(Ni) GBs. Such a hypothetical (dotted) GB wetting tie-line is drawn in Figure 2d in the (Cu) + (Ni) area. Again, following the Cahn’s prediction, the GB wetting tie-line in the (Cu) + (Ni) area should continue into the (Ni,Cu) one-phase area and finish in a critical point [1]. We have drawn such a (dotted) line through the middle experimental point at 750 °C since above this temperature the portion of Σ3 GBs in a Cu-77 wt. % Ni polycrystal suddenly increases from 0.3–0.37 at 600–750 °C to 0.6 at 900 °C. Moreover, some microtwins are visible even in UFG samples after HPT (shown by arrows in Figure 1c). Thus, the changes in GB character distribution during grain growth, as well as a certain input of abnormal grain growth, can serve as an indication of GB complexions transitions [17,19,20,21,22,23,24,25,26,27,87,169,170]. Of course, this phenomenon is only an indirect indication of possible GB complexions transition because the increase of the portion of less mobile low-Σ GBy during grain growth cannot be called unexpected by temperature increase above 0.5 Tm. However, the observed effect is very promising for a new understanding of GB complexions and permits to plan the more detailed studies of GB structure and properties in this system.
It is clear that the new GB lines in the Al-Zn, Al-Mg, Cu-Co, and Cu-Ni phase diagrams proposed in this work are still very hypothetic, and the physical reasons for the small endothermic peaks observed in DSC curves (Figure 3) should be studied in more details.
5. Summary and Conclusions
Small endothermic peaks were observed in ultra-fine grained (UFG) Al-Zn, Al-Mg, Cu-Ag, and Cu-Co solid solutions during their heating in the differential scanning calorimeter (DSC). These peaks are far away from the solidus and solvus lines of respective bulk phase diagrams. The endothermic effect is more pronounced in UFG samples with a high specific area of grain boundaries (GBs) than in their coarse-grained counterparts. In Cu-Ni UFG solid solution the amount of twin GBs drastically increases with increasing temperature. We explain these observed phenomena by the phase transformations between GB complexions. The new lines of these GB phase transformations have been constructed in the Al-Zn, Al-Mg, Cu-Ag, Cu-Co, and Cu-Ni bulk phase diagrams.
Author Contributions
Conceptualization, B.S. and P.Z.; Methodology, T.C.; Software, M.F.; Validation, O.K., and A.W.-M.; Formal Analysis, M.F.; Investigation, O.K., and A.W.-M.; Resources, P.Z.; Data Curation, M.F.; Writing-Original Draft Preparation, O.K.; Writing-Review & Editing, O.K. and B.S.
Funding
This research was funded by National Science Centre of Poland (grant OPUS 2014/13/B/ST8/04247) and Ministry of Education and Science of the Russian Federation (no n. grant for Increase the Competitiveness of NUST “MISiS”).
Acknowledgments
Financial support from the National Science Centre of Poland (grant OPUS 2014/13/B/ST8/04247) and of Ministry of Education and Science of the Russian Federation in the framework of the Program to Increase the Competitiveness of NUST “MISiS” is acknowledged. The part of research has been performed within the Accredited Testing Laboratories possessing the certificate No. AB 120 issued by the Polish Centre of Accreditation. This means that it is performed according to European standard PN-ISO/IEC 17025:2005 as well as the EA-2/15.
Conflicts of Interest
The authors declare no conflict of interest.
References
- Cahn, J.W. Critical point wetting. J. Chem. Phys. 1977, 66, 3667–3676. [Google Scholar] [CrossRef]
- Ebner, C.; Saam, W.F. New phase-transition phenomena in thin argon films. Phys. Rev. Lett. 1977, 38, 1486–1489. [Google Scholar] [CrossRef]
- Rabkin, E.I.; Shvindlerman, L.S.; Straumal, B.B. Grain boundaries: Phase transitions and critical phenomena. Int. J. Mod. Phys. B 1991, 5, 2989–3028. [Google Scholar] [CrossRef]
- Subramaniam, A.; Koch, C.; Cannon, R.M.; Rühle, M. Intergranular glassy films: An overview. Mater. Sci. Eng. A 2006, 422, 3–18. [Google Scholar] [CrossRef]
- Luo, J. Stabilization of nanoscale quasi-liquid interfacial films in inorganic materials: A review and critical assessment. Crit. Rev. Solid State Mater. Sci. 2007, 32, 67–109. [Google Scholar] [CrossRef]
- Kaplan, W.D.; Chatain, D.; Wynblatt, P.; Carter, W.C. A review of wetting versus adsorption complexions, and related phenomena: The Rosetta stone of wetting. J. Mater. Sci. 2013, 48, 5681–5717. [Google Scholar] [CrossRef]
- Cantwell, P.R.; Tang, M.; Dillon, S.J.; Luo, J.; Rohrer, G.S.; Harmer, M.P. Grain boundary complexions. Acta Mater. 2014, 62, 1–48. [Google Scholar] [CrossRef]
- Straumal, B.B.; Mazilkin, A.A.; Baretzky, B. Grain boundary complexions and pseudopartial wetting. Curr. Opin. Solid State Mater. Sci. 2016, 20, 247–256. [Google Scholar] [CrossRef]
- Luo, J. Interfacial engineering of solid electrolytes. J. Mater. 2015, 1, 22–32. [Google Scholar] [CrossRef]
- Raabe, D.; Herbig, M.; Sandloebes, S.; Li, Y.; Tytko, D.; Kuzmina, M.; Ponge, D.; Choi, P.P. Grain boundary segregation engineering in metallic alloys: A pathway to the design of interfaces. Curr. Opin. Solid State Mater. Sci. 2014, 4, 253–261. [Google Scholar] [CrossRef]
- Straumal, B.B.; Zięba, P.; Gust, W. Grain boundary phase transitions and phase diagrams. Intern. J. Inorgan. Mater. 2011, 3, 1113–1115. [Google Scholar] [CrossRef]
- Rohrer, G.S. Grain boundary energy anisotropy: A review. J. Mater. Sci. 2011, 46, 5881–5895. [Google Scholar] [CrossRef]
- Dillon, S.J.; Harmer, M.P.; Luo, J. Grain boundary complexions in ceramics and metals: An overview. JOM 2009, 61, 38–44. [Google Scholar] [CrossRef]
- Straumal, B.B.; Gust, W. Lines of grain boundary phase transitions on the bulk phase diagrams. Mater. Sci. Forum 1996, 207, 59–68. [Google Scholar] [CrossRef]
- Yang, S.; Zhou, N.; Zheng, H.; Shyue, P.O.; Luo, J. First-order interfacial Transformations with a critical point: Breaking the symmetry at a symmetric tilt grain boundary. Phys. Rev. Lett. 2018, 120, 085702. [Google Scholar] [CrossRef]
- Zhu, Q.; Samanta, A.; Li, B.; Rudd, R.E.; Frolov, T. Predicting phase behavior of grain boundaries with evolutionary search and machine learning. Nat. Commun. 2018, 9, 467. [Google Scholar] [CrossRef] [PubMed]
- Zhou, N.; Yu, Z.; Zhang, Y.; Harmer, M.P.; Luo, J. Calculation and validation of a grain boundary complexion diagram for Bi-doped Ni. Scr. Mater. 2017, 130, 165–169. [Google Scholar] [CrossRef]
- Gao, Q.; Widom, M. Surface and grain boundary complexions in transition metal—Bismuth alloys. Curr. Opin. Solid State Mater. Sci. 2016, 20, 240–246. [Google Scholar] [CrossRef]
- Rickman, J.M.; Luo, J. Layering transitions at grain boundaries. Curr. Opin. Solid State Mater. Sci. 2016, 20, 225–230. [Google Scholar] [CrossRef]
- Zhou, N.; Hu, T.; Luo, J. Grain boundary complexions in multicomponent alloys: Challenges and opportunities. Curr. Opin. Solid State Mater. Sci. 2016, 20, 268–277. [Google Scholar] [CrossRef]
- Johansson, S.A.E.; Wahnstrom, G. First-principles derived complexion diagrams for phase boundaries in doped cemented carbides. Curr. Opin. Solid State Mater. Sci. 2016, 20, 299–307. [Google Scholar] [CrossRef]
- Zhou, N.; Luo, J. Developing grain boundary diagrams for multicomponent alloys. Acta Mater. 2015, 91, 202–216. [Google Scholar] [CrossRef]
- Behera, S.K.; Cantwell, P.R.; Harmer, M.P. A grain boundary mobility discontinuity in reactive element Zr-doped Al2O3. Scr. Mater. 2014, 90–91, 33–36. [Google Scholar] [CrossRef]
- Shi, X.; Luo, J. Developing grain boundary diagrams as a materials science tool: A case study of nickel-doped molybdenum. Phys. Rev. B 2011, 84, 014105. [Google Scholar] [CrossRef]
- Kayyar, A.; Qian, H.; Luo, J. Surface adsorption and disordering in LiFePO4 based battery cathodes. Appl. Phys. Lett. 2009, 95, 221905. [Google Scholar] [CrossRef]
- Luo, J. Liquid-like interface complexion: From activated sintering to grain boundary diagrams. Curr. Opin. Solid State Mater. Sci. 2008, 12, 81–88. [Google Scholar] [CrossRef]
- Tang, M.; Carter, W.C.; Cannon, R.M. Diffuse interface model for structural transitions of grain boundaries. Phys. Rev. B 2006, 73, 024102. [Google Scholar] [CrossRef]
- Protasova, S.G.; Kogtenkova, O.A.; Straumal, B.B.; Zięba, P.; Baretzky, B. Inversed solid-phase grain boundary wetting in the Al–Zn system. J. Mater. Sci. 2011, 46, 4349–4353. [Google Scholar] [CrossRef]
- Straumal, B.B.; Gornakova, A.S.; Kogtenkova, O.A.; Protasova, S.G.; Sursaeva, V.G.; Baretzky, B. Continuous and discontinuous grain boundary wetting in the Zn–Al system. Phys. Rev. B 2008, 78, 054202. [Google Scholar] [CrossRef]
- Straumal, B.B.; Kogtenkova, O.; Zieba, P. Wetting transition of grain boundary triple junctions. Acta Mater. 2008, 56, 925–933. [Google Scholar] [CrossRef]
- Straumal, B.B.; Baretzky, B.; Kogtenkova, O.A.; Straumal, A.B.; Sidorenko, A.S. Wetting of grain boundaries in Al by the solid Al3Mg2 phase. J. Mater. Sci. 2010, 45, 2057–2061. [Google Scholar] [CrossRef]
- Kogtenkova, O.A.; Straumal, A.B.; Afonikova, N.S.; Mazilkin, A.A.; Kolesnikova, K.I.; Straumal, B.B. Grain boundary wetting phase transitions in peritectic copper—Cobalt alloys. Phys. Solid State 2016, 58, 743–747. [Google Scholar] [CrossRef]
- Straumal, B.B.; Gust, W.; Watanabe, T. Tie lines of the grain boundary wetting phase transition in the Zn-rich part of the Zn–Sn phase diagram. Mater. Sci. Forum 1999, 294–296, 411–414. [Google Scholar] [CrossRef]
- Straumal, B.B.; Gust, W.; Molodov, D.A. Wetting transition on grain boundaries in Al contacting with a Sn-rich melt. Interface Sci. 1995, 3, 127–132. [Google Scholar] [CrossRef]
- Straumal, B.; Gust, W.; Molodov, D. Tie lines of the grain boundary wetting phase transition in the Al–Sn System. J. Phase Equilib. 1994, 15, 386–391. [Google Scholar] [CrossRef]
- Dash, J.G.; Fu, H.; Wettlaufer, J.S. The premelting of ice and its environmental consequences. Rep. Prog. Phys. 1995, 58, 115–167. [Google Scholar] [CrossRef]
- Chang, L.S.; Rabkin, E.; Straumal, B.; Lejcek, P.; Hofmann, S.; Gust, W. Temperature dependence of the grain boundary segregation of Bi in Cu polycrystals. Scr. Mater. 1997, 37, 729–735. [Google Scholar] [CrossRef]
- Luo, J.; Chiang, Y.M.; Cannon, R.M. Nanometer-thick surficial films in oxides as a case of prewetting. Langmuir 2005, 21, 7358–7365. [Google Scholar] [CrossRef]
- Chang, L.S.; Rabkin, E.; Straumal, B.B.; Hoffmann, S.; Baretzky, B.; Gust, W. Grain boundary segregation in the Cu–Bi system. Defect Diffus. Forum 1998, 156, 135–146. [Google Scholar] [CrossRef]
- Luo, J.; Tang, M.; Cannon, R.M.; Carter, W.C.; Chiang, Y.M. Pressure-balance and diffuse-interface models for surficial amorphous films. Mater. Sci. Eng. A 2006, 422, 19–28. [Google Scholar] [CrossRef]
- Luo, J.; Chiang, Y.M. Wetting and prewetting on ceramic surfaces. Ann. Rev. Mater. Res. 2008, 38, 227–249. [Google Scholar] [CrossRef]
- Chang, L.S.; Straumal, B.B.; Rabkin, E.; Gust, W.; Sommer, F. The solidus line of the Cu–Bi phase diagram. J. Phase Equlib. 1997, 18, 128–135. [Google Scholar] [CrossRef]
- Rabkin, E.I.; Shvindlerman, L.S.; Straumal, B.B. Diffusion of indium along [001] Sn–Ge interphase boundaries: Prewetting phase transition and critical phenomena. J. Less-Common Met. 1990, 159, 43–52. [Google Scholar] [CrossRef]
- Luo, J. Grain boundary complexions: The interplay of premelting. prewetting, and multilayer adsorption. Appl. Phys. Lett. 2009, 95, 071911. [Google Scholar] [CrossRef]
- Straumal, B.; Kogtenkova, O.; Protasova, S.; Mazilkin, A.; Zieba, P.; Czeppe, T.; Wojewoda-Budka, J.; Faryna, M. Wetting and premelting of triple junctions and grain boundaries in the Al–Zn alloys. Mater. Sci. Eng. A 2008, 495, 126–131. [Google Scholar] [CrossRef]
- Straumal, B.B.; Mazilkin, A.A.; Protasova, S.G.; Gusak, A.M.; Bulatov, M.F.; Straumal, A.B.; Baretzky, B. Grain boundary phenomena in NdFeB-based hard magnetic alloys. Rev. Adv. Mater. Sci. 2014, 38, 17–28. [Google Scholar]
- Khalajhedayati, A.; Rupert, T.J. High-temperature stability and grain boundary complexion formation in a nanocrystalline Cu–Zr alloy. JOM 2015, 67, 2788–2801. [Google Scholar] [CrossRef]
- Kuzmina, M.; Herbig, M.; Ponge, D.; Sandlöbes, S.; Raabe, D. Linear complexions: Confined chemical and structural states at dislocations. Science 2015, 349, 1080–1083. [Google Scholar] [CrossRef]
- Sternlicht, H.; Bojarski, S.A.; Rohrer, G.S.; Kaplan, W.D. Quantitative differences in the Y grain boundary excess at boundaries delimiting large and small grains in Y doped Al2O3. J. Eur. Ceram. Soc. 2018, 38, 1829–1835. [Google Scholar] [CrossRef]
- Behler, K.D.; Marvel, C.J.; LaSalvia, J.C.; Walck, S.D.; Harmer, M.P. Observations of grain boundary chemistry variations in a boron carbide processed with oxide additives. Scr. Mater. 2018, 142, 106–110. [Google Scholar] [CrossRef]
- Schuler, J.D.; Rupert, T.J. Materials selection rules for amorphous complexion formation in binary metallic alloys. Acta Mater. 2017, 140, 196–205. [Google Scholar] [CrossRef]
- Mazilkin, A.A.; Straumal, B.B.; Protasova, S.G.; Bulatov, M.F.; Baretzky, B. Pseudopartial wetting of W/W grain boundaries by the nickel-rich layers. Mater. Lett. 2017, 192, 101–103. [Google Scholar] [CrossRef]
- Kwiatkowski da Silva, A.; Leyson, G.; Kuzmina, M.; Ponge, D.; Herbig, M.; Sandlöbes, S.; Gault, B.; Neugebauer, J.; Raabe, D. Confined chemical and structural states at dislocations in Fe-9wt%Mn steels: A correlative TEM-atom probe study combined with multiscale modelling. Acta Mater. 2017, 124, 305–315. [Google Scholar] [CrossRef]
- Dillon, S.J.; Tai, K.; Chen, S. The importance of grain boundary complexions in affecting physical properties of polycrystals. Curr. Opin. Solid State Mater. Sci. 2016, 20, 324–335. [Google Scholar] [CrossRef]
- Tewari, A.; Bowen, P. Grain boundary complexion and transparent polycrystalline alumina from an atomistic simulation perspective. Curr. Opin. Solid State Mater. Sci. 2016, 20, 278–285. [Google Scholar] [CrossRef]
- Rheinheimer, W.; Hoffmann, M.J. Grain growth in perovskites: What is the impact of boundary transitions? Curr. Opin. Solid State Mater. Sci. 2016, 20, 286–298. [Google Scholar] [CrossRef]
- Dargatz, B.; Gonzalez, J.; Bram, M.; Shinoda, Y.; Wakai, F.; Guillon, O. FAST/SPS sintering of nanocrystalline zinc oxide-Part II: Abnormal grain growth. texture and grain anisotropy. J. Eur. Ceram. Soc. 2016, 36, 1221–1232. [Google Scholar] [CrossRef]
- Rheinheimer, W.; Hoffmann, M.J. Grain growth transitions of perovskite ceramics and their relationship to abnormal grain growth and bimodal microstructures. J. Mater. Sci. 2016, 51, 1756–1765. [Google Scholar] [CrossRef]
- Rheinheimer, W.; Hoffmann, M.J. Non-Arrhenius behavior of grain growth in strontium titanate: New evidence for a structural transition of grain boundaries. Scr. Mater. 2015, 101, 68–71. [Google Scholar] [CrossRef]
- Rheinheimer, W.; Baeurer, M.; Chien, H.; Rohrer, G.S.; Handwerker, C.A.; Blendell, J.E.; Hoffmann, M.J. The equilibrium crystal shape of strontium titanate and its relationship to the grain boundary plane distribution. Acta Mater. 2015, 82, 32–40. [Google Scholar] [CrossRef]
- Winterstein, J.P.; Carter, C.B. Electron-beam damage and point defects near grain boundaries in cerium oxide. J. Eur. Ceram. Soc. 2014, 34, 3007–3018. [Google Scholar] [CrossRef]
- Ma, S.; Cantwell, P.R.; Pennycook, T.J.; Zhou, N.; Oxley, M.P.; Leonard, D.N.; Pennycook, S.J.; Luo, J.; Harmer, M.P. Grain boundary complexion transitions in WO3- and CuO-doped TiO2 bicrystals. Acta Mater. 2013, 61, 691–1704. [Google Scholar] [CrossRef]
- Bojarski, S.A.; Ma, S.; Lenthe, W.; Harmer, M.P.; Rohrer, G.S. Changes in the grain boundary character and energy distributions resulting from a complexion transition in Ca-doped yttria. Metall. Mater. Trans. A 2012, 43, 3532–3538. [Google Scholar] [CrossRef]
- Clarke, D.R. On the equilibrium thickness of intergranular glass phases in ceramic materials. J. Am. Ceram. Soc. 1987, 70, 15–22. [Google Scholar] [CrossRef]
- Zhang, Y.; Luo, J. Observation of an unusual case of triple-line instability. Scr. Mater. 2014, 88, 45–48. [Google Scholar] [CrossRef]
- Tai, K.; Feng, L.; Dillon, S.J. Kinetics and thermodynamics associated with Bi adsorption transitions at Cu and Ni grain boundaries. J. Appl. Phys. 2013, 113, 193507. [Google Scholar] [CrossRef]
- Kundu, A.; Asl, K.M.; Luo, J.; Harmer, M.P. Identification of a bilayer grain boundary complexion in Bi-doped Cu. Scr. Mater. 2013, 68, 146–149. [Google Scholar] [CrossRef]
- Straumal, B.B.; Mazilkin, A.A.; Kogtenkova, O.A.; Protasova, S.G.; Baretzky, B. Grain boundary phase observed in Al–5 at.% Zn alloy by using HREM. Philos. Mag. Lett. 2007, 87, 423–430. [Google Scholar] [CrossRef]
- Rickman, J.M.; Harmer, M.P.; Chan, H.M. Grain-boundary layering transitions and phonon engineering. Surf. Sci. 2016, 651, 1–4. [Google Scholar] [CrossRef]
- Pan, Z.; Rupert, T.J. Effect of grain boundary character on segregation-induced structural transitions. Phys. Rev. B 2016, 93, 134113. [Google Scholar] [CrossRef]
- Harmer, M.P. Interfacial kinetic engineering: How far have we come since Kingery’s inaugural Sosman address? J. Am. Ceram. Soc. 2010, 93, 301–317. [Google Scholar] [CrossRef]
- Rickman, J.M.; Chan, H.M.; Harmer, M.P.; Luo, J. Grain-boundary layering transitions in a model bicrystal. Surf. Sci. 2013, 618, 88–93. [Google Scholar] [CrossRef]
- Dillon, S.J.; Tang, M.; Craig Carter, W.; Harmer, M.P. Complexion: A new concept for kinetic engineering in materials science. Acta Mater. 2007, 55, 6208–6218. [Google Scholar] [CrossRef]
- Konyashin, I.; Sologubenko, A.; Weirich, T.; Ries, B. Complexion at WC-Co grain boundaries of cemented carbides. Mater. Lett. 2017, 187, 7–10. [Google Scholar] [CrossRef]
- Zhou, N.; Hu, T.; Huang, J.; Luo, J. Stabilization of nanocrystalline alloys at high temperatures via utilizing high-entropy grain boundary complexions. Scr. Mater. 2016, 124, 160–163. [Google Scholar] [CrossRef]
- Rupert, T.J. The role of complexions in metallic nano-grain stability and deformation. Curr. Opin. Solid State Mater. Sci. 2016, 20, 257–267. [Google Scholar] [CrossRef]
- Harmer, M.P.; Rohrer, G.S. Grain boundary complexions—Current status and future directions. Curr. Opin. Solid State Mater. Sci. 2016, 20, 4–5. [Google Scholar]
- Bojarski, S.A.; Harmer, M.P.; Rohrer, G.S. Influence of grain boundary energy on the nucleation of complexion transitions. Scr. Mater. 2014, 88, 1–4. [Google Scholar] [CrossRef]
- Dillon, S.J.; Harmer, M.P.; Rohrer, G.S. The relative energies of normally and abnormally growing grain boundaries in alumina displaying different complexions. J. Am. Ceram. Soc. 2010, 93, 1796–1802. [Google Scholar] [CrossRef]
- Schumacher, O.; Marvel, C.J.; Kelly, M.N.; Cantwell, P.R.; Vinci, R.P.; Rickman, J.M.; Rohrer, G.S.; Harmer, M.P. Complexion time-temperature-transformation (TTT) diagrams: Opportunities and challenges. Curr. Opin. Solid State Mater. Sci. 2016, 20, 316–323. [Google Scholar] [CrossRef]
- Cantwell, P.R.; Ma, S.; Bojarski, S.A.; Rohrer, G.S.; Harmer, M.P. Expanding time-temperature-transformation (TTT) diagrams to interfaces: A new approach for grain boundary engineering. Acta Mater. 2016, 106, 78–86. [Google Scholar] [CrossRef]
- Molodov, D.A.; Straumal, B.B.; Shvindlerman, L.S. The effect of pressure on migration of <001> tilt grain boundaries in tin bicrystals. Scr. Metall. 1984, 18, 207–211. [Google Scholar] [CrossRef]
- Frazier, W.E.; Rohrer, G.S.; Rollett, A.D. Abnormal grain growth in the Potts model incorporating grain boundary complexion transitions that increase the mobility of individual boundaries. Acta Mater. 2015, 96, 390–398. [Google Scholar] [CrossRef]
- Molodov, D.A.; Czubayko, U.; Gottstein, G.; Shvindlerman, L.S.; Straumal, B.B.; Gust, W. Acceleration of grain boundary motion in Al by small additions of Ga. Philos. Mag. Lett. 1995, 72, 361–368. [Google Scholar] [CrossRef]
- Noskovich, O.I.; Rabkin, E.I.; Semenov, V.N.; Straumal, B.B.; Shvindlerman, L.S. Wetting and premelting phase transitions in 38°[100] tilt grain boundaries in (Fe–12 at.% Si) Zn alloy in the vicinity of the A2–B2 bulk ordering in Fe–12at.%Si alloy. Acta Metall. Mater. 1991, 39, 3091–3098. [Google Scholar] [CrossRef]
- Moghadam, M.M.; Rickman, J.M.; Harmer, M.P.; Chan, H.M. The role of boundary variability in polycrystalline grain-boundary diffusion. J. Appl. Phys. 2015, 117, 045311. [Google Scholar] [CrossRef]
- Straumal, B.B.; Noskovich, O.I.; Semenov, V.N.; Shvindlerman, L.S.; Gust, W.; Predel, B. Premelting transition on 38°<001> tilt grain boundaries in (Fe–10 at.% Si)–Zn alloys. Acta Metall. Mater. 1992, 40, 795–801. [Google Scholar] [CrossRef]
- Divinski, S.V.; Lohmann, M.; Herzig, C.; Straumal, B.; Baretzky, B.; Gust, W. Grain boundary melting phase transition in the Cu–Bi system. Phys. Rev. B 2005, 71, 104104. [Google Scholar] [CrossRef]
- Straumal, B.B.; Polyakov, S.A.; Bischoff, E.; Gust, W.; Mittemeijer, E.J. Faceting of Σ3 and Σ9 grain boundaries in copper. Interface Sci. 2001, 9, 287–292. [Google Scholar] [CrossRef]
- Lee, J.W.; Terner, M.; Hong, H.U.; Nab, S.H.; Seolb, J.B.; Jang, J.H.; Lee, T.H. A new observation of strain-induced grain boundary serration and its underlying mechanism in a Ni–20Cr binary model alloy. Mater. Charact. 2018, 135, 146–153. [Google Scholar] [CrossRef]
- Schölhammer, J.; Baretzky, B.; Gust, W.; Mittemeijer, E.; Straumal, B. Grain boundary grooving as an indicator of grain boundary phase transformations. Interface Sci. 2001, 9, 43–53. [Google Scholar] [CrossRef]
- Rohrer, G.S. The role of grain boundary energy in grain boundary complexion transitions. Curr. Opin. Solid State Mater. Sci. 2016, 20, 231–239. [Google Scholar] [CrossRef]
- Straumal, B.B.; Kogtenkova, O.A.; Gornakova, A.S.; Sursaeva, V.G.; Baretzky, B. Review: Grain boundary faceting-roughening phenomena. J. Mater. Sci. 2016, 51, 382–404. [Google Scholar] [CrossRef]
- Maksimova, E.L.; Shvindlerman, L.S.; Straumal, B.B. Transformation of Σ17 special tilt boundaries to general boundaries in tin. Acta Metall. 1988, 36, 1573–1583. [Google Scholar] [CrossRef]
- Feng, X.; Zhang, J.; Xia, Z.; Fu, W.; Wu, K.; Liu, G.; Sun, J. Stable nanocrystalline NbMoTaW high entropy alloy thin films with excellent mechanical and electrical properties. Mater. Lett. 2018, 210, 84–87. [Google Scholar] [CrossRef]
- Molodov, D.A.; Ivanov, V.A.; Gottstein, G. Low angle tilt boundary migration coupled to shear deformation. Acta Mater. 2007, 55, 1843–1848. [Google Scholar] [CrossRef]
- Gorkaya, T.; Molodov, D.A.; Gottstein, G. Stress-driven migration of symmetrical <001> tilt grain boundaries in Al bicrystals. Acta Mater. 2009, 57, 5396–5405. [Google Scholar] [CrossRef]
- Gorkaya, T.; Molodov, K.D.; Molodov Dmitri, A.; Gottstein, G. Concurrent grain boundary motion and grain rotation under an applied stress. Acta Mater. 2011, 59, 5674–5680. [Google Scholar] [CrossRef]
- Molodov, D.A.; Gorkaya, T.; Gottstein, G. Migration of the Sigma 7 tilt grain boundary in Al under an applied external stress. Scr. Mater. 2011, 65, 990–993. [Google Scholar] [CrossRef]
- Reddy, K.V.; Pal, S. Effect of grain boundary complexions on the deformation behavior of Ni bicrystal during bending creep. J. Mol. Model. 2018, 24, 87. [Google Scholar] [CrossRef]
- Zhang, J.; Tasan, C.C.; Lai, M.J.; Dippel, A.C.; Raabe, D. Complexion-mediated martensitic phase transformation in titanium. Nat. Commun. 2017, 8, 14210. [Google Scholar] [CrossRef] [PubMed]
- Friak, M.; Vsianska, M.; Holec, D.; Šob, M. Quantum-mechanical study of tensorial elastic and high-temperature thermodynamic properties of grain boundary states in superalloy-phase Ni3Al. IOP Conf. Ser. Mater. Sci. Eng. 2017, 219, 012019. [Google Scholar] [CrossRef]
- Feng, L.; Hao, R.; Lambros, J.; Dillon, S.J. The influence of dopants and complexion transitions on grain boundary fracture in alumina. Acta Mater. 2018, 142, 121–130. [Google Scholar] [CrossRef]
- Yu, Z.; Cantwell, P.R.; Gao, Q.; Yin, D.; Zhang, Y.; Zhou, N.; Rohrer, G.S.; Widom, M.; Luo, J.; Harmer, M.P. Segregation-induced ordered superstructures at general grain boundaries in a nickel-bismuth alloy. Science 2017, 358, 97. [Google Scholar] [CrossRef] [PubMed]
- Tran, R.; Xu, Z.; Zhou, N.; Luo, J.; Ong, S.P. Computational study of metallic dopant segregation and embrittlement at molybdenum grain boundaries. Acta Mater. 2016, 117, 91–99. [Google Scholar] [CrossRef]
- Ahadi, A.; Kalidindi, A.R.; Sakurai, J.; Matsushita, Y.; Tsuchiya, K.; Schuh, C.A. The role of W on the thermal stability of nanocrystalline NiTiWx thin films. Acta Mater. 2018, 142, 181–192. [Google Scholar] [CrossRef]
- Pan, Z.; Rupert, T.J. Formation of ordered and disordered interfacial films in immiscible metal alloys. Scr. Mater. 2017, 130, 91–95. [Google Scholar] [CrossRef]
- Cao, W.; Kundu, A.; Yu, Z.; Harmer, M.P.; Vinci, R.P. Direct correlations between fracture toughness and grain boundary segregation behavior in ytterbium-doped magnesium aluminate spinel. Scr. Mater. 2013, 69, 81–84. [Google Scholar] [CrossRef]
- Valiev, R.Z.; Murashkin, M.; Yu Straumal, B.B. Enhanced ductility in ultrafine-grained Al alloys produced by SPD techniques. Mater. Sci. Forum 2009, 633, 321–332. [Google Scholar] [CrossRef]
- Valiev, R.Z.; Murashkin, M.Y.; Kilmametov, A.; Straumal, B.B.; Chinh, N.Q.; Langdon, T.G. Unusual super-ductility at room temperature in an ultrafine-grained aluminum alloy. J. Mater. Sci. 2010, 45, 4718–4724. [Google Scholar] [CrossRef]
- Chinh, N.Q.; Csanádi, T.; Gubicza, J.; Valiev, R.Z.; Straumal, B.B.; Langdon, T.G. The effect of grain-boundary sliding and strain rate sensitivity on the ductility of ultrafine-grained materials. Mater. Sci. Forum 2011, 667, 677–682. [Google Scholar] [CrossRef]
- Chinh, N.Q.; Csanádi, T.; Győri, T.; Valiev, R.Z.; Straumal, B.B.; Kawasaki, M.; Langdon, T.G. Strain rate sensitivity studies in an ultrafine-grained Al–30 wt.% Zn alloy using micro- and nanoindentation. Mater. Sci. Eng. A 2012, 543, 117–120. [Google Scholar] [CrossRef]
- Straumal, B.B.; Sauvage, X.; Baretzky, B.; Mazilkin, A.A.; Valiev, R.Z. Grain boundary films in Al–Zn alloys after high pressure torsion. Scr. Mater. 2014, 70, 59–62. [Google Scholar] [CrossRef]
- Straumal, B.; Valiev, R.; Kogtenkova, O.; Zieba, P.; Czeppe, T.; Bielanska, E.; Faryna, M. Thermal evolution and grain boundary phase transformations in severe deformed nanograined Al–Zn alloys. Acta Mater. 2008, 56, 6123–6131. [Google Scholar] [CrossRef]
- Higashi, K.; Nieh, T.G.; Mabuchi, M.; Wadsworth, J. Effect of liquid phases on the tensile elongation of superplastic aluminum alloys and composites. Scr. Metall. Mater. 1995, 32, 1079–1084. [Google Scholar] [CrossRef]
- Takayama, Y.; Tozawa, T.; Kato, H. Superplasticity and thickness of liquid phase in the vicinity of solidus temperature in a 7475 aluminum alloy. Acta Mater. 1999, 47, 1263–1270. [Google Scholar] [CrossRef]
- Iwasaki, H.; Mori, T.; Mabuchi, M.; Higashi, K. Shear deformation behavior of Al-5% Mg in a semi-solid state. Acta Mater. 1998, 46, 6351–6360. [Google Scholar] [CrossRef]
- Baudelet, B.; Dang, M.C.; Bordeaux, F. Mechanical behaviour of an aluminium alloy with fusible grain boundaries. Scr. Metall. Mater. 1992, 26, 573–578. [Google Scholar] [CrossRef]
- Mabuchi, M.; Higashi, K.; Imai, T.; Kubo, K. Superplastic-like behavior in as-extruded Al–Zn–Mg alloy matrix composites reinforced with Si3N4 whiskers. Scr. Metall. 1991, 25, 1675–1680. [Google Scholar] [CrossRef]
- Kalcher, C.; Adjaoud, O.; Rohrer, J.; Stukowski, A.; Albe, K. Reinforcement of nanoglasses by interface strengthening. Scr. Mater. 2017, 141, 115–119. [Google Scholar] [CrossRef]
- Li, A.; Szlufarska, I. Morphology and mechanical properties of nanocrystalline Cu/Ag alloy. J. Mater. Sci. 2017, 52, 4555–4567. [Google Scholar] [CrossRef]
- Smith, T.M.; Esser, B.D.; Antolin, N.; Carlsson, A.; Williams, R.E.A.; Wessman, A.; Hanlon, T.; Fraser, H.L.; Windl, W.; McComb, D.W.; et al. Phase transformation strengthening of high-temperature superalloys. Nat. Commun. 2016, 7, 13434. [Google Scholar] [CrossRef] [PubMed]
- Kosinova, A.; Straumal, B.B.; Kilmametov, A.R.; Rabkin, E. The effect of bismuth on microstructure evolution of ultrafine grained copper. Mater. Lett. 2017, 199, 156–159. [Google Scholar] [CrossRef]
- Shinagawa, K.; Maki, S.; Yokota, K. Phase-field simulation of platelike grain growth during sintering of alumina. J. Eur. Ceram. Soc. 2014, 34, 3027–3036. [Google Scholar] [CrossRef]
- Amaral, L.; Fernandes, M.; Reaney, I.M.; Harmer, M.P.; Senos, A.M.R.; Vilarinho, P.M. Grain growth anomaly and dielectric response in Ti-rich strontium titanate ceramics. J. Phys. Chem. C 2013, 117, 24787–24795. [Google Scholar] [CrossRef]
- Baeurer, M.; Syha, M.; Weygand, D. Combined experimental and numerical study on the effective grain growth dynamics in highly anisotropic systems: Application to barium titanate. Acta Mater. 2013, 61, 5664–5673. [Google Scholar] [CrossRef]
- Biotteau-Deheuvels, K.; Zych, L.; Gremillard, L.; Chevalier, J. Effects of Ca-, Mg- and Si-doping on microstructures of alumina-zirconia composites. J. Eur. Ceram. Soc. 2012, 32, 2711–2721. [Google Scholar] [CrossRef]
- Dillon, S.J.; Harmer, M.P.; Rohrer, G.S. Influence of interface energies on solute partitioning mechanisms in doped aluminas. Acta Mater. 2010, 58, 5097–5108. [Google Scholar] [CrossRef]
- Dillon, S.J.; Miller, H.; Harmer, M.P.; Rohrer, G.S. Grain boundary plane distributions in aluminas evolving by normal and abnormal grain growth and displaying different complexions. Int. J. Mater. Res. 2010, 101, 50–56. [Google Scholar] [CrossRef]
- Gupta, A.; Sharma, S.; Joshi, M.R.; Agarwal, P.; Balani, K. Grain growth behavior of Al2O3 nanomaterials: A review. Mater. Sci. Forum 2010, 653, 87–130. [Google Scholar] [CrossRef]
- Nie, J.; Chan, J.M.; Qin, M.; Zhou, N.; Luo, J. Liquid-like grain boundary complexion and sub-eutectic activated sintering in CuO-doped TiO2. Acta Mater. 2017, 130, 329–338. [Google Scholar] [CrossRef]
- Zu, Y.; Chen, G.; Fu, X.; Luo, K.; Wang, C.; Song, S.; Zhou, W. Effects of liquid phases on densification of TiO2-doped Al2O3-ZrO2 composite ceramics. Ceram. Int. 2014, 40, 3989–3993. [Google Scholar] [CrossRef]
- Gluzer, G.; Kaplan, W.D. Particle occlusion and mechanical properties of Ni- Al2O3 nanocomposites. J. Eur. Ceram. Soc. 2013, 33, 3101–3113. [Google Scholar] [CrossRef]
- Jung, J.I.; Zhou, N.; Luo, J. Effects of sintering aids on the densification of Mo–Si–B alloys. J. Mater. Sci. 2012, 47, 8308–8319. [Google Scholar] [CrossRef]
- Reimanis, I.; Kleebe, H.J. A Review on the Sintering and Microstructure Development of Transparent Spinel MgAl2O4. J. Am. Ceram. Soc. 2009, 92, 1472–1480. [Google Scholar] [CrossRef]
- Dillon, S.J.; Harmer, M.P. Demystifying the role of sintering additives with “complexion”. J. Eur. Ceram. Soc. 2008, 28, 1485–1493. [Google Scholar] [CrossRef]
- Bueno, P.; Varela, J.; Longo, E. SnO2, ZnO and related polycrystalline compound semiconductors, an overview and review on the voltage-dependent resistance (non-ohmic) feature. J. Eur. Ceram. Soc. 2008, 28, 505–529. [Google Scholar] [CrossRef]
- Wu, Y.; Gao, M.; Li, S.; Ren, Y.; Qin, G. Copper wires with seamless 1D nanostructures: Preparation and electrochemical sensing performance. Mater. Lett. 2018, 211, 247–249. [Google Scholar] [CrossRef]
- Bowman, W.J.; Kelly, M.N.; Rohrer, G.S.; Hernandez, C.A.; Crozier, P.A. Enhanced ionic conductivity in electroceramics by nanoscale enrichment of grain boundaries with high solute concentration. Nanoscale 2017, 9, 17293–17302. [Google Scholar] [CrossRef]
- Cesar, M.; Gall, D.; Guo, H. Reducing grain-boundary resistivity of copper nanowires by doping. Phys. Rev. Appl. 2016, 5, 054018. [Google Scholar] [CrossRef]
- Straumal, B.; Sluchanko, N.E.; Gust, W. Influence of the grain boundary phase transitions on the properties of Cu–Bi polycrystals. Defect Diffus. Forum 2001, 188, 185–194. [Google Scholar] [CrossRef]
- Straumal, B.B.; Myatiev, A.A.; Straumal, P.B.; Mazilkin, A.A. Grain boundary phase transformations in nanostructured conducting oxides. In Nanoscale Phenomena—Fundamentals and Applications; Hahn, H., Sidorenko, A., Tigineanu, I., Eds.; Series NanoScience; Springer: Berlin, Germany, 2009; pp. 75–88. [Google Scholar]
- Straumal, B.B.; Protasova, S.G.; Mazilkin, A.A.; Goering, E.; Schütz, G.; Straumal, P.B.; Baretzky, B. Ferromagnetic behaviour of ZnO: Role of grain boundaries. Beilstein J. Nanotechnol. 2016, 7, 1936–1947. [Google Scholar] [CrossRef] [PubMed]
- Straumal, B.B.; Mazilkin, A.A.; Protasova, S.G.; Myatiev, A.A.; Straumal, P.B.; Goering, E.; Baretzky, B. Influence of texture on the ferromagnetic properties of nanograined ZnO films. Phys. Stat. Sol. B 2011, 248, 581–586. [Google Scholar] [CrossRef]
- Zong, P.; Hanus, R.; Dylla, M.; Tang, Y.; Liao, J.; Zhang, Q.; Snyder, G.J.; Che, L. Skutterudite with graphene-modified grain-boundary complexion enhances zT enabling high-efficiency thermoelectric device. Energy Environ. Sci. 2017, 10, 183–191. [Google Scholar] [CrossRef]
- Kriegel, M.J.; Kilmametov, A.; Rudolph, M.; Straumal, B.B.; Gornakova, A.S.; Stöcker, H.; Ivanisenko, Y.; Fabrichnaya, O.; Hahn, H.; Rafaja, D. Transformation pathway upon heating of Ti–Fe alloys deformed by high-pressure torsion. Adv. Eng. Mater. 2018, 20, 1700933. [Google Scholar] [CrossRef]
- Straumal, B.B.; Gornakova, A.S.; Mazilkin, A.A.; Fabrichnaya, O.B.; Kriegel, M.J.; Baretzky, B.; Jiang, J.Z.; Dobatkin, S.V. Phase transformations in the severely plastically deformed Zr–Nb alloys. Mater. Lett. 2012, 81, 225–228. [Google Scholar] [CrossRef]
- Kogtenkova, O.A.; Protasova, S.G.; Mazilkin, A.A.; Straumal, B.B.; Zięba, P.; Czeppe, T.; Baretzky, B. Heat effect of grain boundary wetting in Al–Mg alloys. J. Mater. Sci. 2012, 47, 8367–8371. [Google Scholar] [CrossRef]
- Kogtenkova, O.A.; Straumal, B.B.; Protasova, S.G.; Gornakova, A.S.; Zięba, P.; Czeppe, T. Effect of the wetting of grain boundaries on the formation of a solid solution in the Al–Zn system. JETP Lett. 2012, 96, 380–384. [Google Scholar] [CrossRef]
- Kogtenkova, O.A.; Zieba, P.; Czeppe, T.; Lityn’ska-Dobrzynska, L.; Straumal, B.B.; Nekrasov, A.N. Wetting of grain boundaries by the second solid phase in the Al-based alloys. Bull. Russ. Acad. Sci. Phys. 2013, 77, 1386–1390. [Google Scholar] [CrossRef]
- Hasan, M.M.; Dholabhai, P.P.; Deya, S.; Uberuaga, B.P.; Castro, R.H.R. Reduced grain boundary energies in rare-earth doped MgAl2O4 spinel and consequent grain growth inhibition. J. Eur. Ceram. Soc. 2017, 37, 4043–4050. [Google Scholar] [CrossRef]
- Castro, R.H.R. On the thermodynamic stability of nanocrystalline ceramics. Mater. Lett. 2013, 96, 45–56. [Google Scholar] [CrossRef]
- Pereira, G.J.; Bolis, K.; Muche, D.N.F.; Gouvêa, D.; Castro, R.H.R. Direct measurement of interface energies of magnesium aluminatespinel and a brief sintering analysis. J. Eur. Ceram. Soc. 2017, 37, 4051–4058. [Google Scholar] [CrossRef]
- Li, H.; Dey, S.; Castro, R.H.R. Kinetics and thermodynamics of densification and grain growth: Insights from lanthanum doped zirconia. Acta Mater. 2018, 150, 394–402. [Google Scholar] [CrossRef]
- Bokov, A.; Zhang, S.; Feng, L.; Dillon, S.H.; Faller, R.; Castro, H.R.R. Energetic design of grain boundary networks for toughening of nanocrystalline oxides. J. Eur. Ceram. Soc. 2018, 38, 4260–4267. [Google Scholar] [CrossRef]
- Muche, D.N.F.; Marple, M.A.T.; Sen, S.; Castro, R.H.R. Grain boundary energy, disordering energy and grain growth kinetics. Acta Mater. 2018, 149, 302–311. [Google Scholar] [CrossRef]
- Li, H.; Souza, F.L.; Castro, R.H.R. Kinetic and thermodynamic effects of manganese as a densification aid in yttria-stabilized zirconia. J. Eur. Ceram. Soc. 2018, 38, 1750–1759. [Google Scholar] [CrossRef]
- Sharma, G.; Castro, R.H.R. Synthesis and surface enthalpy of MgGa2O4 spinel. Thermochim. Acta 2017, 655, 326–330. [Google Scholar] [CrossRef]
- Nafsin, N.; Aguiar, J.A.; Aoki, T.; Andrew, M.; Thron, A.M.; Benthem, K.; Castro, R.H.R. Thermodynamics versus kinetics of grain growth control in nanocrystalline zirconia. Acta Mater. 2017, 136, 224–234. [Google Scholar] [CrossRef]
- Grosso, R.L.; Muccillo, E.N.S.; Castro, R.H.R. Phase stability in scandia-zirconia nanocrystals. J. Am. Ceram. Soc. 2017, 100, 2199–2208. [Google Scholar] [CrossRef]
- Massalski, T.B. Binary Alloy Phase Diagrams, 2nd ed.; ASM International: Materials Park, OH, USA, 1990. [Google Scholar]
- Sauvage, X.; Murashkin MYu Straumal, B.B.; Bobruk, E.; Valiev, R.Z. Ultrafine grained structures resulting from SPD-induced phase transformation in Al-Zn alloys. Adv. Eng. Mater. 2015, 17, 1821–1827. [Google Scholar] [CrossRef]
- Straumal, B.B.; Kilmametov, A.R.; Korneva, A.; Mazilkin, A.A.; Straumal, P.B.; Zięba, P.; Baretzky, B. Phase transitions in Cu-based alloys under high pressure torsion. J. Alloys Compd. 2017, 707, 20–26. [Google Scholar] [CrossRef]
- Zhevnenko, S.N.; Gershman, E.I. Grain boundary phase transformation in Cu–Co solid solutions. J. Alloys Compd. 2012, 536, S554–S558. [Google Scholar] [CrossRef]
- Perevezentsev, V.N.; Shcherban, M.Y.; Murashkin, M.Y.; Valiev, R.Z. High-strain-rate superplasticity of nanocrystalline aluminum alloy 1570. Tech. Phys. Lett. 2007, 33, 648–650. [Google Scholar] [CrossRef]
- Wei, Z.J.; Wang, Z.L.; Wang, H.W.; Cao, L. Evolution of microstructures and phases of Al-Mg alloy under 4 GPa high pressure. J. Mater. Sci. 2007, 42, 7123–7128. [Google Scholar] [CrossRef]
- Schoenitz, M.; Dreizin, E.L. Structure and properties of Al–Mg mechanical alloys. J. Mater. Res. 2003, 18, 1827–1836. [Google Scholar] [CrossRef]
- Skvortsov, A.I.; Polev, V.V. Softening and hardening of alloys of the Al-Zn system under plastic deformation. Met. Sci. Heat Treat. 2017, 59, 504–508. [Google Scholar] [CrossRef]
- Rabkin, E.I.; Semenov, V.N.; Shvindlerman, L.S.; Straumal, B.B. Penetration of tin and zinc along tilt grain boundaries 43° [100] in Fe–5 at.% Si alloy: Premelting phase transition? Acta Metall. Mater. 1991, 39, 627–639. [Google Scholar] [CrossRef]
- Straumal, B.; Rabkin, E.; Shvindlerman, L.; Gust, W. Grain boundary zinc penetration in Fe–Si alloys: Premelting phase transition on the grain boundaries. Mater. Sci. Forum 1993, 126, 391–394. [Google Scholar] [CrossRef]
- Noskovich, O.I.; Rabkin, E.I.; Semenov, V.N.; Straumal, B.B. The zinc penetration along tilt grain boundary 38°[100] in Fe–12at.%Si alloy near ordering A2–B2 in the bulk. Scr. Metall. 1991, 25, 1441–1446. [Google Scholar] [CrossRef]
- Straumal, B.; Rabkin, E.; Lojkowski, W.; Gust, W.; Shvindlerman, L.S. Pressure influence on the grain boundary wetting phase transition in Fe–Si alloys. Acta Mater. 1997, 45, 1931–1940. [Google Scholar] [CrossRef]
- Chang, L.-S.; Rabkin, E.; Straumal, B.B.; Baretzky, B.; Gust, W. Thermodynamic aspects of the grain boundary segregation in Cu(Bi) alloys. Acta Mater. 1999, 47, 4041–4046. [Google Scholar] [CrossRef]
- Straumal, B.; Prokofjev, S.I.; Chang, L.S.; Sluchanko, N.E.; Baretzky, B.; Gust, W.; Mittemeijer, E. Grain boundary phase transitions in the Cu–Bi system. Defect Diffus. Forum 2001, 194–199, 1343–1348. [Google Scholar] [CrossRef]
- Chang, L.-S.; Lojkowski, W.; Straumal, B.; Rabkin, E.; Gust, W. Hot isostatic pressing of Cu–Bi polycrystals with liquid-like grain boundary layers. Acta Mater. 2007, 55, 335–343. [Google Scholar] [CrossRef]
- Straumal, B.B.; Kogtenkova, O.A.; Murashkin MYu Bulatov, M.F.; Czeppe, T.; Zięba, P. Grain boundary wetting transition in Al–Mg alloys. Mater. Lett. 2017, 186, 82–85. [Google Scholar] [CrossRef]
- Straumal, B.B.; Korneva, A.; Kogtenkova, O.; Kurmanaeva, L.; Zięba, P.; Wierzbicka-Miernik, A.; Zhevnenko, S.N.; Baretzky, B. Grain boundary wetting and premelting in the Cu–Co alloys. J. Alloys Compd. 2014, 615, S183–S187. [Google Scholar] [CrossRef]
- Bobruk, E.V.; Sauvage, X.; Enikeev, N.А.; Straumal, B.B.; Valiev, R.Z. Mechanical behavior of ultra-fine grained Al–5Zn. Al–10Zn, Al–30Zn alloys. Rev. Adv. Mater. Sci. 2015, 43, 45–51. [Google Scholar]
- López, G.A.; Mittemeijer, E.J.; Straumal, B.B. Grain boundary wetting by a solid phase; microstructural development in a Zn–5 wt.% Al alloy. Acta Mater. 2004, 52, 4537–4545. [Google Scholar]
- Straumal, B.B.; Khruzhcheva, A.S.; López, G.A. Grain boundary wetting by a (Al) solid phase in Zn–Al polycrystals and Zn bicrystals. Isvestia RAS (Ser. Phys.) 2005, 69, 1312–1318. [Google Scholar]
- Straumal, B.B.; Khruzhcheva, A.S.; López, G.A. “Wetting by solid state” grain boundary phase transition in Zn–Al alloys. Rev. Adv. Mater. Sci. 2004, 6, 13–22. [Google Scholar]
- Straumal, B.B.; Baretzky, B.; Mazilkin, A.A.; Phillipp, F.; Kogtenkova, O.A.; Volkov, M.N.; Valiev, R.Z. Formation of nanograined structure and decomposition of supersaturated solid solution during high pressure torsion of Al–Zn and Al–Mg. Acta Mater. 2004, 52, 4469–4478. [Google Scholar] [CrossRef]
- Mazilkin, A.A.; Kogtenkova, O.A.; Straumal, B.B.; Valiev, R.Z.; Baretzky, B. Formation of nanostructure during high-pressure torsion of Al–Zn, Al–Mg and Al–Zn–Mg alloys. Defect Diffus. Forum 2005, 237–240, 739–744. [Google Scholar] [CrossRef]
- Straumal, B.B.; Rodin, A.O.; Shotanov, A.E.; Straumal, A.B.; Kogtenkova, O.A.; Baretzky, B. Pseudopartial grain boundary wetting: Key to the thin intergranular layers. Defect Diffus. Forum 2013, 333, 175–192. [Google Scholar] [CrossRef]
- Straumal, B.B.; Mazilkin, A.A.; Sauvage, X.; Valiev, R.Z.; Straumal, A.B.; Gusak, A.M. Pseudopartial wetting of grain boundaries in severely deformed Al–Zn alloys. Russ. J. Non-Ferr. Met. 2015, 56, 44–51. [Google Scholar] [CrossRef]
- Chinh, N.Q.; Valiev, R.Z.; Sauvage, X.; Varga, G.; Havancsák, K.; Kawasaki, M.; Straumal, B.B.; Langdon, T.G. Grain boundary phenomena in an ultrafine-grained Al–Zn alloy with improved mechanical behavior for micro-devices. Adv. Eng. Mater. 2014, 16, 1000–1009. [Google Scholar] [CrossRef]
- Indekeu, J.O.; van Leeuwen, J.M.J. “Wetting” phase transitions in type-I superconductors. Physica A 1997, 236, 114–122. [Google Scholar] [CrossRef]
- Dietrich, S.; Schick, M. Critical wetting of surfaces in systems with long-range forces. Phys. Rev. B 1985, 31, 4718–4720. [Google Scholar] [CrossRef]
- Saam, W.F.; Shenoy, V.B. Continuous wetting transitions in adsorbed Xe films. J. Low Temp. Phys. 1995, 101, 225–230. [Google Scholar] [CrossRef]
- Saam, W.F.; Shenoy, V.B. Continuous wetting transitions in Xe adsorbed on NaF and on plated Cs and Rb substrates. Phys. Rev. Lett. 1995, 75, 4086–4089. [Google Scholar]
- Dietrich, S.; Napiorkowski, M. Analytic results for wetting transitions in the presence of van der Waals tails. Phys. Rev. A 1991, 43, 1861–1885. [Google Scholar] [CrossRef] [PubMed]
- Indekeu, J.O.; van Leeuwen, J.M.J. Wetting prewetting and surface transitions in type-I superconductors. Physica C 1995, 251, 290–306. [Google Scholar] [CrossRef]
- Boulter, C.J.; Clarysse, F. Adsorption phenomena in amphiphilic systems. Phys. Rev. E 1999, 60, R2472–R2475. [Google Scholar] [CrossRef]
- Swain, P.S.; Parry, A.O. Two parameters for three-dimensional wetting transitions. Europhys. Lett. 1997, 37, 207–212. [Google Scholar] [CrossRef]
- Parry, A.O.; Swain, P.S. Coupled Hamiltonians and three-dimensional short-range wetting transitions. Phys. A 1998, 250, 167–230. [Google Scholar] [CrossRef]
- Indekeu, J.O.; Ragil, K.; Bonn, D.; Broseta, D.; Meunier, J. Wetting of alkanes on water from a Cahn-type theory: Effects of long-range forces. J. Stat. Phys. 1999, 95, 1009–1043. [Google Scholar] [CrossRef]
- Clarysse, F.; Boulter, C.J. Effective interface models for ternary amphiphilic systems: Thin–thick. first-order and continuous wetting transitions. Phys. A 2000, 278, 356–389. [Google Scholar] [CrossRef]
- Sartori, A.; Parry, A.O. Critical wetting in power-law wedge geometries. J. Phys. Cond. Matter 2002, 14, L679–L686. [Google Scholar] [CrossRef]
- Fenzl, W. Van der Waals interaction and wetting transitions. Europhys. Lett. 2003, 64, 64–69. [Google Scholar] [CrossRef]
- Kogtenkova, O.A.; Mazilkin, A.A.; Straumal, B.B.; Abrosimova, G.E.; Zięba, P.; Czeppe, T.; Baretzky, B.; Valiev, R.Z. Phase transformations in Al–Mg–Zn alloys during high pressure torsion and subsequent heating. J. Mater. Sci. 2013, 48, 4758–4765. [Google Scholar] [CrossRef]
- Straumal, B.B.; Kogtenkova, O.A.; Protasova, S.G.; Zięba, P.; Czeppe, T.; Baretzky, B.; Valiev, R.Z. First measurement of the heat effect of the grain boundary wetting phase transition. J. Mater. Sci. 2011, 46, 4243–4247. [Google Scholar] [CrossRef]
- Straumal, B.B.; López, G.; Mittemeijer, E.J.; Gust, W.; Zhilyaev, A.P. Grain boundary phase transitions in the Al–Mg system and their influence on the high-strain rate superplaticity. Defect Diffus. Forum 2003, 216–217, 307–312. [Google Scholar] [CrossRef]
- Mondolfo, L.F. Aluminium Alloys—Structures & Properties; Butterworths: London, UK, 1976. [Google Scholar]
- Krishna Rao, K.; Herman, H.; Parte, E. The structure of a metastable, trigonal transition phase in quenched Al-29 at. % Zn. Mater. Sci. Eng. 1996, 1, 162–166. [Google Scholar]
- Sandoval-Jimenez, A.; Negrete, J.; Torres-Villaceňor, G. The triclinic high temperature modification of the phase of the phase of the Zn–Al system. Mater. Res. Bull. 1999, 34, 2291–2296. [Google Scholar] [CrossRef]
- Nakayama, Y.; Takaai, T.; Jin, D.; Yamada, Y. Changes in microstructures of Al-5, 10 mass% Mg binary alloys with aging treatment. J. Jpn. Inst. Met. 1997, 61, 34–40. [Google Scholar] [CrossRef]
- Gao, N.; Starink, M.J.; Langdon, T.G. Using differential scanning calorimetry as an analytical tool for ultrafine grained metals processed by severe plastic deformation. Mater. Sci. Technol. 2009, 25, 687–698. [Google Scholar] [CrossRef]
- Straumal, B.B.; Bokstein, B.S.; Straumal, A.B.; Petelin, A.L. First observation of a wetting transition in low-angle grain boundaries. JETP Lett. 2008, 88, 537–542. [Google Scholar] [CrossRef]
- Frolov, T.; Mishin, Y. Thermodynamics of coherent interfaces under mechanical stresses. II. Application to atomistic simulation of grain boundaries. Phys. Rev. B 2012, 85, 224107. [Google Scholar] [CrossRef]
- Hickman, J.; Mishin, Y. Disjoining potential and grain boundary premelting in binary alloys. Phys. Rev. B 2016, 93, 224108. [Google Scholar] [CrossRef]
- Frolov, T.; Asta, M.; Mishin, Y. Segregation-induced phase transformations in grain boundaries. Phys. Rev. B 2015, 92, 020103. [Google Scholar] [CrossRef]
- Frolov, T.; Divinski, S.V.; Asta, M.; Mishin, Y. Effect of interface phase transformations on diffusion and segregation in high-angle grain boundaries. Phys. Rev. Lett. 2013, 110, 255502. [Google Scholar] [CrossRef]
- Berthier, F.; Creuze, J.; Tetot, R.; Legrand, B. Multilayer properties of superficial and intergranular segregation isotherms: A mean-field approach. Phys. Rev. B 2002, 65, 195413. [Google Scholar] [CrossRef]
- Creuze, J.; Berthier, F.; Tetot, R.; Legrand, B. Intergranular segregation and ordering effect: A mixed Monte Carlo mean-field approach. Phys. Rev. B 2000, 62, 2813–2824. [Google Scholar] [CrossRef]
- Creuze, J.; Berthier, F.; Tetot, R.; Legrand, B. Wetting and structural transition induced by segregation at grain boundaries: A Monte Carlo study. Phys. Rev. Lett. 2001, 86, 5735–5738. [Google Scholar] [CrossRef] [PubMed]
- Lozovoi, A.Y.; Paxton, A.T.; Finnis, M.W. Structural and chemical embrittlement of grain boundaries by impurities: A general theory and first-principles calculations for copper. Phys. Rev. B 2006, 74, 155416. [Google Scholar] [CrossRef]
- Zhevnenko, S.N. Interfacial free energy of Cu-Co solid solutions. Metall. Mater. Trans. A 2013, 44, 2533–2538. [Google Scholar] [CrossRef]
- Zhevnenko, S.; Gershman, E. Interface controlled diffusional creep of Cu+2.8 at.% Co solid solution. Defect Diffus. Forum 2012, 322, 33–39. [Google Scholar] [CrossRef]
- Khairullin, A.; Nikulkina, V.; Zhevnenko, S.; Rodin, A. Peculiarity of grain boundary diffusion of Fe and Co in Cu. Defect Diffus. Forum 2017, 380, 135–140. [Google Scholar] [CrossRef]
- Straumal, B.B.; Shvindlerman, L.S. Regions of existence of special and non-special grain boundaries. Acta Metall. 1985, 33, 1735–1749. [Google Scholar]
- Maksimova, E.L.; Rabkin, E.I.; Shvindlerman, L.S.; Straumal, B.B. Phase transitions at grain boundaries in the presence of impurities. Acta Metal. 1989, 37, 1995–1998. [Google Scholar] [CrossRef]


© 2018 by the authors. Licensee MDPI, Basel, Switzerland. This article is an open access article distributed under the terms and conditions of the Creative Commons Attribution (CC BY) license (http://creativecommons.org/licenses/by/4.0/).