Article

Characterization of 17-4PH Single Tracks Produced at Different Parametric Conditions towards Increased Productivity of LPBF Systems—The Effect of Laser Power and Spot Size Upscaling

by
Nkutwane Washington Makoana
1,2,*,
Ina Yadroitsava
2,
Heinrich Möller
3 and
Igor Yadroitsev
2
1
Council for Scientific and Industrial Research, National Laser Centre, Pretoria 0001, South Africa
2
Department of Mechanical Engineering, Central University of Technology, Free State 9301, South Africa
3
Department of Materials Science and Metallurgical Engineering, University of Pretoria, Pretoria 0002, South Africa
*
Author to whom correspondence should be addressed.
Metals 2018, 8(7), 475; https://doi.org/10.3390/met8070475
Submission received: 7 May 2018 / Revised: 2 June 2018 / Accepted: 2 June 2018 / Published: 22 June 2018
(This article belongs to the Special Issue Additive Manufacturing of Ferrous Materials)

Abstract

:
Global industrial adoption of laser-based powder bed fusion (LPBF) technology is still limited by the production speed, the size of the build envelope, and therefore the maximum part size that can be produced. The cost of LPBF can be driven down further by improving the build rates without compromising structural integrity. A common approach is that the build rate can be improved by increasing the laser power and beam diameter to instantly melt a large area of powder, thus reducing the scanning time for each layer. The aim of this study was to investigate the aspects of upscaling LPBF processing parameters on the characteristic formation of stable single tracks, which are the primary building blocks for this technology. Two LPBF systems operating independently, using different parameter regimes, were used to produce the single tracks on a solid substrate deposited with a thin powder layer. The results obtained indicate that higher laser power and spot size can be used to produce stable tracks while the linear energy input is increased. It was also shown statistically that the geometrical characteristics of single tracks are mainly affected by the laser power and scanning speed during the scanning of a thin powder layer.

Graphical Abstract

1. Introduction

Laser-based powder bed fusion (LPBF) technology is gaining popularity in the manufacturing sector worldwide due to its attractive advantages over traditional manufacturing. Despite the well-known benefits and the availability of commercial LPBF systems on the world market, several challenges remain for LPBF to be overcome. Affordability and wide adoption of this technology is limited by the speed of part production and the maximum part size that can be manufactured [1,2,3]. One major drawback of LPBF is that the actual production of big complex parts is slow, with parts taking as much as one week or longer to produce. By improving the building rates, the cost of LPBF can be driven down further [4]. There are several ways to improve the productivity of the LPBF process; one is the increase in the number of laser systems, which can lead to a significant increase in the cost of the LPBF machine, and the second option is to utilize high-powered lasers with a beam focal spot that has a larger diameter to instantly melt a large area of powder, thus reducing the time required to scan each layer [5,6].
Increasing the layer thickness is also considered to be a key method for improving the building rate of the LPBF technology. For example, Ma et al. found that by increasing the layer thickness from 60 µm to 150 µm using 1Cr18Ni9Ti stainless steel (SS), the building rate can be increased, and the relative densities ranged from 99.3–99.8% [7]. Shi et al. used Ti6Al4V to investigate the performance of a higher layer thickness and found that the building rate can be improved by up to 7.2 mm3/s [8]. Wang et al. investigated AISI grade 316 SS powder using a layer thickness of 150 µm, and obtained a higher building rate and relative density of 12 mm3/s and 99.9%, respectively [9].
The presence of defects, often related to non-optimal processing parameters (unmolten particles, entrapped gas, and lack of fusion), also inhibit wide adoption of LPBF technology. Mower and Long found that the fatigue strength exhibited by the LPBF AlSi10Mg and Ti6Al4V in the as-built condition was significantly lower than that of conventional material because of multiple fatigue cracks initiating at the surface defects, internal voids and microcracks [10]. Razavi et al. performed fatigue assessment of the Ti6Al4V circular notched specimens produced by LPBF, and observed very low notch sensitivity attributed to both the microstructure and the surface defects induced by the LPBF process itself [11]. Similarly, Branco et al. studied the cyclic plastic behavior of the 18Ni300 maraging steel processed by LPBF, and observed cracks initiated from the surface and inner defects which propagated through the rest of the cross section [12]. Rausch et al. used numerical simulation to examine the influence of the stochastic powder bed on the process window for dense parts-an increase in the porosity and the surface roughness for samples produced with lower powder bulk densities was observed [13]. Read et al. applied statistical design of experiments to study the influence of process parameters on the porosity development in an AlSi10Mg alloy, and a two-factor interaction model showed that the laser power, scanning speed, and the interaction between the scanning speed and scan spacing have the major influence on the porosity development in the built components [14]. Guzanová et al. studied the influence of the build orientation, heat treatment, and the laser power on the hardness of Ti6Al4V alloy processed by LPBF–the influence of laser power, heat treatment, and the building direction were found to be statistically significant [15]. Lastly, Gong et al. found that the defect morphology in Ti6Al4V parts processed by LPBF and electron based powder bed fusion was mainly influenced by the process parameters as a result the variation in the molten pool [16].
In this study, we investigate the effects of using low laser power and a smaller beam diameter versus high laser power and a larger beam diameter, while maintaining the power density, on the stability and geometrical characteristics of single tracks as a first step to improving the performance of LPBF systems. When changing the process parameters, it is essential to carry out a series of experiments to study the morphology of single tracks produced using different combinations of parameters (laser power, scanning speed, spot size), since the single tracks are the base units for LPBF manufacturing. An analysis of unfavorable effects such as inconsistent melt pool formation, humping and balling effects (spheroidization of the melt pool and formation of beads), and spattering and satellites, is important for understanding the formation of 3D objects. Continuity of the track is necessary, but it is not a sufficient condition for LPBF process optimization. An analysis of cross-sections is also important in order to determine the mode of LPBF processing—i.e., keyhole, transition, or conduction—and accordingly to set optimal process parameters for effective penetration depth into the substrate (previous layer). Measuring the geometric characteristics of single tracks (width, penetration depth, height, and so on) against laser power, scanning speeds, and spot size provides information for the next steps such as hatch distance for single layers and layer thickness with respect to the penetration depth. The surface morphology of the produced single layers provides useful information about the optimal hatch distance for a chosen scanning strategy. Thus, the experiments with single tracks are the first step in a long chain for the optimization of the LPBF process.

2. Materials and Methods
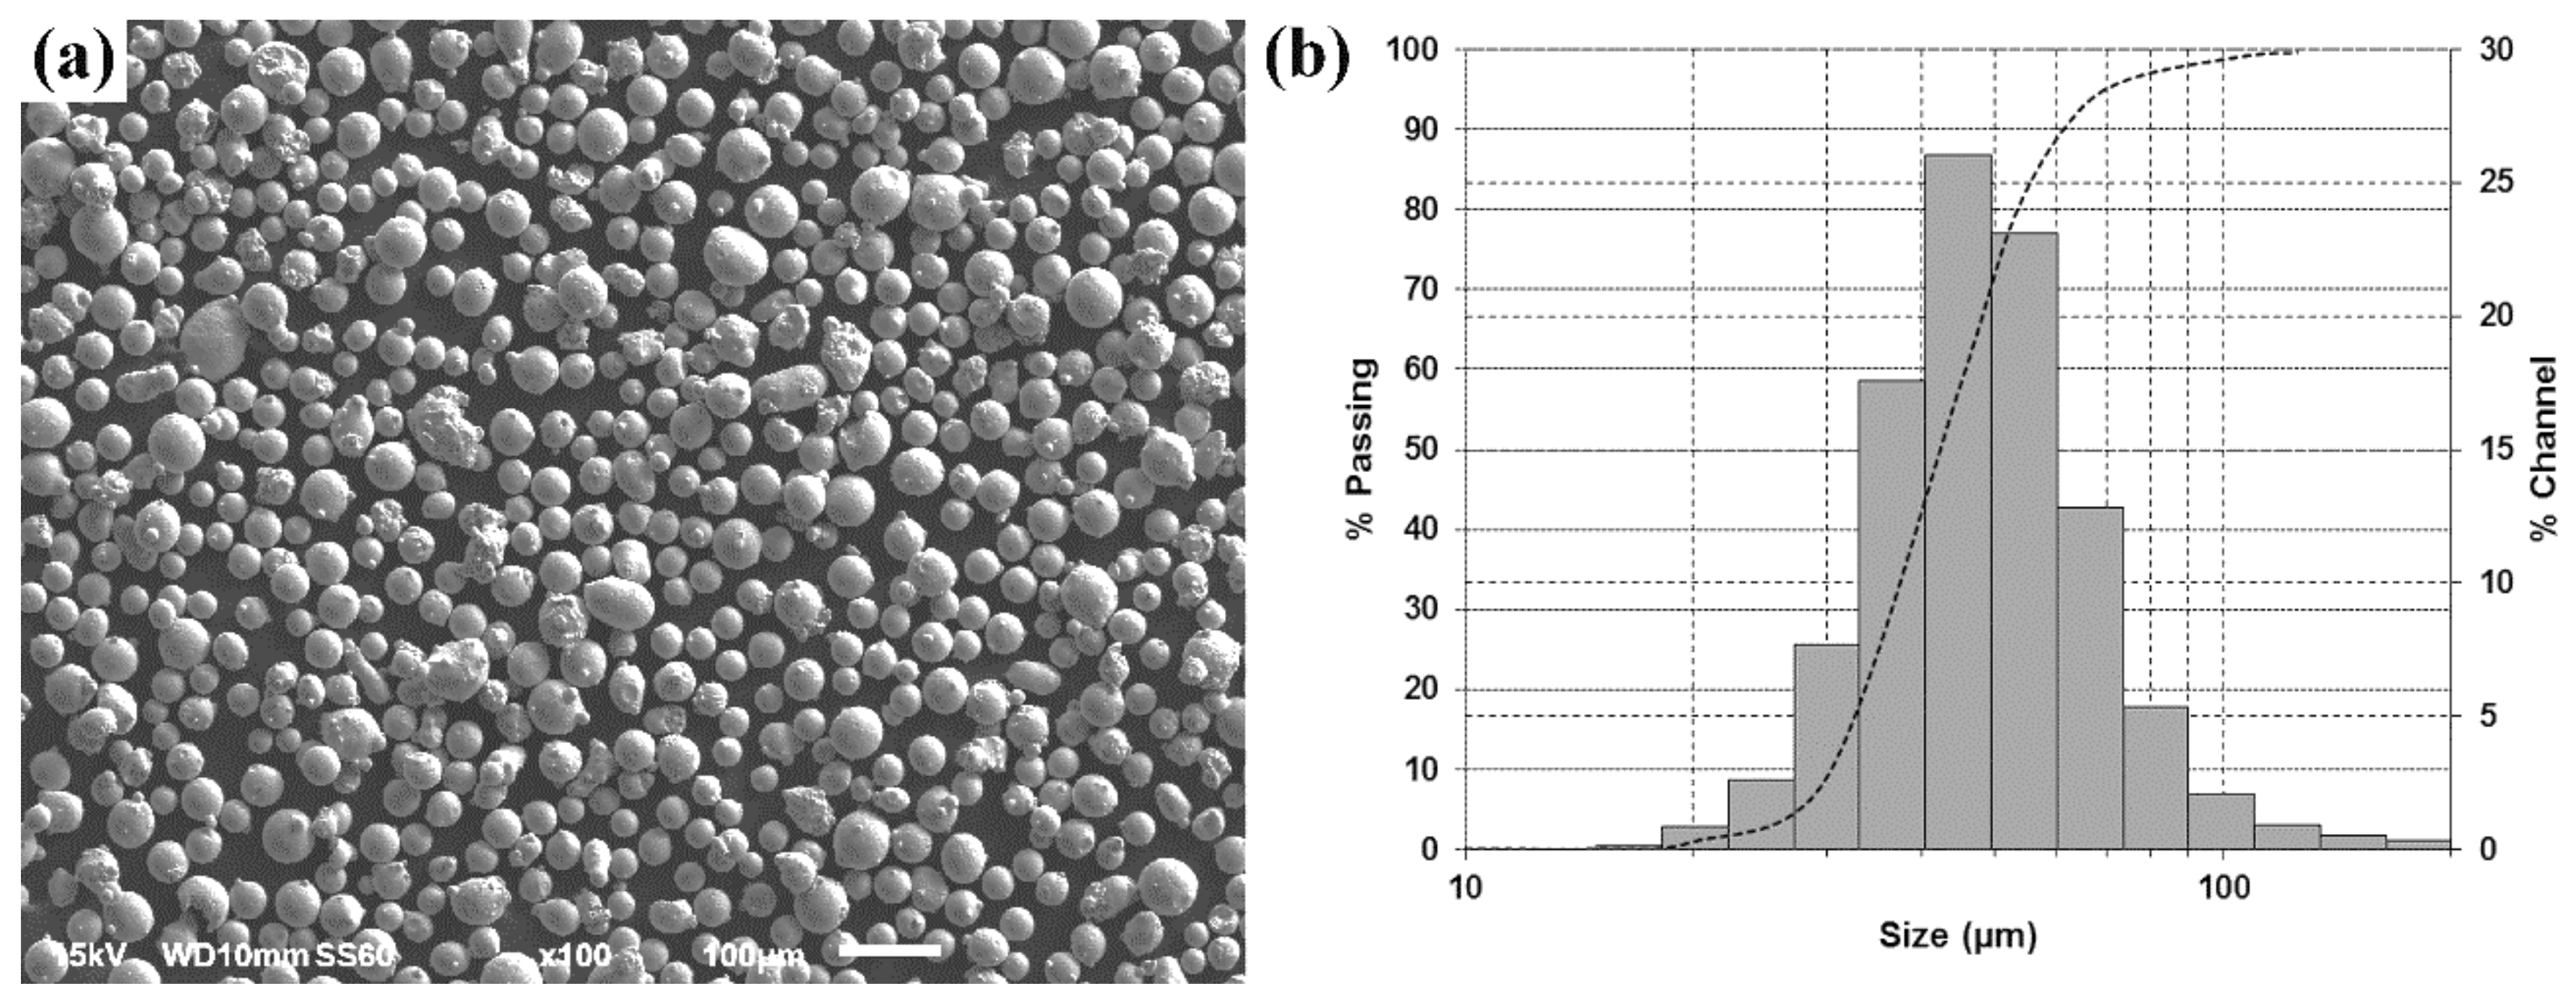
2.1. Material

Stainless steel 17-4PH powder from EOS GmbH (Krailling, Germany) was used to conduct the experiments, with the nominal composition as follows in weight percent (wt. %): Cr-15.79, Ni-4.10, Cu-3.65, Si-0.029, Mn-0.046, C-0.005, Nb + Ta-0.32, P-0.01, and S < 0.005. The powder was gas-atomized, and most particles were fairly spherical with smooth surfaces (Figure 1a). Particle size distribution of the powder obtained using Microtac Bluewave/S3500-SDC (Microtac, SD, USA) was found in the range from 20 µm to approximately 100 µm (Figure 1b). The 10th, 50th, and 90th percentiles of the equivalent diameters were D10 = 30.5 µm, D50 = 40.3 µm, and D90 = 64.1 µm, respectively. The substrate material had a similar composition to that of the powder.
The choice of 17-4PH SS was industrially driven due to its outstanding combination of high strength, good corrosion resistance, and good mechanical properties up to 300 °C, making it highly attractive for industries such as aerospace.

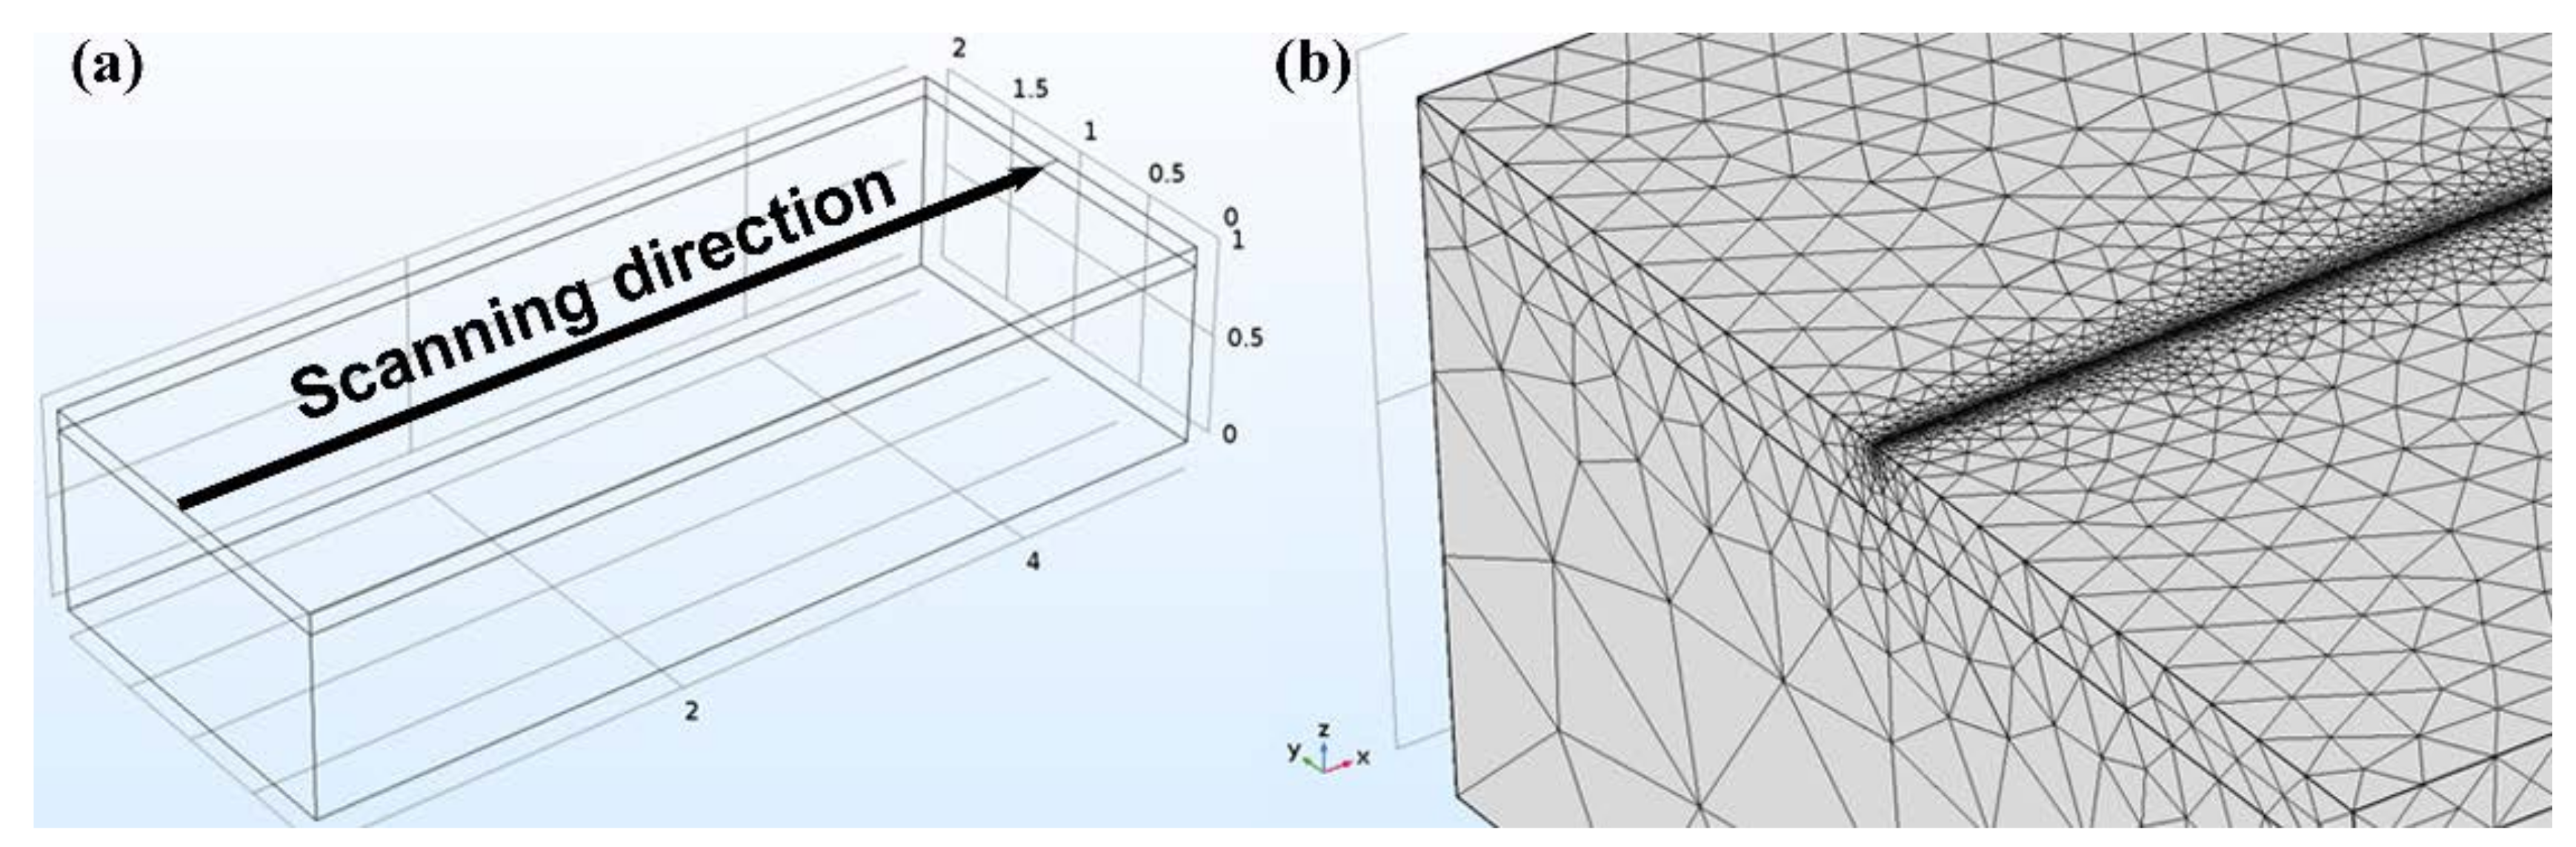
2.2. Experimental Methods

Two LPBF systems operating independently were used to produce the single tracks on a solid substrate deposited with a thin powder layer of 17-4PH stainless steel. One system is a commercial LPBF machine, EOSINST M280 (EOS GmbH, Krailling, Germany), equipped with a single-mode continuous-wave Ytterbium fibre laser operating at 1075 nm wavelength and 80 µm spot size. The second setup is an in-house built LPBF system equipped with a multi-mode continuous-wave Ytterbium fibre laser operating at 1071 nm and a focused beam diameter of 240 µm. In both cases, single tracks were formed by varying the laser power density between 19.9–59.7 kW/mm2. The build chamber was filled with an argon protective atmosphere to prevent oxidation. Table 1 presents the design of experiments involving both systems. The powder layer thickness was about 50 µm.
The temperature-dependent properties of the 17-4PH stainless steel from Comsol material database (COMSOL Multiphysics® Version 5.2a, Comsol Inc., Burlington, MA, USA) were used for numerical simulations of single tracks produced by a moving laser beam with a Gaussian energy distribution on the substrate using Comsol ‘Heat Transfer in Solids’ module. A 3D conductive model was investigated for the solid block with 100 µm upper layer with finer mesh. Around the scanning line, mesh size was extremely fine with a maximum size of 5 µm and a minimum of 0.1 µm. The geometry of the sample and the meshed model are presented in Figure 2.
The evolution of the temperature due to heat conduction was as follows:
( k T ) + q = ρ C p T t
The laser beam heat source has Gaussian distribution in the radial direction with exponential decay in the thickness direction [17], as shown below:
q = 2 P ( 1 R ) β π r 0 2 e 2 ( ( x V t ) 2 + y 2 ) r 0 2 β z
where T is the temperature; t is the time; ρ is the density; Cp is the specific heat capacity; k is the thermal conductivity; P is the laser power; R is the surface reflectivity for the given wavelength; β is the coefficient of absorption; r0 is the characteristic radius of the laser beam; x, y, z are dimensional values; and V is the scanning speed.
The thermal conductivity was 0.0162T + 5.5817 W/(m·K); specific heat capacity was chosen as 0.963743T − 14.57509 J/(kg·K) for 273 K < T < 954 K; 725 J/(kg·K) for the temperature range of 954 K; and 0.3961449T + 153.2494 J/(kg·K) for 996 K < T < 1474 K with extrapolation for higher temperatures as a constant value. The density for temperatures up to 1550 K was 7906.957 − 0.4706124T + 4.471352 × 10⁻⁴T2 − 2.789323 × 10⁻⁷T3 + 2.245476 × 10⁻¹¹T4 kg/m3. Surface reflectivity was 0.65, while the coefficient of absorption was chosen as 106 m–1.
The initial and boundary conditions were as follows: initial (T0) and external (Text) temperatures were assumed to equal 293 K; all surfaces except the upper surface were thermally insulated. The heat transfer coefficient of 10 W/m2K was taken into account for the top surface heat loss:
q 0 = h × ( T e x t T )
The general approach, meshed model geometry, and boundary conditions were similar to those published in previous works [18]. The simulated molten pool dimensions were compared to the experimental results.

3. Results and Discussion

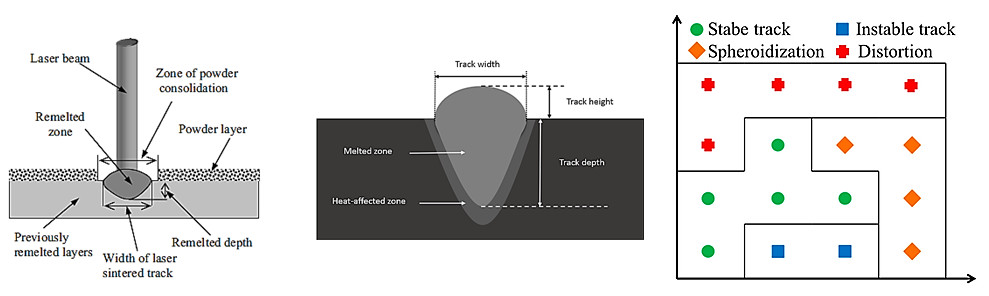
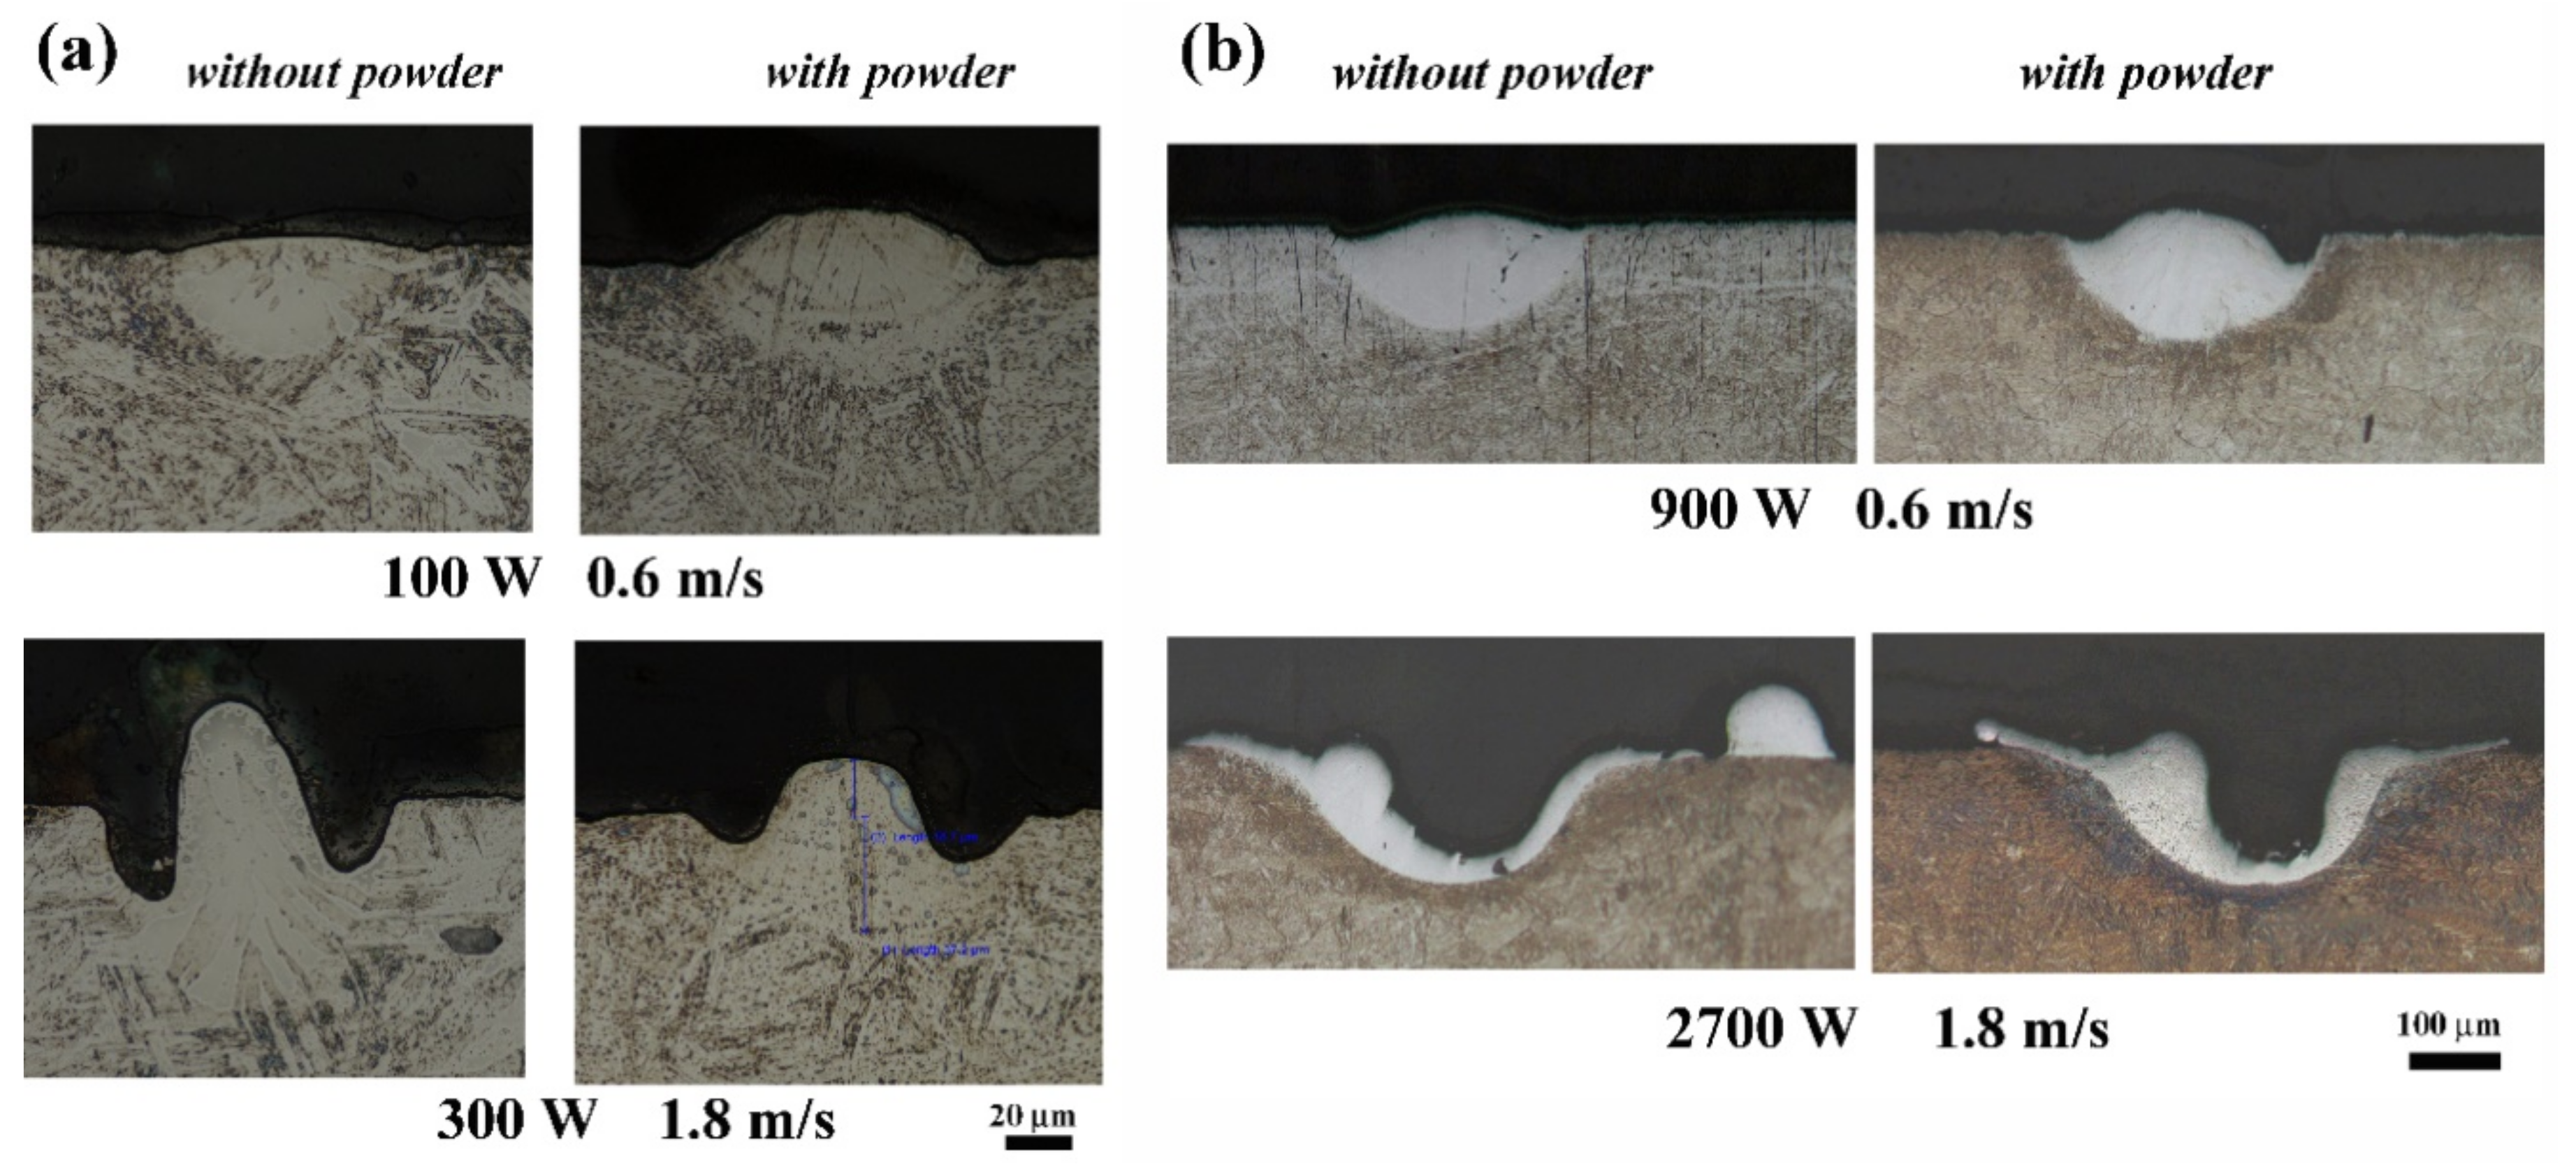
3.1. Surface Morphology and Melt Pool Profiles: Experimental Results

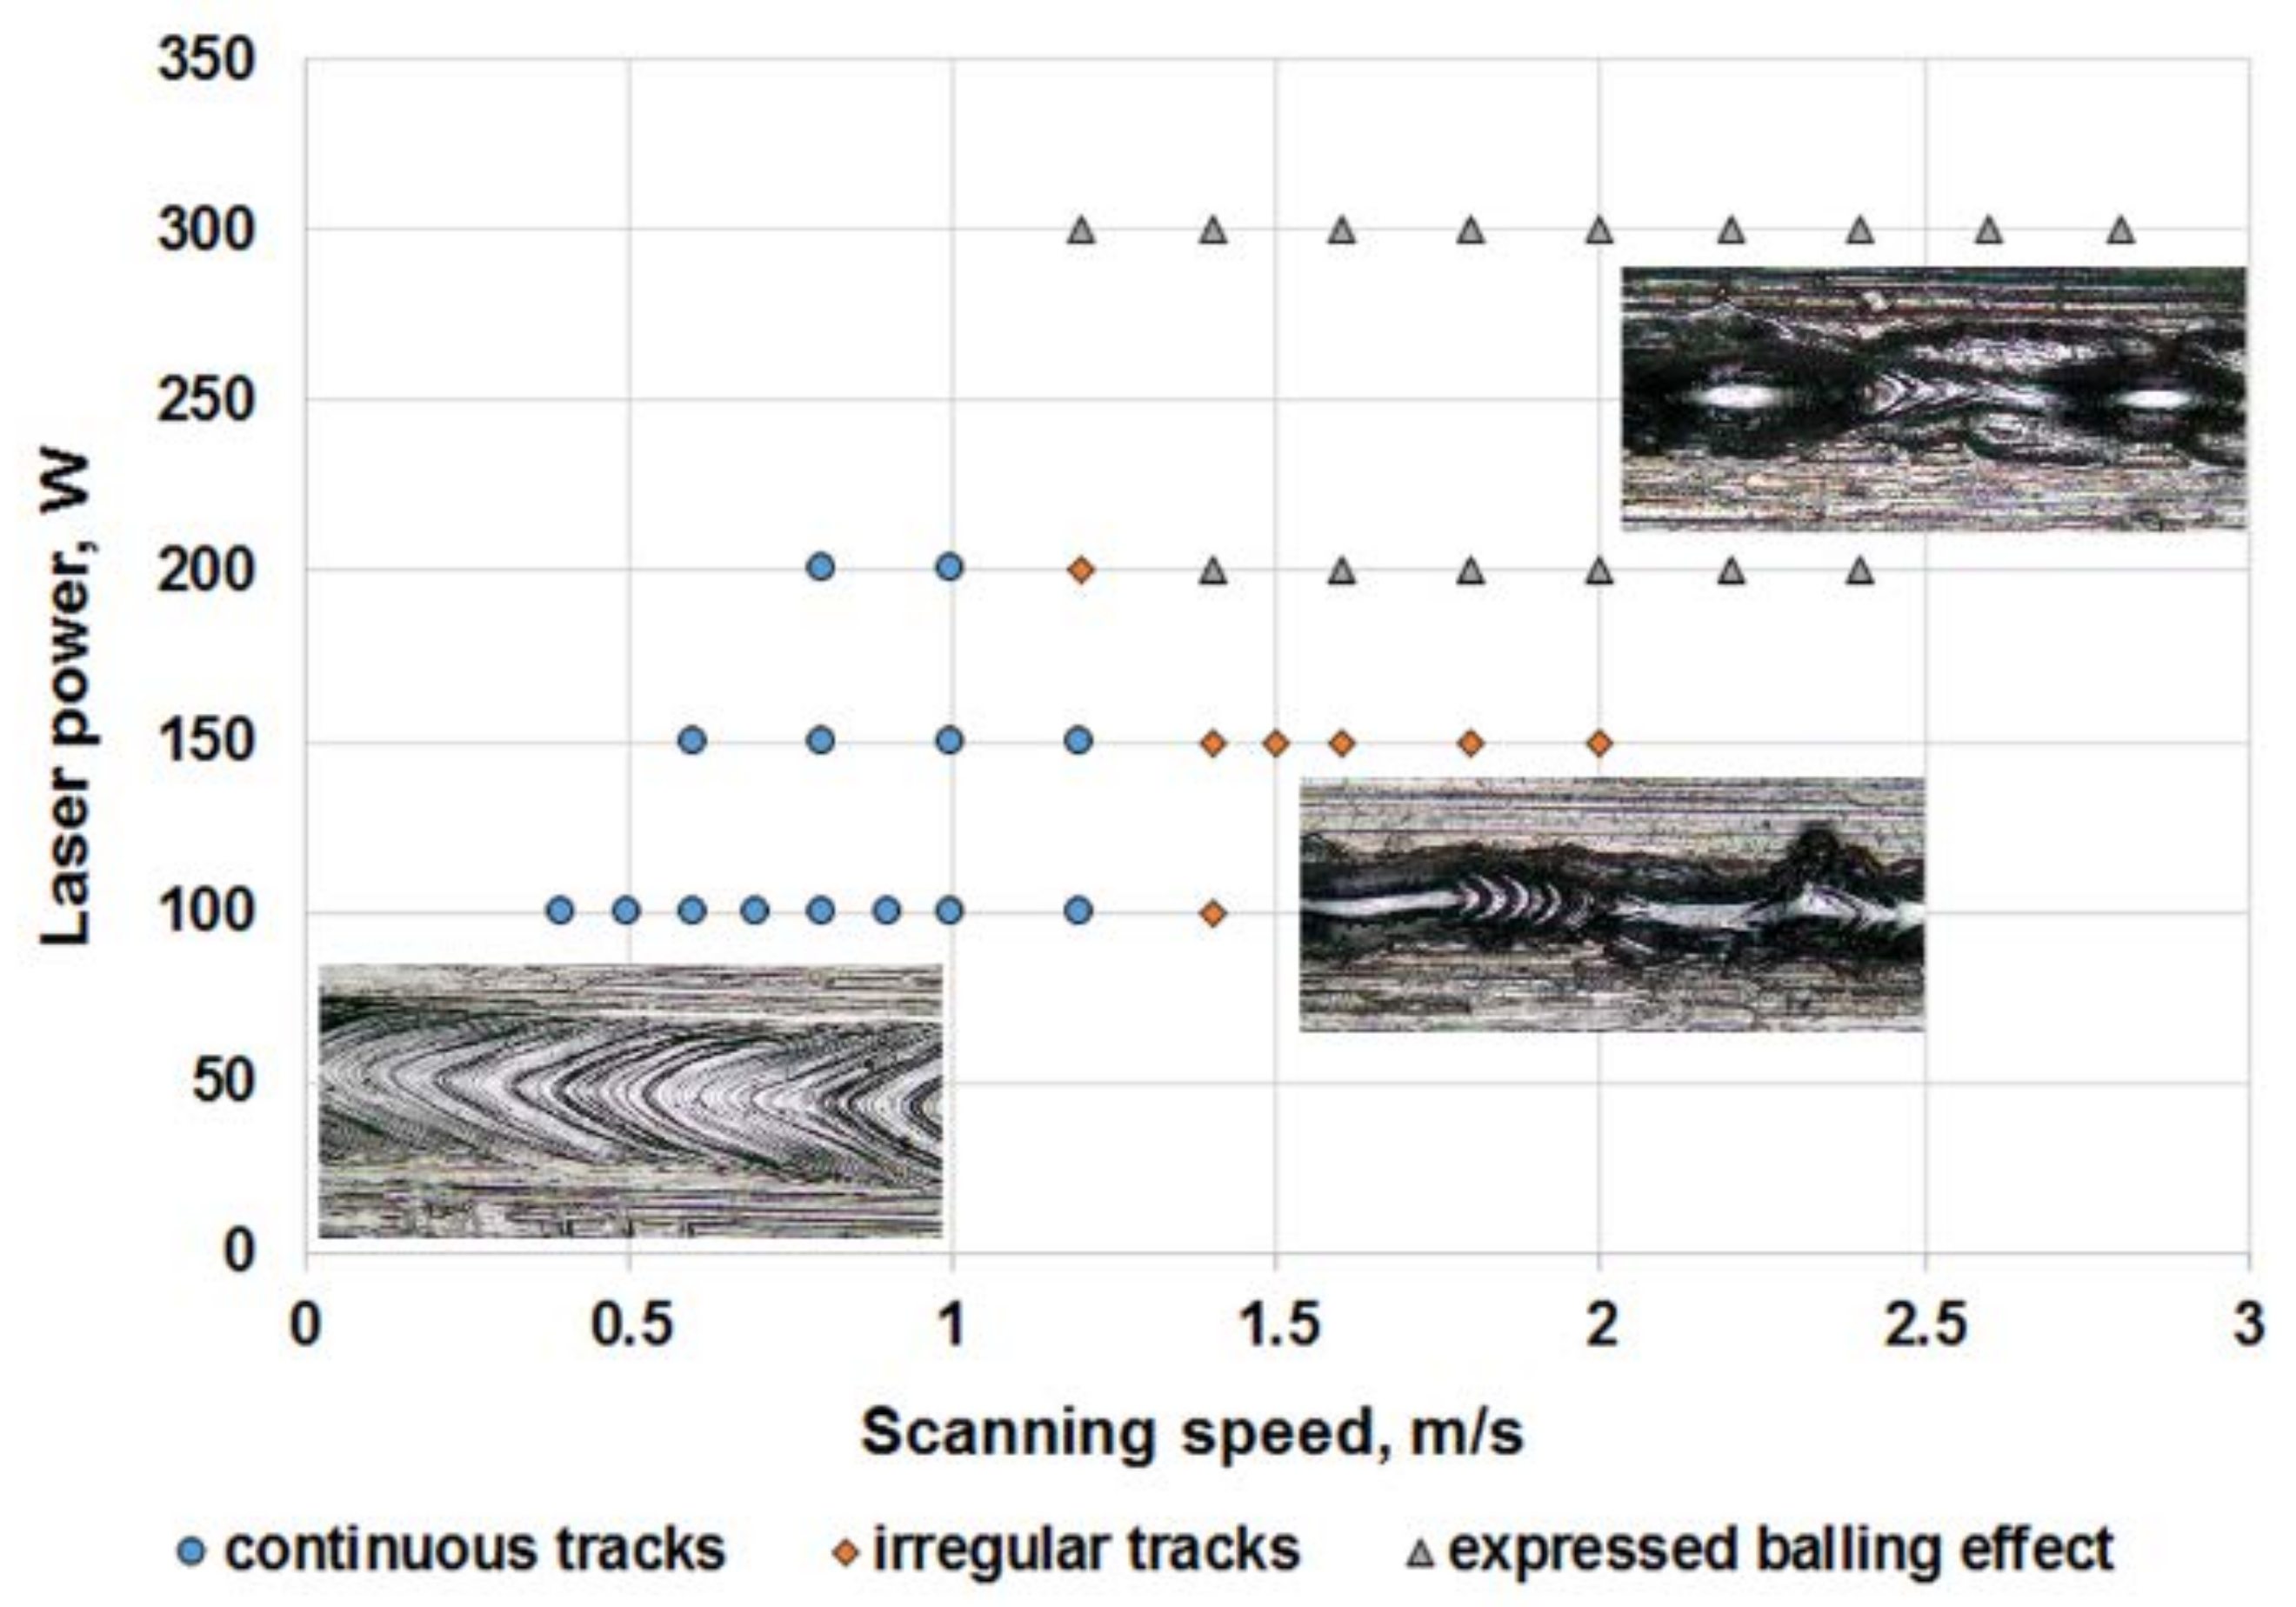
3.1.1. Low-Power System

Figure 3 summarises the low-power system results, which indicate dissimilar surface morphology for single tracks formed using different combinations of laser power and scanning speed. Three distinctive morphologies were observed at different laser powers and scanning speeds: continuous tracks with stable geometrical characteristics, irregular tracks (pre-balling effect), and tracks with an expressed balling effect. The single tracks formed were fairly continuous when the laser power and scanning speed were varied between 100–200 W and 0.4–1.2 m/s, respectively. Irregular tracks caused by strong dynamical melt flow, were formed at higher scanning speeds greater than 1.2 m/s. The balling effect was observed when the laser power and scanning speed were varied between 200–300 W and 1.4–2.8 m/s, respectively.

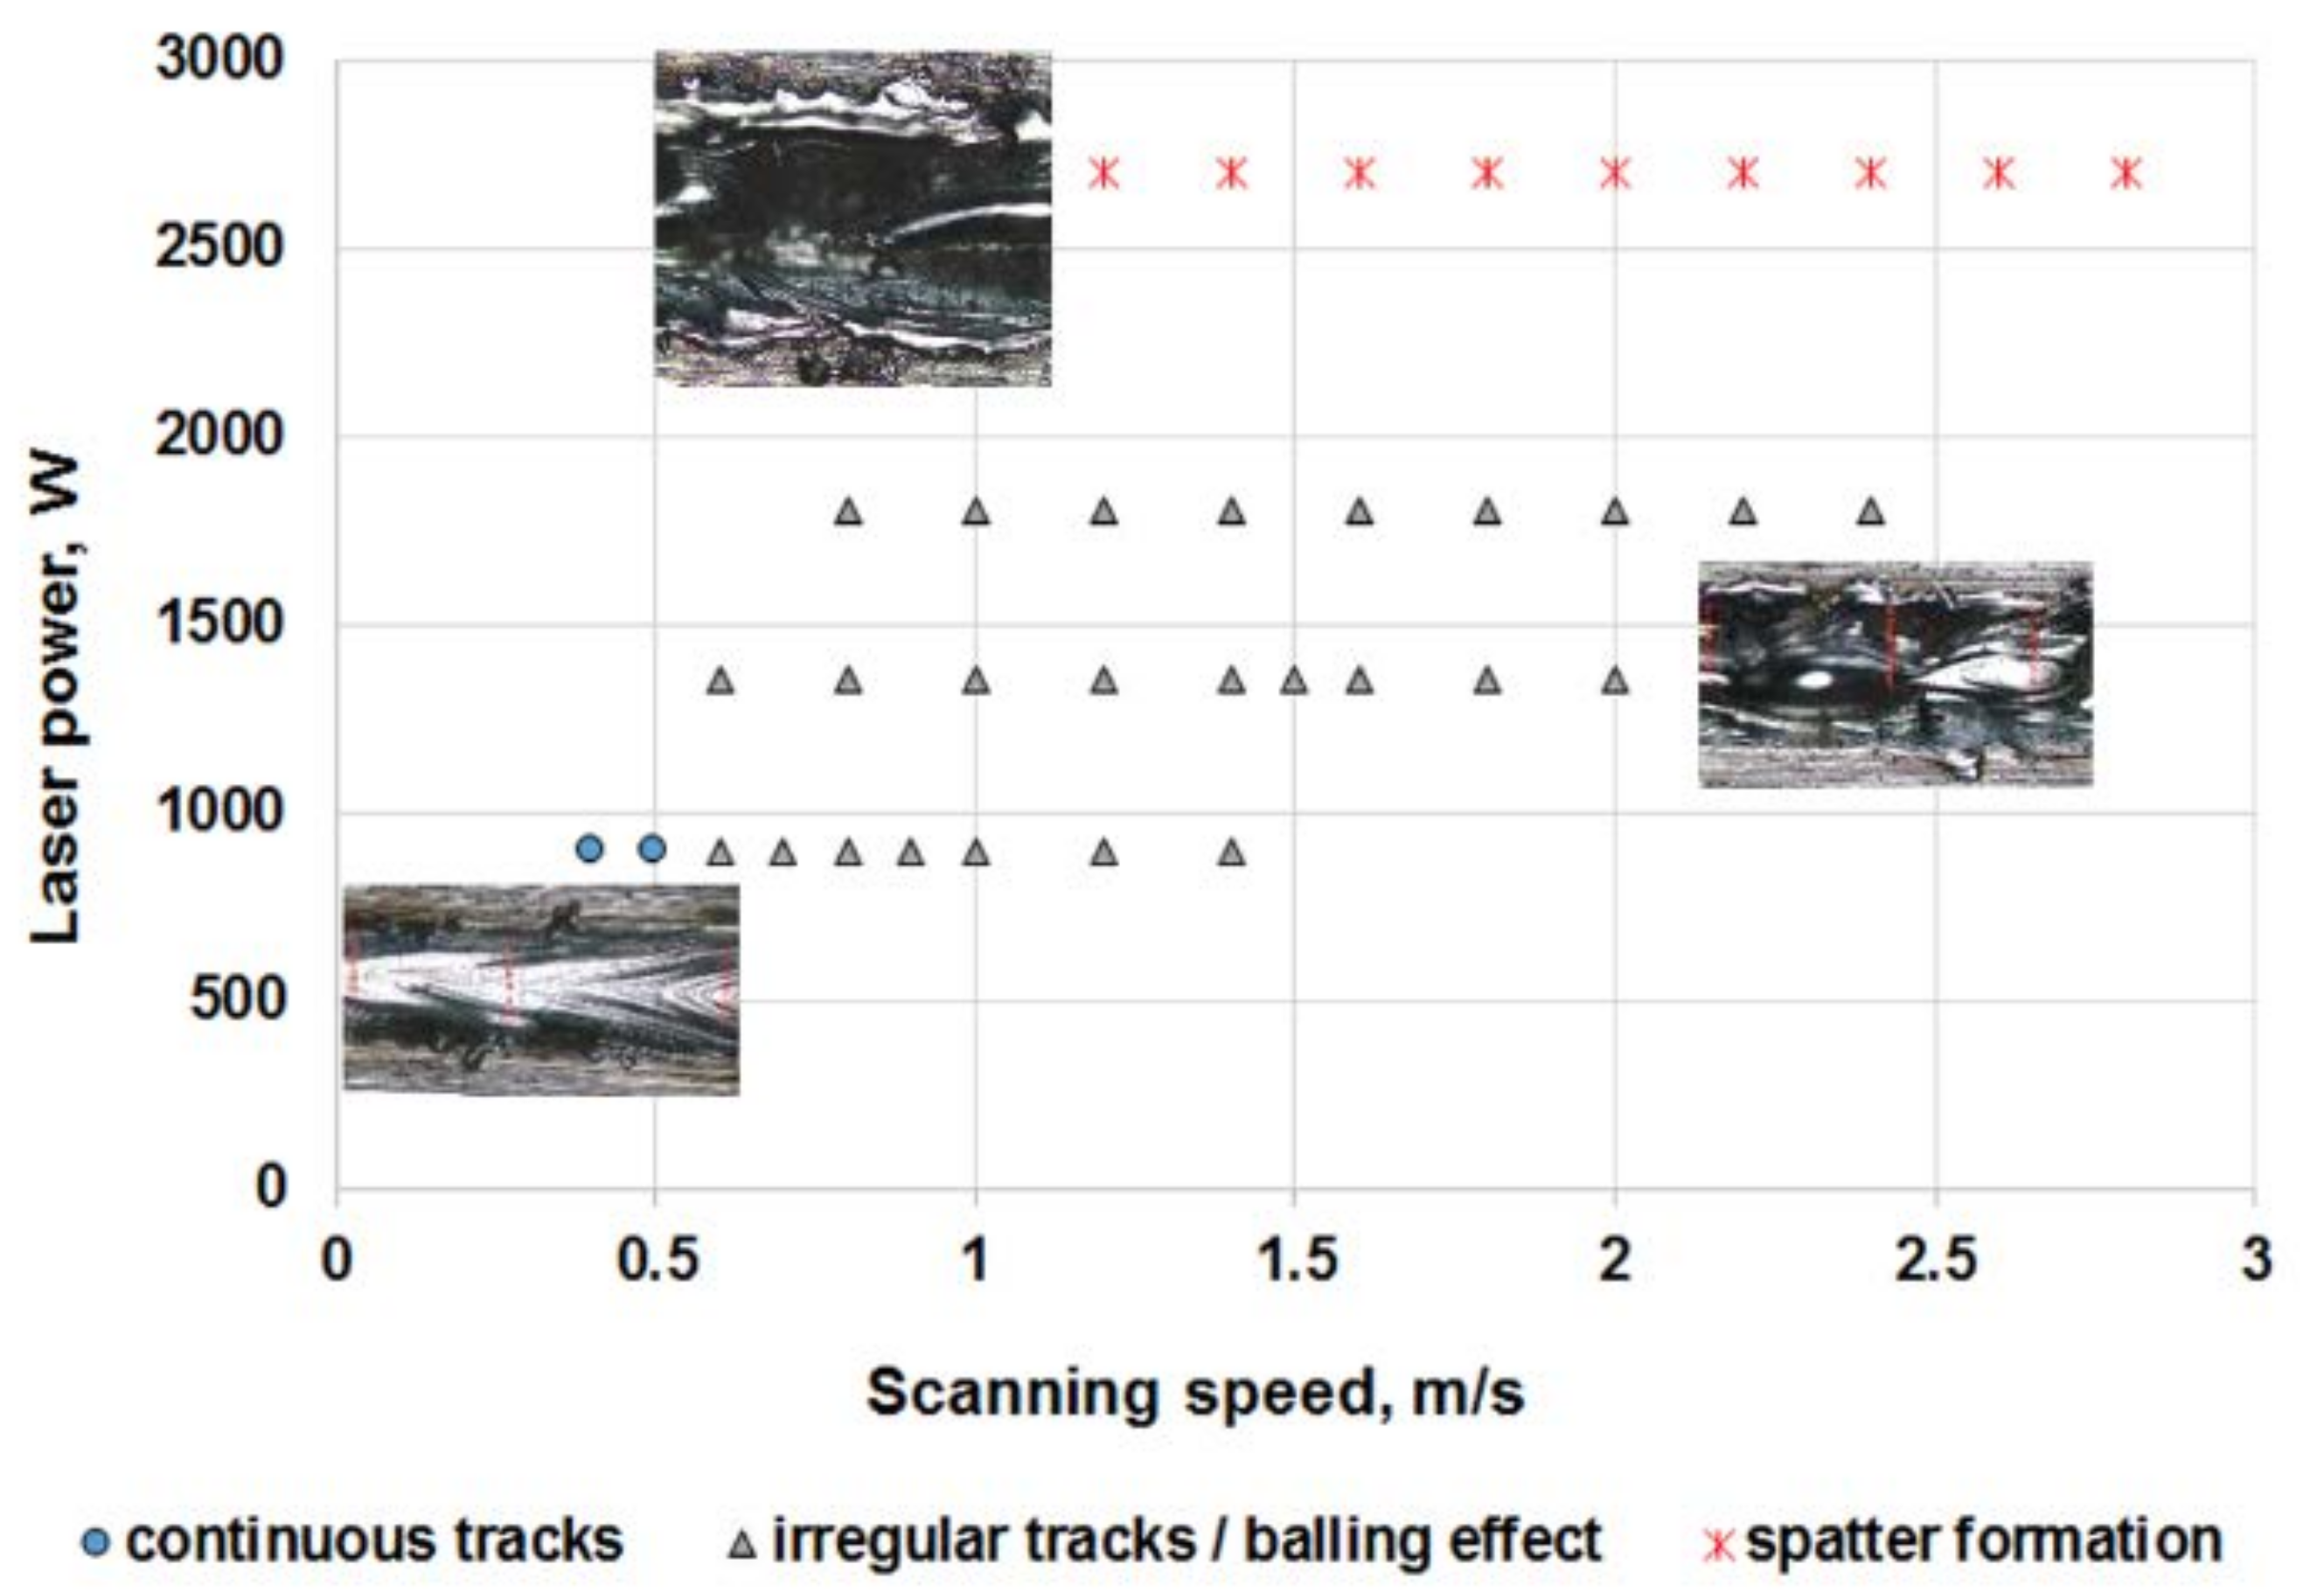
3.1.2. High-Power System

For the high-power system, continuous stable tracks were formed only at 900 W when the scanning speed varied between 0.4–0.5 m/s. The balling effect and spatter formation were revealed at all other sets of process parameters (Figure 4 and Figure 5). These results clearly show that the maximum scanning speed for the formation of a continuous track with stable geometrical characteristics was reduced when a larger beam diameter was used. In comparison, at 80 µm beam diameter, the maximum scanning speed was 1.2 m/s, whereas for the larger beam diameter employed here, the maximum scanning speed was 0.5 m/s, which is 2.4 times slower. It should be noted that with an increase in the laser spot diameter from 80 µm to 240 µm, at correspondent optimal scanning speeds, the time of interaction of laser radiation with the powder increased by 7.2 times, and the linear laser energy input increased from 83–125 J/m for 100–150 W laser power to 1800 J/m at 900 W for stable tracks (Table 1).
The formation of irregular tracks in LPBF can occur as a result of Plateau-Rayleigh capillary instability of the molten pool [19,20]. Thermo-capillary force and recoil pressure induced by the material evaporation are the major driving forces for the melt flow and are the reasons for the formation of irregular tracks [21]. The gradient in the surface tension driven by random attachment of the molten pool to the partially melted particles near the boundaries also causes irregularities [22]. Ambient gas pressure is another influencing factor on the shape of the tracks [23]. The balling effect occurs as a result of the molten pool attempting to find an optimum geometry upon the break-up of a liquid cylinder, and poor wetting of the solid substrate beneath [24]. In other words, the material tends to reach an optimum value between surface area and volume due to surface tension and wetting. Thus, the formation of irregular tracks can be considered as the culmination of a complex hydrodynamic phenomenon occurring in LPBF. These statements are supported by an analysis of cross-sections of produced single tracks without and with powder delivered on the substrate. Without powder, when the laser beam melts the solid substrate, an instable molten pool and a humping effect was found (Figure 5). Similar to welding, instabilities were provoked by differences in gas/liquid velocities and pressures, density and surface tension gradients [25].
Since the 240 µm beam diameter is three times bigger than 80 µm spot size, the time of interaction also increases by three times at the same scanning speed. Longer periods of interaction combined with higher laser power lead to an increased temperature up to boiling point. The recoil pressure creates the depression and spattering of the molten pool (Figure 5b), and this confirms the results of numerical simulation by Khairallah et al. [26] where similar profiles of molten pools were presented.

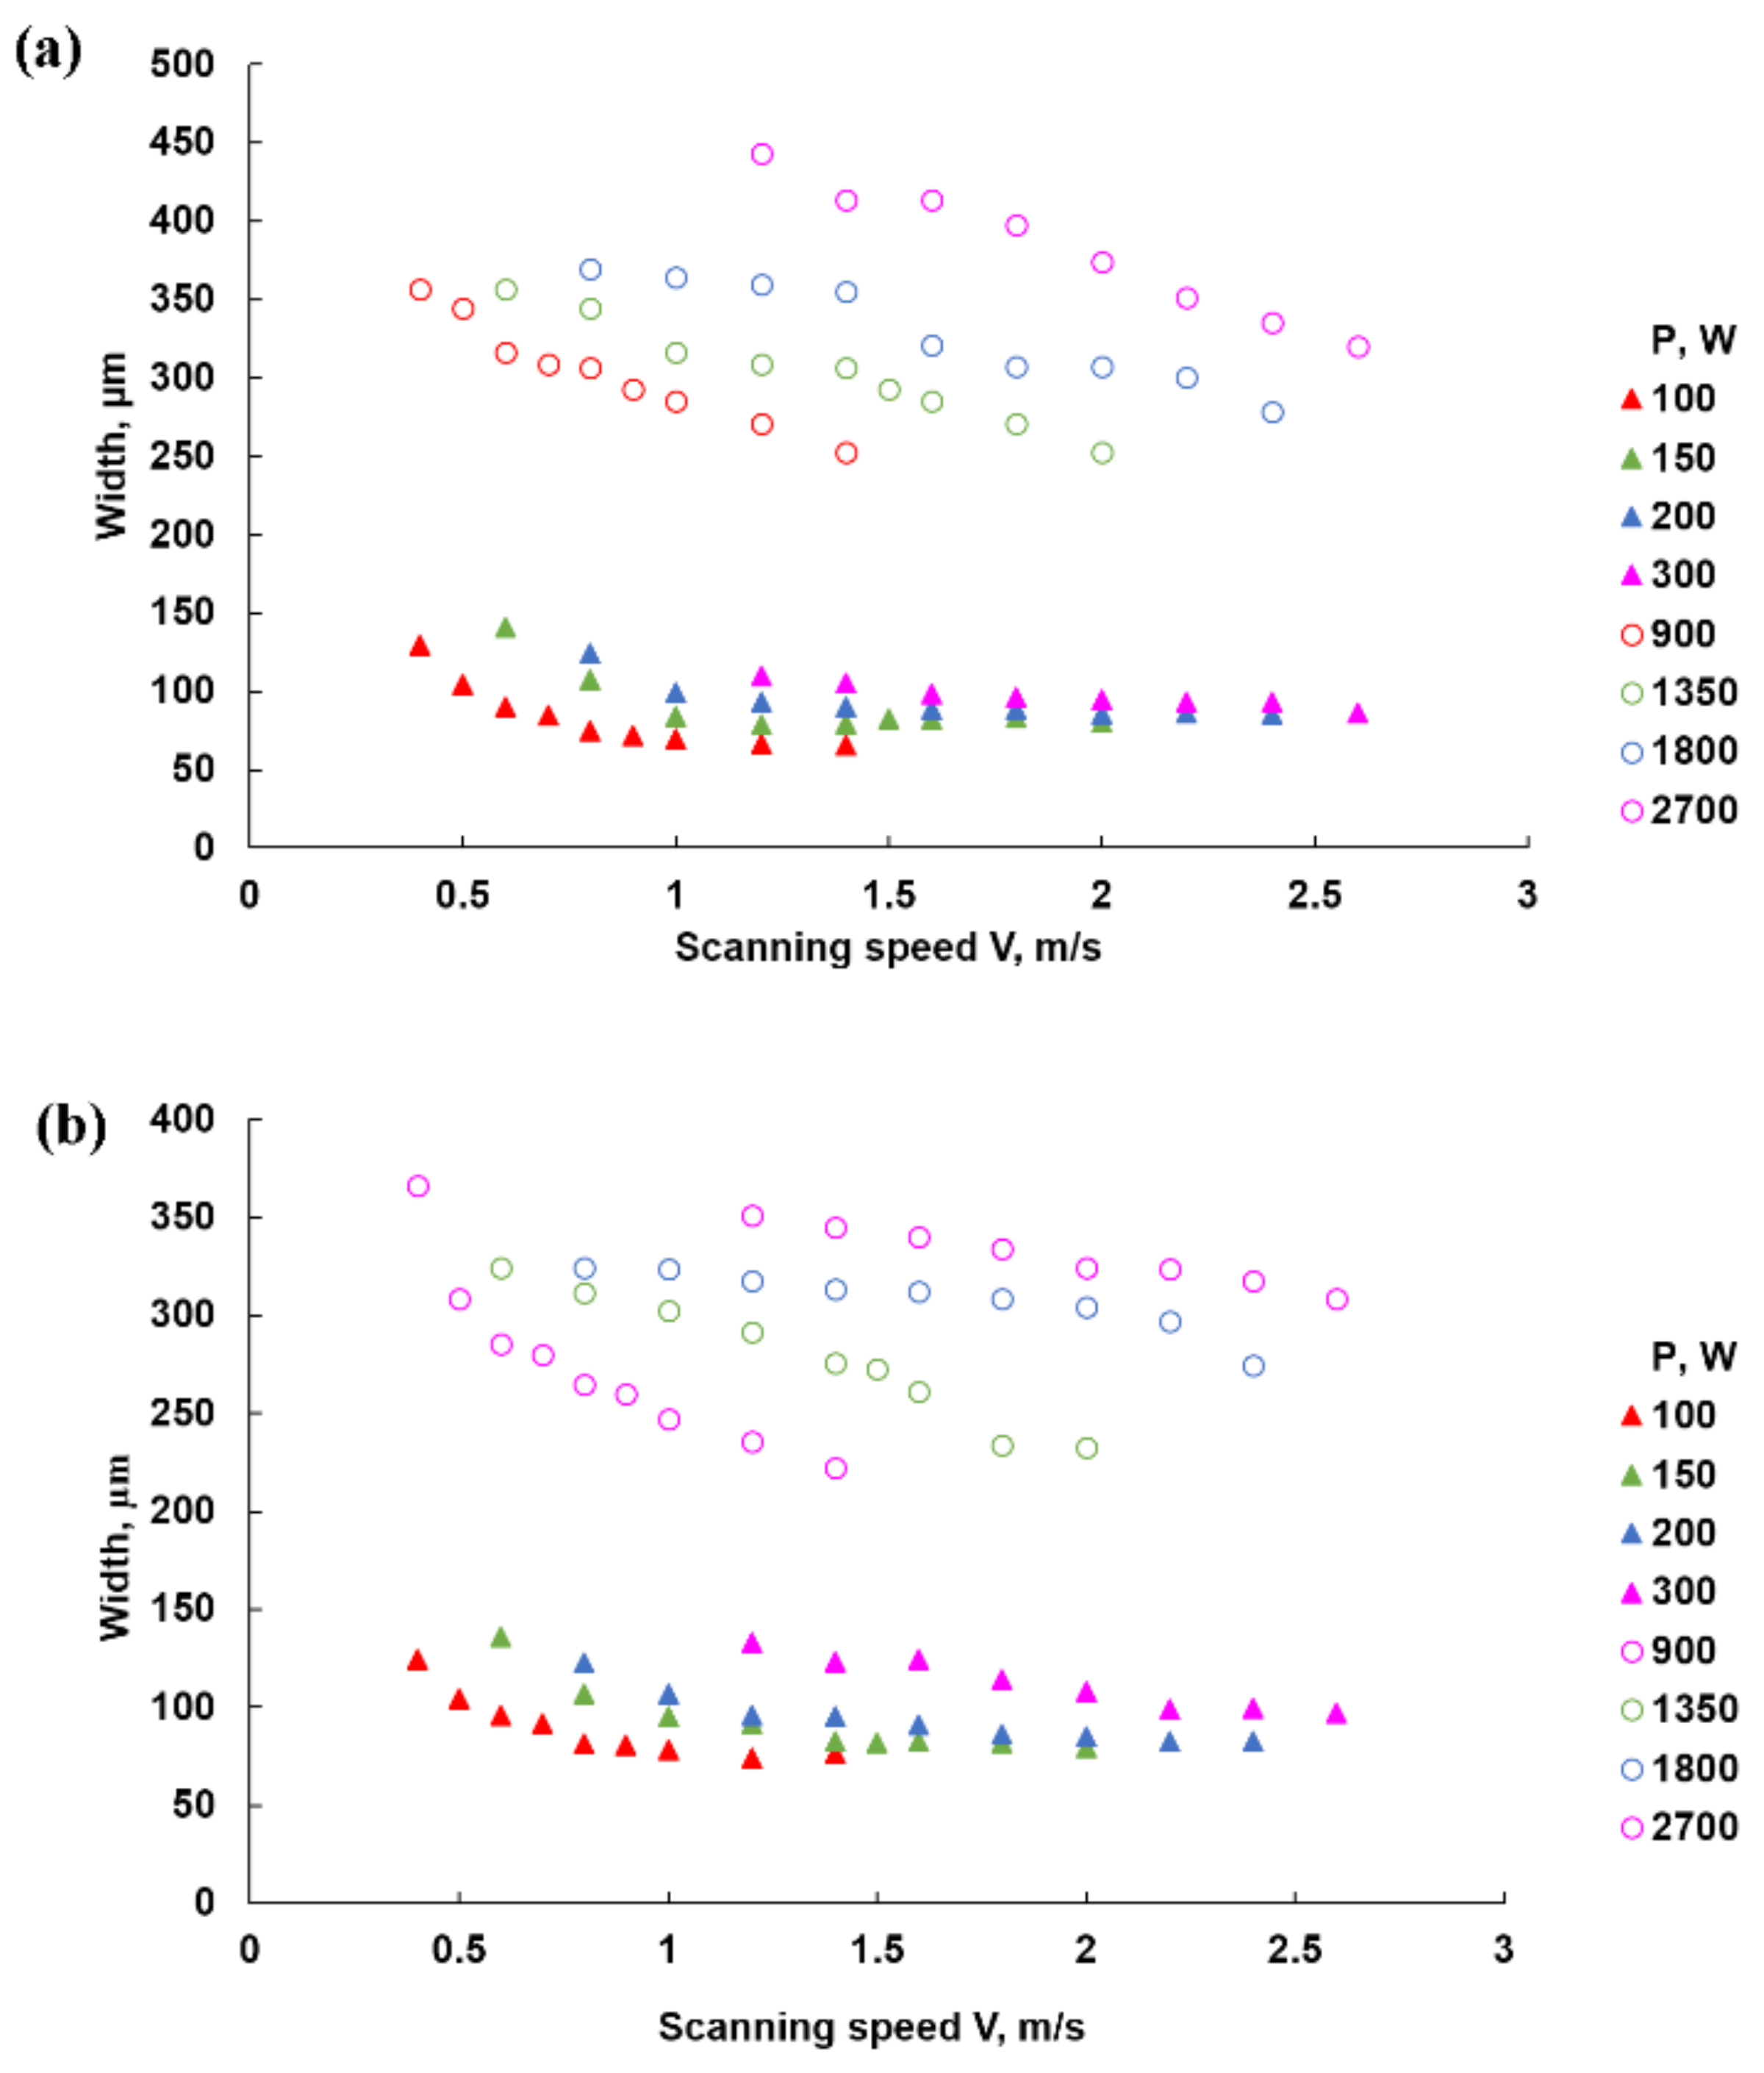
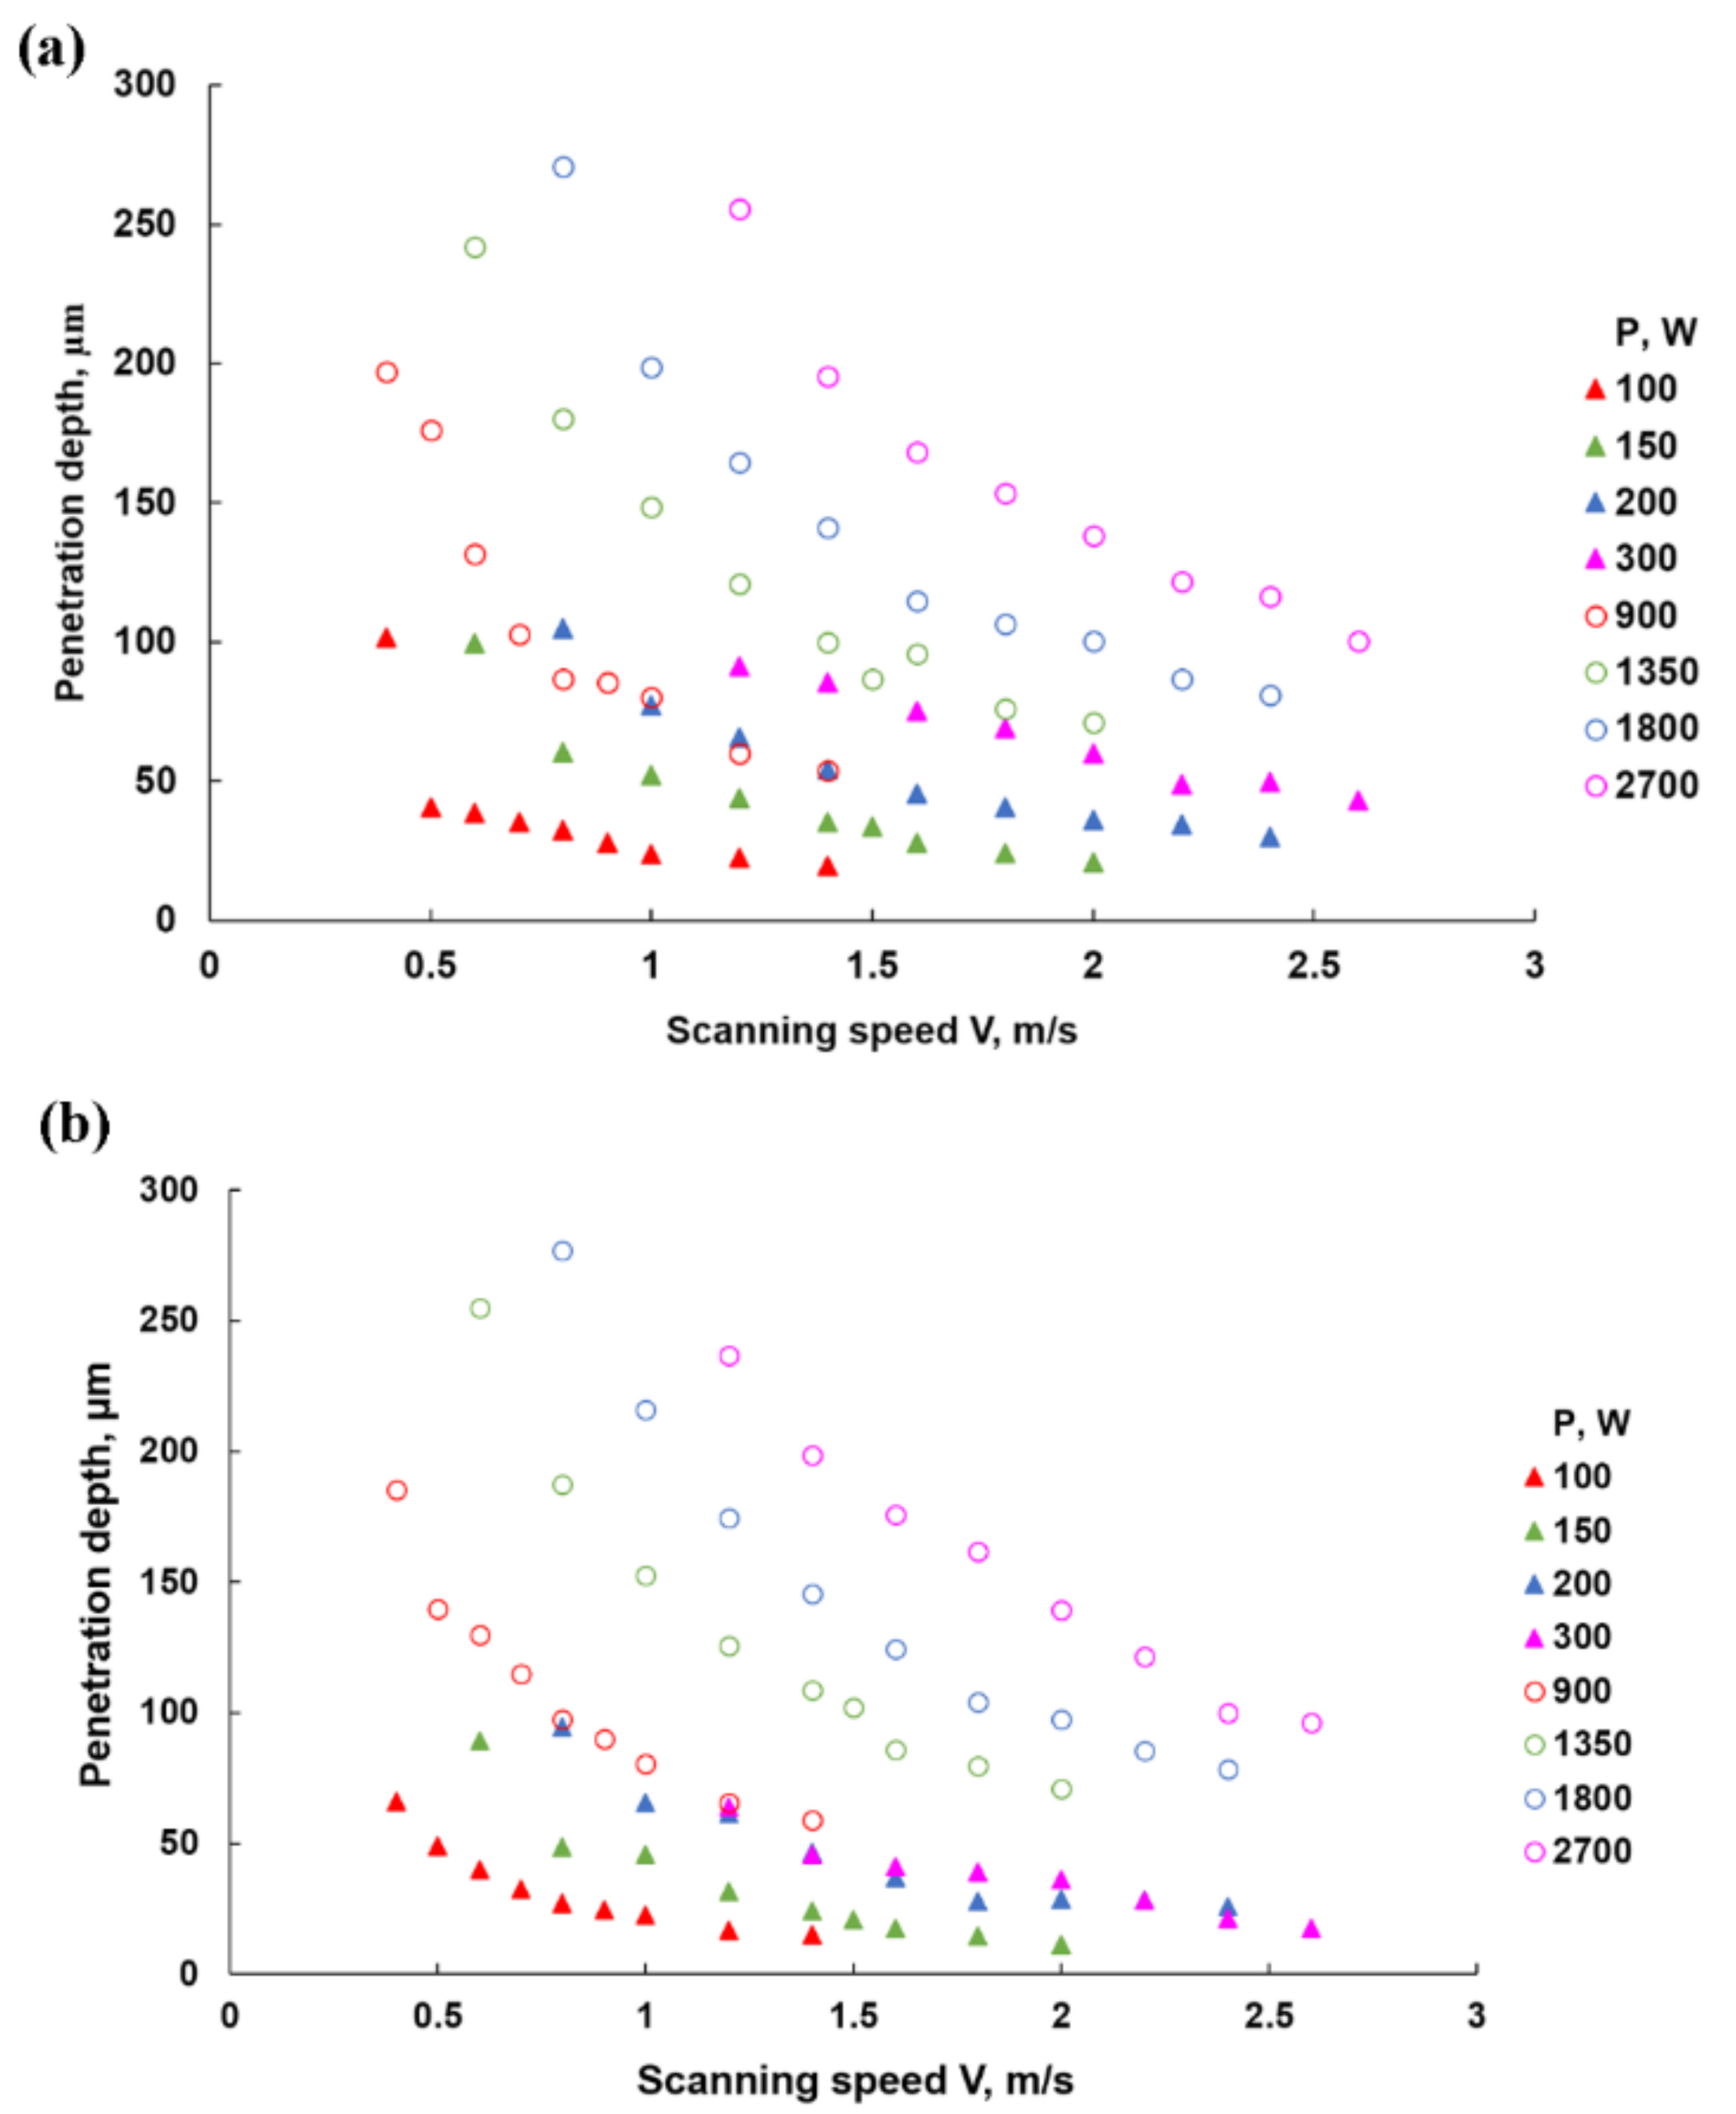
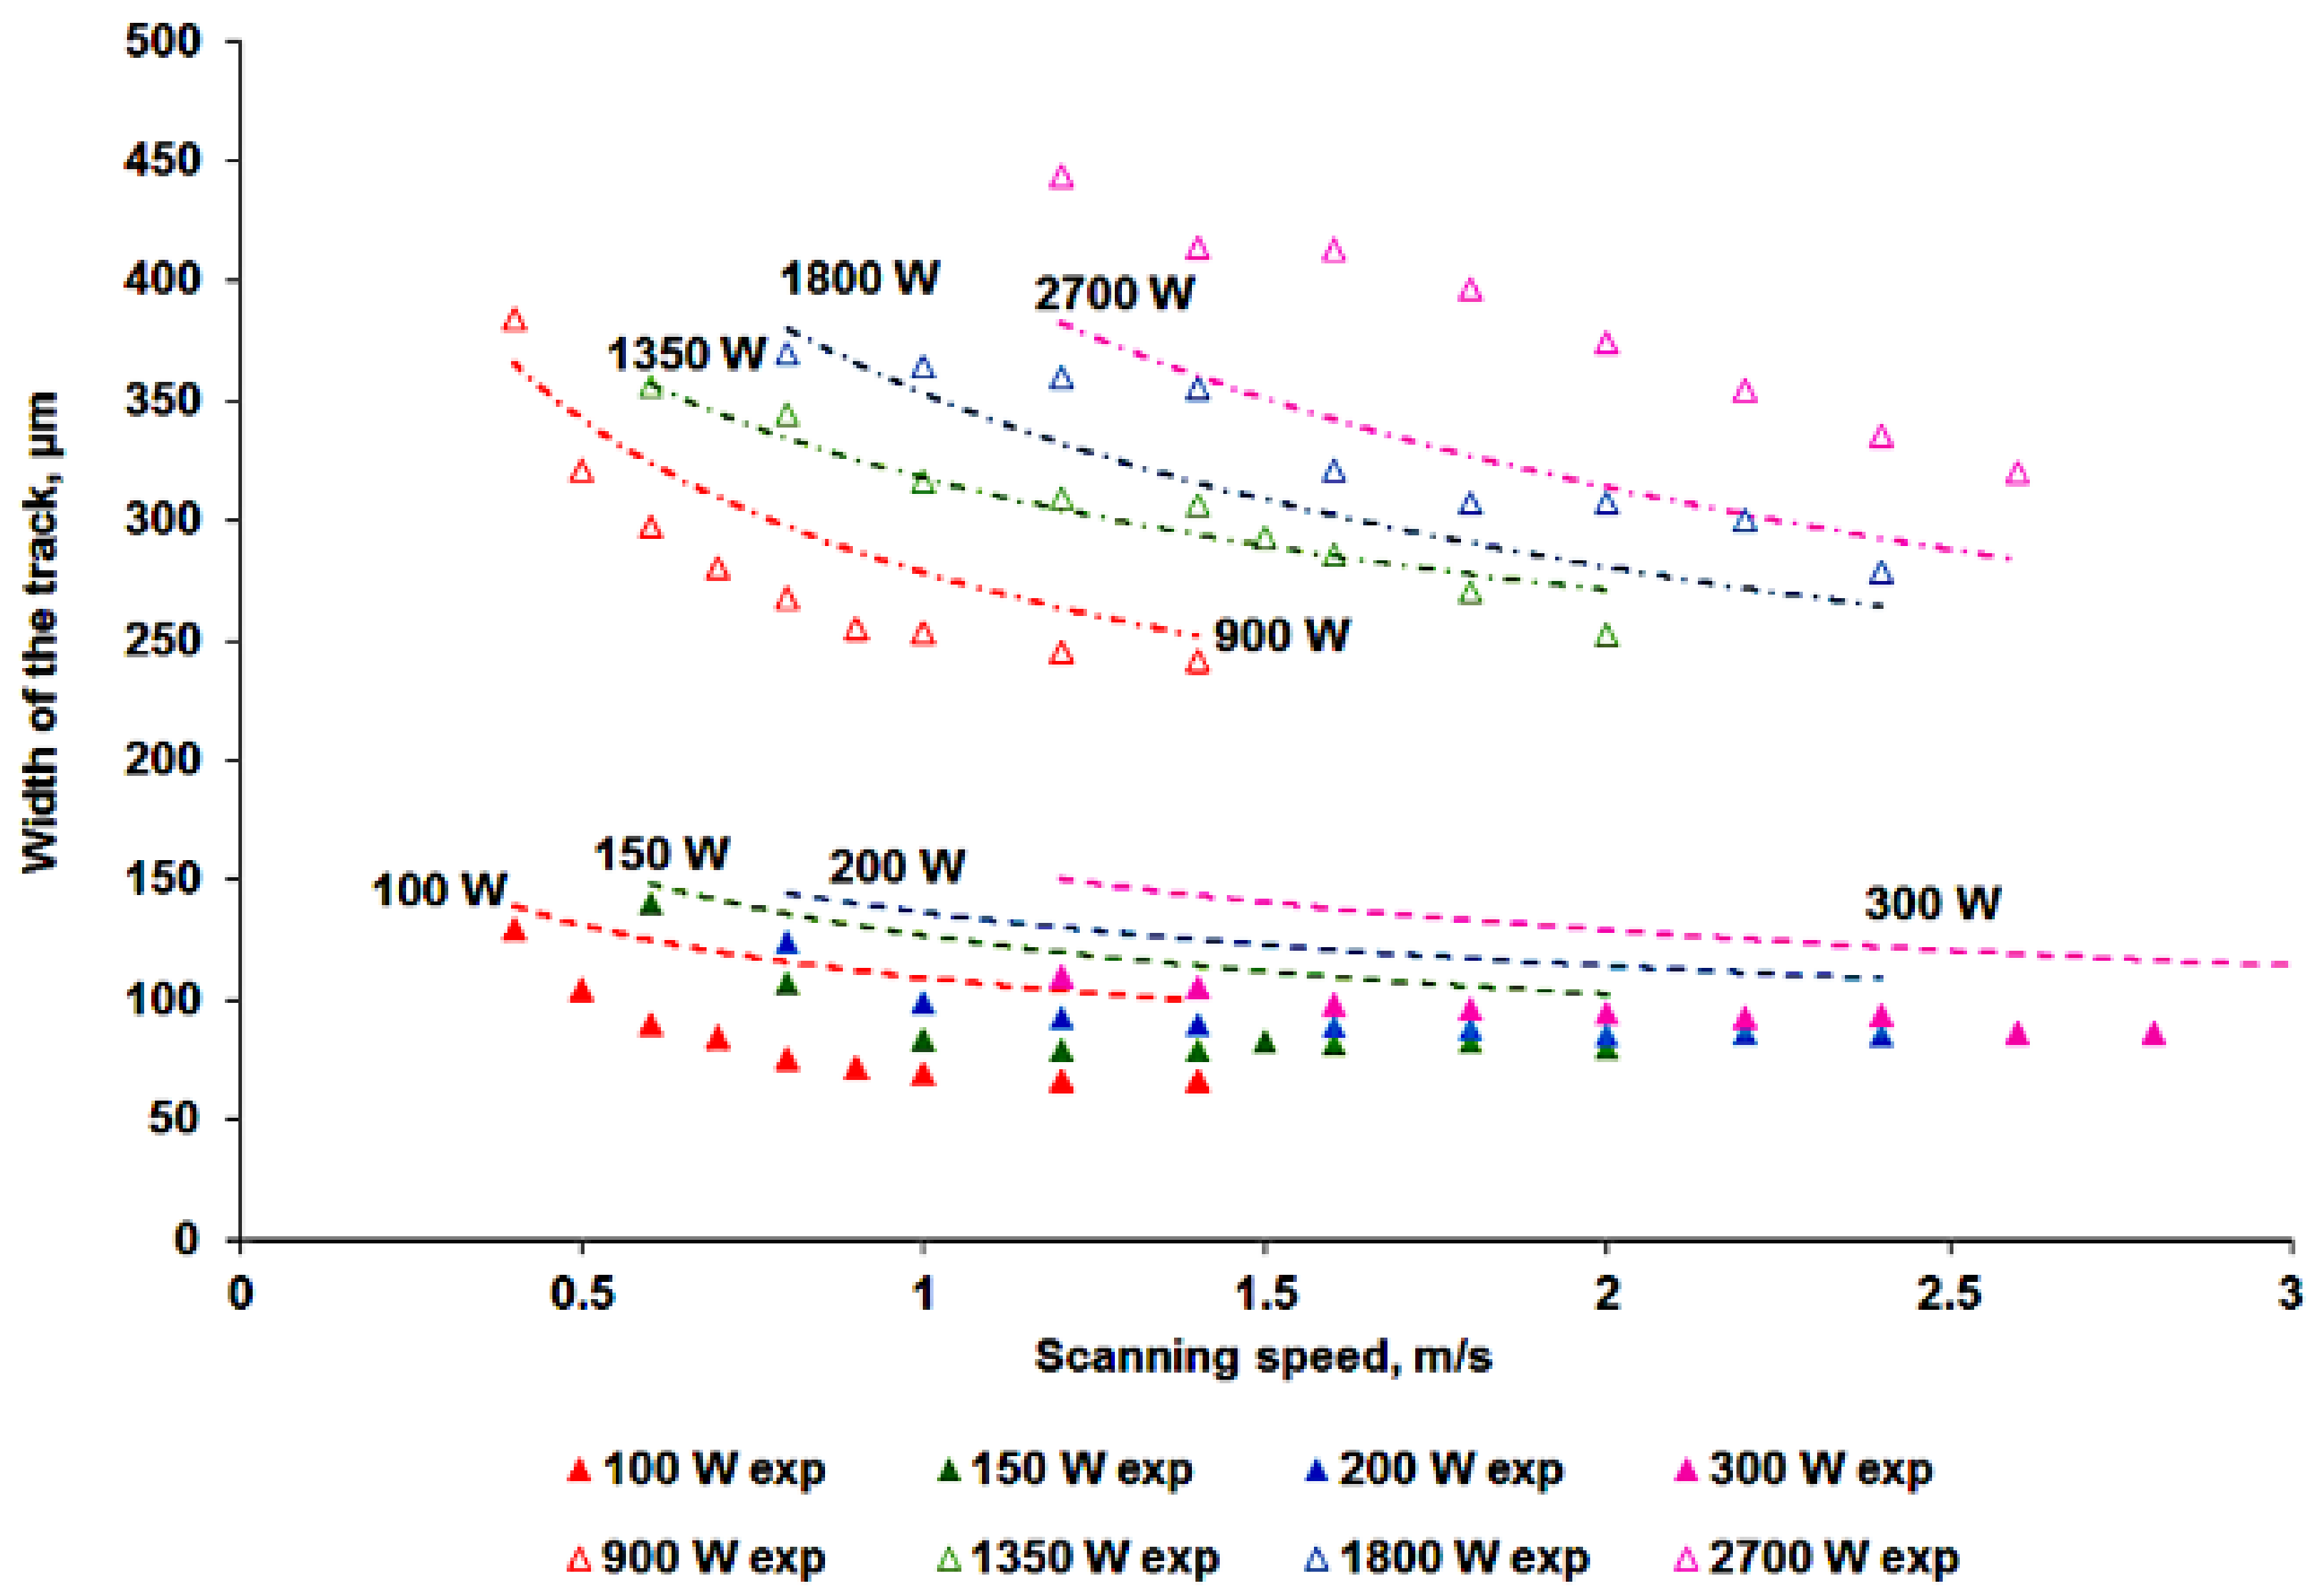
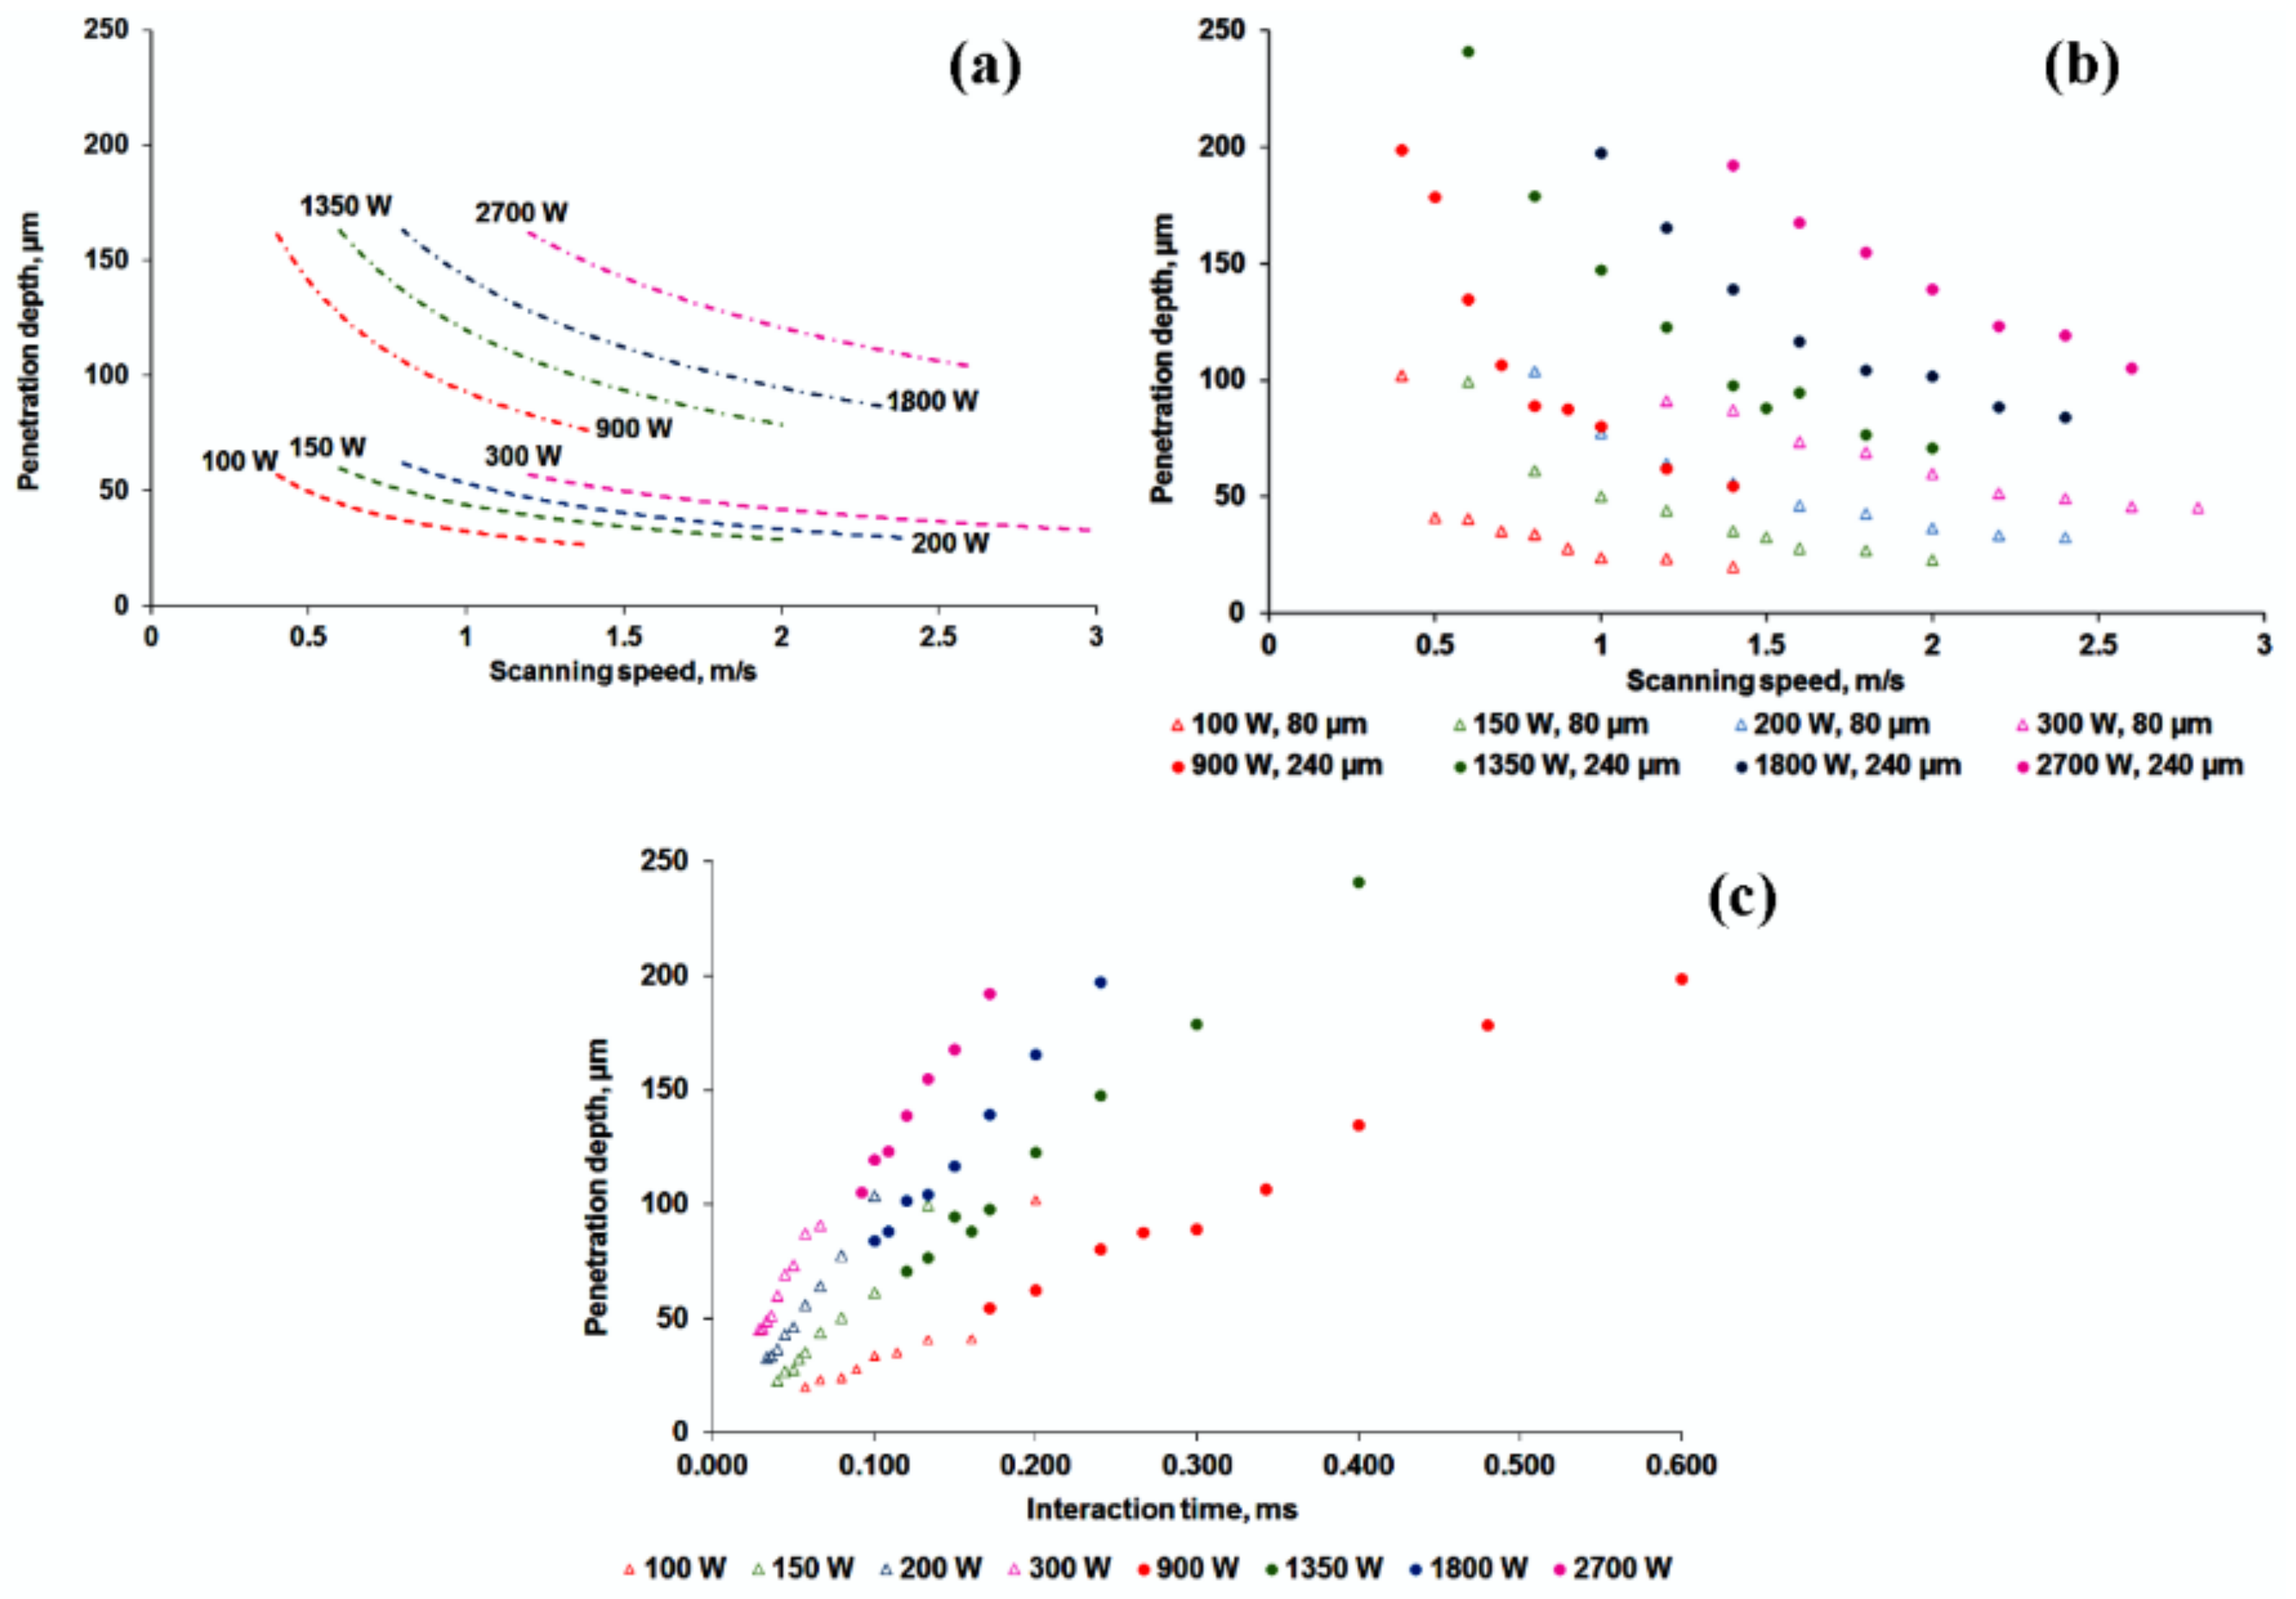
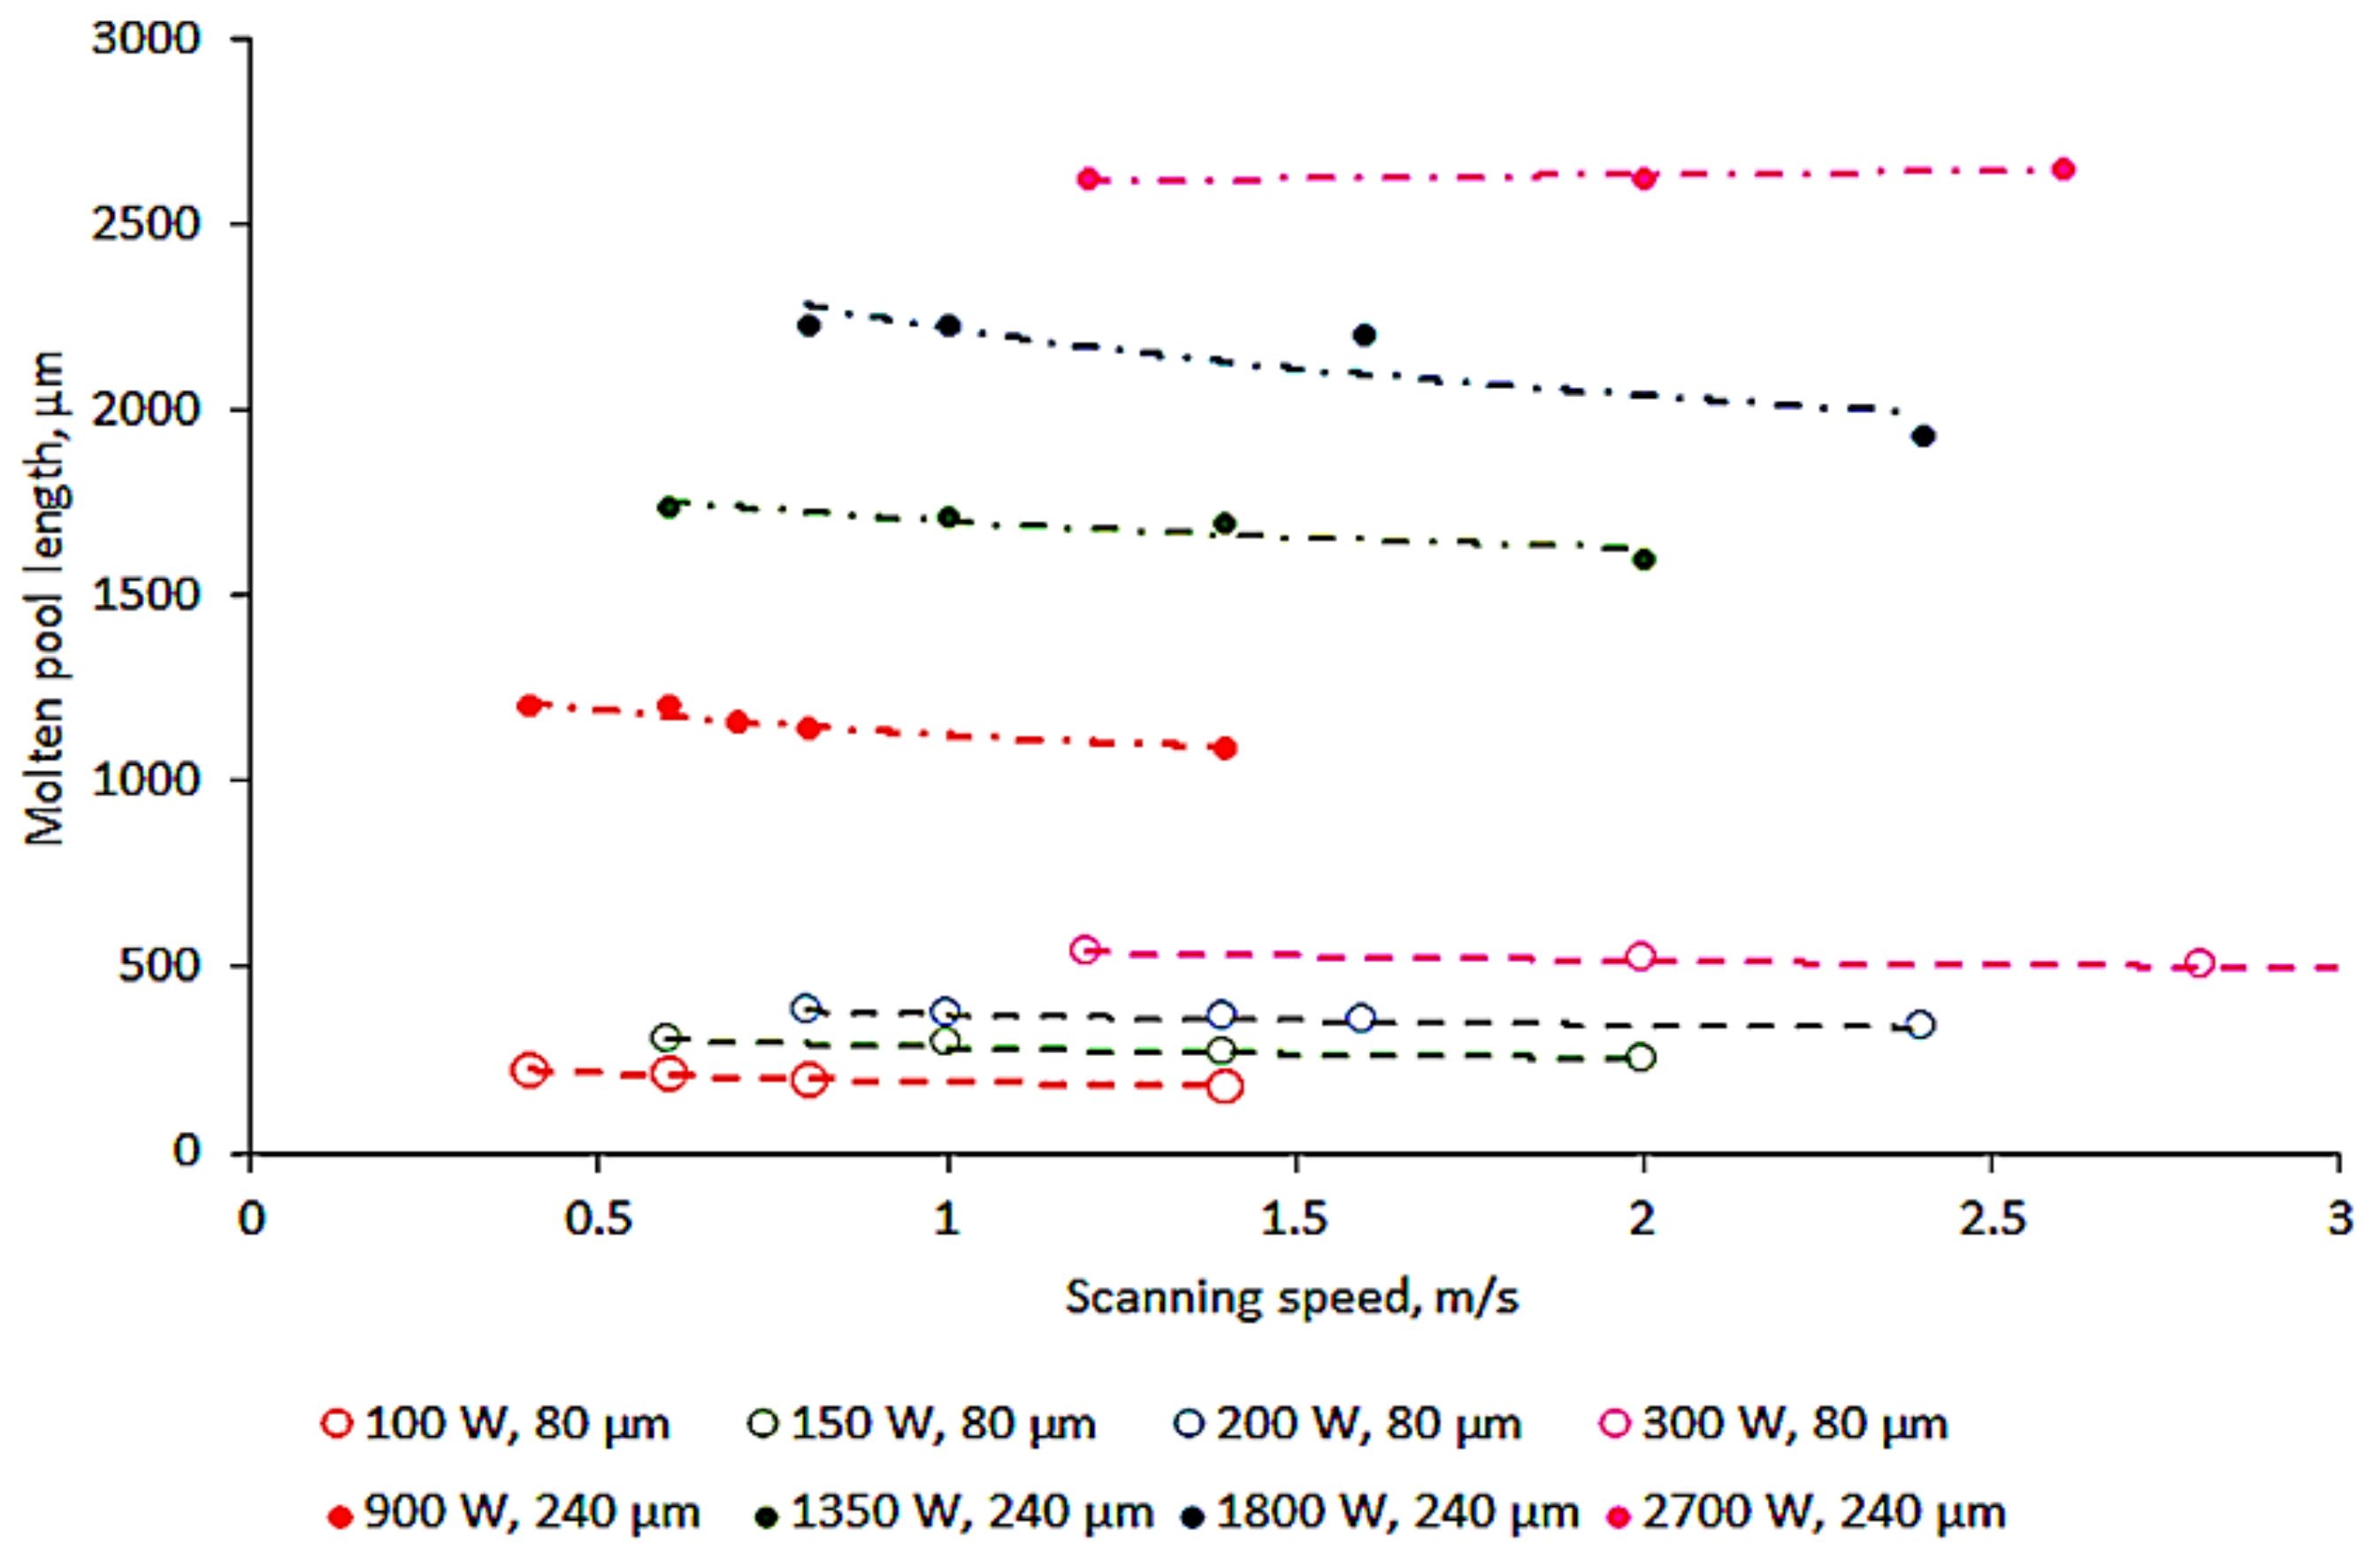
3.2. Parameters Affecting the Molten Pool Size

The general linear model by IBM SPSS Statistics was used to perform ANOVA to determine if the width and penetration depth of single tracks were statistically different when compared (i.e., with and without powder) at different laser powers (P) and scanning speeds (V), and their interactions (Figure 6 and Figure 7). It was found that all factors were statistically significant; the most influential factors were laser power and scanning speed (Table 2, Figure 8).
The laser-beam-matter interaction time decreases with an increasing scanning speed, and consequently reduces the width of the molten pool. Generally, as it was shown before in [27], the minimal width of the molten pool is defined by the laser spot diameter. At chosen process parameters, the maximal width of the molten pool was approximately two times larger than the laser spot diameter. A combination of laser power and the presence of a powder layer was the third influencing factor for the width of the track. At higher laser powers, the width of the tracks was slightly less with the presence of the powder layer, which indirectly indicates the stabilizing role of the powder layer. Further experiments with thicker powder layers need be done to confirm this assumption.
Calculations of the proportion of variance accounted for the effect (partial η2) of laser power and scanning speed, and their combination also had very high effect on the penetration depth (Table 3). All factors and their combination had a stronger effect on the penetration depth variation than on the width of the tracks (Figure 8). The presence of a powder enhanced the absorptivity of the material, which resulted in higher temperatures and strong flows within the molten pool and a stronger effect on the depth of the molten pool than on the width.
ANOVA analysis indicates that the geometric characteristics of single tracks were mainly affected by the laser power and scanning speed during the processing of the thin powder layer (Table 2 and Table 3). The dimensions of the molten pool, such as the width, remelted-depth, and length were also simulated and evaluated experimentally when the laser scanned the substrate without powder. The experimental results on the width of the molten pool were in relatively good agreement with the numerical simulations. Numerical simulations also showed that the width of the molten pool as well as penetration depth reduced with scanning speed (Figure 8 and Figure 9). However, both laser power and interaction time significantly affected the penetration depth (Figure 9c). The model did not take into account flows in the molten pool that had a significant influence in this material thus, there were differences in the predicted penetration depth and the experimental values determined from the cross-sectioning of single tracks. In addition, different coefficients of absorption β could be tested for better predictions of the molten pool size (Equation (2)).
At the chosen process parameters, the length of the simulated molten pool varied significantly for similar laser power densities but different beam diameters (Figure 10). The results show that the determining factor of the molten pool length is the laser power. At a high laser power, when evaporation was not very pronounced, a long molten pool provoked capillary instability of the solidifying cylinder. For example, the ratio of the circumference of the cylinder to the length of the molten pool was less than 1 for P = 300 W, V ≥ 1.2 m/s and for P = 900 W, V > 0.5 m/s.
Normally, a higher laser power leads to a higher temperature gradient, which, in turn, contributes to strong flows in the molten pool, evaporation and splashes. The laser power and beam diameter played the decisive role in the molten pool size. High laser power resulted in very long molten pools, and even the higher penetration depths could not stabilise the melted track. An increase in the volume of the molten pool provoked flows that led to instability in the molten pool and irregularities in the solidified tracks.

4. Summary and Conclusions

Increasing the productivity of LPBF systems without a loss of quality of fabricated parts is an urgent and important task. One of the ways to increase LPBF productivity is to enlarge the focal spot size and, accordingly, the power of the laser radiation in order to maintain an adequate amount of energy to melt the metal powder. The productivity of LPBF manufacturing is proportional to powder layer thickness (h), scanning speed (V), and hatch distance (s). A higher value of V × d × h will lead to a higher productivity in the process. However, our research shows that achieving this will not be easy. When the focal spot diameter was increased threefold, the width of the tracks also increased. This increased the hatch distance significantly, but the optimal scanning speed dropped greatly, thus achieving no gain in the performance in productivity. Lastly, the layer thickness is an unpredictable parameter, since even a small change can easily lead to an unstable mode of forming single tracks and correspondingly to a larger fraction of porosity or even impossibility to complete the final 3D product.
In this work, two LPBF systems operating independently were used to investigate the effects of upscaling process parameters such as laser power and spot size, while keeping similar laser power density, on the process of forming single tracks. It was found that the optimal scanning speed for continuous and stable track was reduced when using a larger beam diameter and higher laser powers. The width and penetration depth of the track generally decreased with an increasing scanning speed and increases with an increase in the laser power. Numerical simulations also showed that the length of the molten pool was greatly affected by the laser power and beam diameter. Based on the above observations, the following conclusions can be drawn:
  • The formation of continuous single tracks has a threshold character and depends on the process parameters. There are stability zones where the tracks formed are continuous and without defects, and instability zones where the tracks formed are irregular or in the form of beads, especially at higher scanning speeds and laser powers.
  • A larger beam diameter and higher laser power can be used to form stable tracks when the scanning speed is reduced.
  • The larger beam diameter and higher laser power result in a wider and deeper molten pool, which allows an increase in the hatch distance and the layer thickness.
  • Numerical simulation has shown that a higher laser power leads to a longer molten pool, which can provoke instabilities.
  • Excessive energy input leads to depression of the molten pool and spatter formation.
  • The laser power and scanning speed exert the most influence on the width and penetration depth of the single track.
  • The process of forming 3D objects will be more complicated. Thus, the next stage of the research should be devoted to the study of the influence of the layer thickness on single track formations and hatch distance on single layer formation.

Author Contributions

Idea, I.Y. (Igor Yadroitsev); Analysis and numerical simulations, I.Y. (Ina Yadroitsava) and I.Y. (Igor Yadroitsev); Funding acquisition, I.Y. (Igor Yadroitsev); Investigation, N.W.M.; Project administration, N.W.M.; Supervision, H.M., I.Y. (Igor Yadroitsev) and I.Y. (Ina Yadroitsava); Writing, review & editing—all authors.

Funding

This research was funded by the Department of Science and Technology and National Research Foundation of South Africa (Grant number 97994).

Acknowledgments

This work was also based on the research supported by the Collaborative Program in Additive Manufacturing of South Africa, the South African Research Chairs Initiative (SARChI) program contractt number CSIR-NLC-CPAM-15-MOA-CUT-01.

Conflicts of Interest

The authors declare no conflicts of interest.

References

  1. Bourell, D.L.; Rosen, D.W.; Leu, M.C. The roadmap for additive manufacturing and its impact. 3D Print. Addit. Manuf. 2014, 1, 1. [Google Scholar] [CrossRef]
  2. Gao, W.; Zhang, Y.; Ramanujan, D.; Ramani, K.; Chen, Y.; Williams, C.B.; Wang, C.C.L.; Shin, Y.C.; Zhang, S.; Zavattieri, P.D. The status, challenges, and future of additive manufacturing in engineering. Comput.-Aided Des. 2015, 69, 65–89. [Google Scholar] [CrossRef]
  3. Ford, S.; Despeisse, M. Additive manufacturing and sustainability: An exploratory study of the advantages and challenges. J. Clean. Prod. 2016, 137, 1573–1587. [Google Scholar] [CrossRef]
  4. Baumers, M.; Dickens, P.; Tuck, C.; Hague, R. The cost of additive manufacturing: Machine productivity, economies of scale and technology-push. Technol. Forecast. Soc. Chang. 2016, 102, 193–201. [Google Scholar] [CrossRef]
  5. Schleifenbaum, H.; Meiners, W.; Wissenbach, K.; Hinke, C. Individualized production by means of high power Selective Laser Melting. CIRP-JMST 2010, 2, 161–169. [Google Scholar] [CrossRef]
  6. Yadroitsava, I.; Els, J.; Booysen, G.; Yadroitsev, I. Peculiarities of single track formation from Ti6AL4V alloy at different laser power densities by selective laser melting. SAJIE 2015, 26, 86–95. [Google Scholar] [CrossRef]
  7. Ma, M.; Wang, Z.; GAO, M.; Zeng, X. Layer thickness dependence of performance in high-power selective laser melting of 1Cr18Ni9Ti stainless steel. J. Mater. Process. Technol. 2015, 215, 142–150. [Google Scholar] [CrossRef]
  8. Shi, X.; Ma, S.; Liu, C.; Chen, C.; Wu, Q.; Chen, X.; Lu, J. Performance of high layer thickness in selective laser melting of Ti6Al4V. Materials 2016, 9, 975. [Google Scholar] [CrossRef] [PubMed]
  9. Wang, S.; Liu, Y.; Shi, W.; Qi, B.; Yang, J.; Zhang, F.; Han, D.; Ma, Y. Research on high layer thickness fabricated of 316L by selective laser melting. Materials 2017, 10, 1055. [Google Scholar] [CrossRef] [PubMed]
  10. Mower, T.M.; Long, M.J. Mechanical behavior of additive manufactured powder-bed laser-fused material. Mater. Sci. Eng. A 2016, 651, 198–213. [Google Scholar] [CrossRef]
  11. Razavi, S.M.J.; Ferro, P.; Berto, F. Fatigue assessment of Ti-6Al-4V circular notched specimens produced by selective laser melting. Metals 2017, 7, 291. [Google Scholar] [CrossRef]
  12. Branco, R.; Costa, J.D.; Berto, F.; Razavi, S.M.J.; Ferreira, J.A.M.; Capela, C.; Santos, L.; Antunes, F. Low-Cycle Fatigue Behaviour of AISI 18Ni300 Maraging Steel Produced by Selective Laser Melting. Metals 2018, 8, 32. [Google Scholar] [CrossRef]
  13. Rausch, A.M.; Küng, V.E.; Pobel, C.; Markl, M.; Körner, C. Predictive Simulation of Process Windows for Powder Bed Fusion Additive Manufacturing: Influence of the Powder Bulk Density. Materials 2017, 10, 1117. [Google Scholar] [CrossRef] [PubMed]
  14. Read, N.; Wang, W.; Essa, K.; Attallah, M.M. Selective laser melting of AlSi10Mg alloy: Process optimisation and mechanical properties developed. Mater. Des. 2015, 65, 417–424. [Google Scholar] [CrossRef]
  15. Guzanová, A.; Ižaríková, G.; Brezinová, J.; Živčák, J.; Draganovská, D.; Hudák, R. Influence of Build Orientation, Heat Treatment, and Laser Power on the Hardness of Ti6Al4V Manufactured Using the DMLS Process. Metals 2017, 7, 318. [Google Scholar] [CrossRef]
  16. Gong, H.; Rafi, K.; Karthik, N.; Starr, T.; Stucker, B. Defect morphology in Ti-6Al-4V parts fabricated by selective laser melting and electron beam melting. In Proceedings of the 24rd Annual International Solid Freeform Fabrication Symposium: An Additive Manufacturing Conference, Austin, TX, USA, 12–14 August 2013. [Google Scholar]
  17. Mazumder, J.; Steen, W. Heat transfer model for CW laser material processing. J. Appl. Phys. 1980, 51, 941–947. [Google Scholar] [CrossRef]
  18. Yadroitsev, I.; Krakhmalev, P.; Yadroitsava, I. Hierarchical design principles of selective laser melting for high quality metallic objects. Addit. Manuf. 2015, 7, 45–56. [Google Scholar] [CrossRef]
  19. Childs, T.; Hauser, C.; Badrossamay, M. Mapping and modelling single scan track formation in direct metal selective laser melting. CIRP Ann. Manuf. Technol. 2004, 53, 191–194. [Google Scholar] [CrossRef]
  20. Yadroitsev, I.; Gusarov, A.; Yadroitsava, I.; Smurov, I. Single track formation in selective laser melting of metal powders. J. Mater. Process. Technol. 2010, 210, 1624–1631. [Google Scholar] [CrossRef]
  21. Dai, D.; Gu, D. Tailoring surface quality through mass and momentum transfer modeling using a volume of fluid method in selective laser melting of TiC/AlSi10Mg powder. Int. J. Mach. Tools Manuf. 2015, 88, 95–107. [Google Scholar] [CrossRef]
  22. Yan, W.; Ge, W.; Qian, Y.; Lin, S.; Zhou, B.; Liu, W.K.; Lin, F.; Wagner, G.J. Multi-physics modeling of single/multiple-track defect mechanisms in electron beam selective melting. Acta Mater. 2017, 134, 324–333. [Google Scholar] [CrossRef]
  23. Matthews, M.J.; Guss, G.; Khairallah, S.A.; Rubenchik, A.M.; Depond, P.J.; King, W.E. Denudation of metal powder layers in laser powder bed fusion processes. Acta Mater. 2016, 114, 33–42. [Google Scholar] [CrossRef]
  24. Das, S. Physical aspects of process control in selective laser sintering of metals. Adv. Eng. Mater. 2003, 5, 701–711. [Google Scholar] [CrossRef]
  25. Wei, P.S. The physics of weld bead defects. In Welding Processes; Kovacevic, R., Ed.; InTech: London, UK, 2012; pp. 395–414. [Google Scholar]
  26. Khairallah, S.A.; Anderson, A.T.; Rubenchik, A.; King, W.E. Laser powder-bed fusion additive manufacturing: Physics of complex melt flow and formation mechanisms of pores, spatter, and denudation zones. Acta Mater. 2016, 108, 36–45. [Google Scholar] [CrossRef] [Green Version]
  27. Yadroitsev, I. Selective Laser Melting: Direct Manufacturing of 3D-Objects by Selective Laser Melting of Metal Powders; Lambert Academic Publishing: Saarbrücken, Germany, 2009. [Google Scholar]
Figure 1. Scanning electron micrograph (a) and particle size distribution (b) of the 17-4PH SS powder.
Metals 08 00475 g001
Figure 2. Schematic of the geometry (a) and the mesh model (b) used for the numerical simulations.
Metals 08 00475 g002
Figure 3. Process map obtained on the 100–300 W laser power and 80 µm laser spot diameter (“low-power system”).
Metals 08 00475 g003
Figure 4. Process map obtained on 900–2700 W laser power and 240 µm laser spot diameter (“high-power system”).
Metals 08 00475 g004
Figure 5. Solidified tracks profiles: (a) stable track at P = 100 W, V = 0.6 m/s (top) and expressed humping effect when scanning the substrate and balling effect in LPBF at P = 300 W, V = 1.8 m/s (bottom); (b) humping and irregularity at P = 900 W, V = 0.6 m/s (top) and spatter formation at P = 2700 W, V = 1.8 m/s (bottom).
Metals 08 00475 g005
Figure 6. Width of the tracks at different laser powers and scanning speeds with powder (a) and without powder (b).
Metals 08 00475 g006
Figure 7. Penetration depth at different laser powers and scanning speeds with powder (a) and without powder (b).
Metals 08 00475 g007
Figure 8. Experimental values (data points) and calculated width (dotted lines) of the tracks at different laser power and beam diameter versus scanning speed.
Metals 08 00475 g008
Figure 9. Calculated (a) and experimental effect (b,c) of scanning speed (b) and interaction time (c) on the penetration depth at different laser powers and beam diameters.
Metals 08 00475 g009
Figure 10. Calculated length of the molten pool versus scanning speed, laser power and spot size.
Metals 08 00475 g010
Table 1. Design of experiments.
ParameterLow-Power SystemHigh-Power System
Beam diameter, 2r0 (µm)80240
Laser power, P (W)100–300900–2700
Scanning speed, V (m/s)0.4–2.80.4–2.8
Laser-matter interaction time, 2r0/V (µs)200–29600–86
Laser power density, P/(π·r02) (kW/mm2)19.9–59.719.9–59.7
Linear energy input, P/V (J/m)35.7–750321–6750
Table 2. Univariate analysis of variance, tests of between-subjects effects: the width of the track.
SourceType III Sum of SquaresdfMean SquareFSig.Partial η2
Corrected Model5,471,735.346 a13939,365.002968.8460.0000.998
Intercept14,999,811.89114,999,811.89369,173.1710.0000.999
P5,301,134.1397757,304.87718,638.6770.0000.998
V191,424.3371512,761.622314.0870.0000.944
P × powder45,185.11976455.017158.870.0000.799
P × V37,439.07547796.57619.6050.0000.767
P × V × powder14,765.41947314.1587.7320.0000.565
Powder12,016.96112,016.96295.760.0000.514
V × powder4340.01615289.3347.1210.0000.276
Error11,376.63228040.631---
Total22,832,609.23420----
Corrected Total5,483,111.978419----
aR2 = 0.998 (Adjusted R2 = 0.997).
Table 3. Univariate analysis of variance, tests of between-subjects effects: the penetration depth.
SourceType III Sum of SquaresdfMean SquareFSig.Partial η2
Corrected Model1,569,172.893 a13911,289.0141639.0410.0000.999
Intercept2,916,511.82312,916,511.823423,445.6010.0000.999
P1,211,746.6047173,106.65825,133.1920.0000.998
V509,356.5381533,957.1034930.20.0000.996
P × V137,073.879472916.466423.4390.0000.986
P × powder9250.96871321.567191.8770.0000.827
P × V × powder5023.96747106.89315.520.0000.723
Powder3650.12713650.127529.9580.0000.654
V × powder2279.27515151.95222.0620.0000.542
Error1928.522806.888---
Total482,8881.17420----
Corrected Total1,571,101.413419----
aR2 = 0.999 (Adjusted R2 = 0.998).

