Article

Finite Element Analysis of Surface Integrity in Deep Ball-Burnishing of a Biodegradable AZ31B Mg Alloy

1
School of Engineering, University of South Australia, Mawson Lakes, SA 5095, Australia
2
Future Industries Institute, University of South Australia, Mawson Lakes, SA 5095, Australia
*
Author to whom correspondence should be addressed.
Metals 2018, 8(2), 136; https://doi.org/10.3390/met8020136
Submission received: 29 December 2017 / Revised: 3 February 2018 / Accepted: 12 February 2018 / Published: 16 February 2018

Abstract

:
As an effective and affordable technique, deep ball-burnishing has been applied to induce the plastic deformation of material, thus resulting in an increased surface hardness, compressive residual stress, and finish quality. Recent research shows that the fast degradation of an Mg alloy implant is a prime limiting factor for its success in in vivo human trials. This paper presents a comprehensive investigation into deep ball-burnishing of a biodegradable AZ31B Mg alloy, in order to improve the alloy’s surface integrity. A series of experiments using an in-house built burnishing tool with a 10-mm steel ball have been conducted, with a key focus of exploring the influence of the major process parameters—e.g., burnishing force (750–2650 N), feed rate (150–500 mm/min), and step-over (0.05–0.15 mm)—on hardness and finish quality. With the aim of performing a parametric sensitivity study, a three-dimensional (3D) finite element (FE) model is developed to predict the deformation mechanics, plastic flow, hardness, and residual stress. The FE model agrees with the experiment, hence validating the reliability of the model. Results show that while burnishing significantly improves surface integrity compared to the untreated surface, burnishing force and step-over are shown to be dominant. The net material movement dictates generated residual stress (tensile or compressive), often negatively affecting the surface integrity (e.g., surface cracks), which may be responsible for the onset of corrosion. An appropriate burnishing strategy must therefore be planned, in order to achieve the intended process outcome. The resulting surface properties, enhanced by the deep ball-burnishing, are expected to potentially increase the corrosion resistance of AZ31B Mg alloy implants.

1. Introduction

Research and development of innovative orthopedic implants has been one of the promising areas in biomedical engineering. In this regard, as an alternative to permanent metallic implants, Mg alloys, which are biodegradable and biocompatible, have been widely considered and employed. Once implanted, they gradually dissolve and are absorbed by the human body. As mechanical properties of Mg alloy are close to that of human bone, they minimize stress shielding, while eliminating the secondary interventional surgery [1]. However, the fast corrosion in human body fluid is a major problem of Mg alloys—i.e., the implant degrades quickly and loses mechanical integrity before the complete healing of bone. The issue is reiterated in an extensive review by Agarwal et al. [2], and the challenge now is how to overcome such a problem associated with Mg alloys. One way to tackle this is to adjust the Mg alloys’ properties by changing their composition and microstructure [3]. However, alloying by adding rare-earth elements often causes toxicity and lack of biocompatibility, hence making the material unsuitable to be implanted. Alternatively, controlling the surface integrity (e.g., hardness, residual stress) by mechanical treatment is found to be a viable means to adjust the degradation kinetics. As a novel technique alternative to its counterparts, e.g., machining [4], shot peening [5], and laser peening [6], ball-burnishing becomes an attractive process to enhance surface integrity [7]. In this process, a ball compresses and rolls over the rough surface, plastically deforming the near-surface zone, hence resulting in smoother surface, increased hardness, and compressive residual stress. As such, ball-burnishing is studied and employed extensively, to improve the wear and fatigue life of metal alloys, including stainless steel [8] and titanium alloys [9]. Via experiment or computational modelling, the effect of various burnishing process parameters on surface integrity are investigated, and the design of appropriate parameters is emphasized to achieve the best result. However, few studies are focused on determining the optimum burnishing effect for biodegradable Mg alloys for the enhancement of corrosion resistance. For instance, cutting followed by ball-burnishing of Mg-Ca alloys is shown to induce residual stress, increase hardness, and reduce roughness, all of which result in increased corrosion resistance [10,11]. The same authors have further reported that higher burnishing force and feed lead to higher corrosion resistance [12]. Hering et al. [13] have reported a similar conclusion, and shown that reduced roughness by ball-burnishing, at a large overlap of 75% and force of 200 bar, retards the degradation rate of AZ91 alloys. Burnishing with cryogenic cooling induces grain refinement and basal texture, which are attributed to increased hardness and the corrosion resistance of AZ31B [14] and Mg-Al-Zn alloys [15]. So the consensus, based on past studies, affirms the overwhelming advantages of burnishing. It is thus crucial to take further steps to investigate, understand, and predict the behavior of burnishing process, when the particular intent is that burnishing is expected to delay the degradation, hence providing the required biomechanical performance of Mg alloy implants. Further, while the importance of the experimental approach is paramount, computational technique is vital to develop the underlying insight and predict the characteristic of the process in a shorter period time, and in an effective manner. Previously, both 2D and 3D finite element (FE) modelling of ball/roller-burnishing of hard metals have been explored and validated experimentally [9,16,17,18]. However, the process has not been employed towards the burnishing of relatively soft Mg alloys. The deformation mechanism, resulting in induced residual stress, could be different from relatively hard metals. It is thus worth underpinning fundamental insights into the burnishing process, and develop a model which will enable a better position in estimating the underlying process outcome.
To this end, this paper aims to study the effect of ball-burnishing on the improvement of the surface integrity of biodegradable AZ31B Mg alloys. Experiments using an in-house built ball-burnishing tool are performed, where the effect of burnishing force, feed, and step-over on roughness and hardness is investigated. Validated experimentally, a 3D FE model of burnishing is developed to conduct a parametric study in estimating residual stress, plastic strain, and hardness. The results from both experiment and simulation are compared, analyzed and discussed.

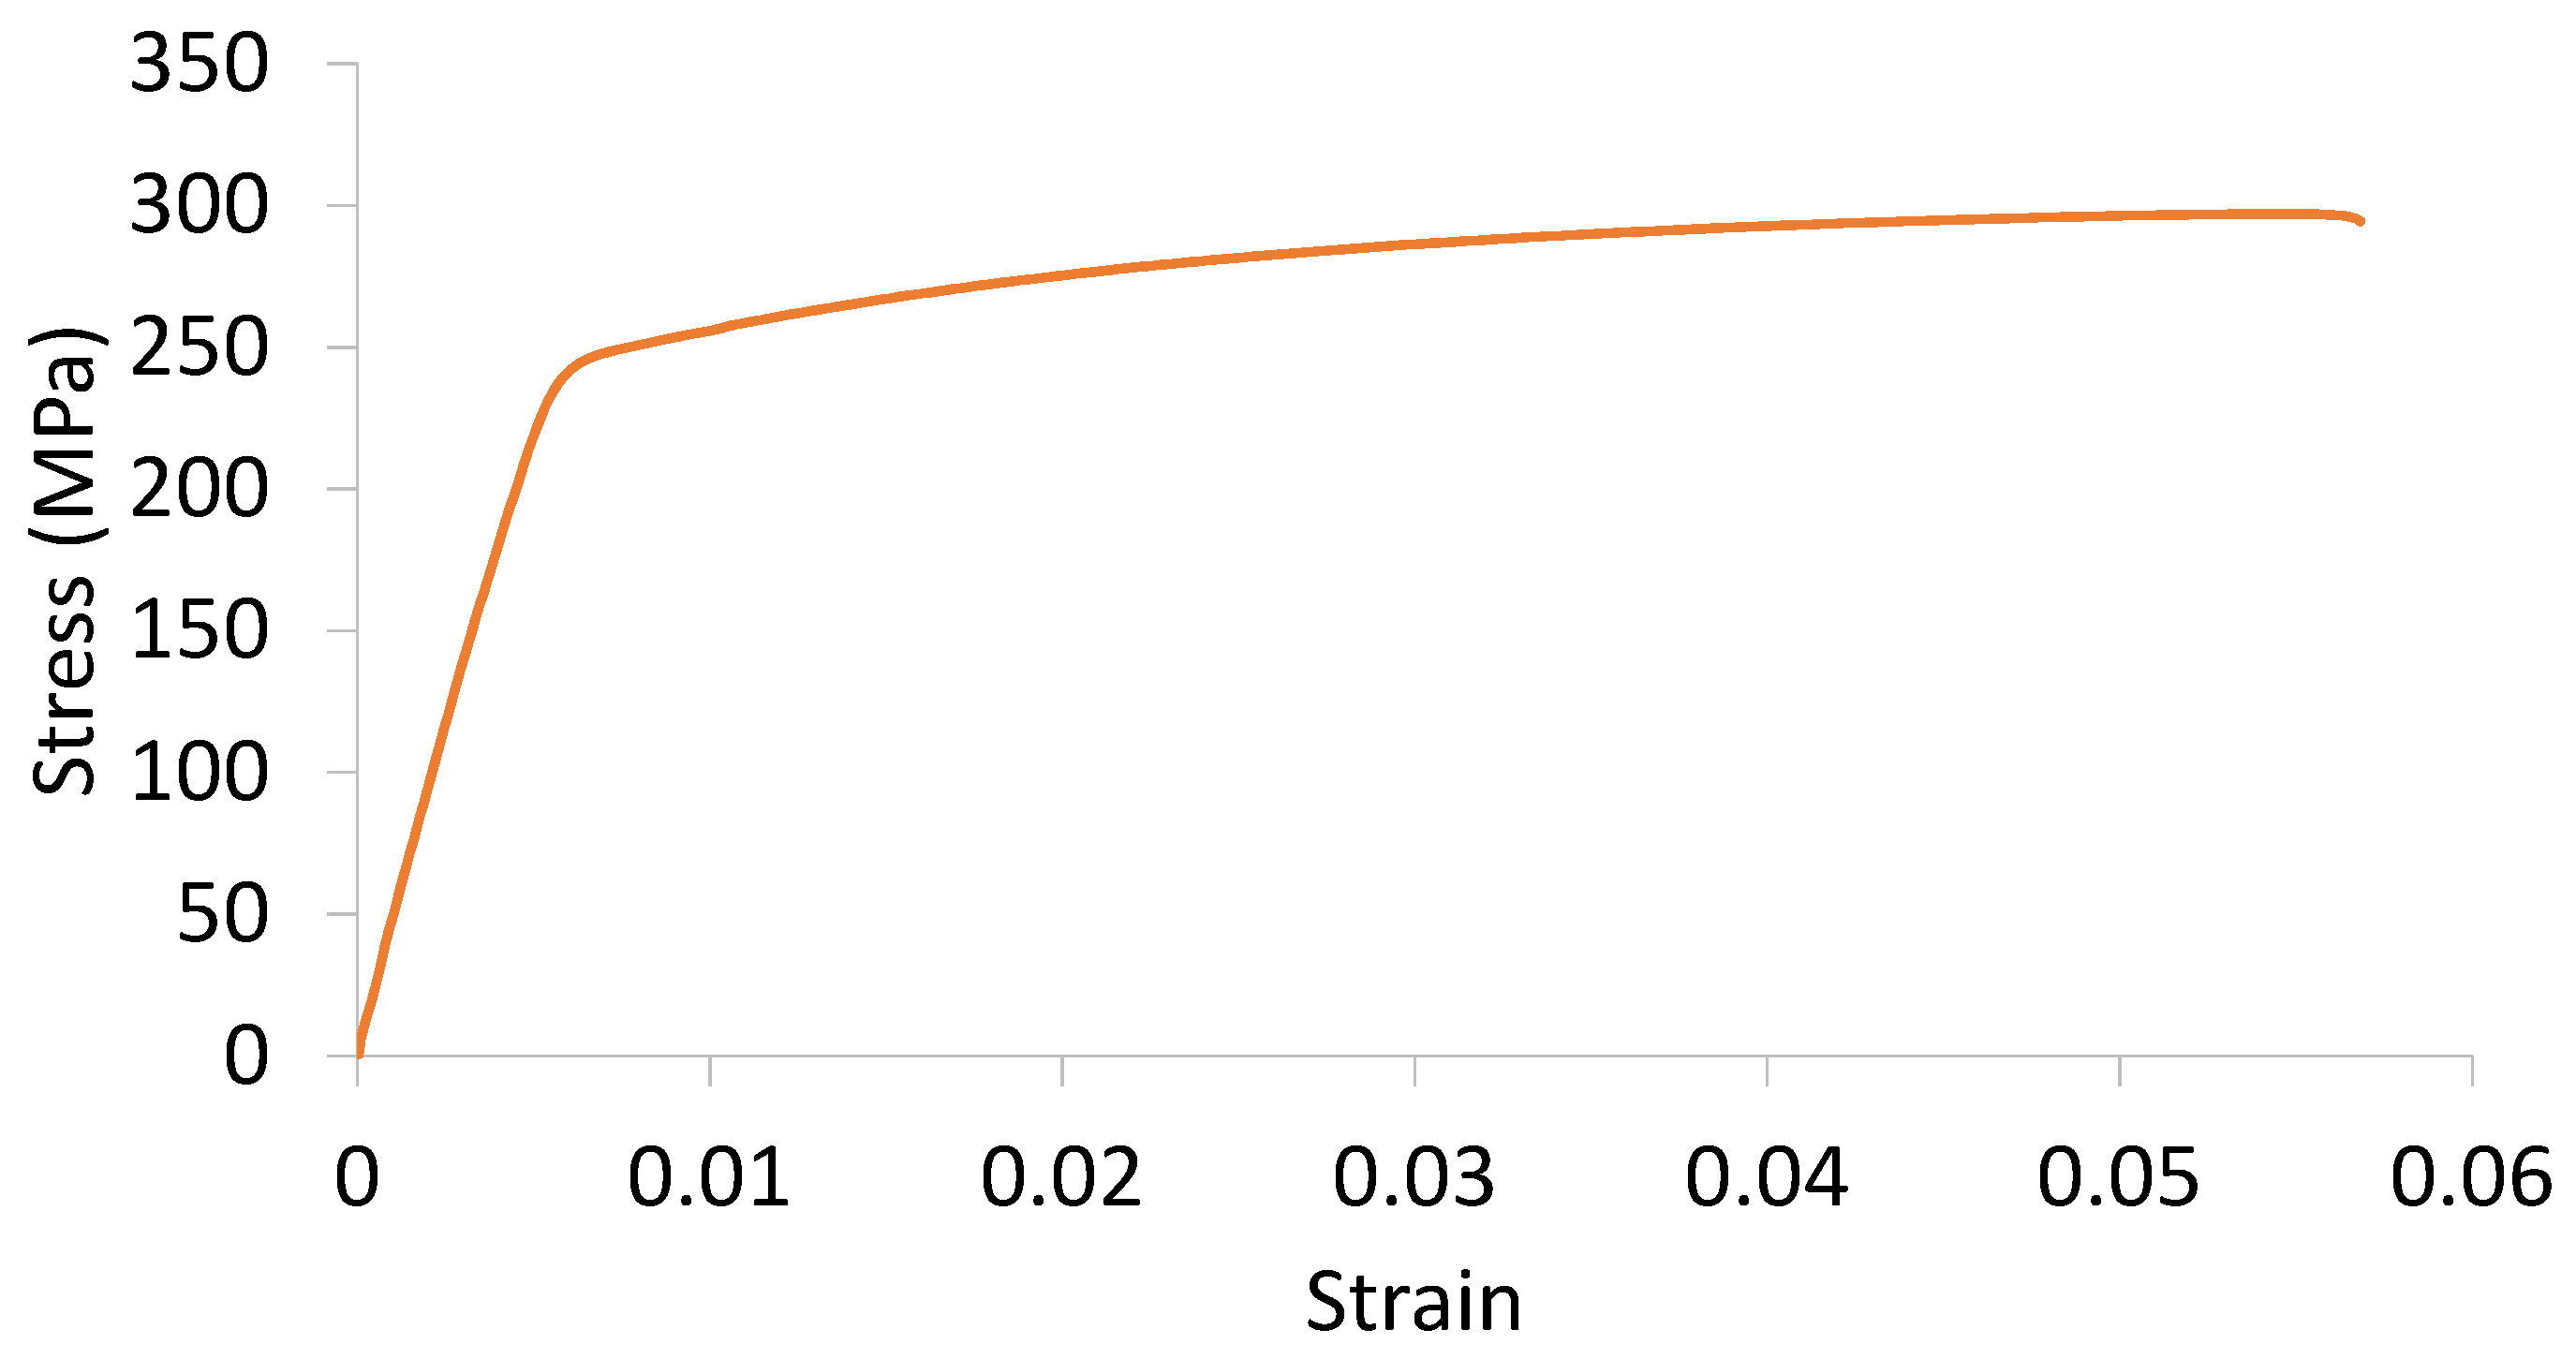
2. Materials and Methods

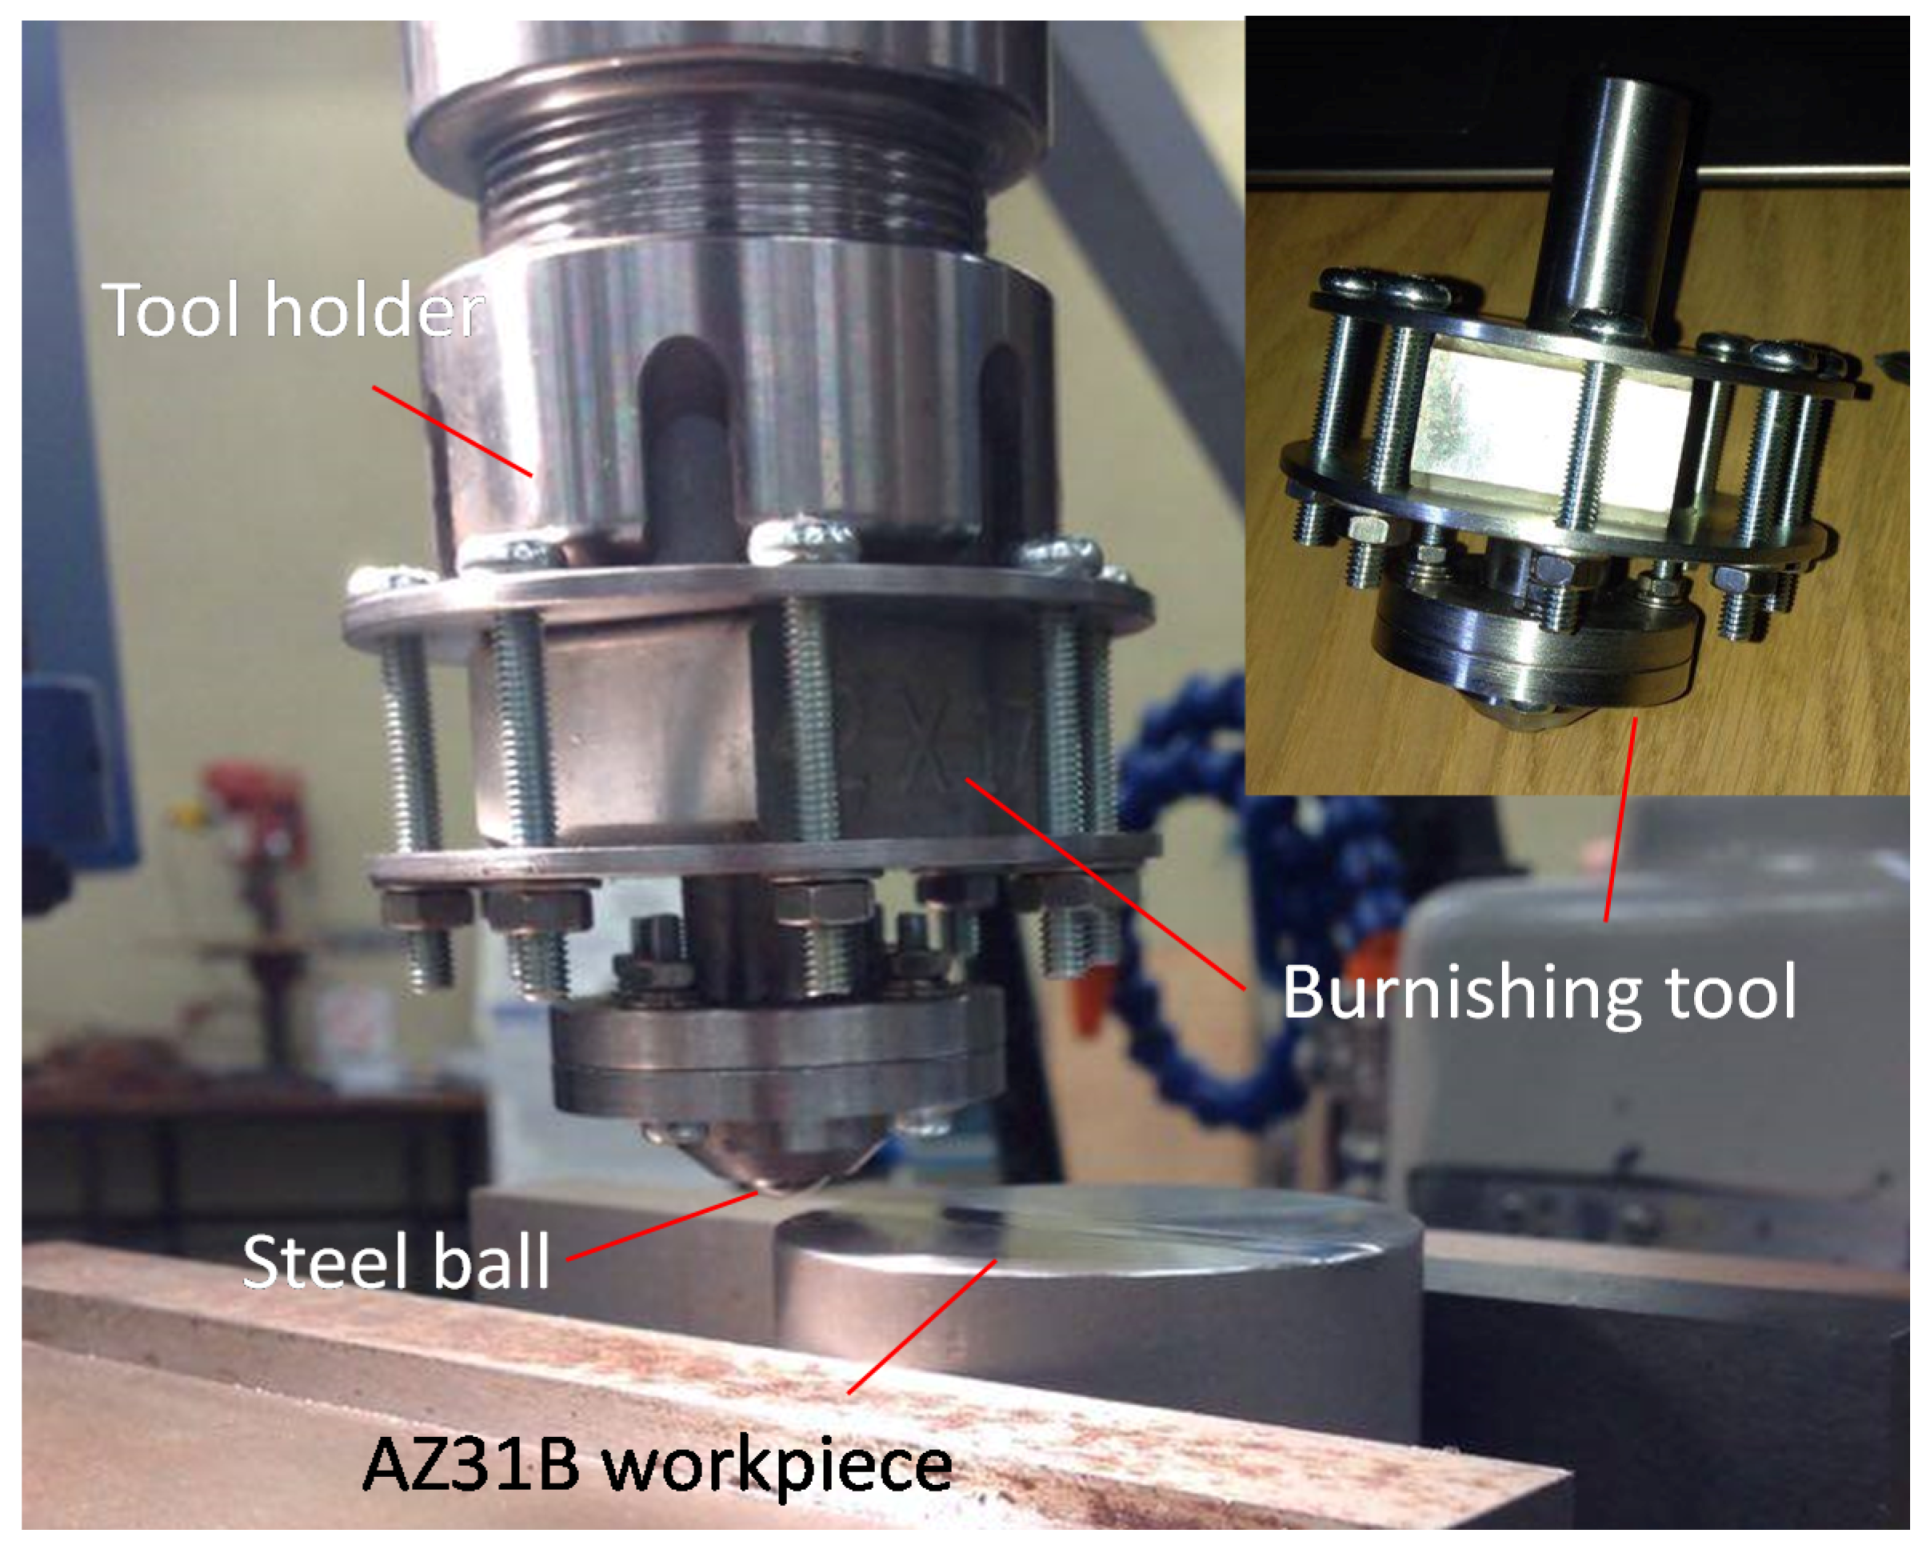
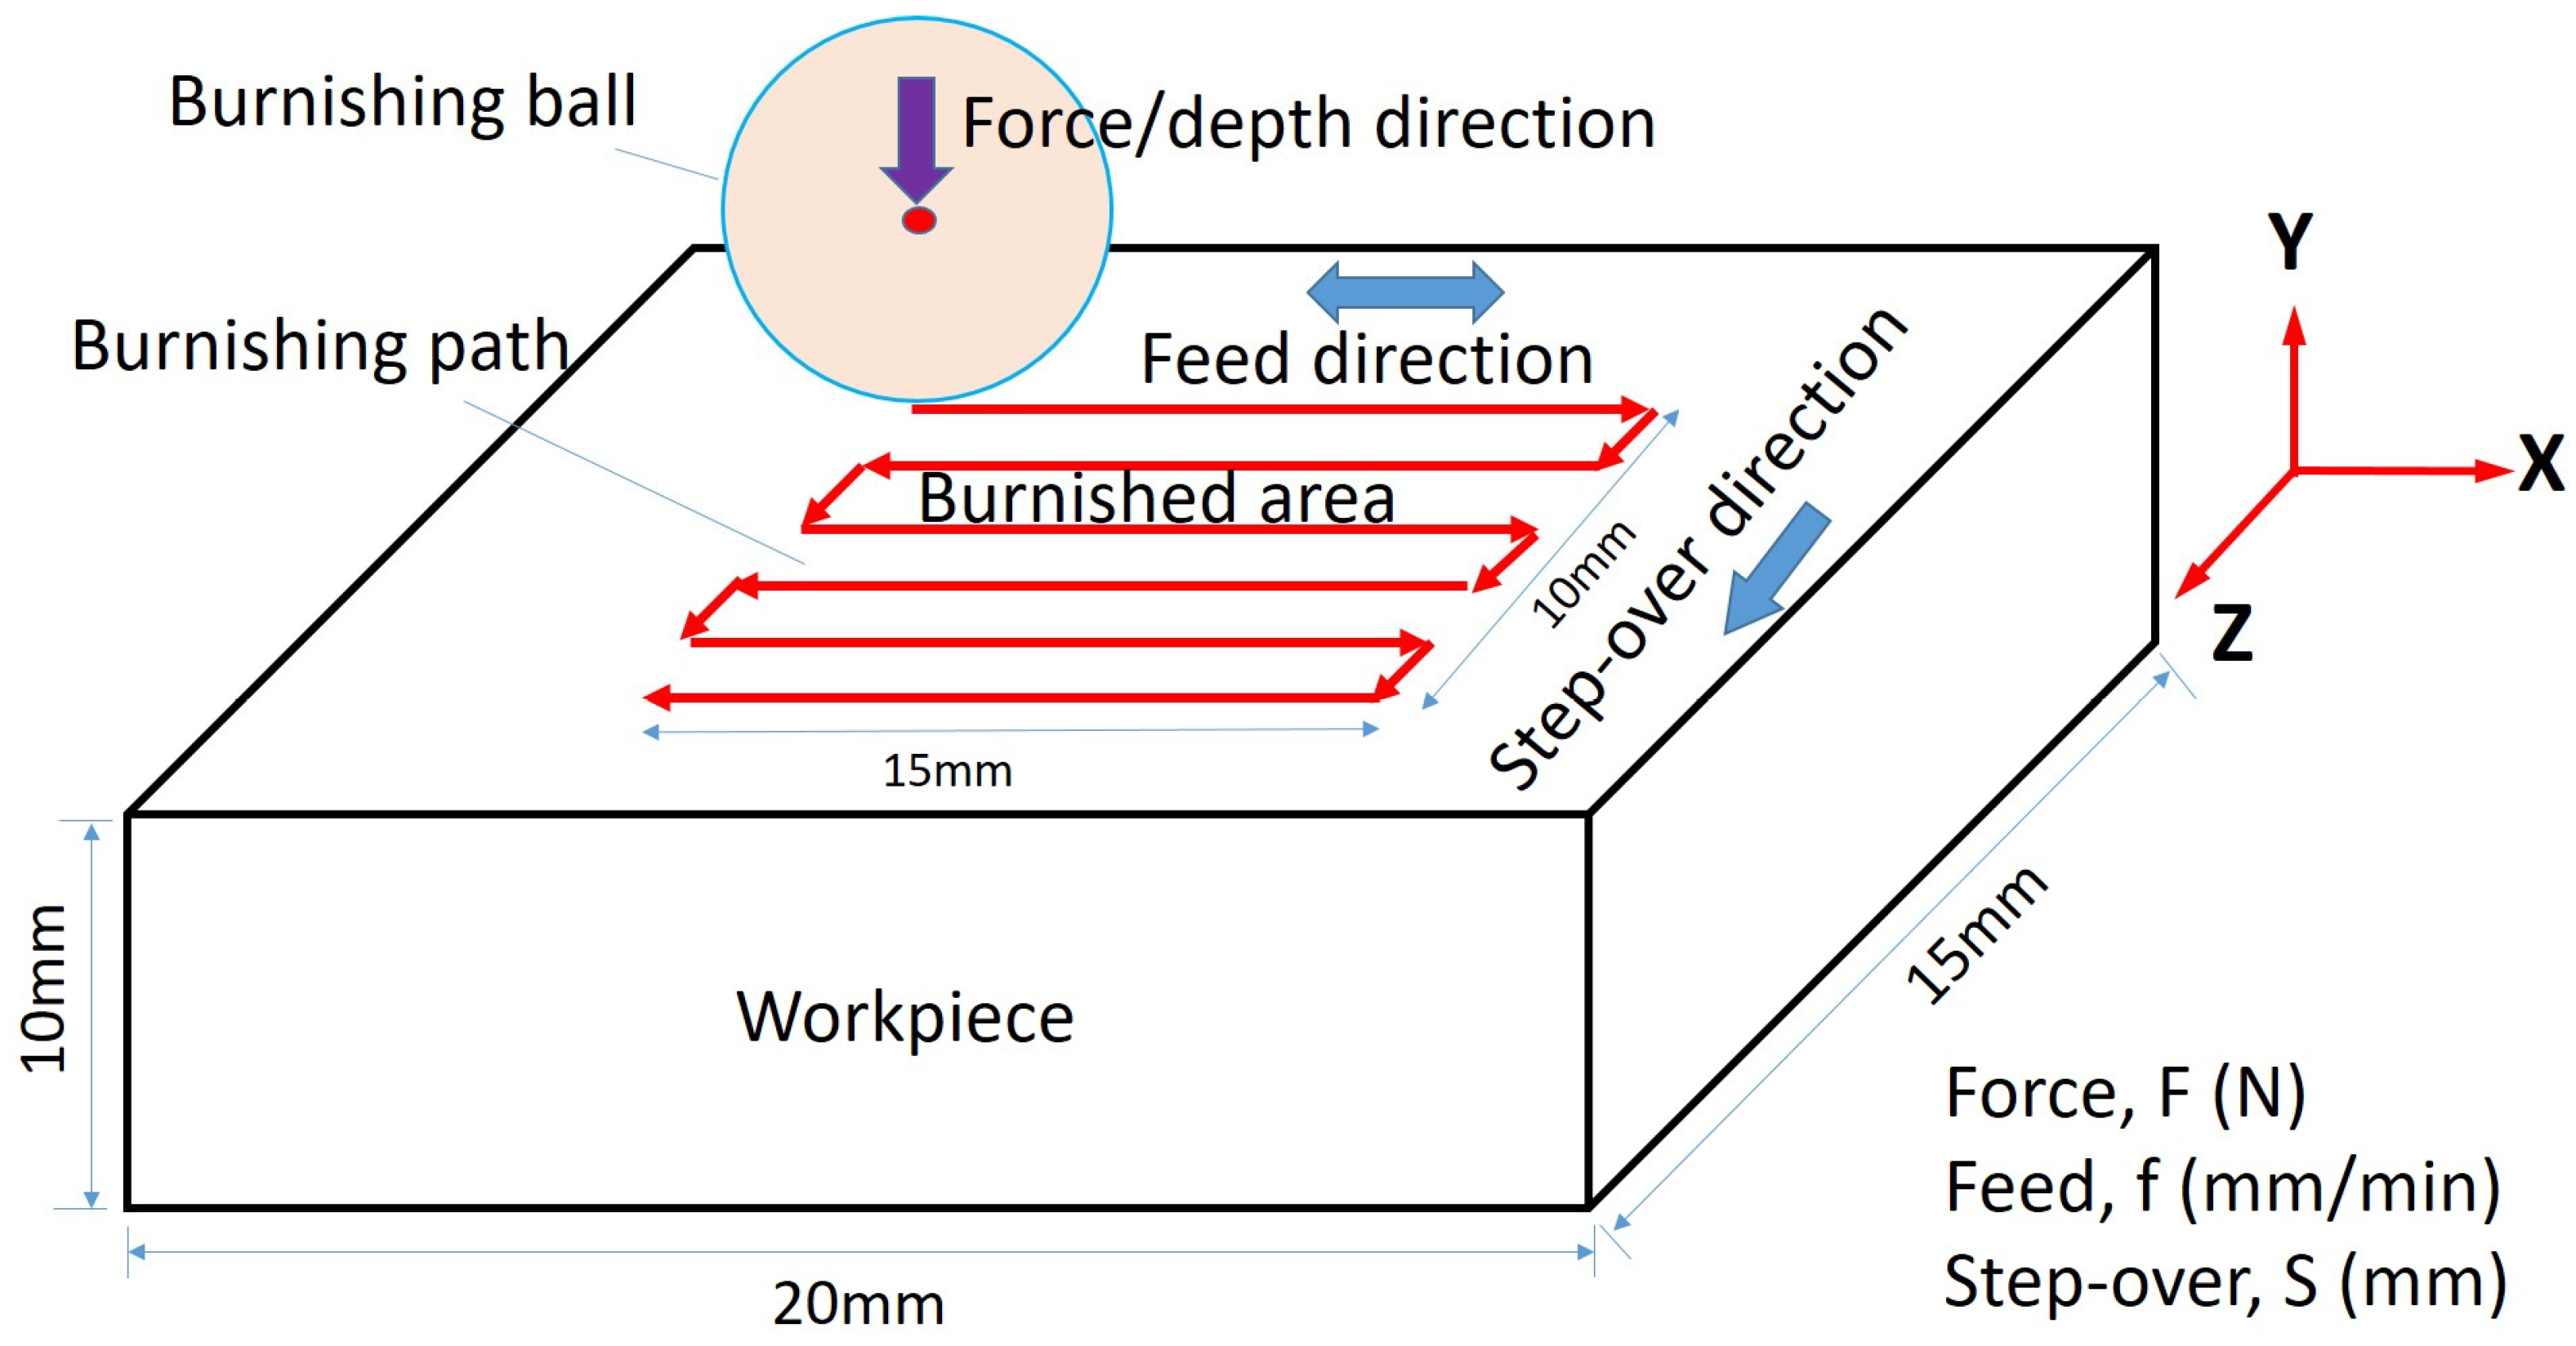
2.1. Burnishing Experiments

A series of burnishing experiments were conducted on AZ31B Mg alloy specimens. The elemental composition of the material is shown in Table 1. Mechanical properties were measured to be: Young’s modulus = 47 GPa, yield strength = 264 MPa, ultimate strength = 315 MPa, and tangent modulus = 0.64 MPa. Before burnishing, the workpiece surface was face-milled with a spindle speed of 4000 rpm, feed of 300 mm/min, and a depth of 0.5 mm, using indexed TiCN-coated carbide inserts. The average roughness Ra and Rt of the milled surface was found to be about 1.12 μm and 8.45 μm, respectively. Figure 1 shows a representative milled 3D and 2D surface topography, on which burnishing was applied.
An in-house built burnishing tool was employed, which consisted of a hardened stainless steel ball of 10 mm in diameter, which rolled on the workpiece. The tool was mounted on a CNC (computer numerical control) machine, and its motion was maintained by the controller of the machine (see Figure 2). A specific area (15 mm in the X-direction × 10 mm in the Z-direction) of the top surface of cylindrical workpiece (50 mm in diameter × 20 mm in height) is burnished with a specific set of burnishing parameters. Figure 3 depicts the zigzag pattern of the burnishing tool paths, where the tool penetrates into the surface at a certain depth, representing the burnishing force, and rolls along a feed direction at a certain speed, creating the plastic deformation of the material. The tool then moves a certain distance along the side, i.e., the stepping distance or step-over, and continues until the whole area is burnished. An experimental design of burnishing tests is prepared, with the aim of exploring the influence of three key parameters—burnishing force F, feed f, and step-over S—with three levels: F = 750, 1650, 2650 N; f = 150, 300, 500 mm/min; S = 0.05, 0.10, 0.15 mm, on surface integrity (e.g., hardness, roughness). According to the design, 27 experiments were performed, resulting in 27 burnished areas. One burnishing pass was considered for each test, i.e., the spherical ball treated the whole area once only. No lubricant or coolant was used in burnishing (i.e., dry burnishing). Surface integrity in terms of surface roughness (Ra and Rt) on top surface and hardness (HV) along the cross-sectional depth from the top surface of the burnished area were measured. Surface topography and roughness were measured by an optical profilometer (Wyko NT 9100, Veeco Co., New York, NY, USA), while hardness was measured by a high precision nano-indenter (UMIS 2000, CSIRO, Sydney, Australia) on the cross-sectional surface, with a load of 40 mN, by taking indentations at an interval of 50 μm. Before hardness test, indentation sample was prepared by cutting the burnished area in half with a diamond cutter, followed by polishing with abrasive grits of 3 μm. Hardness measurement was repeated at least three times, while each time hardness was measured along a different line at 50 μm intervals on the cross-sectional surface from the top edge. The average of the three measurements was considered the final value, and standard deviation at each data point was estimated to indicate the reliability of measurement. A burnished surface texture was further observed under a scanning electron microscope (SEM) (Merlin, Carl Zeiss Co., Oberkochen, Germany). It was assumed that the cutting force during diamond sawing and fine polishing was very small, which would not be sufficient to induce further stress into the material. Therefore, one could expect that the effect of burnishing would not be diminished or altered during the sectioning of burnished sample for hardness measurement.

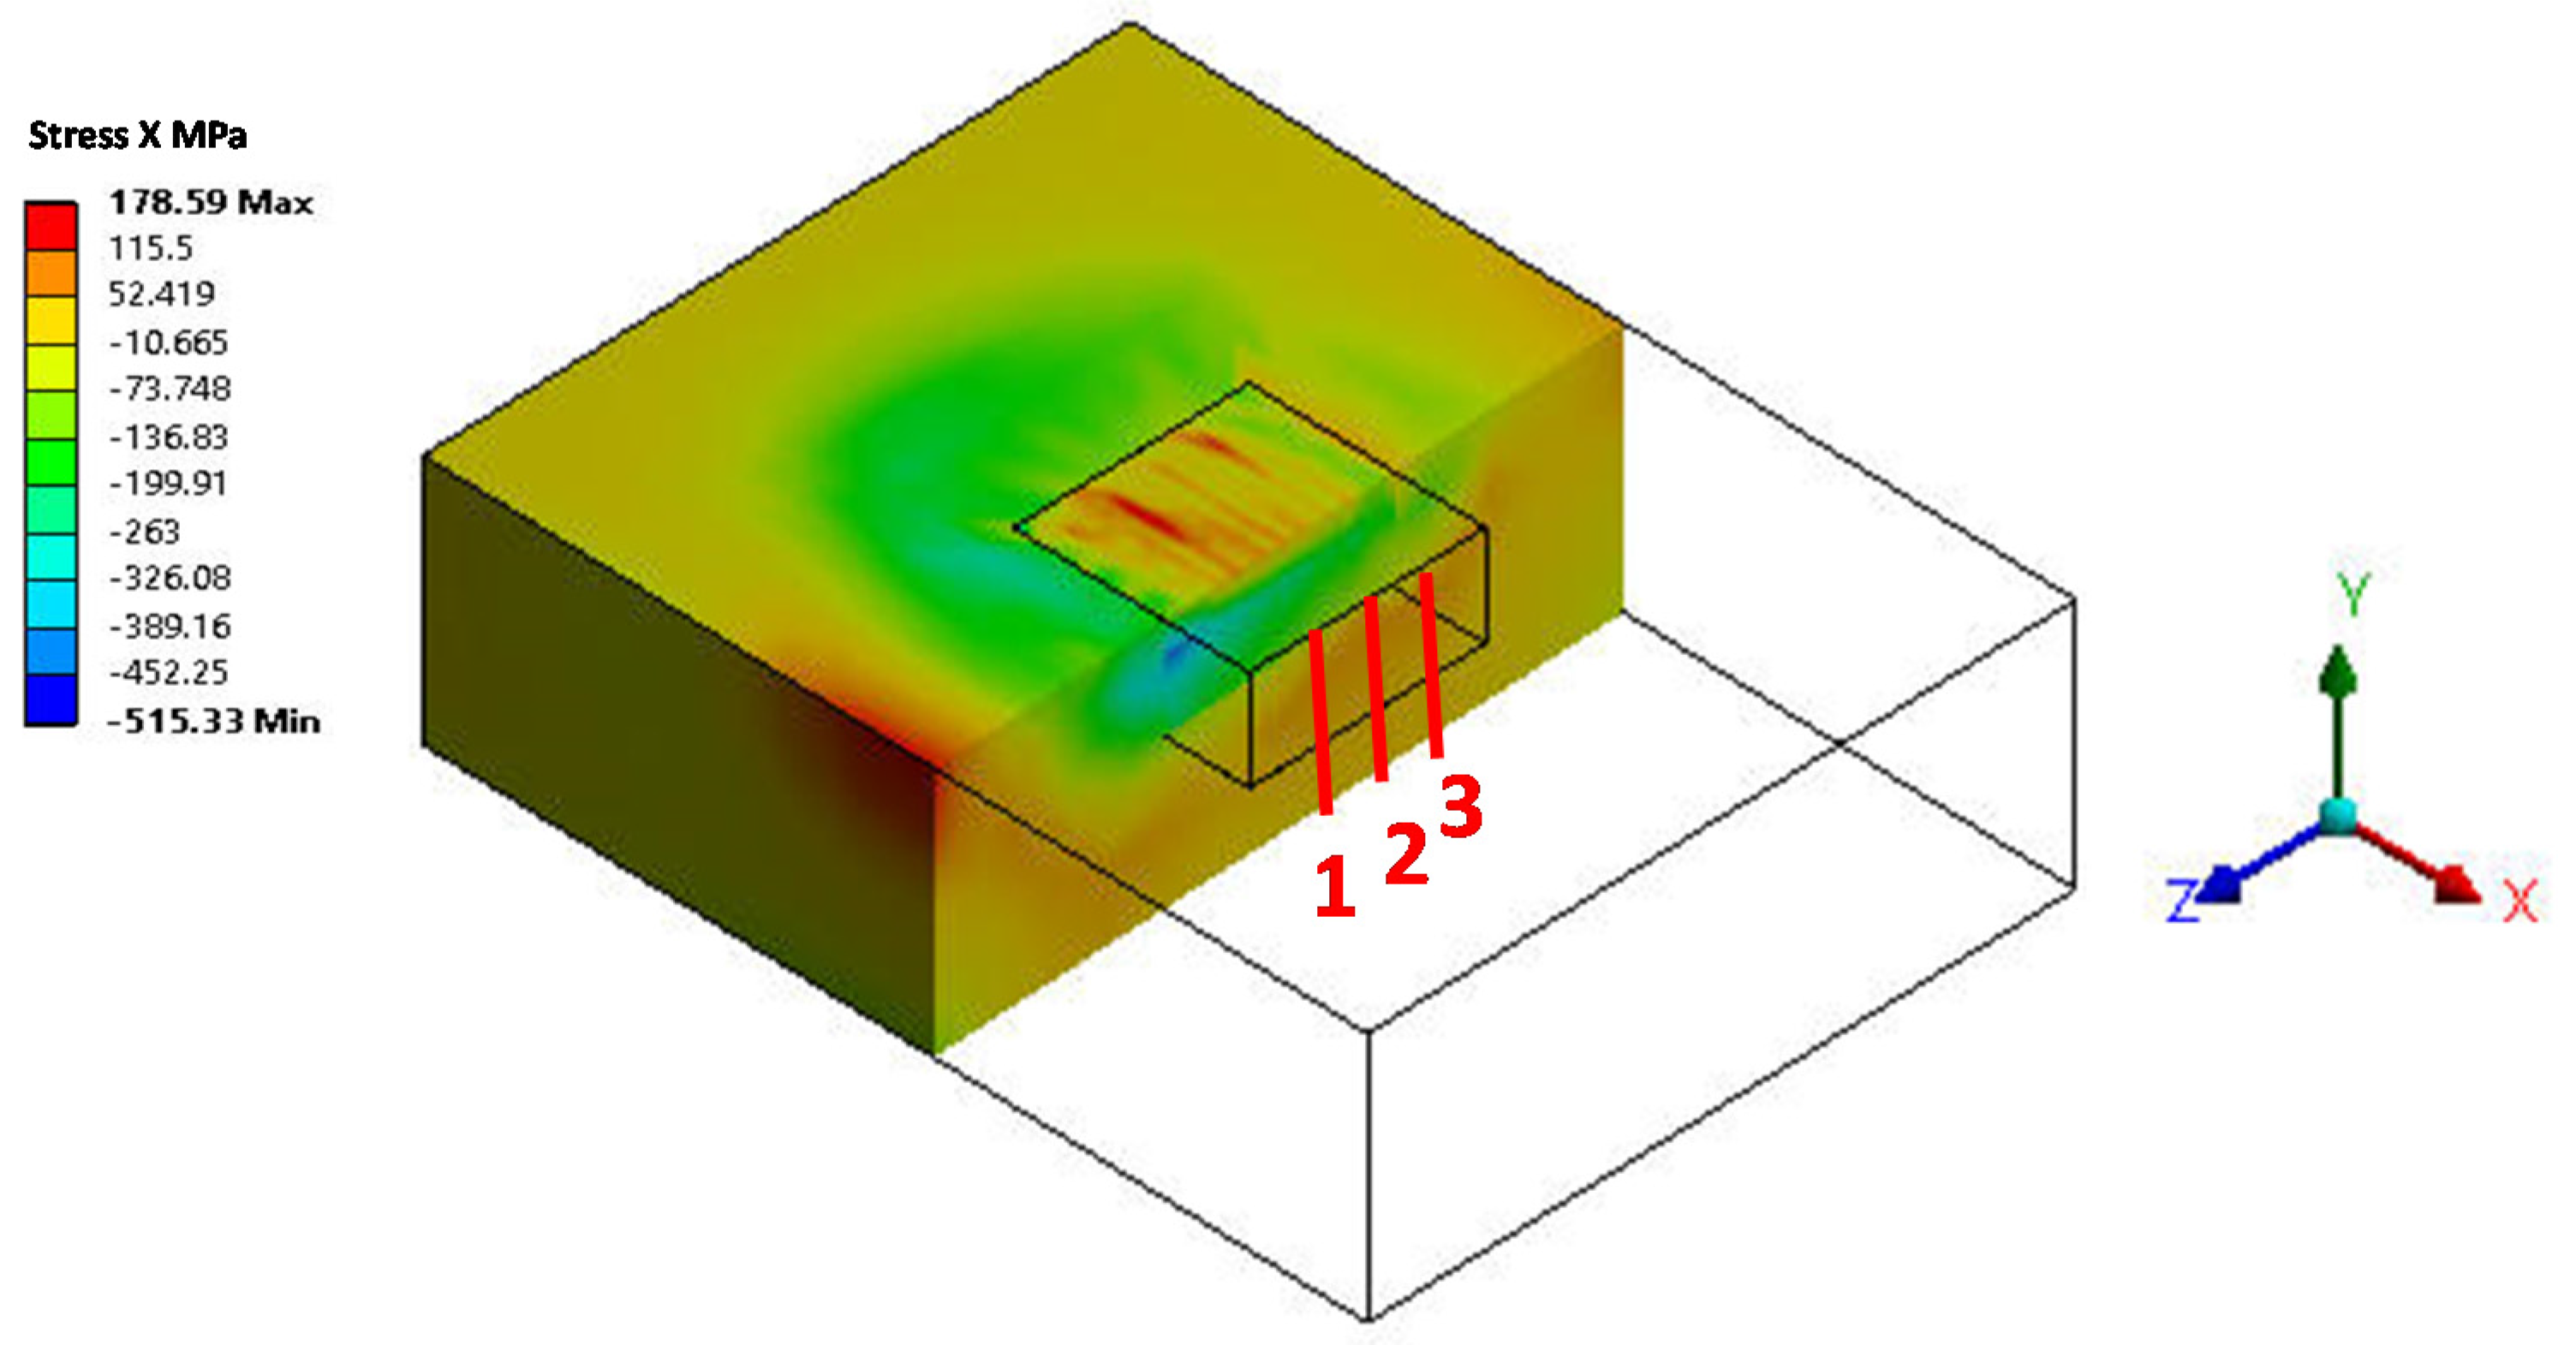
2.2. Finite Element Modelling

A computational modeling of the burnishing process using a finite element (FE) method was developed to perform a parametric study, with the aim of investigating the effect of burnishing on plastic deformation, hardness and residual stress. Figure 4 illustrates a simplified three-dimensional (3D) FE model, involving a workpiece and the burnishing ball. To minimize computational complexity and effort, a test coupon of 20 mm × 15 mm × 10 mm was considered, with a relatively small area of 5 mm × 5 mm and a depth of 5 mm, located at the center of the coupon was modelled to be burnished by the tool. Extra material zone around the burnishing area was considered to allow for sufficient material flow due to burnishing and relaxation afterwards. Both the ball and the workpiece are meshed with hexagonal elements of Solid 185 (Ansys Co., Canonsburg, PA, USA). The elements were considered to be suitable to support the large deformation expected in a cold working process like low/high plastic burnishing. As such, the specific burnishing area was densely meshed with a relatively smaller element size of 0.20 mm, while the rest of the workpiece or the outer zone was meshed with an element as large as 0.5 mm. The number of nodes and elements of the model were 23,619 and 6170, respectively. A mesh convergence study was carefully performed by simulating a simple burnishing, where the element size was changed and the variation of magnitude and location of plastic strain, normal stress, and von Mises stress had been observed. The errors of stress and strain magnitude was found to be less than 1%, and their maximum values remained unchanged. Therefore, such elemental meshing was regarded to be reasonable in predicting the plastic deformation and material flow in burnishing. In FE modelling, the stainless steel burnishing ball of 10 mm in diameter was assumed to be rigid and hard (i.e., non-deformable), while the workpiece was considered to be elasto-plastic, as shown in Figure 5. Stress-strain data was obtained by material testing on the same AZ31B Mg alloys used in burnishing experiments, as described in the earlier section. Following the ASTM E8M-16a standard, tensile tests of the samples were performed on an in-house Instron machine, to obtain engineering stress-strain data. The tests were repeated three times, i.e., three specimens are used for the test. Elastic modulus, yield strength, and Poisson’s ratio were 47 GPa, 264 MPa, and 0.35, respectively. The data was then fed into an FE model to ensure consistency and rational comparison between the FE analysis and the experiment.
The bottom surface of workpiece was assumed to be fixed. In other words, no displacement of elements or nodes in the X, Y and Z directions was allowed. Following the burnishing parameters and tracks (Figure 2), the burnishing process was modelled. There were four main steps to be followed. Step one: starting from the corner of designated burnishing area, the ball initially moves downward along Y-direction at a certain depth (i.e., equivalent to burnishing force F), penetrating into the material, with no rotations of the ball about the X, Y, and Z axes allowed. Step two: the ball moves along the (+) X-direction at a certain speed (i.e., feed f), creating a burnishing track, where the ball is allowed to freely rotate about Z-axis to simulate the rolling motion (in practice, some extent of sliding may occur, in addition to rolling). Step three: while still penetrating into the material, the ball moves with a stepping distance (i.e., step-over, S) along the (+) Z-direction, with the ball being freely rotated about X-axis, which allows the ball to be ready for the next burnishing track along the (−) X-direction, like in step one. Repeating Step two allows the ball to continue burnishing with zig-zag tracks, until the designated area (5 mm × 5 mm) is completely burnished. Step four: as a final step at the end of last track, the ball moves upward along the (+) Y-direction, i.e., the ball is unloaded from the surface. This step concludes one complete pass of burnishing over the entire area. The contact between the ball and workpiece is assumed to be frictionless, though the actual surface may not be smooth, as there would be some roughness. After each burnishing simulation, hardness, plastic strain, and residual stress along the X-axis (feed direction) and along the Z-axis (step-over direction) across the depth of the burnished area are estimated. Three different lines on the cross-section are located (see Figure 6), and the data at 0.05 mm intervals along the depth is recorded. The average of three lines is the final estimate. As burnishing causes plastic deformation or flow of material along the feed (X) and step (Z) directions significantly, only residual stress along the X and Z directions is estimated, presented, and analyzed in this study. Note that hardness is indirectly estimated from the predicted plastic strain or deformation data, by using the relationship between the Vickers hardness HV and effective flow stress σ e of the material as [19]:
H V = k σ e
where, k is a constant, and the flow stress σ e can be mathematically represented in terms of strain ε and strain rate ε ˙ , by using the constitutive model of Johnson and Cook [20] for room temperature testing as:
σ e = ( A + B ε n ) [ 1 + C ln ( ε ˙ ε 0 ˙ ) ] ,
where, n = work-hardening exponent, ε ˙ = reference strain rate (generally taken as 1 s−1), and A, B, and C = constants that describe the work-hardening behavior, whose values are estimated via curve-fitting of experimental results. Since the burnishing is considered as a low-to-medium plasticity deformation, a relatively smaller strain rate ε ˙ of 0.001 is used. The values of the constants including n and k are estimated via split Hopkinson tensile bar experiments with AZ31B Mg alloys [20]:as A = 254.3 MPa, B = 430.4 MPa, n = 0.3939, C = 0.01611, k = 2.9.

3. Results

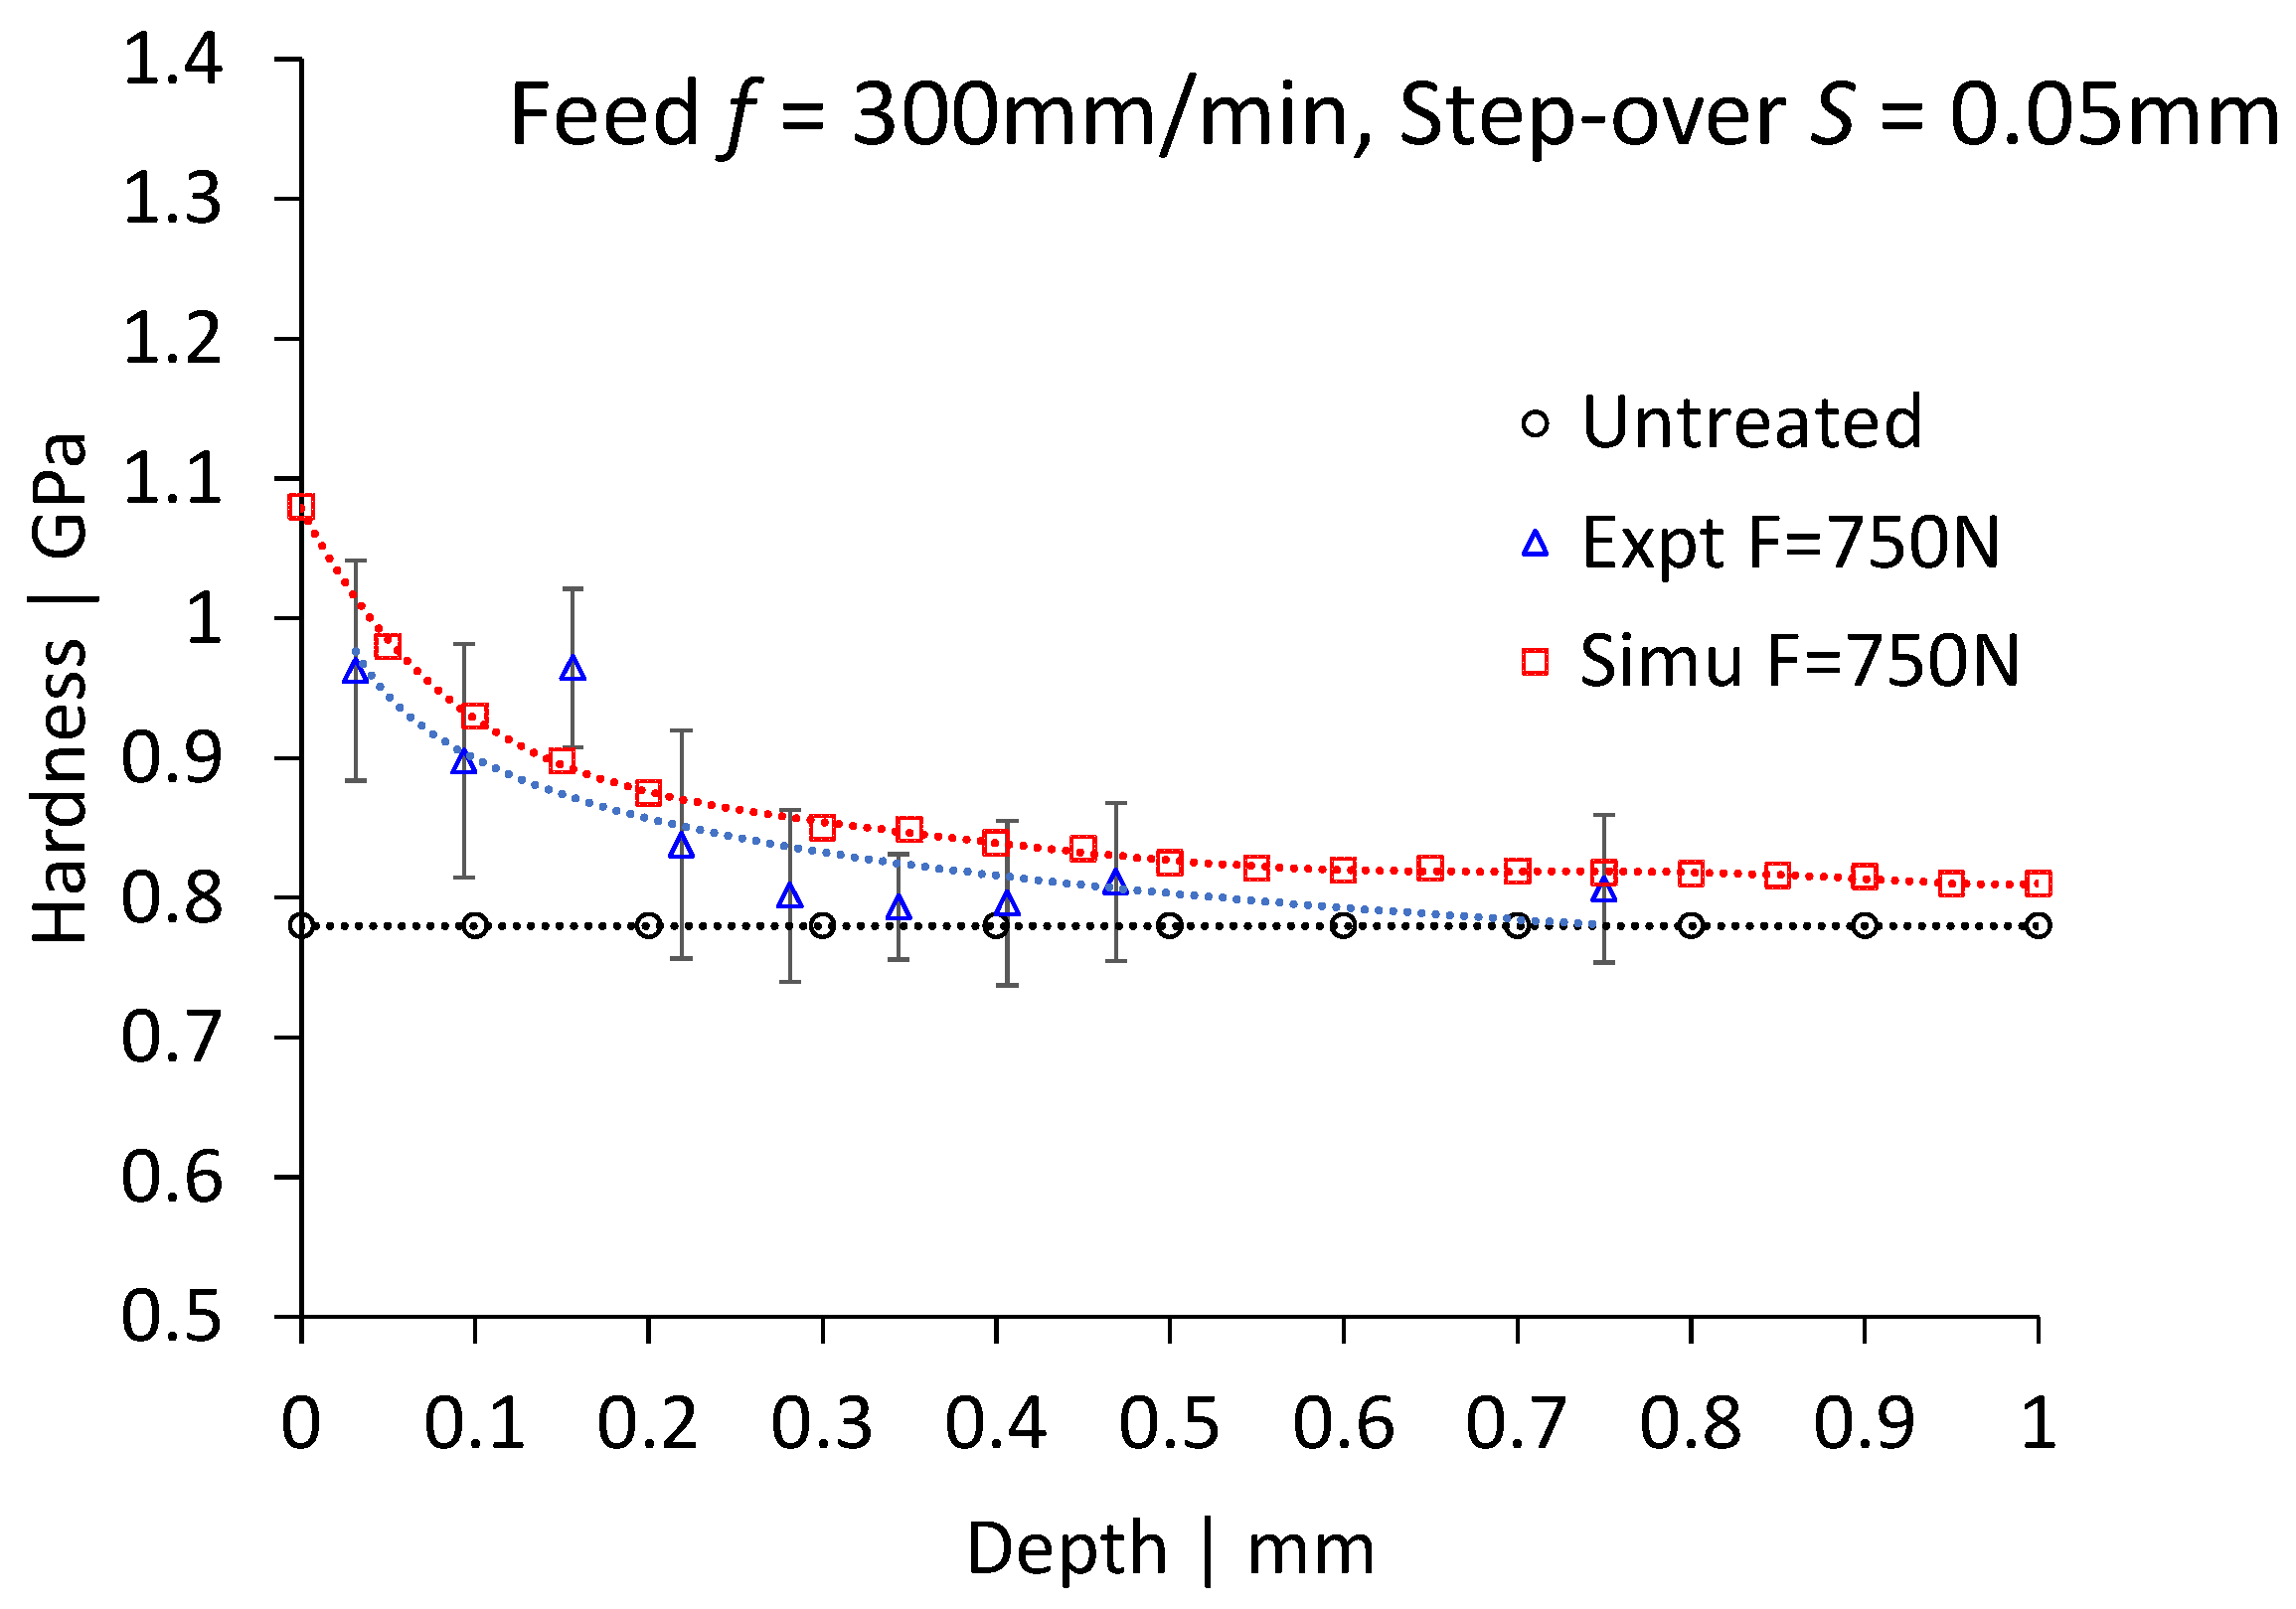
3.1. Comparison between Experiment and the Finite Element Model

In order to validate the FE model, the predicted hardness was compared with that of the experiment. As a representative, Figure 7 shows a comparison of hardness against the cross-sectional depth (from top edge of the burnished specimen) obtained from both the experiment and the simulation, for a burnishing force of 750 N, feed of 300 mm/min, and step-over of 0.05 mm. The dotted lines in Figure 7 indicate the overall trend of the data. The hardness of untreated or unburnished specimen is shown as a reference. It can be seen that, compared to the untreated surface, burnishing has significantly improved the surface’s hardness, with the highest increase at the top surface, while the effect diminishes gradually and matches the untreated surface as the depth increases. The simulated hardness is found to be greater than the experimental one, with a maximum error of about 10%. In the FE model, as the material is considered solid homogeneous, the hardening is more significant via a large plastic deformation, resulting in greater hardness than from the experimental process; this is particularly evidenced at a higher cross-section sectional depth. On the other hand, the experimental test specimens might have had pre-existing impurities, voids, and dislocations, and under burnishing load or pressure, the amount of plastic strain is relatively small—i.e., the material may have undergone, to a large extent, elastic deformation through those defects, hence leading to less plastic deformation and hardness. It should be noted that a larger burnishing force will increase plastic strain and changes in the micro-structure, and hence is expected to increase hardness at the sub-surface. The effect of existing defects on the strain/strain rate will be lower, and the material will behave as a solid homogenous. Therefore, the difference between simulated and experimental hardness is found to be 8.5% and 8%, for burnishing forces of 1650 N and 2650 N, respectively. Such error is reasonable, leading to a satisfactory agreement, and it supports the validity of the FE model and the reliability of its predicted results.

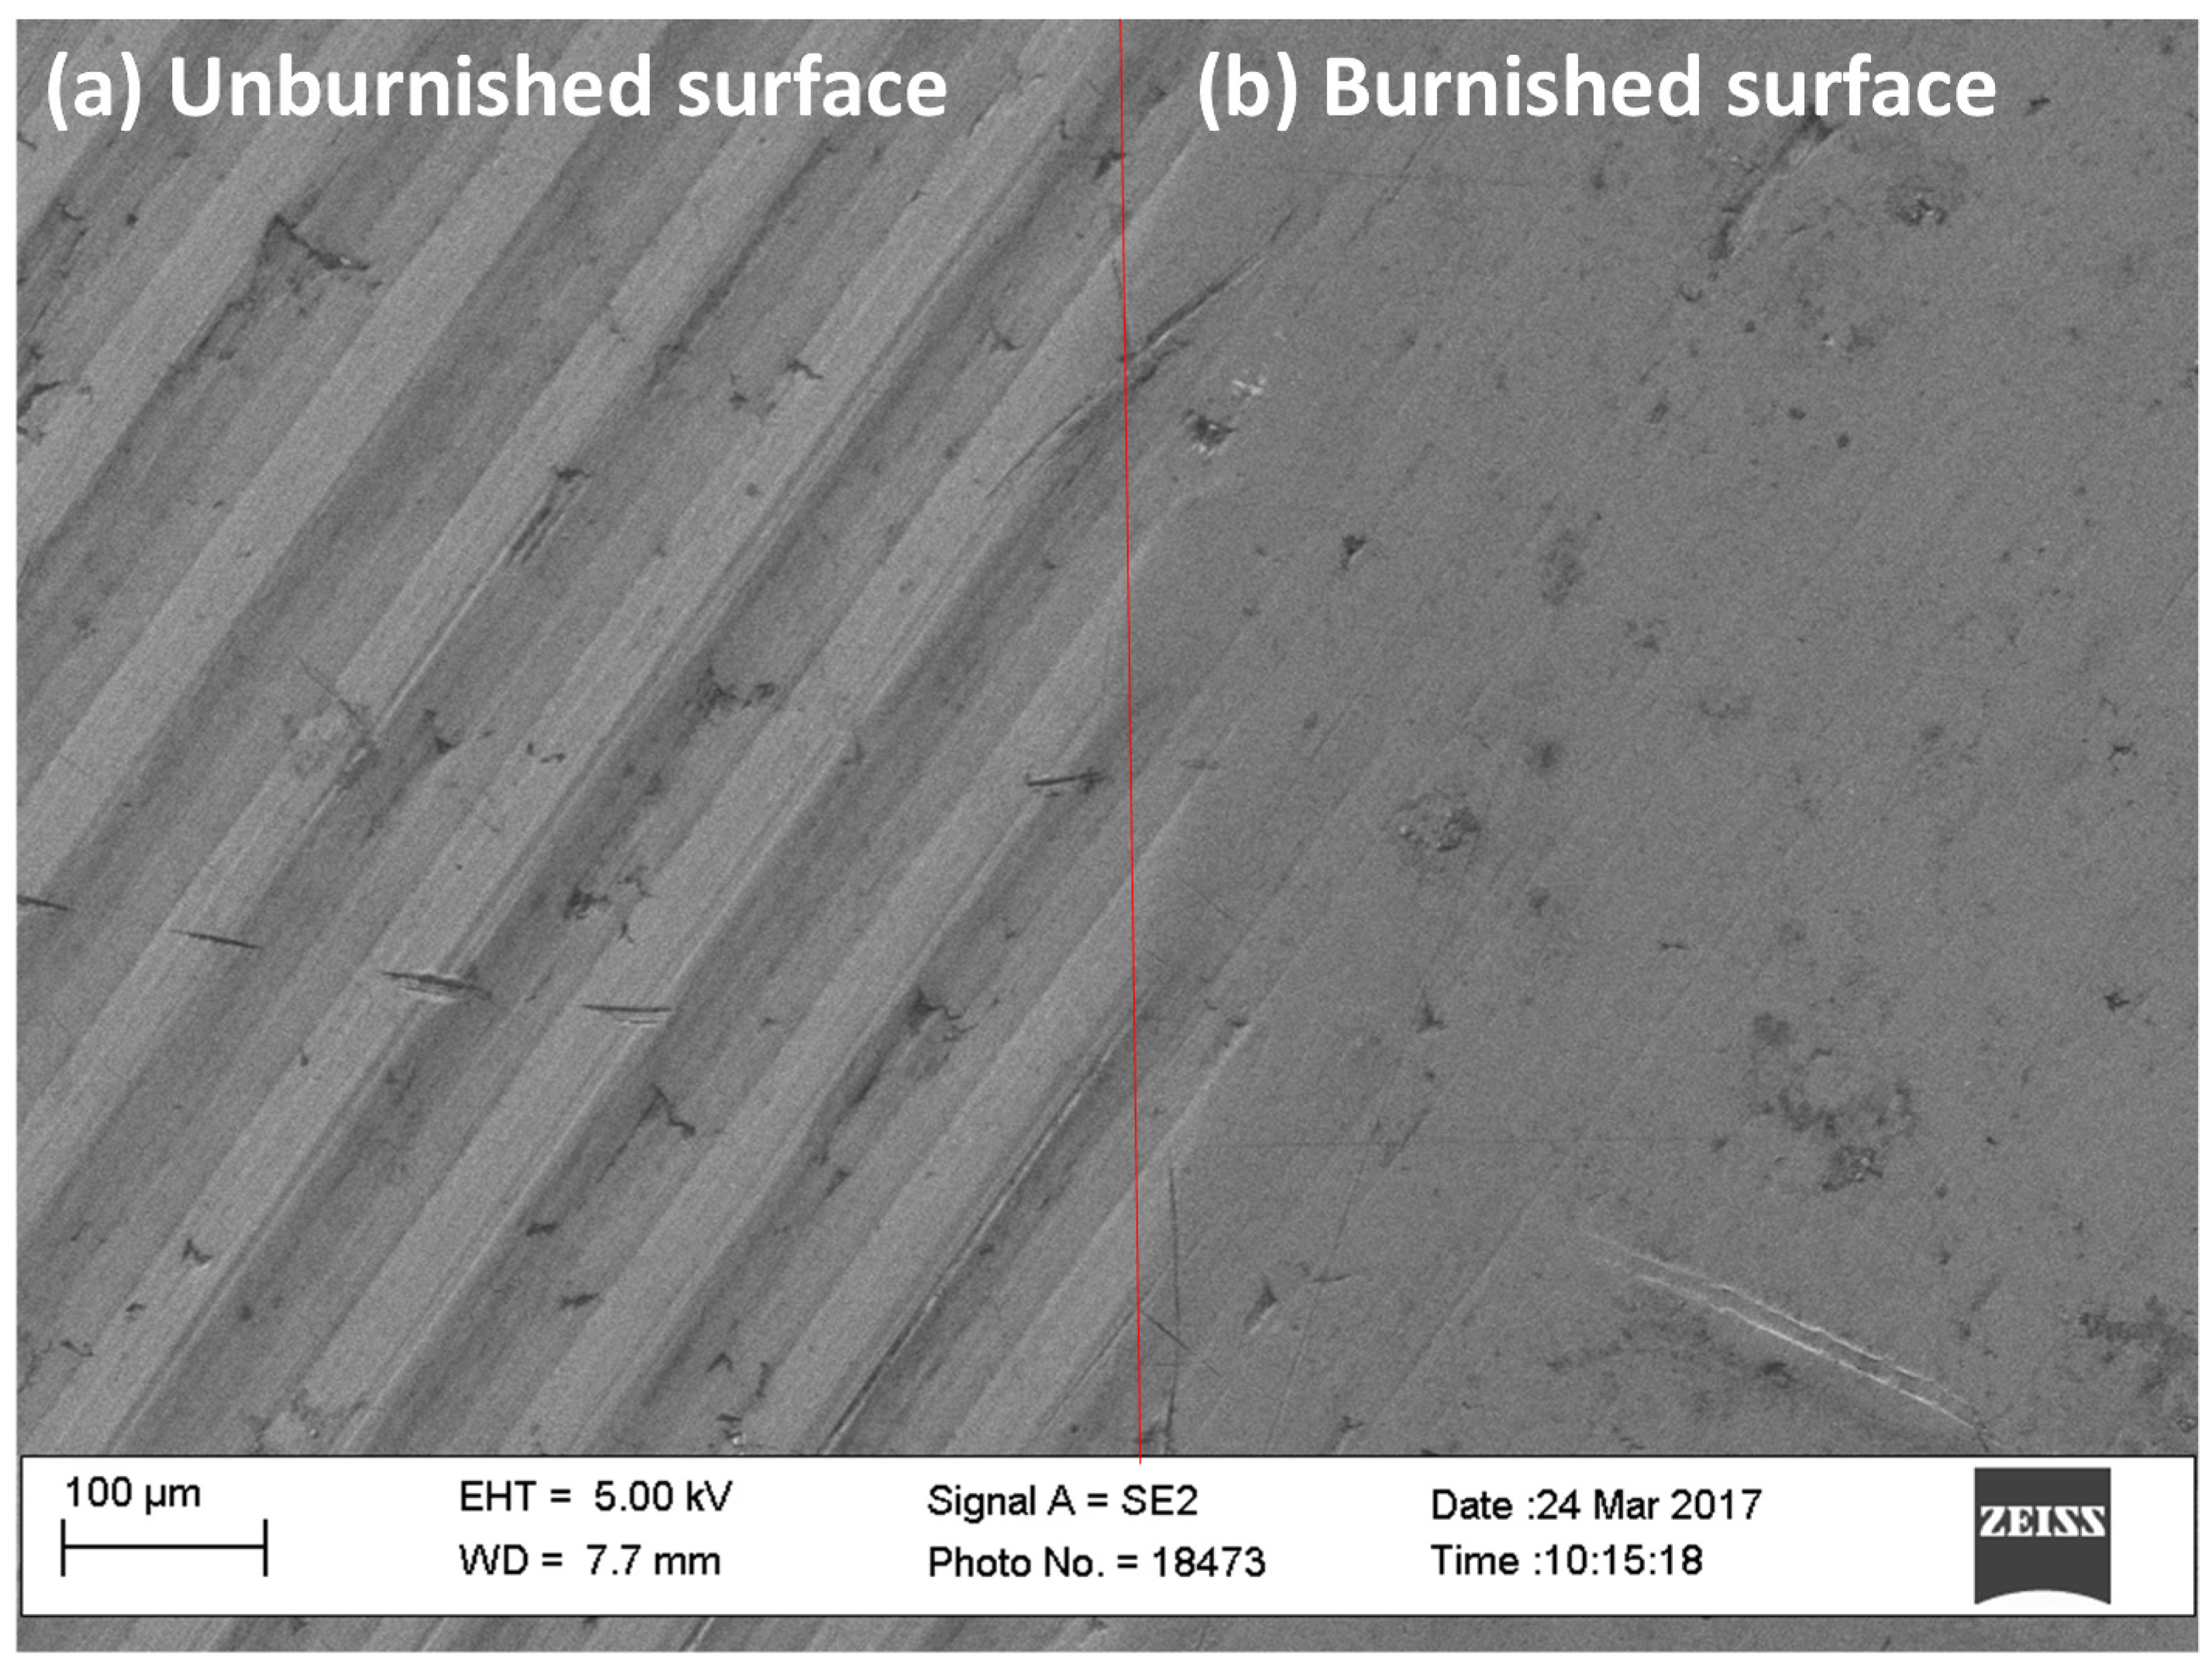
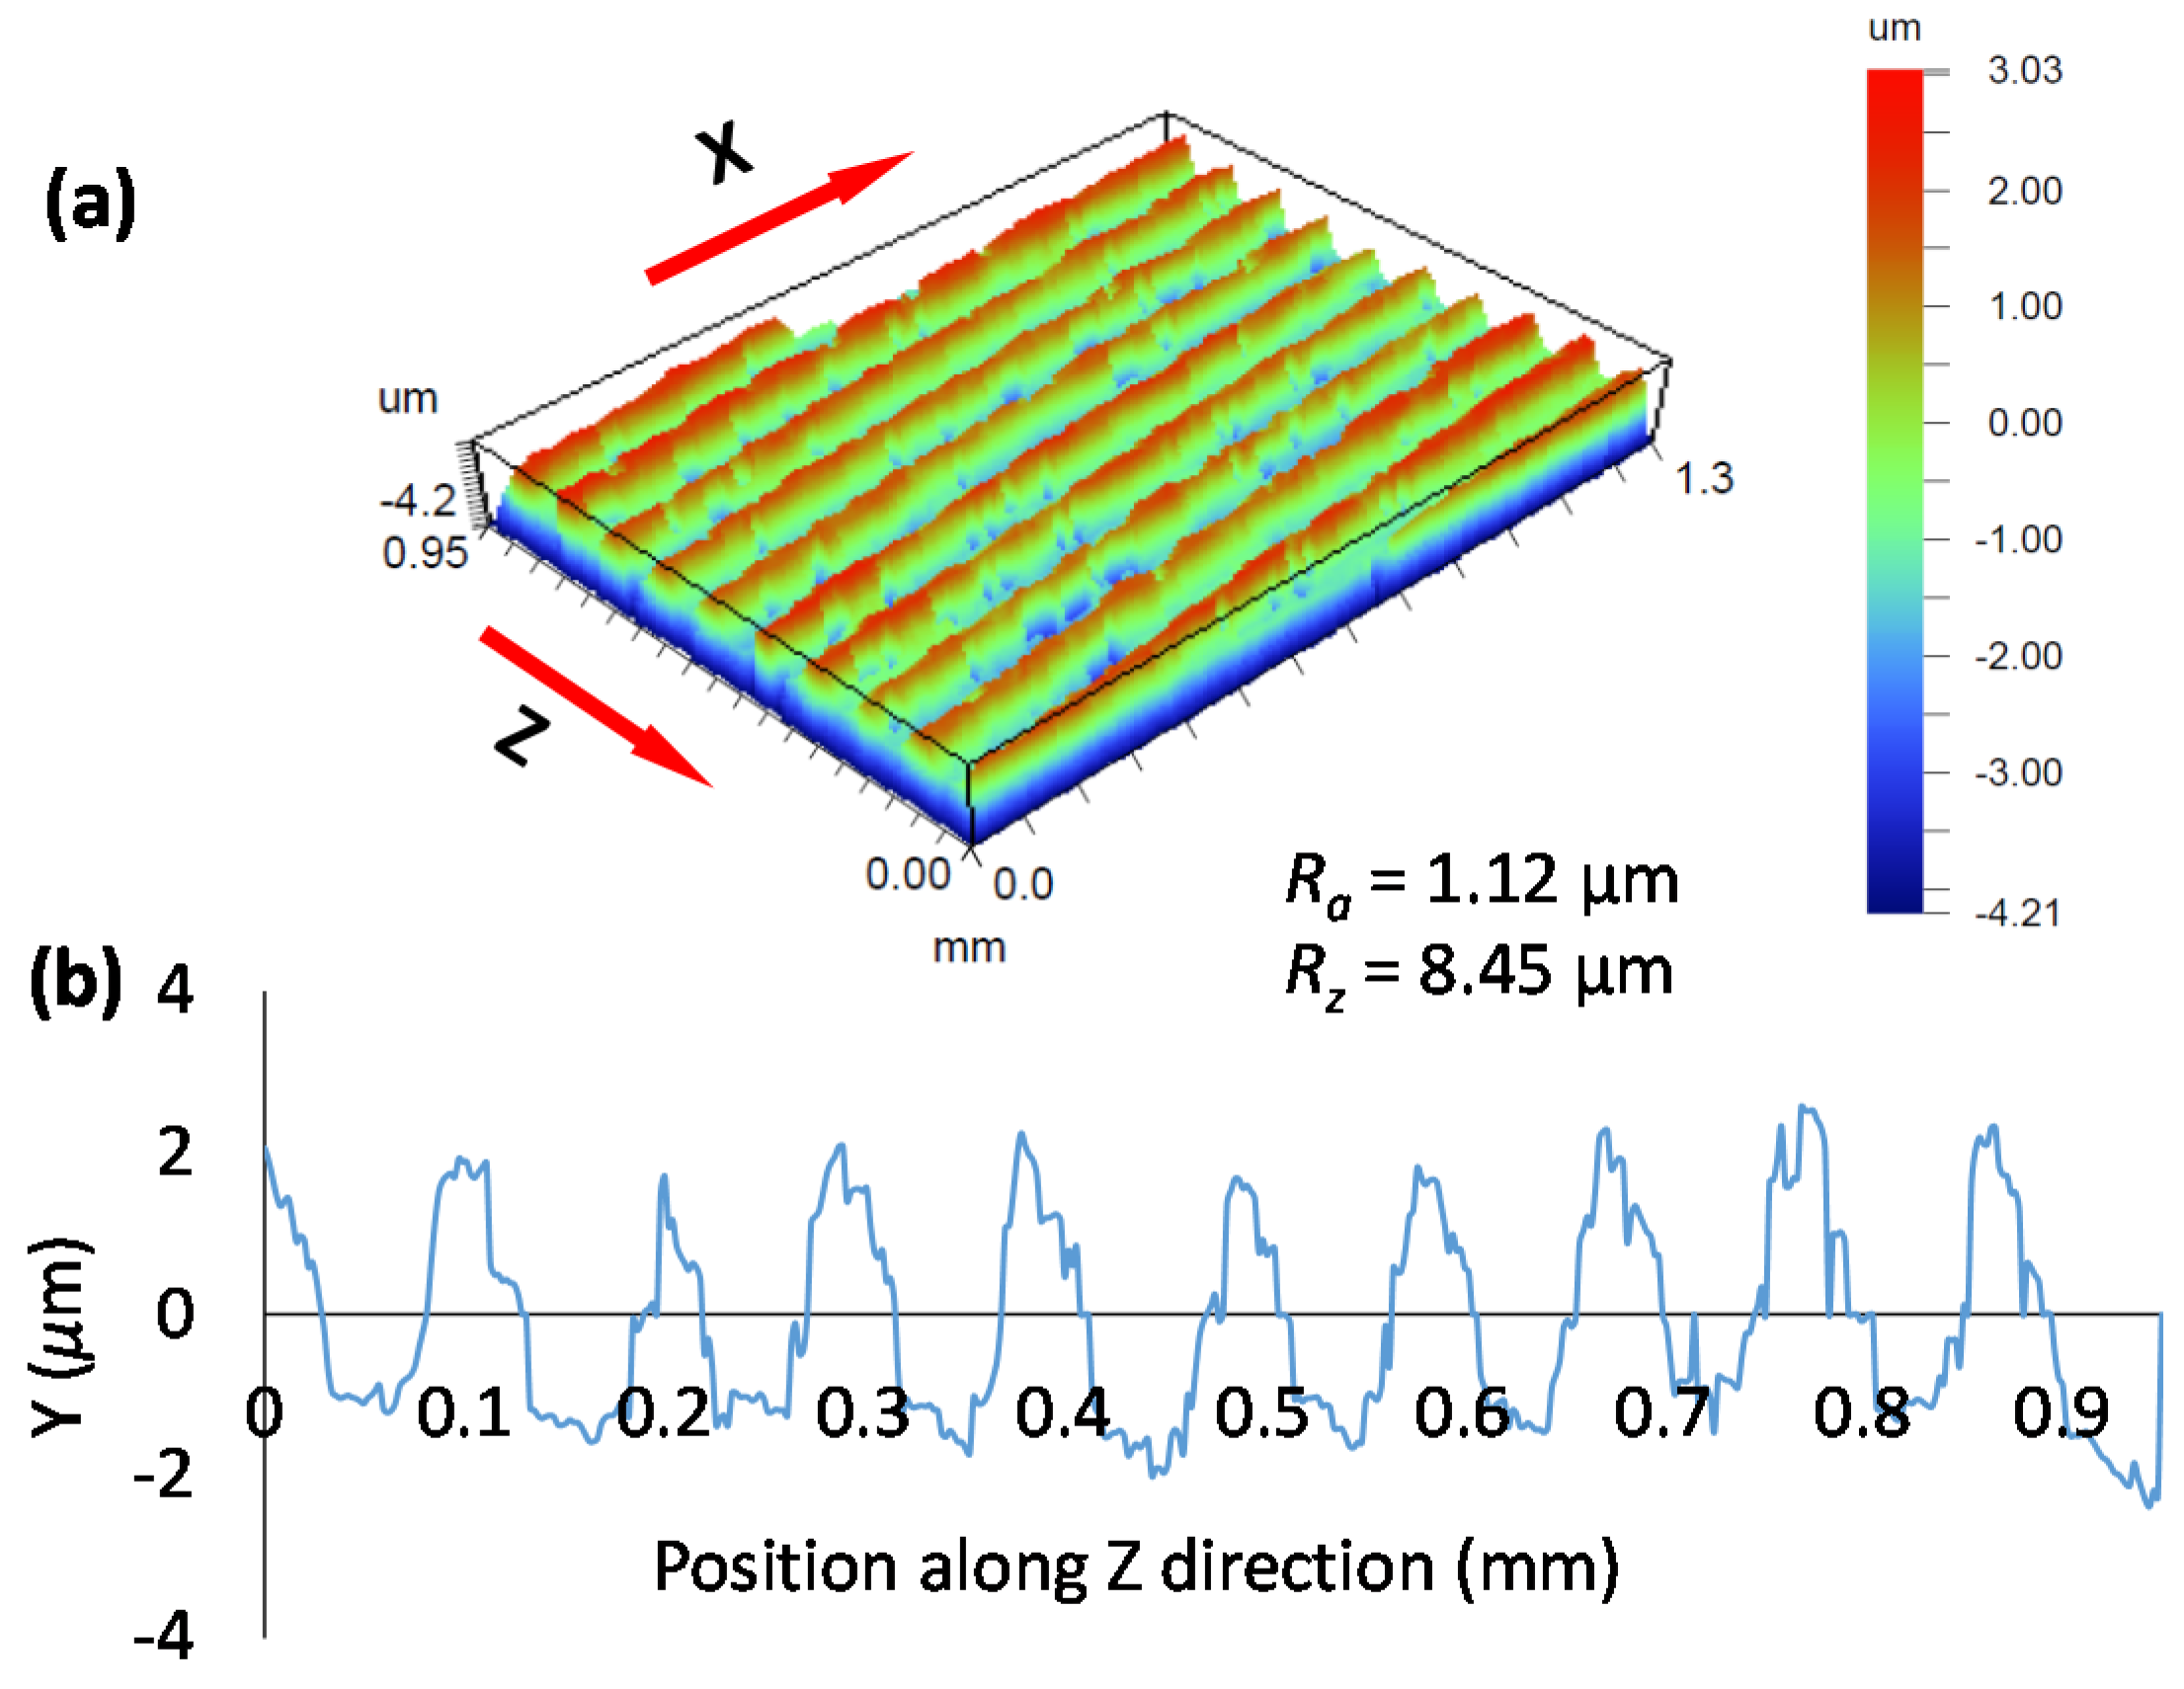
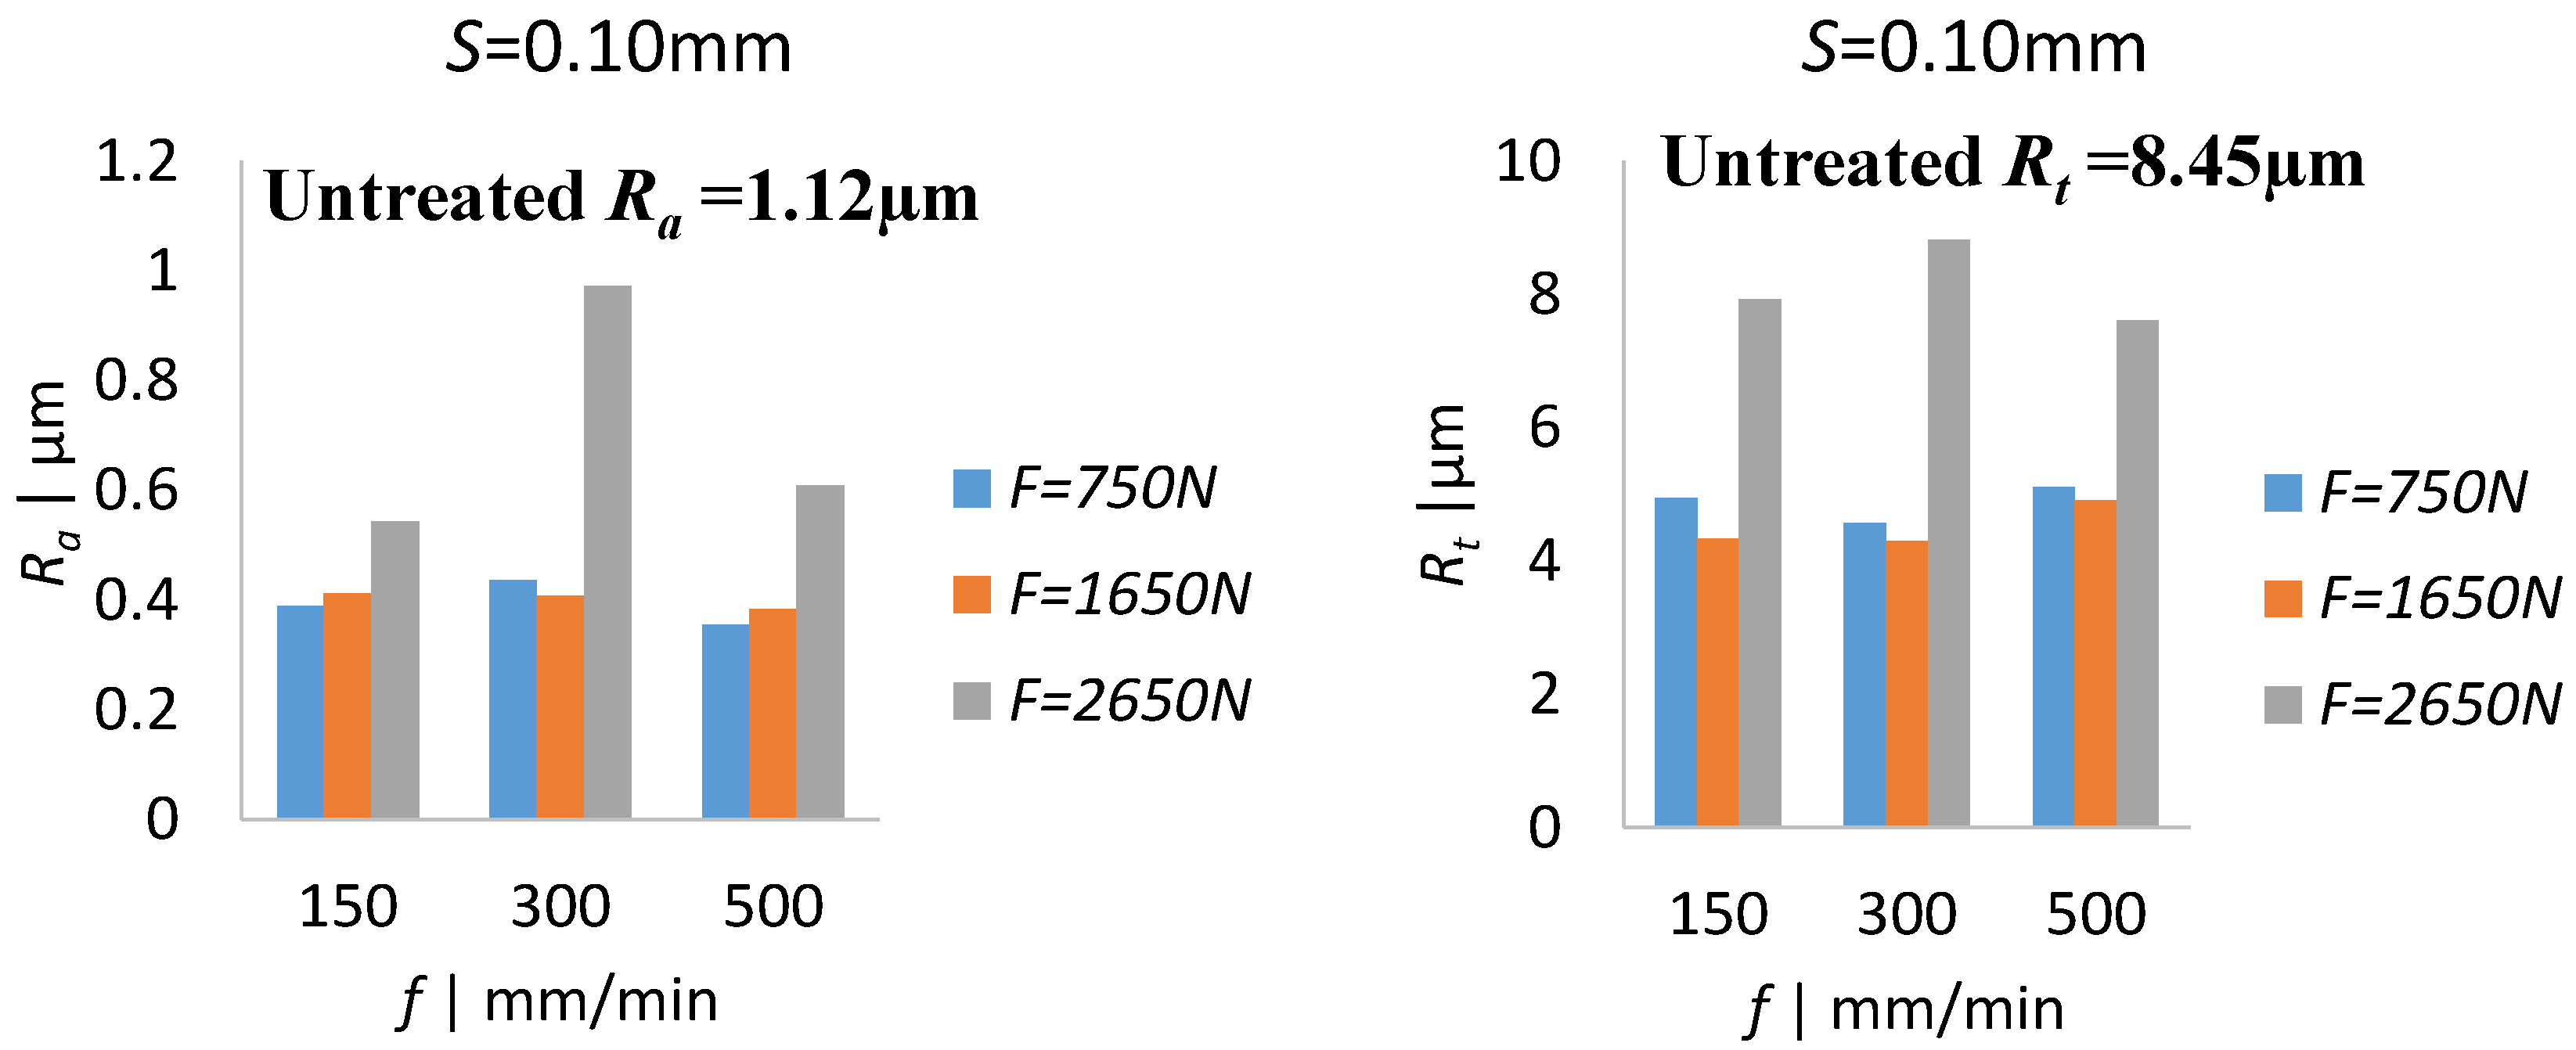
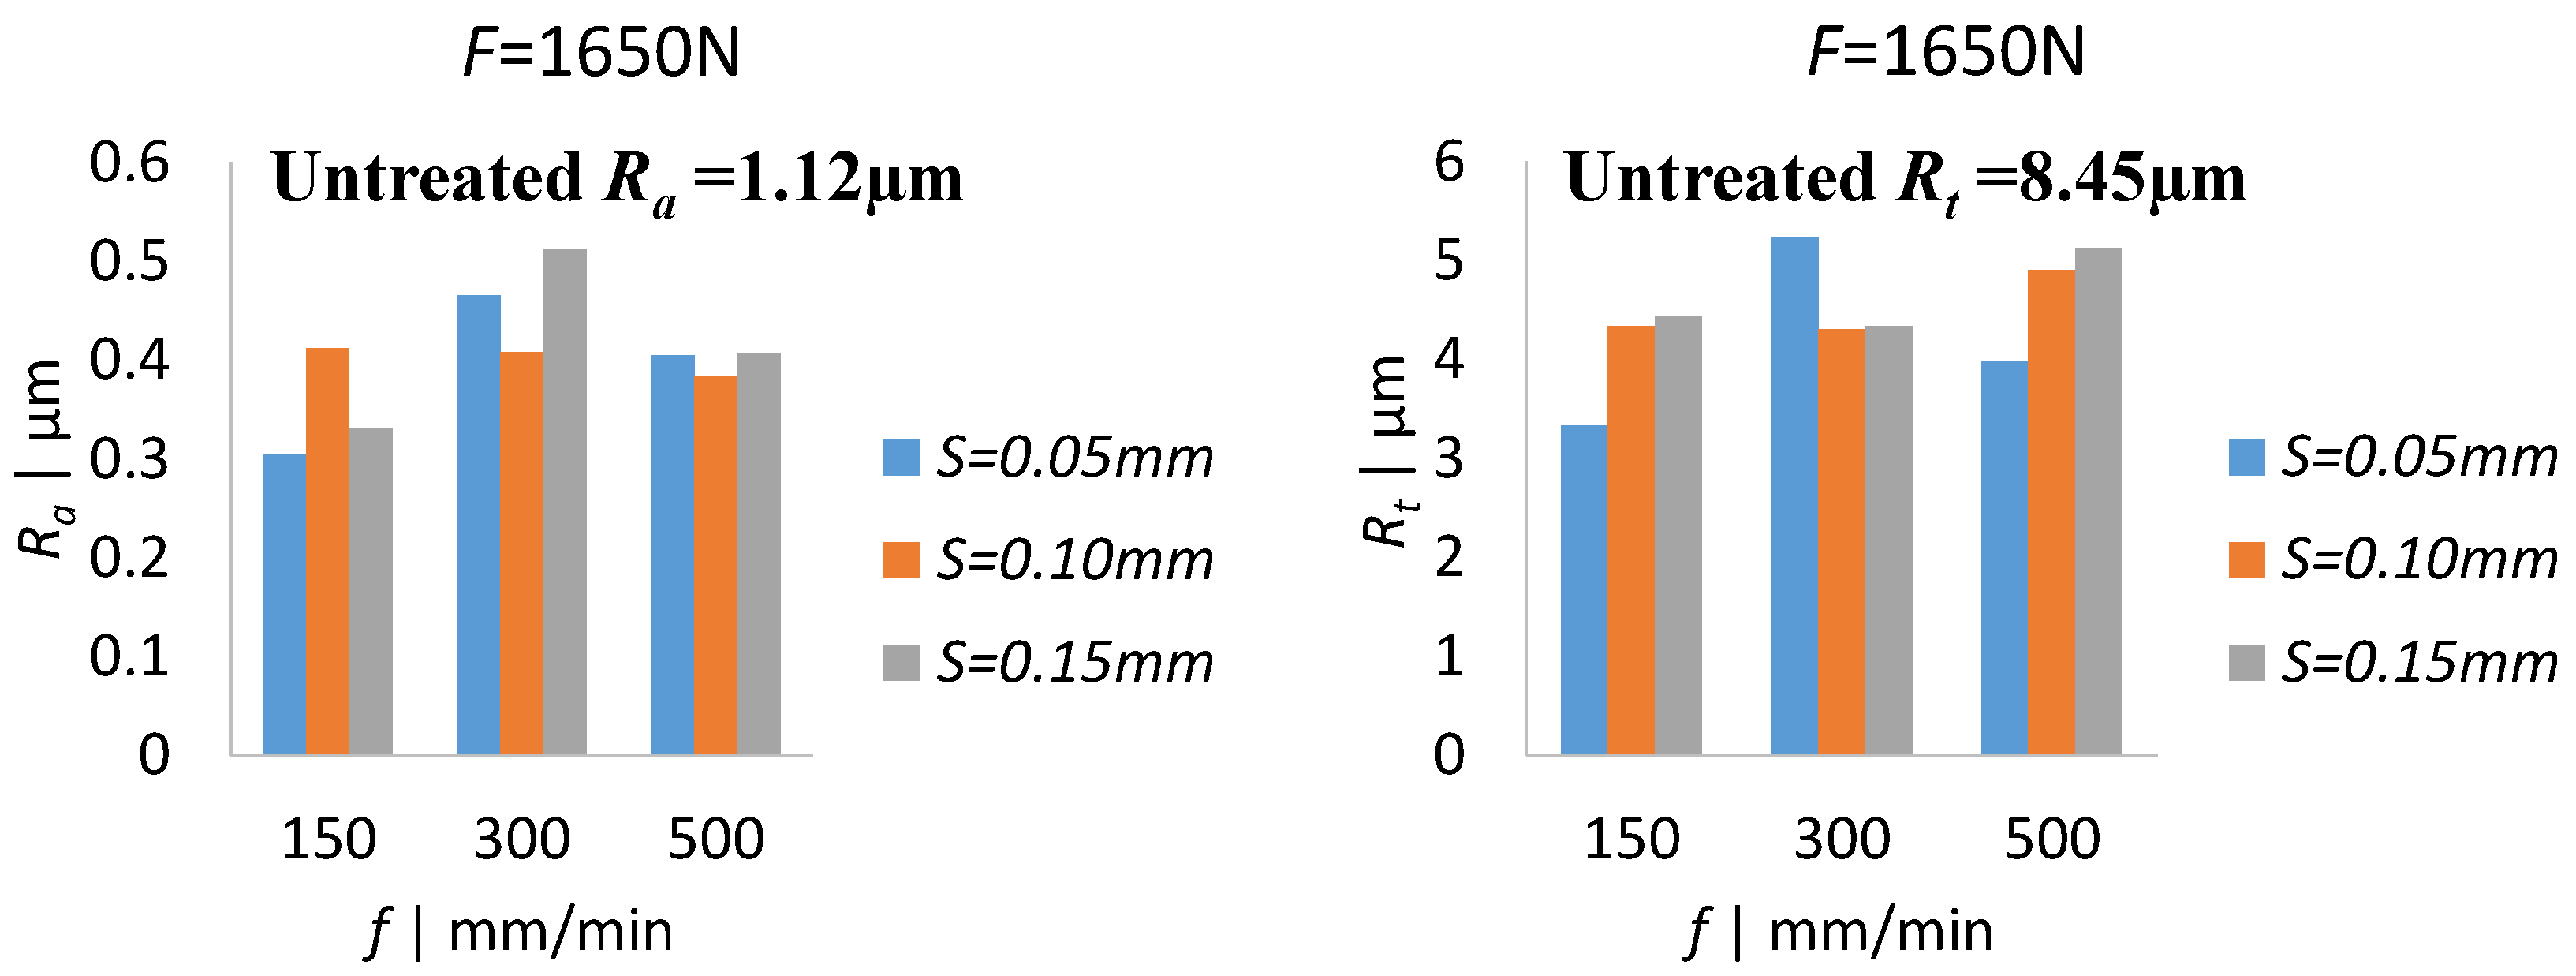
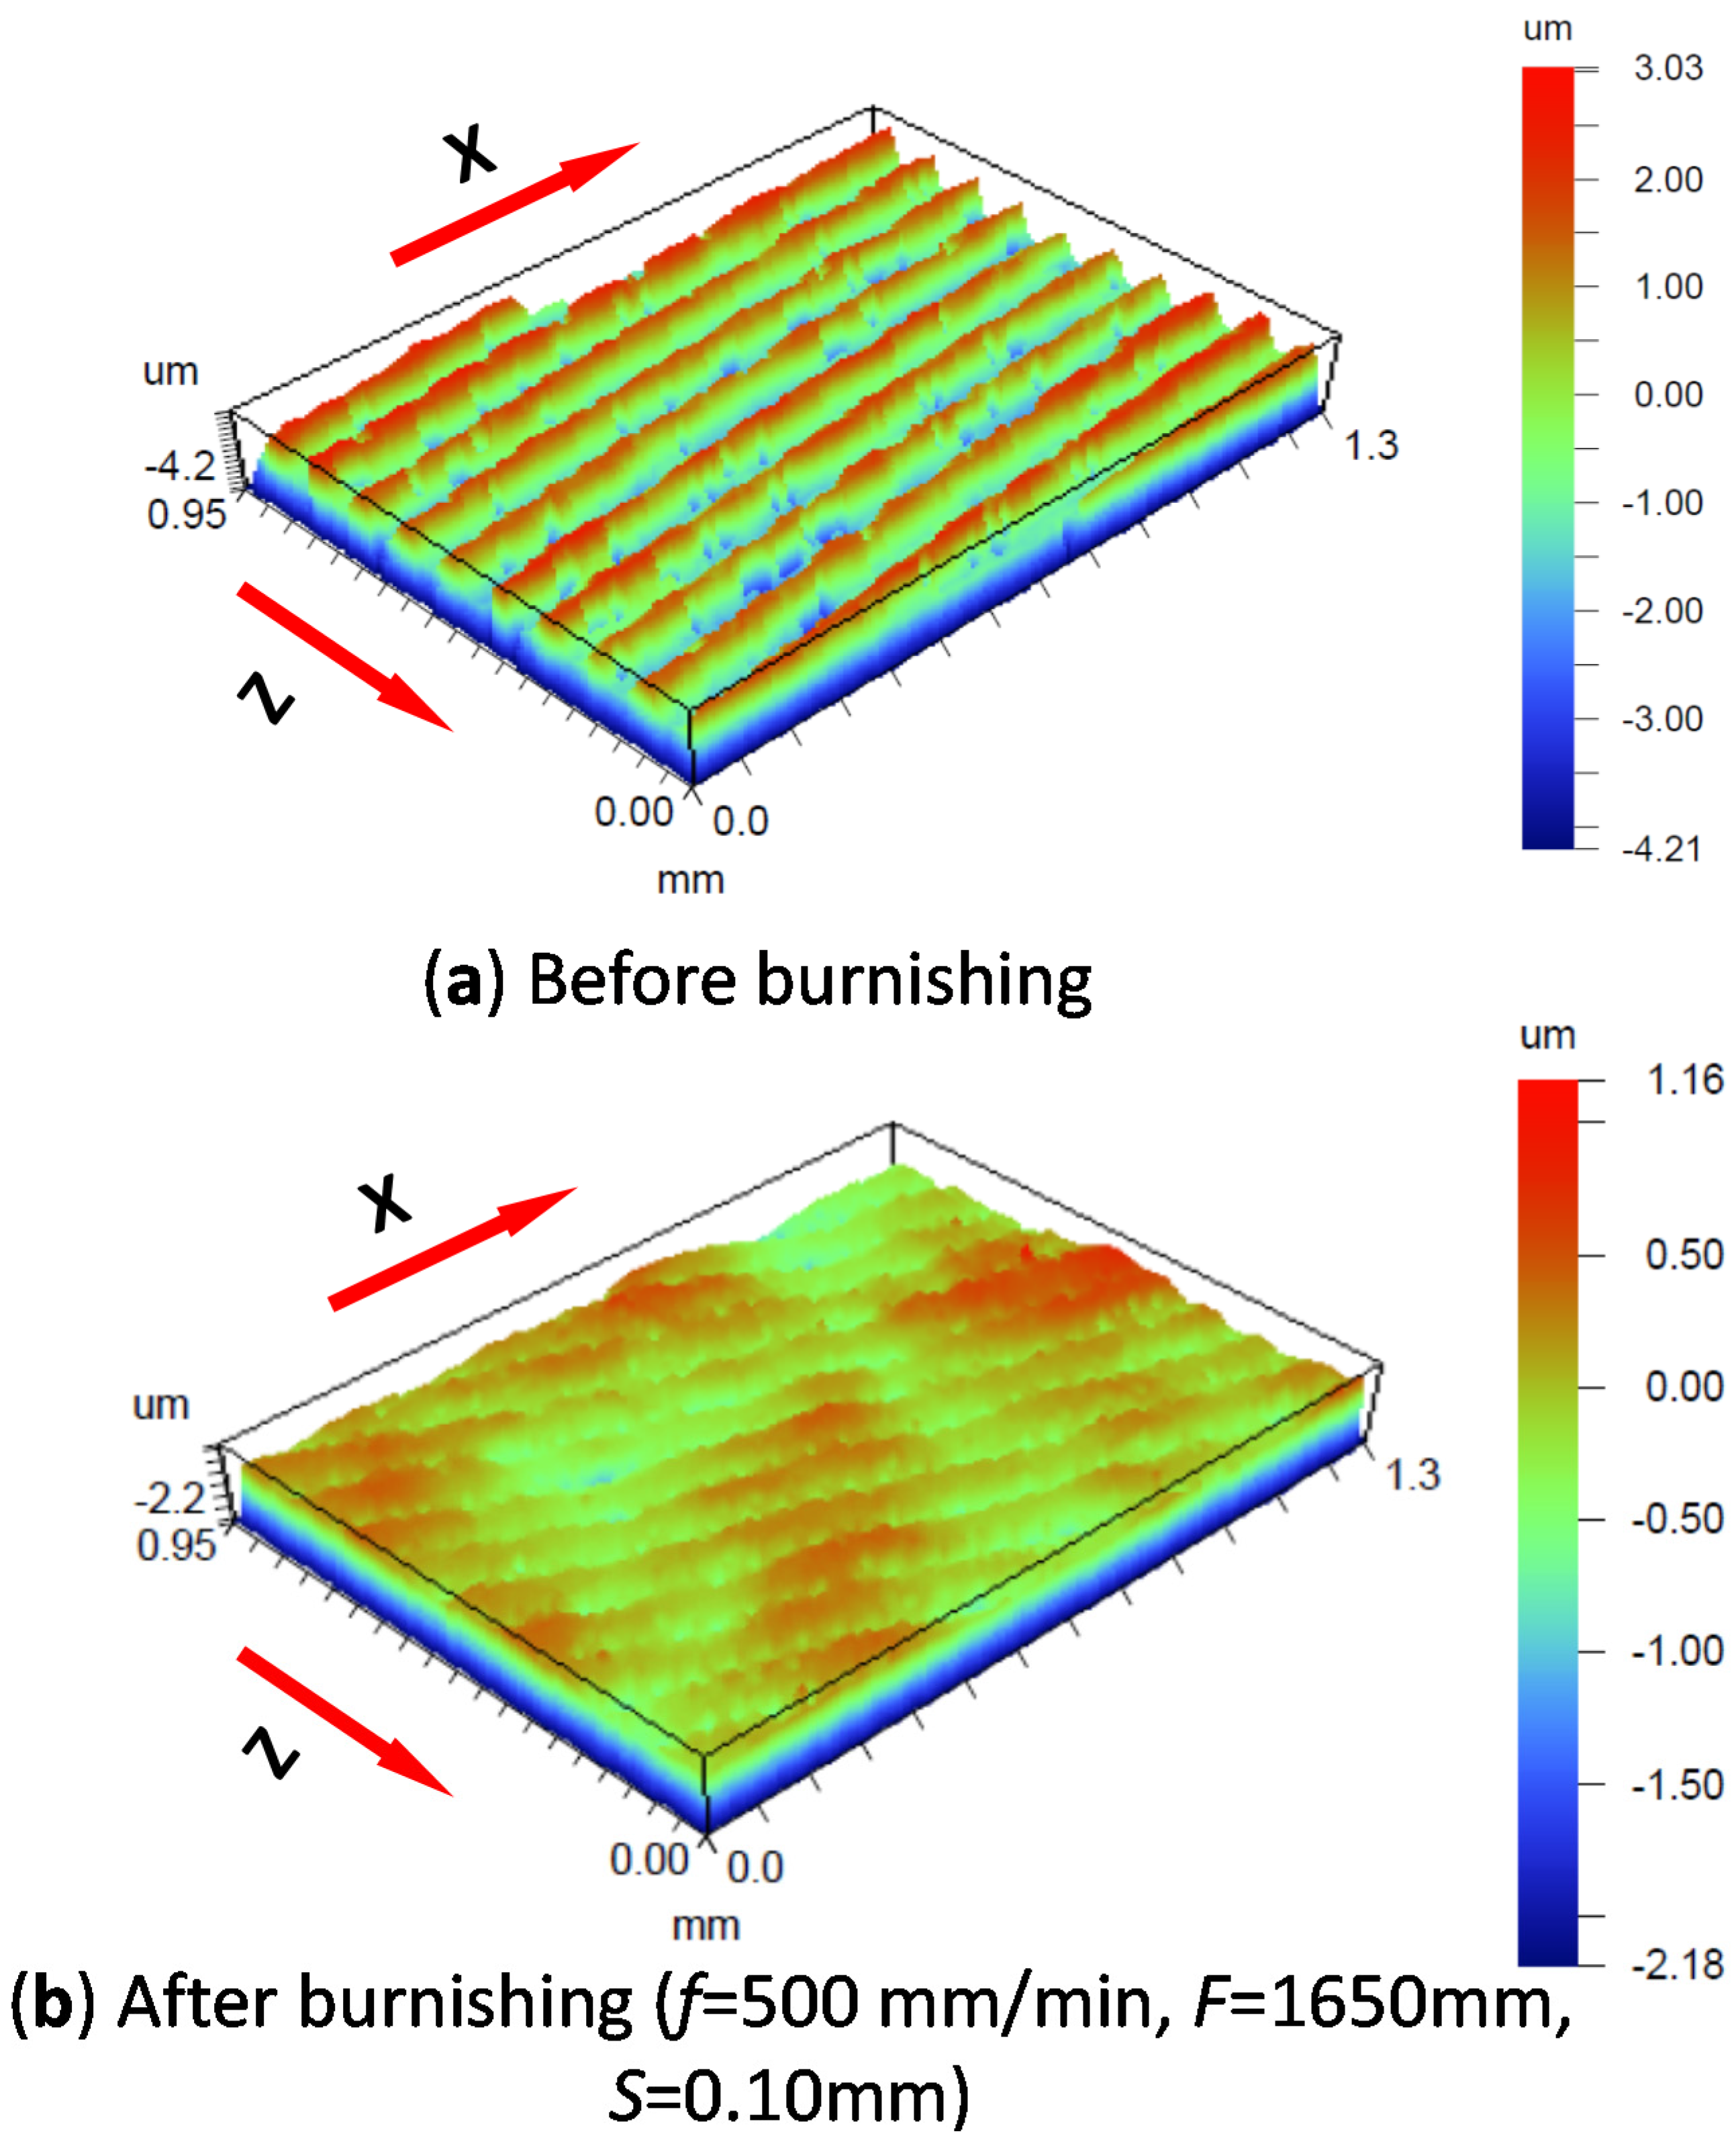
3.2. Analysis of Experimental Surface Roughness and Topography

Figure 8 shows a comparison of surface roughness (Ra and Rt) after burnishing, with respect to force and feed, at a step-over of 0.10 mm. The lower the burnishing force, the larger the roughness reduction, i.e., the greater the improvement in finish. For instance, burnishing at force of 1650 N and a feed of 300 mm/min exhibited an approximately 62% and 46% reduction in Ra and Rt, respectively, with regards to the untreated area. When the force was increased to 2650 N, both Ra and Rt increased drastically, meaning that large forces caused the generation of additional deeper ridges as the ball follows the burnishing tracks, making the surface rougher. This may damage the surface and generate top-surface cracks. One interesting observation is that there was statistically little to no difference in roughness change when burnishing with a force of 750 N or 1650 N. This can be due to the fact that such a low force range is adequate enough to induce plastic deformation into material within the skewness or trough height of the initial surface, improving surface roughness. These results imply that a lower burnishing force would be preferred.
The feed seems to have an insignificant influence on roughness, with the exception of the intermediate feed of 300 mm/min, showing a slight increase of roughness irrespective of the force. The results indicate that lower force and lower feed offer a beneficial burnishing effect in reducing roughness and improving surface integrity, which is expected to prevent potential pitting corrosions. Similar to Figure 8, all burnishing conditions improve roughness with respect to the untreated surface; in particular, at a given burnishing force, a smaller step-over and lower feed rate reduce Ra and Rt (see Figure 9). The results on the effect of step-over and feed rate, as shown in Figure 8, is presented with a representative force of 1650 N, which is a central value of the three forces being considered here. Similar or equivalent trends for the other forces can be expected, and as such, the results for those forces are omitted. As can be seen from Figure 9, the lowest reduction in Ra and Rt were found to be approximately 73% and 60%, respectively, when the surface was burnished at a step-over of 0.05 mm and a feed of 150 mm/min for a given force of 1650 N. A smaller step-over means that part of the same burnished track surface is subject to further plastic deformation by the next or subsequent burnishing track, which removes left-over troughs/ridges, resulting in a relatively smooth surface. Further, Figure 10 and Figure 11 show a comparison of optical profilometry and an SEM image of a surface before and after being burnished at F = 1650 N, f = 300 mm/min, and S = 0.10 mm. This comparison indicates that surface roughness and texture is significantly improved after burnishing.

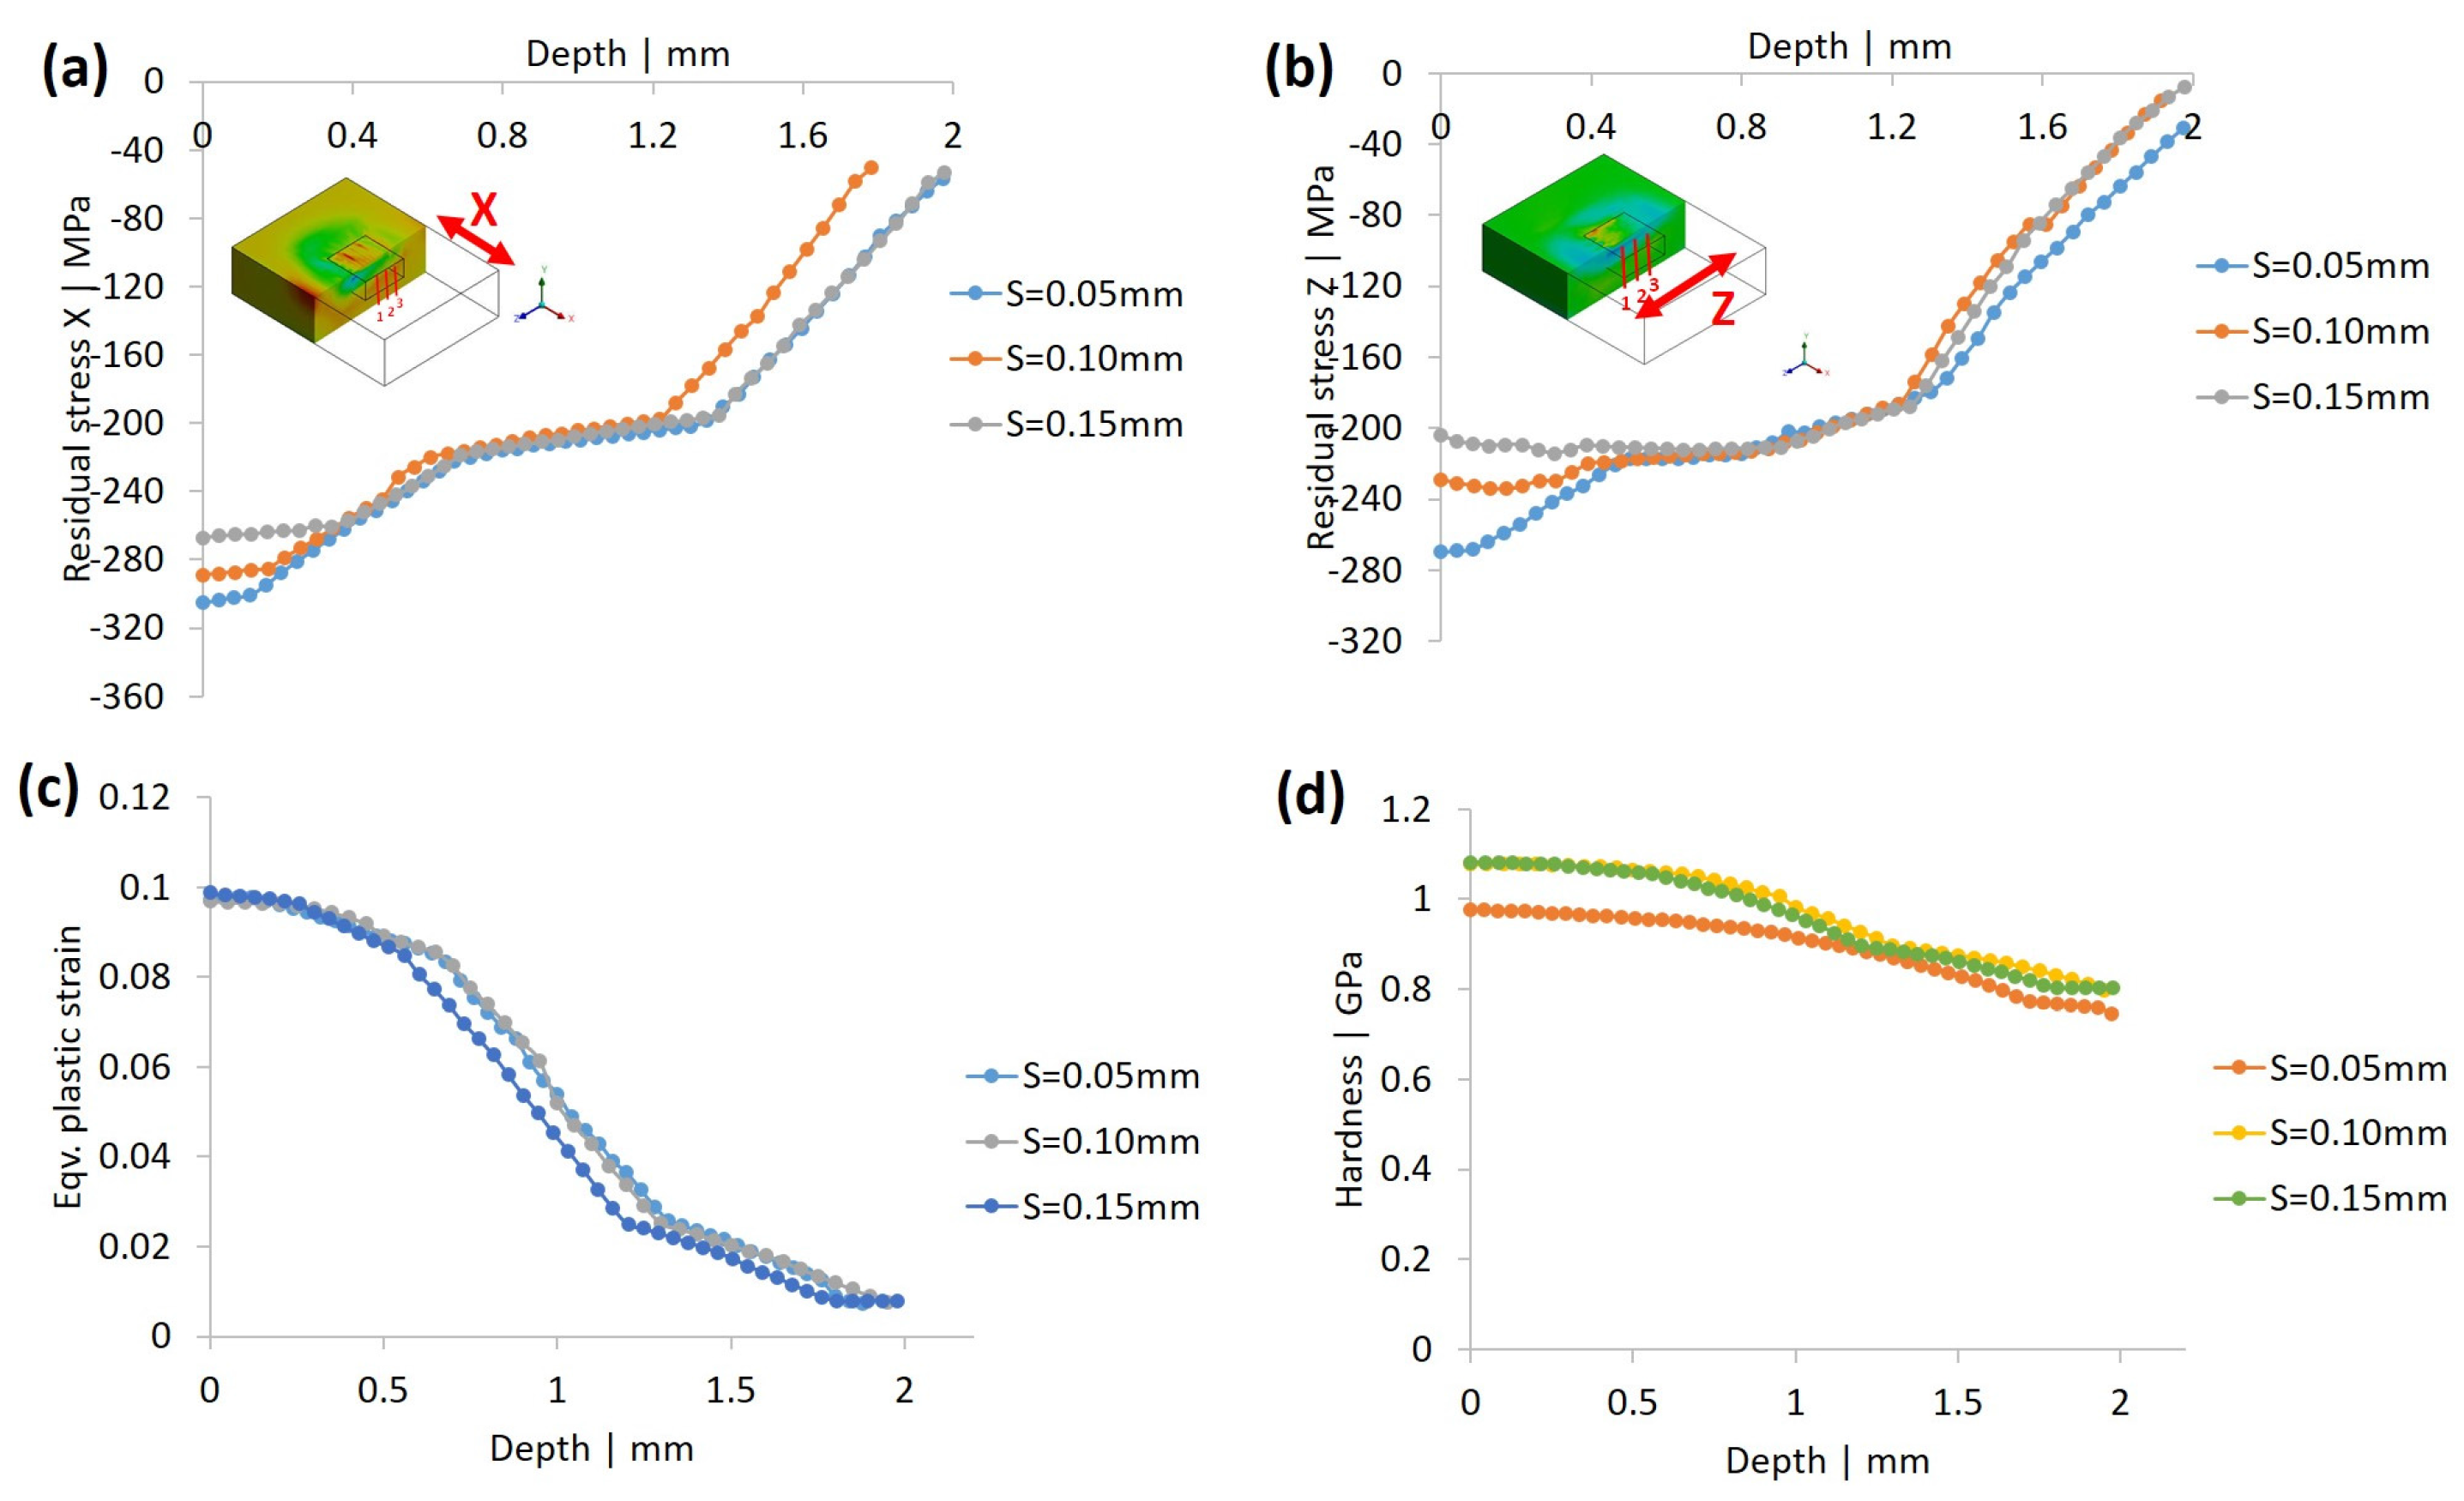
3.3. Sensitivity Study via Finite Element Modelling

3.3.1. Effect of Burnishing Force

As is well known, burnishing generates residual stress within the subsurface of material, which is found to enhance fatigue life and reduce corrosion resistance. Figure 12a,b indicate that residual stress in the X (along feed) and Z (along step-over) directions increases with the increase of a burnishing force, up to 1650 N. The maximum increase in stress is found at the top surface, and both stresses decrease as the depth increases. Interestingly, when the force is increased further to 2650 N, residual stress at the top surface drops, but increases as the depth increases. This indicates that a greater burnishing force may not generate higher residual stress. Instead, tensile stress may potentially be generated, which may cause damage and cracks on the top surface, as explained in more details in Section 4. However, it is seen that irrespective of stress magnitude in the feed and step directions, a larger force seems to induce compressive stress below the top surface, i.e., the deeper modified surface. An appropriate force must therefore be applied in order to achieve the desired surface integrity. Note that residual stress in the X direction seems to be larger than that in the Z direction, regardless of burnishing force. This would be attributed to the fact that the material flow and plastic deformation is the most dominant along feed (X) direction than Z direction. As shown in Figure 12c,d, equivalent plastic strain and hardness increase with the burnishing force, and they are found to be at their maximum at the top surface, and gradually decrease as the depth increases. Most importantly, greater force increases hardness at deeper layers, with respect to the nominal hardness (0.78 GPa) of the untreated surface. For instance, while a force of 750 N imparts 1 mm deep hardness until reaching the reference hardness, forces of 1650 N and 2650 N induce 1.5 mm and 1.92 mm deep hardened layers within the material, respectively. As is obvious, plastic strain and hardness follow the same trend, and, as such, the result is consistent with and supported by the change of residual stress with the effect of burnishing force.

3.3.2. Effect of Burnishing Step

As is shown in Figure 13a,b, the lower the step-over the higher the residual stress X and Z when the depth increases up to 0.40 mm. After this, the step-over has insignificant effect on residual stress except for a slight variation only after a depth of 1.2 mm up to 2 mm. Smaller step-over means that the part of previous burnished surface is burnished again by the next burnishing track, hence resulting increase of plastic deformation and material at a lower depth. Again, residual stress X is higher than residual stress Z. In particular, variation of residual stress Z is quite noticeable at a lower depth (up to 0.40 mm). Similar to residual stress, equivalent plastic strain follows the same trend (Figure 13c). On the other hand, when step-over is 0.05 mm, hardness is low until a depth of 1 mm, while step-over of 0.10 mm and 0.15 mm increase hardness at the same level and follow the same trend during that depth level (Figure 13d). After the depth level of 1 mm, step-over has minimal effect on hardness. Overall, it can be concluded that smaller step-over is beneficial in generating larger compressive stress at shallow depth, and, accordingly, step-over should be selected as per the intensity and depth of surface modification required.

3.3.3. Effect of Burnishing Feed Rate

Figure 14 shows the effect of feed rate on residual stress, plastic strain, and hardness. As can be seen in Figure 14a, the lower the feed rate, the higher the residual stress in the X direction. When the feed rate is above 300 mm/min, the residual stress drops significantly. Such a trend is quite noticeable at a depth of 0.50 mm, and beyond this, the feed has minimal effect on residual stress along the X direction. A low feed rate causes plastic deformation along the X direction in a smaller area at a slower rate, resulting in fairly larger compressive stress at a shallow depth. In other words, deformed material is settled permanently before the plastic deformation in the next step, i.e., successive plastically deformation is not affected by consecutive burnishing steps. The opposite applies to higher feed rates, which may cause possible tensile stress and hence reducing overall residual stress. On the other hand, the residual stress along Z-direction is not affected by the feed rate until a depth of 0.40 mm; beyond this, the stress drops significantly when the feed rate is 500 mm/min, while the effect of feed rates of 150–300 mm/min is none or minimal (Figure 14b). As can be seen in Figure 14c,d, while a higher feed rate increases plastic strain slightly when the depth is up to 0.40 mm, such effect on hardness is minimal. Overall, the results indicate that lower feed rate seems to be beneficial in increasing residual stress but provides little enhancement in hardness, which is expected to reduce the corrosion rate in a saline environment.

4. Discussion

Due to the stringent requirements of integral functionality of a product, surface treatment as a post-processing technique is extensively employed to enhance finish, hardness, fatigue, and corrosion performance. Past studies over the decades have clearly demonstrated the overwhelming advantages, and techniques of its kind have now become standard in wider industries, e.g., aerospace, automotive, mining, and biomedical areas. Similar to processes like shot peening and hammering, deep ball-burnishing is a cold-working process with a set of controlled parameters, which imparts the plastic flow, smoothens the surface, and results in compressive stress in material. As a result, the surface becomes harder and wear- and corrosion-resistant, all of which improves fatigue life. This study comprehensively explores the underlying effect of burnishing on the biodegradable AZ31B Mg alloy, with an aim to improve mechanical properties, which consequently will enhance the corrosion resistance for the alloy’s potential application as an orthopedic implant. Conventionally, burnishing is effective in minimizing surface skewness, and our results indicate that lower force and lower step-over smoothen the surface the most. This observation is consistent with previous studies when burnishing Mg-based alloys [12]. However, the level of smoothness or roughness reduction depends on initial roughness and burnishing parameters. For example, when the burnishing force is increased beyond a certain level, the depth of indentation becomes large, resulting in a high amount of plastic deformation, which causes a deeper burnishing track. As a result, surface smoothness may become worse, and subsequently, potential crack and cold weld may initiate, further damaging surface topography. When smoothness is a priority, without a need for altering the dimensional integrity, low burnishing force with a small step would be preferred. As observed from both experiment and simulation, hardness at the top surface is the highest, and reduces at a deeper layer. The trend remains the same at any set of process parameters. However, interestingly, the increase of top surface hardness with a larger burnishing force is marginal. As can be seen from a comparison of experimental hardness, shown in Figure 15, when the force is increased from 1650 N to 2650 N, the difference in increase of top surface hardness is only 7.4%. However, the modified layer with a larger force appears to be deeper (>0.7 mm), meaning that a larger force is able to cause plastic flow of material at a higher depth, compacting material by compressing pores, voids, and cracks. This is a great benefit for the modified material to be used in high load-bearing applications to improve fatigue and wear life. However, such a benefit can be a trade-off by generating additional cracks or tensile stress at the top surface. Careful attention must, thus, be given to eliminate or minimize tensile stress initiated in surface modification process.
Validated with experimental hardness data, a computational FE model has been employed to understand the underlying effect of design variables, hence enabling one to optimize the burnishing process in a short period of time. In particular, this is very crucial for parametric study in the event of demand for a new design, and therefore, the approach is widely used in modern industries to turn a new idea or design into reality in an efficient way [7,18]. With the FE model developed, we have predicted residual stress, hardness, and the plastic strain of burnishing. Residual stress induced by plastic deformation is the key factor responsible for the enhancement of surface integrity. A large burnishing force induces high compressive stress at the top surface, and the stress effect remains at a deeper layer. For instance, at a burnishing force of 750 N, the stress becomes tensile at a depth of 1.6 mm, whereas, at a higher force of 1650 N or 2650 N, the stress becomes as large as up to −325 MPa, and remains compressive at a depth of more than 1.6 mm. Feed-directional stress is higher than step-directional stress. Estimated hardness and plastic strain follow the same trend, as they are the underlying mechanisms towards the generation of residual stress.
The burnishing step (also called the step-over) dictates the overlapping effect, i.e., interference of a previous track by the current, which essentially affects the extent of plastic deformation or material flow (across the adjacent tracks), as well as the type of induced stress (tensile or compressive). Though the amount of overlap and subsequent deformation depends on the depth of the track and the number of passes, our simulation results (based on a single pass burnishing) reveal that a smaller step is beneficial in increasing compressive stress.
As is well-reported, surface roughness worsens with the increase of the feed rate, although with some improvements in productivity. Our simulation results reveal that when the feed rate is within a small range (between 150 and 300 mm/min), the residual stress across the depth is not affected significantly; however, it drops at the top surface when the feed jumps to 500 mm/min. This would be due to the fact that the material has less time to undergo sufficient plastic deformation as the burnishing ball rolls onto the surface. Residual stress along the feed direction (X-direction) is again observed to be the dominant, as compared to transverse direction (i.e., Z-direction). Therefore, if the goal is to induce large compressive stress, a small to medium feed (depending on the capability of the machine used) must be considered, while taking the acceptable surface roughness into consideration.
Residual stress is the most important property which dictates the performance metric (e.g., wear, fatigue, and corrosion) of a treated part. Therefore, the measurement and evaluation of residual stress across surface and sub-surface is crucial to validate the parametric model. Residual stress can be detrimental in terms of deteriorating surface properties instead of the expected burnishing effect if the process is not well controlled [16]. Depending on the burnishing force and track width (i.e., step-over), the net material flow affects the type (i.e., compressive or tensile) and amount of residual stress into the surface. While it is expected that burnishing is supposed to induce a deeper compressive residual stress across the depth from the top surface (as demonstrated in Figure 12, Figure 13 and Figure 14), an amount of tensile stress is often observed in places of the top surface, which may be responsible for potential surface damage and the onset of corrosion. As can be seen in Figure 16, a line of tensile stress along the feed direction (X-axis) within the main burnished area is observed, and it is repeated across the tracks (i.e., the stepping direction, or the Z-axis), while compressive stress is noticed on the areas at the start and finish of ball rolling. Generation of tensile stress along the stepping direction (Z-axis) within the main burnished area is less significant, but a concentrated tensile stress at both the start and finish ends of burnishing is clearly observed. These are the areas where material has experienced little or no plastic deformation. This could even occur when the width of burnishing track is smaller than the step-over distance, meaning that a very narrow strip is left unburnished, thus resulting in tensile stress. It is thus important to perform multiple burnishing passes to ensure adequate overlap and plastic flow of material, and to induce only compressive residual stress across the designated area. Appropriate burnishing path planning is crucial to achieve the desired surface integrity. The importance of the design of a burnishing strategy affecting the net plastic flow and generated residual stress (either tensile or compressive) is reported elsewhere in literature [9].
The change of microstructure due to plastic deformation/flow is another critical aspect to look at, in order to get a better understanding of the reasons for the improvement of surface integrity. The effect of crystallographic orientation and dynamic recrystallization of grains on the improvement of corrosion performance of low plasticity deformation in a cryogenic environment has been reported [15,21]; however, a discrepancy has also been noted. The behavior of microstructural change under the effect of different burnishing conditions would be worthy of further investigation, i.e., whether grain refinement plays any role to the corrosion kinetics. However, the consensus is that residual stress significantly controls surface integrity, hence increasing the corrosion resistance [22,23]. Therefore, the selection of appropriate process parameters is the key to achieving the intended properties of the part. Further, the burnishing ball size, dynamic friction at the interface between the workpiece and the ball (due to potential sliding), and heat generation may affect the deformation behavior and residual stress induced. As the main aim of this study is to explore the effect of key process parameters on surface integrity and residual stress generation on Mg alloys, we have chosen a single burnishing pass. However, it is to be acknowledged that the number of passes may affect the plastic flow and induced stress. Future research will take these perspectives into account, in order to develop a more comprehensive insight into the burnishing of Mg-based alloys.

5. Conclusions

This study has aimed at a parametric study of the burnishing of biodegradable AZ31B Mg alloys via experiment and FE modelling, with a focus of exploring the effect of process parameters on surface integrity and residual stress. Below are a few key findings out of the work presented in this paper.
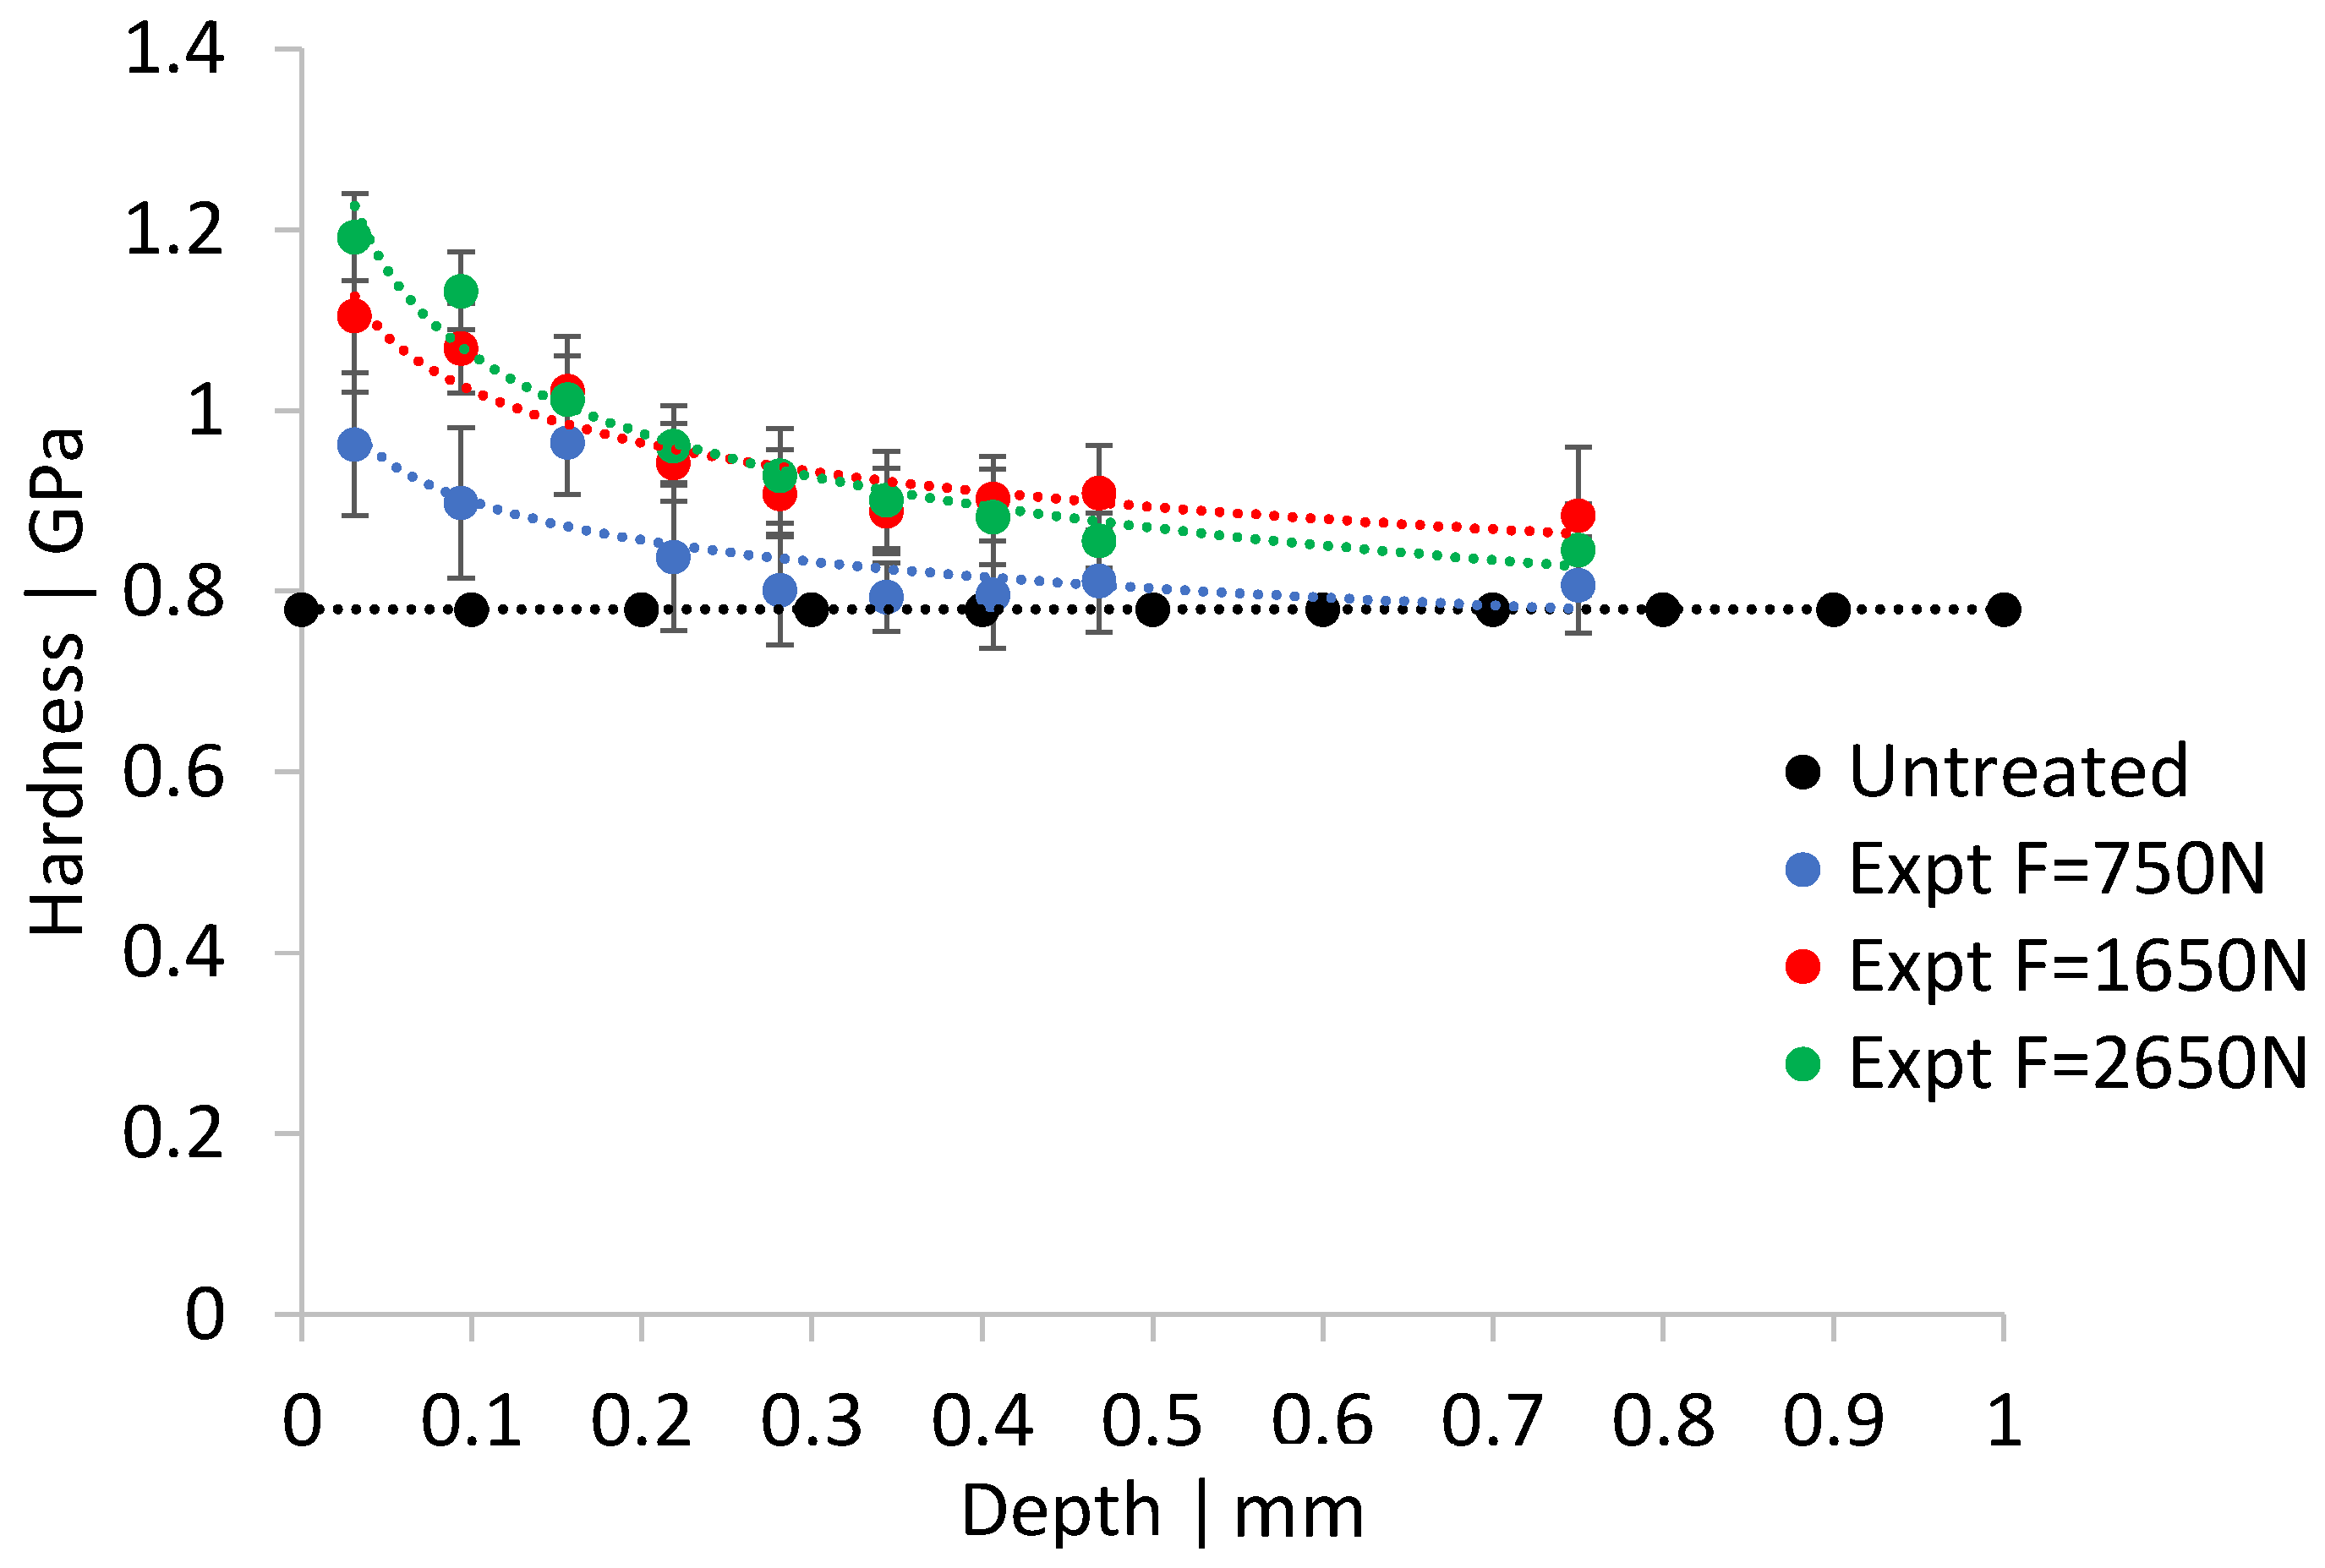
  • Experimental results indicate that compared to untreated specimens, burnishing distinctively improved hardness at the top, to a maximum, which decreases and reaches the bulk hardness (0.78 GPa) as the depth increases.
  • The FE model satisfactorily agrees with the experiment, with a maximum error of 10%, in hardness at burnishing force of 750 N, a feed rate of 300 mm/min, and a step-over of 0.05 mm, hence validating the reliability of the model.
  • Experimental surface topography results indicate that while all burnishing conditions improve roughness compared to the untreated surface, a lower burnishing force (of up to 1650 N) and step-over (of up to 0.10 mm) are shown to significantly reduce surface roughness (Ra and Rt) for a given feed, while feed has minimal effect. A smooth surface is expected to minimize pitting corrosion of Mg alloys.
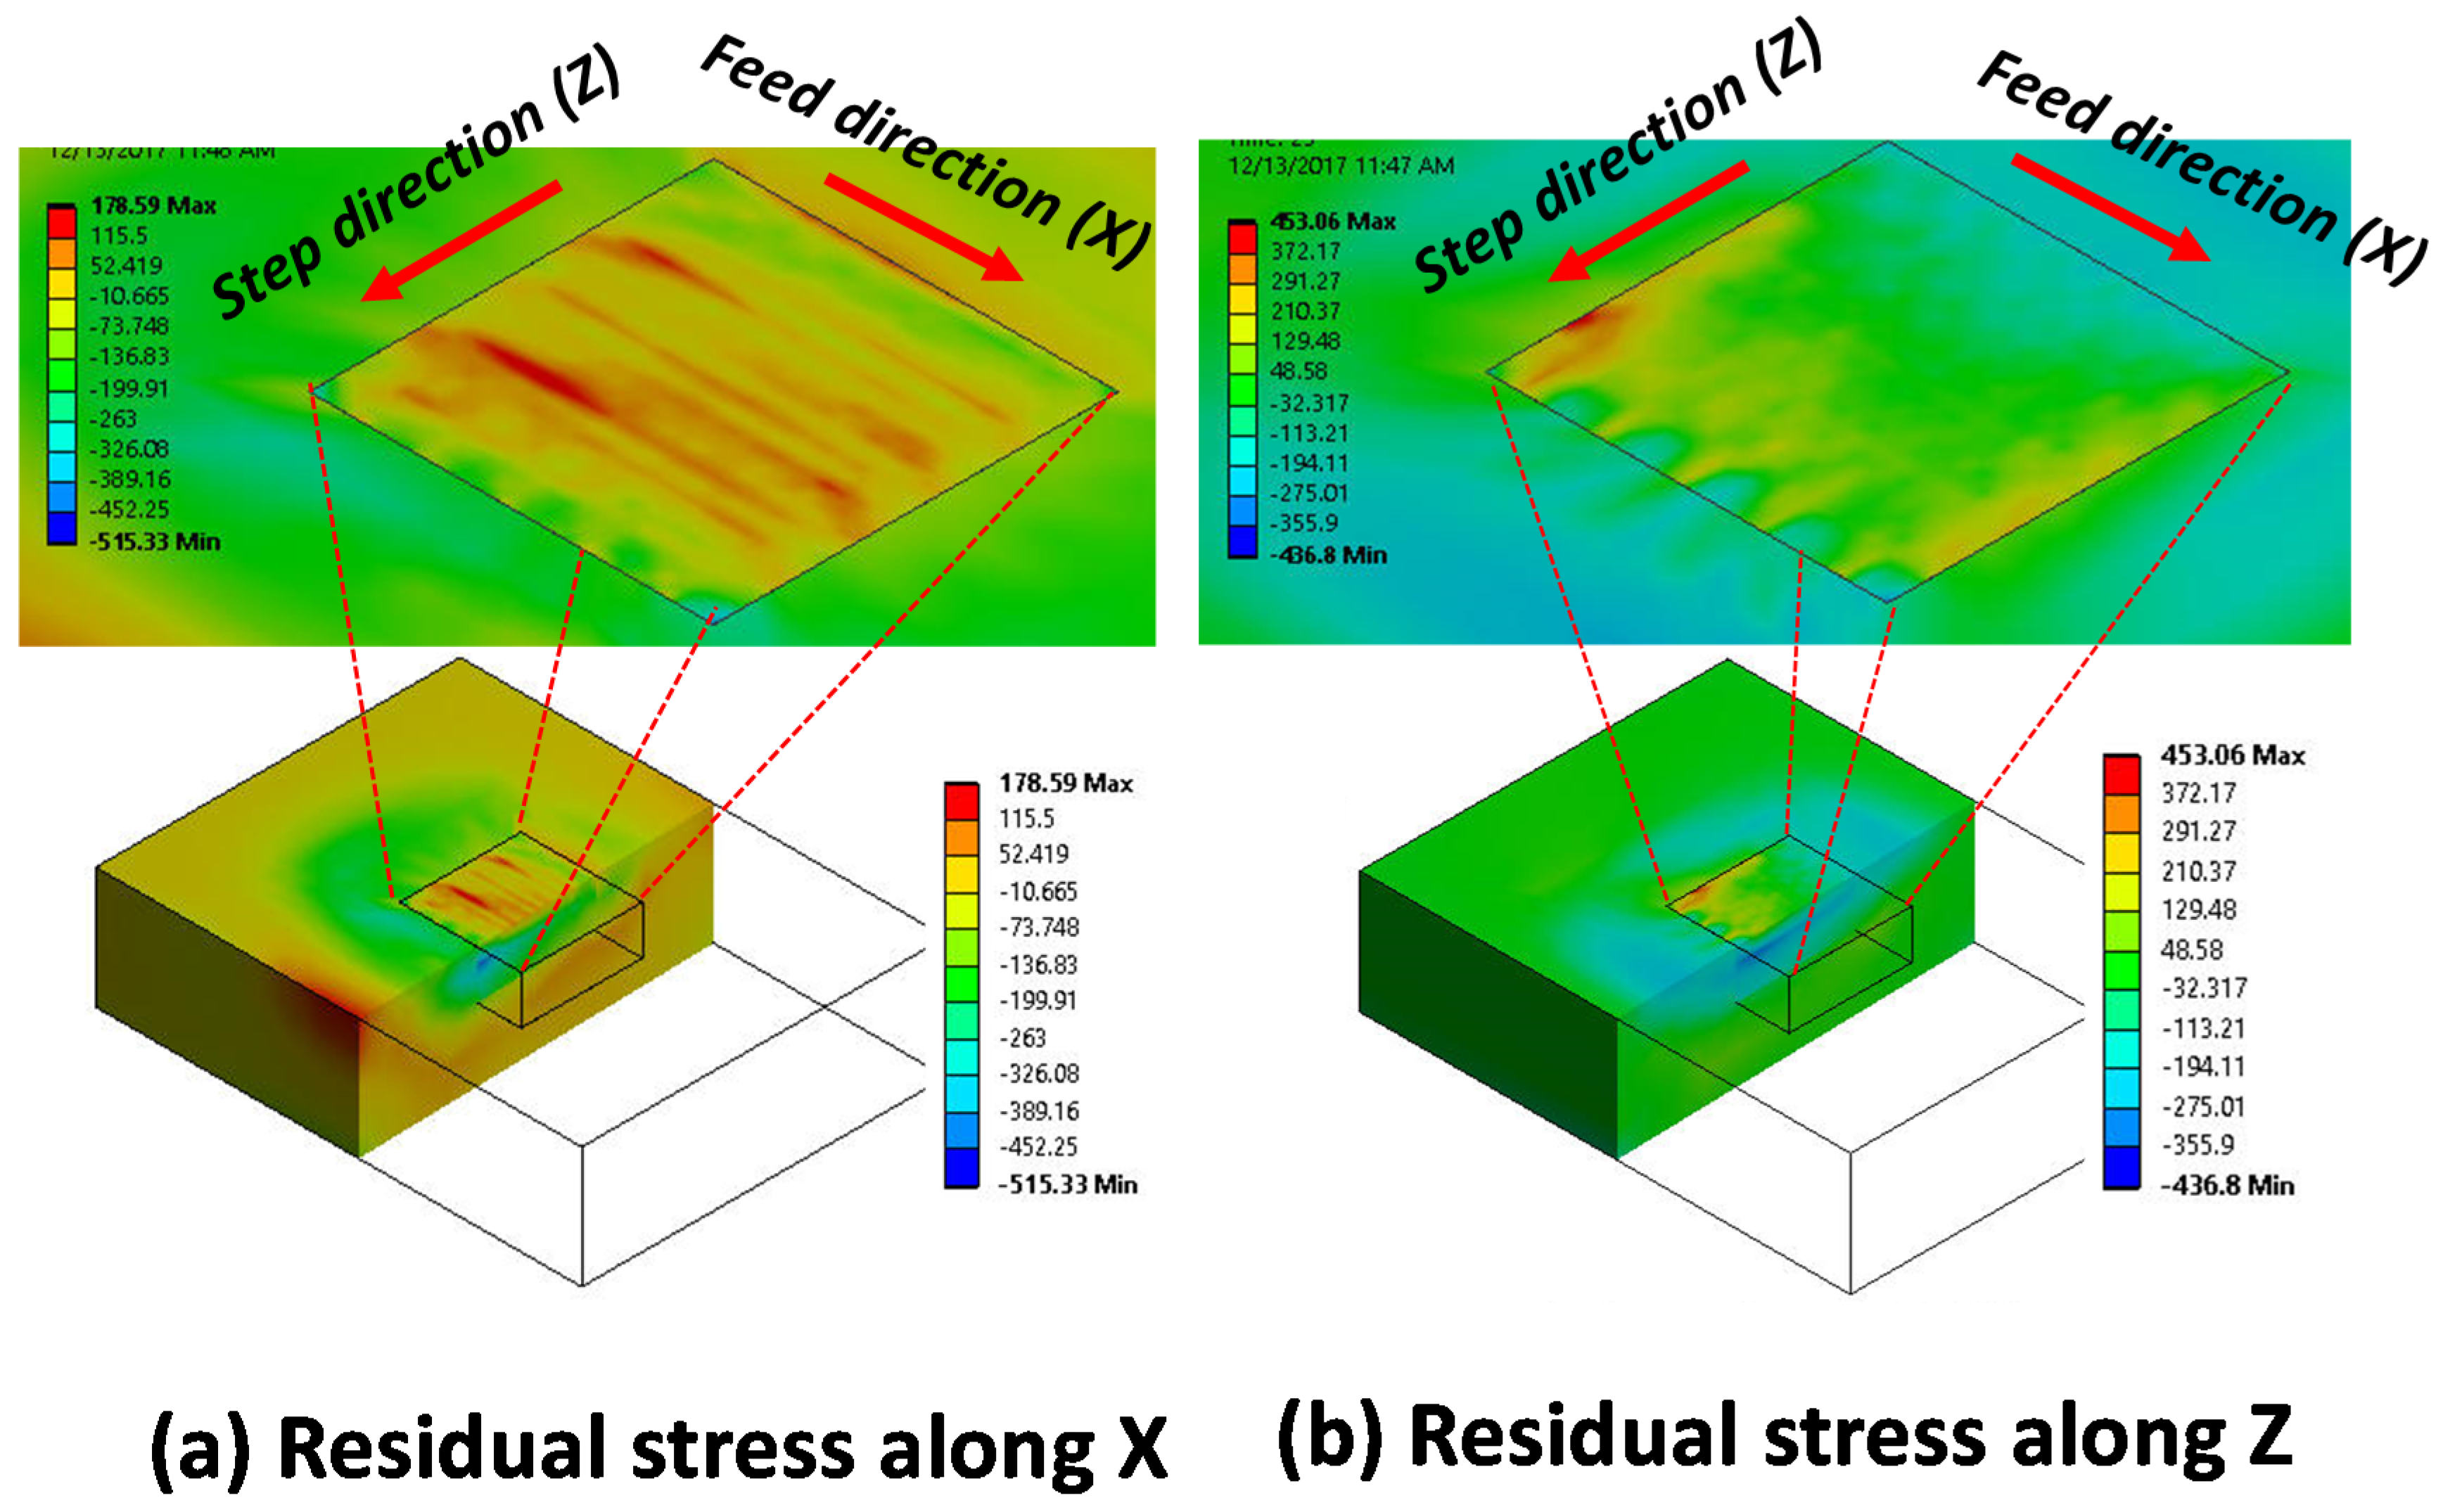
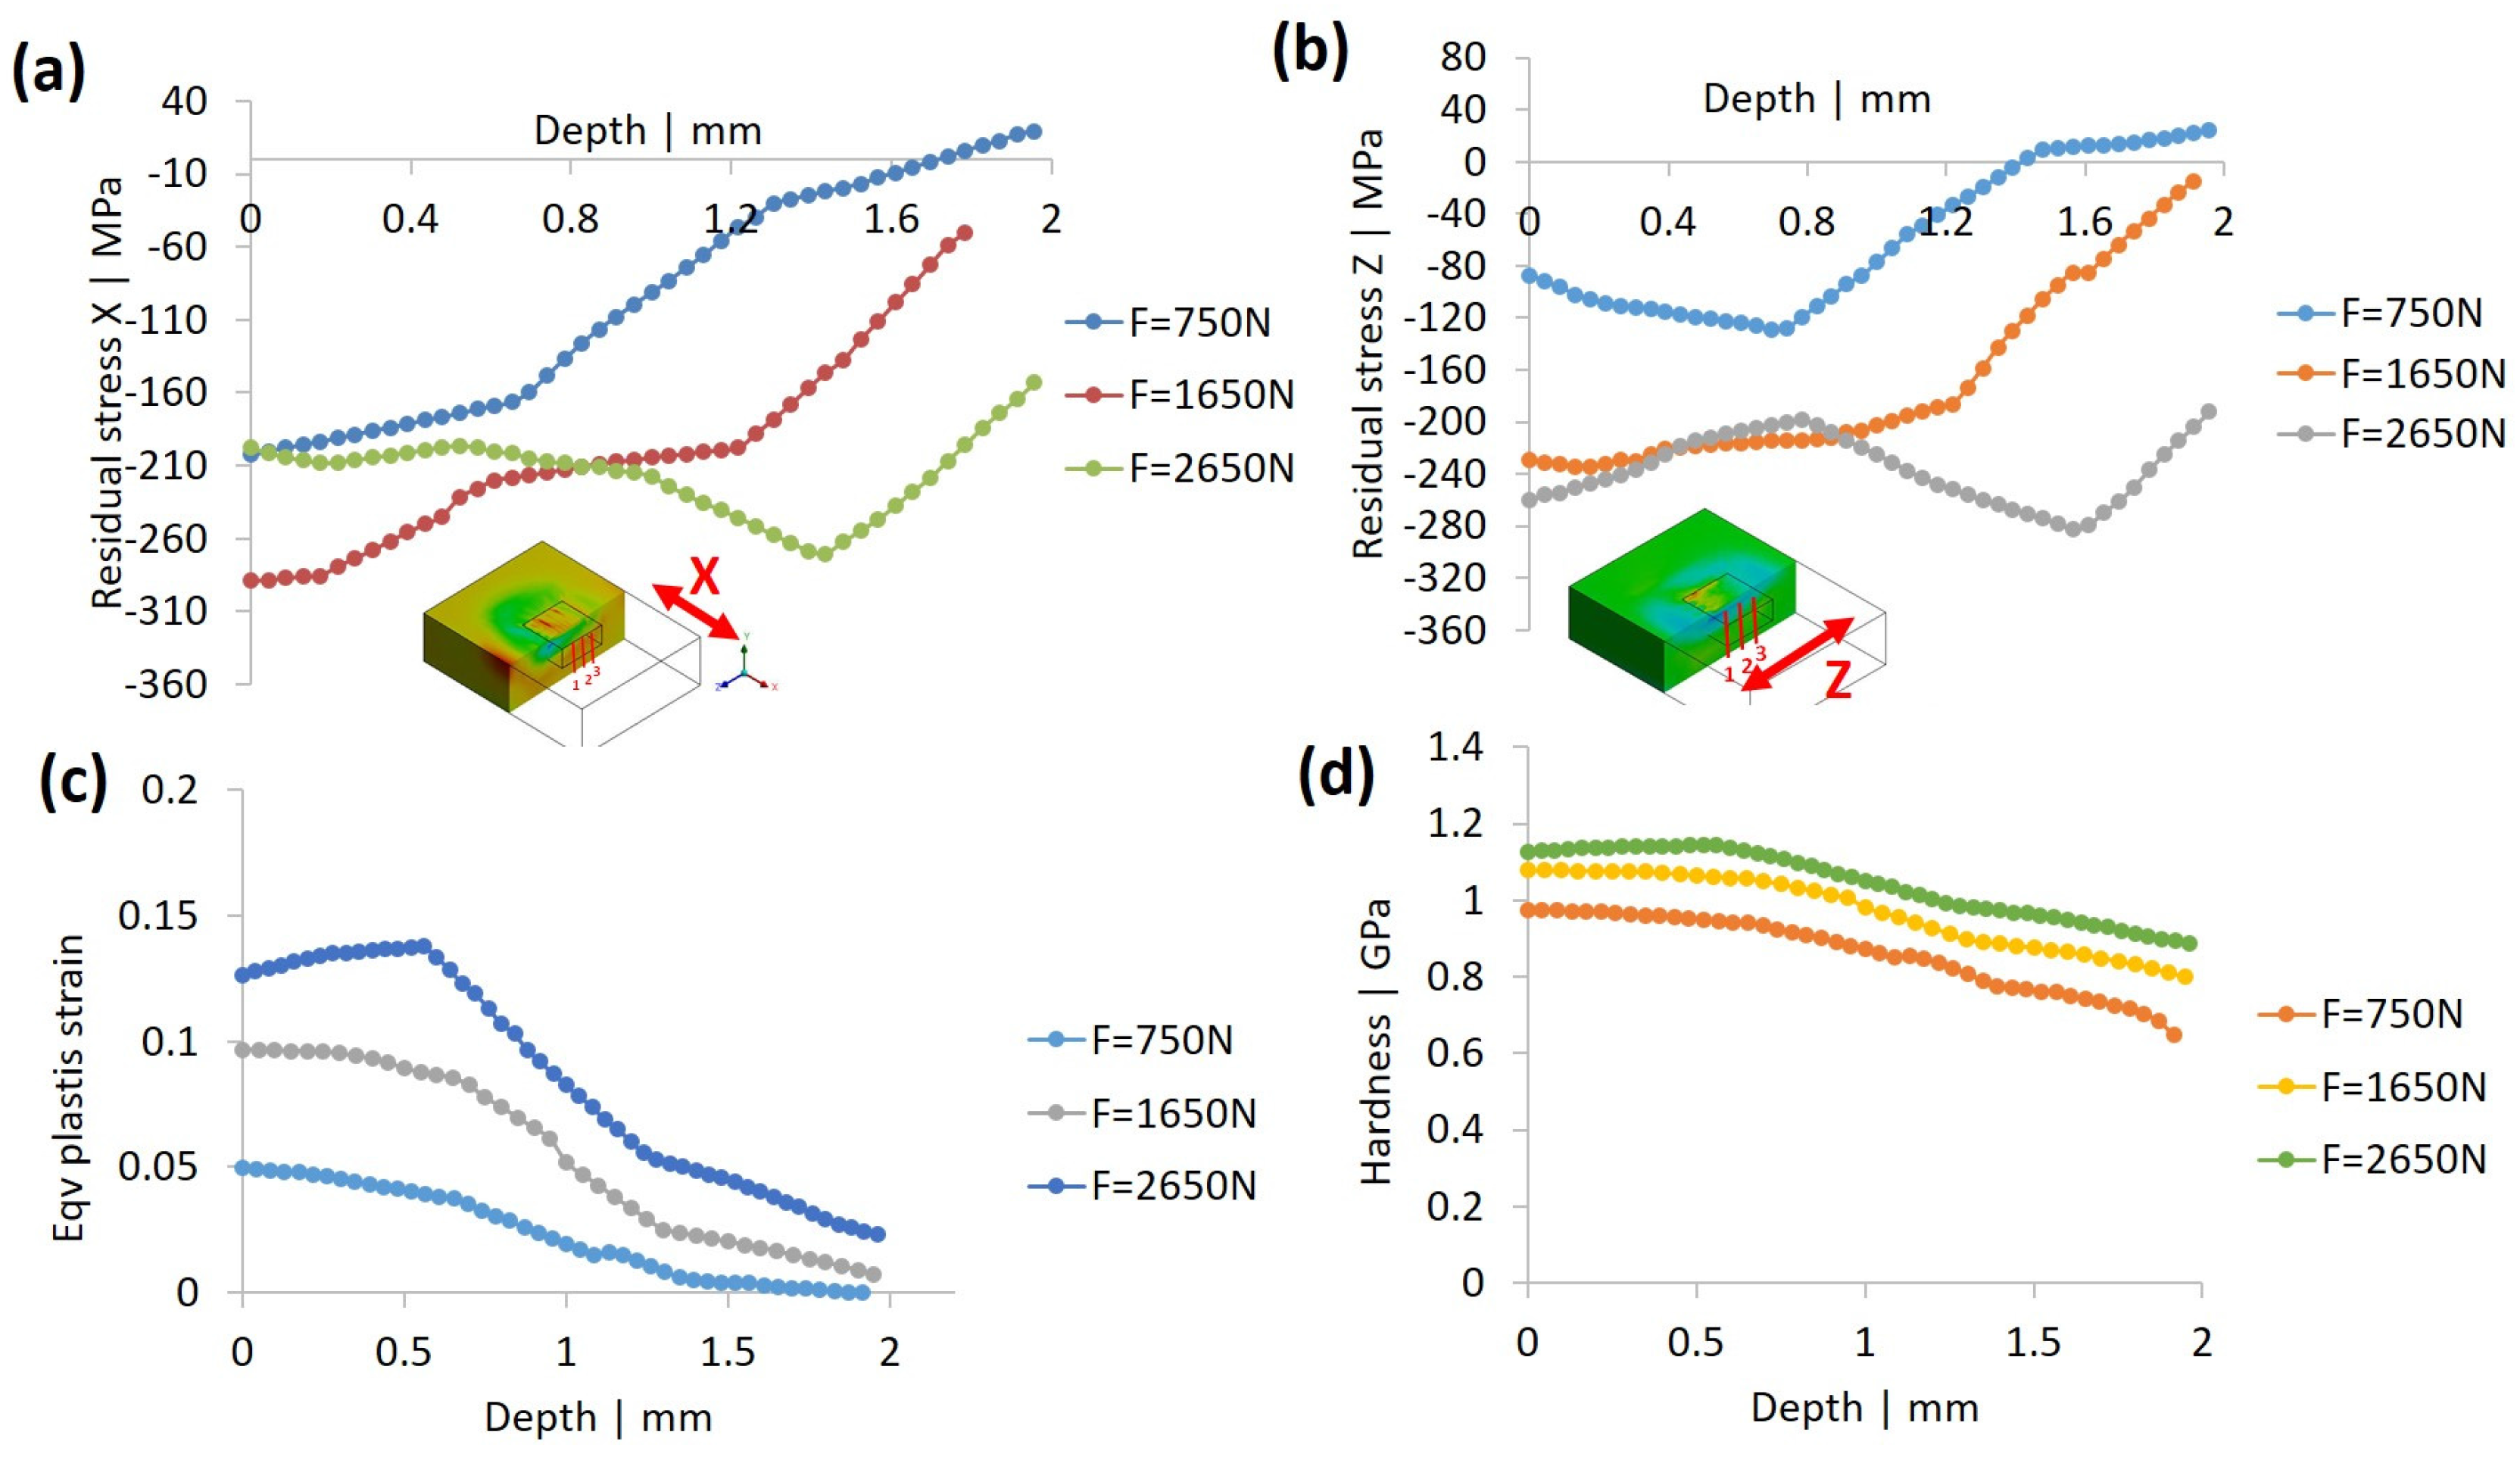
  • The FE analysis shows that the higher the burnishing force, the larger the residual stress, at a depth of as much as 1.2 mm. Stress is high (as high as −300 MPa) at the top surface, and decreases as the depth increases. Residual stress in the feed direction (X) is always found to be larger than that in the step-over direction (Z). Plastic strain and hardness follow the same trend, with the change of force, while hardness increases up to 1.1 GPa at the top surface at a force of 2650 N. Caution, however, must be taken, as a very large burnishing force may cause negative effects, i.e., lower compressive stress, high roughness, and surface damage.
  • The smaller the burnishing step-over, the higher the residual stress; however, such improvement is noticed at a shallow depth of 0.40 mm, after which changes in the step-over amount has minimal effect. Plastic strain and hardness, though, behave slightly in the opposite way, where hardness increases with a larger step-over. A trade-off between residual stress and hardness may need to be taken into consideration.
  • While a lower feed rate seems to increase residual stress, that stress’ variation across depth is relatively small when the feed rate goes up to 300 mm/min; afterwards, the effect is negative, i.e., stress drops drastically. Therefore, a smaller feed rate may be selected, to avoid potential surface or sub-surface cracks/damage, which can generate tensile stress. Plastic strain and hardness are not much affected by feed.
Increased surface integrity due to residual stress induced by ball-burnishing, as presented in the current paper, is expected to improve corrosion resistance, and hence delay the degradation kinetics of AZ31B Mg alloys. Our FE simulation results clearly indicate that surface integrity, in terms of residual stress generation and hardness, can be controlled by deep ball-burnishing parameters. Future work will focus on experimental analysis of residual stress and the evaluation of the corrosion performance, to validate the efficacy of this surface modification technique.

Acknowledgments

This work was performed in part at the South Australian Node of the Australian National Fabrication Facility under the National Collaborative Research Infrastructure Strategy. The authors have not received any external funding in support of the work presented in the paper.

Author Contributions

Mohammad Sharif Uddin, Colin Hall and Peter Murphy conceived the work and designed the experiments; Ryan Hooper performed the experiments; Mohammad Sharif Uddin and Ryan Hooper analyzed the data; Eric Charrault and Vincent Santos contributed to characterizations, surface observations and analysis tools; Mohammad Sharif Uddin wrote and revised the paper.

Conflicts of Interest

The authors declare no conflict of interest.

References

  1. Uddin, M.S.; Hall, C.; Murphy, P. Surface treatments for controlling corrosion rate of biodegradable Mg and Mg-based alloy implants. Sci. Technol. Adv. Mater. 2015, 16, 053501. [Google Scholar] [CrossRef] [PubMed]
  2. Agarwal, S.; Curtin, J.; Duffy, B.; Jaiswal, S. Biodegradable magnesium alloys for orthopaedic applications: A review on corrosion, biocompatibility and surface modifications. Mater. Sci. Eng. C 2016, 68, 948–963. [Google Scholar] [CrossRef] [PubMed]
  3. Cha, P.-R.; Han, H.-S.; Yang, G.-F.; Kim, Y.-C.; Hong, K.-H.; Lee, S.-C.; Jung, J.-Y.; Ahn, J.-P.; Kim, Y.-Y.; Cho, S.-Y.; et al. Biodegradability engineering of biodegradable Mg alloys: Tailoring the electrochemical properties and microstructure of constituent phases. Sci. Rep. 2013, 3, 2367. [Google Scholar] [CrossRef] [PubMed]
  4. Uddin, M.S.; Rosman, H.; Hall, C.; Murphy, P. Enhancing the corrosion resistance of biodegradable Mg-based alloy by machining-induced surface integrity: Influence of machining parameters on surface roughness and hardness. Int. J. Adv. Manuf. Technol. 2016, 1–14. [Google Scholar] [CrossRef]
  5. Schulze, V.; Bleicher, F.; Groche, P.; Guo, Y.B.; Pyun, Y.S. Surface modification by machine hammer peening and burnishing. CIRP Ann. Manuf. Technol. 2016, 65, 809–832. [Google Scholar] [CrossRef]
  6. Sealy, M.P.; Guo, Y.B.; Caslaru, R.C.; Sharkins, J.; Feldman, D. Fatigue performance of biodegradable magnesium-calcium alloy processed by laser shock peening for orthopedic implants. Int. J. Fatigue 2016, 82, 428–436. [Google Scholar] [CrossRef]
  7. Zhang, T.; Bugtai, N.; Marinescu, I.D. Burnishing of aerospace alloy: A theoretical-experimental approach. J. Manuf. Syst. 2015, 37, 472–478. [Google Scholar] [CrossRef]
  8. Chomienne, V.; Valiorgue, F.; Rech, J.; Verdu, C. Influence of ball-burnishing on residual stress profile of a 15-5PH stainless steel. CIRP J. Manuf. Sci. Technol. 2016, 13, 90–96. [Google Scholar] [CrossRef]
  9. Lim, A.; Castagne, S.; Cher Wong, C. Effect of deep cold rolling on residual stress distributions between the treated and untreated regions on Ti-6Al-4V alloy. J. Manuf. Sci. Eng. 2016, 138, 111005. [Google Scholar] [CrossRef]
  10. Salahshoor, M.; Guo, Y.B. Biodegradation control of magnesium-calcium biomaterial via adjusting surface integrity by synergistic cutting-burnishing. Procedia CIRP 2014, 13, 143–149. [Google Scholar] [CrossRef]
  11. Salahshoor, M.; Guo, Y.B. Process mechanics in ball-burnishing biomedical magnesium-calcium alloy. Int. J. Adv. Manuf. Technol. 2013, 64, 133–144. [Google Scholar] [CrossRef]
  12. Salahshoor, M.; Guo, Y.B. Surface integrity of magnesium-calcium implants processed by synergistic dry cutting-finish burnishing. Procedia Eng. 2011, 19, 288–293. [Google Scholar] [CrossRef]
  13. Hering, B.; Wippermann, A.; Mörke, T.; Grove, T.; Denkena, B. Manufacturing of osteosynthesis systems made of magnesium alloy AZ91. In Magnesium Technology 2016; Singh, A., Solanki, K., Vnuel, M., Neelameggham, N.R., Eds.; John Wiley & Sons, Inc.: New York, NY, USA, 2016; pp. 317–322. ISBN 978-1-119-27480-3. [Google Scholar]
  14. Pu, Z.; Song, G.-L.; Yang, S.; Dillon, O.W.; Puleo, D.A.; Jawahir, I.S. Cryogenic burnishing of AZ31B Mg alloy for enhanced corrosion resistance. In Magnesium Technology 2011; Sillekens, W.H., Agnew, S.R., Neelameggham, N.R., Mathaudhu, S.N., Eds.; John Wiley & Sons, Inc.: New York, NY, USA, 2011; pp. 513–518. ISBN 978-1-118-06202-9. [Google Scholar]
  15. Pu, Z.; Yang, S.; Song, G.-L.; Dillon, O.W., Jr.; Puleo, D.A.; Jawahir, I.S. Ultrafine-grained surface layer on Mg-Al-Zn alloy produced by cryogenic burnishing for enhanced corrosion resistance. Scr. Mater. 2011, 65, 520–523. [Google Scholar] [CrossRef]
  16. Coules, H.E.; Horne, G.C.M.; Kabra, S.; Colegrove, P.; Smith, D.J. Three-dimensional mapping of the residual stress field in a locally-rolled aluminium alloy specimen. J. Manuf. Process. 2017, 26, 240–251. [Google Scholar] [CrossRef]
  17. Virtanen, S. Surface modification and coating of biodegradable magnesium. Meet. Abstr. 2016, 10, 1206. [Google Scholar]
  18. Yen, Y.C.; Sartkulvanich, P.; Altan, T. Finite element modeling of roller burnishing process. CIRP Ann. Manuf. Technol. 2005, 54, 237–240. [Google Scholar] [CrossRef]
  19. Sonmez, F.O.; Demir, A. Analytical relations between hardness and strain for cold formed parts. J. Mater. Process. Technol. 2007, 186, 163–173. [Google Scholar] [CrossRef]
  20. Ahmad, I.R.; Shu, D.W. Experimental and constitutive study of tensile behavior of AZ31B wrought magnesium alloy. ASCE J. Eng. Mech. 2015, 141. [Google Scholar] [CrossRef]
  21. Trdan, U.; Skarba, M.; Grum, J. Laser shock peening effect on the dislocation transitions and grain refinement of Al-Mg-Si alloy. Mater. Charact. 2014, 97, 57–68. [Google Scholar] [CrossRef]
  22. De Lacalle, L.N.L.; Lamikiz, A.; Sánchez, J.A.; Arana, J.L. The effect of ball-burnishing on heat-treated steel and Inconel 718 milled surfaces. Int. J. Adv. Manuf. Technol. 2007, 32, 958–968. [Google Scholar] [CrossRef]
  23. Revankar, G.D.; Shetty, R.; Rao, S.S.; Gaitonde, V.N. Wear resistance enhancement of titanium alloy (Ti-6Al-4V) by ball-burnishing process. J. Mater. Res. Technol. 2017, 6, 13–32. [Google Scholar] [CrossRef]
Figure 1. Milled surface topography before burnishing (a) 3D and (b) 2D profiles.
Metals 08 00136 g001
Figure 2. Experimental setup of the burnishing.
Metals 08 00136 g002
Figure 3. Schematic of burnishing process and tracks.
Metals 08 00136 g003
Figure 4. Finite element (FE) model of the burnishing process (a) 3D view of model (b) close-up of test coupon.
Metals 08 00136 g004
Figure 5. Elasto-plastic profile of the AZ31B alloy used in FE modelling.
Metals 08 00136 g005
Figure 6. Representative residual stress estimation along the cross-sectional depth of the burnished area. Lines 1, 2, and 3 indicate the depth lines along which stress is estimated.
Metals 08 00136 g006
Figure 7. Comparison of experimental and simulated hardness at F = 750 N, f = 300 mm/min, and S = 0.05 mm. The error bar at each data point indicates the standard deviation of the measurement.
Metals 08 00136 g007
Figure 8. Effect of burnishing force and feed on roughness—Ra (left) and Rt (right)—at a step-over, with an S of 0.10 mm.
Metals 08 00136 g008
Figure 9. Effect of a burnishing step-over and feed rate on roughness—Ra (left) and Rt (right)—at a force of 1650 N.
Metals 08 00136 g009
Figure 10. Surface topography (a) before and (b) after burnishing, measured by an optical profilometer at F = 1650 N, f = 300 mm/min, and S = 0.10 mm.
Metals 08 00136 g010
Figure 11. SEM photo of surface topography (a) before and (b) after burnishing at F = 1650 N, f = 300 mm/min, and S = 0.10 mm.
Metals 08 00136 g011
Figure 12. Effect of burnishing force on (a) residual stress along X (feed direction); (b) residual stress along Z (step-over direction); (c) plastic strain and (d) hardness at f = 300 mm/min and S = 0.10 mm.
Metals 08 00136 g012
Figure 13. Effect of burnishing step-over on (a) residual stress along X (feed direction); (b) residual stress along Z (step-over direction); (c) plastic strain and (d) hardness at F = 1650 N, f = 300 mm/min.
Metals 08 00136 g013
Figure 14. Effect of burnishing feed rate on (a) residual stress along the X (feed) direction; (b) residual stress along the Z (step-over) direction; (c) plastic strain, and (d) hardness, at F = 1650 N and S = 0.10 mm.
Metals 08 00136 g014
Figure 15. Experimental hardness with respect to the burnishing force. The error bar at each data point indicates the standard deviation of the measurement.
Metals 08 00136 g015
Figure 16. Residual stress distribution on the top surface (a) along the X (feed) direction and (b) the Z (step-over) direction directions when burnishing at S = 0.05 mm, f = 300 mm/min and F = 1650 N.
Metals 08 00136 g016
Table 1. Elemental composition of AZ31B alloy used.
ElementMgAlZnSiMnCuCaFeNi
Composition (wt %)96.32.50.80.100.200.0500.040.0050.005

