Abstract
Anodic oxidation is an easy and cheap surface treatment to form nanostructures on the surface of titanium items for improving the interaction between metallic implants and the biological environment. The long-term success of the devices is related to their stability. In this work, titanium nanotubes were formed on a dental screw, made of titanium CP2, through an anodization process using an “organic” solution based on ethylene glycol containing ammonium fluoride and water. Then, the electrochemical stability in the Hank’s solution of these “organic” nanotubes has been investigated for 15 days and compared to that of titanium nanotubes on a similar type of sample grown in an inorganic solution, containing phosphoric and hydrofluoridric acids. Morphological and crystallographic analysis were performed by using scanning electron microscopy (SEM) and X-Ray diffractometry (XRD) tests. Electrochemical measurements were carried out to study the stability of the nanotubes when are in contact with the biological environment. The morphological measurements revealed long nanotubes, small diameters, smooth side walls, and a high density of “organic” nanotubes if compared to the “inorganic” ones. XRD analysis demonstrated the presence of rutile form. An appreciable electrochemical stability has been revealed by Electrochemical Impedance Spectroscopy (EIS) analysis, suggesting that the “organic” nanotubes are more suitable for biomedical devices.
1. Introduction
The natural and amorphous oxide layer (2–5 nm) present on a titanium surface provides its excellent corrosion resistance. This is one of the reasons why titanium is widely used as implant material [1,2]. In order to improve the interaction between a titanium implant and a biological environment, the mechanical, physical, chemical, electrochemical or biochemical surface modifications of medical devices are needed [3,4,5,6]. Among the electrochemical treatments, the anodic oxidation is a cost-effective, versatile, and simple process widely used in the industrial field. The anodic oxide film grown on titanium substrate may exhibit a compact, porous or nanotubular structure by changing the anodizing process parameters, such as the voltage applied, the duration of the anodizing, the electrolyte composition, and so on [7,8,9,10,11,12,13,14]. With the coming of nanomaterials, it has been observed that nanostructured surfaces tend to improve cell-implant interaction, stimulating the cell-adhesion processes [15,16] as the osseointegration mechanism [17,18,19,20,21]. Tsuchiya et al. showed a significant growth of hydroxyapatite (bone-like calcium phosphate) on TiO2 nanotube layers compared to flat compact titanium oxide layers [22]. Hilario et al. [17] investigated the influence of the morphology and the crystalline structure of the titanium nanotubes on the apatite-forming ability, suggesting the best compromise between the nanotubes size and their crystalline phase. In addition, these kinds of nanostructures could be used as a reservoir for drug delivery applications [23,24,25]. To date, depending on the anodizing process parameters, several types of nanotubes are possible to obtain on the metallic substrate [26]. They are different basically in: (i) pore diameters, (ii) wall roughness and thickness as well as (iii) in length. In previous works [27,28], an anodizing process on a dental implant screw was presented. In particular, the use of an aqueous solution based on hydrofluoridric acid was allowed to obtain titanium nanotubes of about 500 nm in length and about 100 nm in diameter on a dental implant. An increased corrosion resistance and a more active role, to promote the formation of chemical compounds containing Ca and P in comparison to the untreated samples, were observed on the anodized specimens. In this paper, titanium nanotubes with different morphologies, in terms of diameter, length, and side wall roughness, were obtained by anodizing a titanium dental screw in electrolytic solutions containing organic (ethylene glycol) and inorganic (ammonium fluoride) compounds as well as water. Little research has focused on the electrochemical characterization in Hank’s solution of the titanium nanotubes produced through anodizing in different electrolytes [29,30,31]. However, the corrosion resistance of metals, used as biomaterials, should be evaluated for a long time frame to ensure their long-term success in the human body [32]. To the authors’ best knowledge, there is so far no report that describes the electrochemical behavior for a long immersion time in the physiological media (i.e., Hank’s solution) of the titanium nanotubes grown by using different electrolytes that compare their stability. Therefore, the aims of this work were: (i) to realize titanium oxide nanotubes in an organic electrolytic solution, (ii) to investigate their morphological aspect and their electrochemical behavior in Hank’s solution for 15 days and (iii) to compare the corrosion resistance properties of the “organic” nanotubes to that of the “inorganic” nanotubes previously grown and characterized. Electrochemical Impedance Spectroscopy (EIS) and polarization potentiodynamic (PD) measurements were conducted to test the samples steadiness. The experimental analysis was supported by morphological and crystallographic measurements, conducted using scanning electron microscope (SEM) and X-ray diffraction (XRD).
2. Materials and Methods
Titanium dental screws, provided by Deltal Medics (Milano, Italy), made of titanium CP2 with the following geometric features; 3 mm in diameter and 8 mm in length—were used as a samples to be coated. Ammonium fluoride (NH4F), ethylene glycol (EG) and Hank’s solution were purchased from Sigma Aldrich and used as received. The composition of the Hank’s solution was 0.185 g/L CaCl2∙2H2O, 0.09767 g/L MgSO4, 0.4 KCl g/L, 0.06 KH2PO4 g/L, 0.35 g/L NaHCO3, 8.0 g/L NaCl, 0.04788 g/L Na2HPO4, 1.0 g/L D-Glucose, without Phenol Red and sodium bicarbonate. The electrolytic solution was prepared by mixing 2.5 wt % of NH4F and 12.5 wt % of water in ethylene glycol.
TiO2 Nanotube Film Preparation
Prior to the anodizing process, titanium screws were sequentially cleaned for 10 min in acetone, ethanol, and deionized water using an ultrasonic bath. Then they were dried in air. A number of five screws were used. The anodic oxidation treatment was performed by using the DC power supply Gen 600-5.5 (TDK, Lambda, Milano, Italy) connected to a two-electrode system, with a platinum rod as cathode and the titanium screws as anode. The nanotubes formation, conducted in the organic solution, involves the formation of a layer on the top tubes, named “nano-grass” [33], due to the split off of the tube walls. The literature offers different methods to remove, the “nano-grass” layer, or to impede its formation, as the sonication, or supercritical drying, etc. [34,35,36,37,38,39,40]. The technique used in this work involves three subsequent steps: (i) sample anodic oxidation in acid electrolyte to obtain a porous titanium oxide, (ii) thermal treatment of sample at 700 °C for 1 h, (iii) anodizing in the organic media and (iv) washing in deionized water [35]. The samples were firstly anodized in a 1 M H2SO4 (Sigma Aldrich, Milano, Italy) aqueous solution at 20 V for 20 min, then they were annealed in an oven at 700 °C for 1 h. Finally, the anodizing process to form the nanotubes array was carried out in the organic solution aforementioned at 30 V for 1080 min. At the end of the process, the samples were washed in deionized water to remove the sacrificial porous oxide titanium layer, under which “organic” nanotubes have grown.
The sample surface was studied using a SEM (SEM, Hitachi TM3000, Hitachi, Japan). The crystallographic structure was investigated by XRD (XRD, PaNanalytical, X-Pert PRO, Cambridge, UK), using a CuKα radiation (λ = 1.5404 Ǻ) and a Bregg–Brentano geometry, in the range from 5° to 80° with a step size of 0.013°. The X-ray generator operated at 40 kV and 40 mA. The apparatus used to perform the electrochemical tests was a potentiostat (Solartron 1287, Photoanalytical, Milano, Italy) linked to an Impedance/Gain-phase Analyser (Solartron 1260, Photoanalytical, Milano, Italy) and connected to a three-electrode electrochemical cell consisting of a platinum rod as counter-electrode, a saturated calomel electrode (SCE) as reference electrode, and titanium screws as the working electrode. The analysis was performed at room temperature, exposing a surface of about 3 cm2, in the Hank’s solution with the following composition (g/L): 0.185 CaCl2∙2H2O, 0.098 MgSO4, 0.4 KCl, 0.06 KH2PO4, 0.35 NaHCO3, 8.0 NaCl, 0.048 Na2HPO4, 1.0 D-glucose, pH = 7.4. A potentiodynamic polarization test was performed in a potential window from −30 mV to +1500 mV vs. the open circuit potential (OCP) at a scan rate of 0.166 mV/s. The electrochemical impedance spectra were recorded at the OCP in a frequency range of 104 Hz–0.02 Hz, applying an AC amplitude signal of ±5 mV. The EIS data were plotted as Bode plots and interpreted on the basis of the electrical equivalent circuits by using the Zview software (Scribner Associates Inc., Southern Pines, NC, USA) for fitting the experimental results. The quality of the fit was judged by the χ2 parameter. Each measurement was repeated three times in order to evaluate the reproducibility.
In order to investigate the influence of the nanotubes morphology on the electrochemical stability of the titanium implant, all measurements carried out on the nano-structures formed in the “organic” solution, named Ti_NTorg, were compared to the results previously [27,28] obtained from the nanotubes grown on the same type of dental screw (named as Ti_NTinorg), in an “inorganic” solution and from the untreated sample, named as Ti pristine. For the sake of clarity, the parameters of the anodic oxidation process carried out in the “inorganic” or “organic” electrolyte are summarized in Table 1. Five samples of each type of nanotubes were used to carry out the comparison.

Table 1.
Summary of parameters used during the anodic oxidation process conducted in the “inorganic” or “organic” solution.
3. Results and Discussion
3.1. Morphological Analysis
The top view SEM image, reported in Figure 1a, clearly shows the formation of nanotubes in the “organic” electrolytic solution by following the procedure adopted in this work. This procedure obtains an open top porous network of high density, self-organized nanotubes with a mean diameter of about 70 nm. The cross-sectional SEM image, Figure 1b, reveals the regular alignment of the nanotubes, about 8 µm in length, the smoothness of the side walls, and the closed backside of the nanotubes, detached from the titanium substrate.
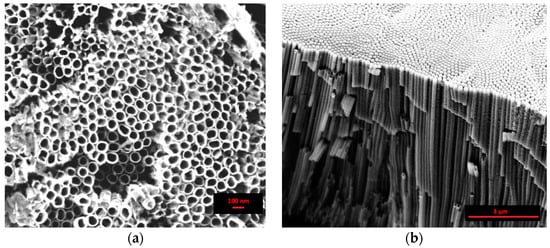
Figure 1.
Scanning electron microscopy (SEM) images of the anodized sample in the “organic” solution at 30 V for 1080 min: (a) top view and (b) cross sectional view.
The anodization conducted in the “organic” electrolyte obtains long nanotubes (several micrometers) and a smooth tube wall. In fact, the oxide dissolution at the top side of the nanotubes is inhibited, and the fluctuations of the current transient accompanied by a pH burst at the pore tip are damped by decreasing the diffusion constant of the F− in the organic electrolyte [40].
In comparison, the SEM images of the nanostructure obtained by using an inorganic solution are reported in Figure 2. As shown in the top view micrograph (Figure 2a), the surface was characterized by ordered nanotubes well separated from each other. The shape and the side walls displayed significant irregularities. The latter presented a “bamboo type” form, that, according to Kontos [39], introduced a small scale surface roughness component. The mean diameter and the length of the nanotubes were about 100 nm and 0.5 µm, respectively. In the “inorganic” solution, the limited thickness of the nanotubes layer is due to the achievement of a steady state regime between the oxide-growth rate and the dissolution reaction rate [41]. The ripples at the tube walls are ascribed to a higher quantity of water and are responsible for the continuous etching and passivation of the cell boundary regions [42].
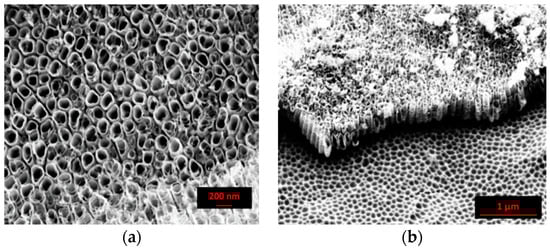
Figure 2.
SEM images of the anodized sample in the “inorganic” solution at 30 V for 90 min: (a) top view and (b) cross sectional view. X-Ray diffractometry.
Table 2 summarizes the dimension of the nanotubes obtained by using inorganic or organic electrolytic solution.
Table 2.
Geometric features of titanium nanotubes formed in the inorganic, Ti_NTinorg, or in the organic electrolyte, Ti_NTorg.
3.2. XRD Analysis
The XRD patterns of the anodized samples in the “organic” electrolytic solution (Ti_NTorg), anodized in “inorganic” media, (Ti_NTinorg), and of the un-treated sample (Ti pristine), are reported in Figure 3. The graph reveals the characteristics of the diffraction peaks of titanium at 2θ values of 35.09°, 38.42°, 40.17°, 53.05°, 62.9°, 70.66°, and 76.19° corresponding to (100), (002), (101), (102), (110), (103) and (112) planes, respectively, for all the tested samples. Although, in this research the traditional Bragg–Brentano system was used, the sample anodized in viscous electrolyte, characterized by a nanotubes layer thick 8 µm, showed a weak peak at 2θ values of 27.37°, corresponding to the (110) phase [17,43]. This event highlighted the presence of a rutile structure of titanium oxide, due to the annealing process carried out at 700 °C to avoid the formation of the “nano-grass” layer during the anodization in the “organic” electrolyte.
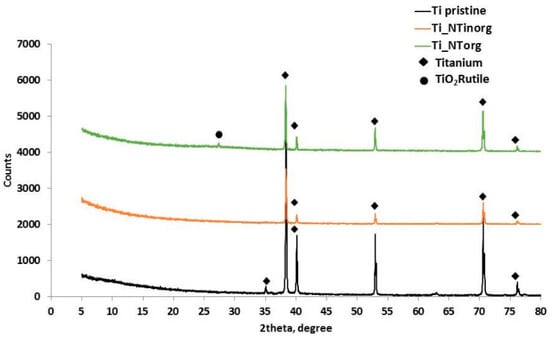
Figure 3.
Comparison of X-ray diffraction pattern of Ti pristine sample (curve black), Ti_NTinorg sample (curve orange), and Ti_NTorg (curve green).
As can see from Figure 3, the peaks intensity changed with the morphology of the sample. Indeed, the Ti_NTorg sample presented higher peaks intensity if compared to the Ti_NTinorg sample, probably due to the roughness of the tube walls, which are smooth for the former and rippled for the latter and strongly affect the X-ray signal.
The use of an “organic” electrolyte induced an increase of the nanotubes length and also involved a crystalline phase of the titanium oxide, in rutile form, due to a necessary heat treatment. Zywitzki et al. [35] measured the nanoindentation and tested the mechanical properties, in term of hardness and Young’s modulus, of amorphous, anatase, and rutile forms of titanium oxide layers grown by reactive pulse magnetron sputtering. They have verified that the rutile form presented higher mechanical properties in comparison to the amorphous titanium oxide. Indeed, the hardness (as the mean pressure that a material can support under load [44]) and the Young’s modulus of the rutile form are about 17 GPa and 260 GPa, respectively. While, the amorphous titanium oxide presents values of about 7 GPa of hardness and of about 160 GPa Young’s modulus. A high hardness value and a low Young’s modulus are the “desiderata” requirements for a dental implant, since the former enhances the wear resistance while the latter reduces the stress shielding phenomena. In addition, the rutile phase seems to improve the apatite formation in comparison to the amorphous titanium oxide [22].
3.3. Electrochemical Analysis
The potentiodynamic polarization curve of the Ti_NTorg sample is sketched in Figure 4 and it is compared to the un-treated sample, Ti pristine, and to the specimen anodized in “inorganic” electrolyte, Ti_NTinorg. From a brief glimpse at the obtained curves, it was possible to see that the presence of the nanotubes layer severely influenced the sample’s electrochemical behavior. It was possible to note a change of the corrosion potential values, Ecorr, and a variation of the passive current values, ip. Indeed, the Ti_NTinorg specimen showed a more noble corrosion potential (Ecorr = −0.12 V) in comparison to the titanium pristine sample (Ecorr = −0.30 V), which was due to the formation of the anodic oxide layer. The passive film protects the metal from the environment, retarding the electrons passage across its self. Consequently, a lower passive current (ip ~ 1.12 × 10⁻⁷ A/cm2) for the Ti_NTinorg sample was recorded. The sample with longer nanotubes, (Ti_NTorg), obtained in the “organic” electrolyte, exhibited the highest corrosion potential (Ecorr = −0.065 V), due to the greater thickness of the anodic oxide formed on its surface. At the same time, the sample showed the highest passive current (ip ~ 7.35 × 10⁻⁶ A/cm2). On the other hand, since the Ti_NTorg sample is expected to have a very large area per unit geometric area, if compared to the untreated and Ti_NTinorg samples, it was able to expose a wider reactive surface [45], exhibiting an “apparent” higher passive current. In addition, ip, for the sample Ti_NTorg remained constant during the experiment, suggesting a larger passivity range of the anodic oxide grown on its surface. In comparison, the Ti_NTinorg sample presented a slight variation of the ip through the test. Regarding the accurate evaluation of the passive current, a detailed study is needed to verify the previous hypothesis.
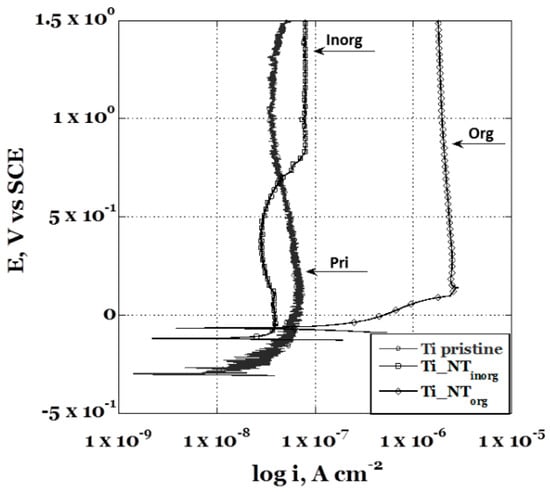
Figure 4.
Comparison between the potentiodynamic polarization curves obtained in Hank’s’ solution for the anodized samples in the” inorganic” (Ti_NTinorg sample), the “organic” (Ti_NTorg sample) electrolytic solution, and un-treated (Ti pristine sample).
The results of the EIS analysis carried out in Hanks’ solution for 360 h on the Ti_NTorg samples are reported in the form of Bode plots in Figure 5. The impedance modulus curves recorded for the entire duration of the experiment were almost overlapping, excluding the curve recorded at t = 0. Indeed, it is possible to imagine that, at the beginning of the test, chemical reactions started to develop on the surface, reaching equilibrium after a certain period of time. The overlapping of the remaining curves indicated the stability of these kinds of nanotubes in the test solution. They present a morphological aspect more defined than those nanotubes obtained in the acidic solutions. A slight decrease of the impedance modulus value was exhibited only in the low frequency range. In the phase angle plot (see Figure 5b) at the beginning of the test (t = 0) a rapid rise of the phase angle, from −10° to −60° in the frequency range from 20 kHz to 1 Hz, was observed. In addition, a decrease of the phase angle to a value of about 45° in the lowest frequency range was recorded. The trend of the curves suggested the presence of a second constant time due to the structure of the double-layer oxide. It was made of a porous outer layer of lower impedance and a dense inner layer, usually defined as a “barrier layer”, associated to high impedance and responsible for corrosion protection [46]. As the immersion time elapsed, the maximum of the phase angle, recorded in the middle frequency range at the beginning of the test, slightly decreased until 216 h. Afterwards, it gradually moved toward the high frequency range, indicating a very slow decrease of corrosion protection ability.
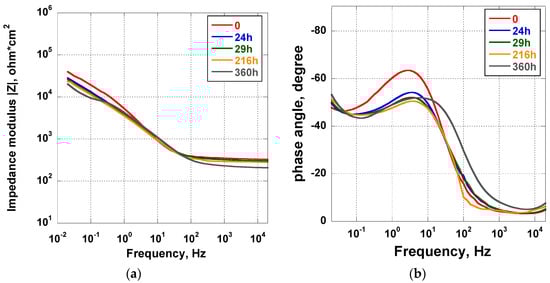
Figure 5.
Impedance (a) and phase angle (b) plots of the Ti_NTorg samples immersed in Hanks’ solution for 15 days.
The electrochemical behavior of the Ti_NTorg sample was evaluated by using a simple electrical equivalent circuit model (see Figure 6), Rs(RtQPEt)(RbQPEb), widely reported in literature [47,48], in order to simulate the structure of the nanotubes composed by a double-layer oxide, as aforementioned.
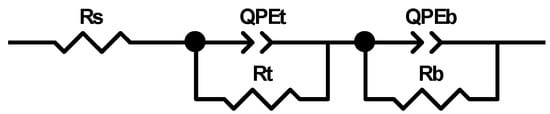
Figure 6.
Electrical equivalent circuit model used for fitting the impedance spectra of the Ti_NTorg samples.
The model adopted was made of three modules connected in series. A resistor Rs, to indicate the electrolytic solution resistance, was connected in series to a parallel combination of a constant phase element QPEt and a resistance Rt. They represent the non-ideal behavior of the double layer capacitance of the nanotubes porous outer layer and its resistance, respectively. This mesh was in turn linked in series to another parallel combination of a constant phase element QPEb and a resistance Rb. The latter represent the non-ideal behavior of the double layer capacitance of the nanotubes barrier layer and its resistance, respectively. The impedance of a constant phase element QPE is defined as ZCPE = [Q (jωn)]−1, with n = 1 for an ideal capacitor, n = −1 for ideal inductor and n = 0 for ideal resistor [49].
A good agreement between the experimental and fitting data was obtained, as confirmed by the χ2 values reported in Table 3, where also the electrical equivalent circuit parameters are reported.
Table 3.
Electrical equivalent circuit parameters of the Ti_NTorg sample.
At the onset of immersion in the Hanks’ solution, the resistance of the porous outer layer, Rt, was 1.17 × 10⁴ Ω∙cm2 and the resistance of the barrier layer, Rb, was 1.73 × 10⁵ Ω∙cm2, in agreement with the results in literature [50]. This data indicated that the porous layer showed a smaller resistance than the barrier layer, which clearly dominates the corrosion protection. In the following immersion days, Rt was essentially constant throughout the measurement, revealing a stability of the outer porous layer. The resistance values of Rb increased by about one order of magnitude and remained constant for the duration of the test. Generally, a high value of the barrier layer resistance, Rb, suggests higher corrosion protection ability. The capacitance of the outer porous layer value, QPEt, and that of the inner layer, QPEb, changed very little throughout the duration of the experiment, suggesting the long-term stability of the system under study. The value “n” of the constant phase element representing the outer porous and the inner layers, which changed from 0.7 to 0.86, was indicative of a near-capacitive behavior.
It is noteworthy that the nanotubes porous outer layer values, Rt, estimated by fitting the EIS data, presented a similar trend as the Ecorr values that were recorded in the early stage of immersion of each test, as well as verified in earlier work [28]. As a matter of fact, they showed a decrease after the first 24 h of immersion in the test solution, up to a value that remained essentially constant throughout the duration of the test (Figure 7). The Ecorr values variation, from −136 mV to an almost constant value of about −250 mV, confirmed the lack of an EIS curve overlapping those recorded at the beginning of the test.
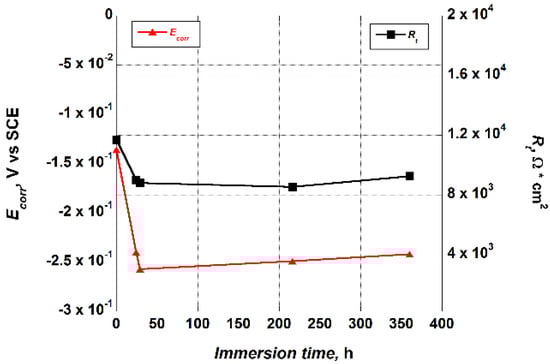
Figure 7.
Trend of the Ecorr and Rt values versus the immersion time in the Hank’s solution exhibited by the Ti_NTorg sample.
The trend of the Ecorr values indicated that, after 24 h of immersion in the test solution, the equilibrium between the formation and the dissolution of the surface oxide on the nanotubes was already achieved.
To evaluate the influence of the electrolyte solution used to grow the titanium nanotubes on the electrochemical stability of the implant, a comparison between samples anodized in an inorganic or organic media was considered. In Table 4 the equivalent circuit parameters of the Ti_NTinorg, previously obtained, are reported.
Table 4.
Electrical equivalent circuit parameters of the Ti_NTinorg sample.
By comparing the two sets of the equivalent circuits parameters, it was possible to verify that the Rt parameter for the Ti_NTinorg sample shifted in the range from 7.32 × 10³ Ω∙cm2 to 2.84 × 10⁴ Ω∙cm2. The Rt parameter for the Ti_NTorg specimen remained essentially constant. On the other hand, the Rb values for the “inorganic” nanotubes shifted in the range from 1.40 × 10⁵ Ω∙cm2 to 2.17 × 10⁶ Ω∙cm2. While the Rb values for the “organic” nanotubes improved by one order of magnitude, reaching a constant value and highlighting the instability of the nanotubes grown in the inorganic solution, which presented variable Rt and Rb values. The Rb value for the organic sample was higher than the inorganic sample. It suggested that the barrier layer formed in the organic nanotubes had better resistance to corrosion, which is most likely due to these reasons: (i) the presence of a rutile phase observed in these kinds of nanotubes, which are the most dense titanium oxide (4.25 g∙cm3) and the most thermodynamically stable [51], (ii) the morphology of the “organic” nanotubes. The latter allowed a much slower replacement of the electrolytic solution within longer and narrower “organic” nanotubes than that showed by the “inorganic” nanotubes, characterized by greater accessibility. Looking at the parameters obtained at the beginning of the test, both samples, Ti_NTinorg and Ti_NTorg seemed to present similar values of Rt and Rb; however, in this case, as in the potentiodynamic polarization curves, the contribution of the “real” area should be taken into account.
4. Conclusions
The anodic oxidation performed on a dental screw in an “organic” solution obtained nanotubes about 70 nm in diameters, about 8 in length µm, and smooth side walls. The XRD pattern has revealed the presence of a rutile structure, as the results of the heat treatment were performed to prevent the formation of an unavoidable nanograss layer. On the other hand, the rutile form could improve the bone-bonding ability and could provide better mechanical properties compared to amorphous titanium oxide. The potentiodynamic polarization test showed a high corrosion potential, due to the anodic oxide formed and its thickness, but also a high passive current for the greater area exposed by the “organic” nanotubes, which were longer than the “inorganic” nanotubes and displayed a higher density. The EIS tests conducted for 15 days in Hank’s solution demonstrated a higher stabilized surface of the “organic” nanostructures, in comparison to the “inorganic” nanotubes, which evinces their use for long-term medical devices.
Author Contributions
Data curation, A.A.; Formal analysis, A.A.; Funding acquisition, A.C.; Investigation, A.C.; Project administration, T.M.; Supervision, T.M.; Writing – original draft, A.A.
Funding
This research received no external funding.
Conflicts of Interest
The authors declare no conflict of interest.
References
- Brunette, P.T.D.M.; Textor, M.; Thomsen, P. Titanium in Medicine; Springer: Berlin/Heidelberg, Germany, 2001. [Google Scholar]
- Long, M.; Rack, H.J. Titanium alloys in total joint replacement—A materials science perspective. Biomaterials 1998, 19, 1621–1639. [Google Scholar] [CrossRef]
- Monetta, T.; Acquesta, A.; Bellucci, F. Evaluation of roughness and electrochemical behavior of titanium in biological environment. Metall. Ital. 2014, 106, 13–21. [Google Scholar]
- Yang, B.; Uchida, M.; Kim, H.-M.; Zhang, X.; Kokubo, T. Preparation of bioactive titanium metal via anodic oxidation treatment. Biomaterials 2004, 25, 1003–1010. [Google Scholar] [CrossRef]
- Monetta, T.; Scala, A.; Malmo, C.; Bellucci, F. Antibacterial Activity of Cold Plasma & minus—Treated Titanium Alloy. Plasma Med. 2011, 1, 205–214. [Google Scholar]
- Monetta, T.; Bellucci, F. Strong and Durable Antibacterial Effect of Titanium Treated in Rf Oxygen Plasma: Preliminary Results. Plasma Chem. Plasma Process. 2014, 34, 1247–1256. [Google Scholar] [CrossRef]
- Roy, P.; Berger, S.; Schmuki, P. TiO2 Nanotubes: Synthesis and Applications. Angew. Chem. Int. Ed. 2011, 50, 2904–2939. [Google Scholar] [CrossRef] [PubMed]
- Wang, J.; Fan, H.; Zhang, H.; Chen, Q.; Liu, Y.; Ma, W. Anodizing process of titanium and formation mechanism of anodic TiO2 nanotubes. Prog. Chem. 2016, 28, 284–295. [Google Scholar]
- Xie, Z.B.; Blackwood, D.J. Effects of anodization parameters on the formation of titania nanotubes in ethylene glycol. Electrochim. Acta 2010, 56, 905–912. [Google Scholar] [CrossRef]
- Muti, M.N.; Dzilal, A.; Dennis, J. Effects of Synthesis Parameters on the structure of titania nanotubes. J. Eng. Sci. Technol. 2008, 3, 163–171. [Google Scholar]
- Bauer, S.; Kleber, S.; Schmuki, P. TiO2 nanotubes: Tailoring the geometry in H3PO4/HF electrolytes. Electrochem. Commun. 2006, 8, 1321–1325. [Google Scholar] [CrossRef]
- Omidvar, H.; Goodarzi, S.; Seif, A.; Azadmehr, A.R. Influence of anodization parameters on the morphology of TiO2 nanotube arrays. Superlattices Microstruct. 2011, 50, 26–39. [Google Scholar] [CrossRef]
- Yoriya, S.; Grimes, C.A. Self-assembled anodic TiO2 nanotube arrays: Electrolyte properties and their effect on resulting morphologies. J. Mater. Chem. 2011, 21, 102–108. [Google Scholar] [CrossRef]
- Lockman, Z.; Sreekantan, S.; Ismail, S.; Schmidt-Mende, L.; MacManus-Driscoll, J.L. Influence of anodisation voltage on the dimension of titania nanotubes. J. Alloys Compd. 2010, 503, 359–364. [Google Scholar] [CrossRef]
- Curtis, A.; Wilkinson, C.; Curtis, A.; Wilkinson, C. Nanotechniques and approaches in biotechnology. Mater. Today 2001, 4, 22–28. [Google Scholar] [CrossRef]
- Demetrescu, I.; Pirvu, C.; Mitran, V. Effect of nano-topographical features of Ti/TiO2 electrode surface on cell response and electrochemical stability in artificial saliva. Bioelectrochemistry 2010, 79, 122–129. [Google Scholar] [CrossRef] [PubMed]
- Hilario, F.; Roche, V.; Nogueira, R.P.; Junior, A.M.J. Influence of morphology and crystalline structure of TiO2 nanotubes on their electrochemical properties and apatite-forming ability. Electrochim. Acta 2017, 245, 337–349. [Google Scholar] [CrossRef]
- Yu, B.; Song, P.I.; Ho, P.H.; Ho, L.M.; Sung, B.T.; Warwick, D.; Michael, S. The effect of annealing temperatures on surface properties, hydroxyapatite growth and cell behaviors of TiO2 nanotubes. Surf. Interface Anal. 2011, 43, 998–1005. [Google Scholar]
- Kakoli, D.; Susmita, B.; Amit, B. TiO2 nanotubes on Ti: Influence of nanoscale morphology on bone cell–materials interaction. J. Biomed. Mater. Res. Part A 2009, 90, 225–237. [Google Scholar]
- Oh, S.; Daraio, C.; Chen, L.H.; Pisanic, T.R.; Fiñones, R.R.; Jin, S. Significantly accelerated osteoblast cell growth on aligned TiO2 nanotubes. J. Biomed. Mater. Res. Part A 2006, 78, 97–103. [Google Scholar] [CrossRef] [PubMed]
- Hsu, H.-C.; Wu, S.-C.; Hsu, S.-K.; Chang, Y.-C.; Ho, W.-F. Fabrication of nanotube arrays on commercially pure titanium and their apatite-forming ability in a simulated body fluid. Mater. Charact. 2015, 100, 170–177. [Google Scholar] [CrossRef]
- Tsuchiya, H.; Macak, J.M.; Muller, L.; Kunze, J.; Muller, F.; Greil, P.; Virtanen, S.; Schmuki, P. Hydroxyapatite growth on anodic TiO2 nanotubes. J. Biomed. Mater. Res. Part A 2006, 77, 534–541. [Google Scholar] [CrossRef] [PubMed]
- De Santo, I.; Sanguigno, L.; Causa, F.; Monetta, T.; Netti, P.A. Exploring doxorubicin localization in eluting TiO2 nanotube arrays through fluorescence correlation spectroscopy analysis. Analyst 2012, 137, 5076–5081. [Google Scholar] [CrossRef] [PubMed]
- Shidfar, S.; Tavangarian, F.; Nemati, N.H.; Fahami, A. Drug delivery behavior of titania nanotube arrays coated with chitosan polymer. Mater. Discov. 2017, 8, 9–17. [Google Scholar] [CrossRef]
- Khoshnood, N.; Zamanian, A.; Massoudi, A. Tailoring in vitro drug delivery properties of titania nanotubes functionalized with (3-Glycidoxypropyl) trimethoxysilane. Mater. Chem. Phys. 2017, 193, 290–297. [Google Scholar] [CrossRef]
- Padiyan, D.P.; Raja, D.H. Synthesis of Various Generations Titania Nanotube Arrays by Electrochemical Anodization for H2 Production. Energy Procedia 2012, 22, 88–100. [Google Scholar] [CrossRef]
- Monetta, T.; Acquesta, A.; Carangelo, A.; Bellucci, F. TiO2 Nanotubes on Ti Dental Implant. Part 1: Formation and Aging in Hank’s Solution. Metals 2017, 7, 167. [Google Scholar] [CrossRef]
- Monetta, T.; Acquesta, A.; Carangelo, A.; Bellucci, F. TiO2 nanotubes on Ti dental implant. Part 2: EIS characterization in Hank’s solution. Metals 2017, 7. [Google Scholar] [CrossRef]
- Mohan, L.; Anandan, C.; Rajendran, N. Electrochemical behaviour and bioactivity of self-organized TiO2 nanotube arrays on Ti-6Al-4V in Hanks’ solution for biomedical applications. Electrochim. Acta 2015, 155, 411–420. [Google Scholar] [CrossRef]
- Al-Mobarak, N.; Al-Swayih, A. Development of titanium surgery implants for improving osseointegration through formation of a titanium nanotube layer. Int. J. Electrochem. Sci. 2014, 9, 32–45. [Google Scholar]
- Wen, C.S.; Chon, C.C.; Yuan, H.S. Monitoring the Effects of Growing Titania Nanotubes on Titanium Substrate by Electrochemical Impedance Spectroscopy Measurement. Jpn. J. Appl. Phys. 2009, 48, 035004. [Google Scholar]
- Chen, Q.; Thouas, G.A. Metallic implant biomaterials. Mater. Sci. Eng. R Rep. 2015, 87, 1–57. [Google Scholar] [CrossRef]
- Ya, J.; Li, A.; Liu, Z.; Lei, E.; Zhao, W.; Zhao, D.; Liu, C. Investigation of surface morphologies of TiO2 nanotube arrays by anodization in ethylene glycol electrolytes. J. Optoelectron. Adv. Mater. 2011, 13, 684–688. [Google Scholar]
- Hoon, L.J.; Jinsub, C. Titanium Oxide Nanowires Originating from Anodically Grown Nanotubes: The Bamboo-Splitting Model. Small 2007, 3, 1504–1507. [Google Scholar]
- Kim, D.; Ghicov, A.; Schmuki, P. TiO2 Nanotube arrays: Elimination of disordered top layers (“nanograss”) for improved photoconversion efficiency in dye-sensitized solar cells. Electrochem. Commun. 2008, 10, 1835–1838. [Google Scholar] [CrossRef]
- Li, H.; Cheng, J.W.; Shu, S.; Zhang, J.; Zheng, L.; Tsang, C.K.; Cheng, H.; Liang, F.; Lee, S.T.; Li, Y.Y. Selective removal of the outer shells of anodic TiO2 nanotubes. Small 2013, 9, 37–44. [Google Scholar] [CrossRef] [PubMed]
- Martin, J.; Hirsch, S.G.; Giri, A.; Griep, M.H.; Karna, S.P. One-Step Synthesis and Characterization of Highly-Ordered Titanium Dioxide Nanotubes. In Proceedings of the 2012 12th IEEE International Conference on Nanotechnology (IEEE-NANO), Birmingham, UK, 20–23 August 2012. [Google Scholar]
- Song, Y.-Y.; Lynch, R.; Kim, D.; Roy, P.; Schmuki, P. TiO2 Nanotubes: Efficient Suppression of Top Etching during Anodic Growth: Key to Improved High Aspect Ratio Geometries. Electrochem. Solid-State Lett. 2009, 12, C17–C20. [Google Scholar] [CrossRef]
- Kontos, A.G.; Kontos, A.I.; Tsoukleris, D.S.; Likodimos, V.; Kunze, J.; Schmuki, P.; Falaras, P. Photo-induced effects on self-organized TiO2 nanotube arrays: the influence of surface morphology. Nanotechnology 2009, 20, 045603. [Google Scholar] [CrossRef] [PubMed]
- Macak, J.M.; Tsuchiya, H.; Taveira, L.; Aldabergerova, S.; Schmuki, P. Smooth Anodic TiO2 Nanotubes. Angew. Chem. Int. Ed. 2005, 44, 7463–7465. [Google Scholar] [CrossRef] [PubMed]
- Hu, M.Z.; Lai, P.; Bhuiyan, M.S.; Tsouris, C.; Gu, B.; Paranthaman, M.P.; Gabitto, J.; Harrison, L. Synthesis and characterization of anodized titanium-oxide nanotube arrays. J. Mater. Sci. 2009, 44, 2820–2827. [Google Scholar] [CrossRef]
- Lee, K.; Mazare, A.; Schmuki, P. One-Dimensional Titanium Dioxide Nanomaterials: Nanotubes. Chem. Rev. 2014, 114, 9385–9454. [Google Scholar] [CrossRef] [PubMed]
- Gibran, K.; Ibadurrahman, M.; Slamet. Effect of electrolyte type on the morphology and crystallinity of TiO2 nanotubes from Ti-6Al-4V anodization. IOP Conf. Ser. Earth Environ. Sci. 2018, 105, 012038. [Google Scholar] [CrossRef]
- Chuang, L.-C.; Luo, C.-H.; Yang, S. The structure and mechanical properties of thick rutile–TiO2 films using different coating treatments. Appl. Surf. Sci. 2011, 258, 297–303. [Google Scholar] [CrossRef]
- Mohan, L.; Anandan, C.; Rajendran, N. Electrochemical behavior and effect of heat treatment on morphology, crystalline structure of self-organized TiO2 nanotube arrays on Ti-6Al-7Nb for biomedical applications. Mater. Sci. Eng. C Mater. Biol. Appl. 2015, 50, 394–401. [Google Scholar] [CrossRef] [PubMed]
- De Assis, S.L.; Wolynec, S.; Costa, I. Corrosion characterization of titanium alloys by electrochemical techniques. Electrochim. Acta 2006, 51, 1815–1819. [Google Scholar] [CrossRef]
- Yu, W.Q.; Qiu, J.; Xu, L.; Zhang, F.Q. Corrosion behaviors of TiO2 nanotube layers on titanium in Hank’s solution. Biomed. Mater. 2009, 4, 065012. [Google Scholar] [CrossRef] [PubMed]
- Al-Swayih, A. Electrochemical Characterization of Titanium Oxide Nanotubes Fabricated by Anodizing in Three Kinds of Electrolytes. Life Sci. J. 2014, 11, 52–59. [Google Scholar]
- Jüttner, K. Electrochemical impedance spectroscopy (EIS) of corrosion processes on inhomogeneous surfaces. Electrochim. Acta 1990, 35, 1501–1508. [Google Scholar] [CrossRef]
- Simi, V.S.; Rajendran, N. Influence of tunable diameter on the electrochemical behavior and antibacterial activity of titania nanotube arrays for biomedical applications. Mater. Charact. 2017, 129, 67–79. [Google Scholar] [CrossRef]
- Martin, N.; Rousselot, C.; Rondot, D.; Palmino, F.; Mercier, R. Microstructure modification of amorphous titanium oxide thin films during annealing treatment. Thin Solid Films 1997, 300, 113–121. [Google Scholar] [CrossRef]


© 2018 by the authors. Licensee MDPI, Basel, Switzerland. This article is an open access article distributed under the terms and conditions of the Creative Commons Attribution (CC BY) license (http://creativecommons.org/licenses/by/4.0/).