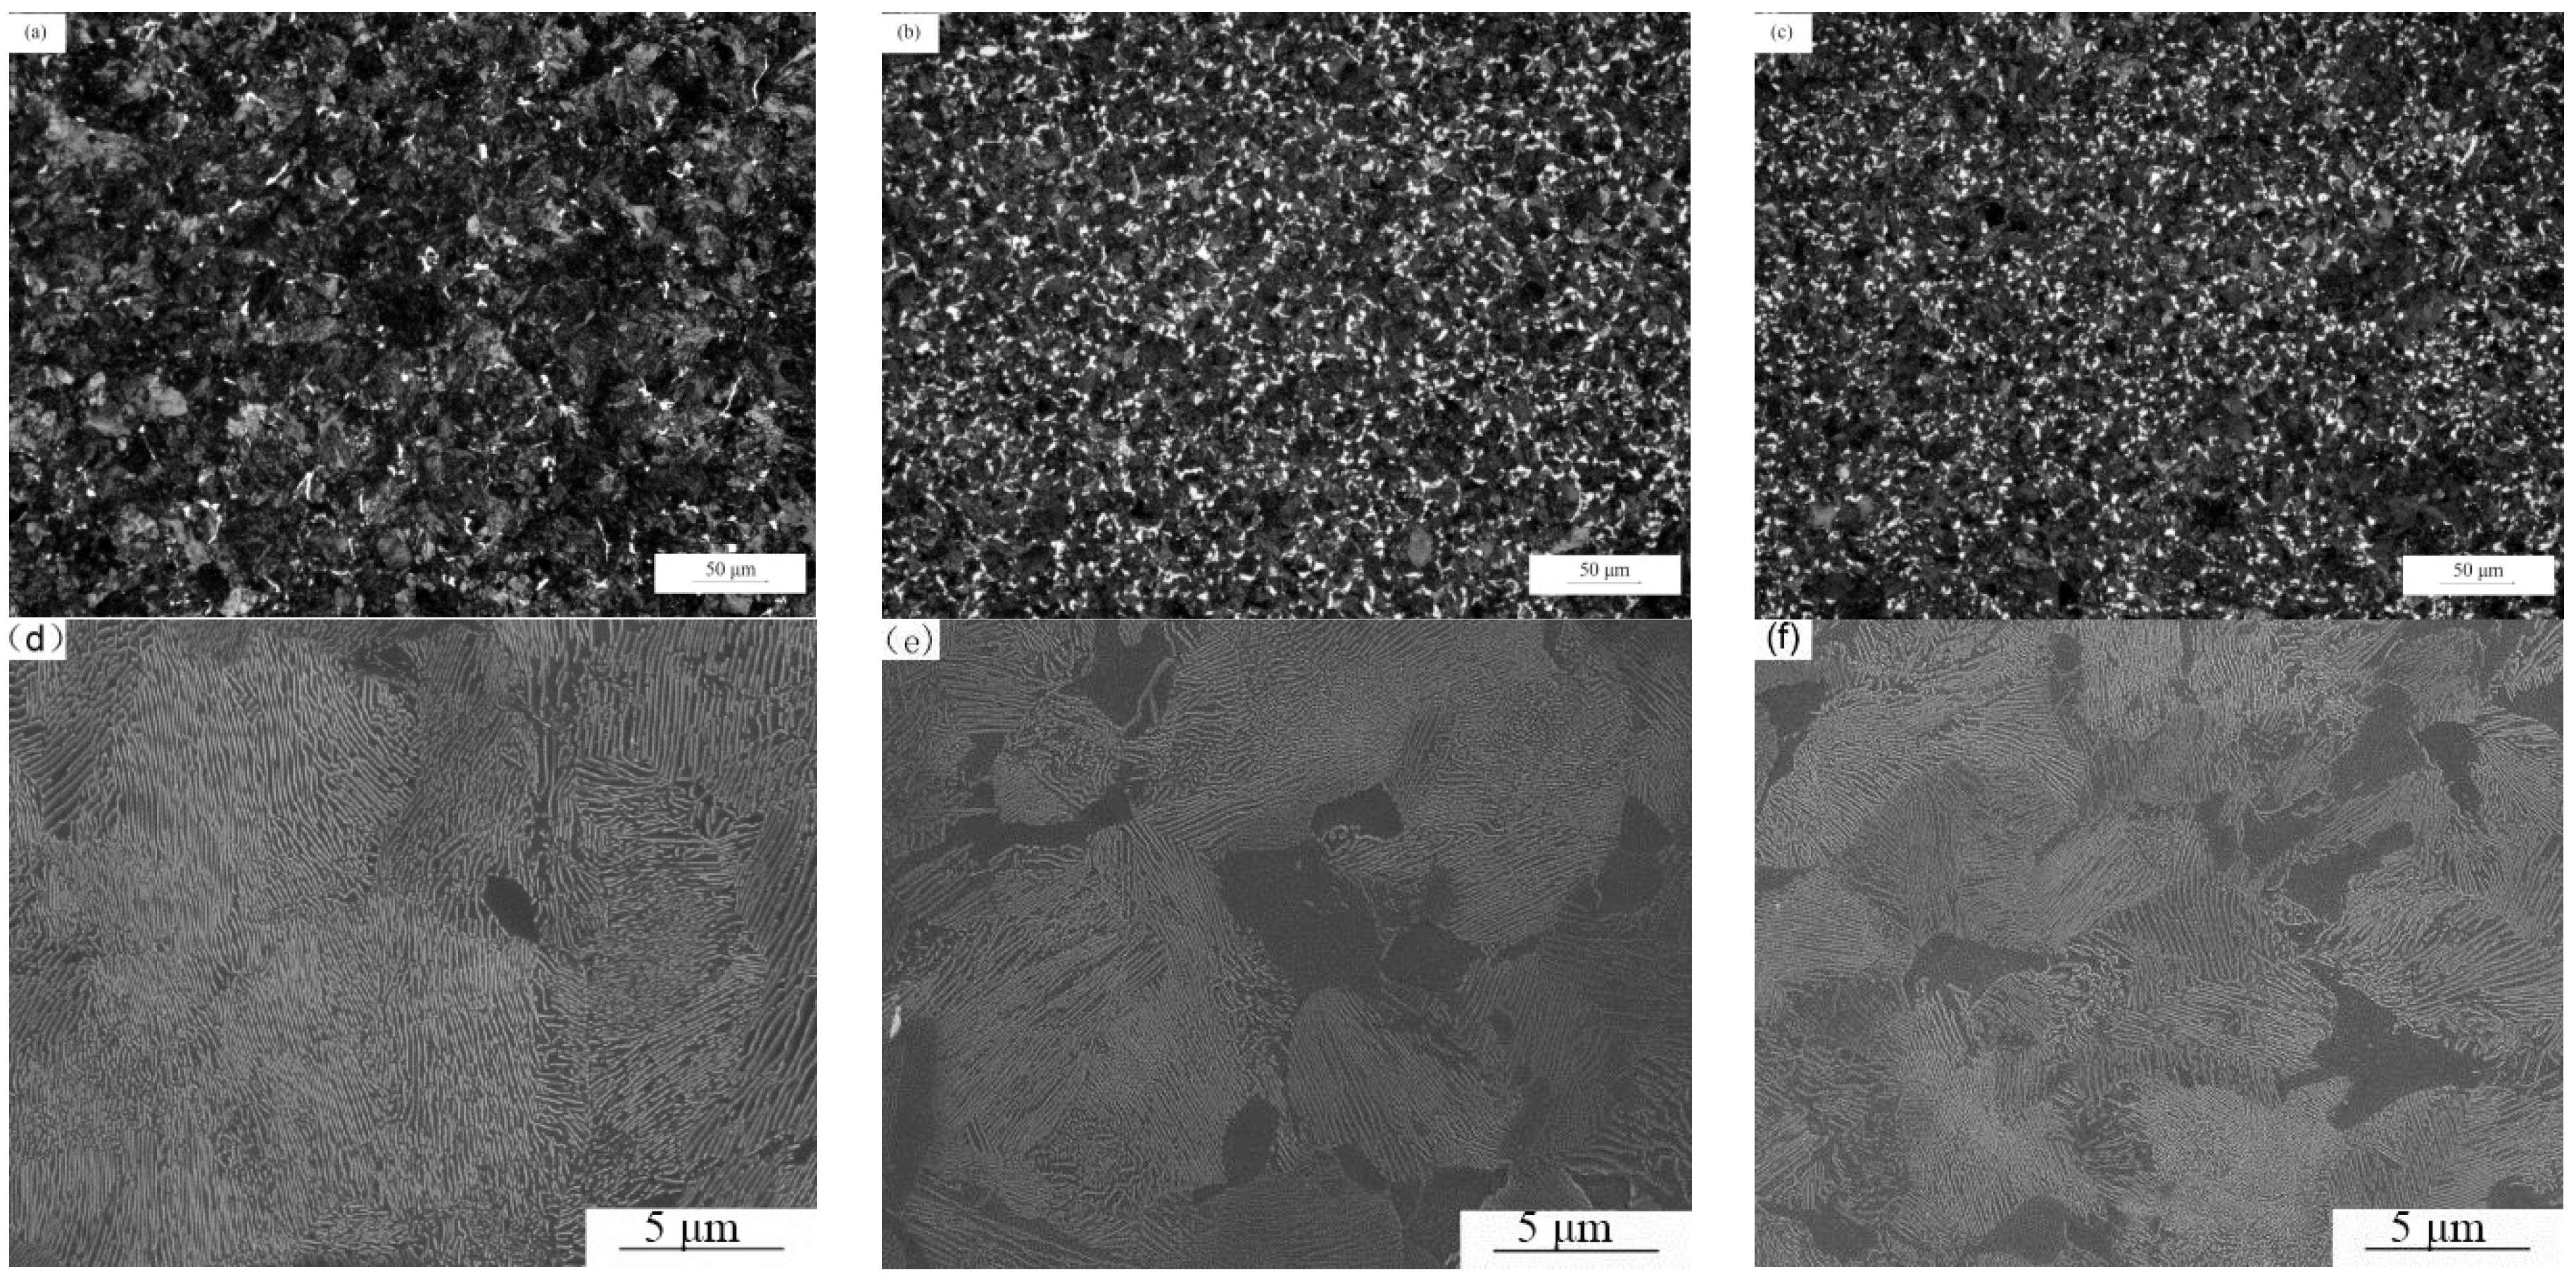
Article

Influence of Vanadium on the Microstructure and Mechanical Properties of Medium-Carbon Steels for Wheels

1
School of Materials Science and Engineering, University of Science and Technology, Beijing 100083, China
2
Department of Structural Steels, Central Iron and Steel Research Institute, Beijing 100081, China
3
Department of Materials Science and Engineering, Kunming University of Science and Technology, Kunming 650093, China
*
Author to whom correspondence should be addressed.
Metals 2018, 8(12), 978; https://doi.org/10.3390/met8120978
Submission received: 31 October 2018 / Revised: 14 November 2018 / Accepted: 21 November 2018 / Published: 23 November 2018
(This article belongs to the Special Issue Advances in Microalloyed Steels)

Abstract

:
Steels used for high-speed train wheels require a combination of high strength, toughness, and wear resistance. In 0.54% C-0.9% Si wheel steel, the addition of 0.075 or 0.12 wt % V can refine grains and increase the ferrite content and toughness, although the influence on the microstructure and toughness is complex and poorly understood. We investigated the effect of 0.03, 0.12, and 0.23 wt % V on the microstructure and mechanical properties of medium-carbon steels (0.54% C-0.9% Si) for train wheels. As the V content increased, the precipitation strengthening increased, whereas the grain refinement initially increased, and then it remained unchanged. The increase in strength and hardness was mainly due to V(C,N) precipitation strengthening. Increasing the V content to 0.12 wt % refined the austenite grain size and pearlite block size, and increased the density of high-angle ferrite boundaries and ferrite volume fraction. The grain refinement improved the impact toughness. However, the impact toughness then reduced as the V content was increased to 0.23 wt %, because grain refinement did not further increase, whereas precipitation strengthening and ferrite hardening occurred.

1. Introduction

Steels for high-speed train wheels must have good strength, toughness, and wear resistance. Pearlite steel, which has a lamellar microstructure obtained by special processing, is exceptionally strong and is often used for this application. The performance of the microstructure mainly depends on the proeutectoid ferrite and pearlite content, and the size of the pearlite substructure.
Microalloying is used to improve the performance of wheel steel by increasing its strength and preventing crack propagation via obtaining a microstructure with good toughness. V has a high solubility in γ-Fe, and it exists in solution or as a precipitate below austenitizing temperatures. The addition of V results in solution strengthening, precipitation strengthening, grain refinement, and hardening. Thus, V has an important effect on the toughness of steel [1,2,3]. Adding 0.1 wt % V to eutectoid steel can delay the pearlite transformation and effectively refine the pearlite colony size and interlamellar spacing [4]. The dissolution and precipitation of V in medium-carbon steel has a beneficial effect on microstructure refinement and ferrite content, and increases the steel strength [5,6]. Studies have shown that ferrite volume fraction and grain size, pearlite colony/block size, pearlite interlemellar spacing, and austenite grain size all contribute to the toughness of hypoeutectic steel [7,8]. The addition of V increases the hardness of steel, while a high V content decreases the impact toughness [9]. A previous study reported that in steel containing 0.4 wt % C, the toughness of the steel dropped sharply when the V content reached 0.2 wt %, but a detailed explanation was not given [10]. Most research focuses on low-carbon or medium-carbon steels with a C content of 0.4 wt %, or steels with a low Si content, so that the volume fraction of proeutectoid ferrite is high. There has been limited research on wheel steel with a C content of around 0.54 wt %, a high Si content, and a low ferrite content. In 0.54% C-0.9% Si wheel steel, increasing the V content from 0.03 to 0.075 or 0.12 wt % can substantially refine the grains and increase the ferrite content and toughness, although it has a complex effect on strength [11]. The effect of the V content on the microstructure and toughness of medium-carbon wheel steel (0.54% C-0.9% Si) with a low ferrite content remains poorly understood. Thus, in this paper, we investigate the effect of V content on the microstructure and toughness of medium-carbon wheel steel with a low ferrite content.

2. Materials and Methods

2.1. Materials and Processing Technology

Three experimental steels were prepared by smelting in a vacuum induction furnace and rolling. The equilibrium phase-transformation temperatures of the steels were calculated by using Thermo-Calc (TCFE7) software (TCFE7 database, Stockholm, Sweden). The chemical composition of the steel samples and the Ae3 (γ/α temperature) and Ae1 (γ+α/γ+α+θ temperature) equilibrium temperatures are listed in Table 1. The size of the rolled specimen was 250 mm (length, rolling direction) × 125 mm (width) × 60 mm (thickness). The rolling process involved heating to 1280 °C for 2 h, several passes of continuous rolling, and finishing rolling above 900 °C, followed by air cooling to room temperature.
For the heat treatment experiments, samples of 65 mm (length)× 62 mm (width) × 15 mm (thickness) were used. The heat treatment process was heating to 860 °C for 1 h, air cooling to room temperature (an average cooling rate of about 3 °C/s in the range of 700–500 °C), tempering at 520 °C for 2 h, and air cooling to room temperature. The schematic of the thermo-mechanical treatment of the investigated steels is shown in Figure 1.

2.2. Mechanical Properties

Standard tensile samples with a diameter of 5 mm and a standard length of 25 mm were tested at room temperature on a tensile testing machine (WE-300, Jinan Kairui Machinery Equipment Co., Ltd., Jinan, China), to obtain the yield strength (Rp0.2), tensile strength (Rm), section shrinkage (ψ), and elongation (δ).
The heat-treated samples were mechanically ground and polished, and then etched with 4% nitric acid in alcohol. The hardness was measured using a Vickers hardness tester with a load of 5 kg and a loading time of 10 s. Microhardness measurements were performed made using a Vickers hardness tester (VH-5, Univer, Qingdao Fupida Electromechanical Technology Co., Ltd., Qingdao, China) with a load of 10 g and a loading time of 10 s. Before measuring the microhardness, the sample was polished and slightly etched with 2% nitric acid in alcohol to distinguish the proeutectoid ferrite and pearlite. The Charpy V impact tests were conducted on an impact tester (JBW-300N, Shanghai Zhujin Instrument Co., Ltd., Shanghai, China) using transverse specimens (10 mm × 10 mm × 55 mm) at test temperatures of −20 and 20 °C.

2.3. Microstructure Analysis

After mechanical grinding, polishing, and etching with 4% nitric acid in alcohol, the heat-treated samples were examined by optical microscopy (OM, GX51, Olympus, Tokyo, Japan) and scanning electron microscopy (SEM, S-4300, Hitachi, Tokyo, Japan). Since the pro-eutectoid ferrite is formed at the austenite grain boundary, we used the intercept method to measure the amount of pro-eutectoid ferrite per unit distance, to obtain the spacing of the pro-eutectoid ferrite, thereby estimating the austenite grain size. The volume fraction of the proeutectoid ferrite was measured from the OM images by the point count method, and there were at least 15 photographs with a magnification of 100×. The intercept method was used to measure the pearlite colony size and the lamellar spacing from the SEM images. The pearlite block size was measured from a large-angle interface diagram with an electron backscatter diffraction (EBSD, Nordlys F+, Oxford, London, UK) step size of 0.5 μm. The density of the high-angle ferrite interface was the ratio of the total length of the interface greater than 15° to the measured area in the ferrite interface diagram per unit area. The cementite thickness (tc) was calculated from the relationship between the pearlite interlamellar spacing (S) and the carbon content (wt % C) [12].
  t c = S   ×   0.15 ( w t   %   C ) V  
where V is the volume fraction of pearlite.
The samples were examined by SEM and EBSD after electrolytic polishing. Thin-film samples with a diameter of 3 mm were prepared using a double-spout electrolytic polishing device in 8% perchloric acid in ethanol, and the microstructure and precipitation of the samples were analyzed by transmission electron microscopy (TEM; H-800, Hitachi, Tokyo, Japan) at an acceleration voltage of 200 kV.
The precipitated phase in the steels was qualitatively and quantitatively investigated by physicochemical phase analysis. Six 20 mm × 60 mm samples were prepared, subjected to electrolysis, and then cleaned to remove residues. The samples were analyzed by X-ray diffraction (XRD), quantitative analysis, and X-ray small angle diffraction to determine the particle size. The residue after electrolysis was also analyzed by XRD (APD-10, Phillips, London, UK). The element mass fraction was determined by inductively coupled plasma-atomic emission spectrometry, and the particle size analysis of the MC phase was performed by Kratky small-angle X-ray scatterometry.

3. Results and Discussion

3.1. Microstructure

The microstructure of the heat-treated samples was lamellar pearlite with a small amount of proeutectoid ferrite. The OM (Figure 2a–c) and SEM (Figure 2d–f) images show the microstructure of the steels. The microstructural parameters of the steels are shown in Table 2. As the V content was increased from 0.03 to 0.12 wt %, the sizes of the austenite grains, pearlite colonies, and pearlite blocks decreased, and the proeutectoid ferrite volume fraction and the density of high-angle ferrite boundaries increased. The changes in these parameters were small when the V content was further increased from 0.12 to 0.23 wt %. In addition, the proeutectoid ferrite size decreased and the cementite thickness did not change significantly as the V was content increased.
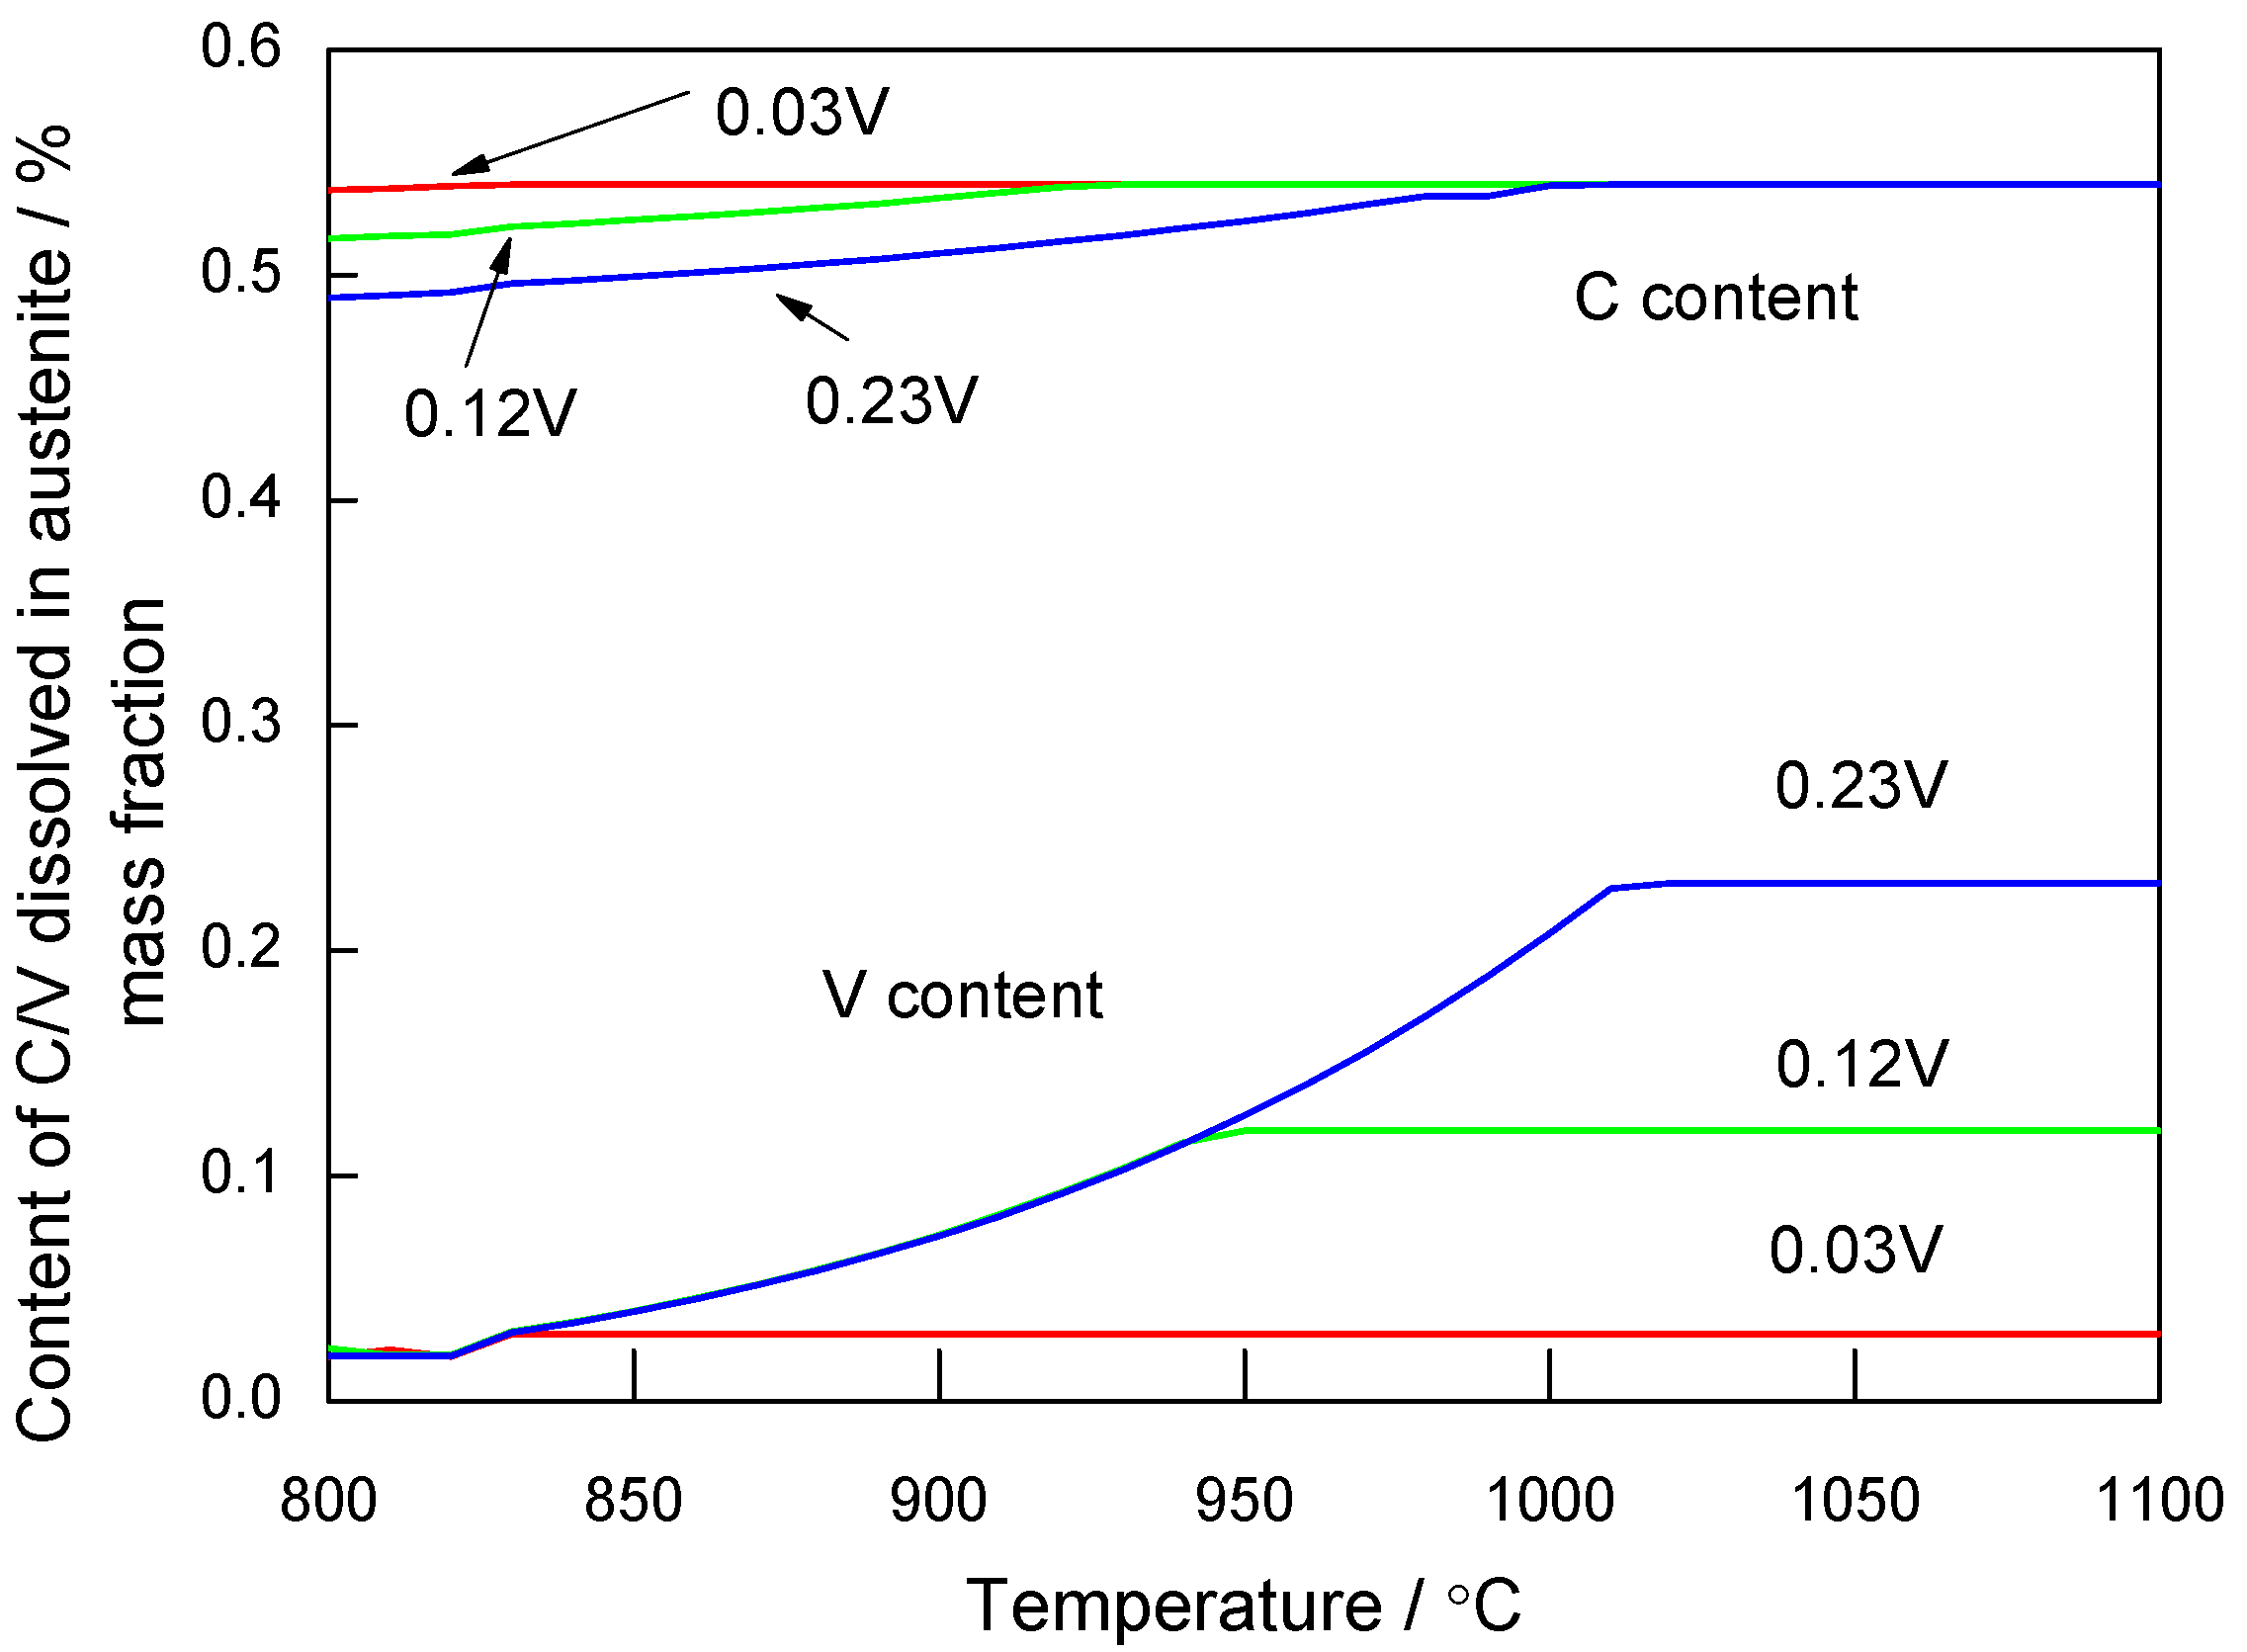
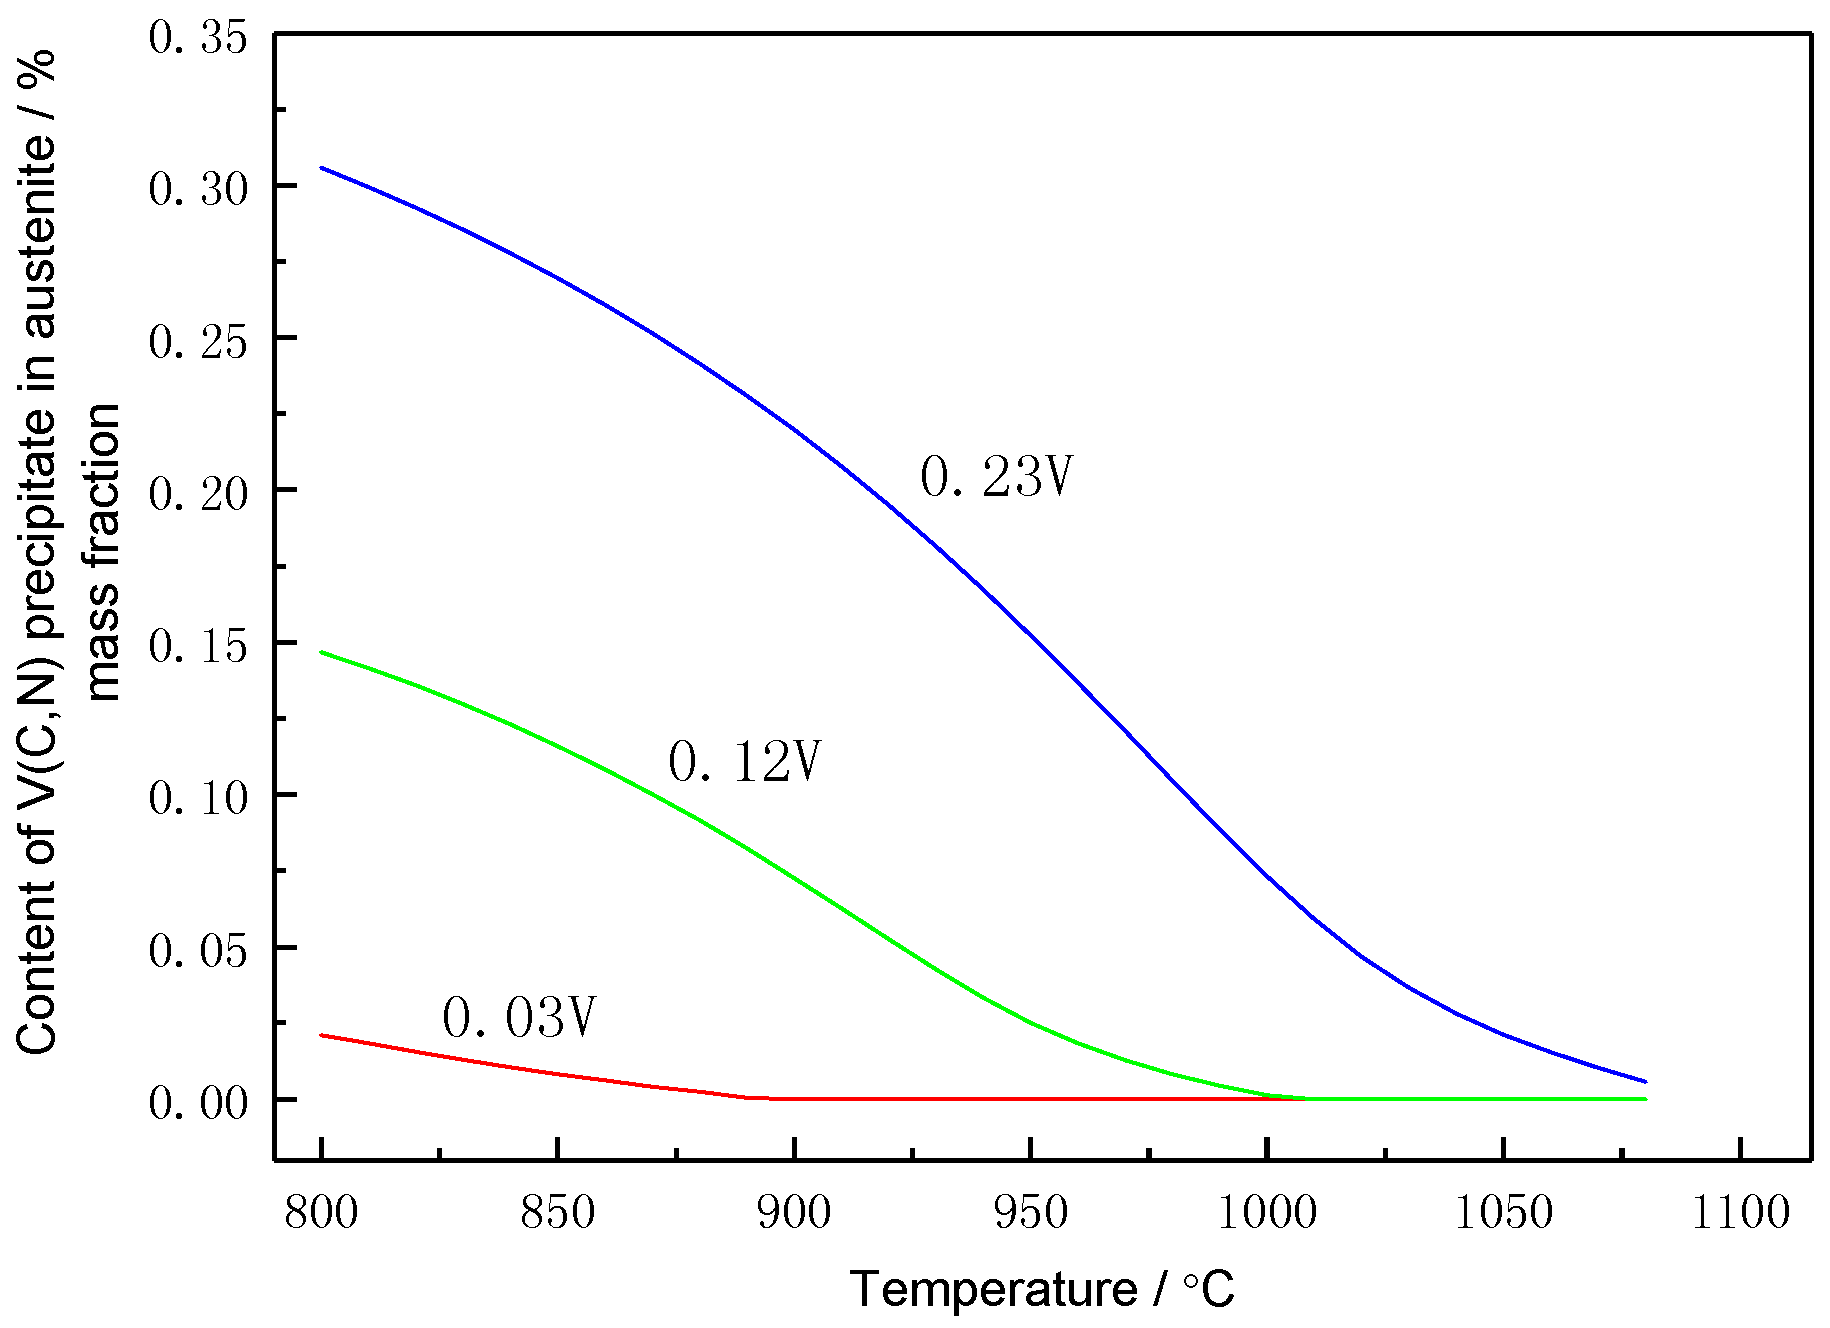
Figure 3 shows the results of the Thermo-Calc calculations. V solid solution in austenite in steel samples 0.03 V and 0.12 V had a small amount of precipitate from 830 °C to 940 °C. In contrast, sample 0.23 V showed precipitate from 1010 °C, the amount of solid solution decreased from 0.23 to 0.11 wt % at 940 °C, and subsequently, the amount of solid solution was the same as that of sample 0.12 V.
Compared with samples 0.03 V and 0.12 V, V precipitation gradually increased with the increase in V content. The precipitated V(C,N) was formed at the austenite grain boundary, preventing the grain from growing, and thus refining the grain. Grain refinement provides more nucleation positions and facilitates proeutectoid ferrite transformation. Compared with samples 0.12 V and 0.23 V, as the V content continued to increase, a large amount of V was coarse precipitate, which had little effect on the austenite refinement as the temperature was decreased from 1010 to 940 °C, due to the high temperature and low N content. When the driving force of the grain growth is balanced with the resistance of the second-phase particles to grain growth, high-V steel can precipitate too many particles at a high temperature, and the resistance to grain growth exceeds the driving force for balancing grain growth. Thus, some precipitated particles do not produce a refinement effect [13].
The higher the V content in the experimental steels, the higher the precipitation temperature of VC; the initial precipitation temperatures of VC for samples 0.03 V, 0.12 V, and 0.23 V were 830 °C, 940 °C, and 1010 °C, respectively. In austenite at a temperature of 860 °C, V is completely dissolved in 0.03 V steel and only partially dissolved in 0.12 V and 0.23 V steels. Furthermore, the amount of undissolved precipitates (VC) present in 0.23 V steel was higher than that in 0.12 V steel, and the solution content of V was the same.
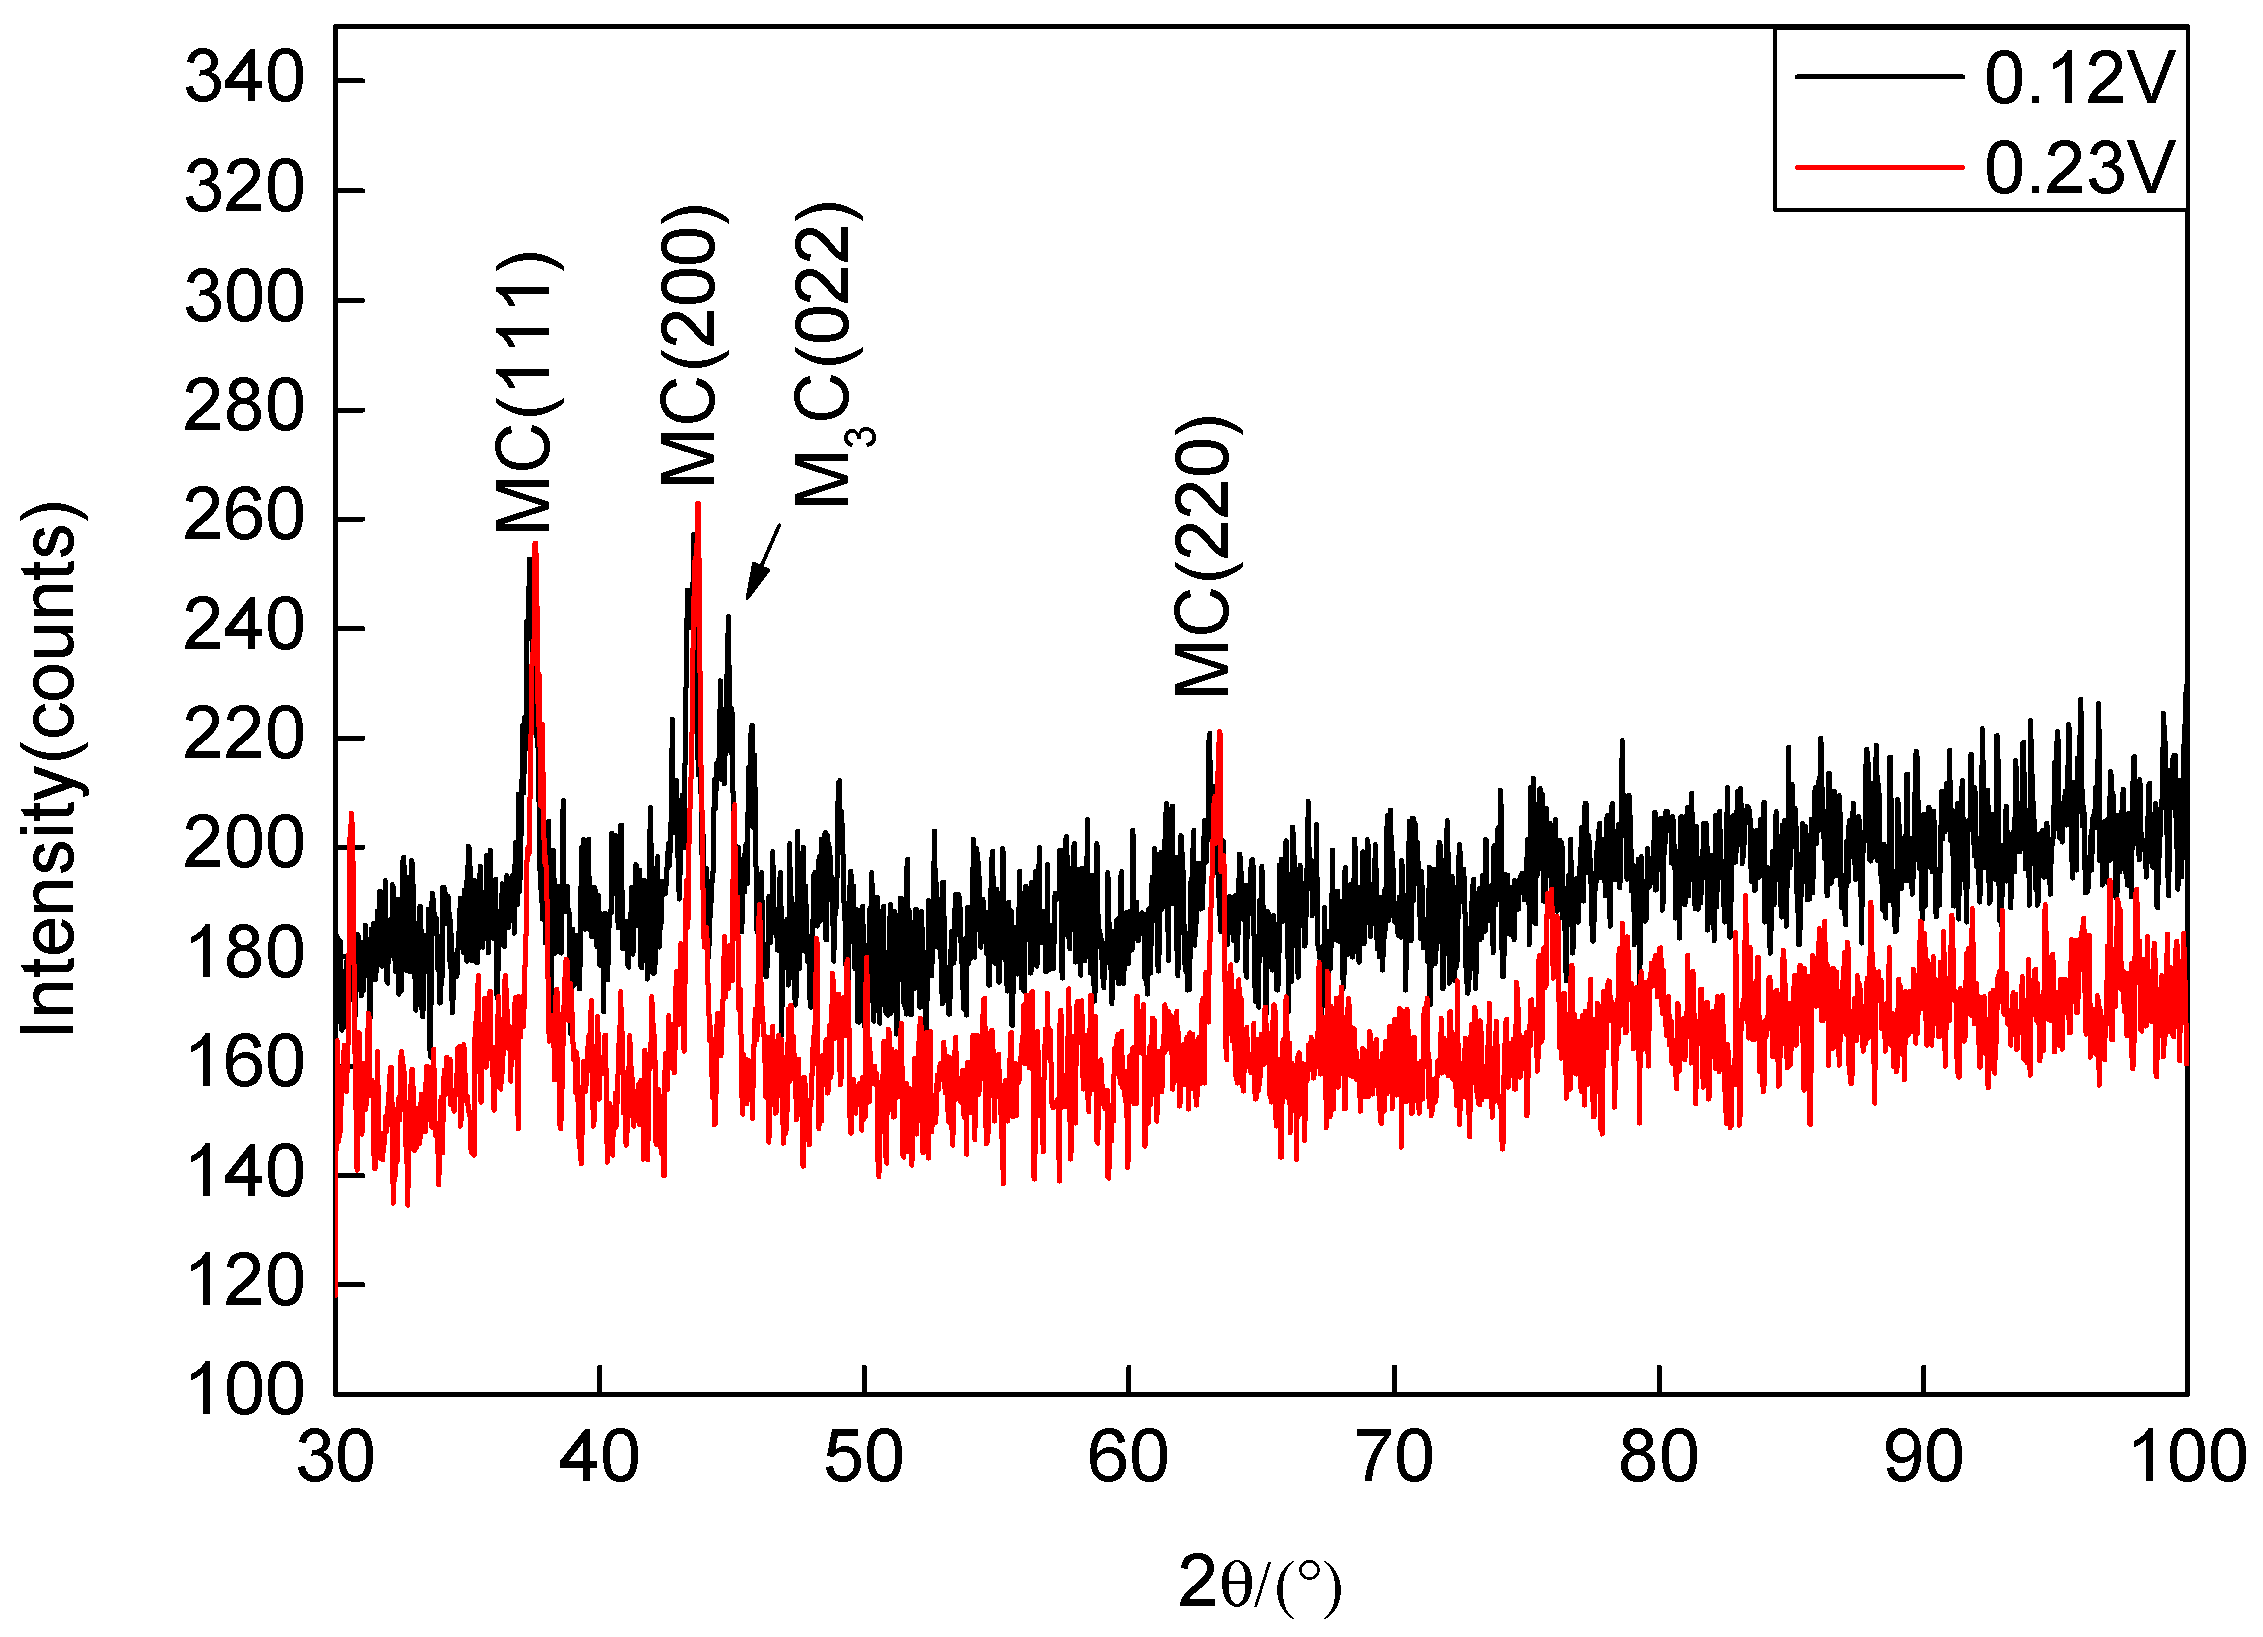
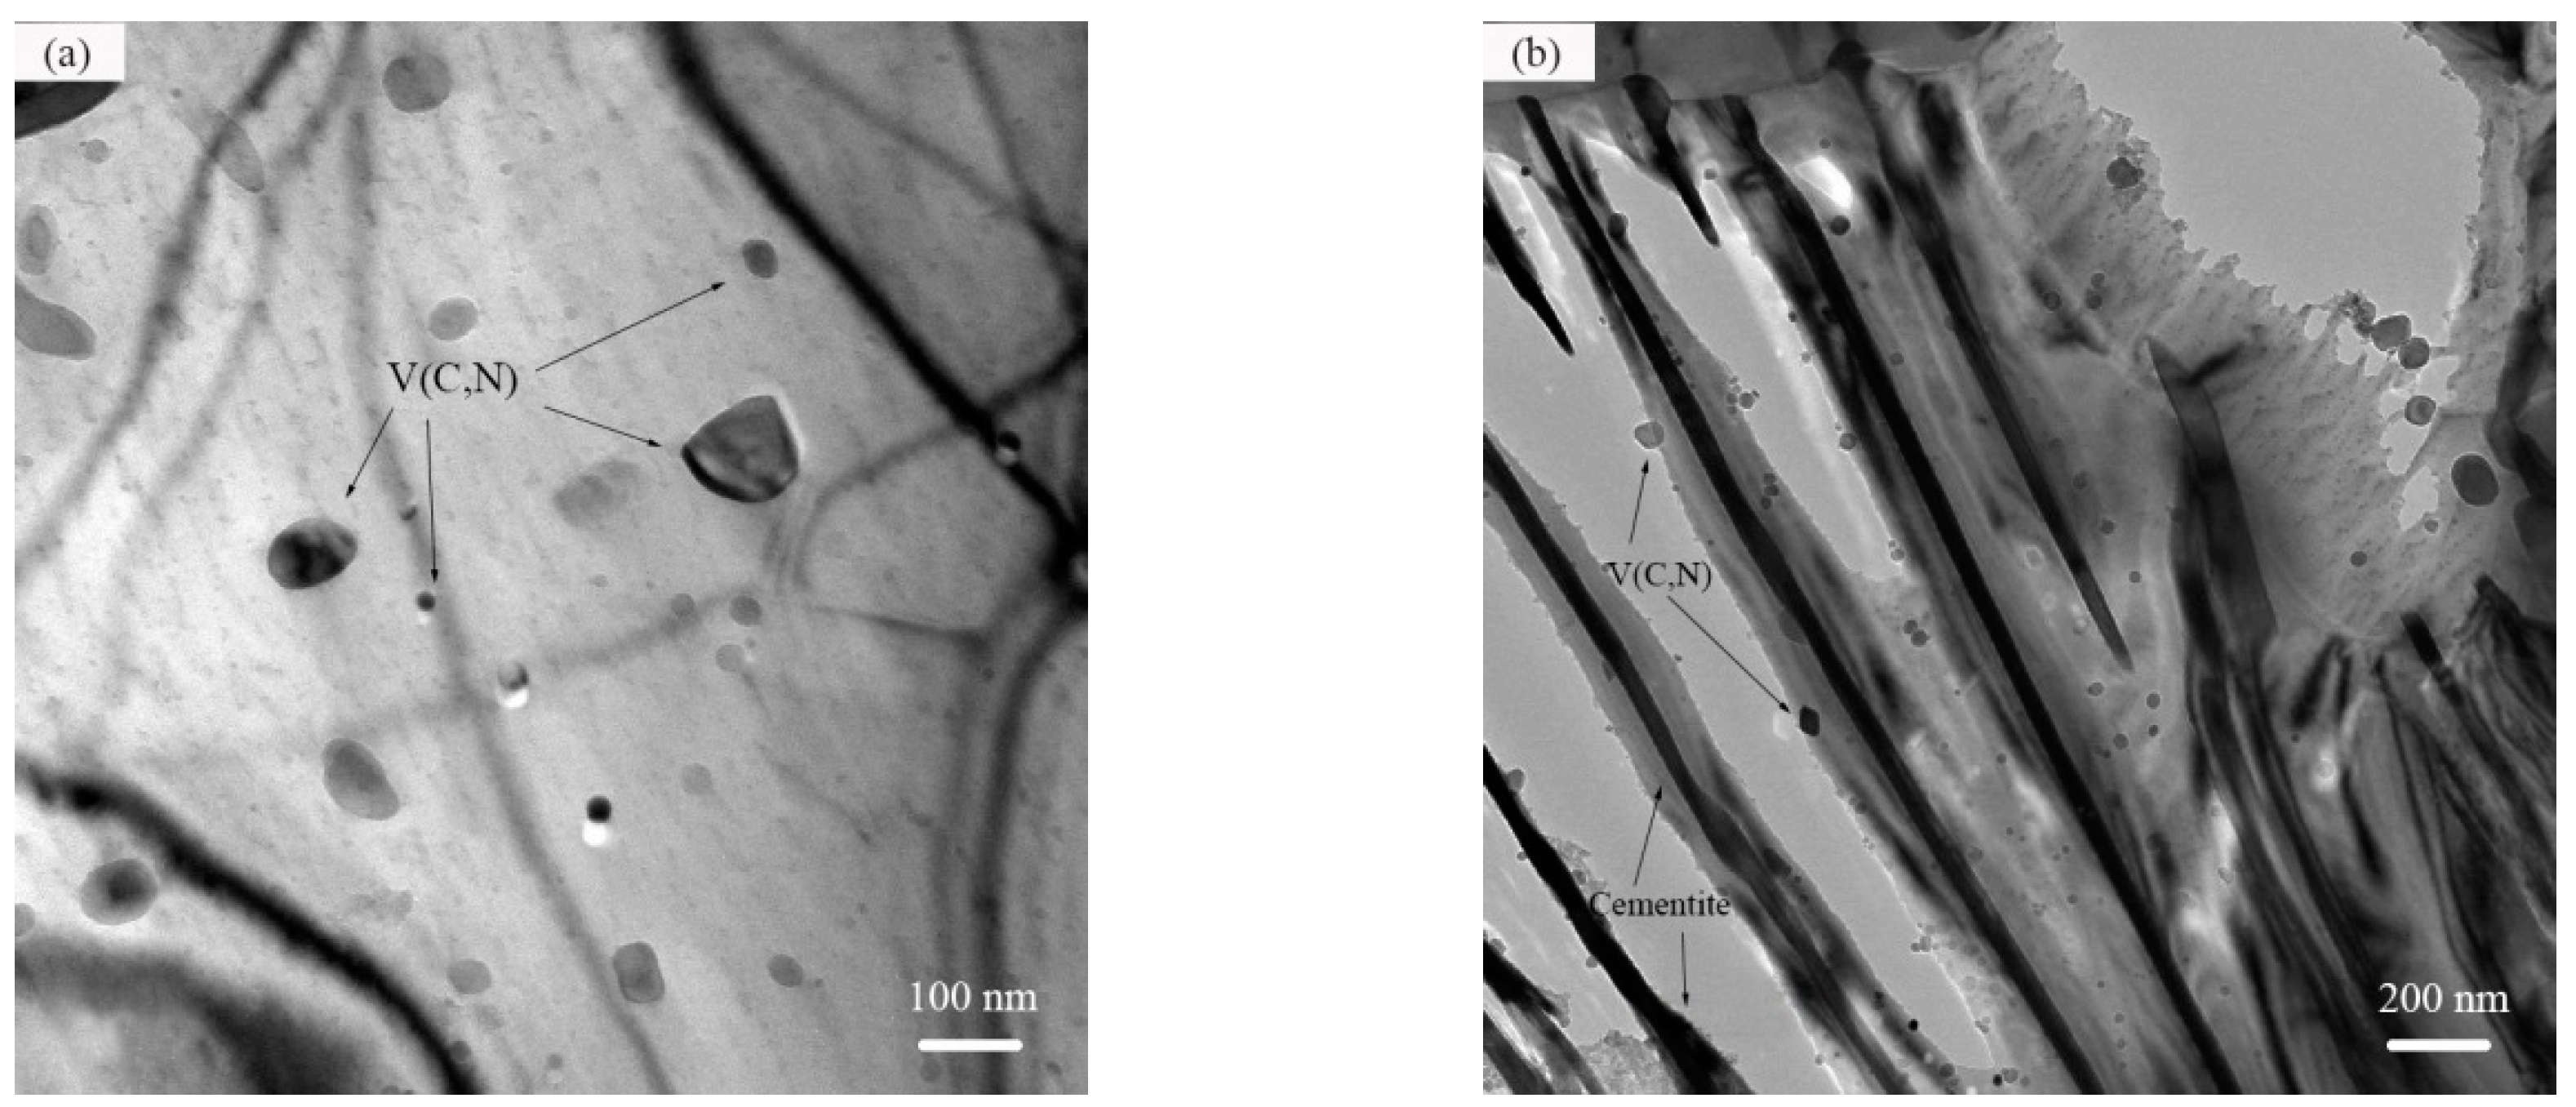
Comparing samples 0.03 V and 0.12 V, V precipitation gradually increased with increasing V content. The precipitates formed at the austenite grain boundary, preventing the grain from growing, and thus refining the grain. Grain refinement provides more nucleation sites and facilitates proeutectoid ferrite transformation. As shown in Figure 4, the amount of VC precipitated in 0.03 V steel was small, leading to weak grain refinement. The amount of VC precipitated in 0.12 V and 0.23 V steels was relatively higher, resulting in an obvious grain refinement effect. According to Zener’s formula, the relationship between the precipitates and grain size is:
  D C = A d f  
where DC is the critical grain size (μm), A is a proportionality factor, d is the S of the precipitate (μm), and f is the volume fraction of the precipitate.
Since the precipitation temperature of VC and the content of undissolved V are both higher for 0.23 V steel, the VC size precipitated at 860 °C will be greater than that for 0.12 V steel. Meanwhile, as can be seen from Figure 3, the volume fraction of VC in 0.23 V steel at 860 °C is also higher than that in 0.12 V steel, and the values of d/f should be essentially equivalent. Therefore, the grain-refining effect of VC on 0.23 V steel and 0.12 V steel is basically the same.
The dissolved V contents in 0.03 V, 0.12 V, and 0.23 V steels were 0.03, 0.045, and 0.045 wt %, respectively, while the solution contents of C were 0.54, 0.52, and 0.50 wt %, respectively. The solute drag effect of V plays a role in grain refinement. The solid solutions of V in samples 0.12 V and 0.23 V were the same, and there was no further refinement effect. Therefore, the austenite size of sample 0.12 V was substantially smaller than that of sample 0.03 V, whereas those of samples 0.12 V and 0.23 V were similar. The change in proeutectoid ferrite content was mainly caused by the austenite grain size and the C solid solution content. The austenite refinement of sample 0.12 V was considerably greater than that of sample 0.03 V, the C solid solution content was lower, and the proeutectoid ferrite content was higher. The austenite refinement of sample 0.23 V was not obvious compared with sample 0.12 V, the C solid solution was lower, and the proeutectoid ferrite content was similar.
As the V content increases, the amount of proeutectoid ferrite at the austenite grain boundary increases. This destroys the continuity between the austenite grains, and reduces the size of the austenite grains that transformed to pearlite, thus refining the sizes of the pearlite colonies and blocks after the transformation. The nucleation and growth rates of pearlite colonies and blocks are also affected by the pearlite transformation temperature, and decreasing the transformation temperature refines the sizes of the pearlite colonies and blocks. The V solid solution increases the diffusion activation energy of C atoms, improving the stability of the austenite, and increasing the undercooling of the material at the same cooling rate. Owing to the differences in the austenite grain size and pearlite transformation temperature, sample 0.12 V had substantially smaller pearlite colonies and blocks than sample 0.03 V, whereas those of samples 0.12 V and 0.23 V were similar.
As the V content increased, the temperature of the pearlite transformation decreased. Because V is a strong carbide-forming element that hinders the diffusion of C atoms, the interlamellar spacing also decreased.

3.2. Analysis of the Precipitate Phase

XRD and TEM were used to examine the precipitated phases. The V in sample 0.03 V was almost completely dissolved at 860 °C, as Figure 4 shows. For the convenience of the following analysis, we ignore the precipitation in 0.03 V steel; only the precipitated phases in samples 0.12 V and 0.23 V were analyzed. Samples 0.12 V and 0.23 V contained the M3C (alloy cementite) phase and the MC (V(C,N) phase, which includes a small amount of Cr. The quantitative analysis results are presented in Table 3 and Table 4. The amount of V precipitate and the mass fraction of the M3C and M(C,N) phases were obtained. The XRD patterns are shown in Figure 5. The nominal chemical formulas of the M(C,N) phase in samples 0.12 V and 0.23 V were calculated as (V0.767Cr0.233)(C0.937N0.063) and (V0.876Cr0.124)(C0.943N0.057), respectively. M(C,N) particles were precipitated in the proeutectoid ferrite and pearlitic ferrite (Figure 6). Figure 7 shows the size distribution of V(C,N) in samples 0.12 V and 0.23 V, which had average sizes of 48.9 and 40.7 nm, respectively.

3.3. Strength and Hardness

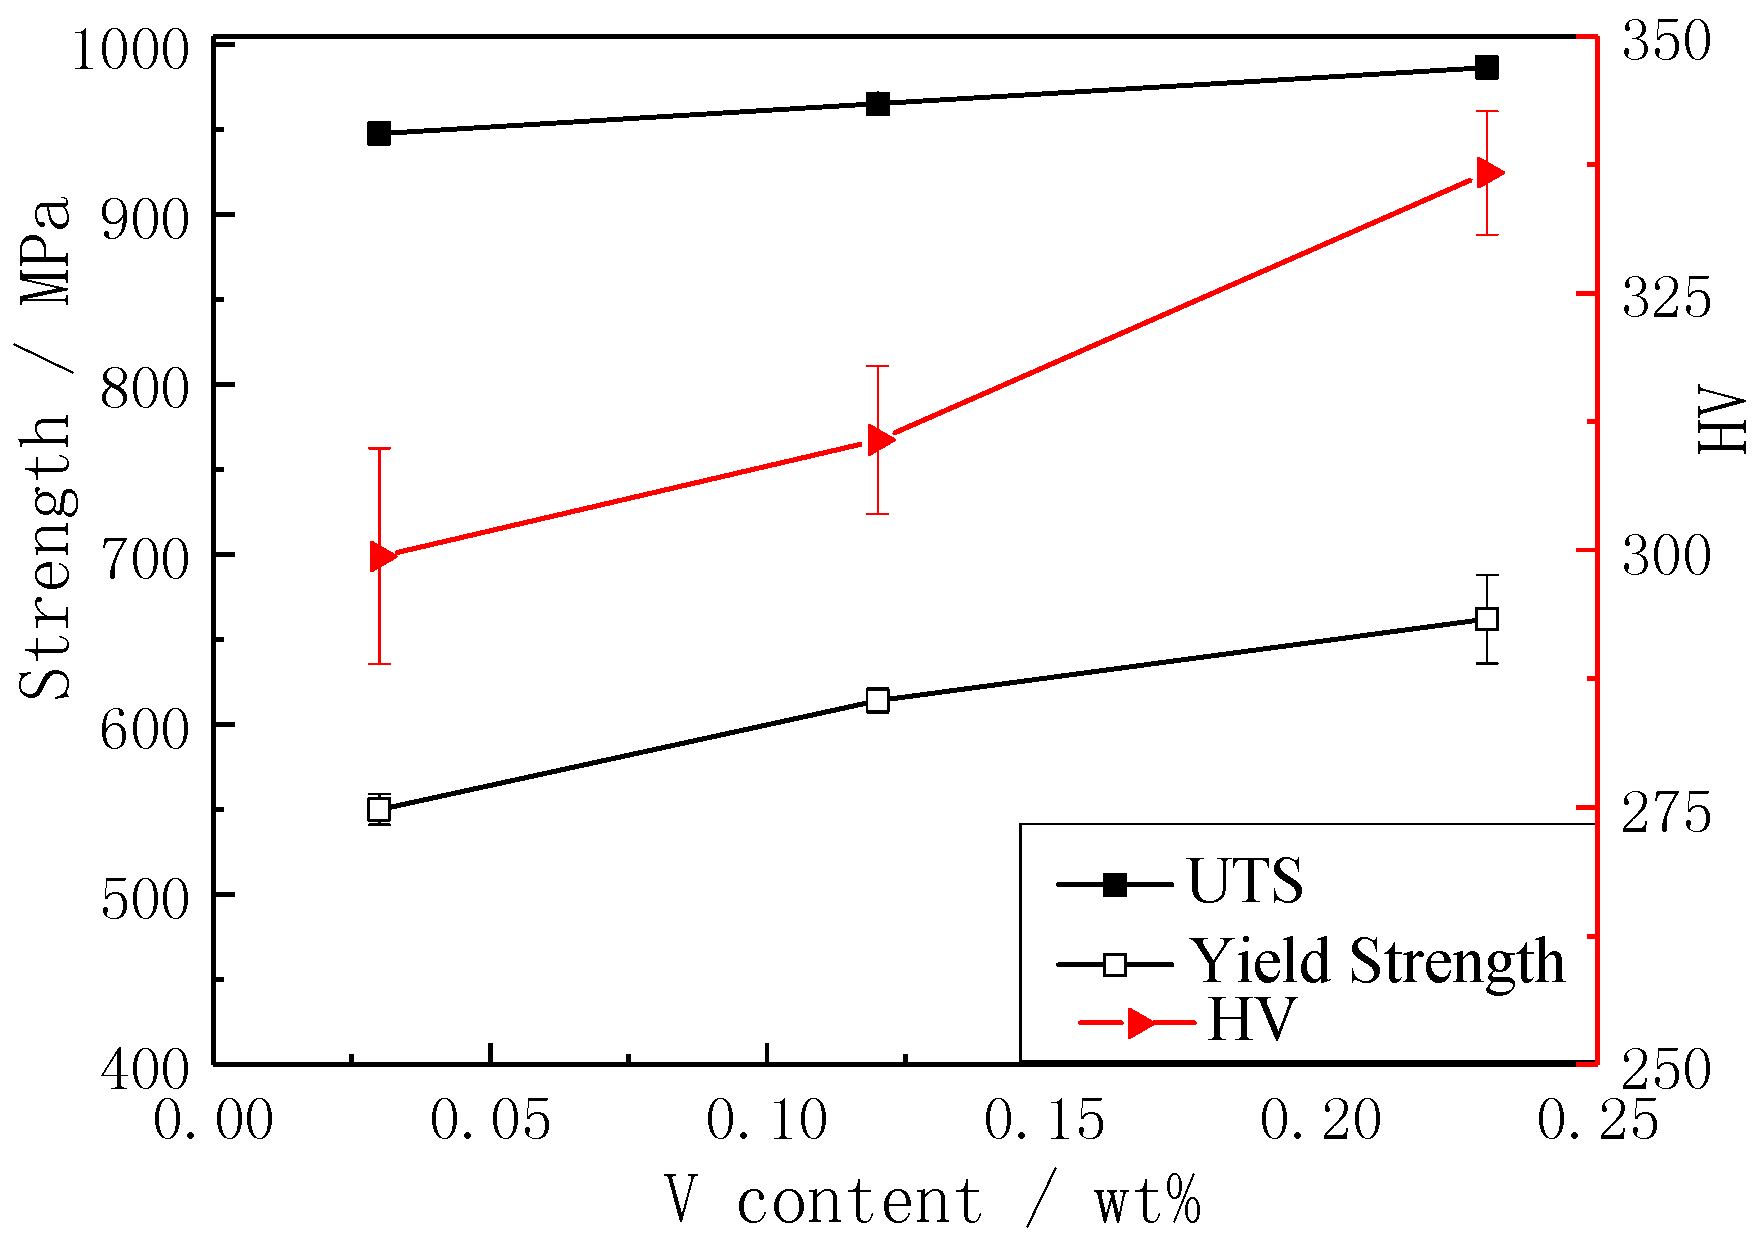
The ultimate tensile strength (UTS), yield strength, Vickers hardness (HV), and microhardness of the proeutectoid ferrite and pearlite increased considerably with the increase in V content (Figure 8 and Figure 9). However, the elongation and section shrinkage of the steels were similar. The microstructure of the steels were proeutectoid ferrite and pearlite. The strength of the multiphase mainly depends on the soft phase; thus, because the proeutectoid ferrite content was lower in the steel samples, the effect of pearlite on the strength was also considered.
Gladman et al. [7] used regression analysis to describe the relationship between steel strength and the strength and volume fraction of proeutectoid ferrite and pearlite, as expressed in the following equation:
σ ys = f α 1 3 σ α + ( 1 f α 1 3 ) σ P ,  
where σys, σα, and σp are the yield strengths of the steel, proeutectoid ferrite, and pearlite, respectively. fα is the volume fraction of proeutectoid ferrite. In contrast to low-carbon steel and eutectoid steel, in proeutectoid steel, the strength of proeutectoid ferrite increases with the volume fraction of pearlite, which is independent of the size of the proeutectoid ferrite grains. The strength and microhardness of pearlite also increases with the pearlite volume fraction, independent of the pearlite interlamellar spacing [14]. As the V content increased from 0.03 to 0.12 wt %, the volume fraction of pearlite decreased. Therefore, the reason for why the strength of 0.12 V steel is higher than that of 0.03 V steel is basically independent of the change in pearlite volume fraction; upon increasing the V content from 0.12 to 0.23 wt %, the pearlite volume fraction remained unchanged. Therefore, the yield strength change of sample 0.23 V was independent of the grain refinement, in contrast to sample 0.12 V. The yield strength was also affected by the solid solution elements and the precipitated phase. The V contents in the solid solutions in 0.03 V, 0.12 V, and 0.23 V steels of 0.03, 0.045, and 0.045 wt %, respectively, showed negligible differences at 860 °C. The contents of other elements were also similar. Therefore, the increase in strength was independent of solution strengthening.
Previous analysis has been based on the assumption that the strength of pearlite is independent of interlamellar spacing. However, Gladman et al. [7,15,16] concluded that the strength of pearlite is related to interlamellar spacing, and this is described by the following strength formula for proeutectoid steel [7]:
  σ y s = 15.4 ( f 1 3 [ 2.3 + 3.8 ( % M n ) + 1.13 d α 2 1 ] + 1 f 1 3 [ 11.6 + 0.25 S 2 1 ] ) + 4.1 ( % S i ) + 27.6 ( % N )  
where f is the volume fraction of ferrite (%), d α is the grain size of ferrite (mm), and S is the interlamellar spacing of pearlite (mm). We calculated that the yield strength increases of samples 0.12 V and 0.23 V compared with sample 0.03 V were −13 and 1 MPa, respectively. Thus, the increase of yield strength in this experiment was independent of fine crystal reinforcing and solution strengthening.
The precipitation strengthening of V in medium-carbon steel can be described by the Ashby–Orowan model [17]. Therefore, the increase in precipitation strengthening was calculated by the following equation obtained from the Ashby–Orowan model [13]:
  σ p = 8.995 × 10 3 f 1 / 2 d ln ( 2.417 d )  
where d is the average diameter of the precipitate particles (nm) and, f is the volume fraction of the precipitated phase (%),which is obtained from f = f M C × ρ F e ρ M C , and where fMC is the mass fraction of the precipitated phase (wt %), ρ F e is the density of the α-Fe matrix, which is 7.875 g/cm3, and ρ M C   is the theoretical density of the precipitated phase. Because the atomic weight of Cr is close to that of V, it was regarded as equivalent to V. The N content was negligible, the nominal formula of phase MC in the experimental steel was identified as VC, and the density of VC is 5.717 g/cm3.
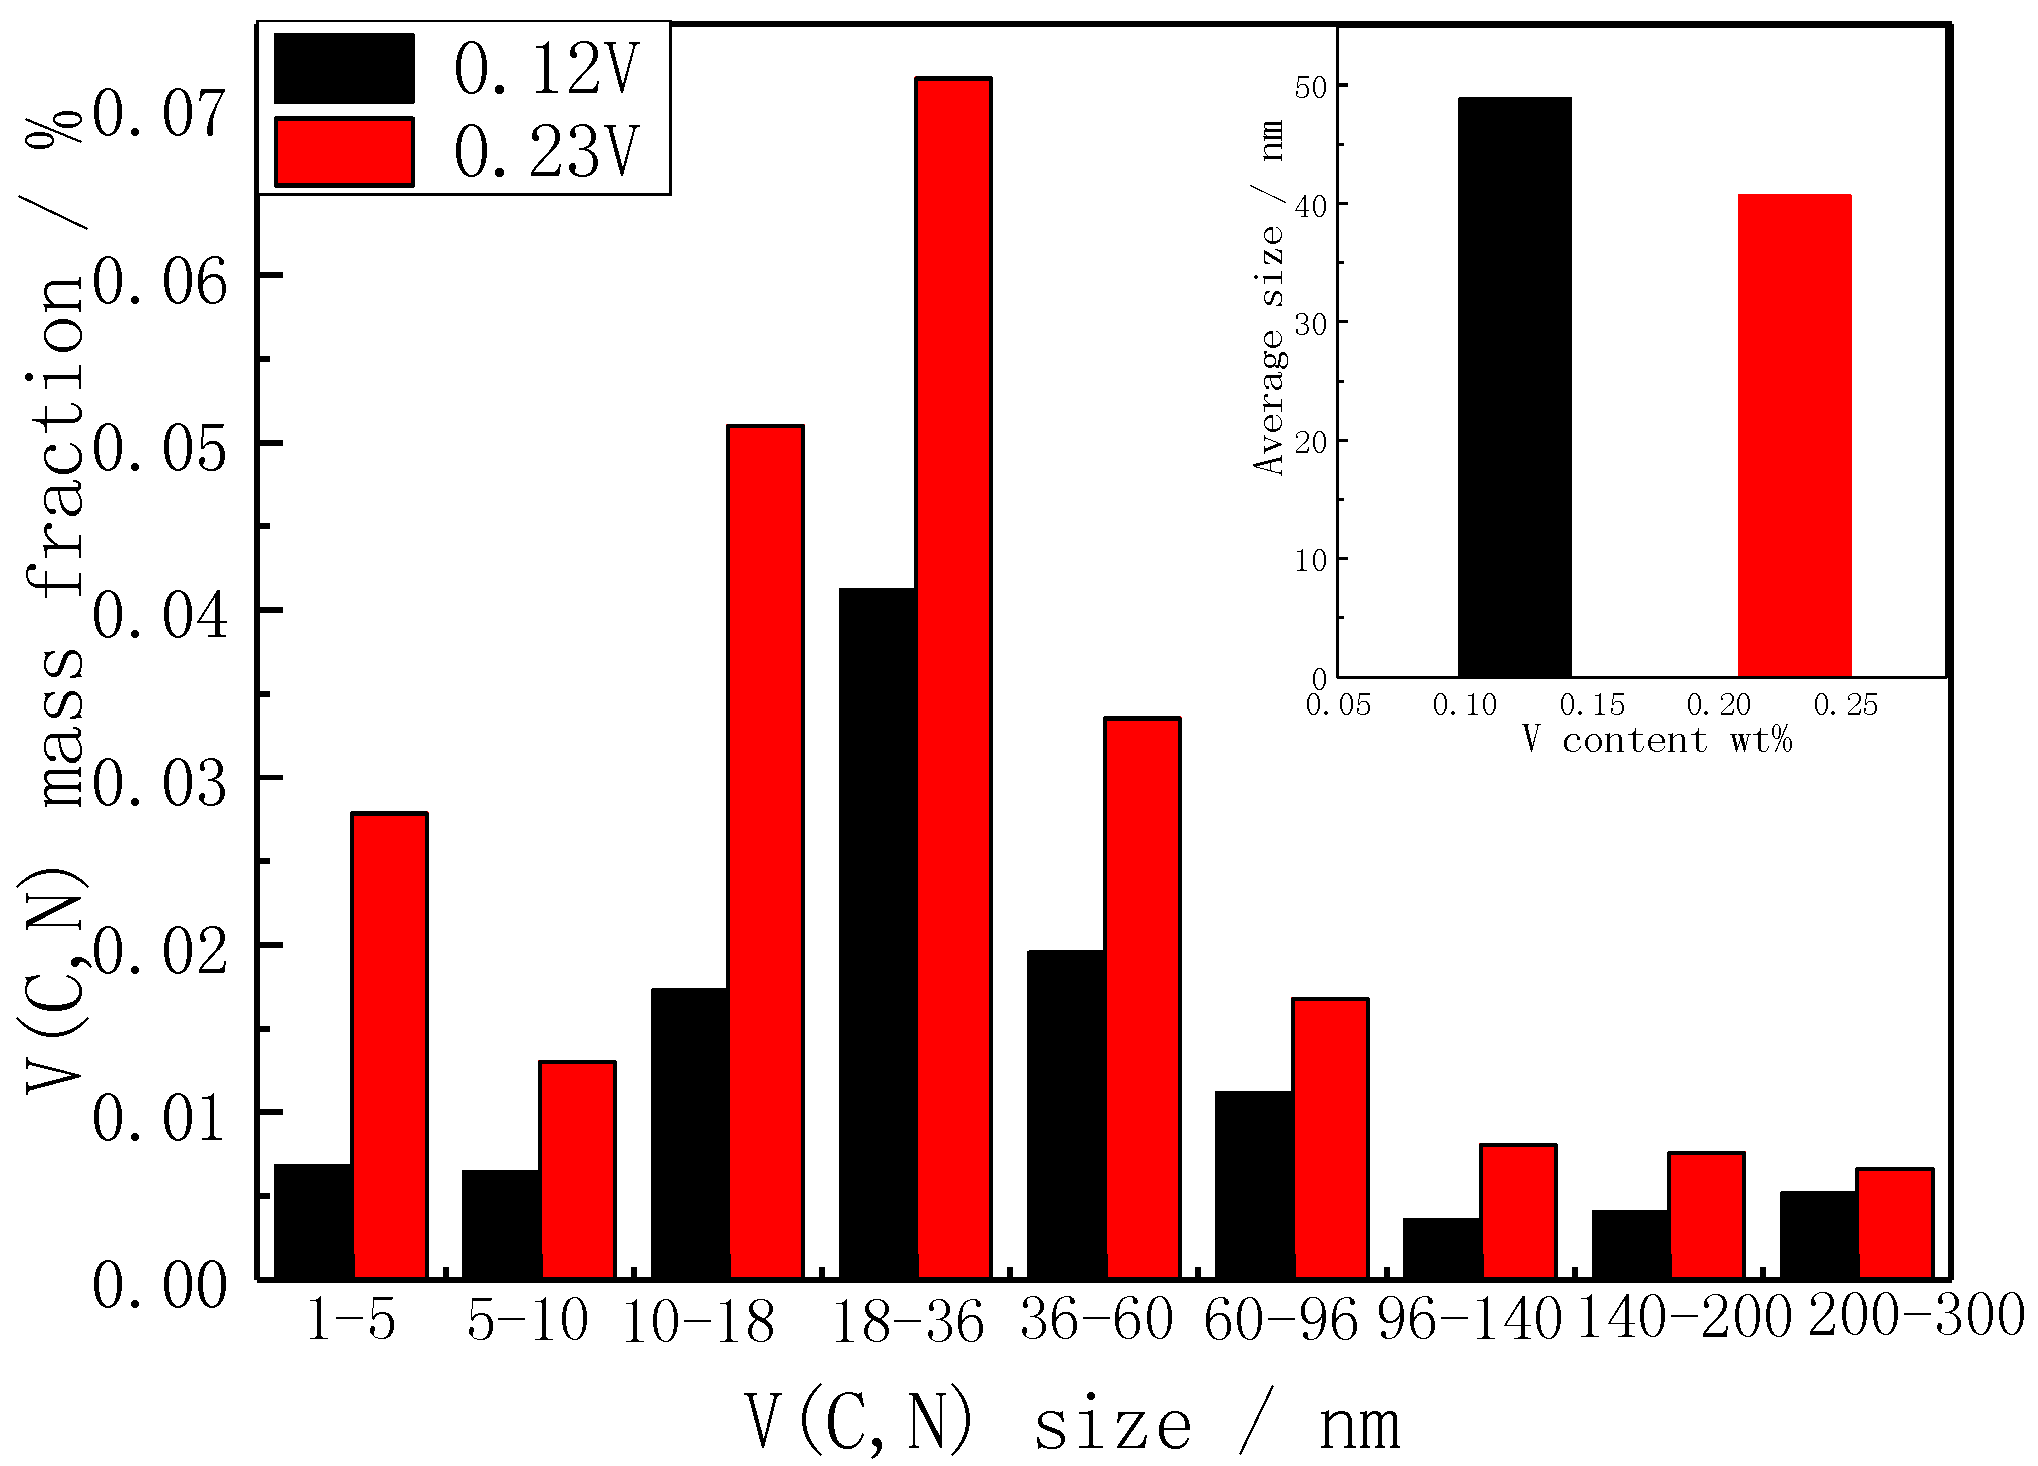
To further explain the calculated effect for overall strengthening, calculation results of precipitation hardening increments are shown in Table 5, and the effect of a precipitated phase of different sizes was superimposed on the root mean square [10]. The increases in precipitation strengthening for samples 0.12 V and 0.23 V were calculated as 83 and 147 MPa, respectively, and they were mainly produced by particles that were smaller than 60 nm in diameter.
The effect on solution strengthening, fine crystal strengthening, and precipitation strengthening was similar to the tensile strength and yield strength. Therefore, precipitation strengthening was the most important strengthening factor.

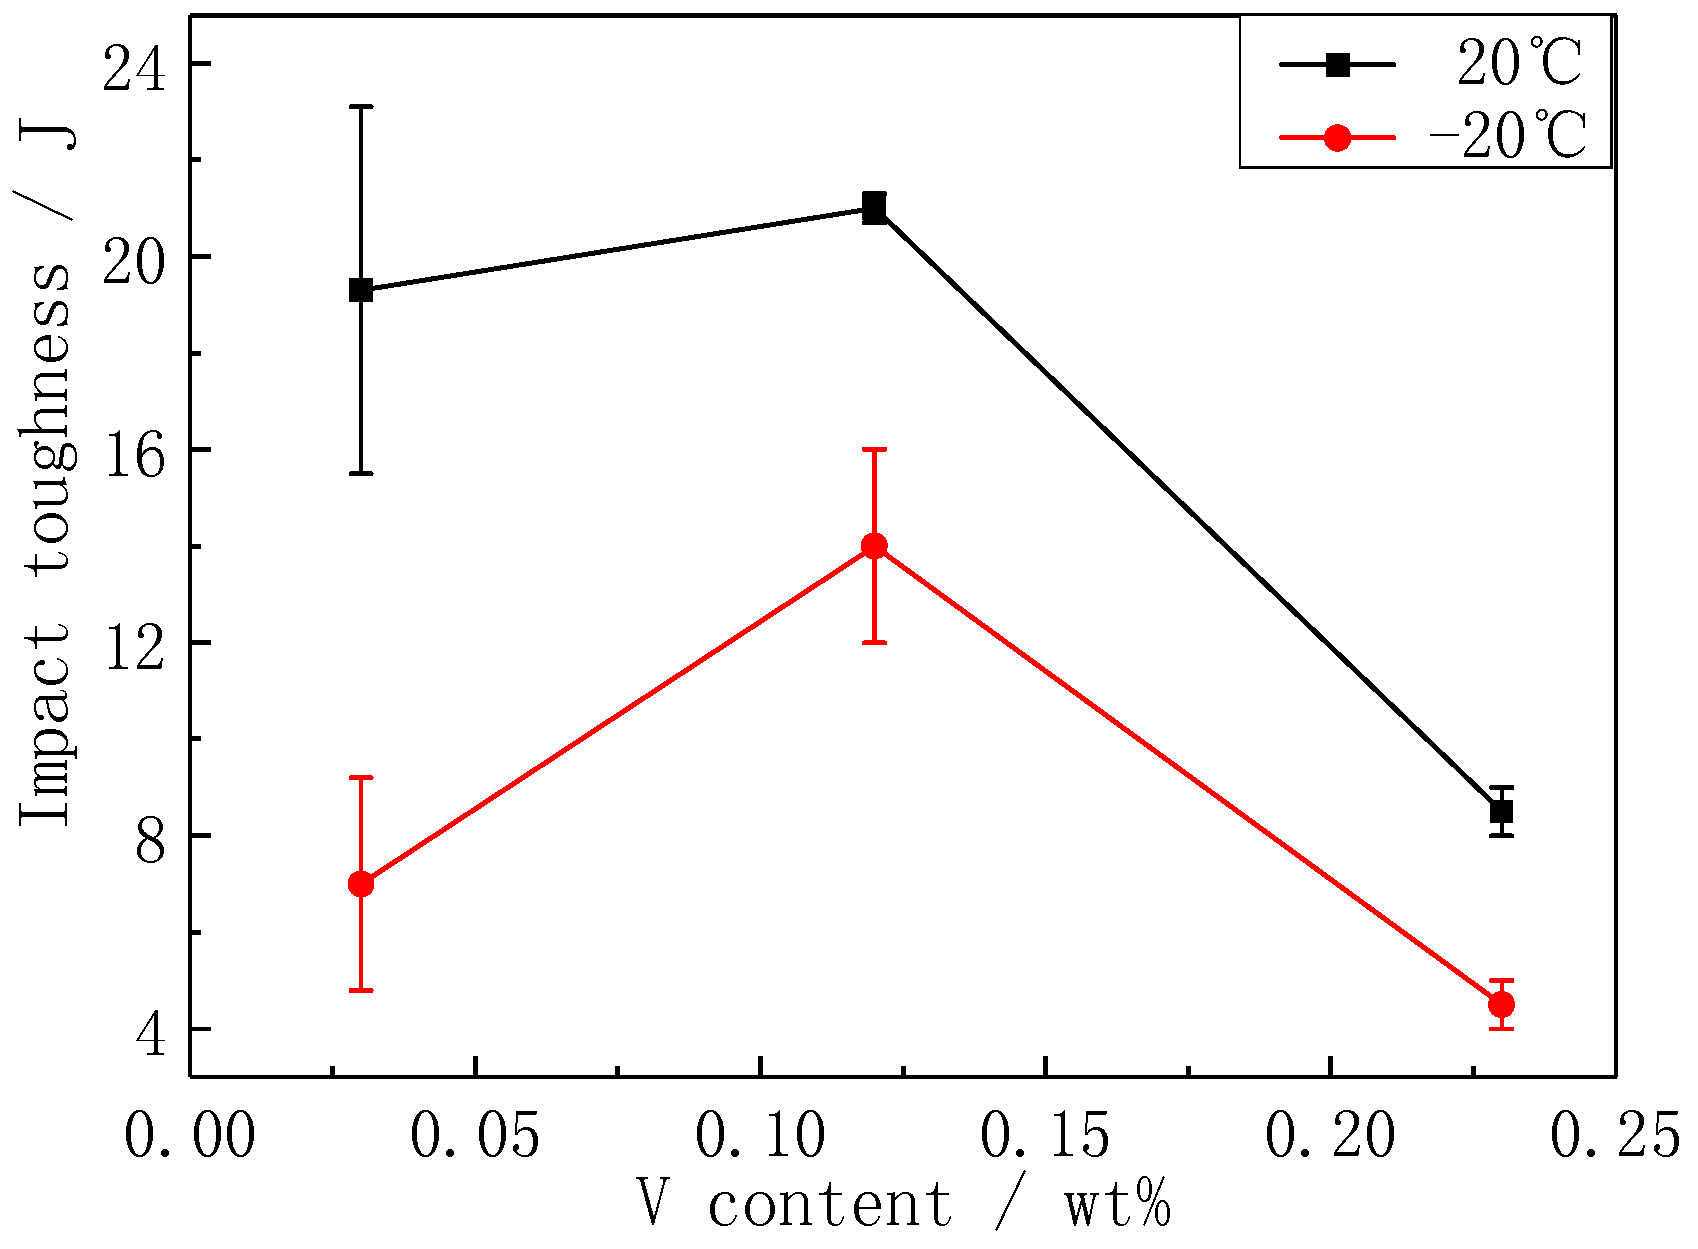
3.4. Impact Toughness

The Charpy impact energies of the steel samples are shown in Figure 10. As the V content increased, the impact energies initially increased, reached a maximum at a V content of 0.12 wt %, and then decreasing sharply. The impact specimens did not contain inclusions at the crack origins.
The volume fraction of proeutectoid ferrite, the size of austenite grains and pearlite colonies and blocks, and pearlite interlamellar spacing affect the toughness of hypoeutectoid steel [5,8]. When the V content increased from 0.03 to 0.12 wt % (samples 0.03 V and 0.12 V), the volume fraction of proeutectoid ferrite increased, increasing the impact toughness. The effect of austenite grain refinement on toughness occurred via the pearlite substructure. The ferrite/cementite interface hardly changed the direction of crack propagation, which showed that although the cementite lamellae inhibited the dislocation slip, they did not inhibit the growth of cleavage cracks, unlike traditional grain boundaries [18]. Pearlite interlamellar spacing has little effect on toughness. Alexander and Bernstein [18,19], and Mishra and Singh [20] have shown that refinement of the interlamellar spacing increases both the cleavage fracture stress and the yield strength. The larger the ratio of cleavage fracture stress to yield strength, the more difficult it is for cleavage fracture to occur, and the higher the toughness. The cleavage fracture stress and yield strength are calculated by [19]:
σ f c = 156.5 S 1 + 423.8 , σ y = 73.1 S 1 + 99.3 ,  
where σfc is the cleavage fracture stress (MPa), σy is the yield strength (MPa), and S is the pearlite interlamellar spacing (μm). The ratios of cleavage fracture stress to yield strength were 2.52, 2.49, and 2.46 for samples 0.03 V, 0.12 V, and 0.23 V, respectively. Although the refinement of the interlamellar spacing in the experimental steel may slightly reduce the toughness, the overall effect was negligible.
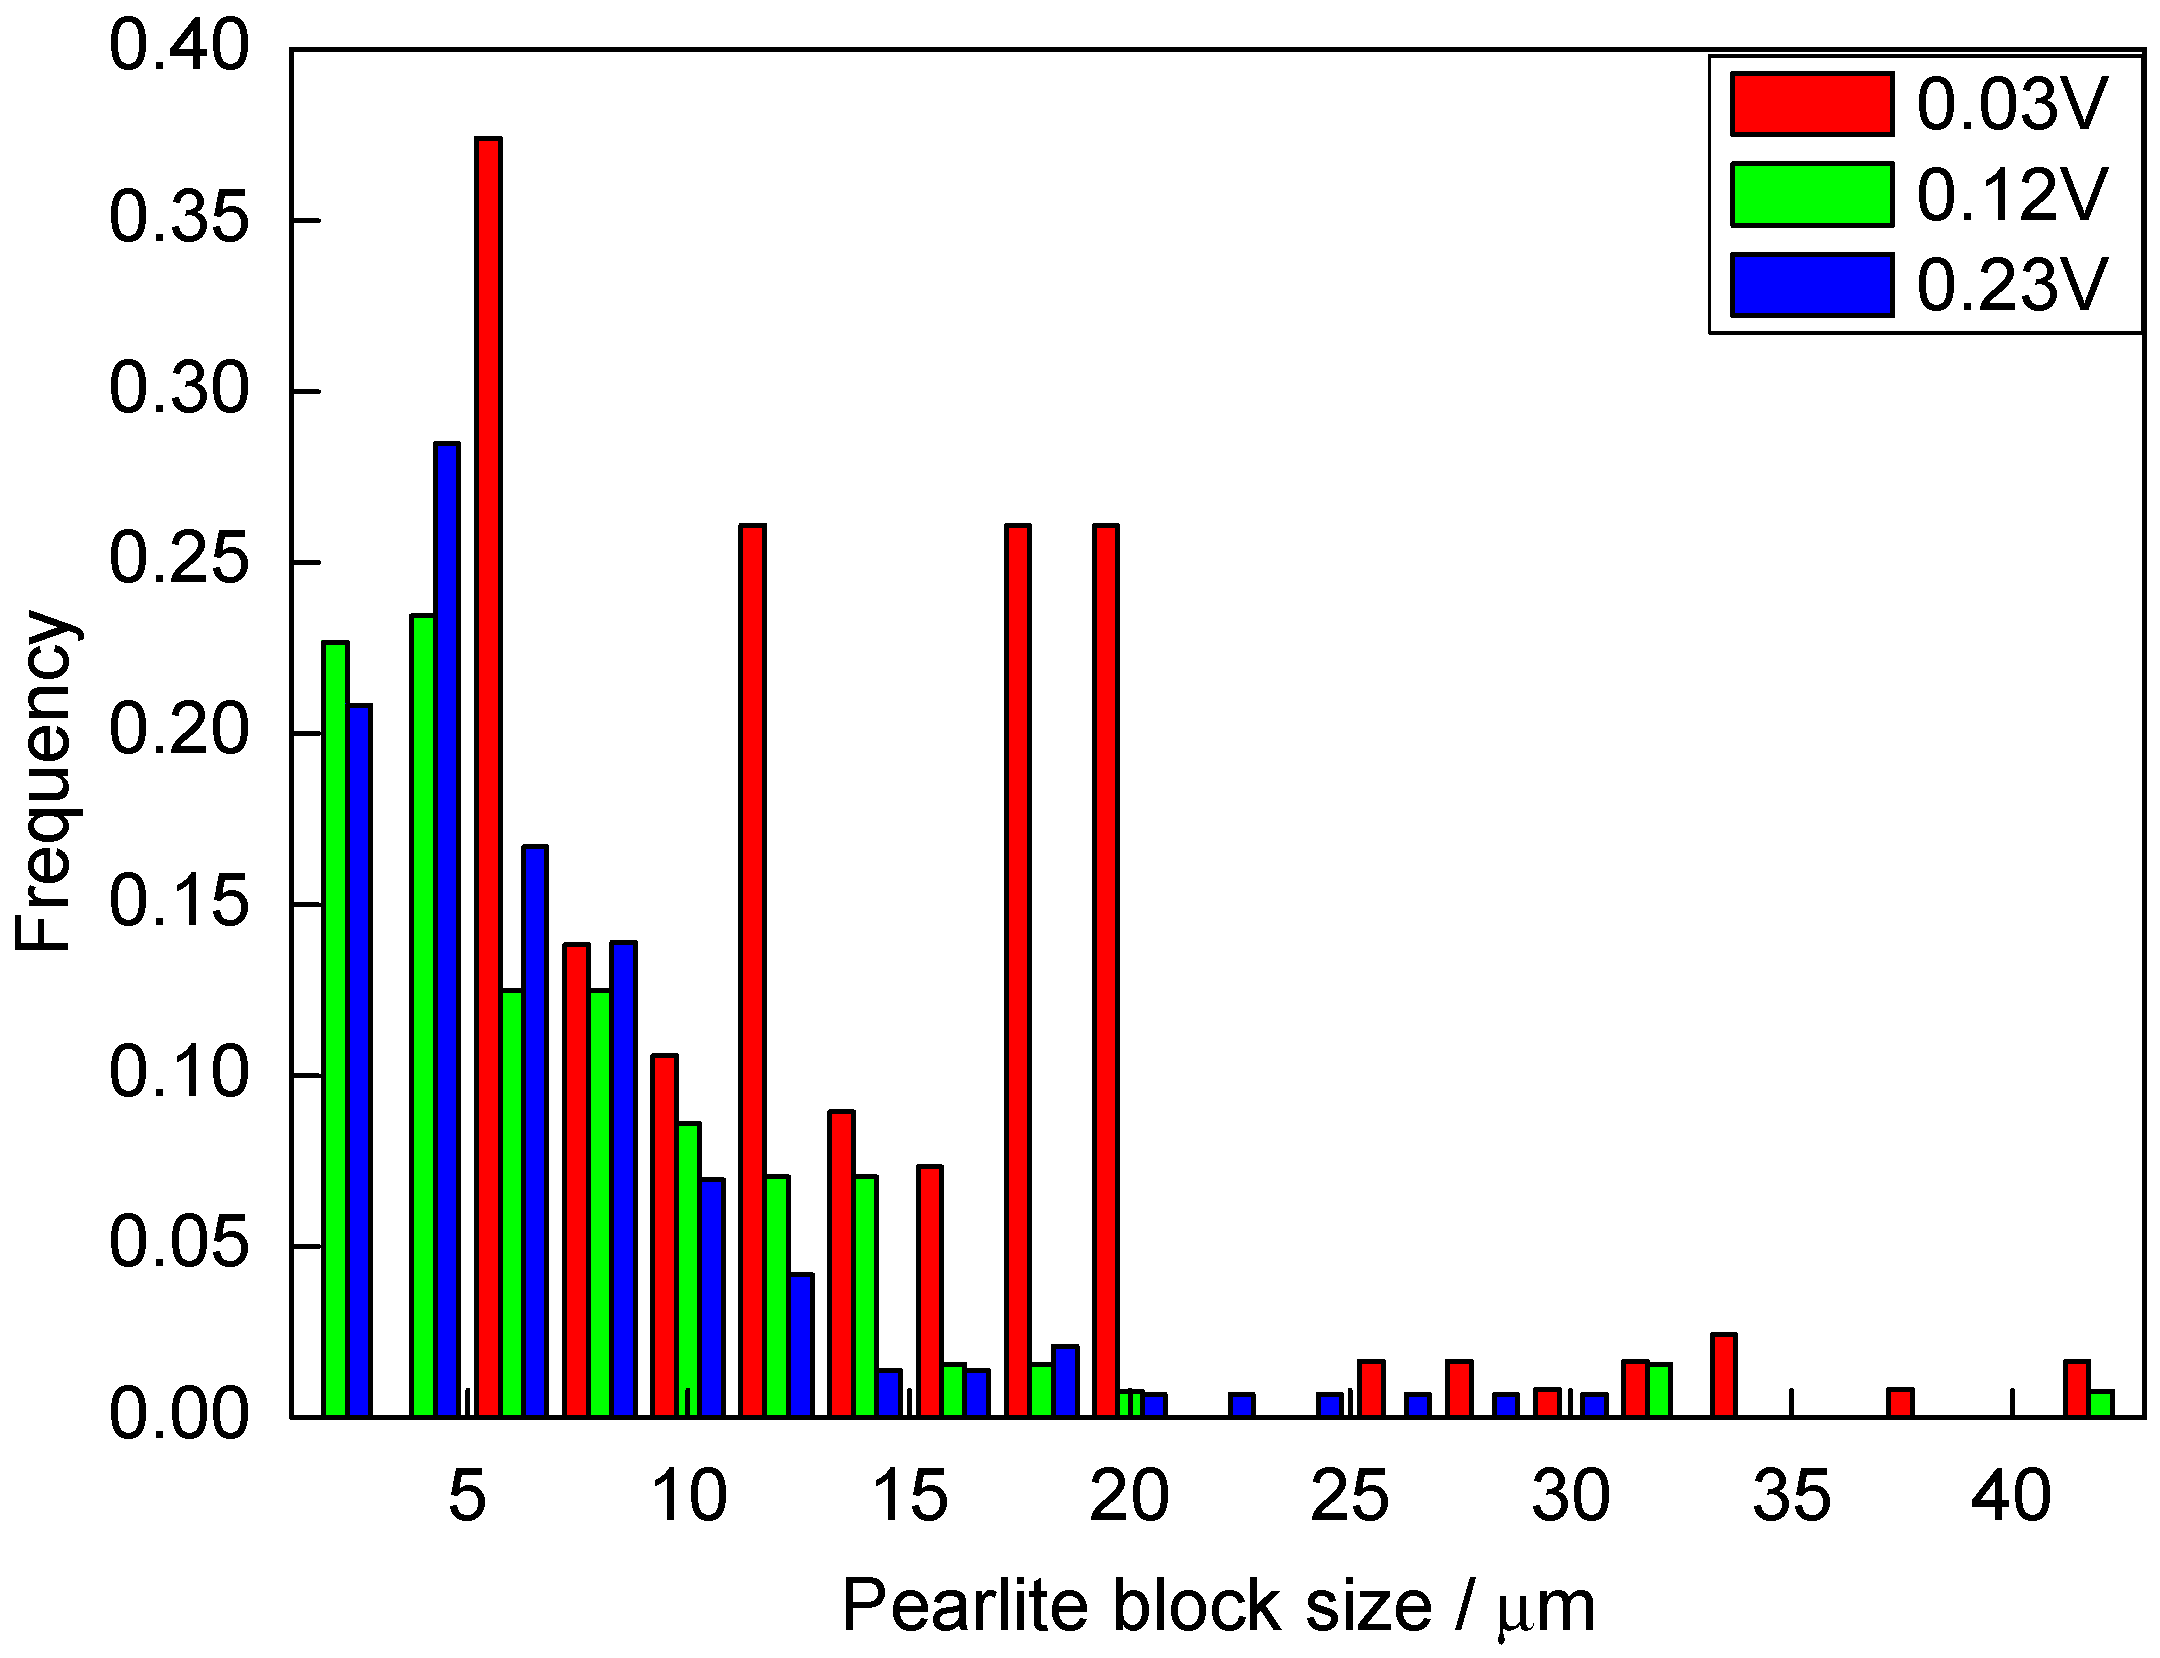
The effect of austenite grain size on the size of the pearlite blocks is much greater than that on the size of the pearlite colonies, and the pearlite blocks control fractures [16,21,
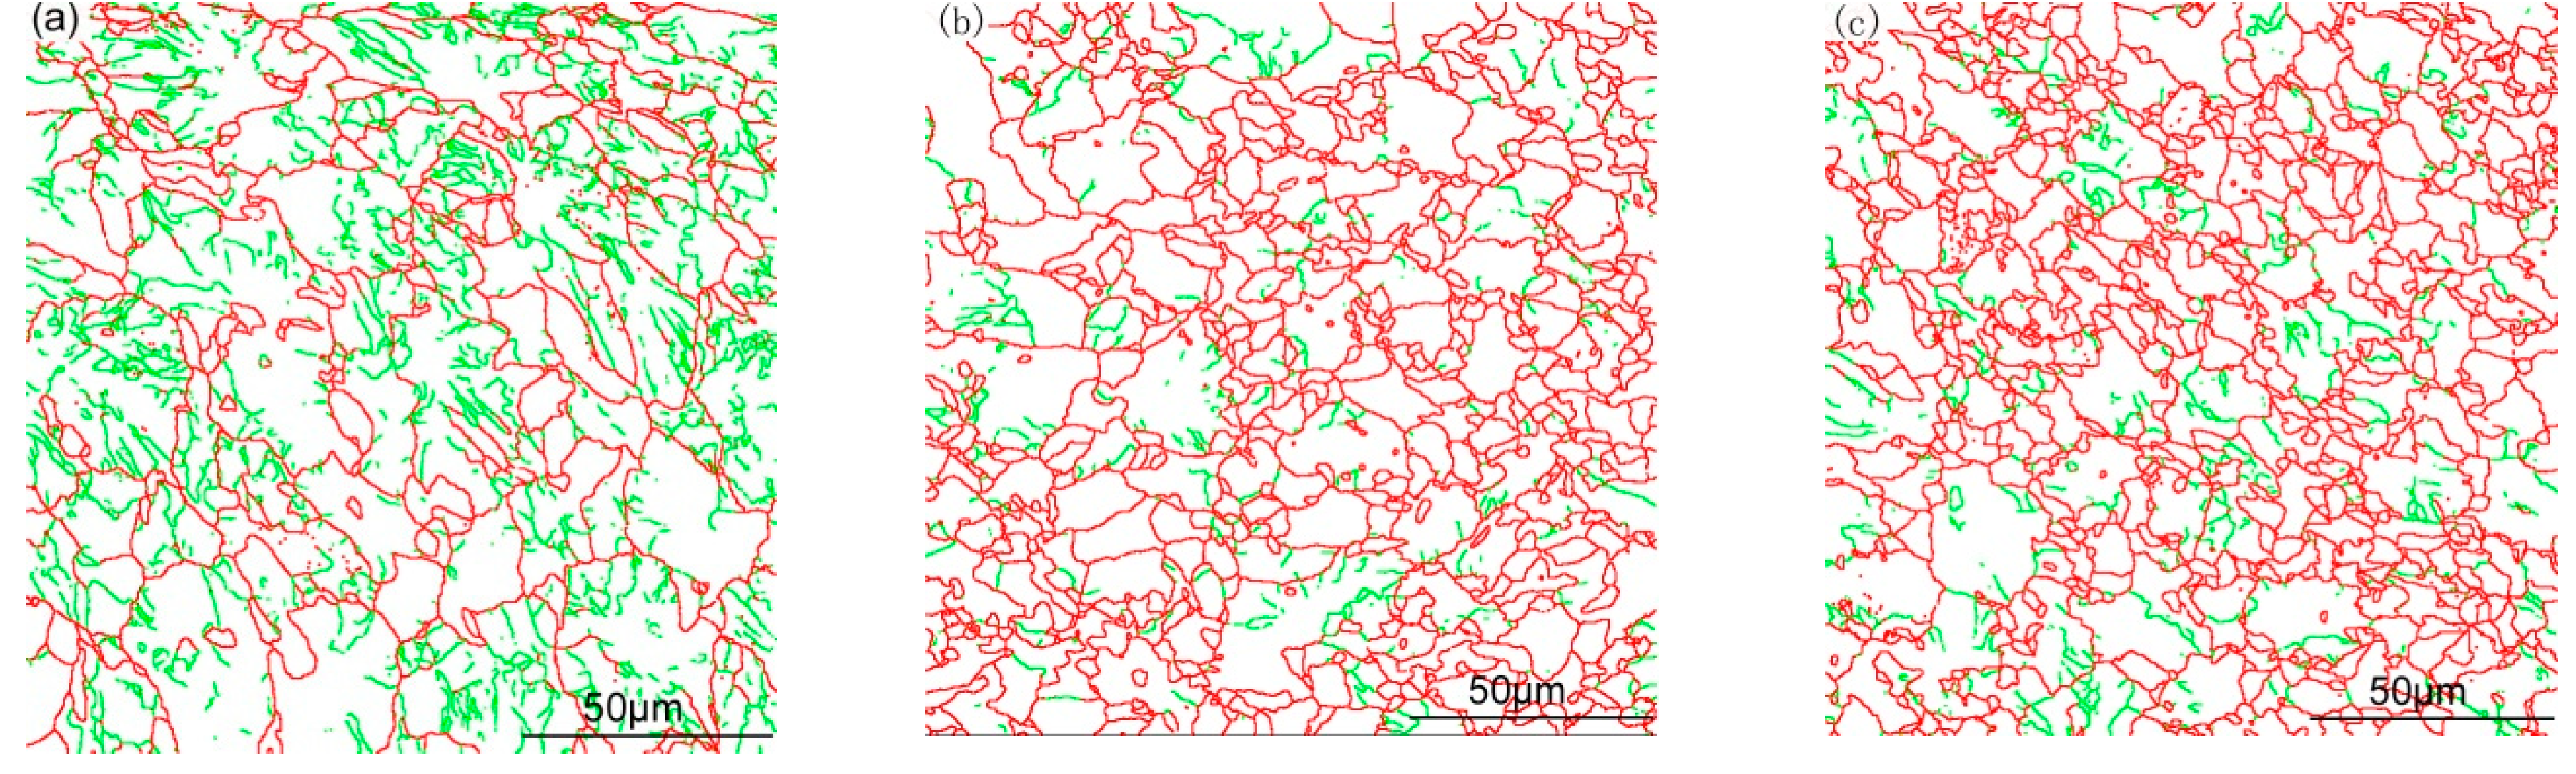
22]. The microstructures of the steels were observed by EBSD, and the pearlite block size and large-angle interface were analyzed (Figure 11 and Figure 12). The pearlite block size was counted according to the large-angle interface (>15°), and the density of the high-angle ferrite boundaries was calculated. The average size of the pearlite blocks for the 0.03 V, 0.12 V, and 0.23 V steels were 11.2, 8.2, and 7.9 μm, respectively. Large-angle interfaces hinder cracks, and the greater the interface density, the greater the toughness. Table 2 shows the ferrite interface density (total interface length per unit area; >15°) in the steel samples. When the V content was increased from 0.03 to 0.12 wt % (samples 0.03 V and 0.12 V), the size of the pearlite blocks decreased, and the high-angle boundary density increased with the austenite grain refinement. Thus, the remarkable increase in the toughness was mainly due to the refinement of the microstructure, although the increase in the volume fraction of proeutectoid ferrite also increased the toughness.
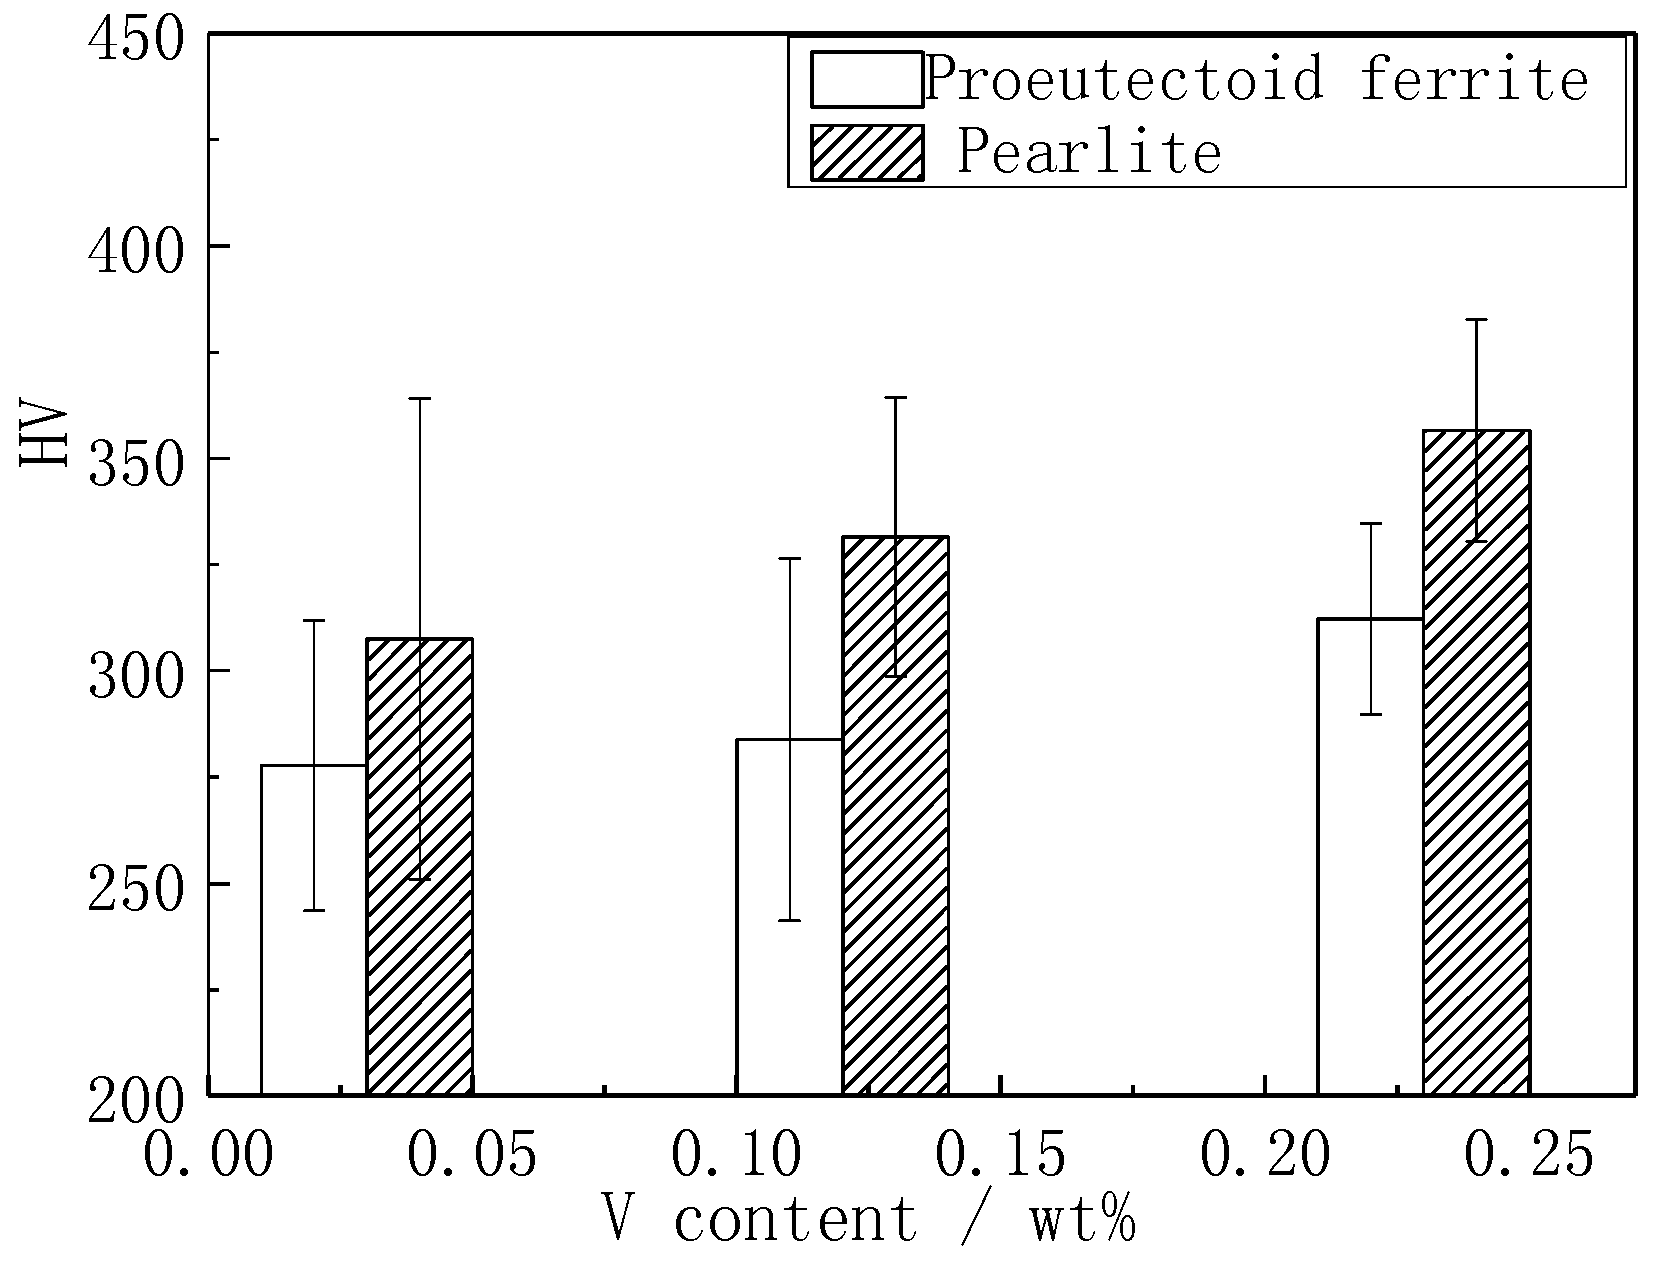
When the V content was increased from 0.12 to 0.23 wt %, V had little effect on the microstructure refinement, and the refinement of the pearlite blocks and the increase in the density of the high-angle boundaries were not important. Besides, the volume fraction of the proeutectoid ferrite is equivalent. Theoretically, the toughness values of the steels should be similar. However, the toughness of sample 0.23 V was substantially lower. As the V content increased, the microhardness of the proeutectoid ferrite and pearlite increased considerably (Figure 11).
The hardening of pearlite is mainly controlled by ferrite, although it is also affected by the interlamellar spacing. The effect of the interlamellar spacing on the strength and hardness was small. In hypoeutectoid steel, when the interlamellar spacing is less than 627 nm, the overlapping of the plastic deformation zone in ferrite will increase its hardness and reduce the toughness. As the interlamellar spacing decreases, the overlapping of the plastic deformation zone in pearlitic ferrite increases the strength and hardness, and reduces the toughness. When the spacing is smaller, the hardening reaches saturation, and the change in strength, hardness, and toughness tends to zero [13,22,23]. In this study, the interlamellar spacing of pearlite was small, and the hardening of the ferrite obtained by the refinement of the lamellar spacing may have reached the limit. Combined with the results obtained from Equation (5), the interlamellar spacing has little effect on the hardening of ferrite. There was a coherent or semi-coherent relationship between the precipitated V(C,N) and the matrix, which greatly increased the friction resistance between the crystal lattices and limited the plastic deformation of ferrite , thereby hardening the ferrite [13,24]. Combined with the microhardness, as the V content increases, the hardness of the proeutectoid ferrite and pearlite increases. In the analysis of strength and hardness, it can be seen that precipitation strengthening is the most important strengthening factor. The addition of V increased the volume fraction of ferrite and refined the structure, while hardening the ferrite. At a V content of 0.03 wt %, V was completely dissolved in the microstructure, resulting in a small effect on strengthening and toughening. When the V content was increased to 0.12 wt %, the microstructure refinement and increase in the volume fraction of ferrite were greater, and the precipitation strengthening was lower. Thus, the positive effect of grain refinement on toughness outweighed the negative effect of ferrite hardening, increasing the impact toughness substantially. When the V content was increased to 0.23 wt %, the effect on the grain refinement was smaller, but the precipitation strengthening continued to increase. The decrease in toughness caused by ferrite hardening was much greater than the positive effect of grain refinement and the increase in proeutectoid ferrite volume fraction, and the impact toughness was reduced.

4. Conclusions

In medium-carbon wheel steel, the effect of precipitation strengthening increased with increasing V content, and the grain refining effect and the volume fraction of proeutectoid ferrite initially increased, and then remained unchanged. The yield strength, tensile strength, and hardness of the steels increased substantially with increasing V content, owing to the precipitation strengthening by V(C,N) particles. As the V content was increased from 0.03 to 0.12 wt %, the size of the austenite grains and pearlite blocks decreased, and the density of the high-angle boundaries and the volume fraction of proeutectoid ferrite increased. The positive effect of grain refinement on toughness was greater than the negative effect of ferrite hardening caused by precipitation strengthening, and the impact toughness was improved. However, at 0.23 wt % V, the grain refining effect did not increase, whereas the precipitation strengthening increased. Thus, the negative effect of the ferrite hardening on toughness was greater than the positive effect of the grain refinement, and the impact toughness was reduced.

Author Contributions

Conceptualization was completed by Z.L. and P.W.; visualization and methodology were completed by G.L.; investigation, software, data collation, formal analysis, and writing of the manuscript were completed independently by P.W.; verification was completed by P.W., Z.L., and S.Z.; resources, supervision, and capital acquisition were completed by Z.L.; the review and editing were completed by Q.Y.; and C.Y. was responsible for project management.

Funding

This research was funded by the National Basic Research Program of China. (973 Program, grant number 2015CB654803).

Acknowledgments

The authors would like to thank the professors, senior engineers, doctoral students, etc., for their guidance and help with these of this experiments, and also acknowledge the technical support provided by other laboratory staff.

Conflicts of Interest

We declare no conflict of interest and the funders had no role in the design of this study.

References

  1. Qi, J.J.; Huang, Y.H.; Zhang, Y. Microalloyed Steels; Metallurgical Industry Press: Beijing, China, 2006; p. 31. ISBN 7502439692. [Google Scholar]
  2. Rune, L.; Bevis, H.; Tadeusz, S.; Stanislaw, Z. The Role of Vanadium in Microalloyed Steels; Metallurgical Industry Press: Beijing, China, 2015; pp. 19–31. ISBN 9787502470968. [Google Scholar]
  3. Wu, D.Y.; Xiao, F.R.; Wang, B. Investigation on grain refinement and precipitation strengthening applied in high speed wire rod containing vanadium. Mater. Sci. Eng. A 2014, 592, 102–110. [Google Scholar] [CrossRef]
  4. Li, J.; Yang, Z.M. The effects of V on phase transformation of high carbon steel during continuous cooling. Acta Metall. 2010, 46, 1501–1510. [Google Scholar] [CrossRef]
  5. Sakamoto, H.; Toyama, K.; Hirakawa, K. Fracture toughness of medium-high carbon steel for railroad wheel. Mater. Sci. Eng. A 2000, 285, 288–292. [Google Scholar] [CrossRef]
  6. Ishikawa, F. Intragranular ferrite nucleation in medium-carbon vanadium steels. Metall. Mater. Trans. A 1994, 25, 929–936. [Google Scholar] [CrossRef]
  7. Gladman, T.; McIvor, I.; Pickering, F. Some aspects of the structure-property relationships in high-C ferrite-pearlite steels. J. Iron Steel Inst. 1972, 210, 916–930. [Google Scholar]
  8. Ma, Y. Study on Toughening Mechanism and Production Process Optimization of Wheel Steel for High Speed Train. Ph.D. Thesis, Central Iron & Steel Research Institute, Beijing, China, May 2012. [Google Scholar]
  9. Parsons, S.A.; Edmonds, D.V. Microstructure and mechanical properties of medium-carbon ferrite pearlite steel microalloyed with vanadium. Mater. Sci. Technol. 1987, 3, 894–904. [Google Scholar] [CrossRef]
  10. Wu, Y.F.; Hui, W.J.; Chen, S.L. Influence of vanadium on microstructure and mechanical properties of medium carbon forging steel. J. Iron Steel Res. 2016, 28, 56–62. [Google Scholar] [CrossRef]
  11. Zuo, Y.; Zhou, S.T.; Li, Z.D. Effect of V and Si on microstructure and mechanical properties of medium-carbon pearlitic steels for wheels. Chin. J. Mater. Res. 2016, 30, 401–408. [Google Scholar] [CrossRef]
  12. O’Donnelly, B.E.; Reuben, R.L.; Baker, T.N. Quantitative assessment of strengthening parameters in ferrite-pearlite steels from microstructural measurements. Metall. Sci. J. 2013, 11, 45–51. [Google Scholar] [CrossRef]
  13. Yong, Q.L. The Second Phase in Steel; Metallurgical Industry Press: Beijing, China, 2006; pp. 47–55. ISBN 7502440003. [Google Scholar]
  14. Ray, K.K.; Mondal, D. The effect of interlamellar spacing on strength of pearlite in annealed eutectoid and hypoeutectoid plain carbon steels. Acta Metall. Mater. 1991, 39, 2201–2208. [Google Scholar] [CrossRef]
  15. Mondal, D.P.; Ray, K.K.; Das, S. The strength of ferrite in annealed Armco iron and hypoeutectoid steels. Z. fuer Metallkunde 1998, 89, 635–641. [Google Scholar]
  16. Hyzak, J.M.; Bernstein, I.M. The role of microstructure on the strength and toughness of fully pearlitic steels. Metall. Trans. A 1976, 7, 1217–1224. [Google Scholar] [CrossRef]
  17. Miyamoto, G.; Hori, R.; Poorganji, B.; Furuhara, T. Interphase precipitation of VC and resultant hardening in V-added medium carbon steels. ISIJ Int. 2011, 51, 1733–1739. [Google Scholar] [CrossRef]
  18. Park, Y.J.; Bernstein, I.M. The process of crack initiation and effective grain size for cleavage fracture in pearlitic eutectoid steel. Metall. Trans. A 1979, 10, 1653–1664. [Google Scholar] [CrossRef]
  19. Alexander, D.J.; Bernstein, I. M. Cleavage fracture in pearlitic eutectoid steel. Metall. Trans. A 1989, 20, 2321–2335. [Google Scholar] [CrossRef]
  20. Mishra, K.; Singh, A. Effect of interlamellar spacing on fracture toughness of nano-structured pearlite. Mater. Sci. Eng. A 2017, 706, 22–26. [Google Scholar] [CrossRef]
  21. Nakase, K.; Bernstein, I.M. The effect of alloying elements and microstructure on the strength and fracture resistance of pearlitic steel. Metall. Trans. A 1988, 19, 2819–2829. [Google Scholar] [CrossRef]
  22. Furuhara, T.; Kikumoto, K.; Saito, H.; Sekine, T.; Ogawa, T.; Morito, S.; Maki, T. Phase transformation from fine-grained austenite. ISIJ Int. 2008, 48, 1038–1045. [Google Scholar] [CrossRef]
  23. Dollar, M.; Bernstein, I.M.; Thompson, A.W. Influence of deformation substructure on flow and fracture of fully pearlitic steel. Acta Metall. 1988, 36, 311–320. [Google Scholar] [CrossRef]
  24. Modi, O.P.; Deshmukh, N.; Mondal, D.P.; Jha, A.K.; Yegneswaran, A.H.; Khaira, H.K. Effect of interlamellar spacing on the mechanical properties of 0.65% C steel. Mater. Charact. 2001, 46, 347–352. [Google Scholar] [CrossRef]
Figure 1. The schematic of the thermo-mechanical treatment of the investigated steels.
Metals 08 00978 g001
Figure 2. OM (optical microscopy) and SEM (scanning electron microscopy) images showing the microstructures of the investigated steels. (a,d) Sample 0.03 V; (b,e) sample 0.12 V; (c,f) sample 0.23 V.
Metals 08 00978 g002
Figure 3. Effect of V content on dissolved C and V contents in austenite in steel samples 0.03 V (red), 0.12 V (green), and 0.23 V (blue).
Metals 08 00978 g003
Figure 4. Content of V(C,N) precipitate in austenite in steel samples 0.03 V (red), 0.12 V (green), and 0.23 V (blue).
Metals 08 00978 g004
Figure 5. X-ray diffraction (XRD) pattern of steel samples 0.12 V (black) and 0.23 V (red).
Metals 08 00978 g005
Figure 6. Transmission electron microscopy (TEM) images of sample 0.23 V showing (a) V(C,N) particles in proeutectoid ferrite, and (b) pearlitic ferrite.
Metals 08 00978 g006
Figure 7. Average size and size distribution of V(C,N) in samples 0.12 V (red) and 0.23 V (black).
Metals 08 00978 g007
Figure 8. Ultimate tensile strength (closed squares, red triangles), yield strength (open squares), and Vickers hardness (red triangles) for the investigated steels (0.03, 0.12, and 0.23 wt % V).
Metals 08 00978 g008
Figure 9. Microhardness of proeutectoid ferrite and pearlite in investigated steels (0.03, 0.12, and 0.23 wt % V).
Metals 08 00978 g009
Figure 10. Charpy impact energies for the investigated steels (0.03, 0.12, and 0.23 wt % V).
Metals 08 00978 g010
Figure 11. Distribution of the pearlite block size in samples 0.03 V (red), 0.12 V (green), and 0.23 V (blue).
Metals 08 00978 g011
Figure 12. Ferrite orientation maps for samples (a) 0.03 V; (b) 0.12 V; (c) 0.23 V. Red lines represent high-angle boundaries (>15°), and green lines represent low-angle boundaries (5°–15°).
Metals 08 00978 g012
Table 1. Compositions of the investigated steels (wt %), Ae3, and Ae1 (°C).
SampleCSiMnPSCrVNAe3Ae1
0.03 V0.540.880.780.00790.00770.170.030.0014768.2740.5
0.12 V0.540.870.780.00720.00780.180.120.0016769.3740.2
0.23 V0.540.950.800.00710.00710.180.230.003779.0740.0
Table 2. Microstructural parameters of the investigated steels.
SampleAGS (μm)fα (%)dα (μm)PS (μm)NS (μm)S (μm)tc (μm)ρα (μm)
0.03 V32.4 ± 1.82.0 ± 0.44.02 ± 1.59.3 ± 1.512.1 ± 0.40.158 ± 0.030.0147.76
0.12 V16.6 ± 0.811.1 ± 0.43.66 ± 0.45.5 ± 1.07.4 ± 0.30.143 ± 0.020.01414.36
0.23 V15.7 ± 0.711.2 ± 0.33.41 ± 0.25.2 ± 0.56.6 ± 0.30.131 ± 0.020.01215.01
Austenite grain size (AGS); proeutectoid ferrite volume fraction ( f α ); proeutectoid ferrite size ( d α ); pearlite colony size (PS); pearlite block size (NS); interlamellar spacing (S); cementite thickness (tc); density of high-angle ferrite boundaries ( ρ α ).
Table 3. Elemental content of M3C in steel samples 0.12 V and 0.23 V.
SampleElemental Content of M3C (wt %)
FeCrMnVCΣ
0.12 V5.650.0270.1370.0120.4186.244
0.23 V5.3230.0230.1290.020.3945.889
Table 4. Elemental content of M(C,N) in steel samples 0.12 V and 0.23 V.
SampleElemental Content of M(C,N) (wt %)
VCrNCΣ
0.12 V0.0710.0220.00160.020.115
0.23 V0.1670.0240.0030.0420.236
Table 5. Calculations results of precipitation hardening increments.
Sample Size (nm)1–55–1010–1818–3636–6060–9696–140140–200200–300
0.12 V57.432.734.933.114.66.83.02.40.8
0.23 V116.346.560.043.819.18.44.53.22.2

