Application of an Evolving Non-Associative Anisotropic-Asymmetric Plasticity Model for a Rare-Earth Magnesium Alloy

Abstract
1. Introduction
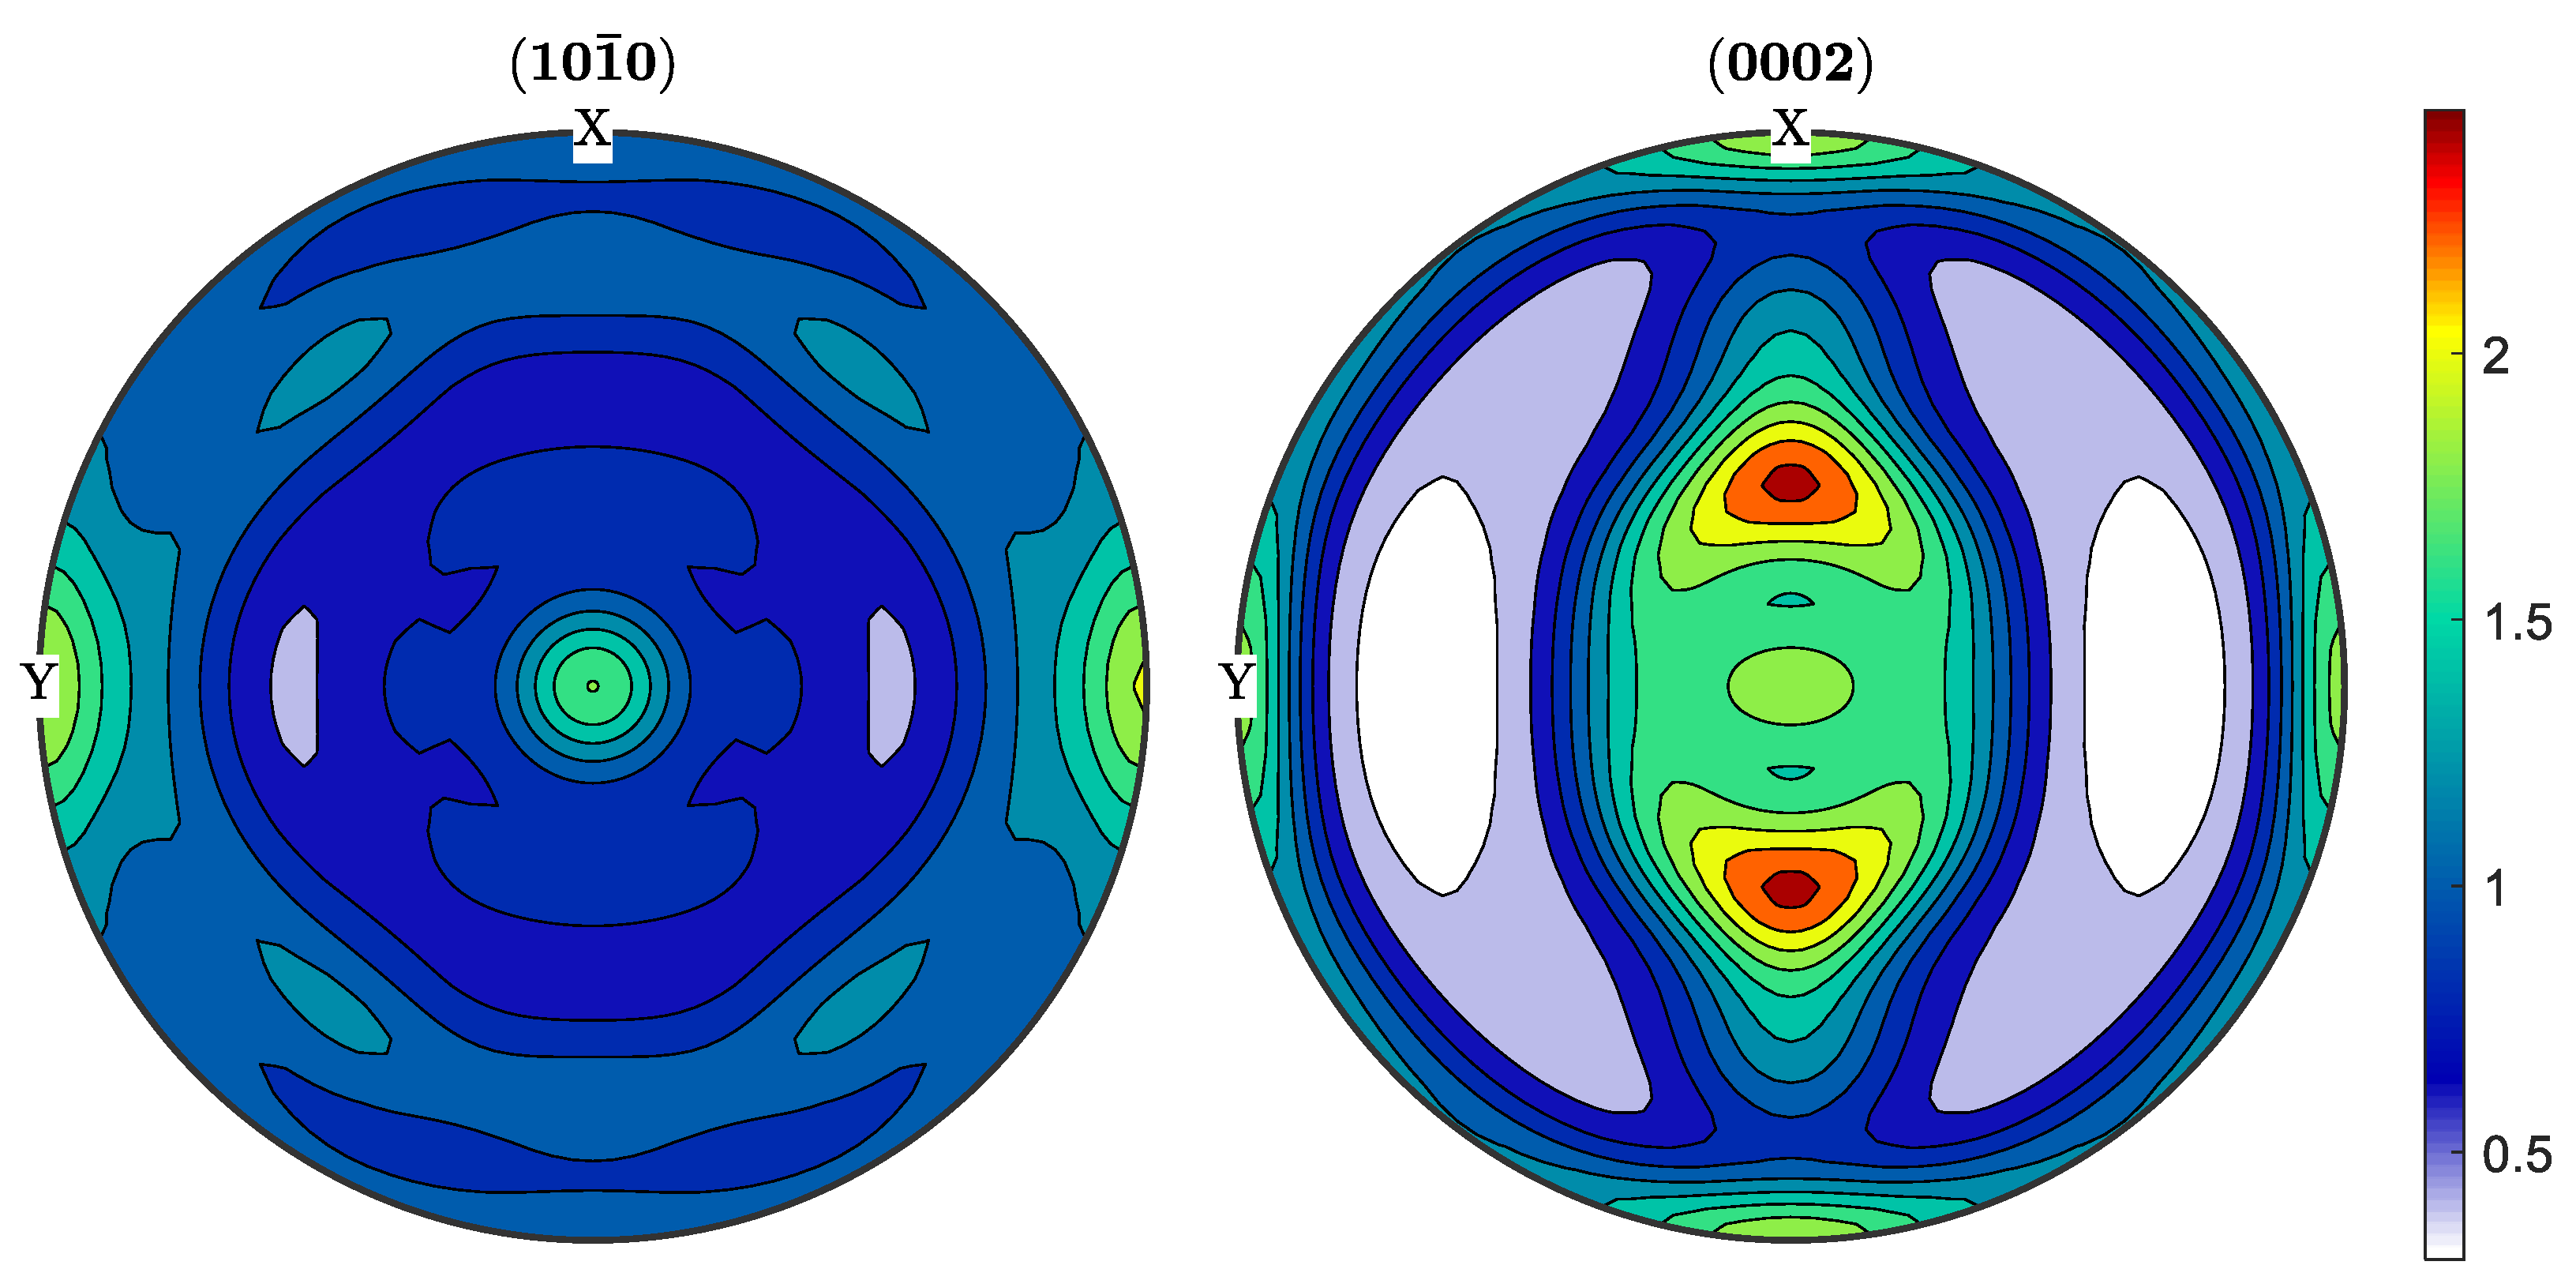
2. Material
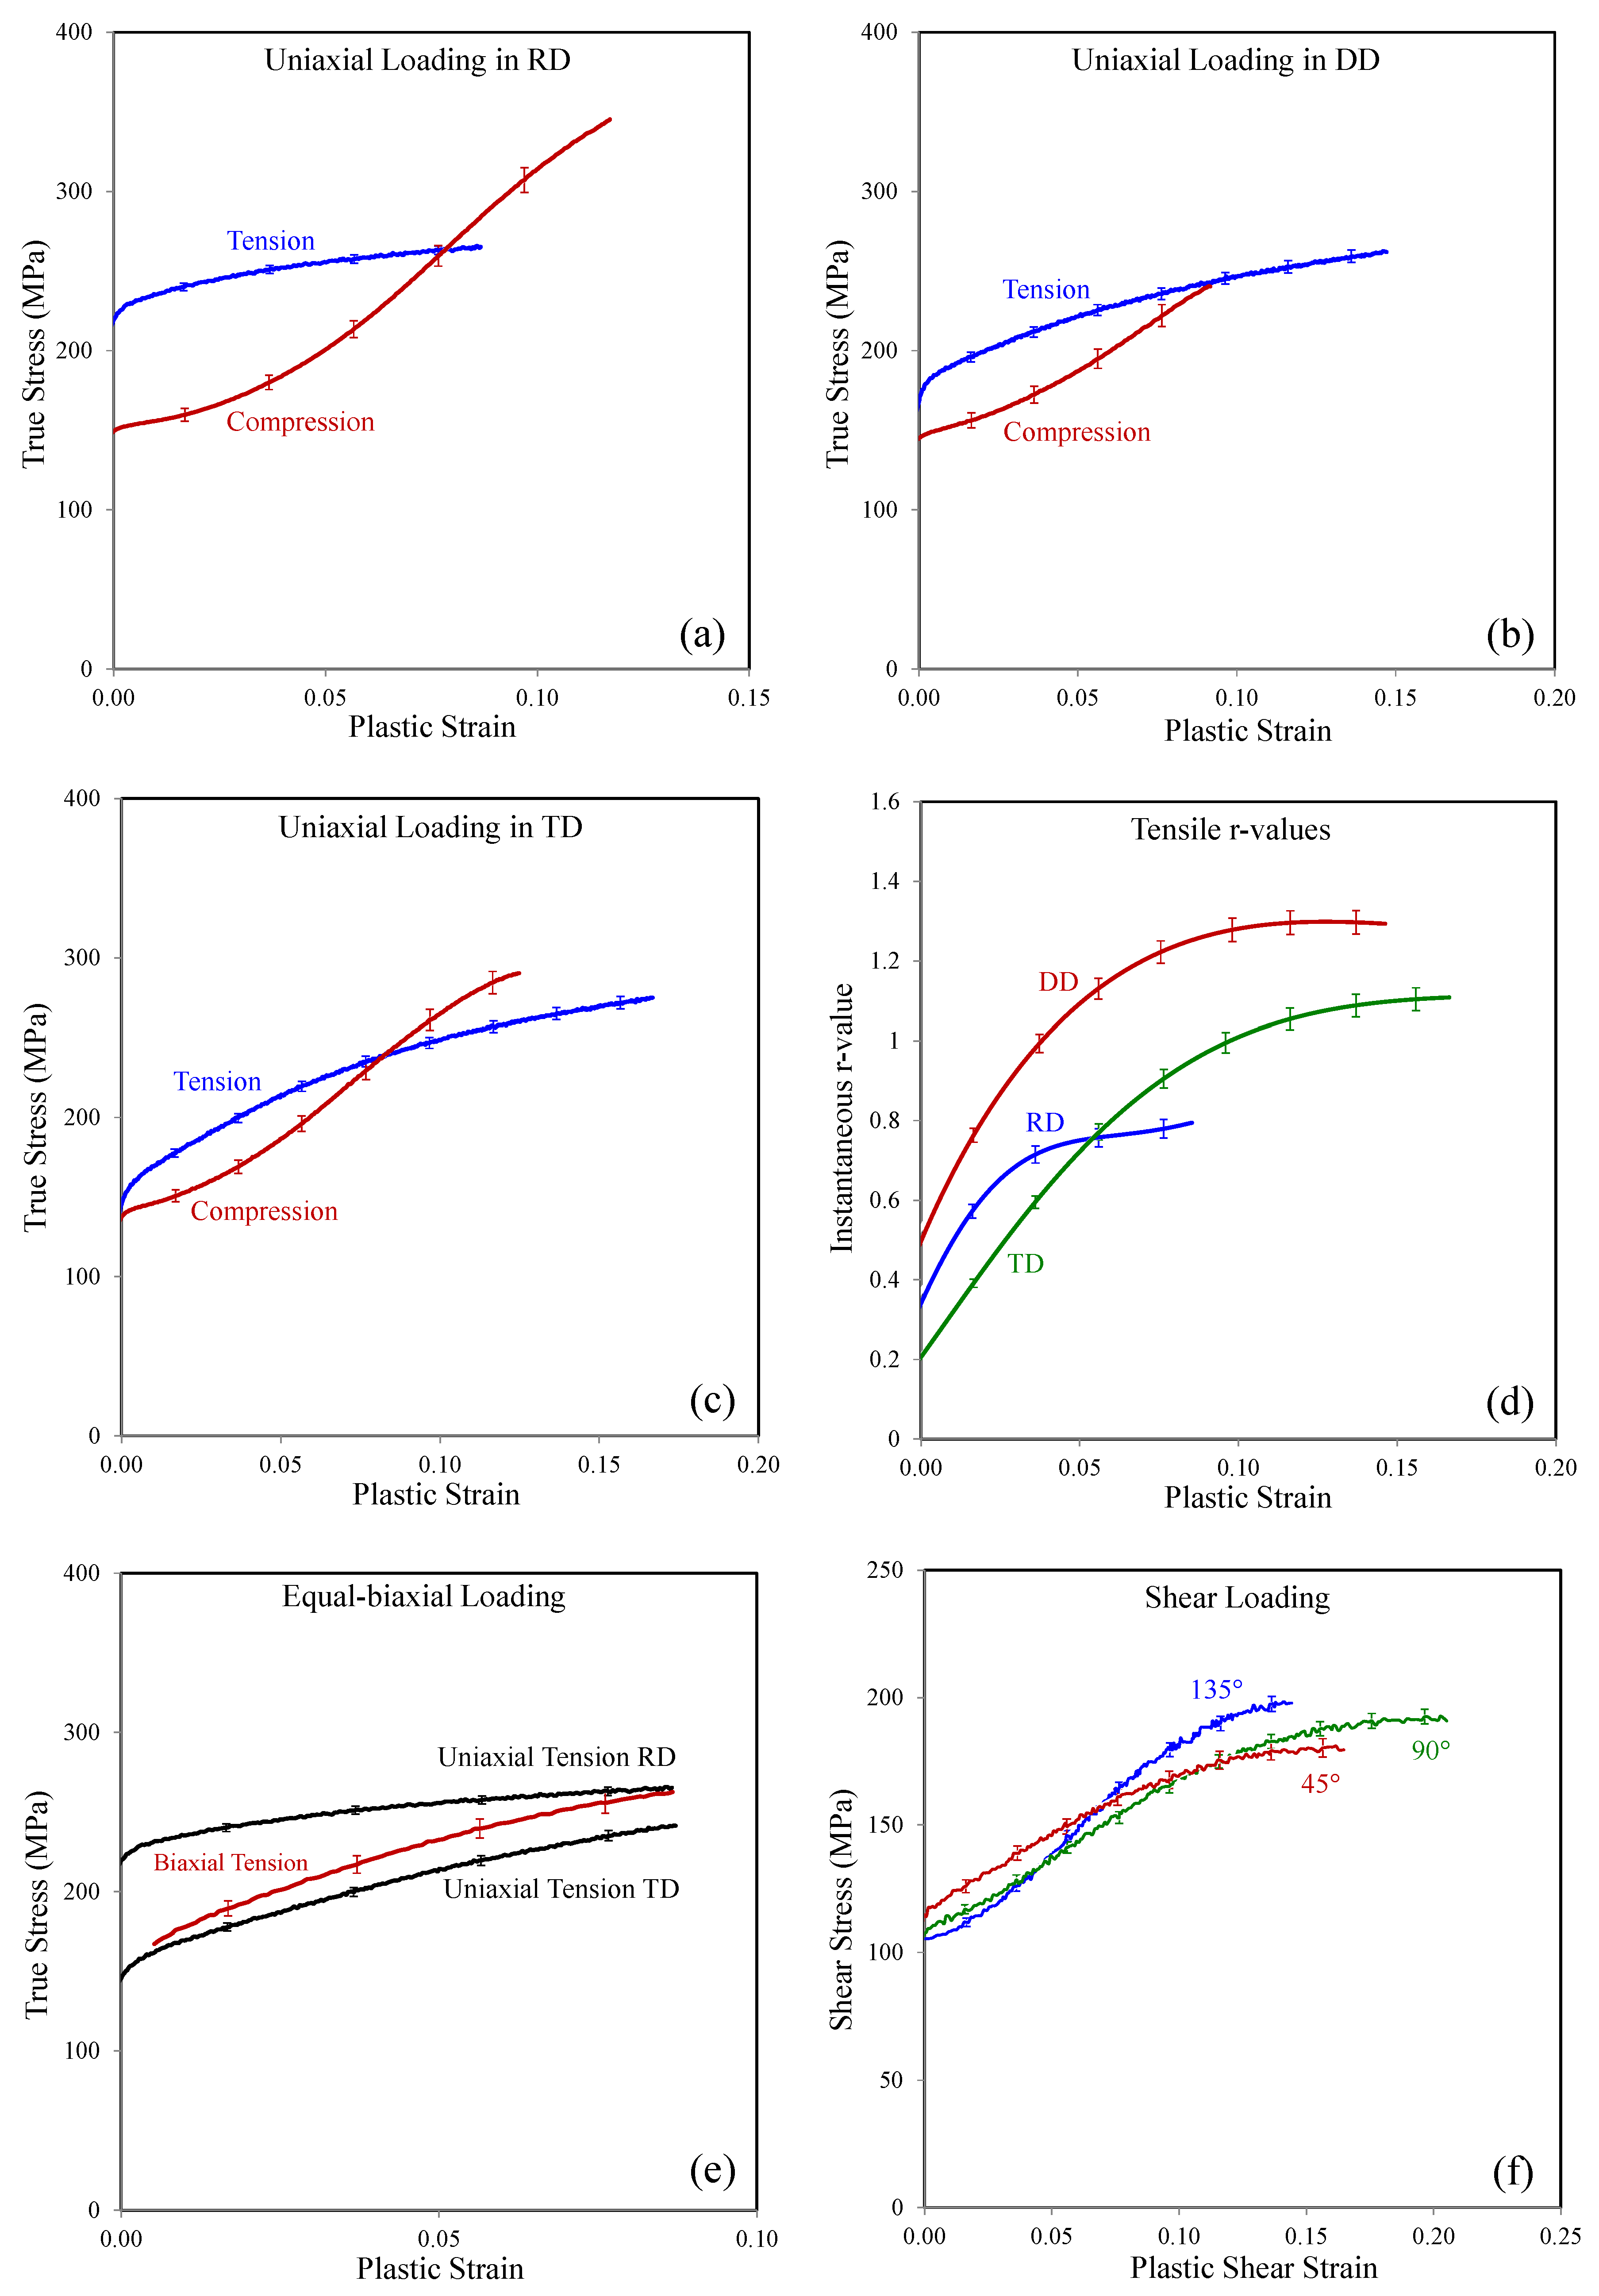
Plastic Response
3. Plasticity Model
3.1. Yield Function and Plastic Potential
3.2. Implementation into a Finite Element Code
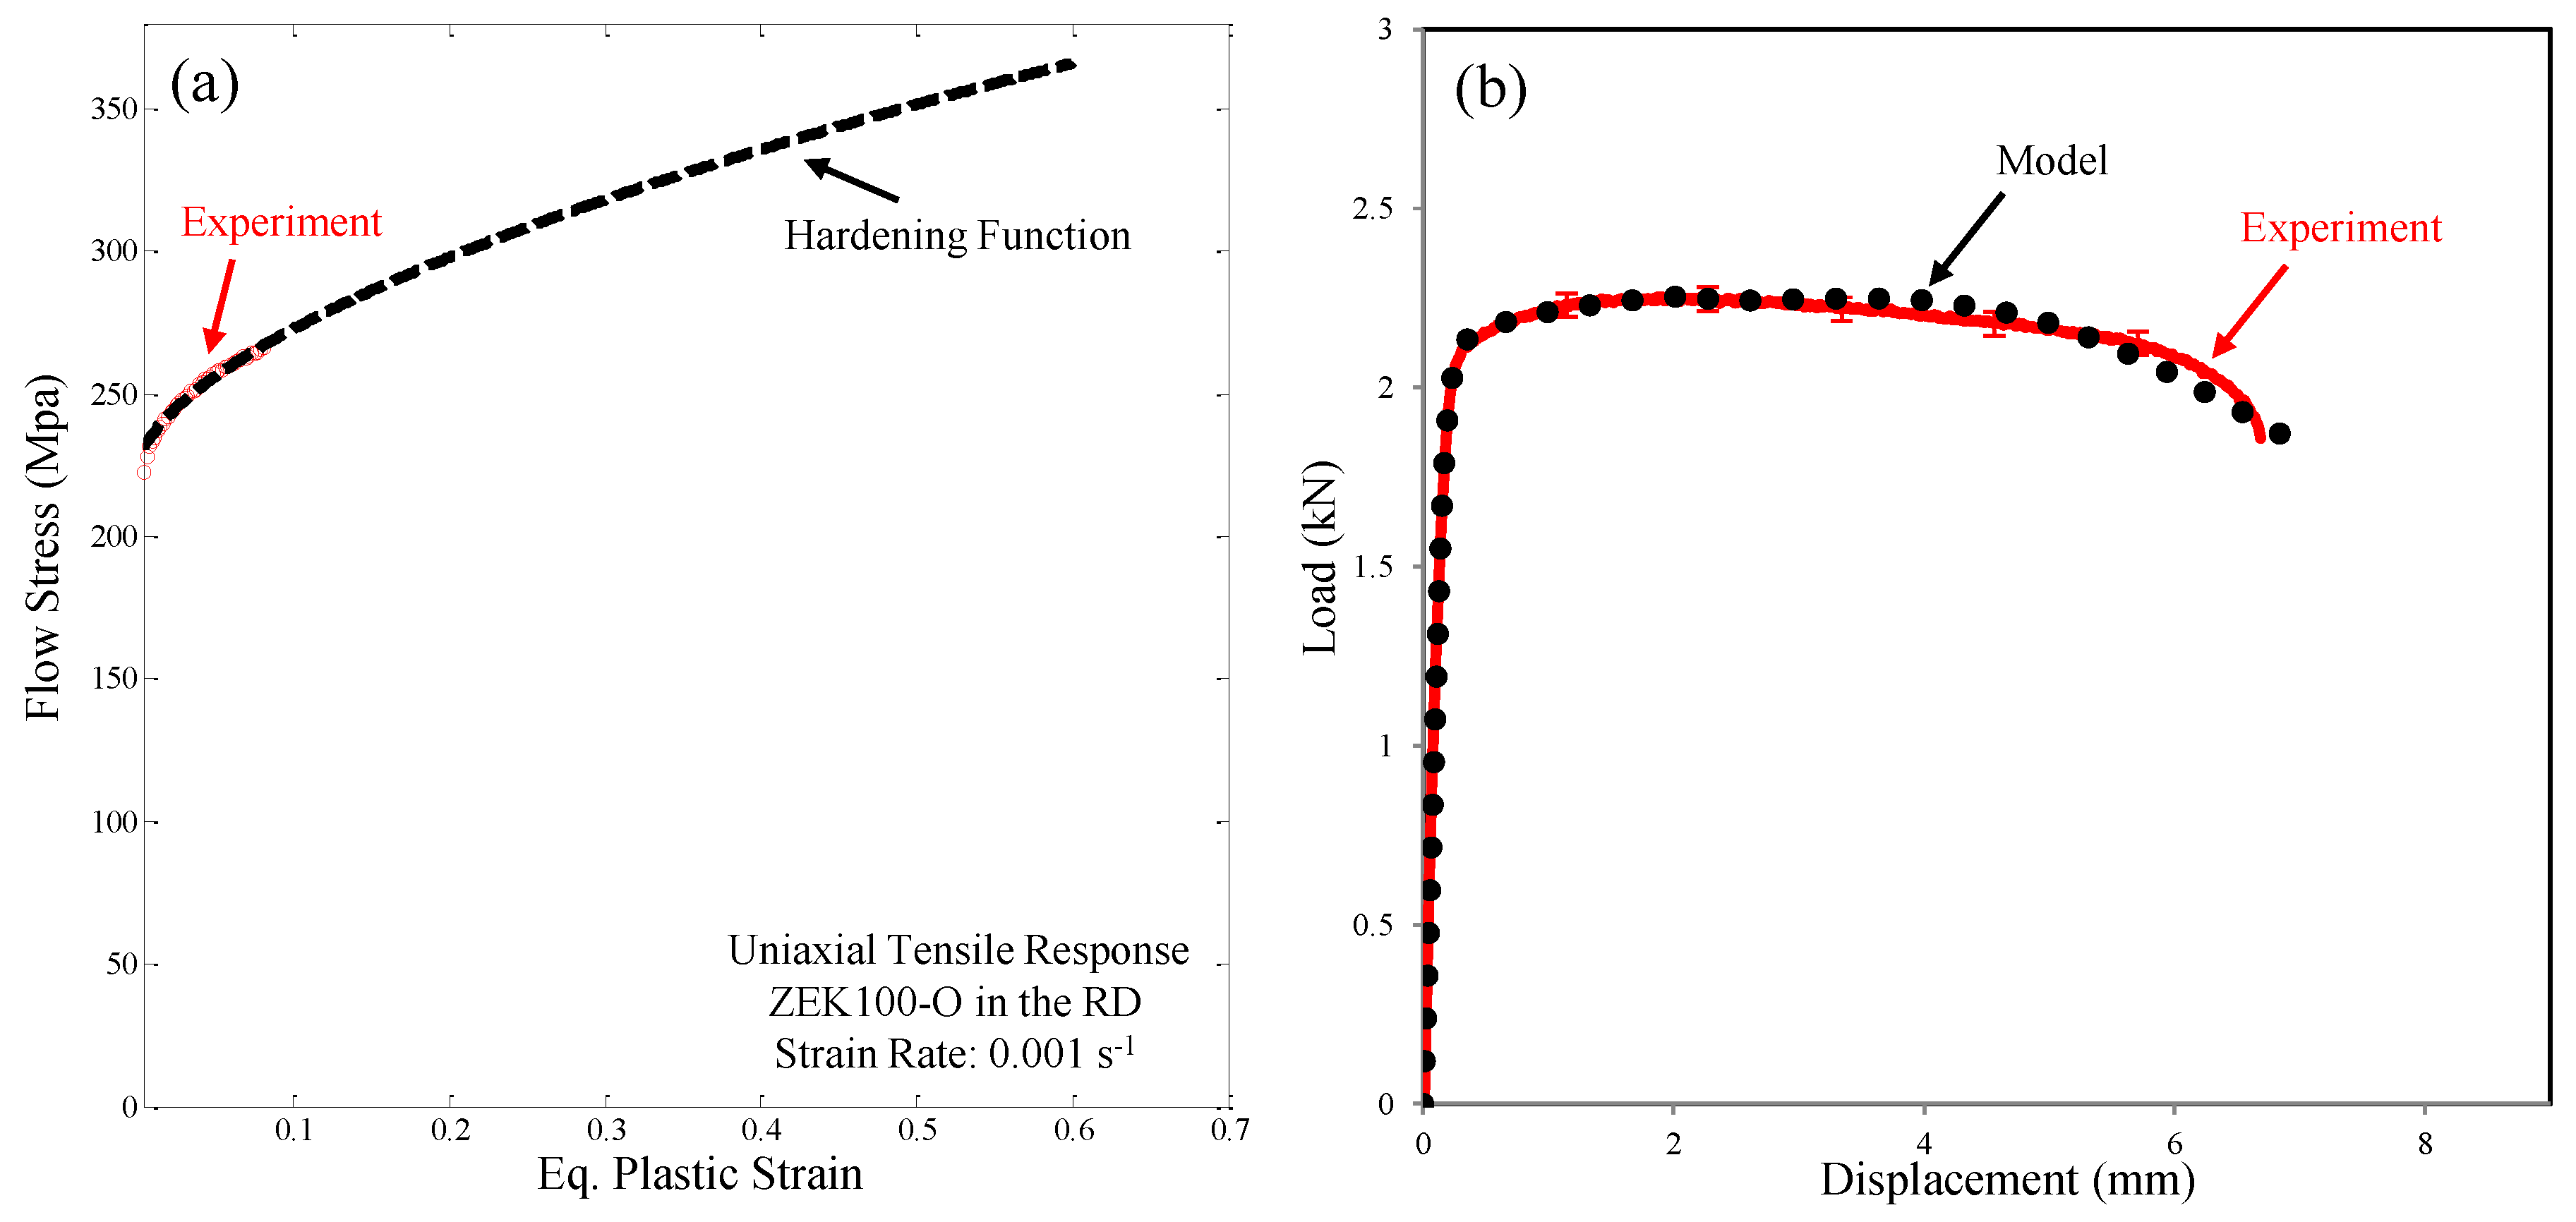
3.3. Hardening Function
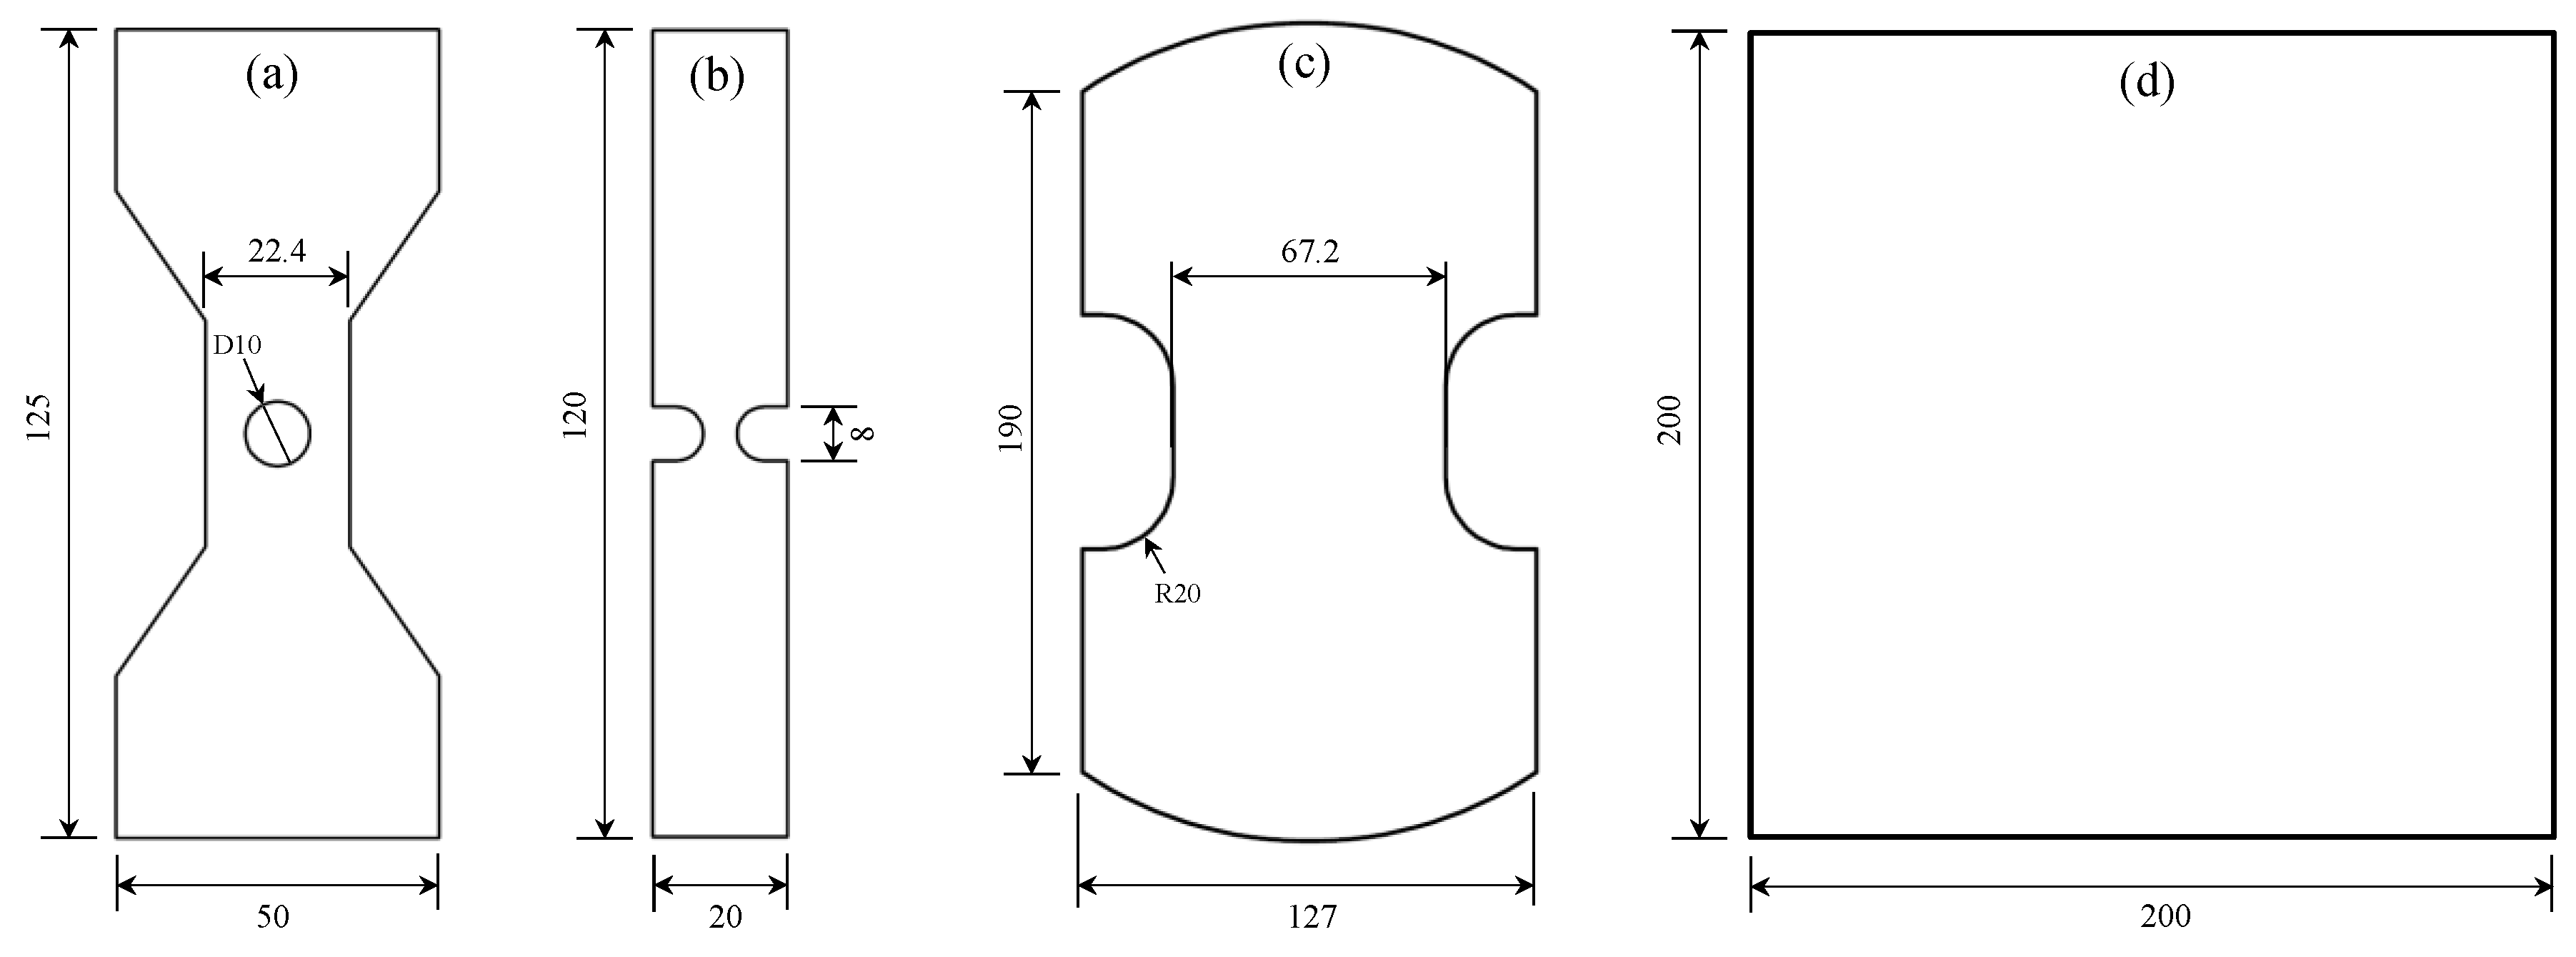
4. Coupon-Level Experiments
4.1. In-Plane Tensile Tests
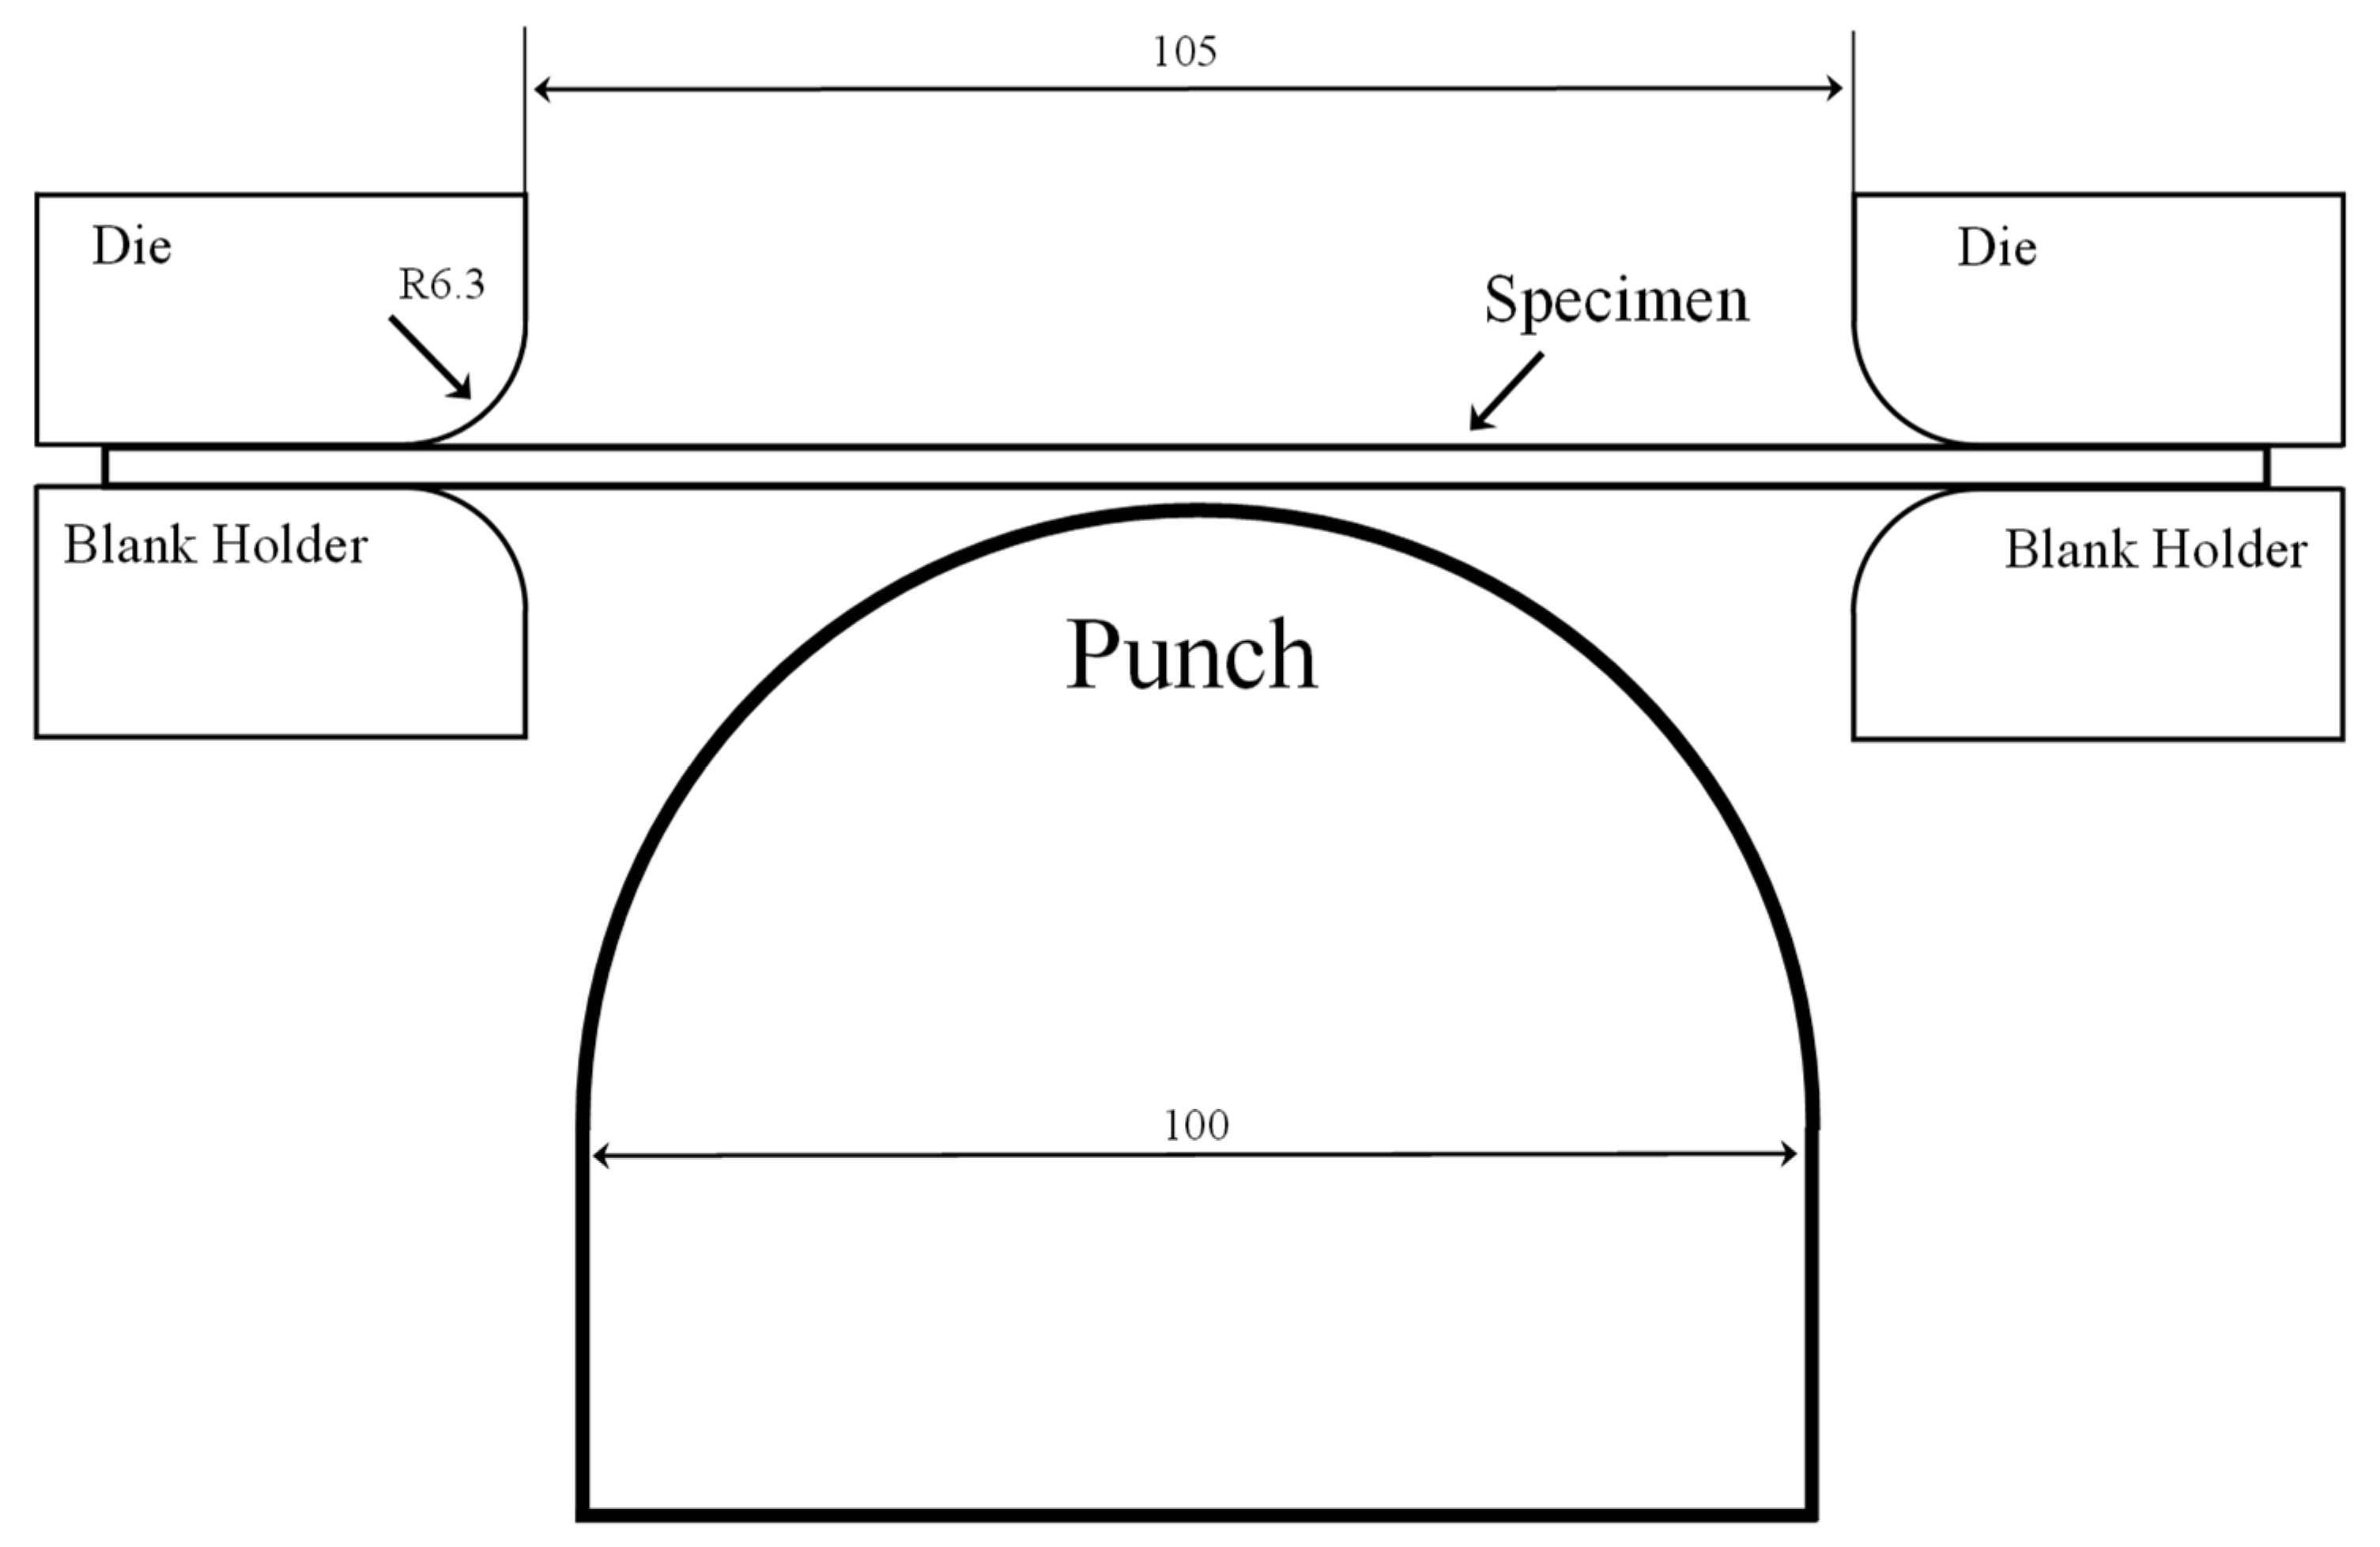
4.2. Nakazima Dome Tests
4.3. Strain Measurements
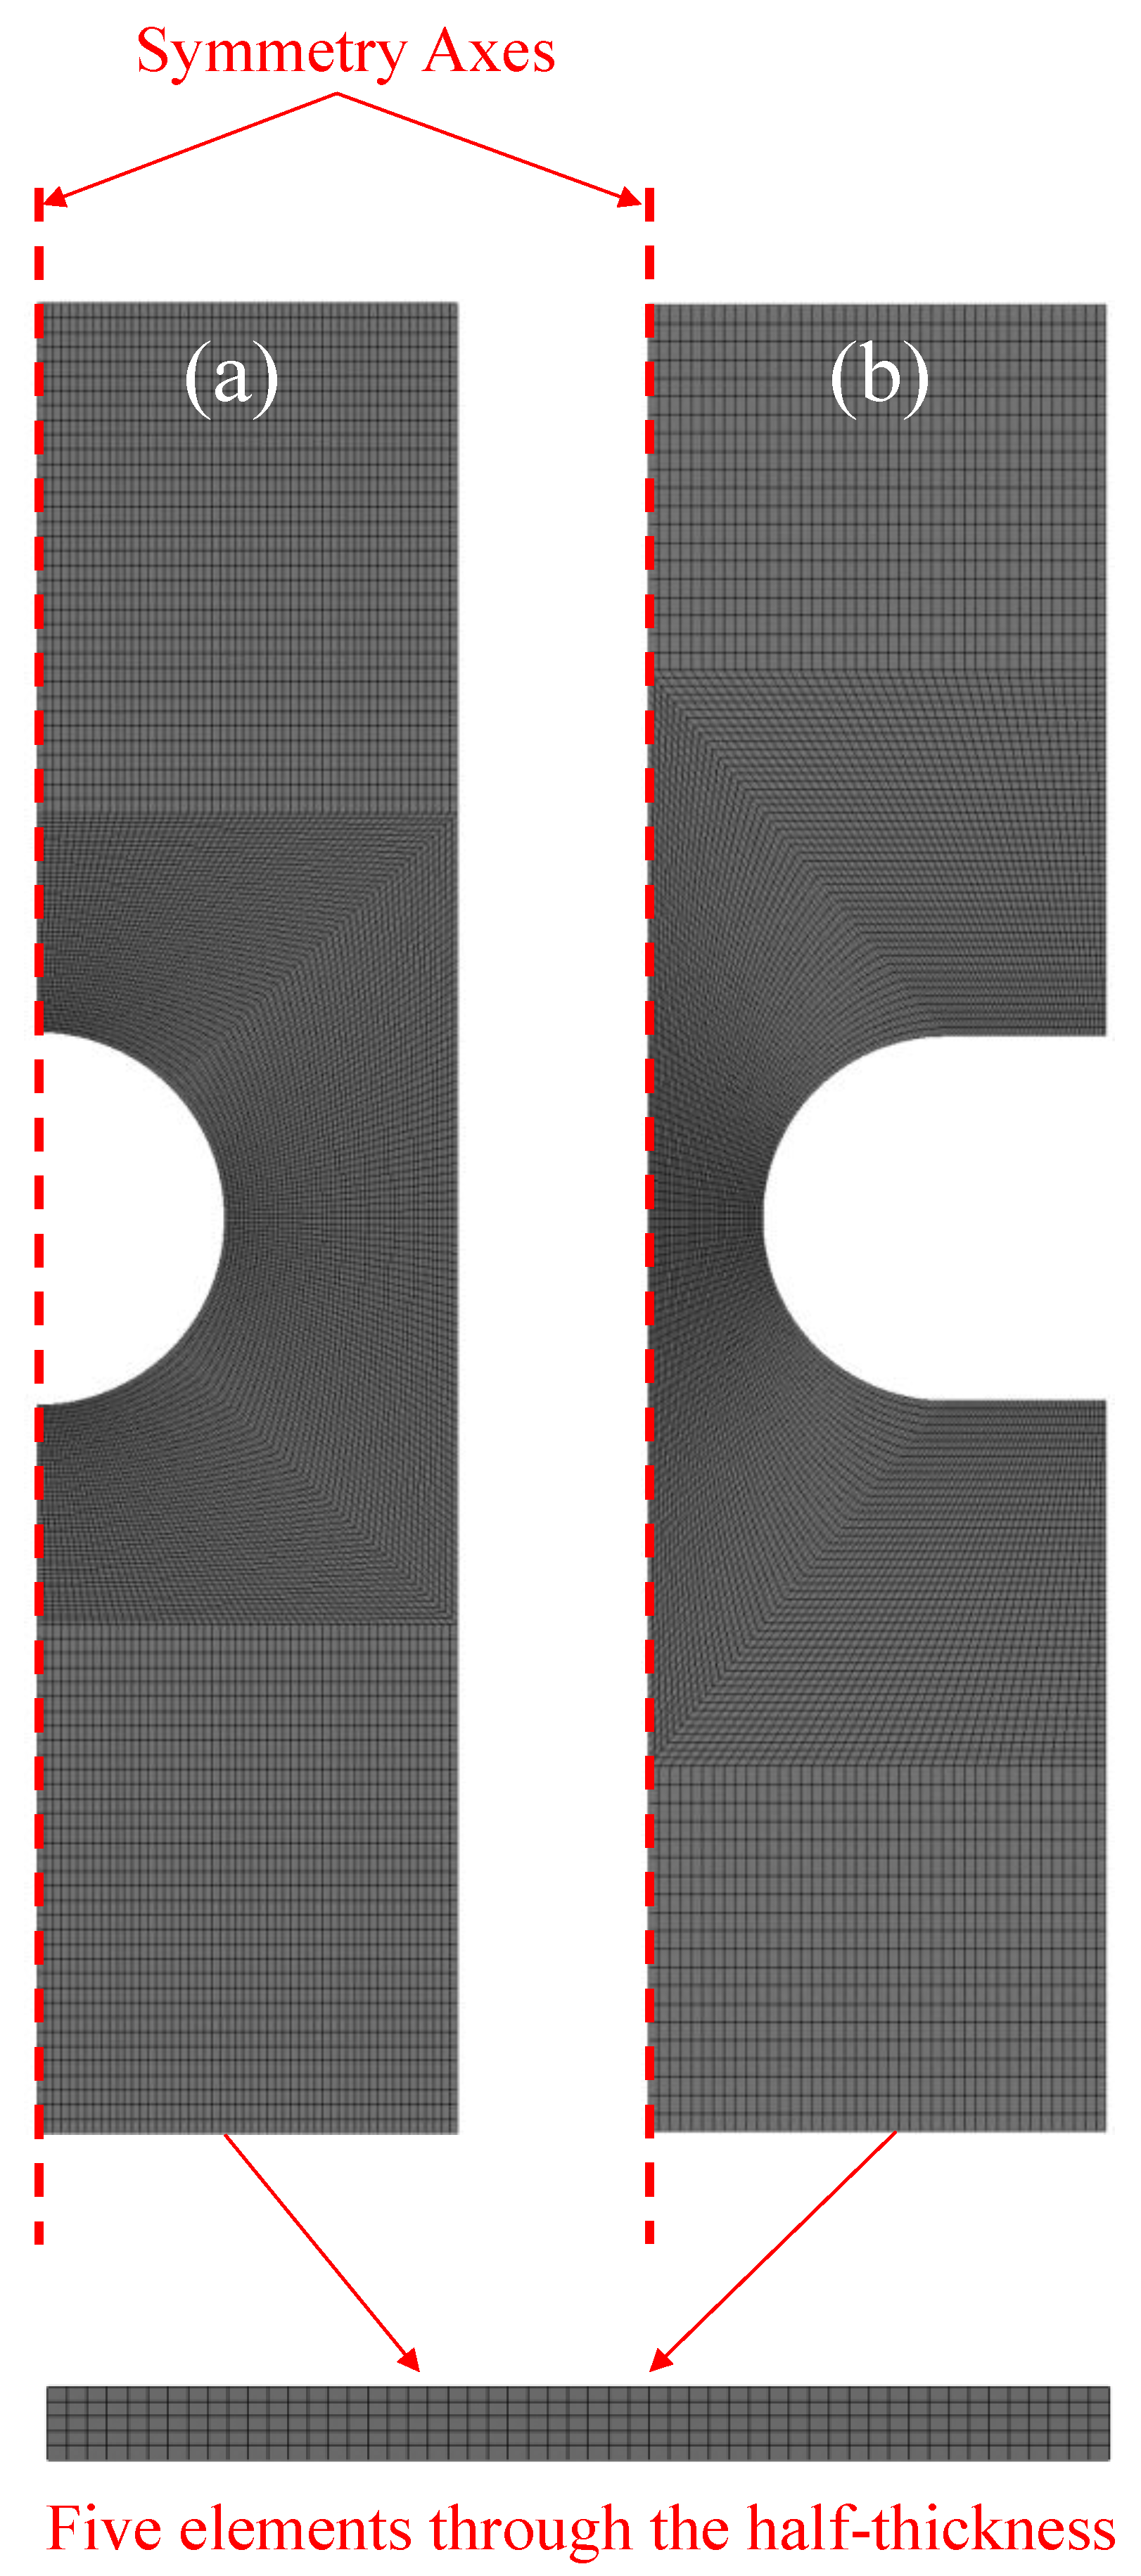
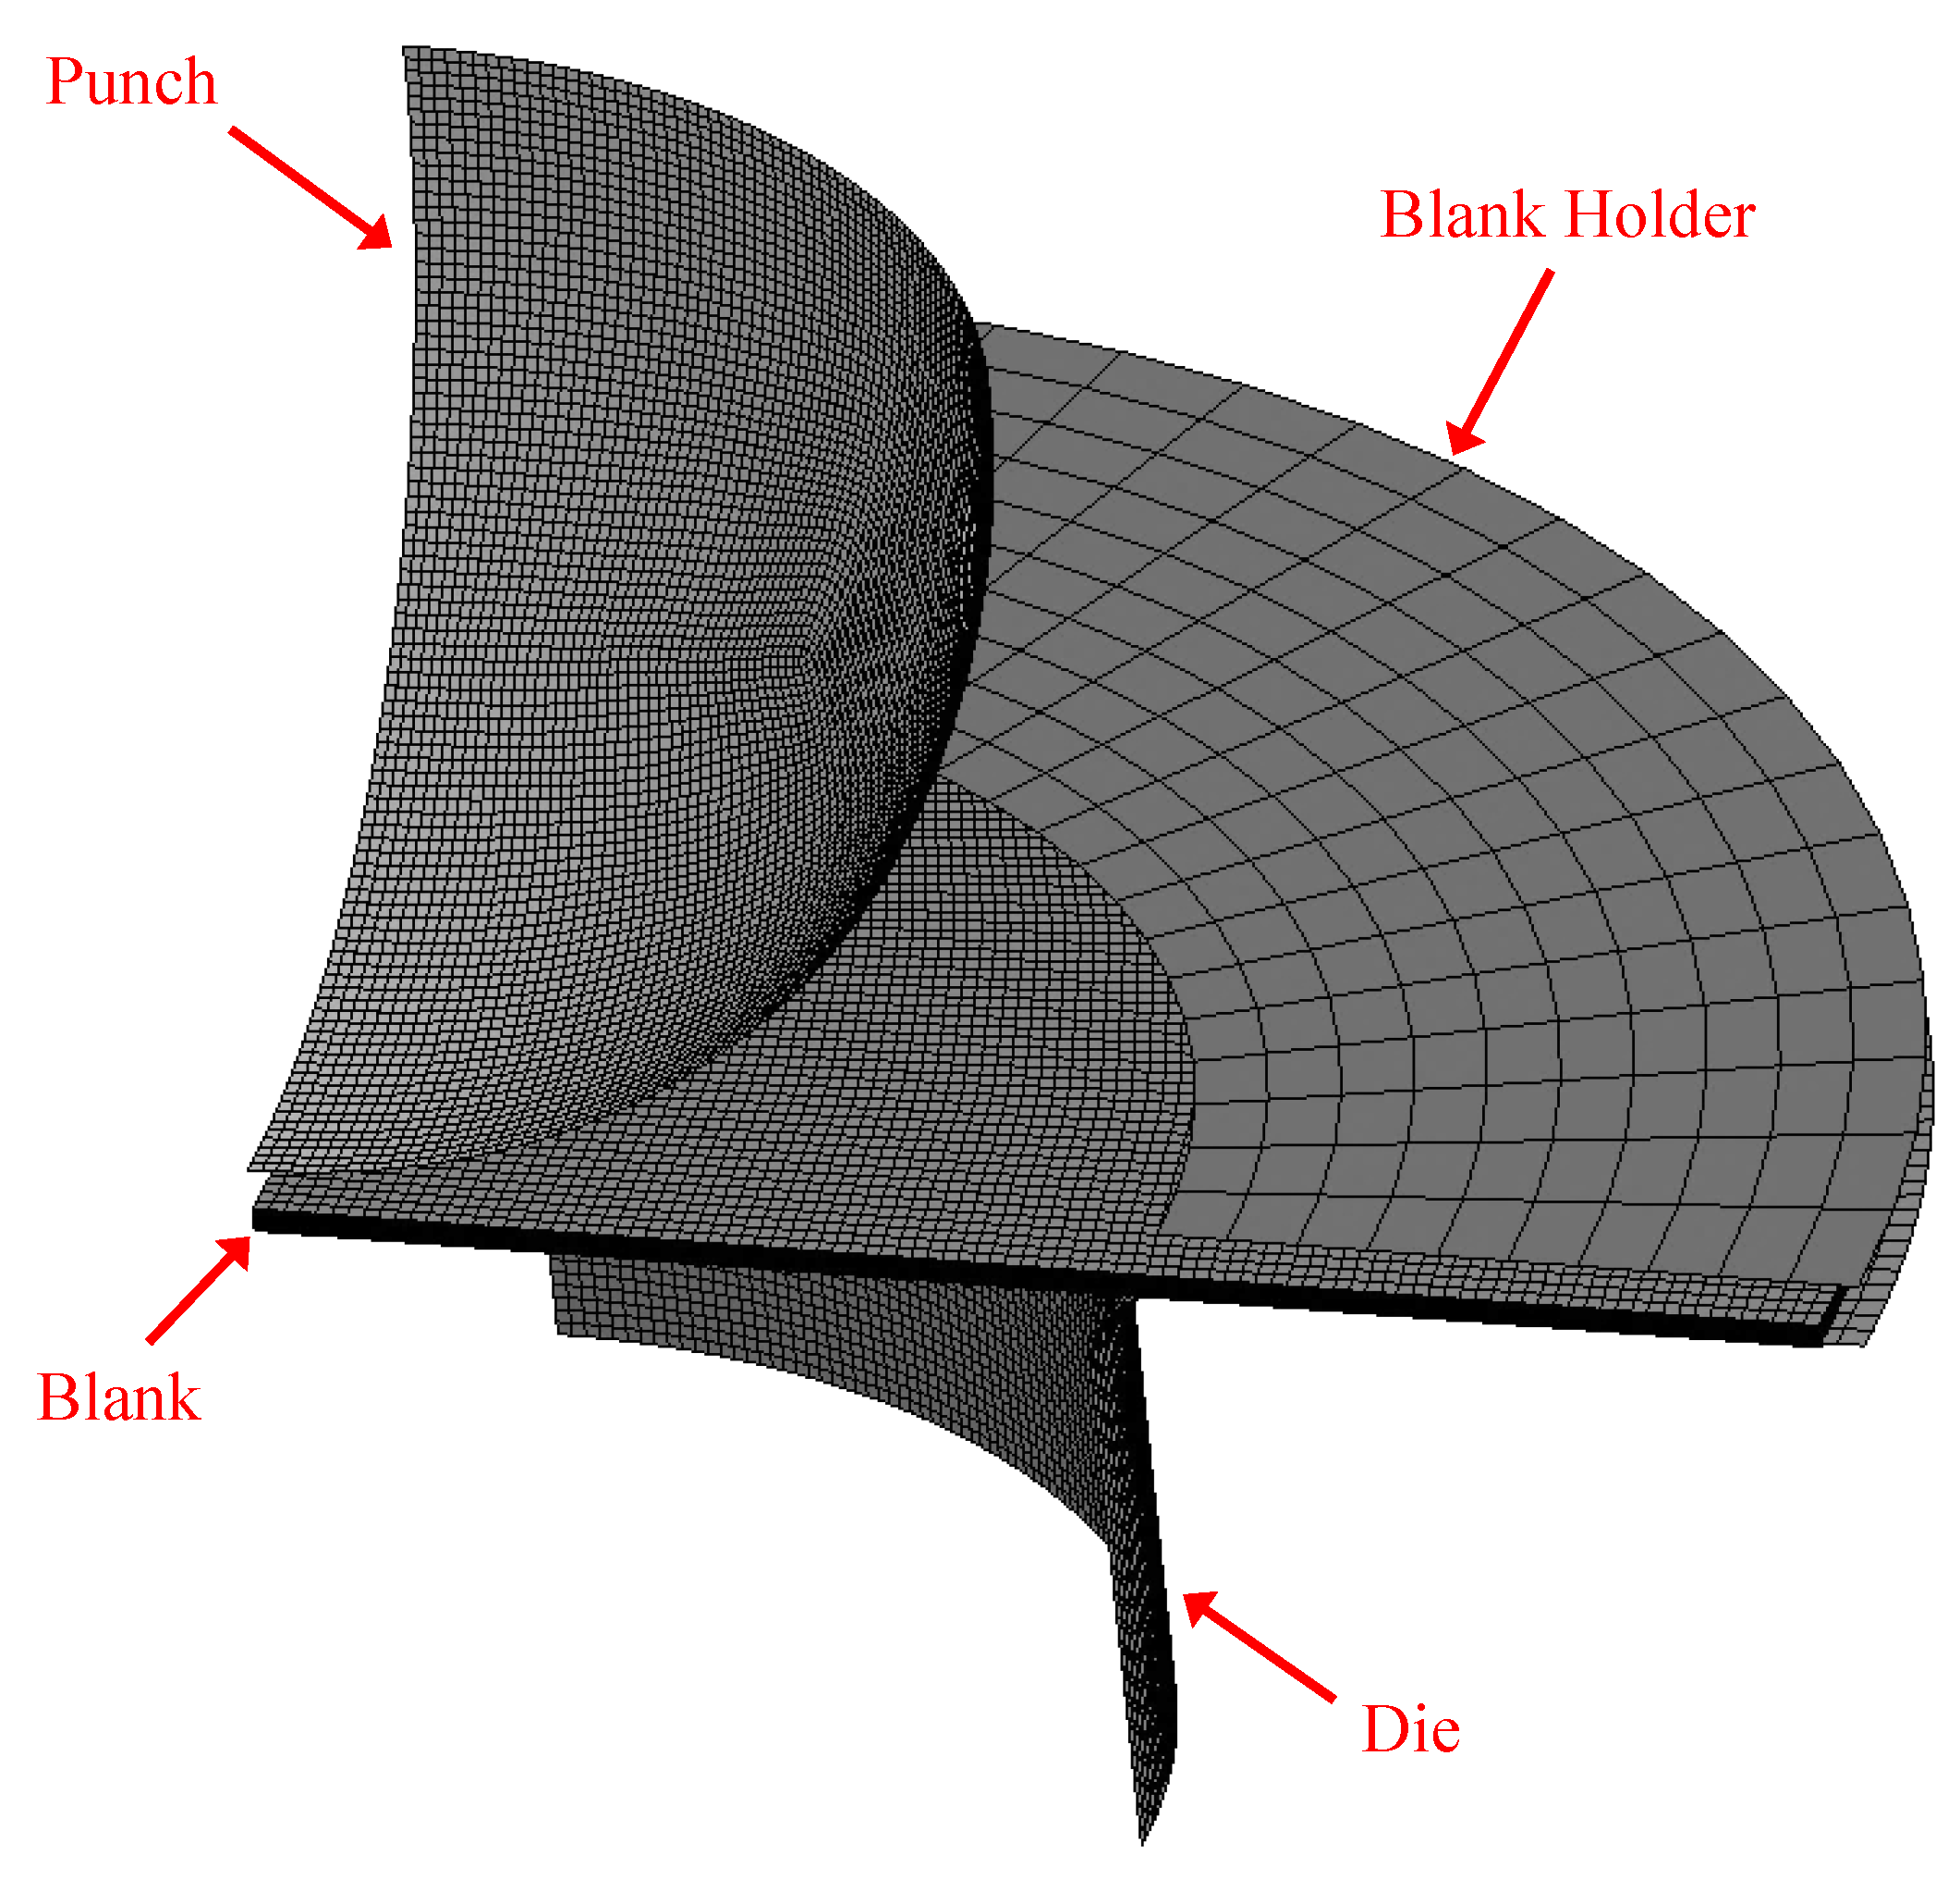
5. Finite Element Models
6. Results and Comparison
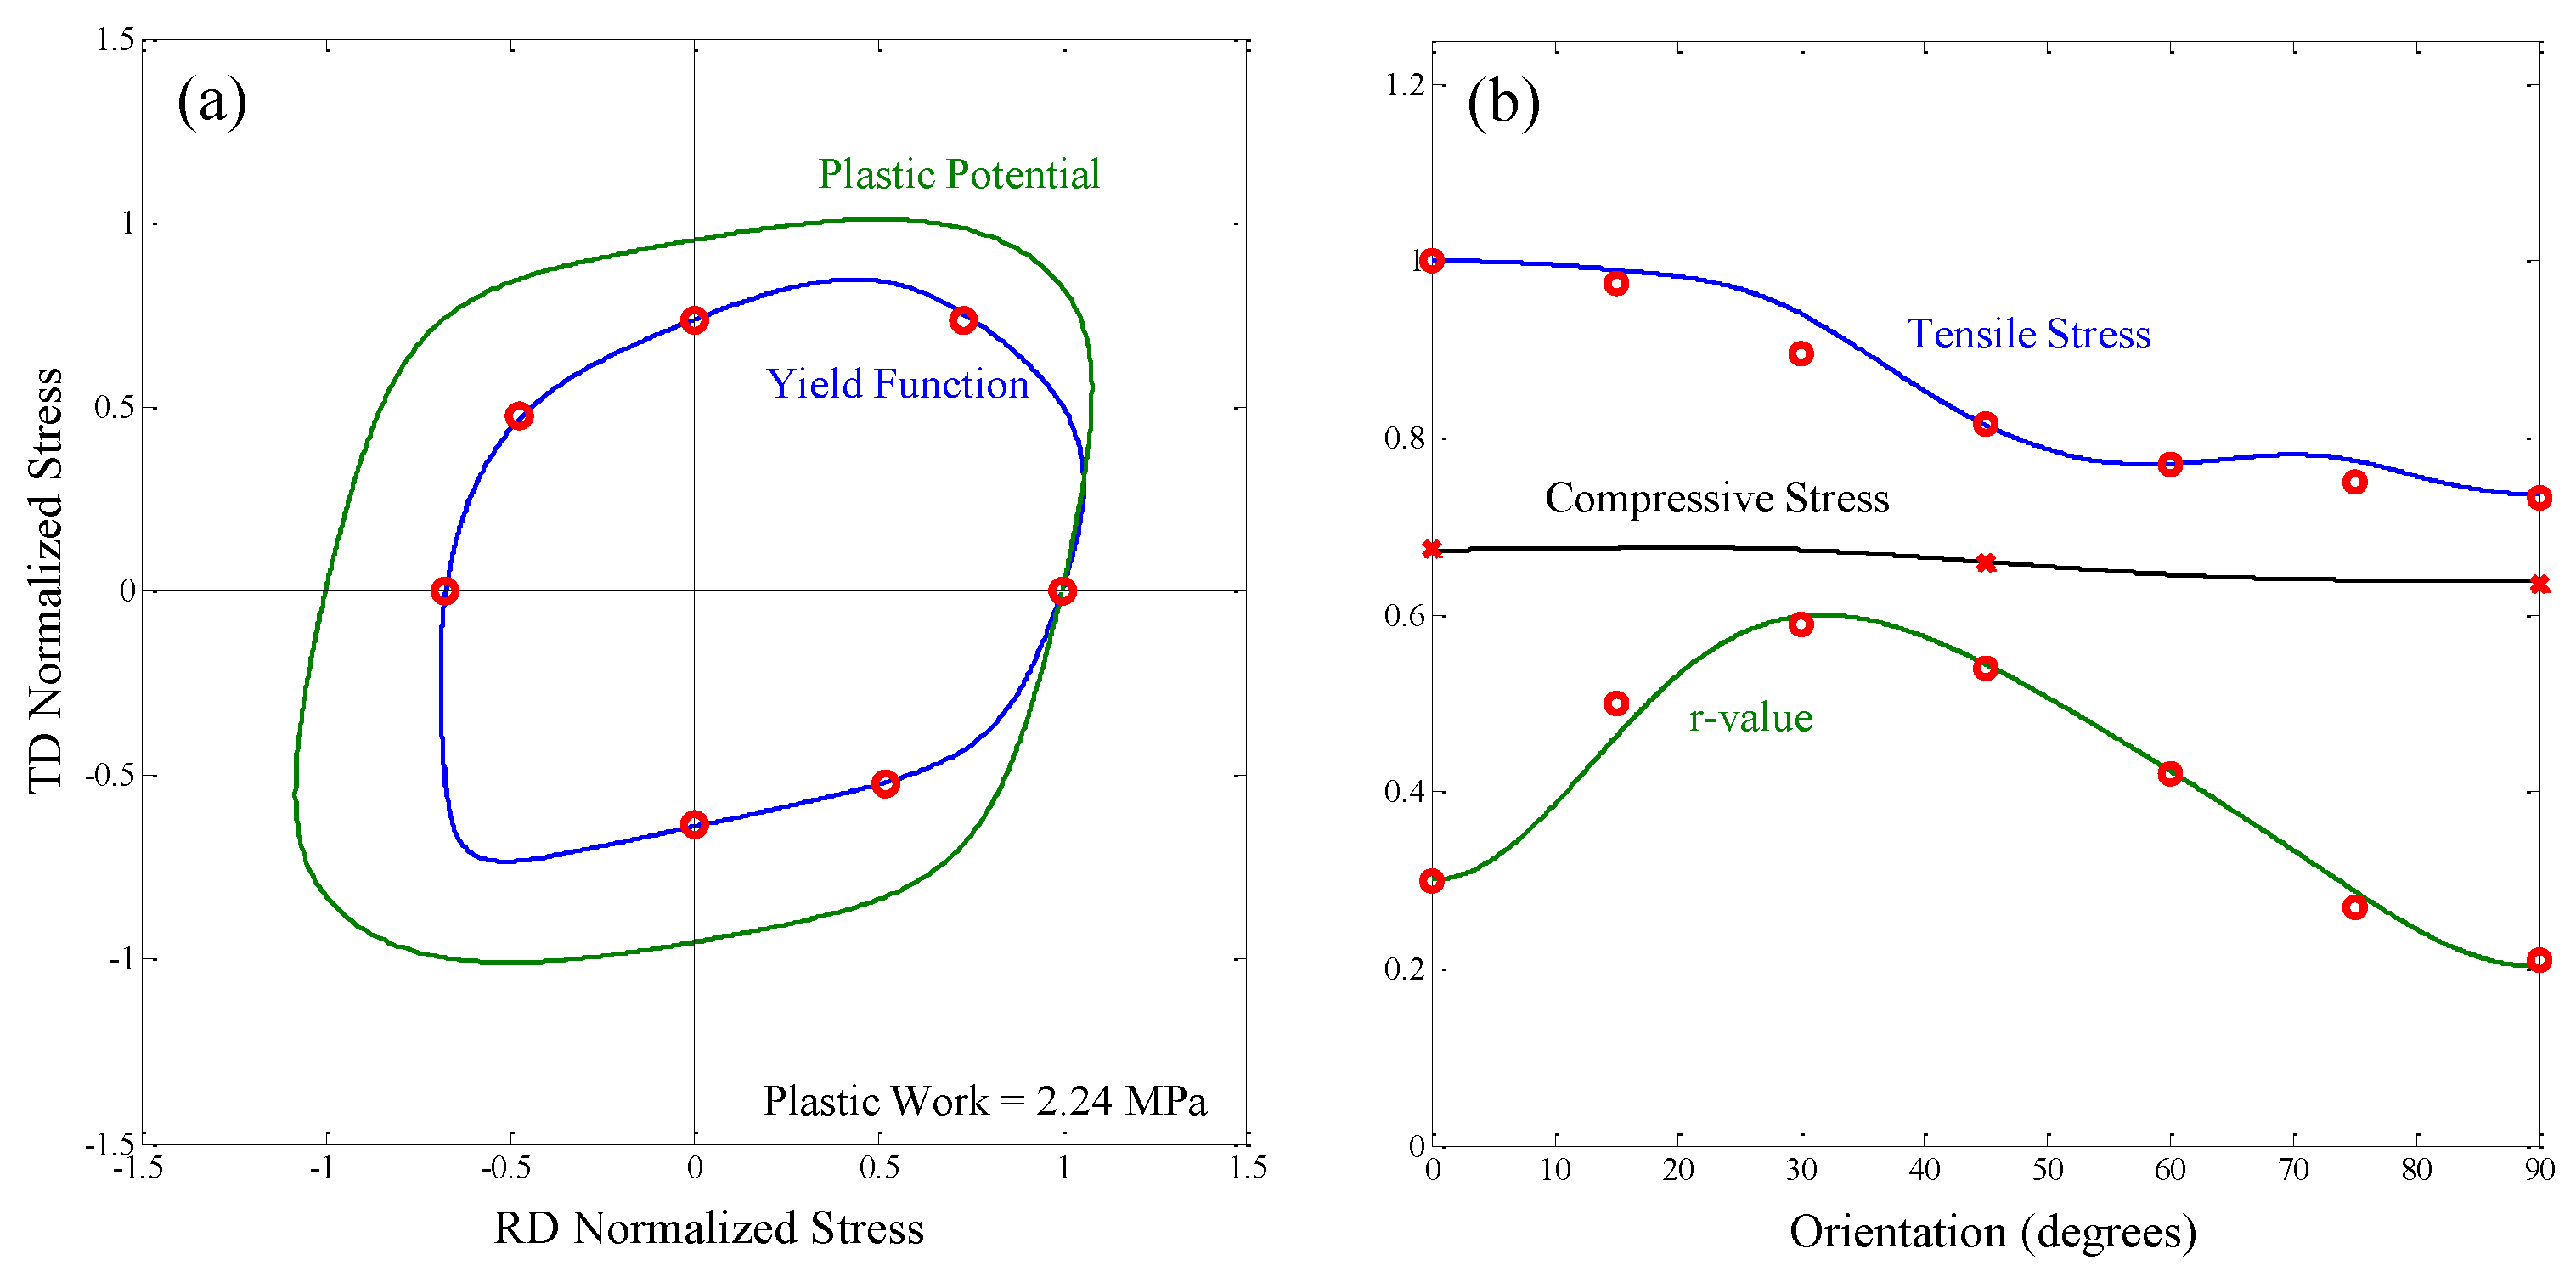
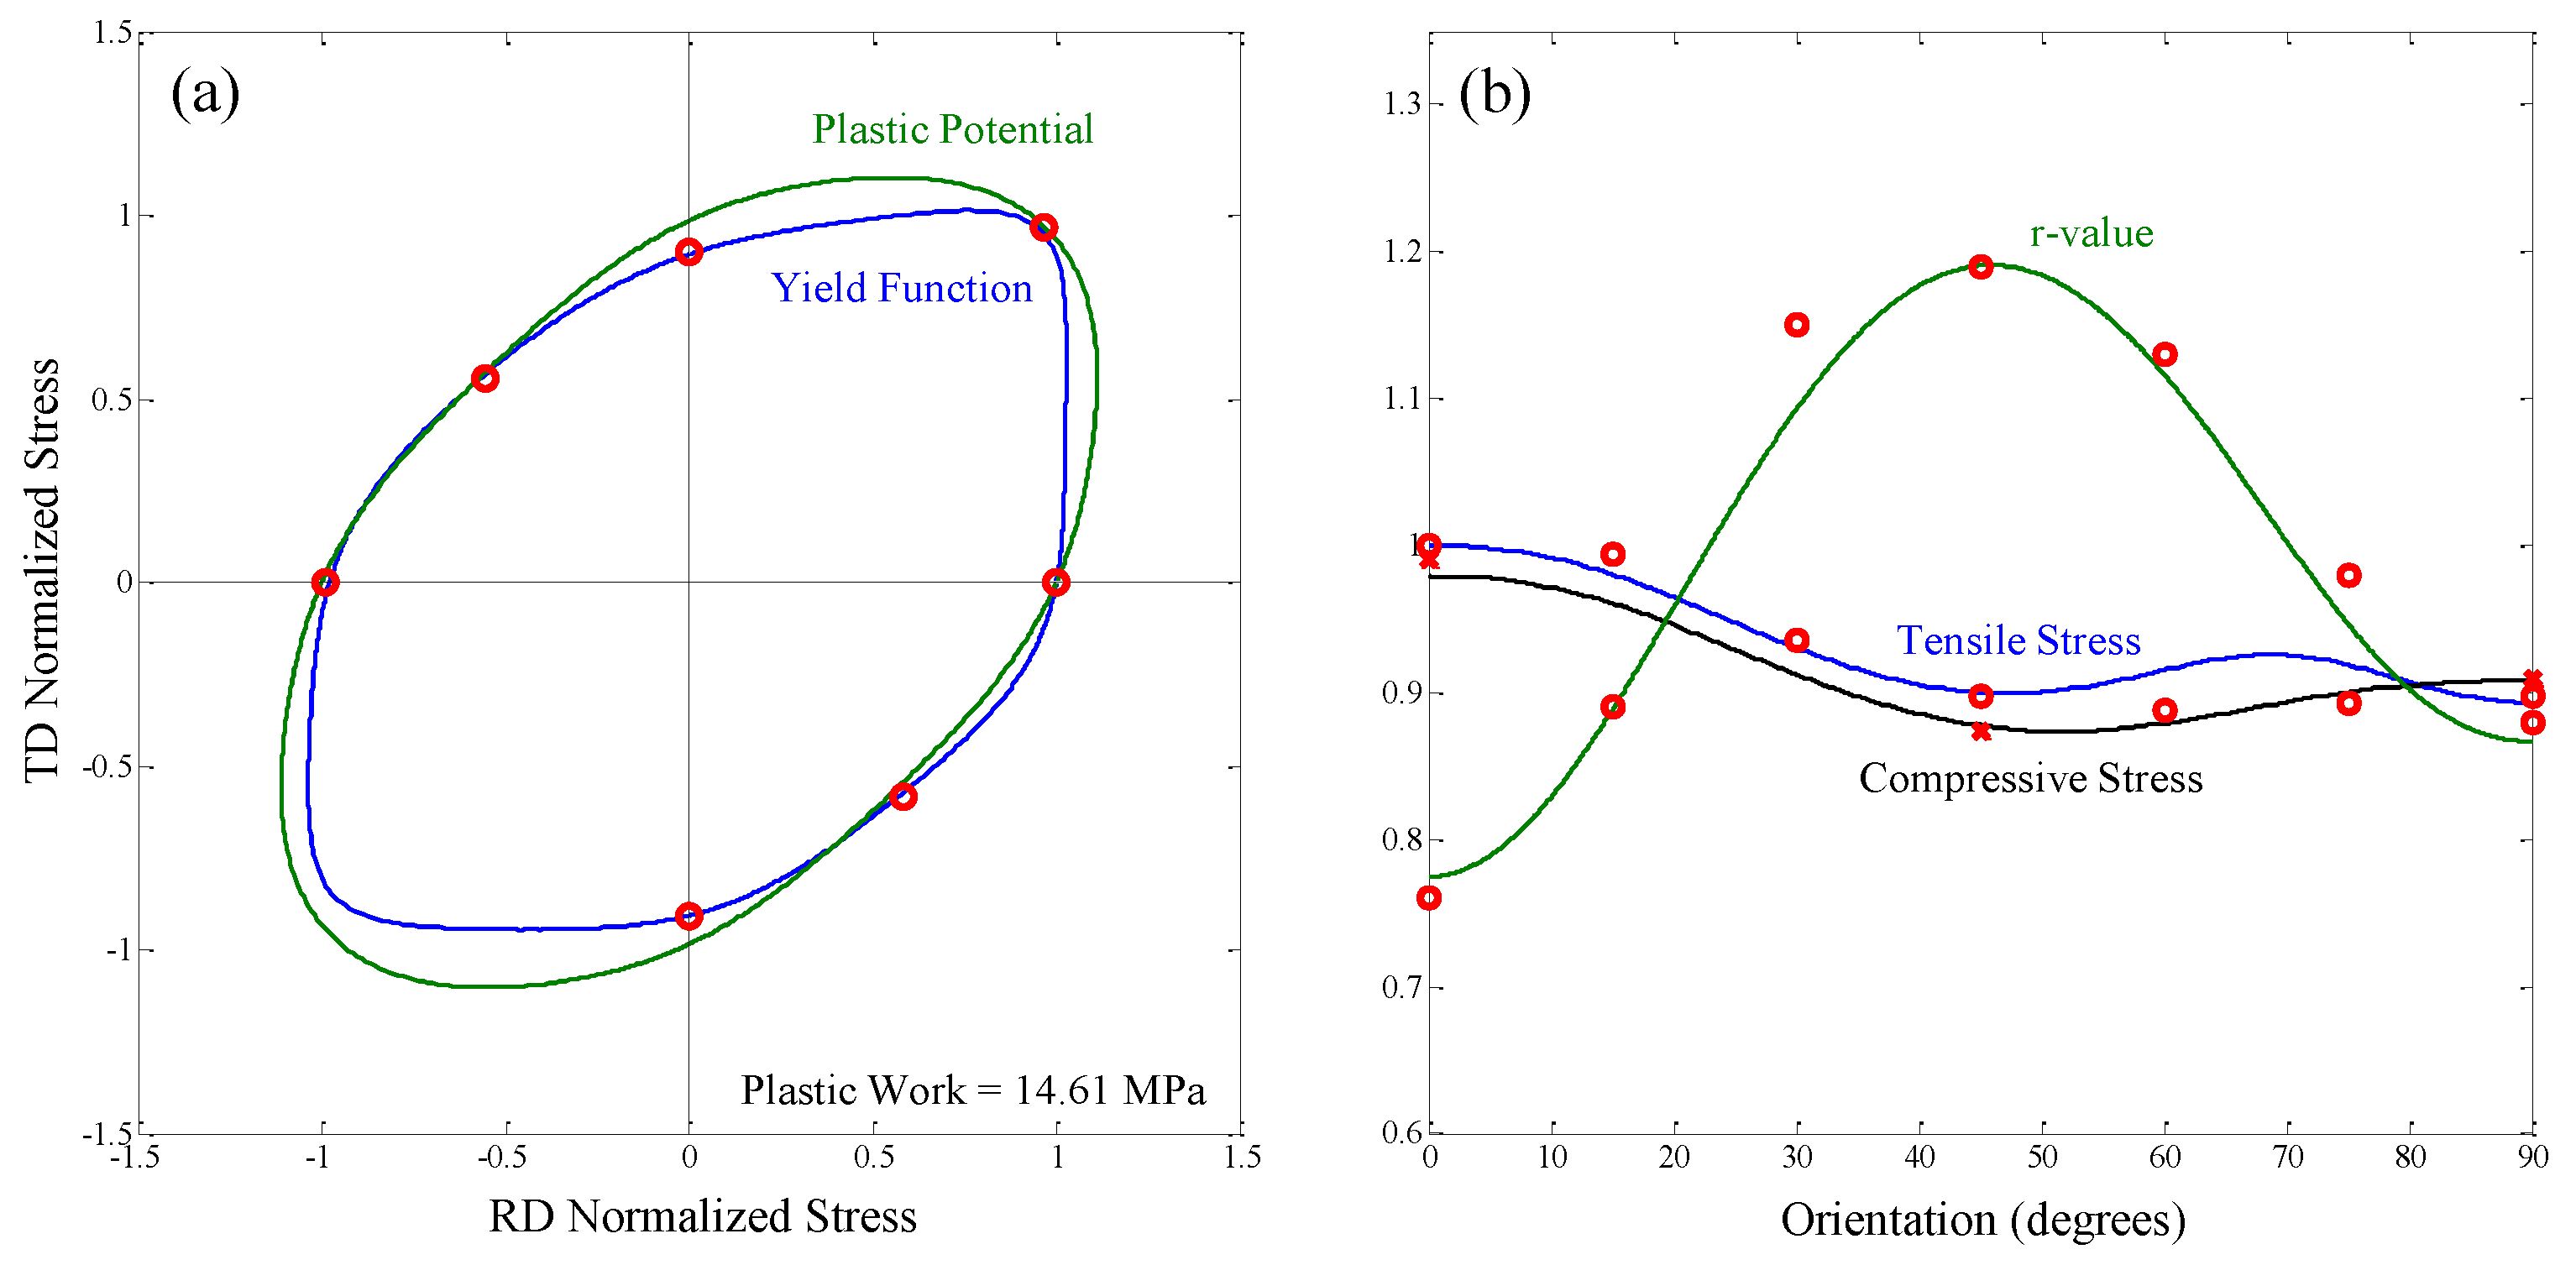
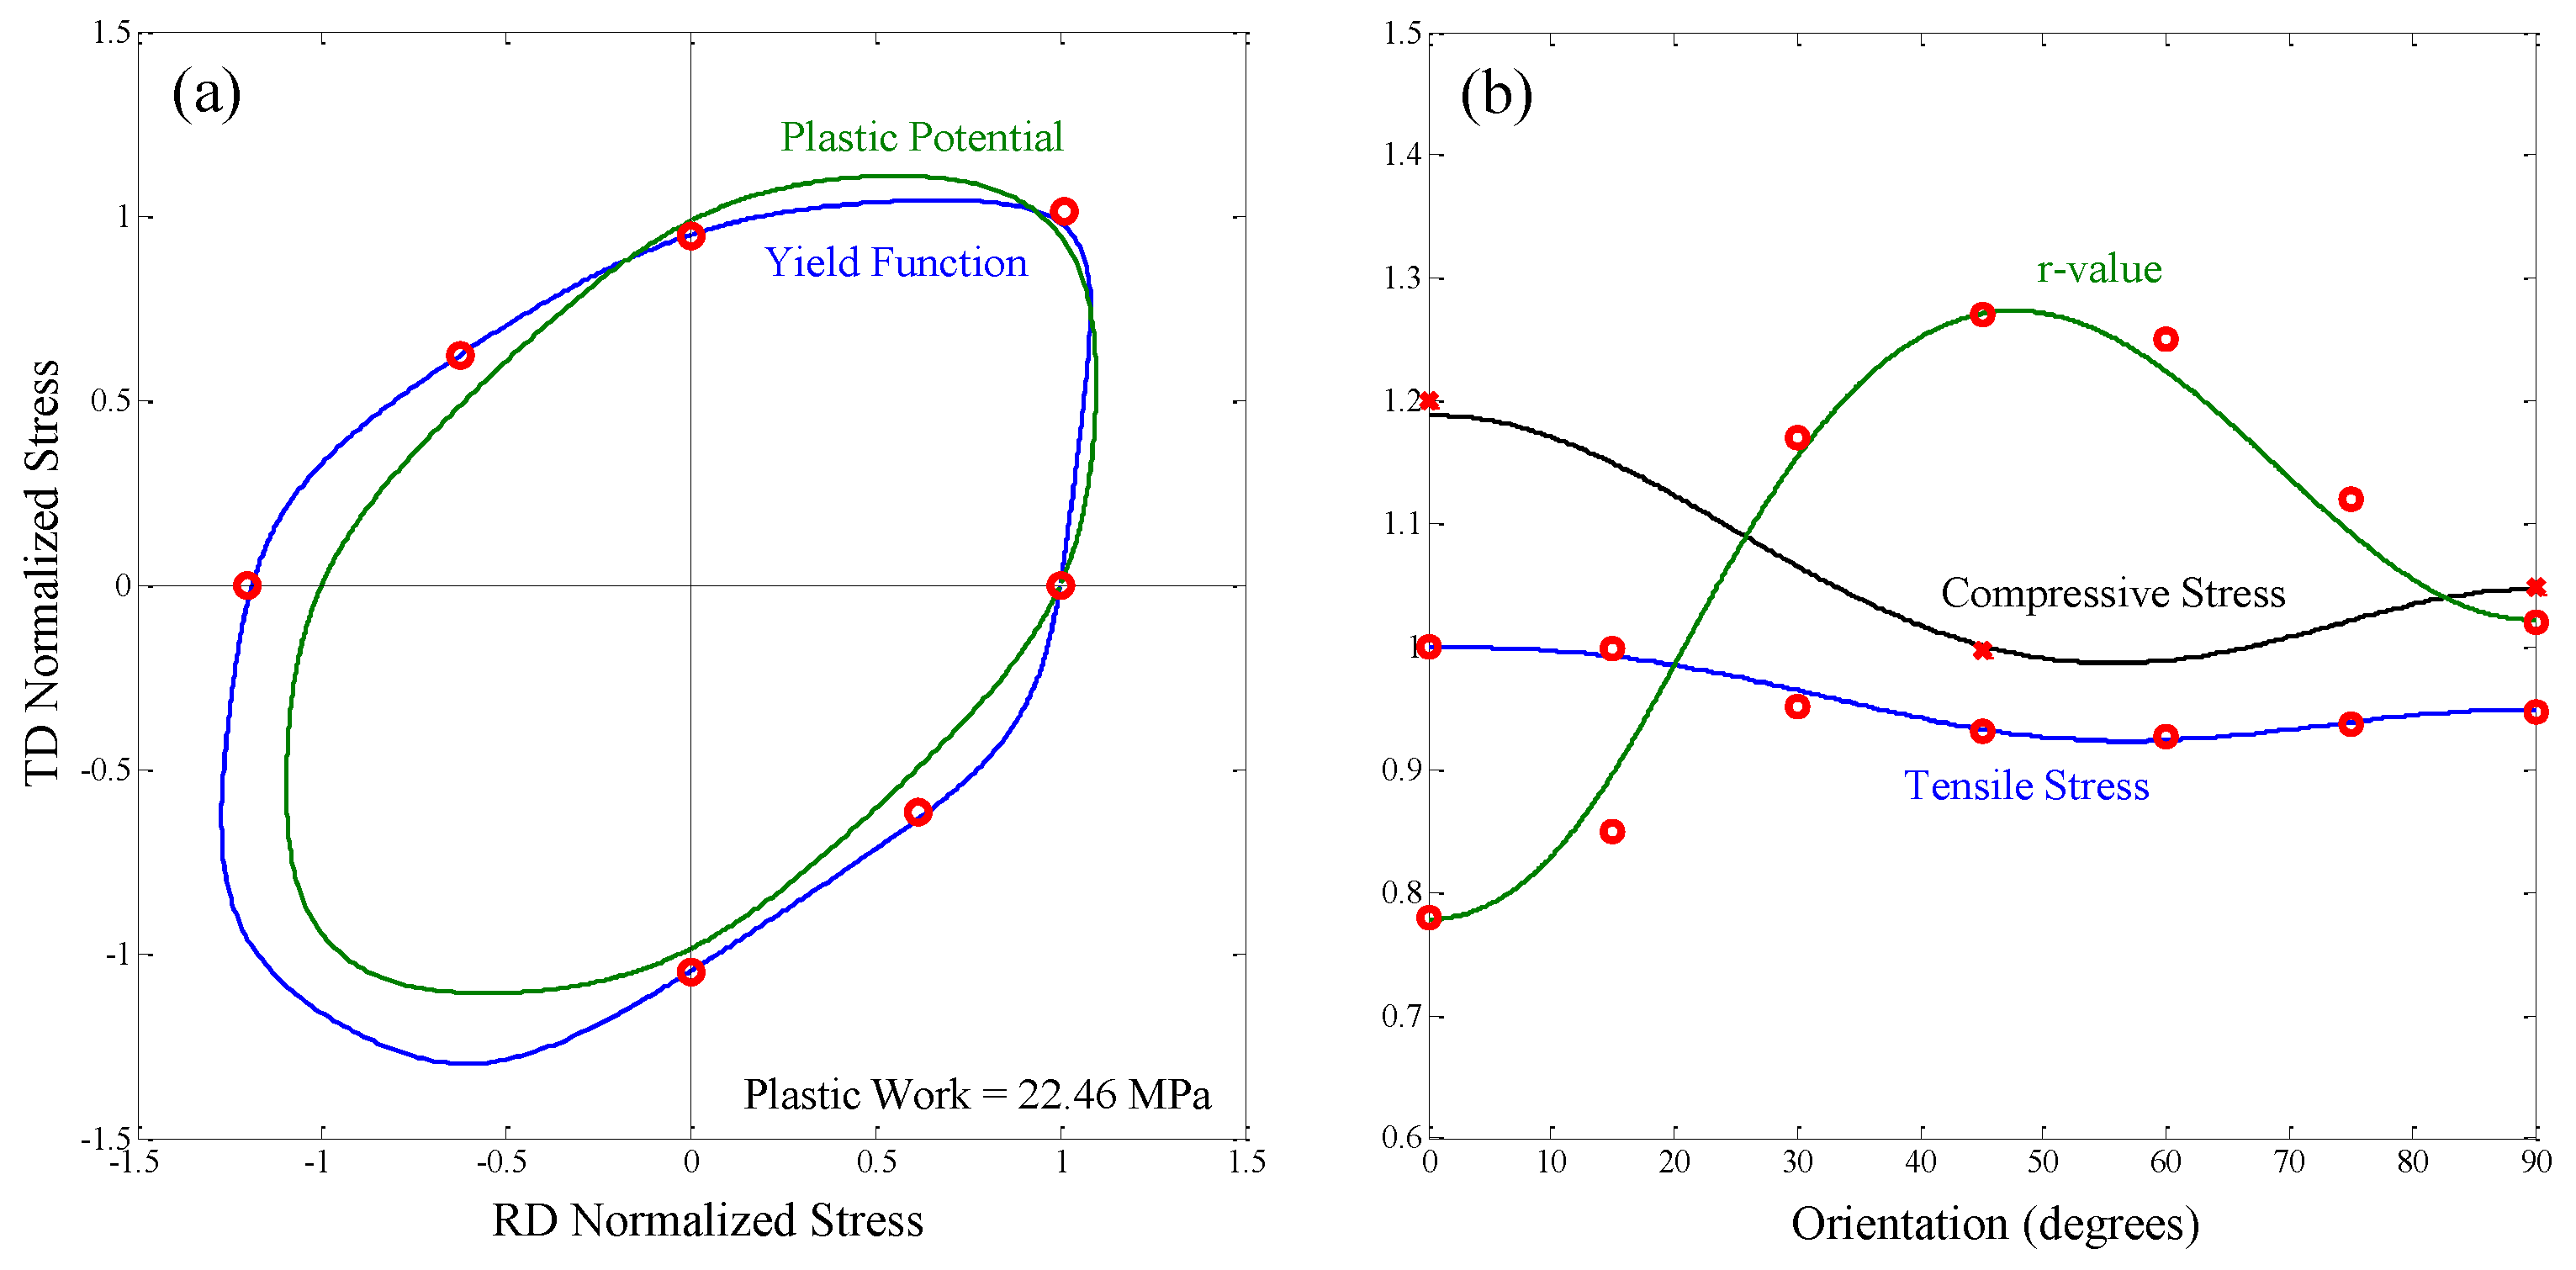
6.1. Yield Function and Plastic Potential
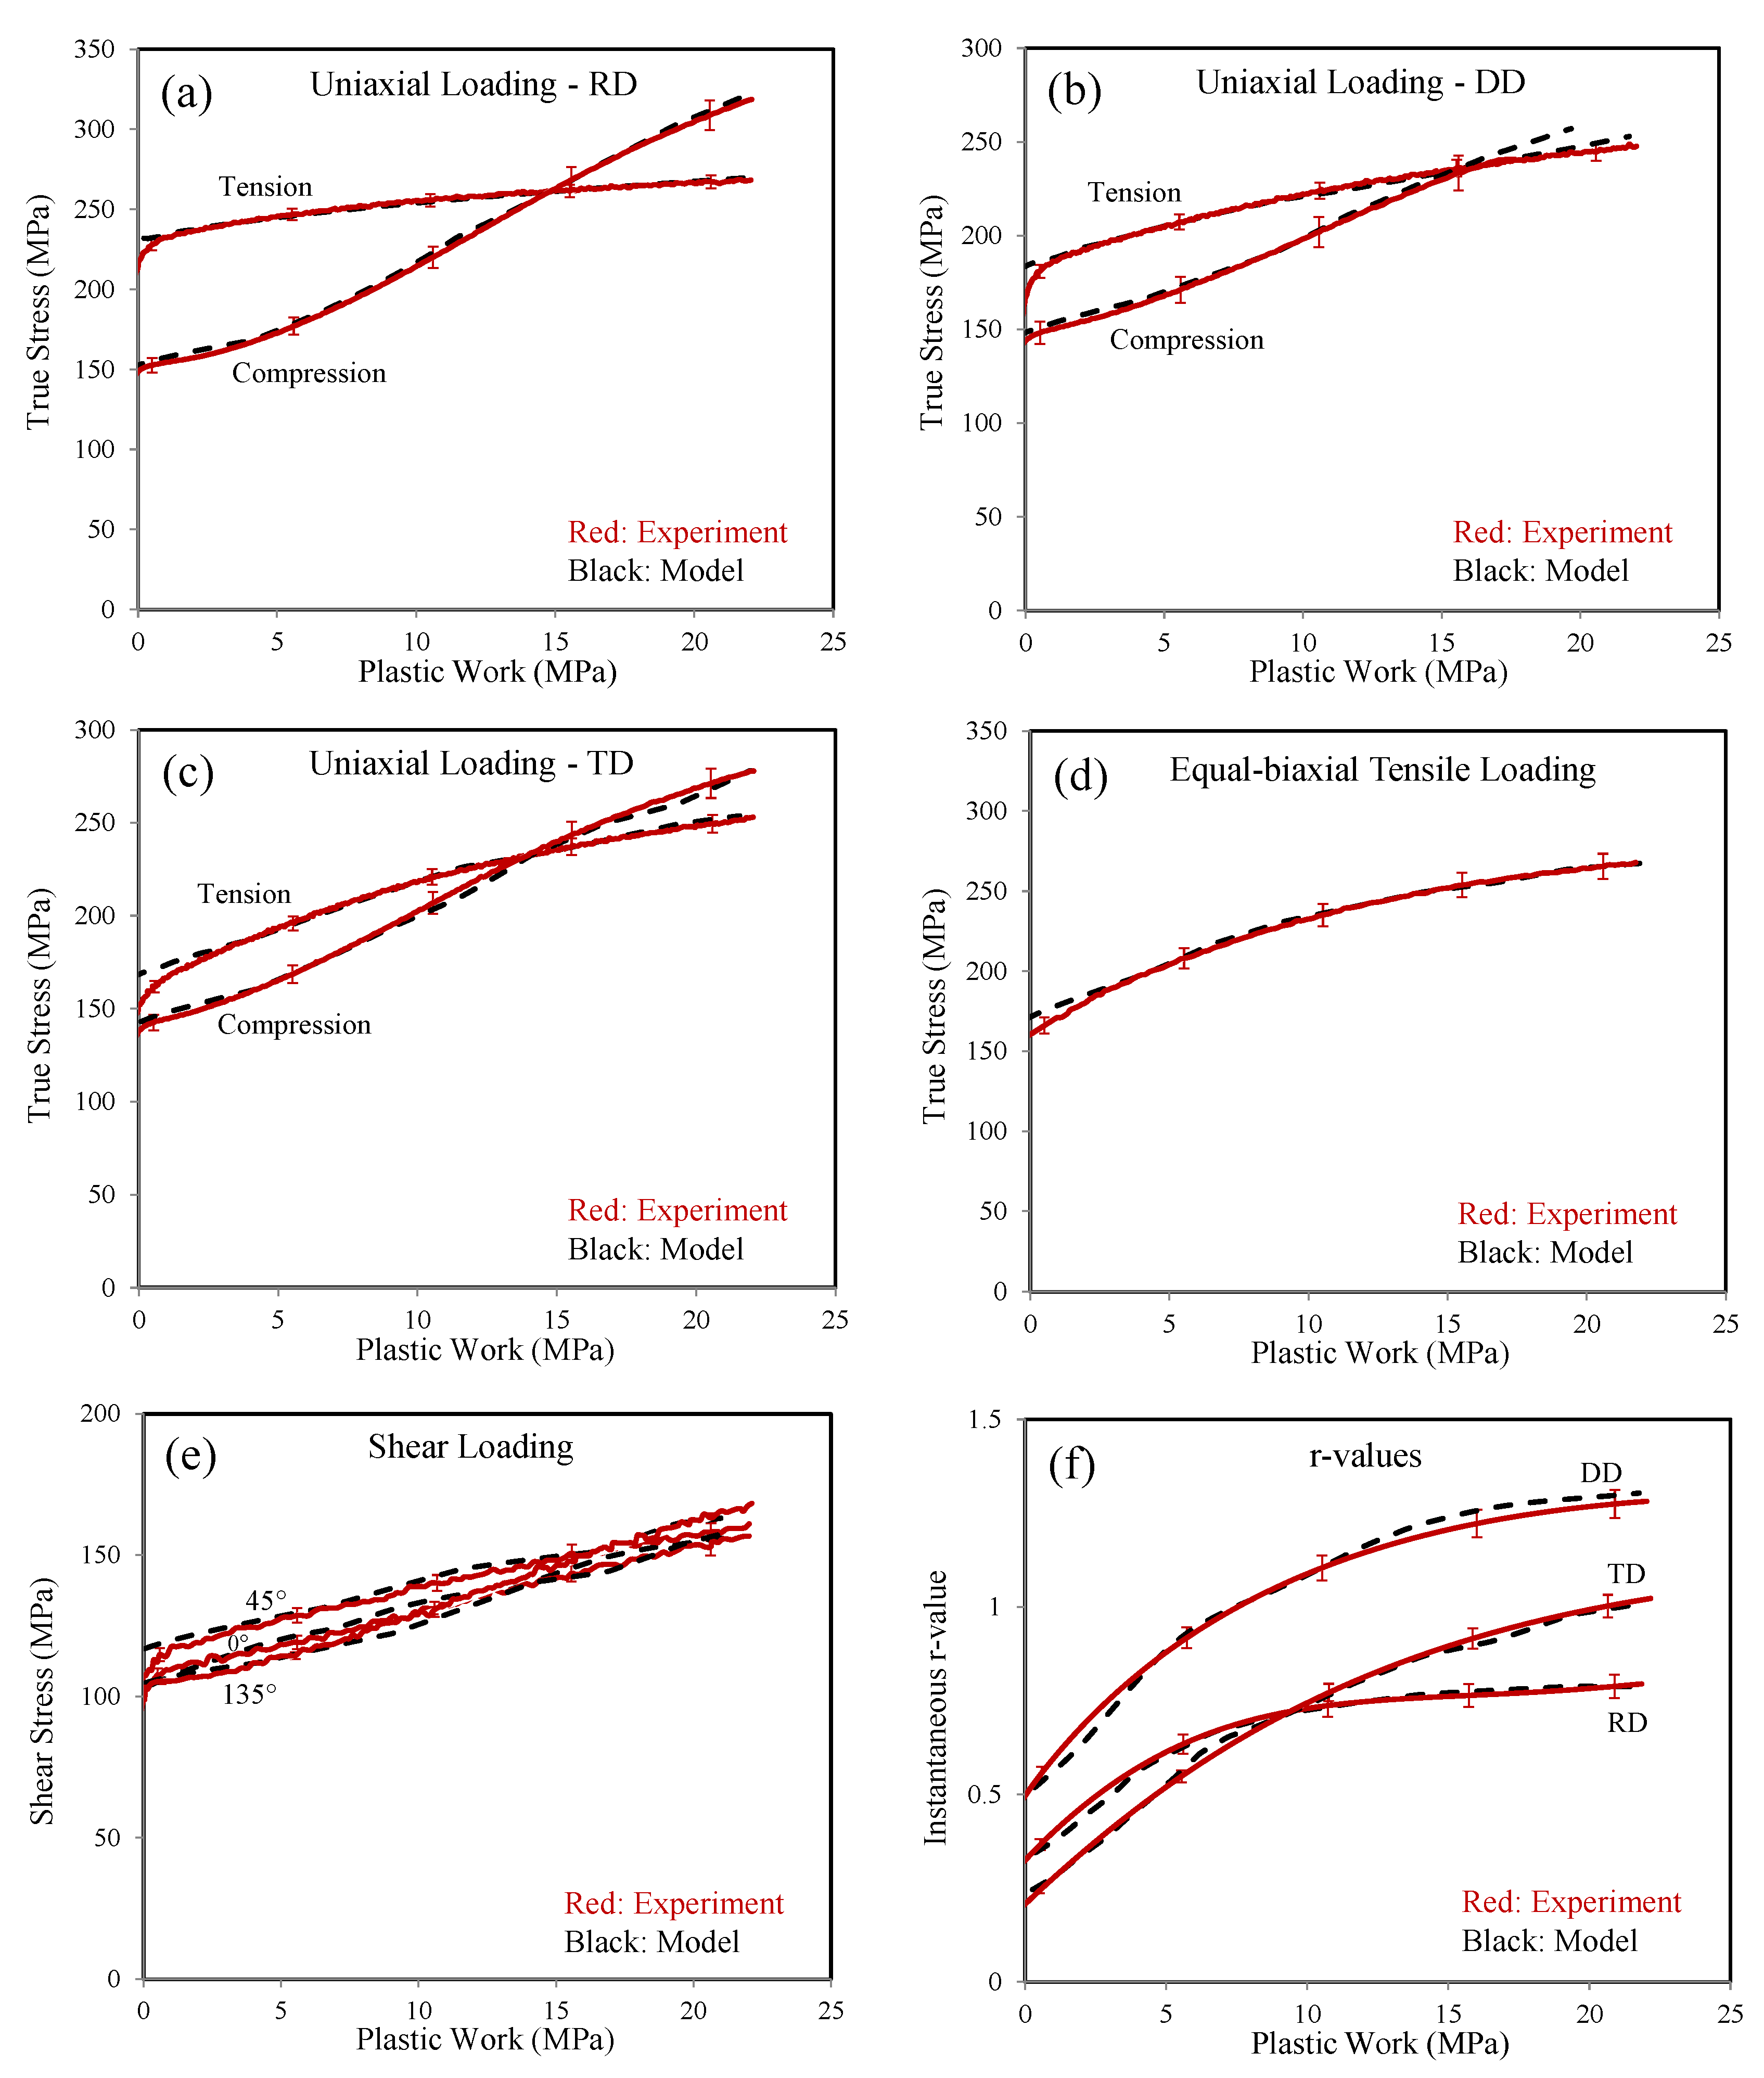
6.2. Evaluation of the Model Using Single-Element Simulations
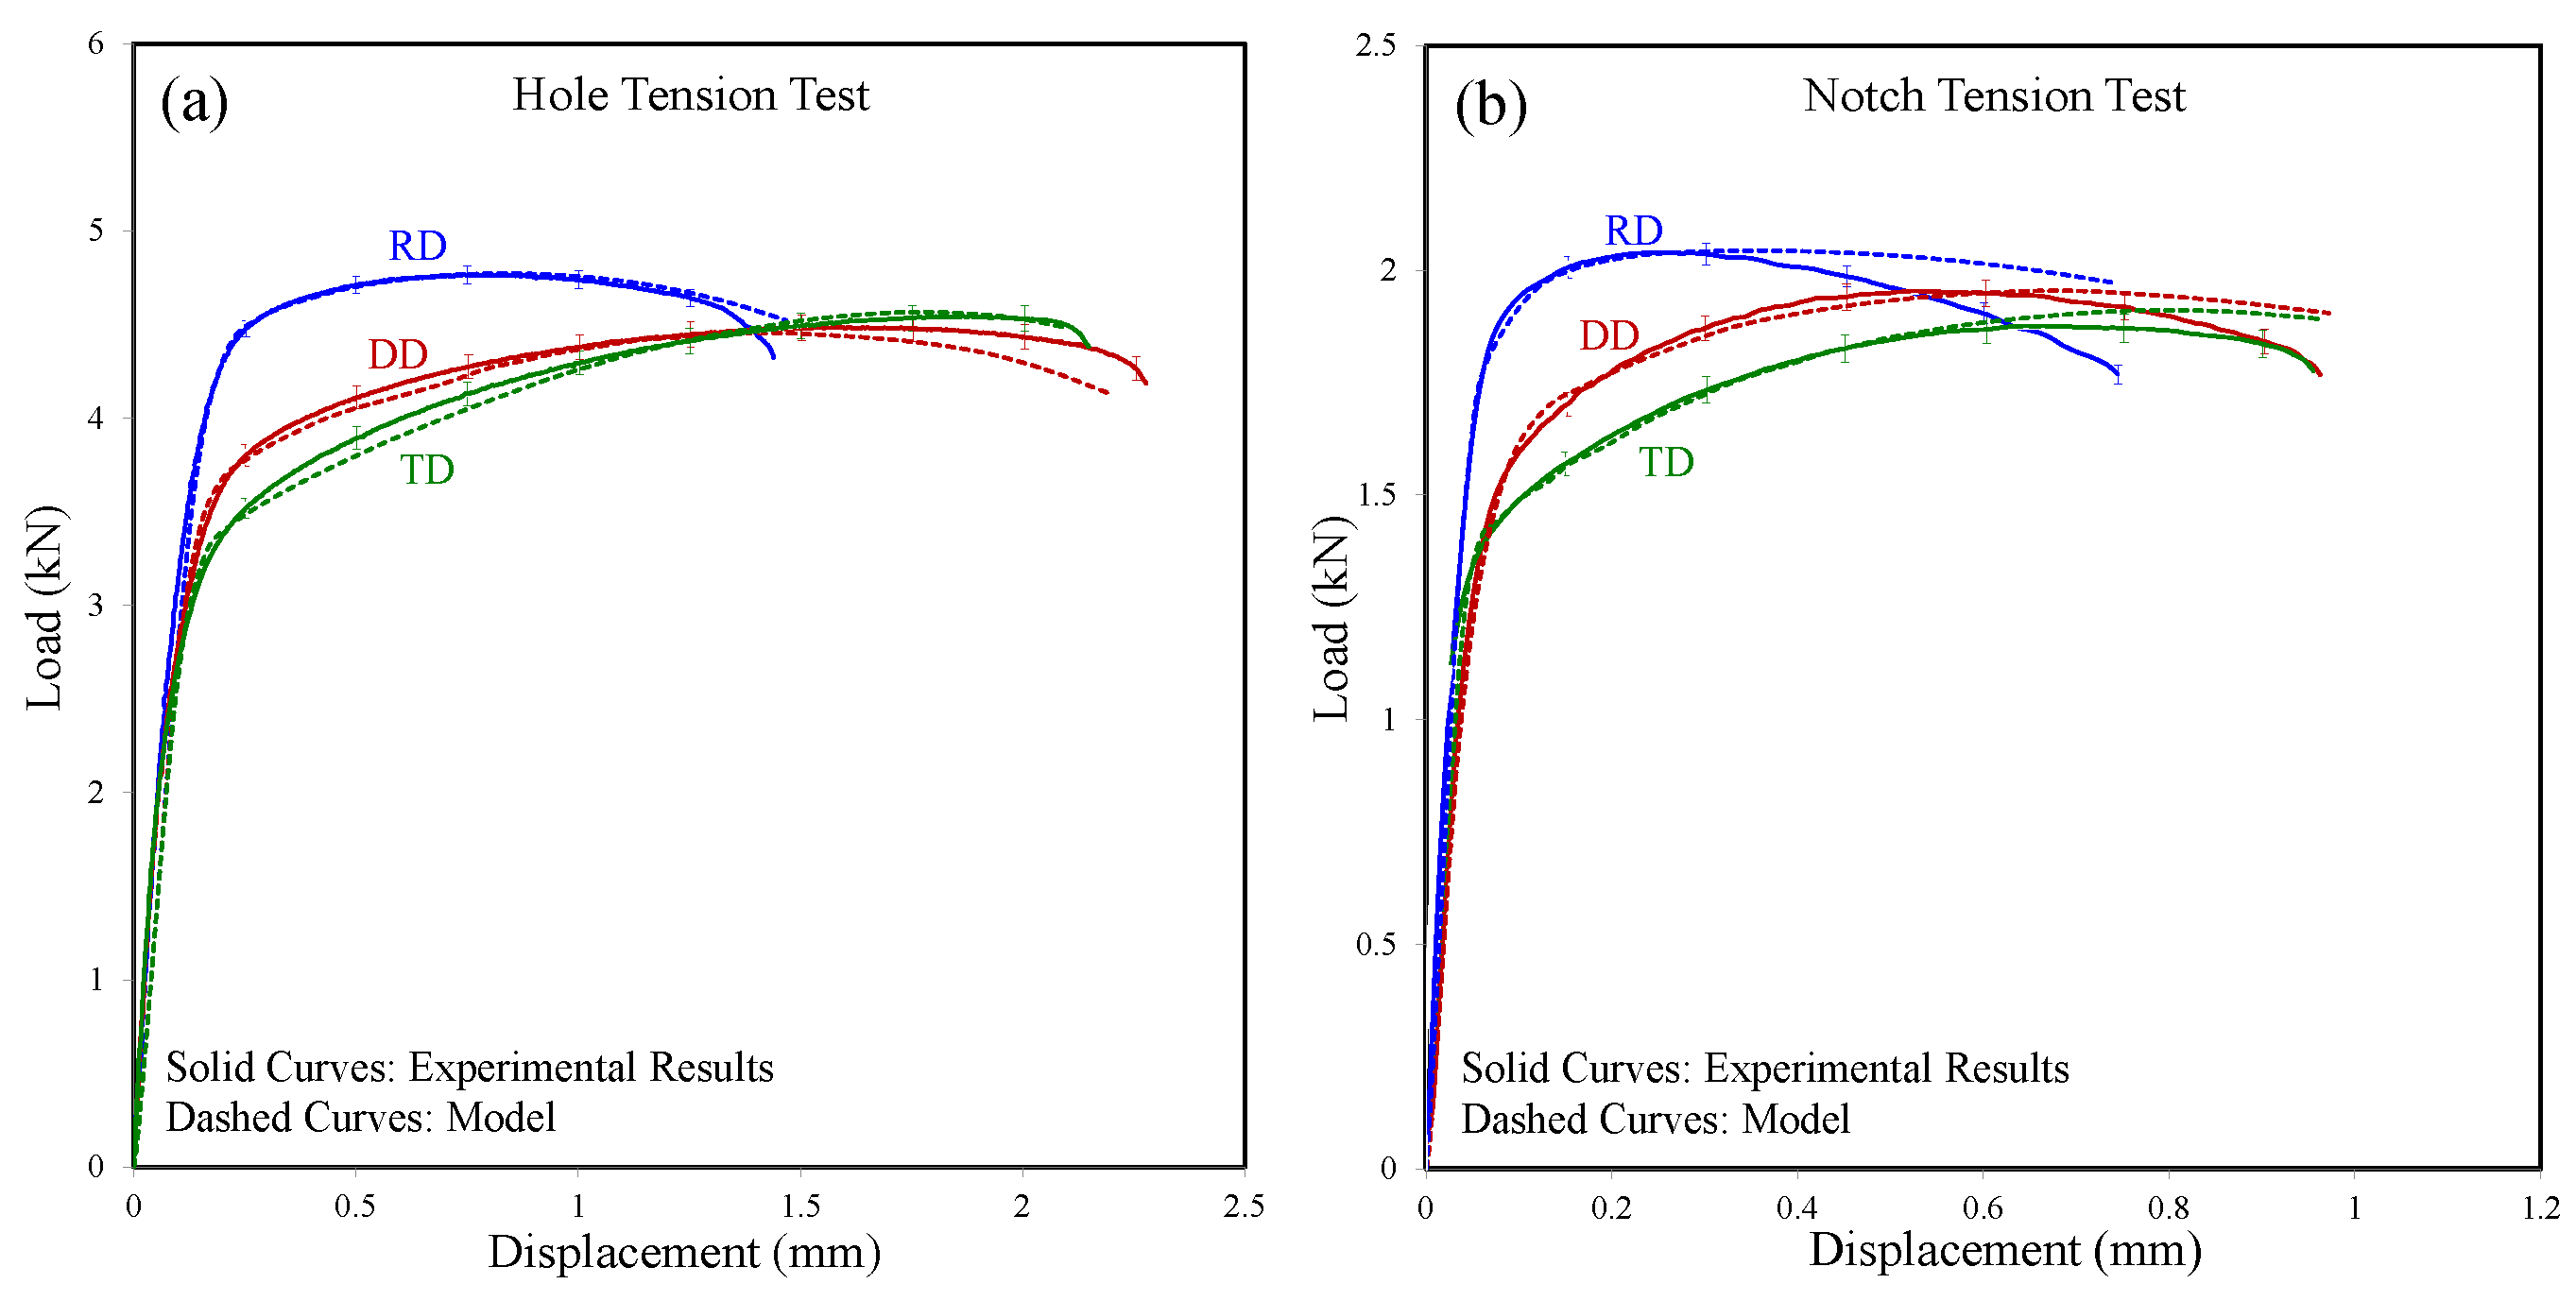
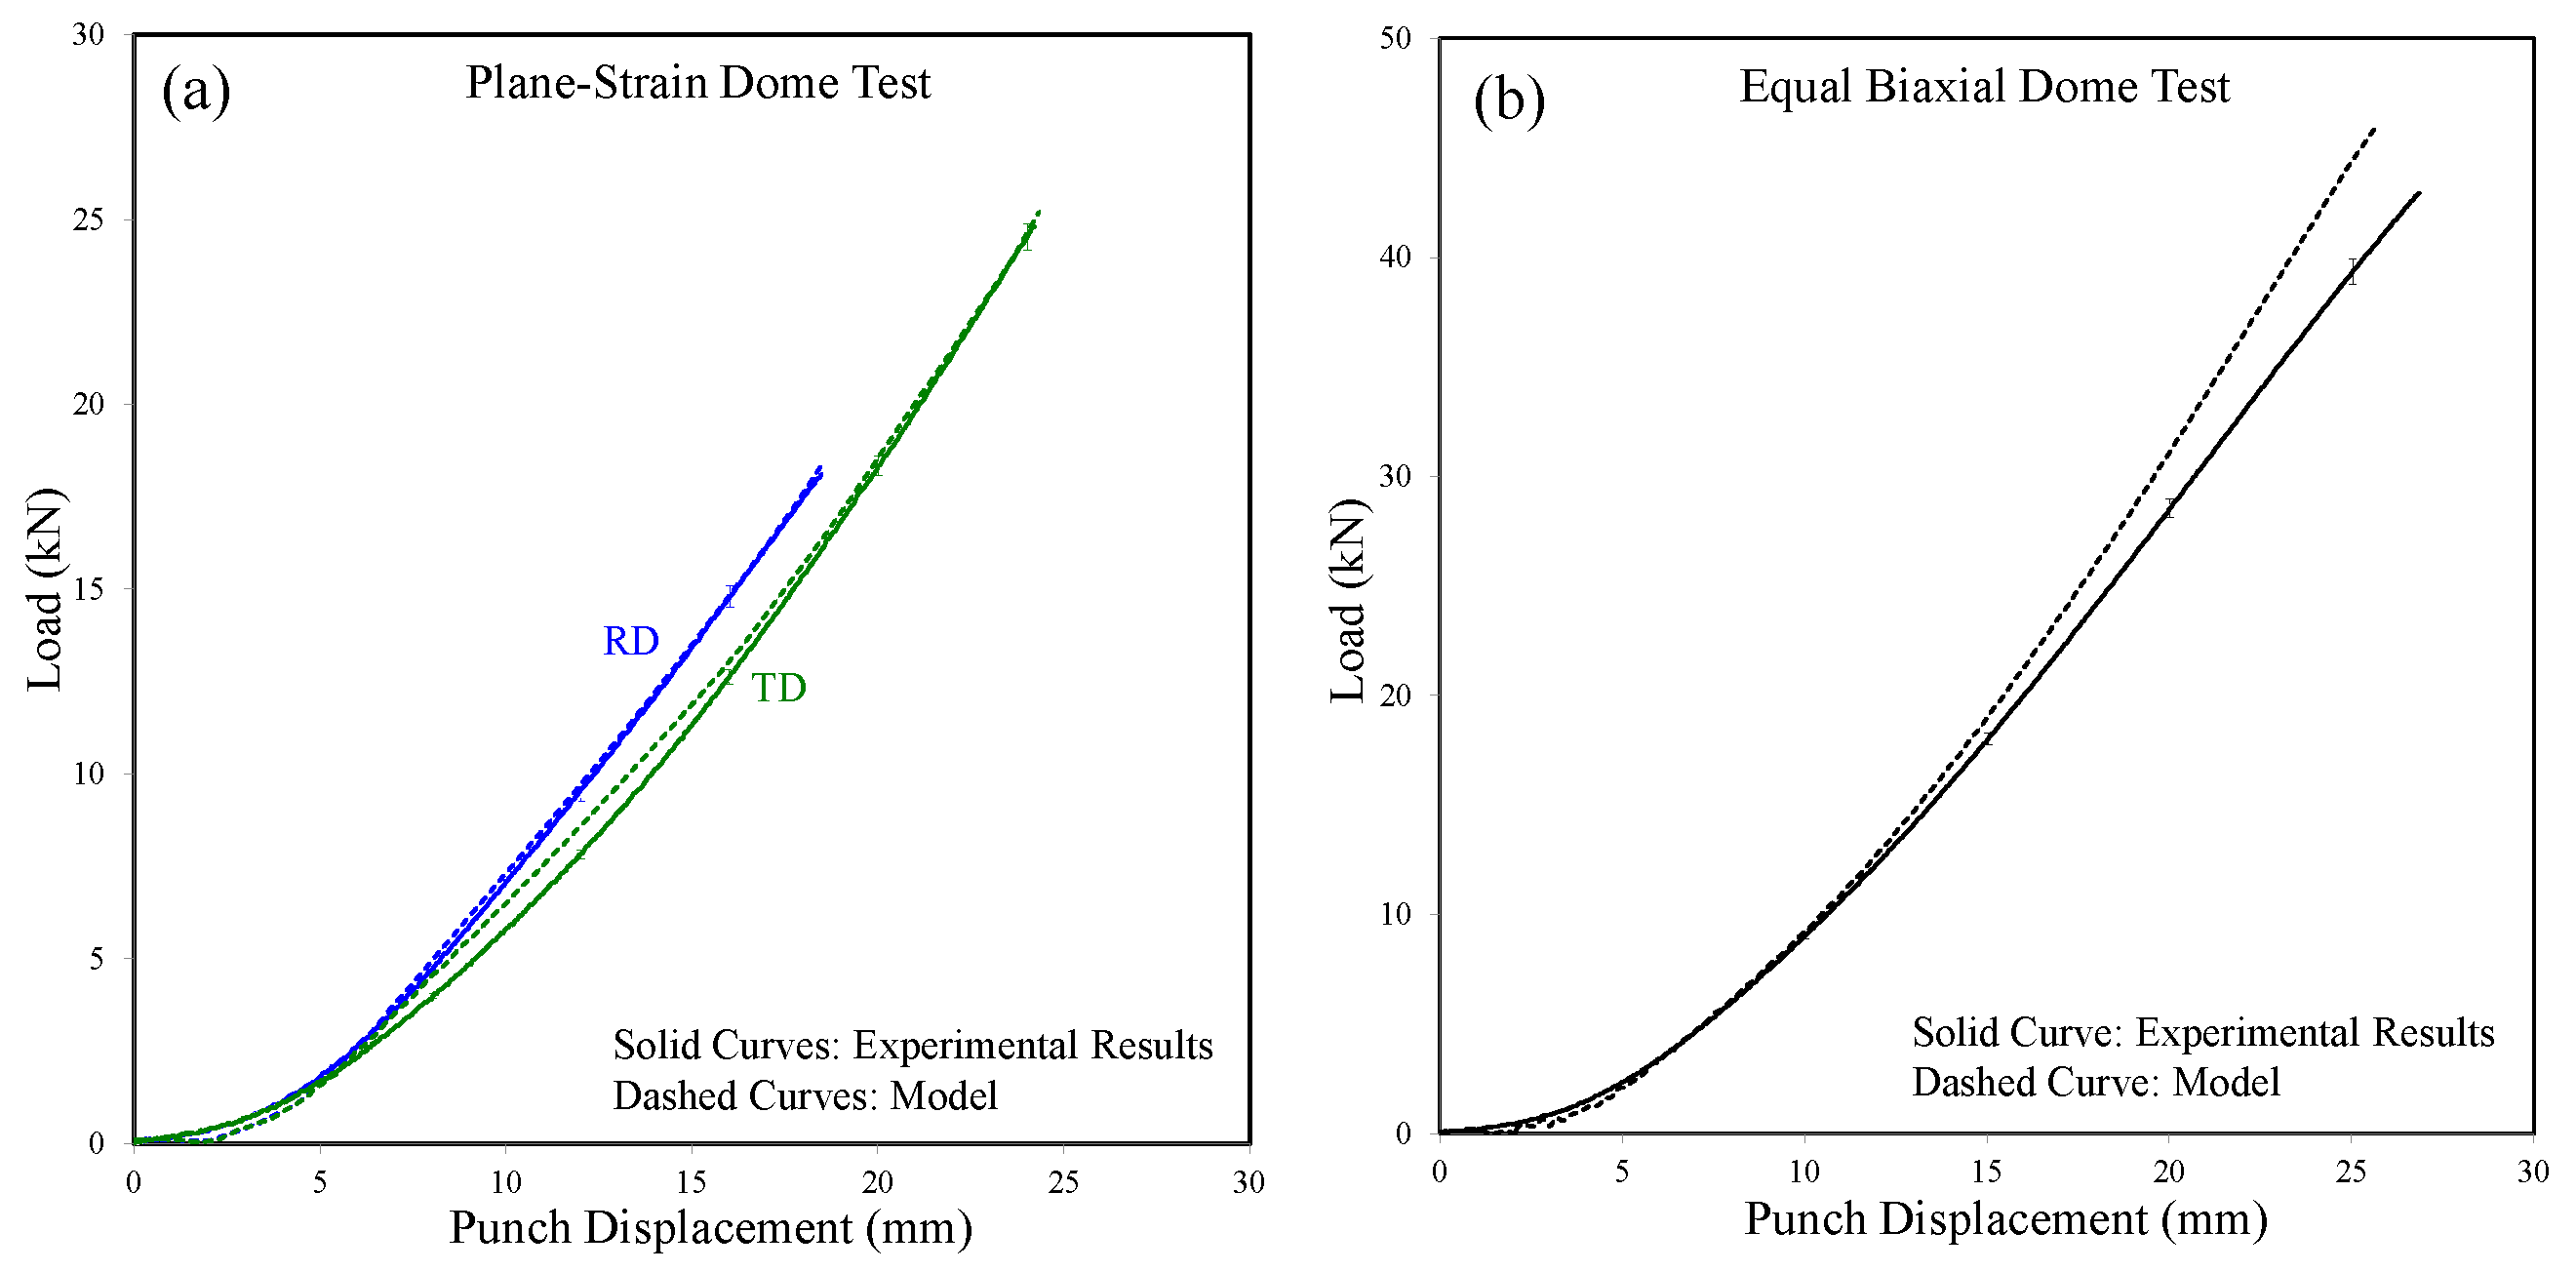
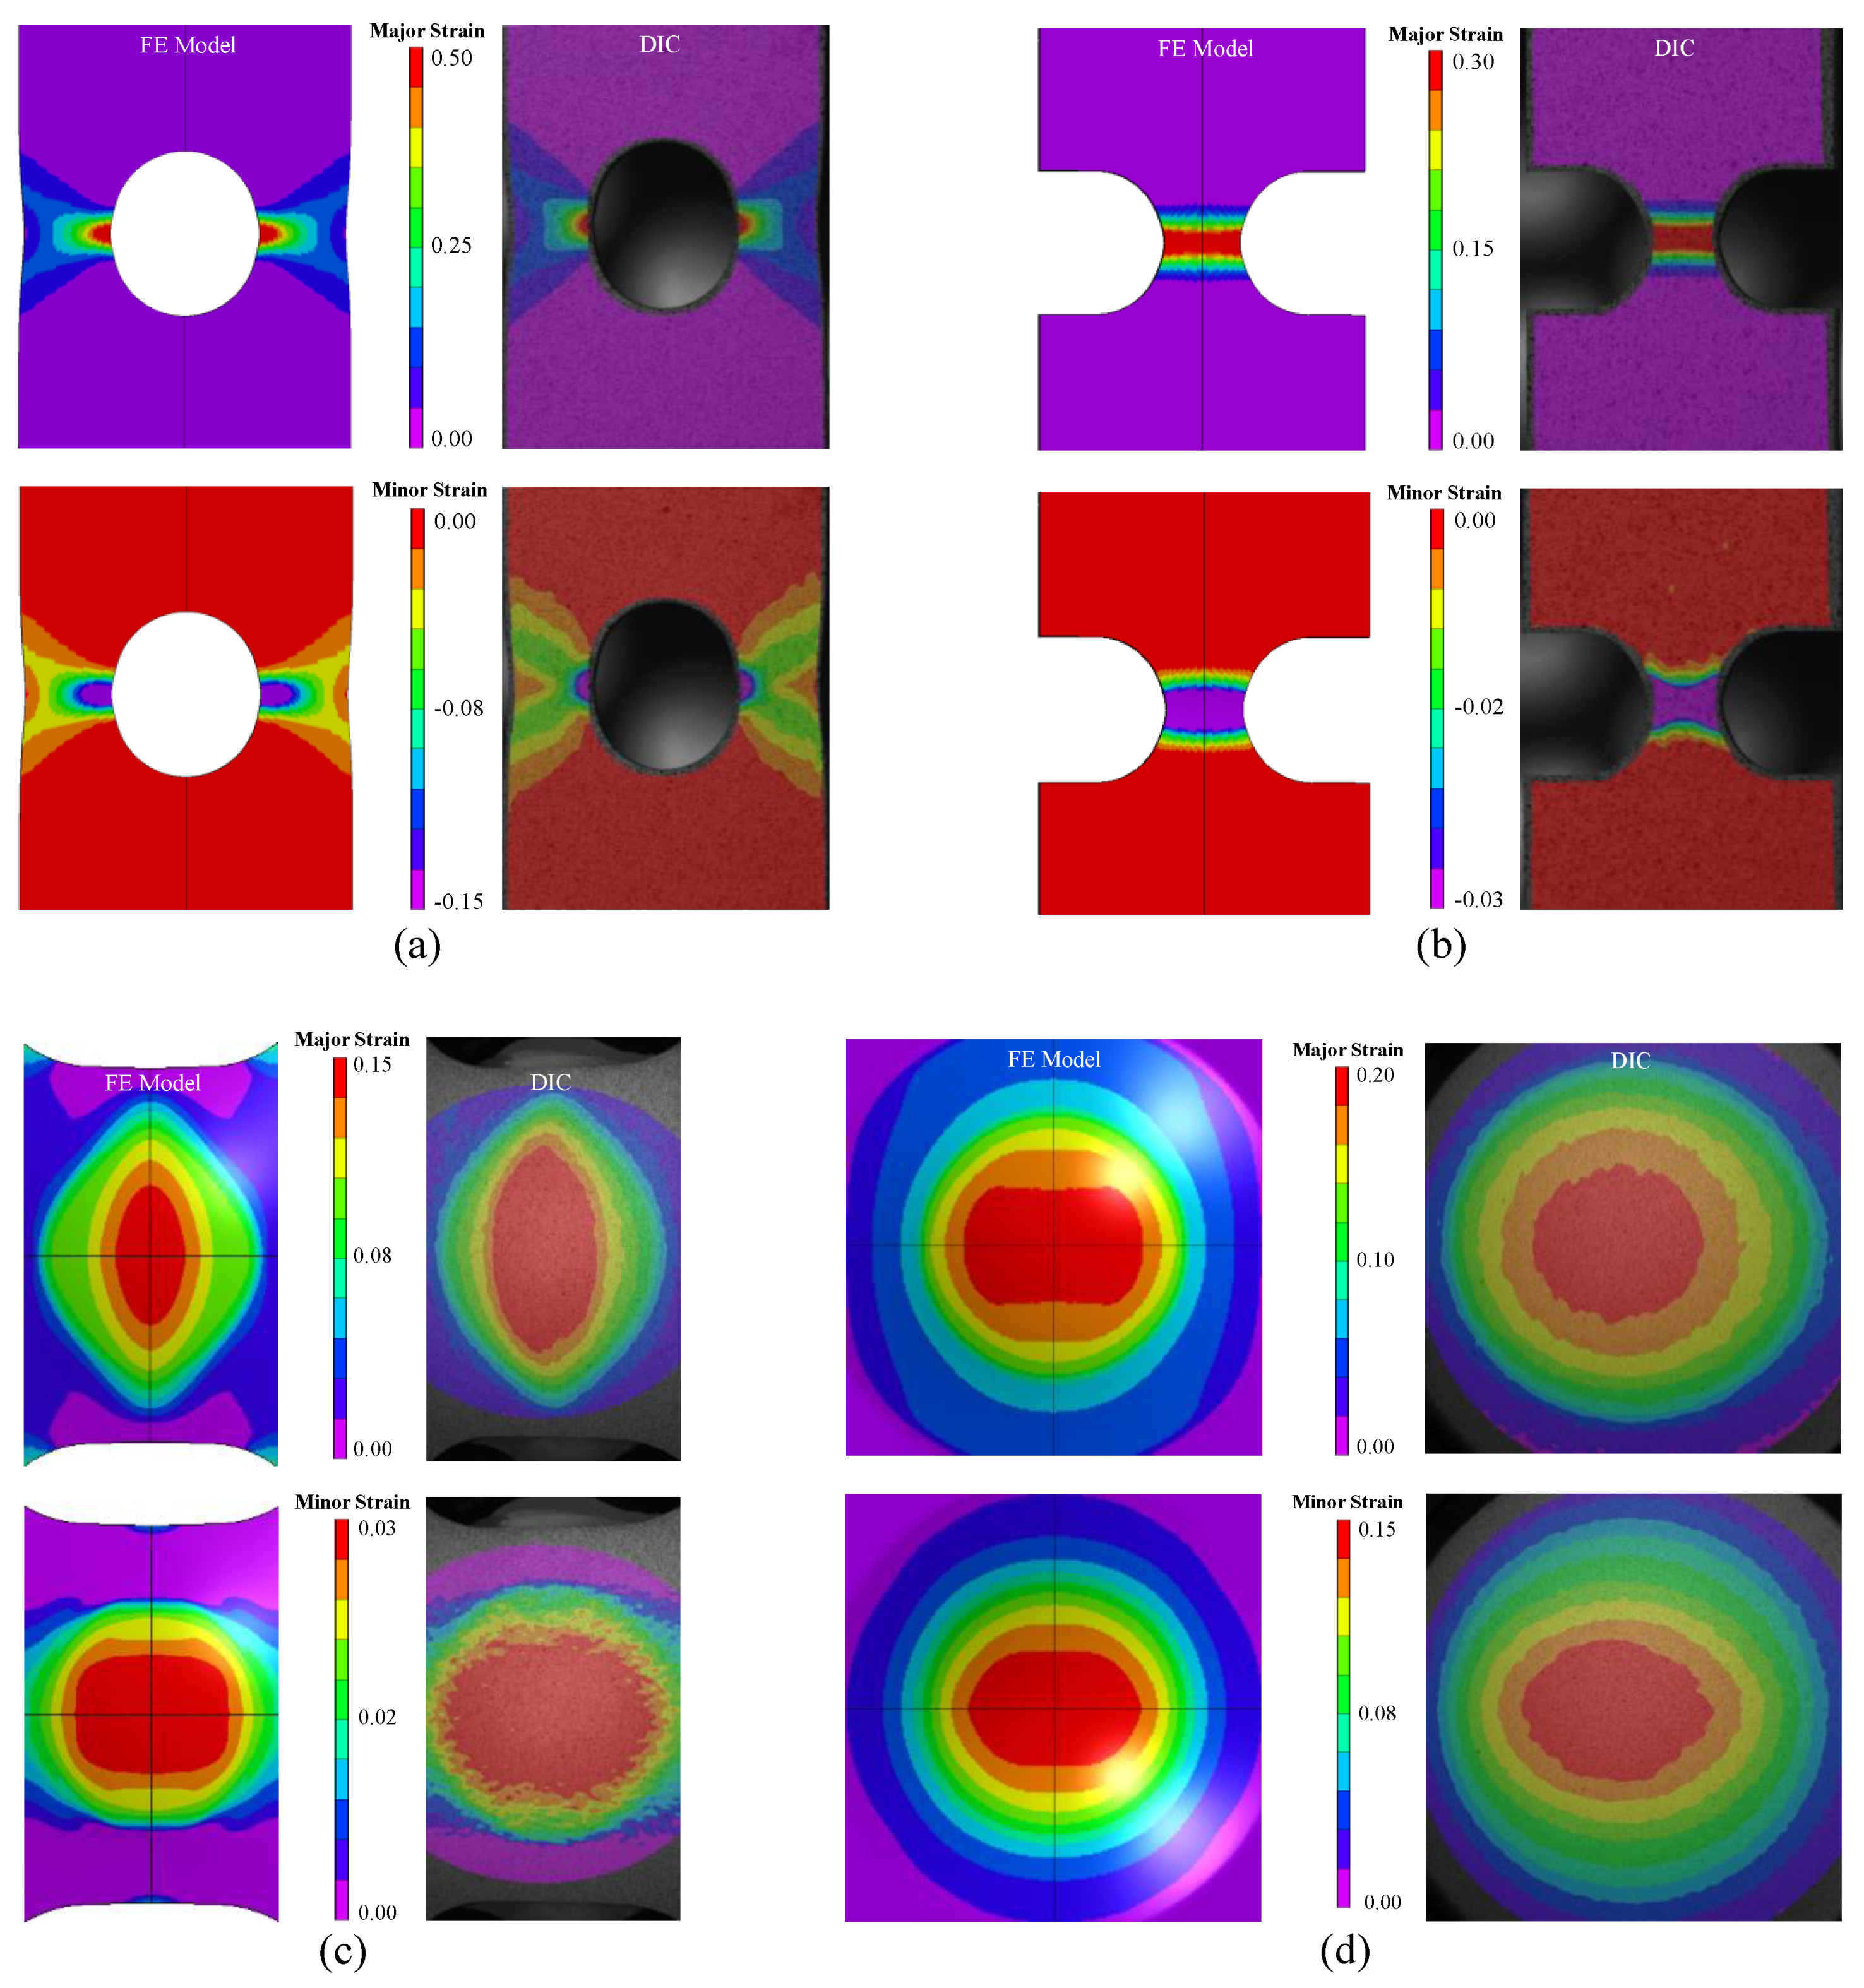
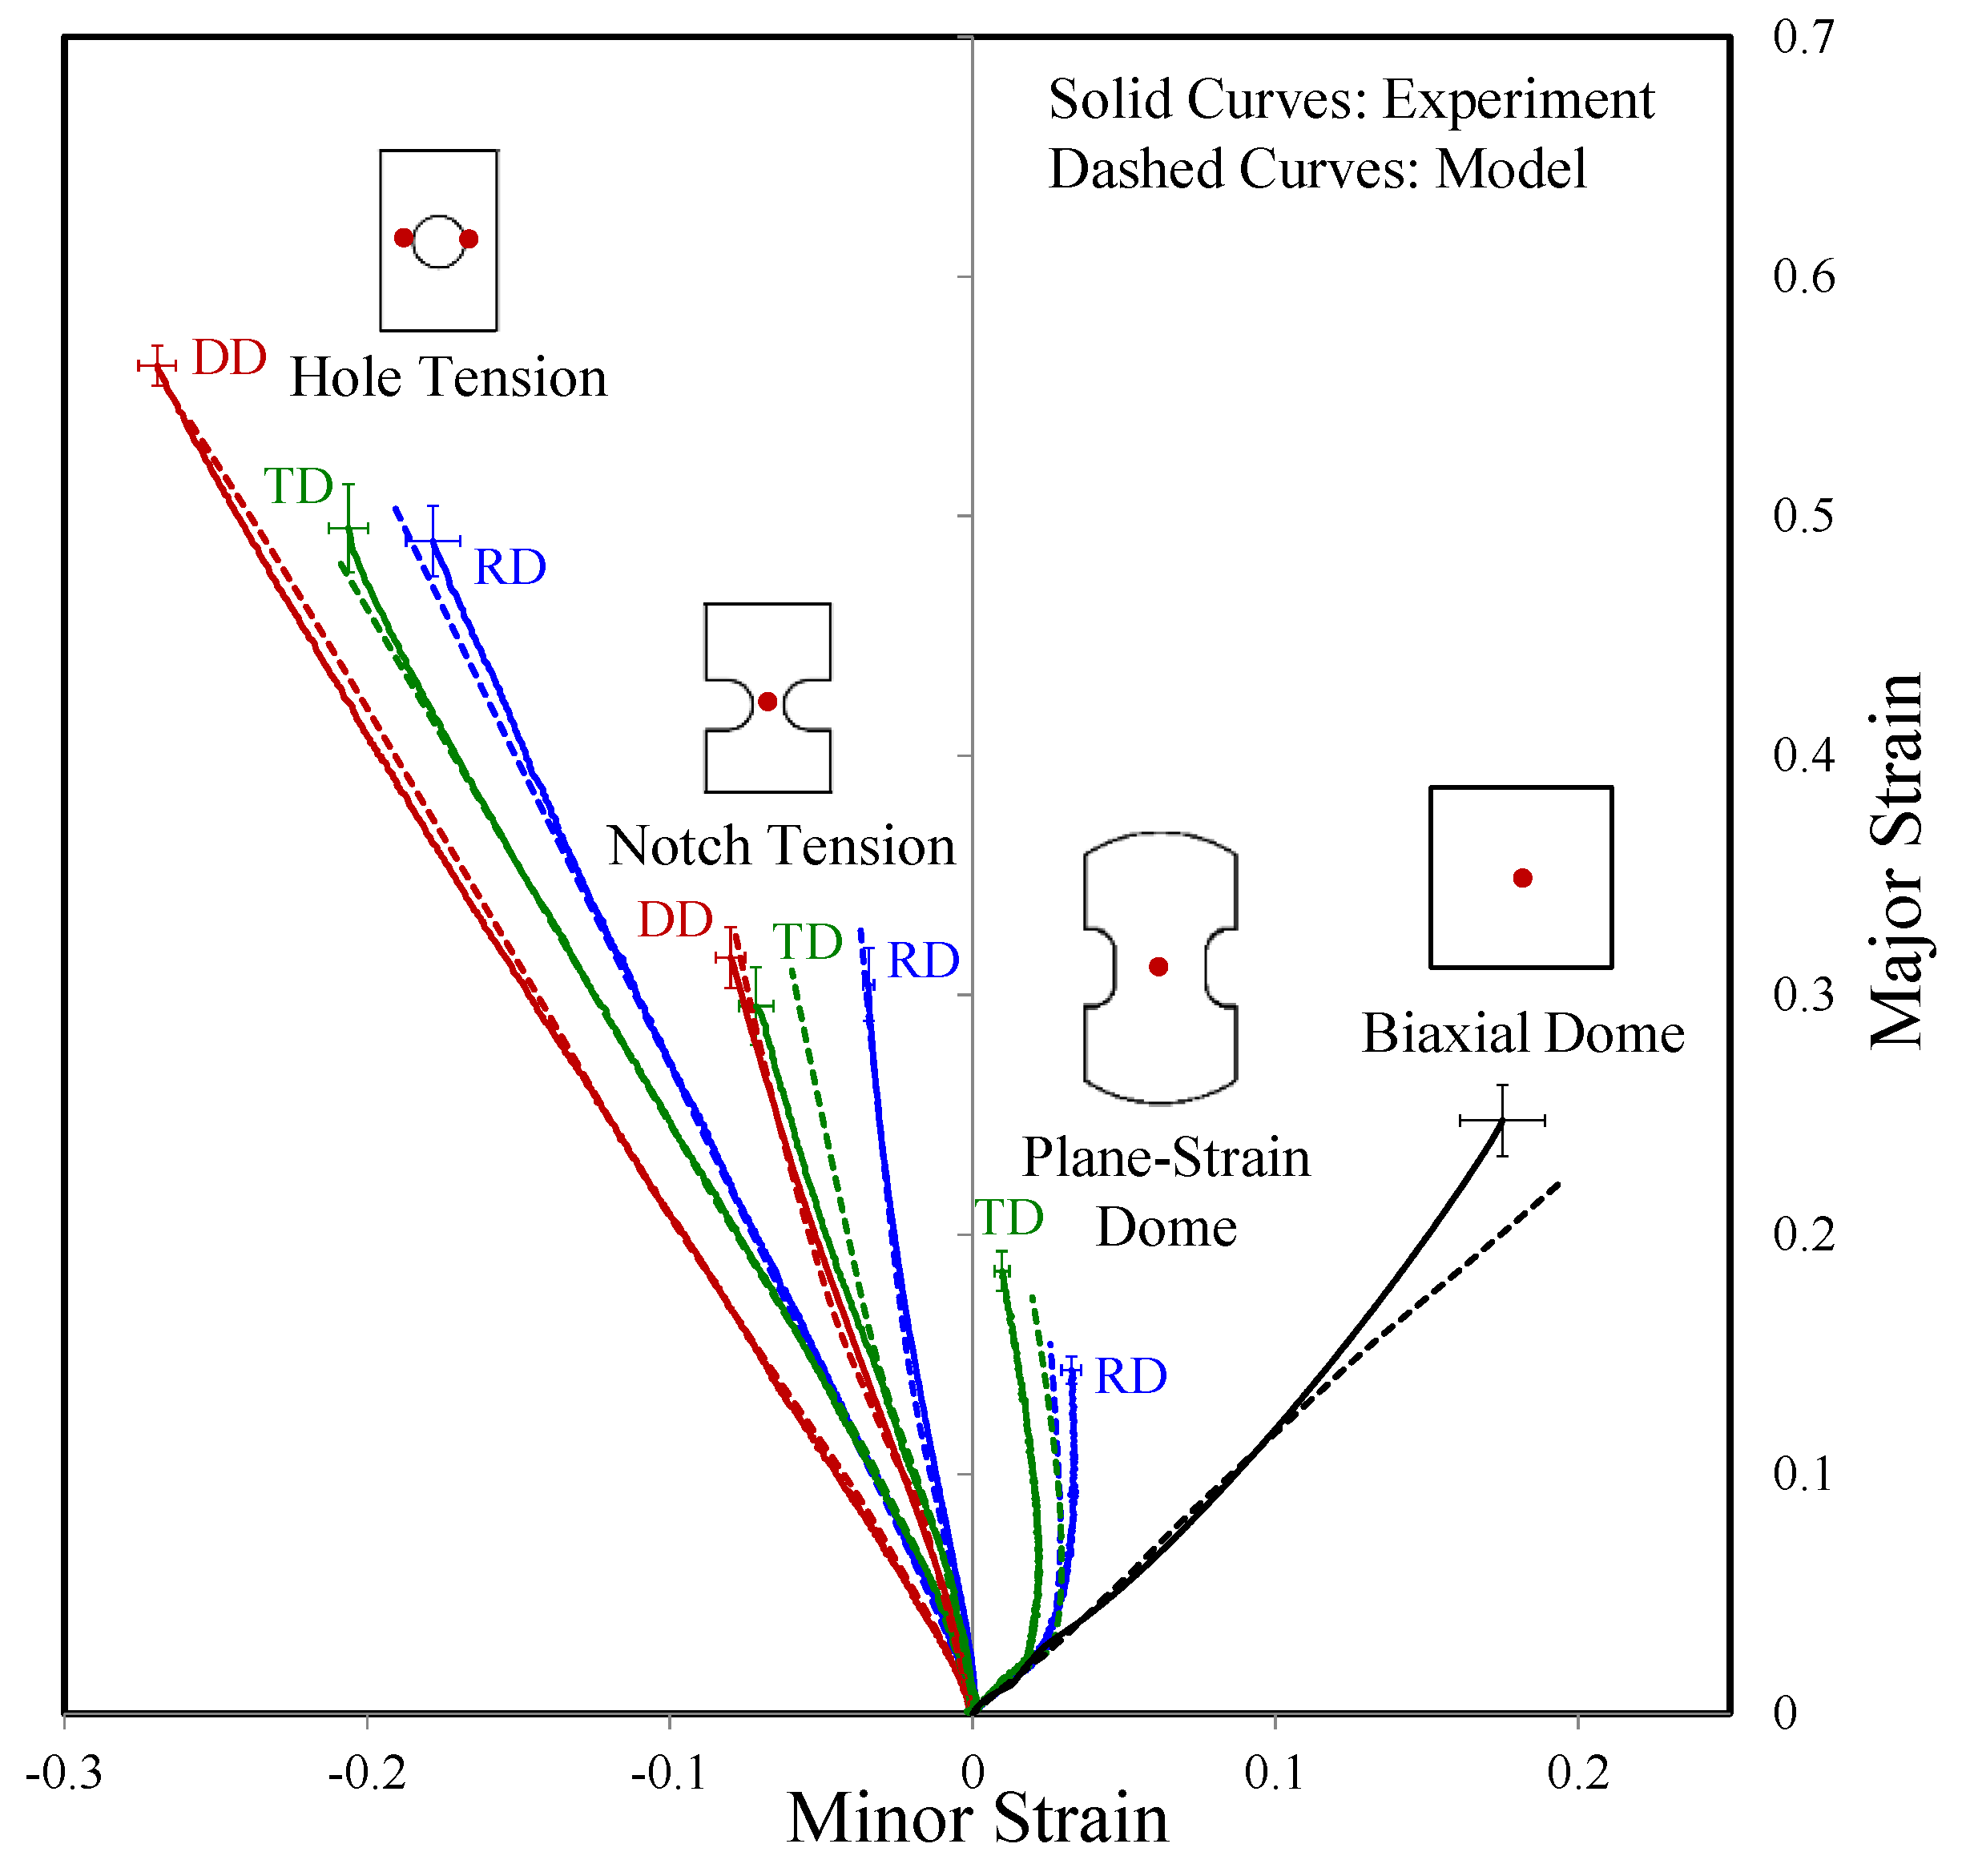
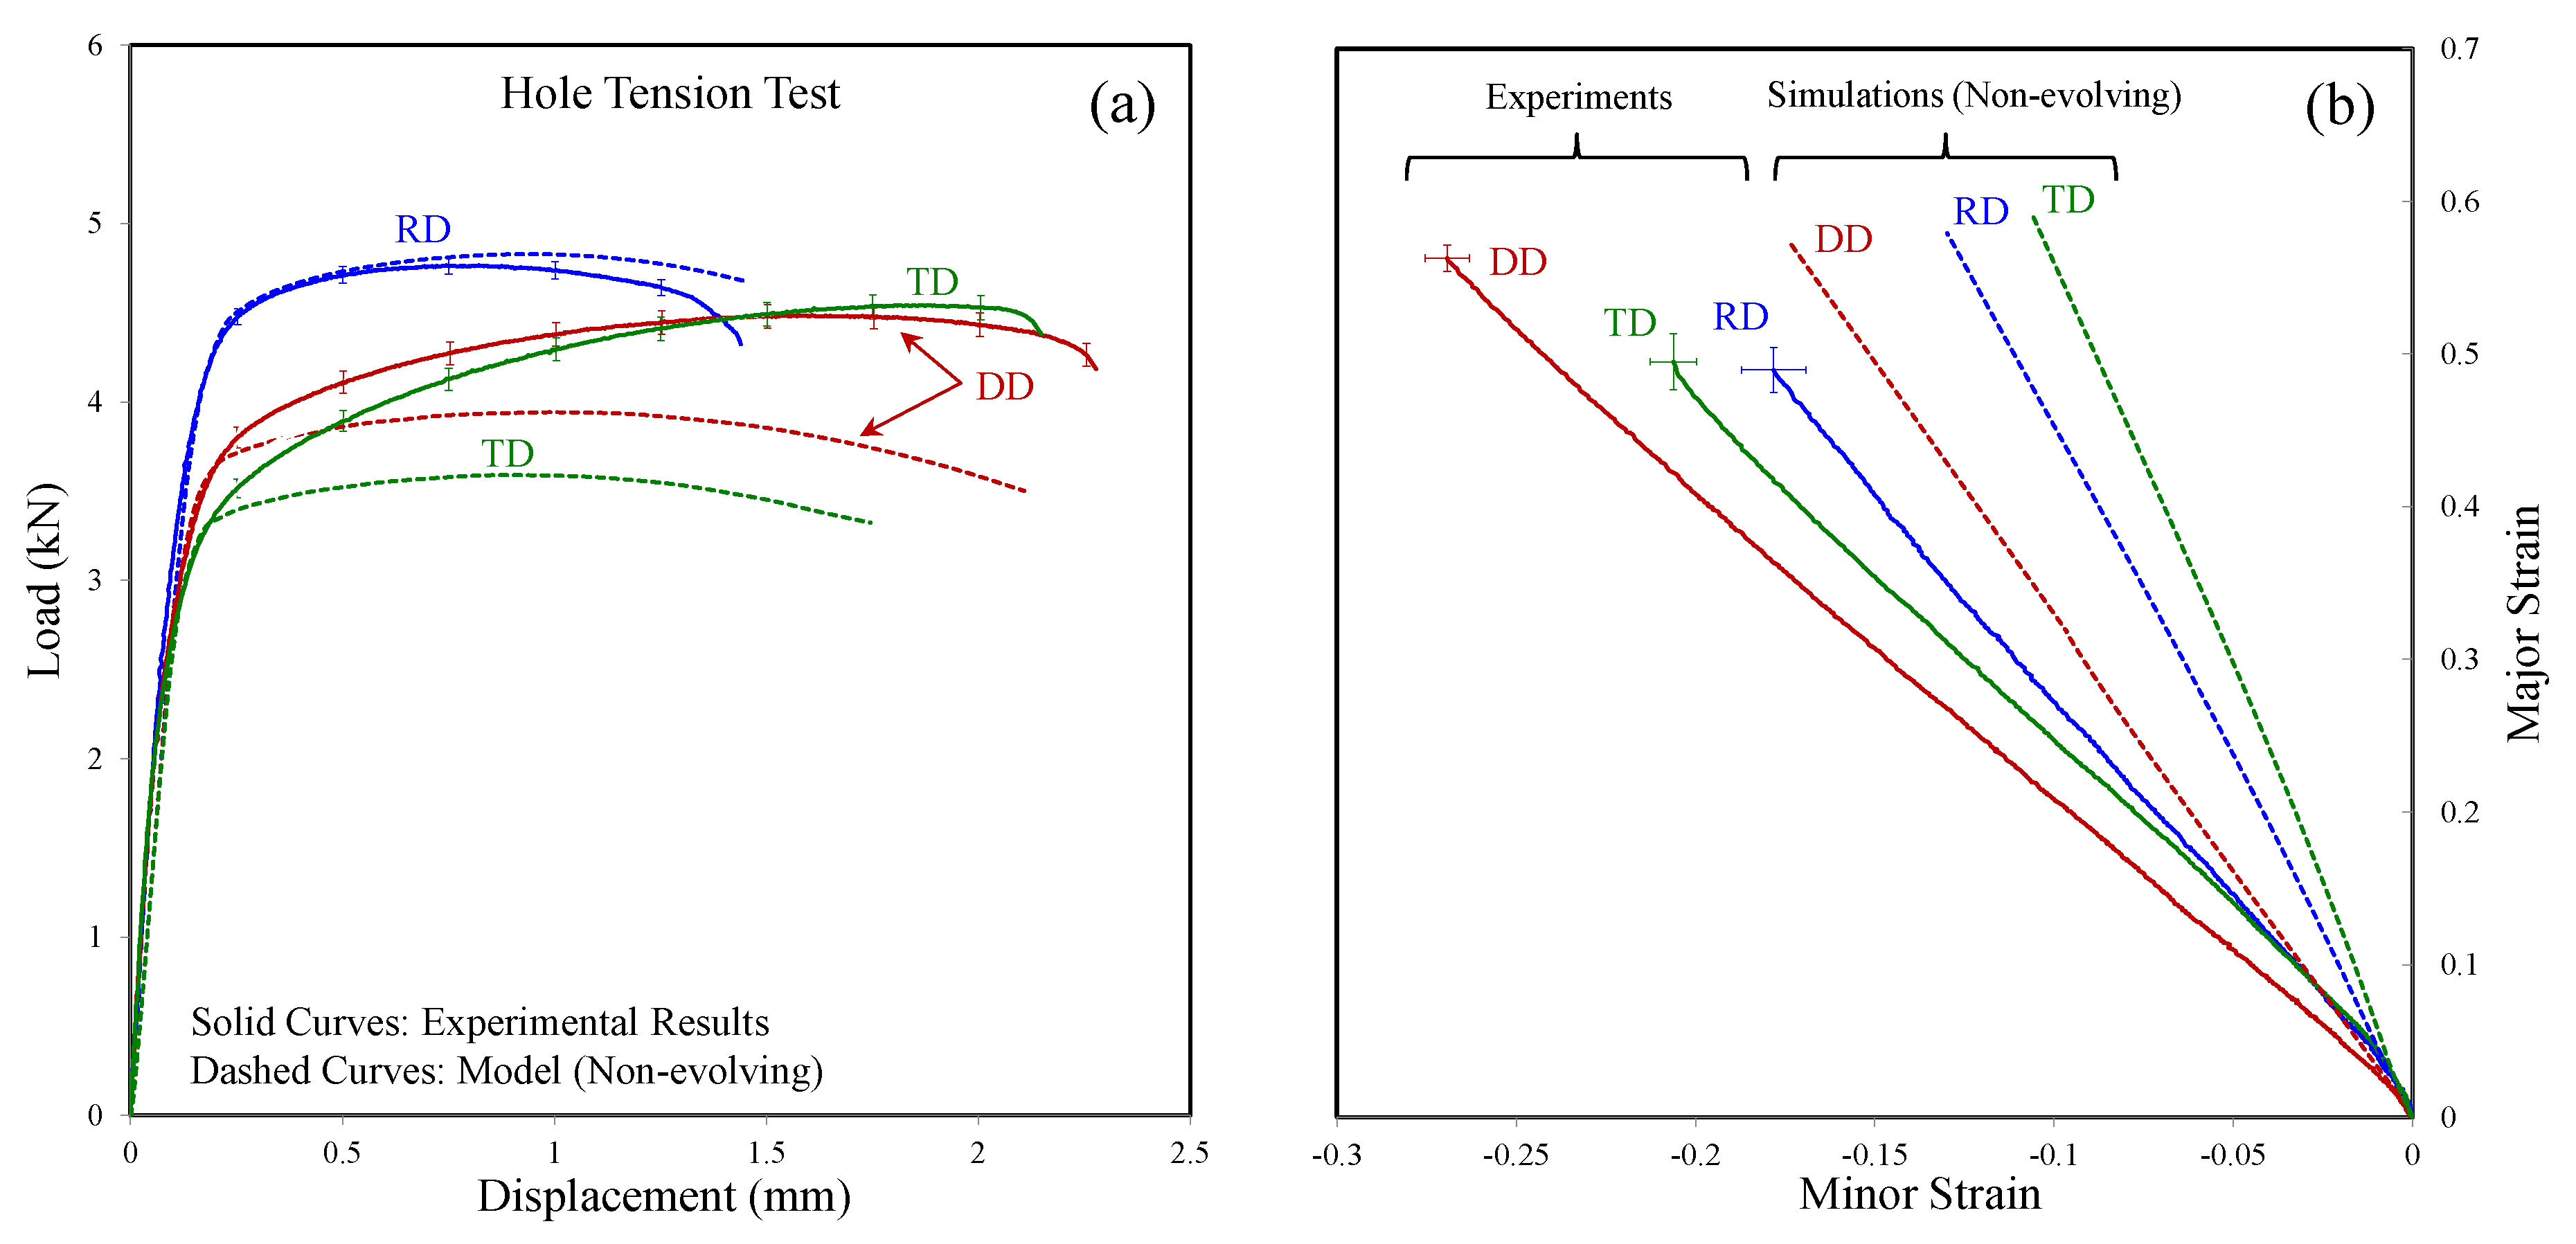
6.3. Evaluation of the Model for Full-Scale Simulation
Influence of Evolving Anisotropy on the Predicted Structural Response
7. Discussion
- The proposed plasticity model was developed for proportional loading conditions and it was shown that the model performs well under these conditions; however, the performance of the model under severe non-proportional conditions has to be evaluated in future.
- Consideration of the evolution of anisotropy was shown to be critical for global response and local strain/stress histories. A limitation of the approach is that the evolving anisotropy is restricted to the onset of necking at relatively low strain levels after which the anisotropy evolution was assumed to saturate. New experimental techniques that can suppress necking are required to characterize and expose the behavior of the material at larger strains under proportional conditions.
- The work hardening rate under equal-biaxial tension was obtained using the through-thickness compression test and should be revisited by performing cruciform or bulge tests. Re-calibrating the model with the results of these alternative tests might improve its accuracy under biaxial-dominant states such as in the equal-biaxial Nakazima dome test.
- This research was focused on the room temperature behavior of ZEK100-O under quasi-static conditions. Forming operations of magnesium alloys may also be performed at elevated temperatures and strain rates but the severity of anisotropy and asymmetry of the material is reduced by increasing the temperature [68,69], thus it is expected that the present modelling framework will perform well at elevated temperatures. However, this needs further investigations that will be considered in future work.
8. Conclusions
Author Contributions
Acknowledgments
Conflicts of Interest
References
- Zarandi, F.; Yue, S. Magnesium sheet; challenges and opportunities. In Magnesium Alloys—Design, Processing and Properties; Frank, C., Ed.; InTech: London, UK, 2011; ISBN 978-953-307-520-4. [Google Scholar]
- Tefashe, U.M.; Dauphin-Ducharme, P.; Danaie, M.; Mauzeroll, J. Localized corrosion behavior of AZ31B magnesium alloy with an electrodeposited poly (3,4-Ethylenedioxythiophene) coating. J. Electrochem. Soc. 2015, 162, 536–544. [Google Scholar] [CrossRef]
- Andrade, F.X.C.; Feucht, M.; Haufe, A.; Neukamm, F. An incremental stress state dependent damage model for ductile failure prediction. Int. J. Fract. 2016, 200, 127–150. [Google Scholar] [CrossRef]
- Barlat, F.; Lian, K. Plastic behavior and stretchability of sheet metals. Part I: A yield function for orthotropic sheets under plane stress conditions. Int. J. Plast. 1989, 5, 51–66. [Google Scholar] [CrossRef]
- Barlat, F.; Lege, D.J.; Brem, J.C. A 6-component yield function for anisotropic materials. Int. J. Plast. 1991, 7, 693–712. [Google Scholar] [CrossRef]
- Barlat, F.; Maeda, Y.; Chung, K.; Yanagawa, M.; Brem, J.C.; Hayashida, Y.; Lege, D.J.; Matsui, K.; Murtha, S.J.; Hattori, S.; et al. Yield function development for aluminum alloy sheets. J. Mech. Phys. Solids 1997, 45, 1727–1763. [Google Scholar] [CrossRef]
- Barlat, F.; Brem, J.C.; Yoon, J.W.; Chung, K.; Dick, R.E.; Lege, D.J.; Pourboghrat, F.; Choi, S.H.; Chu, E. Plane stress yield function for aluminum alloy sheets—Part I: Theory. Int. J. Plast. 2003, 21, 1009–1039. [Google Scholar] [CrossRef]
- Barlat, F.; Aretz, H.; Yoon, J.W.; Karabin, M.E.; Brem, J.C.; Dick, R.E. Linear transformation-based anisotropic yield functions. Int. J. Plast. 2005, 21, 1009–1039. [Google Scholar] [CrossRef]
- Kurukuri, S.; Worswick, M.J.; Bardelcik, A.; Mishra, R.K.; Carter, J.T. Constitutive behavior of commercial grade ZEK100 magnesium alloy sheet over a wide range of strain rates. Metall. Mater. Trans. A 2014, 45, 3321–3337. [Google Scholar] [CrossRef]
- Kurukuri, S.; Worswick, M.J.; Ghaffari Tari, D.; Mishra, R.K.; Carter, J.T. Rare-sensitivity and tension-compression asymmetry in AZ31B magnesium alloy sheet. Philos. Trans. R. Soc. A 2014, 372, 20130216. [Google Scholar] [CrossRef]
- Ghaffari Tari, D.; Worswick, M.J.; Ali, U.; Gharghouri, M.A. Mechanical response of AZ31B magnesium alloy: Experimental characterization and material modeling considering proportional loading at room temperature. Int. J. Plast. 2014, 55, 247–267. [Google Scholar] [CrossRef]
- Abedini, A.; Butcher, C.; Nemcko, M.J.; Kurukuri, S.; Worswick, M.J. Constitutive characterization of a rare-earth magnesium alloy sheet (ZEK100-O) in shear loading: Studies of anisotropy and rate sensitivity. Int. J. Mech. Sci. 2017, 128–129, 54–69. [Google Scholar] [CrossRef]
- Habib, S.A.; Khan, A.S.; Gnaupel-Herold, T.; Lloyd, J.T.; Schoenfeld, S.E. Anisotropy, tension-compression asymmetry and texture evolution of a rare-earth-containing magnesium alloy sheet, ZEK100, at different strain rates and temperatures: Experiments and modeling. Int. J. Plast. 2017, 95, 163–190. [Google Scholar] [CrossRef]
- Cazacu, O.; Barlat, F. A criterion for description of anisotropy and yield differential effects in pressure-insensitive metals. Int. J. Plast. 2004, 20, 2027–2045. [Google Scholar] [CrossRef]
- Drucker, D.C. Relation of experiments to mathematical theories of plasticity. J. Appl. Mech. 1949, 16, 349–357. [Google Scholar]
- Cazacu, O.; Plunkett, B.; Barlat, F. Orthotropic yield criterion for hexagonal closed packed metals. Int. J. Plast. 2006, 22, 1171–1194. [Google Scholar] [CrossRef]
- Plunkett, B.; Cazacu, O.; Barlat, F. Orthotropic yield criteria for description of the anisotropy in tension and compression of sheet metals. Int. J. Plast. 2008, 24, 847–866. [Google Scholar] [CrossRef]
- Nebebe Mekonen, M.; Steglich, D.; Bohlen, J.; Letzig, D.; Mosler, J. Mechanical characterization and constitutive modeling of Mg alloy sheets. Mater. Sci. Eng. A 2012, 540, 174–186. [Google Scholar] [CrossRef]
- Yoon, J.; Cazacu, O.; Mishra, R.K. Constitutive modeling of AZ31 sheet alloy with application to axial crushing. Mater. Sci. Eng. A 2013, 565, 203–212. [Google Scholar] [CrossRef]
- Chandola, N.; Lebensohn, R.; Cazacu, O.; Revil-Baudard, B.; Mishra, R.K.; Barlat, F. Combined effects of anisotropy and tension-compression asymmetry on the torsional response of AZ31 Mg. Int. J. Solids Struct. 2015, 58, 190–200. [Google Scholar] [CrossRef]
- Muhammad, W.; Brahme, A.P.; Kang, J.; Mishra, R.K.; Inal, K. An elasto-plastic constitutive model for evolving asymmetric/anisotropic hardening behavior of AZ31B and ZEK100 magnesium alloy sheets considering monotonic and reverse loading paths. Int. J. Plast. 2015, 70, 30–59. [Google Scholar] [CrossRef]
- Gilles, G.; Hammami, W.; Libertiaux, V.; Cazacu, O.; Yoon, J.H.; Kuwabara, T.; Habraken, A.M.; Duchene, L. Experimental characterization and elasto-plastic modeling of the quasi-static mechanical response of TA-6V at room temperature. Int. J. Solids Struct. 2011, 48, 1277–1289. [Google Scholar] [CrossRef]
- Tuninetti, V.; Gilles, G.; Milis, O.; Pardoen, T.; Habraken, A.M. Anisotropy and tension-compression asymmetry modeling of the room temperature plastic response of Ti-6Al-4V. Int. J. Plast. 2015, 67, 53–68. [Google Scholar] [CrossRef]
- Li, H.; Hu, X.; Yang, H.; Li, L. Anisotropic and asymmetric yielding and its distorted evolution: Modelling and applications. Int. J. Plast. 2016, 82, 127–158. [Google Scholar] [CrossRef]
- Revil-Baudard, B.; Cazacu, O.; Flater, P.; Chandola, N.; Alves, J.L. Unusual plastic deformation and damage features in titanium: Experimental tests and constitutive modelling. J. Mech. Phys. Solids 2016, 88, 100–122. [Google Scholar] [CrossRef]
- Chaboche, J.L. A review of some plasticity and viscoplasticity constitutive theories. Int. J. Plast. 2008, 24, 1642–1693. [Google Scholar] [CrossRef]
- Barlat, F.; Gracio, J.J.; Lee, M.; Rauch, E.F.; Vincze, G. An alternative to kinematic hardening in classical plasticity. Int. J. Plast. 2011, 27, 1309–1327. [Google Scholar] [CrossRef]
- Barlat, F.; Jeong, Y.; Ha, J.; Tome, C.; Lee, M.; Wen, W. Advances in constitutive modeling of plasticity for forming applications. Key Eng. Mater. 2017, 725, 3–14. [Google Scholar] [CrossRef]
- Steglich, D.; Tian, X.; Besson, J. Mechanism-based modelling of plastic deformation in magnesium alloys. Eur. J. Mech. A Solids 2016, 55, 289–303. [Google Scholar] [CrossRef]
- Kondori, B.; Madi, Y.; Besson, J.; Benzerga, A.A. Evolution of the 3D plastic anisotropy for HCP metals: Experiments and modeling. Int. J. Plast. 2018. [Google Scholar] [CrossRef]
- Bishop, J.F.W.; Hill, R. A theory of the plastic distortion of a polycrystalline aggregate under combined stresses. Philos. Mag. 1951, 42, 414–427. [Google Scholar] [CrossRef]
- Stoughton, T.B. A non-associated flow rule for sheet metal forming. Int. J. Plast. 2002, 18, 687–714. [Google Scholar] [CrossRef]
- Stoughton, T.B.; Yoon, J.W. Review of Drucker’s postulate and the issue of plastic instability in metal forming. Int. J. Plast. 2006, 22, 391–433. [Google Scholar] [CrossRef]
- Drucker, D.C. A definition of stable inelastic material. ASME J. Appl. Mech. 1959, 26, 101–106. [Google Scholar]
- Cvitanic, V.; Vlak, F.; Lozina, Z. A finite element formulation based on non-associated plasticity for sheet metal forming. Int. J. Plast. 2008, 24, 646–687. [Google Scholar] [CrossRef]
- Taherizadeh, A.; Green, D.E.; Ghaei, A.; Yoon, J.W. A non-associated constitutive model with mixed iso-kinematic hardening for finite element simulation of sheet metal forming. Int. J. Plast. 2010, 26, 288–309. [Google Scholar] [CrossRef]
- Park, T.; Chung, K. Non-associated flow rule with symmetric stiffness modulus for isotropic-kinematic hardening and its application for earing in circular cup drawing. Int. J. Solids Struct. 2012, 49, 3582–3593. [Google Scholar] [CrossRef]
- Steglich, D.; Tian, X.; Bohlen, J.; Kuwabara, T. Mechanical testing of thin sheet magnesium alloys in biaxial tension and uniaxial compression. Exp. Mech. 2014, 54, 1247–1258. [Google Scholar] [CrossRef]
- Levesque, J.; Inal, K.; Neale, K.W.; Mishra, R.K. Numerical modeling of formability of extruded magnesium alloy tubes. Int. J. Plast. 2010, 26, 65–83. [Google Scholar] [CrossRef]
- Pandey, A.; Kabirian, F.; Hwang, J.H.; Choi, S.H.; Khan, A.S. Mechanical responses and deformation mechanism of an AZ31 Mg alloy sheet under dynamic and simple shear deformations. Int. J. Plast. 2016, 68, 111–131. [Google Scholar] [CrossRef]
- Steglich, D.; Jeong, Y. Texture-based forming limit prediction for Mg sheet alloy ZE10 and AZ31. Int. J. Mech. Sci. 2016, 117, 102–114. [Google Scholar] [CrossRef]
- Qiao, H.; Guo, X.Q.; Hong, S.G.; Wu, P.D. Modeling of {10-12}-{10-12} secondary twinning in pre-compressed Mg alloy AZ31. J. Alloys Compd. 2017, 725, 96–107. [Google Scholar] [CrossRef]
- Safaei, M. Constitutive Modelling of Anisotropic Sheet Metals Based on a Non-Associated Flow Rule. Ph.D. Thesis, Ghent University, Ghent, Belgium, 2013. [Google Scholar]
- Swift, H. Length changes in metals under torsional overstrain. Engineering 1947, 163, 253–257. [Google Scholar]
- Abedini, A.; Butcher, C.; Rahmaan, T.; Worswick, M.J. Evaluation and calibration of anisotropic yield criteria in shear loading: Constraints to eliminate numerical artefacts. Int. J. Solids Struct. 2018, 151, 118–134. [Google Scholar] [CrossRef]
- Abedini, A.; Butcher, C.; Worswick, M.J. Experimental fracture characterization of an anisotropic magnesium alloy sheet in proportional and non-proportional loading conditions. Int. J. Solids Struct. 2018, 144–145, 1–19. [Google Scholar] [CrossRef]
- Ortiz, M.; Simo, J.C. An analysis of a new class of integration algorithms for elastoplastic constitutive relations. Int. J. Numer. Methods Eng. 1986, 23, 353–366. [Google Scholar] [CrossRef]
- Yoon, J.; Cazacu, O.; Yoon, J.W.; Dick, R.E. Earing predictions for strongly textured aluminum sheets. Int. J. Mech. Sci. 2010, 52, 1563–1578. [Google Scholar] [CrossRef]
- Dunand, M.; Mohr, D. Hybrid experimental-numerical analysis of basic ductile fracture experiments for sheet metals. Int. J. Solids Struct. 2010, 47, 1130–1143. [Google Scholar] [CrossRef]
- Hockett, J.E.; Sherby, O.D. Large strain deformation of polycrystalline metals at low homologous temperatures. J. Mech. Phys. Solids 1975, 23, 87–98. [Google Scholar] [CrossRef]
- Omer, K.; Kim, S.; Butcher, C.; Worswick, M.J. Characterizing the constitutive properties of AA7075 for hot forming. In Proceedings of the IDDRG Conference, Munich, Germany, 2–6 July 2017. [Google Scholar]
- Tardif, N.; Kyriakides, S. Determination of anisotropy and material hardening for aluminum sheet metal. Int. J. Solids Struct. 2012, 49, 3496–3506. [Google Scholar] [CrossRef]
- Luo, M.; Dunand, M.; Mohr, D. Experimental and modeling of anisotropic extrusions under multi-axial loading—Part II: Ductile fracture. Int. J. Plast. 2012, 32, 36–58. [Google Scholar] [CrossRef]
- Kofiani, K.; Nonn, A.; Wierzbicki, T. New Calibration method for high and low triaxiality and validation on SENT specimens of API X70. Int. J. Press. Vessels Pip. 2013, 111–112, 187–201. [Google Scholar] [CrossRef]
- Anderson, D.; Butcher, C.; Pathak, N.; Worswick, M.J. Failure parameter identification and validation for a dual-phase 780 steel sheet. Int. J. Solids Struct. 2017, 124, 89–107. [Google Scholar] [CrossRef]
- Nakazima, K.; Kikuuma, T.; Hasuku, K. Study on the formability of steel sheets. Yawata Tech. Rep. 1968, 264, 8517–8530. [Google Scholar]
- Reu, P. The art and application of DIC, virtual strain gage size study. Exp. Tech. 2015, 39, 1–3. [Google Scholar]
- Rahmaan, T.; Abedini, A.; Butcher, C.; Pathak, N.; Worswick, M.J. Experimental investigation of strain rate effect on fracture characteristics of DP600 and AA5182-O sheet metal alloys under shear loading. Int. J. Impact Eng. 2017, 108, 303–321. [Google Scholar] [CrossRef]
- Noder, J. Characterization and Simulation of Warm Forming of 6xxx and 7xxx Series Aluminum Alloys. Master’s Thesis, University of Waterloo, Waterloo, ON, Canada, 2017. [Google Scholar]
- Lou, X.Y.; Li, M.; Boger, R.K.; Agnew, S.R.; Wagoner, R.H. Hardening evolution of AZ31B Mg sheet. Int. J. Plast. 2007, 23, 44–86. [Google Scholar] [CrossRef]
- Flores, P.; Tuninetti, V.; Gilles, G.; Gonry, P.; Duchene, L.; Habraken, A.M. Accurate stress computation in plane strain tensile tests for sheet metal using experimental data. J. Mater. Process. Technol. 2010, 210, 1772–1776. [Google Scholar] [CrossRef]
- Kuwabara, T.; Ikeda, S.; Kuroda, K. Measurement and analysis of differential work hardening in cold-rolled steel sheet under biaxial tension. J. Mater. Process. Technol. 1998, 80–81, 517–523. [Google Scholar] [CrossRef]
- Koc, M.; Billur, E.; Cora, O.N. An experimental study on the comparative assessment of hydraulic bulge test analysis and methods. Mater. Des. 2011, 32, 272–281. [Google Scholar] [CrossRef]
- Bruschi, S.; Altan, T.; Banabic, D.; Bariani, P.F.; Brosius, A.; Cao, J.; Ghiotti, A.; Khraishesh, M.; Merklein, M.; Tekkaya, A.E. Testing and modelling of material behaviour and formability in sheet metal forming. CIRP Ann. Manuf. Technol. 2014, 63, 727–749. [Google Scholar] [CrossRef]
- Aretz, H.; Barlat, F. New convex yield functions for orthotropic metal plasticity. Int. J. Non-Linear Mech. 2013, 51, 97–111. [Google Scholar] [CrossRef]
- Bai, Y.; Wierzbicki, T. A new model of metal plasticity and fracture with pressure and Lode dependence. Int. J. Plast. 2008, 24, 1071–1096. [Google Scholar] [CrossRef]
- Bai, Y.; Wierzbicki, T. Application of extended Mohr-Coulomb criterion to ductile fracture. Int. J. Fract. 2010, 161, 1–20. [Google Scholar] [CrossRef]
- Boba, M.; Butcher, C.; Panahi, N.; Worswick, M.J.; Mishra, R.K.; Carter, J.T. Warm forming limits of rare earth-magnesium alloy ZEK100 sheet. Int. J. Mater. Form. 2017, 10, 181–191. [Google Scholar] [CrossRef]
- Kurukuri, S.; Boba, M.; Butcher, C.; Worswick, M.J.; Mishra, R. Cylindrical cup deep drawing of ZEK100 sheet at elevated temperatures. In Proceedings of the IDDRG Conference, Waterloo, ON, Canada, 3–7 June 2018. [Google Scholar]


| wp (MPa) | 2.24 | 4.61 | 7.04 | 9.53 | 12.05 | 14.61 | 17.20 | 19.82 | 22.46 |
|---|---|---|---|---|---|---|---|---|---|
| 0.01 | 0.02 | 0.03 | 0.04 | 0.05 | 0.06 | 0.07 | 0.08 | 0.09 |
| Material | (MPa) | b (MPa) | c | d |
|---|---|---|---|---|
| ZEK100-O | 229.40 | 299.20 | 0.8867 | 0.7603 |
| Test | Image Resolution (mm/Pixel) | Step Size (Pixel) | Filter Size | VSGL (mm) |
|---|---|---|---|---|
| Hole Tension | 0.021 | 2 | 7 | ~0.3 |
| Notch Tension | 0.021 | 2 | 7 | ~0.3 |
| Nakazima Dome | 0.056 | 1 | 5 | ~0.3 |
| wp (MPa) | 2.24 | 4.61 | 7.04 | 9.53 | 12.05 | 14.61 | 17.20 | 19.82 | 22.46 |
|---|---|---|---|---|---|---|---|---|---|
| 1.0000 | 1.0000 | 1.0000 | 1.0000 | 1.0000 | 1.0000 | 1.0000 | 1.0000 | 1.0000 | |
| 1.2675 | 0.4784 | 0.2200 | 0.4782 | 0.0567 | 0.6306 | −0.6852 | 0.6380 | −1.4666 | |
| 0.8817 | 0.5018 | 0.7679 | −0.2543 | 0.5592 | 0.6628 | 0.4591 | 0.0072 | 0.5029 | |
| 0.7580 | 0.5681 | −0.1478 | 1.3508 | 0.4420 | 0.9203 | 0.9505 | 0.4047 | −0.0128 | |
| 0.1328 | 1.1662 | 0.6439 | 0.2457 | 0.7413 | 0.3305 | 0.3182 | 0.6262 | 0.9007 | |
| 0.9177 | 0.3304 | 0.5054 | 0.4724 | 1.0226 | 0.8930 | 0.6683 | 1.1338 | −1.2123 | |
| 0.7789 | 0.6374 | 0.5848 | −0.7907 | 0.7024 | −0.3267 | −1.5832 | 0.5668 | 2.2911 | |
| 0.2494 | 0.0415 | 0.0833 | 0.1112 | 0.1367 | 0.7271 | 0.6195 | 0.1825 | 0.0035 | |
| 1.0000 | 1.0000 | 1.0000 | 1.0000 | 1.0000 | 1.0000 | 1.0000 | 1.0000 | 1.0000 | |
| 0.1714 | 0.3799 | 0.5198 | 0.3551 | 0.3744 | 0.5240 | 2.7714 | 0.2216 | −0.3851 | |
| 0.1579 | 0.2873 | 0.0371 | 1.4404 | −0.1768 | 0.0678 | −0.3256 | 1.5587 | −1.3223 | |
| 0.0646 | 0.7531 | 1.0956 | 1.0389 | 1.3346 | 1.3304 | 1.3598 | −0.0572 | 0.9229 | |
| 0.9606 | −0.1176 | 0.5731 | 0.4132 | 0.4541 | 0.7737 | −0.1801 | 0.3998 | −1.5118 | |
| −0.2222 | 0.2522 | −0.3647 | 0.7598 | −0.7847 | 0.3962 | −1.1856 | 1.0566 | 0.1471 | |
| 0.7796 | −0.5169 | −0.6516 | 0.8829 | −0.9231 | 0.7595 | 1.9091 | −1.0412 | 1.3174 | |
| 0.1549 | 0.2101 | 0.1496 | 0.1078 | 0.0424 | −0.0070 | −0.0039 | 0.0299 | −0.2140 | |
| a | 8.0 | 8.0 | 8.0 | 8.0 | 8.0 | 8.0 | 8.0 | 8.0 | 8.0 |
| wp (MPa) | 2.24 | 4.61 | 7.04 | 9.53 | 12.05 | 14.61 | 17.20 | 19.82 | 22.46 |
|---|---|---|---|---|---|---|---|---|---|
| 1.0000 | 1.0000 | 1.0000 | 1.0000 | 1.0000 | 1.0000 | 1.0000 | 1.0000 | 1.0000 | |
| −1.0237 | 0.4545 | 1.0102 | 1.9966 | 2.2040 | −0.2985 | 0.0789 | 0.2260 | −1.0533 | |
| −0.7035 | 1.9085 | 0.5943 | 0.9545 | 0.5387 | 0.9434 | 0.6934 | 0.6262 | 0.0433 | |
| −1.1355 | 2.7551 | 0.2229 | 1.9468 | 0.0420 | 3.7692 | 1.0820 | 0.6369 | 0.1369 | |
| −1.0161 | −0.4556 | −0.5241 | 1.6583 | −1.6638 | 1.5718 | 0.6025 | 0.1549 | 0.9841 | |
| 1.6804 | −0.1473 | 0.7699 | 2.3592 | 2.2291 | −0.1777 | −0.0479 | 0.8652 | 1.2972 | |
| 2.3642 | 2.8355 | 1.3665 | −1.2575 | −0.7711 | 3.0478 | 1.0943 | 1.0682 | −2.0093 | |
| 0.0000 | 0.0000 | 0.0000 | 0.0000 | 0.0000 | 0.0000 | 0.0000 | 0.0000 | 0.0000 | |
| 1.0000 | 1.0000 | 1.0000 | 1.0000 | 1.0000 | 1.0000 | 1.0000 | 1.0000 | 1.0000 | |
| −0.9739 | 2.2285 | 1.6401 | −0.2225 | 1.3887 | 3.5177 | 0.3567 | 0.5942 | 0.2376 | |
| 2.0532 | −1.1593 | 0.3106 | 0.2338 | −0.2669 | −0.5467 | 1.4043 | 0.2108 | 0.9882 | |
| 0.8498 | −0.9201 | 0.2082 | 0.4295 | −2.4330 | 0.9106 | 1.0313 | 0.8402 | −0.9774 | |
| 1.8880 | 0.6140 | 0.8446 | −0.9849 | −0.4236 | −0.4920 | 1.3962 | 0.1178 | 1.0276 | |
| 2.0598 | 2.3104 | −0.6056 | −0.2812 | 2.6643 | 2.9248 | 0.5250 | 0.2857 | −0.6515 | |
| 2.3474 | 2.3376 | 1.4876 | 1.0685 | −2.5729 | 1.2072 | 0.7650 | −0.9337 | 2.2355 | |
| 0.0000 | 0.0000 | 0.0000 | 0.0000 | 0.0000 | 0.0000 | 0.0000 | 0.0000 | 0.0000 | |
| a | 8.0 | 8.0 | 8.0 | 8.0 | 8.0 | 8.0 | 8.0 | 8.0 | 8.0 |
© 2018 by the authors. Licensee MDPI, Basel, Switzerland. This article is an open access article distributed under the terms and conditions of the Creative Commons Attribution (CC BY) license (http://creativecommons.org/licenses/by/4.0/).
Share and Cite
Abedini, A.; Butcher, C.; Worswick, M.J. Application of an Evolving Non-Associative Anisotropic-Asymmetric Plasticity Model for a Rare-Earth Magnesium Alloy. Metals 2018, 8, 1013. https://doi.org/10.3390/met8121013
Abedini A, Butcher C, Worswick MJ. Application of an Evolving Non-Associative Anisotropic-Asymmetric Plasticity Model for a Rare-Earth Magnesium Alloy. Metals. 2018; 8(12):1013. https://doi.org/10.3390/met8121013
Chicago/Turabian StyleAbedini, Armin, Cliff Butcher, and Michael J. Worswick. 2018. "Application of an Evolving Non-Associative Anisotropic-Asymmetric Plasticity Model for a Rare-Earth Magnesium Alloy" Metals 8, no. 12: 1013. https://doi.org/10.3390/met8121013
APA StyleAbedini, A., Butcher, C., & Worswick, M. J. (2018). Application of an Evolving Non-Associative Anisotropic-Asymmetric Plasticity Model for a Rare-Earth Magnesium Alloy. Metals, 8(12), 1013. https://doi.org/10.3390/met8121013