Article

The Potential of Acousto-Ultrasonic Techniques for Inspection of Baked Carbon Anodes

1
Aluminum Research Centre—REGAL, Département de génie chimique, Université Laval, Québec, QC G1V 0A6, Canada
2
Aluminum Research Centre—REGAL, Département de génie civil, Université Laval, Québec, QC G1V 0A6, Canada
3
Alcoa Primary Metals Smelting Center of Excellence, Québec, QC G0A 1S0, Canada
4
Aluminum Research Centre—REGAL, Département de génie des mines, de la métallurgie et des matériaux, Université Laval, Québec, QC G1V 0A6, Canada
*
Author to whom correspondence should be addressed.
Metals 2016, 6(7), 151; https://doi.org/10.3390/met6070151
Submission received: 30 May 2016 / Revised: 24 June 2016 / Accepted: 28 June 2016 / Published: 4 July 2016

Abstract

:
High quality baked carbon anodes contribute to the optimal performance of aluminum reduction cells. However, the currently decreasing quality and increasing variability of anode raw materials (coke and pitch) make it challenging to manufacture the anodes with consistent overall quality. Intercepting faulty anodes (e.g., presence of cracks and pores) before they are set in reduction cells and deteriorate their performance is therefore important. This is a difficult task, even in modern and well-instrumented anode plants, because lab testing using core samples can only characterize a small proportion of the anode production due to the costly, time-consuming, and destructive nature of the analytical methods. In addition, these results are not necessarily representative of the whole anode block. The objective of this work is to develop a rapid and non-destructive method for quality control of baked anodes using acousto-ultrasonic (AU) techniques. The acoustic responses of anode samples (sliced sections) were analyzed using a combination of temporal features computed from AU signals and principal component analysis (PCA). The AU signals were found sensitive to pores and cracks and were able to discriminate the two types of defects. The results were validated qualitatively by submitting the samples to X-ray Computed Tomography (CT scan).

Graphical Abstract

1. Introduction

The currently decreasing quality and increasing variability of anode raw materials (coke and pitch) make it challenging to manufacture the anodes with consistent overall quality. Intercepting faulty anodes before they are set in reduction cells and deteriorate their performance (i.e., energy consumption and efficiency) requires testing all or the majority of the manufactured anodes. However, even in modern and well-instrumented anode manufacturing plants, the traditional lab inspection strategy based on core sampling can, at best, evaluate the properties of about 1% of the manufactured anodes due to the costly, time-consuming, and destructive nature of the analytical methods. In addition, the core sample properties are typically available after the anode is set in the reduction cells due to the long lab delays. For economical and logistics reasons, it is generally not possible to improve the rate of anode testing by increasing the lab work load. Furthermore, the properties obtained from core samples are not necessarily representative of the whole anode block, as reported by Sinclair and Sadler [1,2], who provide a complete list of issues related to the use of core samples for quality control and decision-making. Indeed, anode blocks are heterogeneous materials that may contain different types of internal defects (i.e., coke particles not penetrated by pitch, regions of high/low pitch concentration, pores and cracks) which can lead to the anisotropic distribution of properties within the block. The current strategy may completely miss these defects if the core is not sampled where the defects are located. Hence, the mechanical properties and electrical resistivity obtained from core samples may only reflect localized properties. Therefore, rapid and non-destructive techniques to inspect anode blocks should be investigated in order to provide a better picture of the anode quality in a timely fashion. This would allow anode sorting strategies to be put in place and feedback-corrective adjustments to be implemented on the paste plant and baking furnace operation parameters.
Recent research efforts were focused on developing systems for measuring the anode resistivity distribution online based on the work of Seger [3,4] and/or Haldemann and Fawzi [5]. For example, a device called MIREA (Mesure Instantanée de la Résistivité Électrique Anodique) was proposed to measure the anodic electrical resistance [6,7]. Basically, an electrical current entering by the stub holes is passed through the anode in a similar way to if the anode was rodded while several voltage drop measurements are collected at different locations on the anode surface. A numerical model of the anode is then used together with the voltage drop measurements to estimate the anode resistivity distribution. Alternatively, the resistivity distribution can be measured using an array of electrical contact points placed at the top and bottom of the anode and by measuring the voltage drop at each of these points [8,9]. In addition to providing resistivity measurements, these systems should allow detecting the presence of defects within the anodes since damage within the carbon block should, in principle, disturb the electrical current distribution. However, their ability to discriminate between different types of defects (e.g., pores vs. cracks) has not been demonstrated.
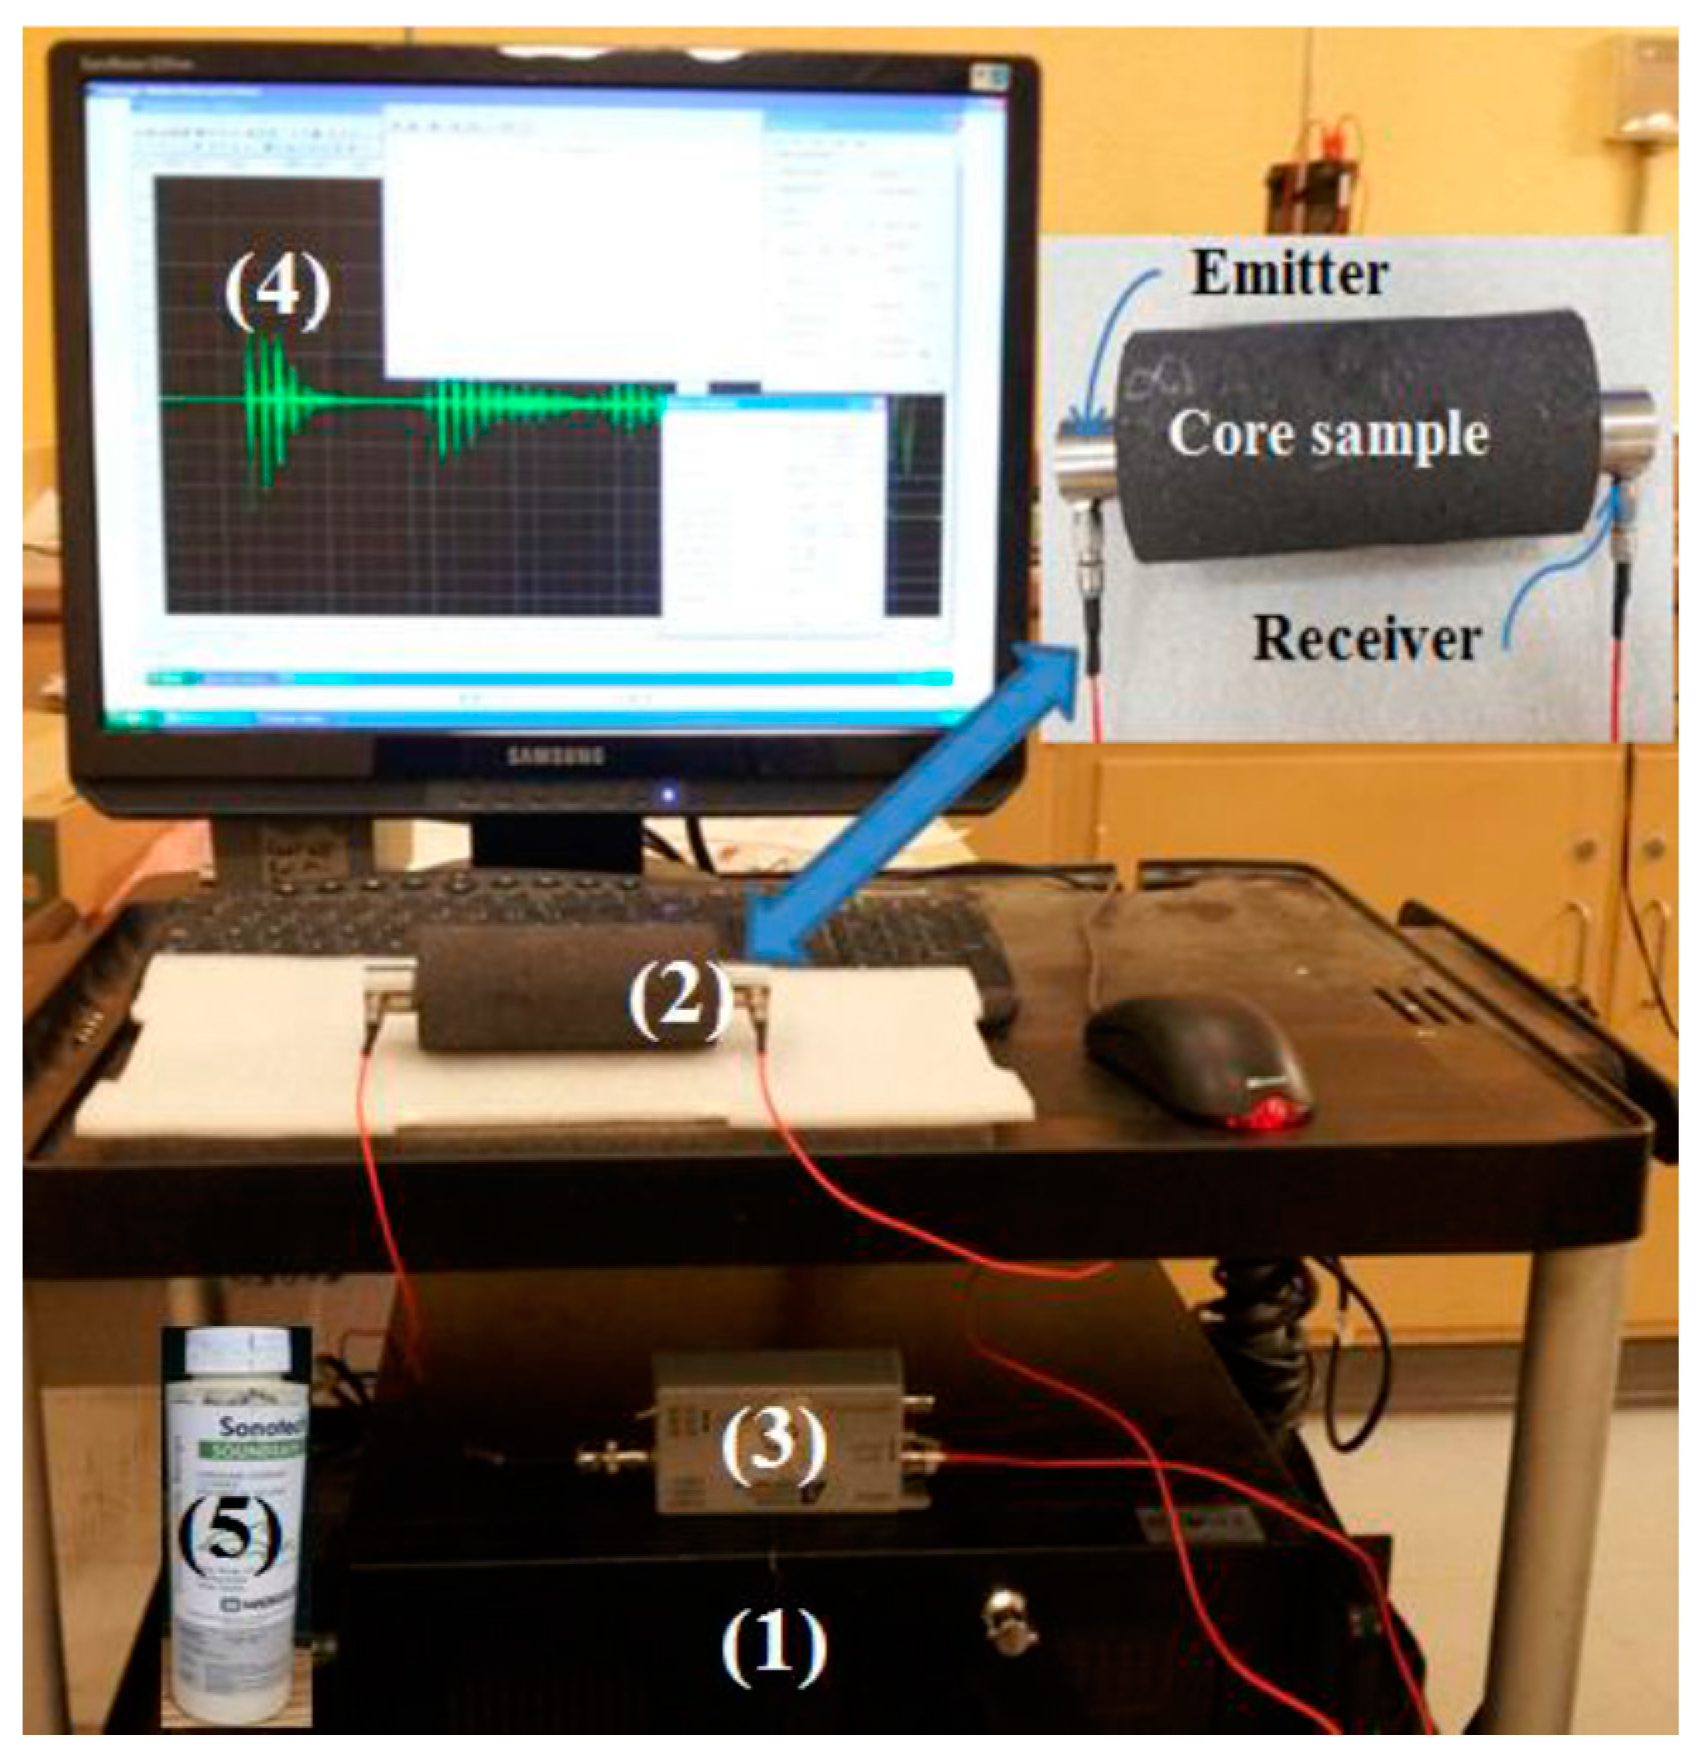
Alternatively, the internal structure of the anodes could be inspected by acousto-ultrasonic (AU) techniques. These non-destructive methods have been widely used in the inspection of composite materials, such as concrete and refractories [10,11,12]. However, applications of AU for testing complex porous materials naturally containing pores and cracks, such as baked carbon anodes, are not as common as for denser materials such as parts made of metal alloys or highly graphitized carbon materials, which are expected to be free of internal voids. The main issue with the anodes is separating defects affecting their performance in the reduction cells from the internal porosity, which is always present, when both types of voids attenuate the acoustic waves propagating through the materials. The only publicly available reports on the application of acoustic methods on carbon electrodes appear to be those of Allaire [13] and Allaire et al. [14] using the SonicByte™ system [15]. Their work mainly focused on measuring the elastic properties of refractory and carbonaceous materials as a means of detecting defects. Although this technique may help identify faulty anodes, it only provides an estimate of the overall material properties. Inspecting the anode block at different positions should provide more information about the distribution of pores and cracks within the volume, and provide a clearer diagnostic. This is essential for taking appropriate corrective actions on the anode manufacturing plant operations. In addition to detecting and discriminating the internal anode defects, the AU signals could provide measurements of the anode density distribution, which is complementary information to electrical resistivity measurements.
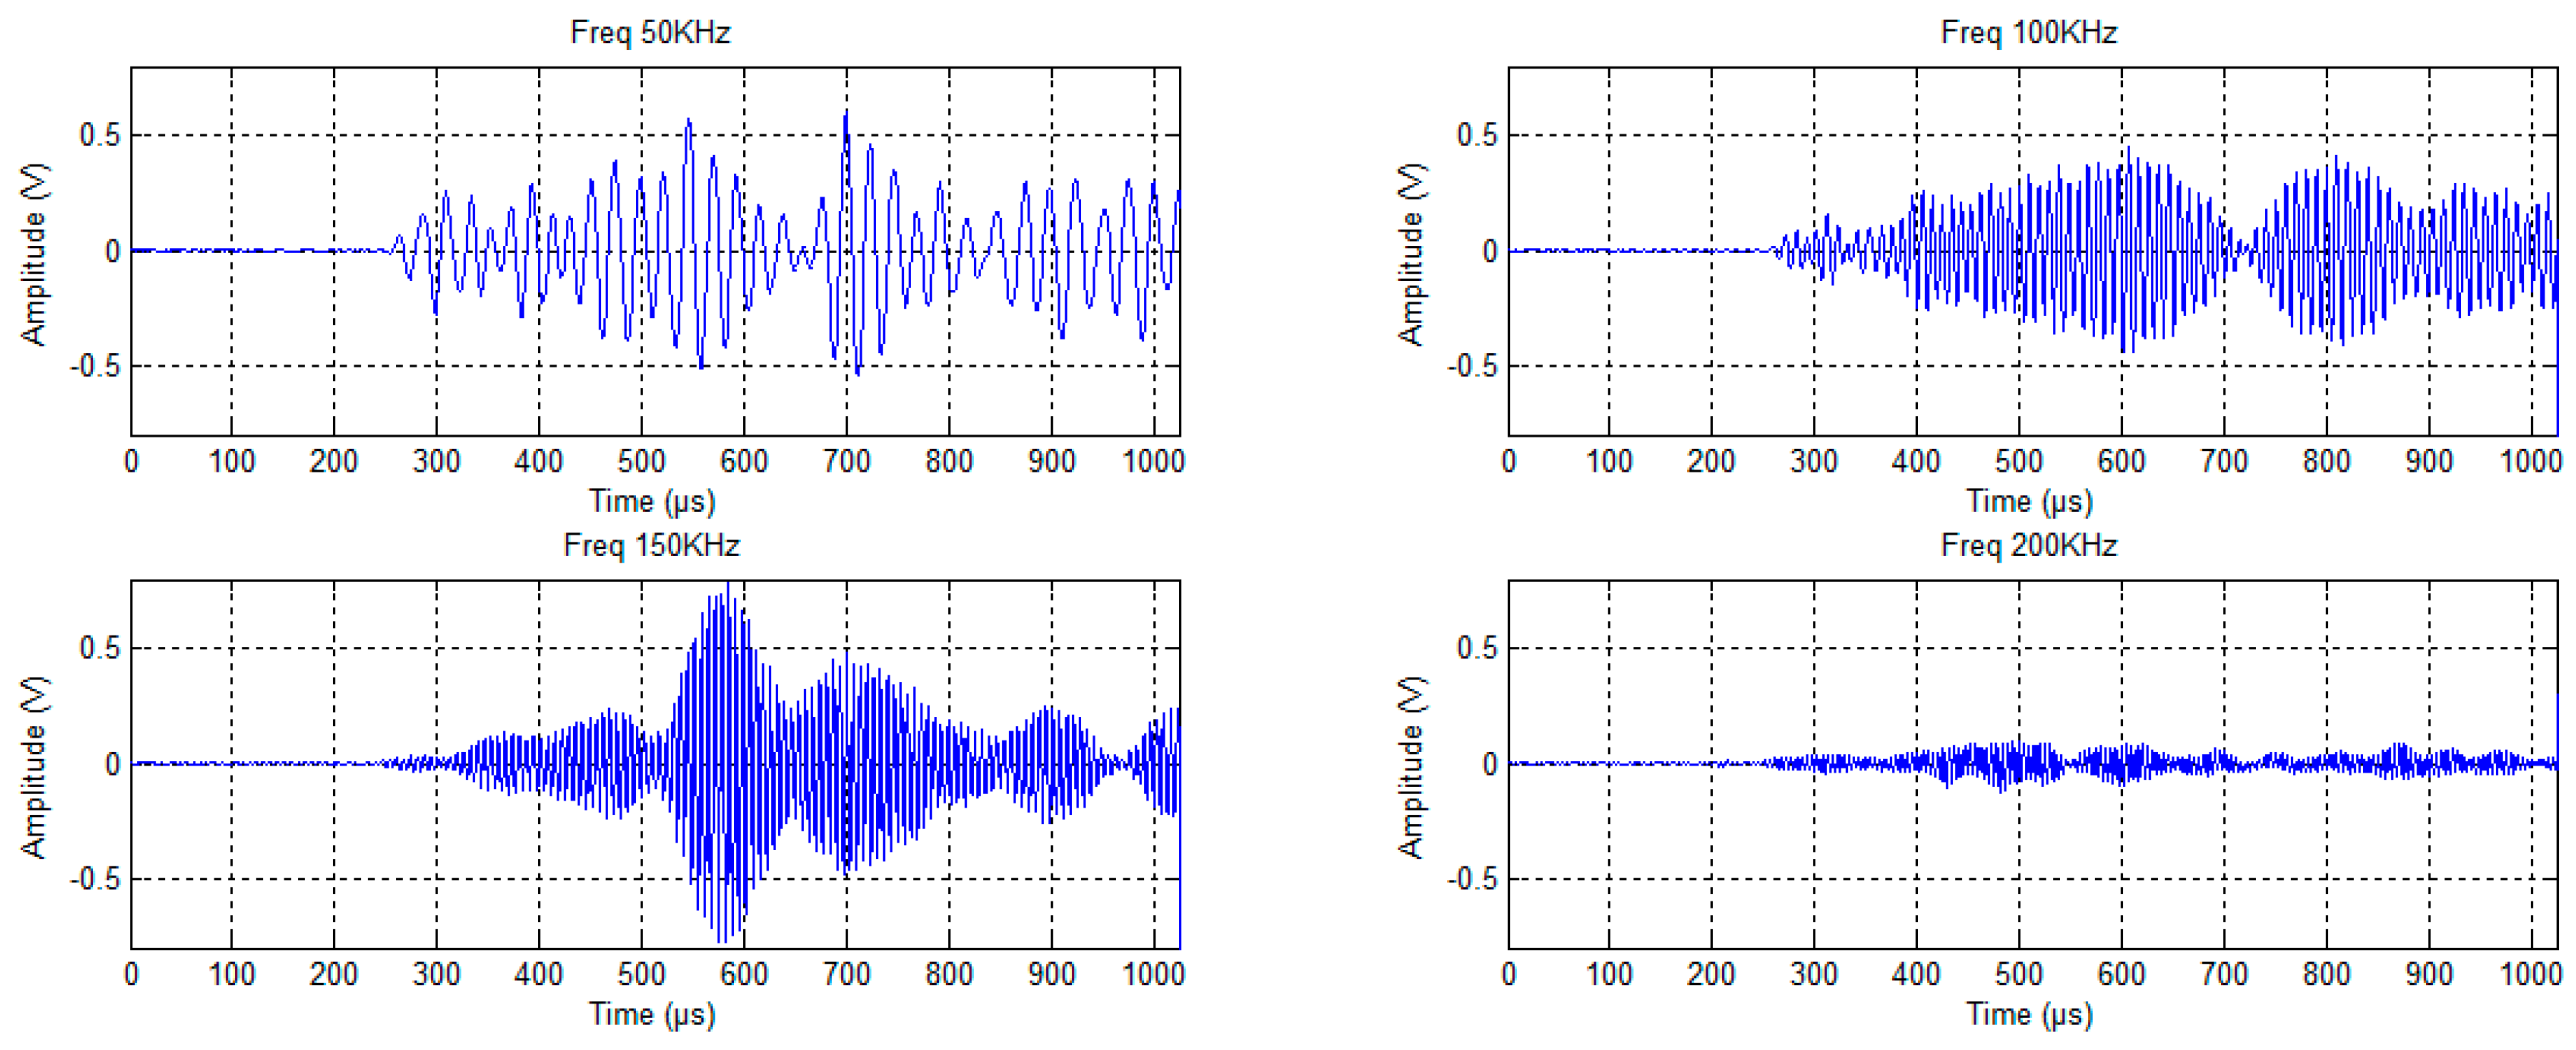
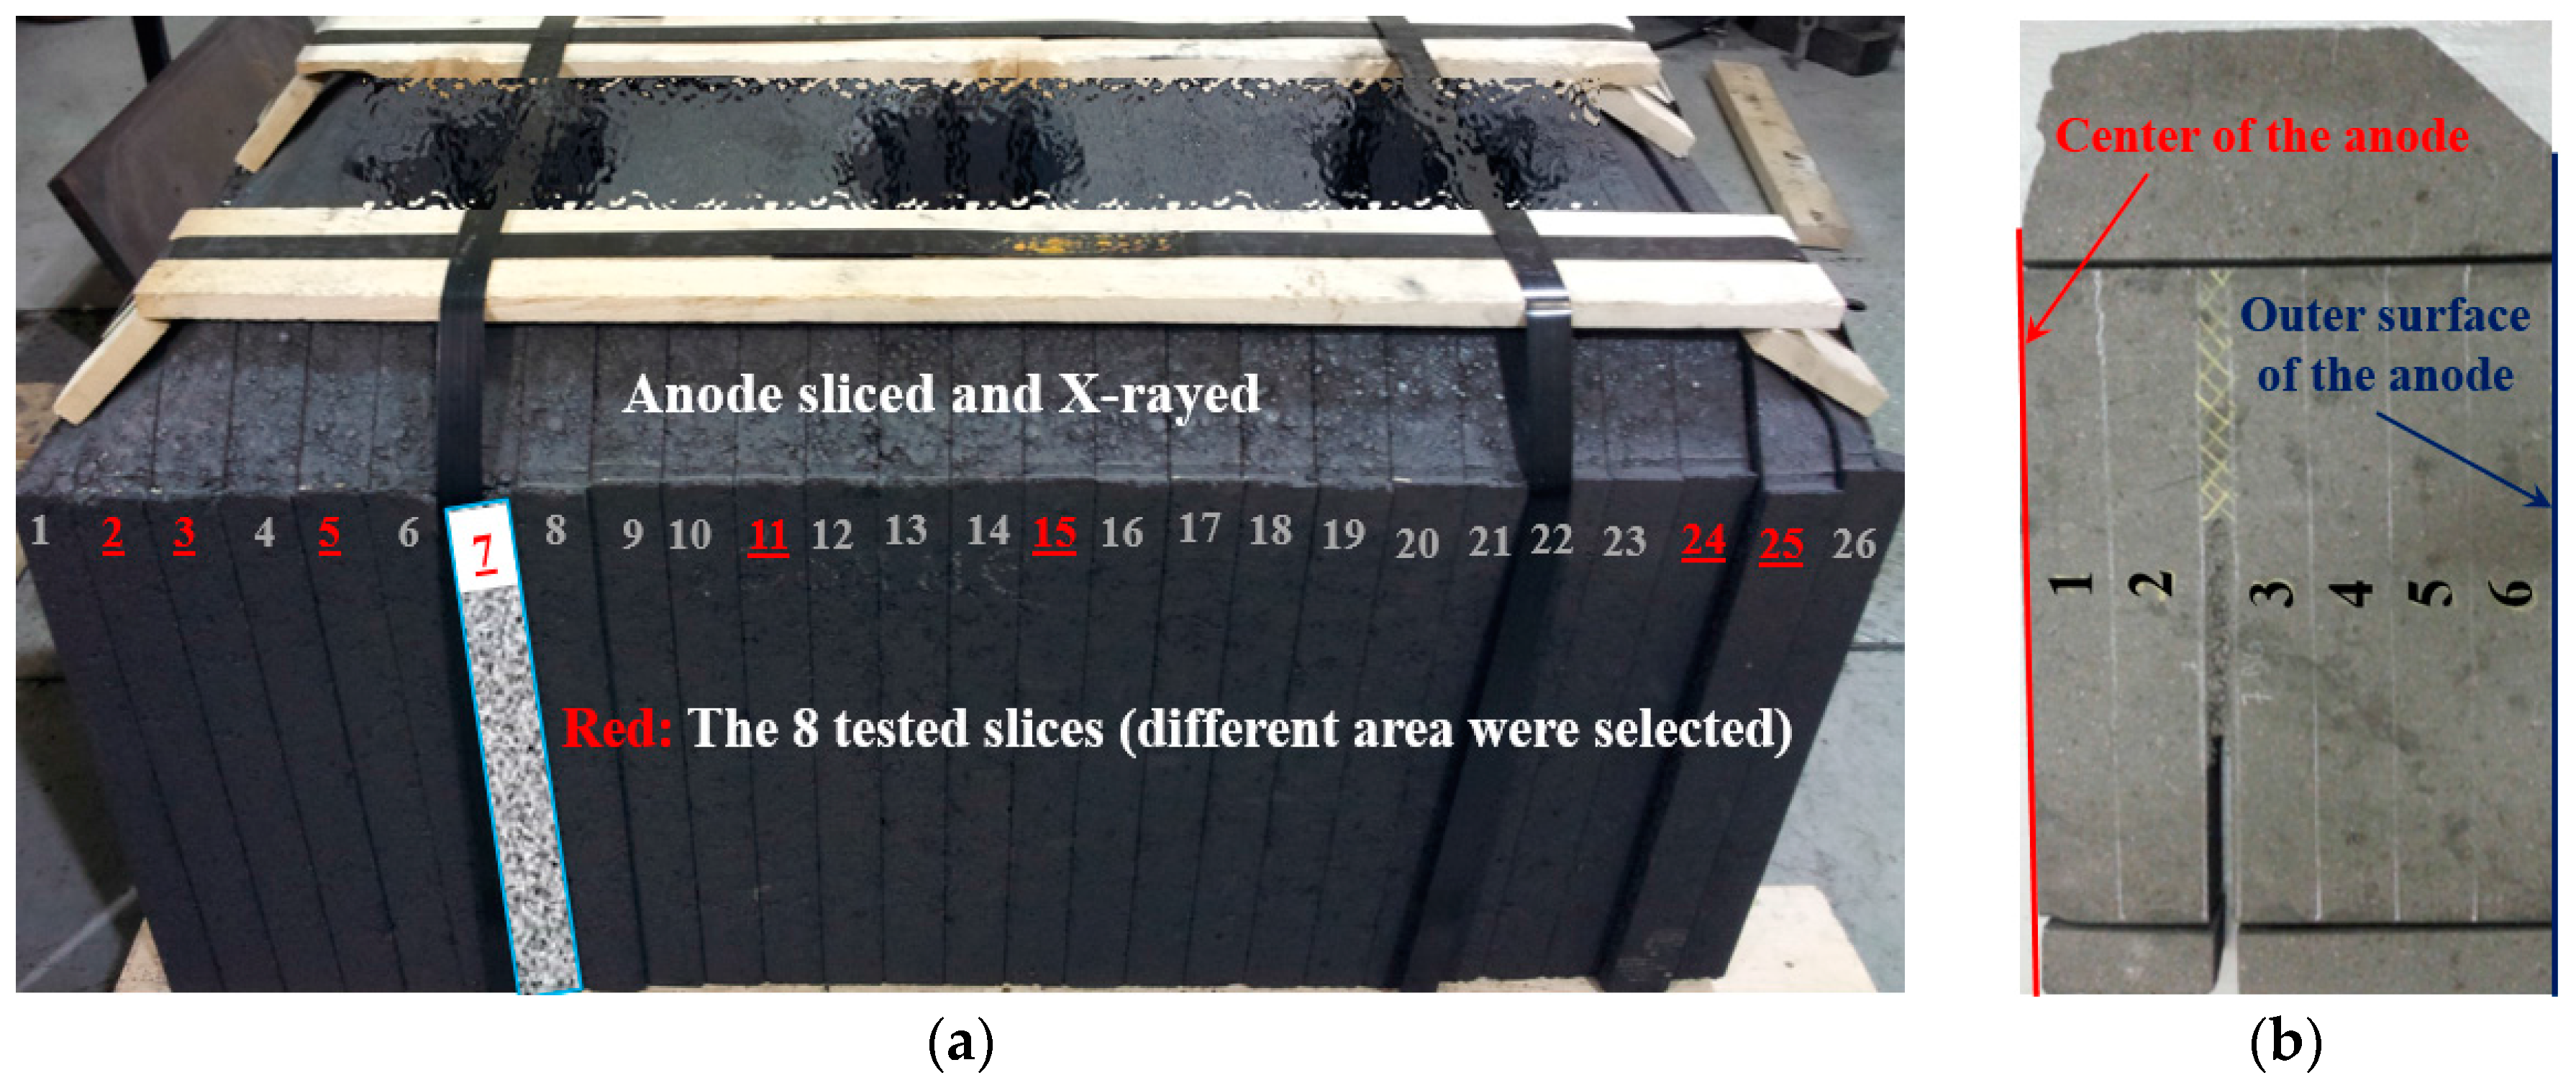
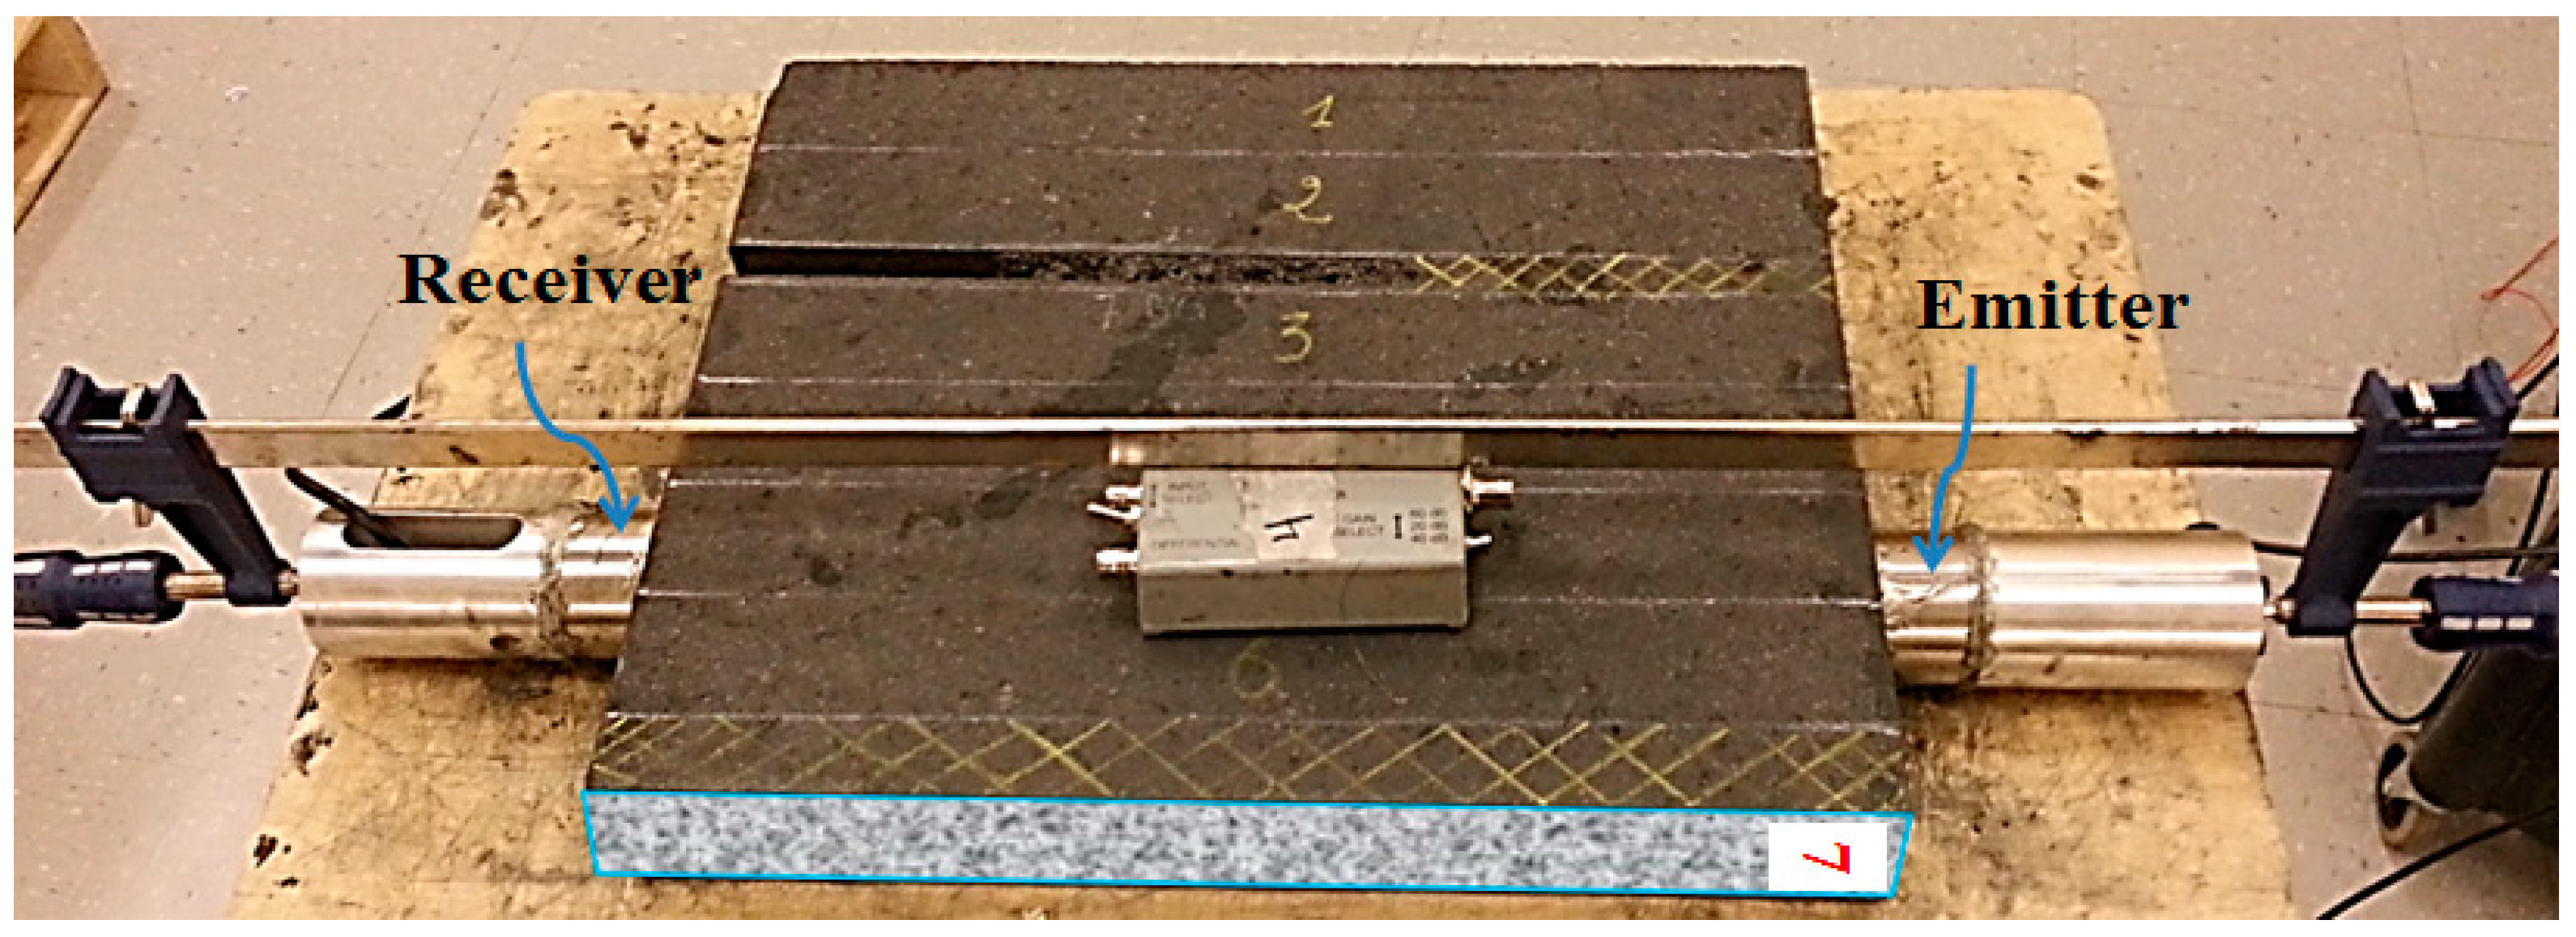
The objective of this work is to investigate the sensitivity of the acousto-ultrasonic techniques to defects within the internal structure of carbon anode materials. It focuses especially on the detection and identification of two types of internal voids, namely pores and cracks, using the attenuated acoustic signal propagating through the material. To prove the concept, a baked anode was sliced along its length and analyzed by X-ray Computed Tomography (CT scan) to reveal its internal structure [16]. Acoustic excitation waves at different frequencies were sent through the materials and the attenuated signals were measured at different positions on a certain number of slices. Several features were computed from the AU signals and collected in a data matrix which was then analyzed using principal component analysis (PCA) [17]. The clustering patterns obtained in the PCA score space suggest that the proposed approach is sensitive to the concentration of pores and the presence of cracks, and that both types of voids can be distinguished. The results were validated qualitatively using CT scan images.
The paper is organized as follows. The experimental details about the acoustic inspection set-up as well as the baked anode samples are presented first. The methods used for processing and analyzing the acoustic signals are then described. The results obtained with the proposed approach are presented and discussed. Finally, some conclusions are drawn.

2. Experimental

2.1. Acoustic Inspection System

An overview of the AU signal measurement system is shown in Figure 1. Signal conditioning was performed by pre-amplifiers. The conditioned signal (with an amplification gain of 40 dB) was sent to the main data-acquisition board in which the AU waveforms and parameters were stored.
The system is composed of four Physical Acoustics™ (PAC) hardware components (MISTRAS Group Inc.: Princeton Jct., NJ, USA). The components are identified directly within Figure 1 and are also listed below:
(1)
PAC SAMOS™ multi-channel acoustic inspection system consisting of four 16-bit PCI-8 boards, including a 1-MHz analog-digital (AD) converter on each channel.
(2)
PAC R6-α resonant transducers (bandwidth 10 kHz–1 MHz, resonant frequency at 55 kHz, 15 mm Ø).
(3)
PAC model 2/4/6 pre-amplifier (10 kHz–2 MHz).
(4)
PAC application software AEwin™ for SAMOS™.
Acoustic coupling (gel type) was also used to ensure a good contact between the acoustic sensors and the baked anode samples (number 5 in Figure 1). Note that an anode core sample is shown in this figure for illustration purpose only.

2.2. Baked Anode Samples

A full-scale baked anode manufactured at the Alcoa Deschambault smelter located in Quebec, Canada (ADQ), was used in this work. The anode was first scanned using computed X-ray tomography (CT scan) to reveal its internal structure [16]. This imaging technique is non-destructive in nature, but it is expensive to purchase and operate, and the data analysis is too time-consuming to be used for routine anode inspection at the plant. Hence, the CT scan images were used to qualitatively validate that the variations observed in the attenuated acoustic signals were associated with pores and cracks. The baked anode was sliced prior to imaging because the available instrument could not take samples as large as an anode. It was first cut into 26 slices of equal thickness along it length as shown in Figure 2a and then each slice was cut further in halves along the height of the anode (see Figure 2b). A total of eight slices were selected for collecting the acoustic signals. These correspond to slices numbered 2, 3, 5, 7, 11, 15, 24, and 25 identified in red in Figure 2a. They were selected in such a way to obtain a representative sampling of the internal structure of the anode. The slices were selected at both ends of the anode as well as below and between the stub holes. It is well known in the field that spatial distribution of anode density, pore and crack concentration within the block is non-uniform, and that the internal structure at both ends of the anodes, below and between the stub holes are expected to be systematically different. Note that the top and bottom of each half slice were also cut prior to collecting the acoustic measurements to obtain samples of even height and to standardize the sample geometry for all the selected slices (see Figure 2b). Finally, each sample was divided (virtually) into six corridors along the sample height as shown again in Figure 2b. These corridors of equal width were delimited using a white chalk. They were numbered 1 to 6 from the center of the anode toward its outer surface.
An example CT scan image is shown in Figure 3 for slice number 7. The numbers within the image identify the six corridors drawn on the slices, in the same order as discussed previously (1 is at the center of the anode and 6 is close to the outer surface). The image clearly shows the pores and cracks, and regions of different densities (proportional to gray level intensities).

2.3. Acoustic Inspection Data Collection

The acoustic sensors were mounted and put into close contact with the samples as shown in Figure 4. Both sensors (emitter and receiver) were positioned at both ends of a given corridor within a slice. They were maintained into position using a clamping device. The interfaces between the sensors and the material were filled with coupling gel in order to maintain appropriate signal transmission. The material in each corridor was then submitted sequentially to seven different excitation frequencies (100, 130, 150, 170, 200, 230, and 250 kHz) while recording the attenuated acoustic signals. This procedure was repeated for each of the 6 corridors and for the 8 anode slices. In addition, preliminary work (not shown) has established that 250 kHz is the maximum excitation frequency for this material because the acoustic signal was found to be completed attenuated at higher frequencies. The data collection strategy was found to be repeatable and it was not necessary to average several raw signals to reduce measurement errors. The sample surface quality was similar for most samples. It is therefore considered that the signal attenuation is mainly due to the material properties and voids (pores, cracks) and the effect of surface quality is negligible.
Some of the acoustic signals acquired at different frequencies on a particular corridor are shown in Figure 5 for illustration purpose. The signal attenuation pattern clearly changes as a function of the excitation frequency. According to mechanical wave propagation theory [18,19,20], there is a relationship between the attenuation at a given frequency and the size of the voids inside a material. Higher frequency waves are attenuated by smaller voids compared to lower frequency waves. Hence, exciting the material at different frequencies should help detect variations in void sizes within the material.

3. Acoustic Signal Processing and Analysis

3.1. Acoustic Features Extraction

Waveform processing of acoustic signals has routinely been used for detecting defects in materials. The acoustic wave propagating through the material attenuates at defects and discontinuities such as voids, cracks and inclusions. Hence, efficient techniques for acoustic signal analysis should allow distinguishing materials with and without defects. Although direct analysis of all the raw signals could be performed using, for example, unsupervised clustering techniques such as principal component analysis (PCA) [21], it was instead decided to compute a small number of commonly used temporal features from each attenuated acoustic signal in order to reduce the size of the dataset to be analyzed and facilitate interpretation of the results. Indeed, a total of seven signals were collected from the material contained in each corridor (one for each excitation frequency), and one such raw signal is formed by several thousands of data points. The following commonly used time domain scalar attenuation features were therefore computed from each raw attenuated acoustic signal [22]: the maximum (MAX), mean, standard deviation (STD), energy (E), root mean square (RMS), skewness (S) and kurtosis (K) of the signal time series x(i), i = 1, 2, …N:
MAX = max i = 1 N x ( i )
Mean = x ¯ = 1 N i = 1 N x ( i )
STD = 1 N i = 1 N ( x ( i ) x ¯ ) 2
E = i = 1 N | x ( i ) | 2
RMS = 1 N i = 1 N [ x ( i ) ] 2
S = 1 N i = 1 N ( x ( i ) x ¯ ) 3 STD 3
K = 1 N i = 1 N ( x ( i ) x ¯ ) 4 STD 4
where N is the total number of data points in the signal time series (same for all signals collected in this work). Signal processing was performed using Matlab version R2014a (MathWorks, Natick, MA, USA).
The data was stored in a (48 × 49) dimensional matrix X. The 49 columns correspond to the seven temporal features computed from the seven attenuated acoustic signals collected from each of the 48 samples (six corridors × eight anode slices). Principal component analysis (PCA) was then used to analyze the information contained in the feature matrix X.

3.2. Principal Component Analysis (PCA)

PCA is a widely used multivariate statistical method for the analysis of large datasets containing noisy and highly collinear data, as is the case in this study. Assume a data matrix X (I × J) containing J measurements collected from I samples. Further assume that both systematic variations and noise are present in this dataset. PCA decomposes the variance-covariance structure of X by finding a small number of orthogonal latent variables A << J capturing most of the systematic variations in X, but leaving noise or irrelevant information as residuals. These latent variables (also called components) are defined as linear combinations of the J original measurements and together define a lower dimensional subspace allowing easy visualization and interpretation of the information contained in large datasets. The PCA decomposition is expressed mathematically as shown below:
X = a = 1 A t a p a T + E
where the orthogonal score vectors ta (I × 1), a = 1,2,…,A, are those latent variables providing the coordinates of each sample in the low dimensional subspace (plane or hyperplane) after projection. The subspace itself is defined by the A orthonormal loading vectors pa (J × 1), which are linear combinations of the original variables (i.e., ta = X × pa). The projection residuals are collected in the residual matrix E (I × J). The loading vectors are calculated in such a way that t1 explains the greatest amount of variance in X, t2 the second greatest amount of variance left unexplained by the first component, and so on.
PCA effectively performs unsupervised clustering of the I samples in the latent variable subspace, which can be visualized using scatter plots of the scores (t’s). The differences between the clusters can be interpreted using the loading vectors (p’s). The reader is referred to Wold et al. [17] for more details about PCA. The ProMV software version 15.08 (ProSensus, Ancaster, ON, Canada) was used to build the PCA models.

4. Results and Discussion

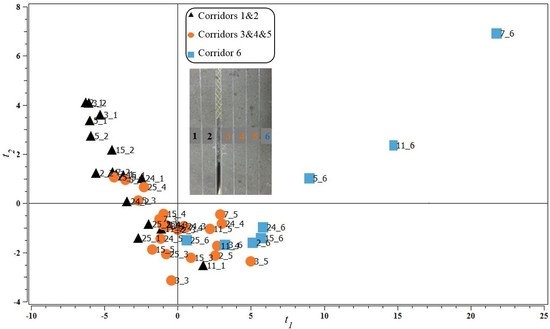
The mechanical wave exciting a porous material, such as carbon anode materials, usually has complex propagation characteristics. PCA was applied to the attenuated acoustic signal feature matrix X to assess whether the anode samples (corridors) located at different positions within the block could be distinguished based on their attenuation behavior (quantified by temporal features at different frequencies).
A total of 15 principal components (i.e., latent variables) were found statistically significant by a cross-validation procedure [23]. The cumulative sum of squares explained (R2) and predicted (Q2) by the first two PCA components are provided in Table 1. Only those two components are discussed since they were found sufficient to discriminate the samples. They explain 65% of the variance of the attenuation features (X) and maintained a relatively good performance in prediction by cross-validation (Q2 = 56%).
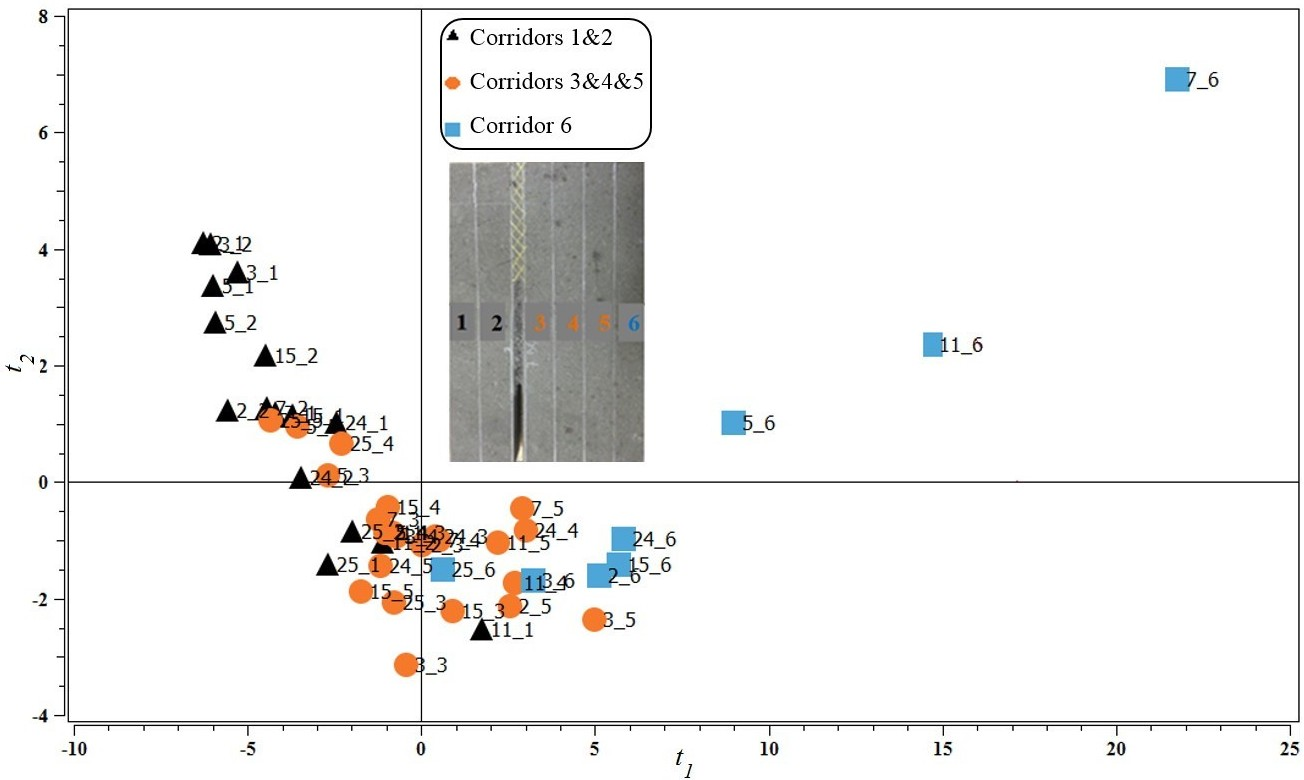
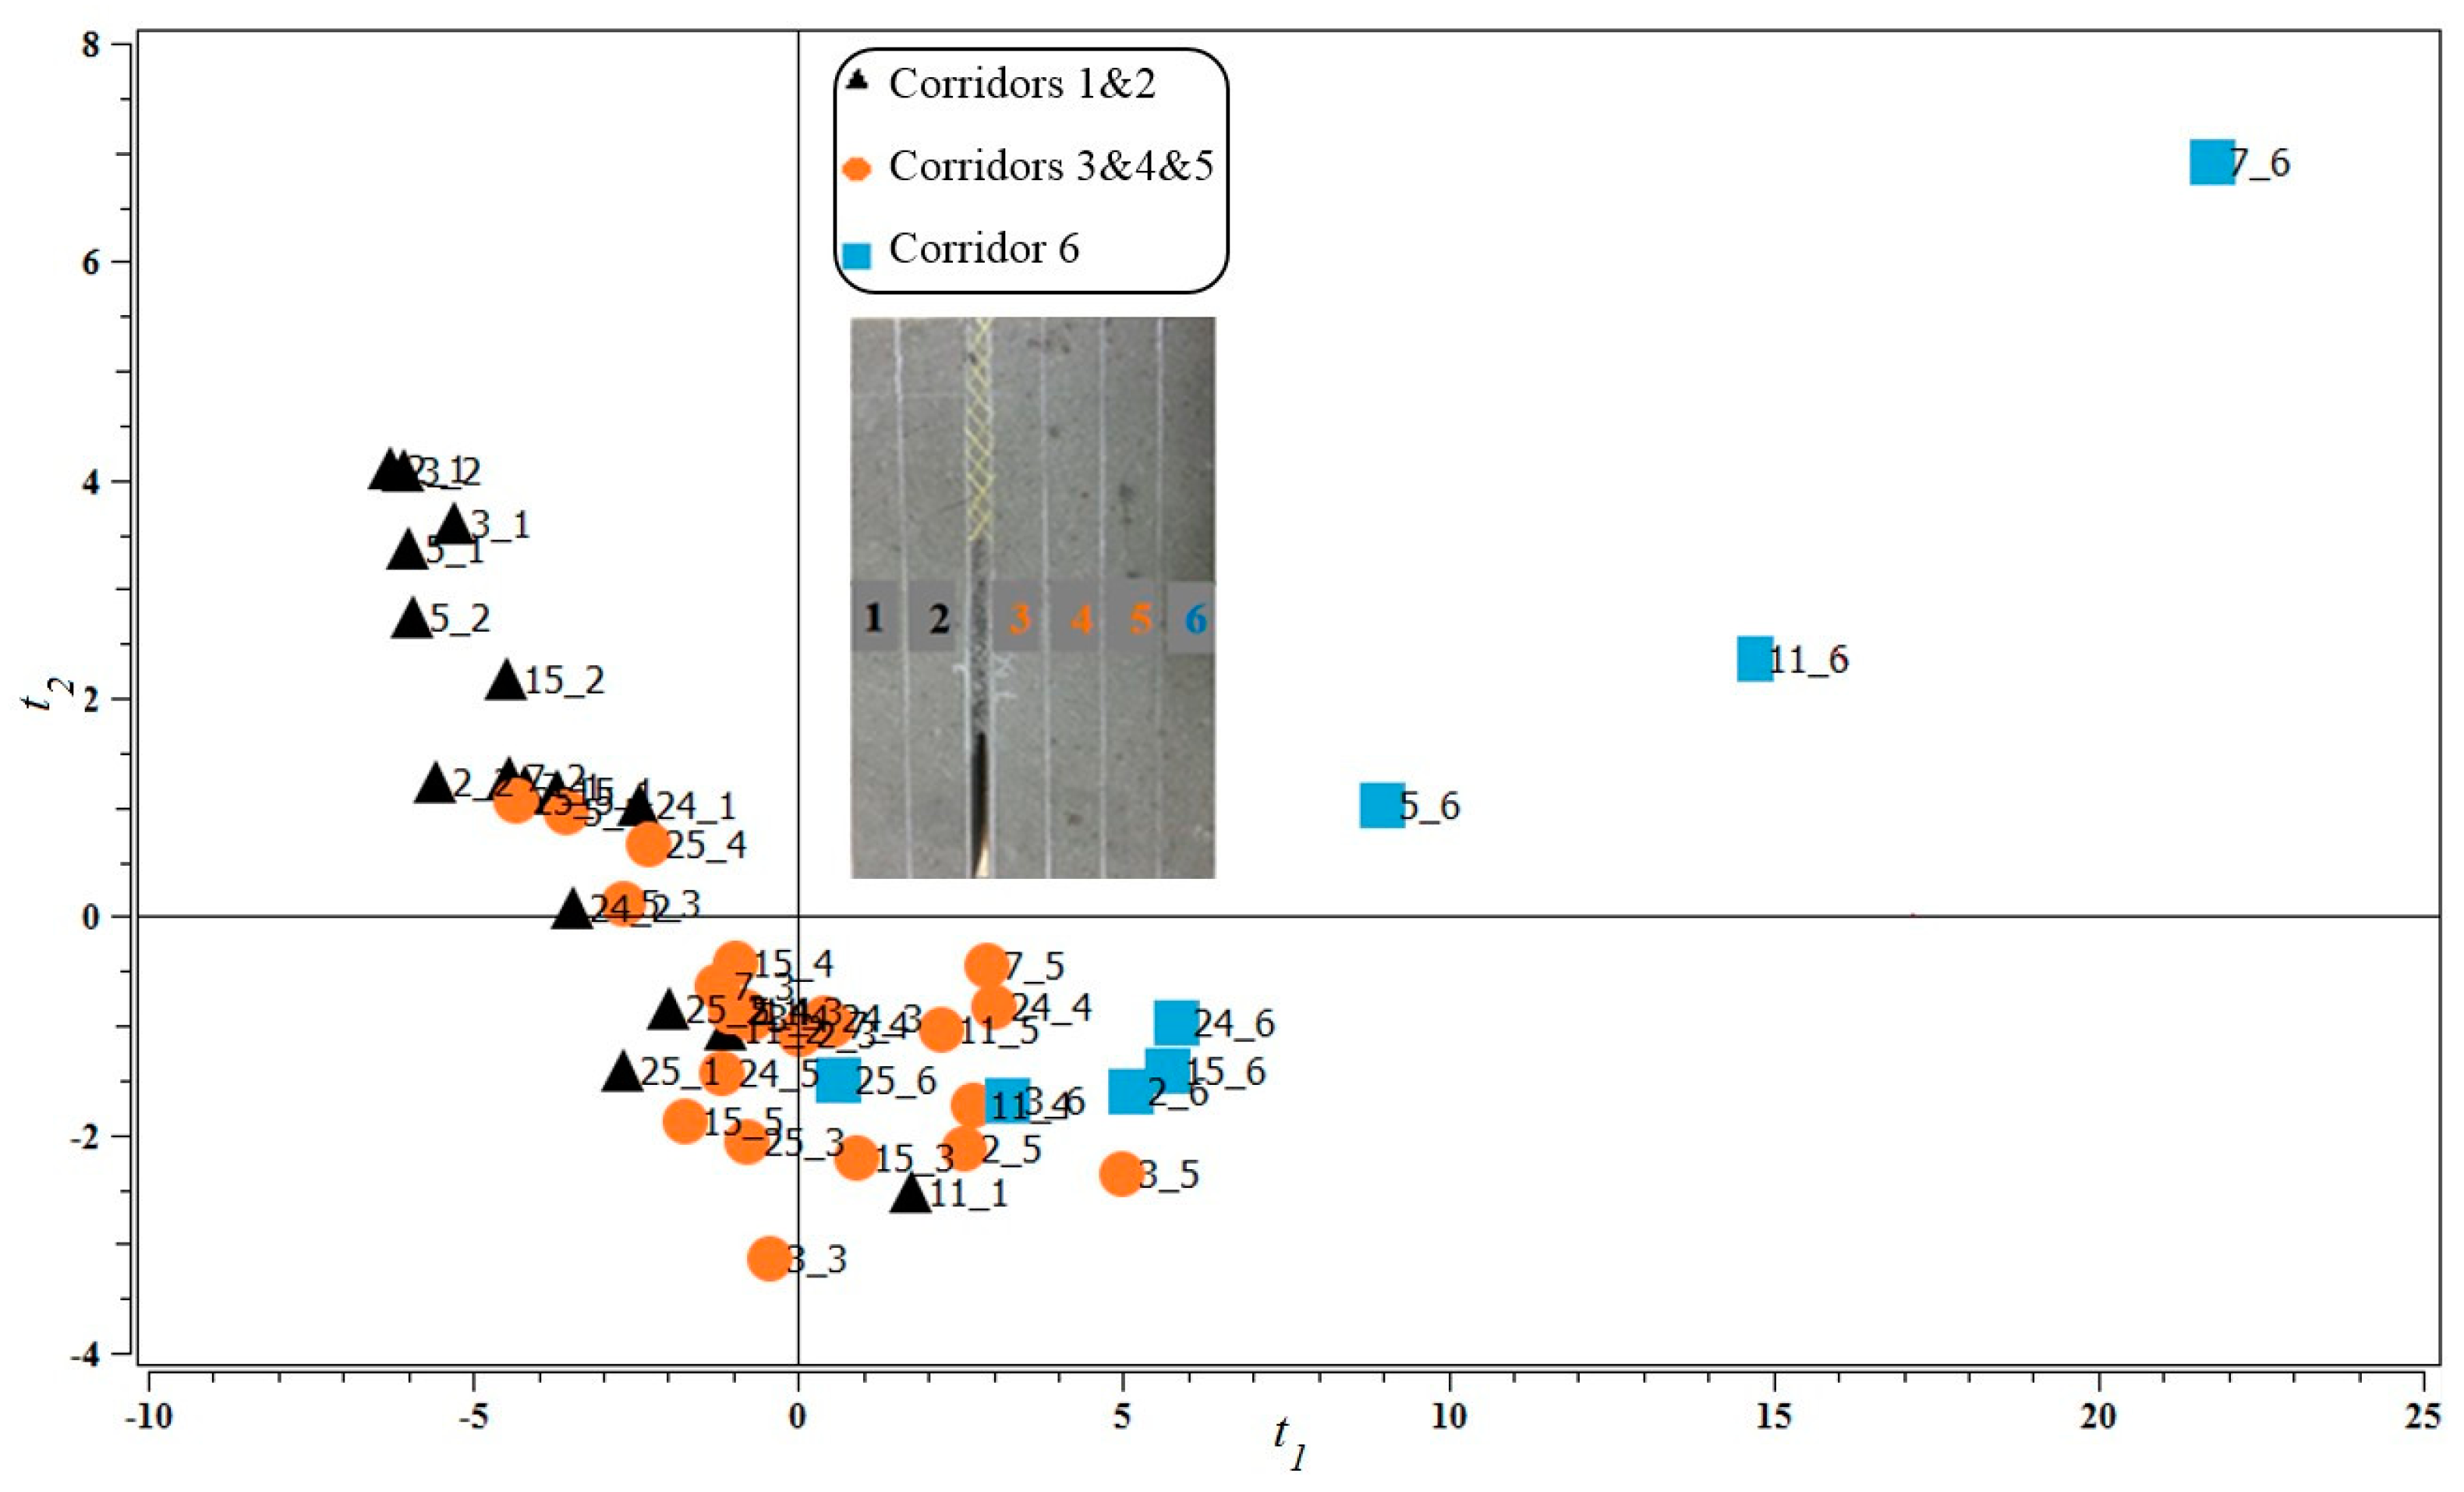
Figure 6 presents the latent variable score space (t1 vs. t2) for the first two components of the PCA model. Each marker corresponds to the attenuation behavior of one particular corridor (one row in 
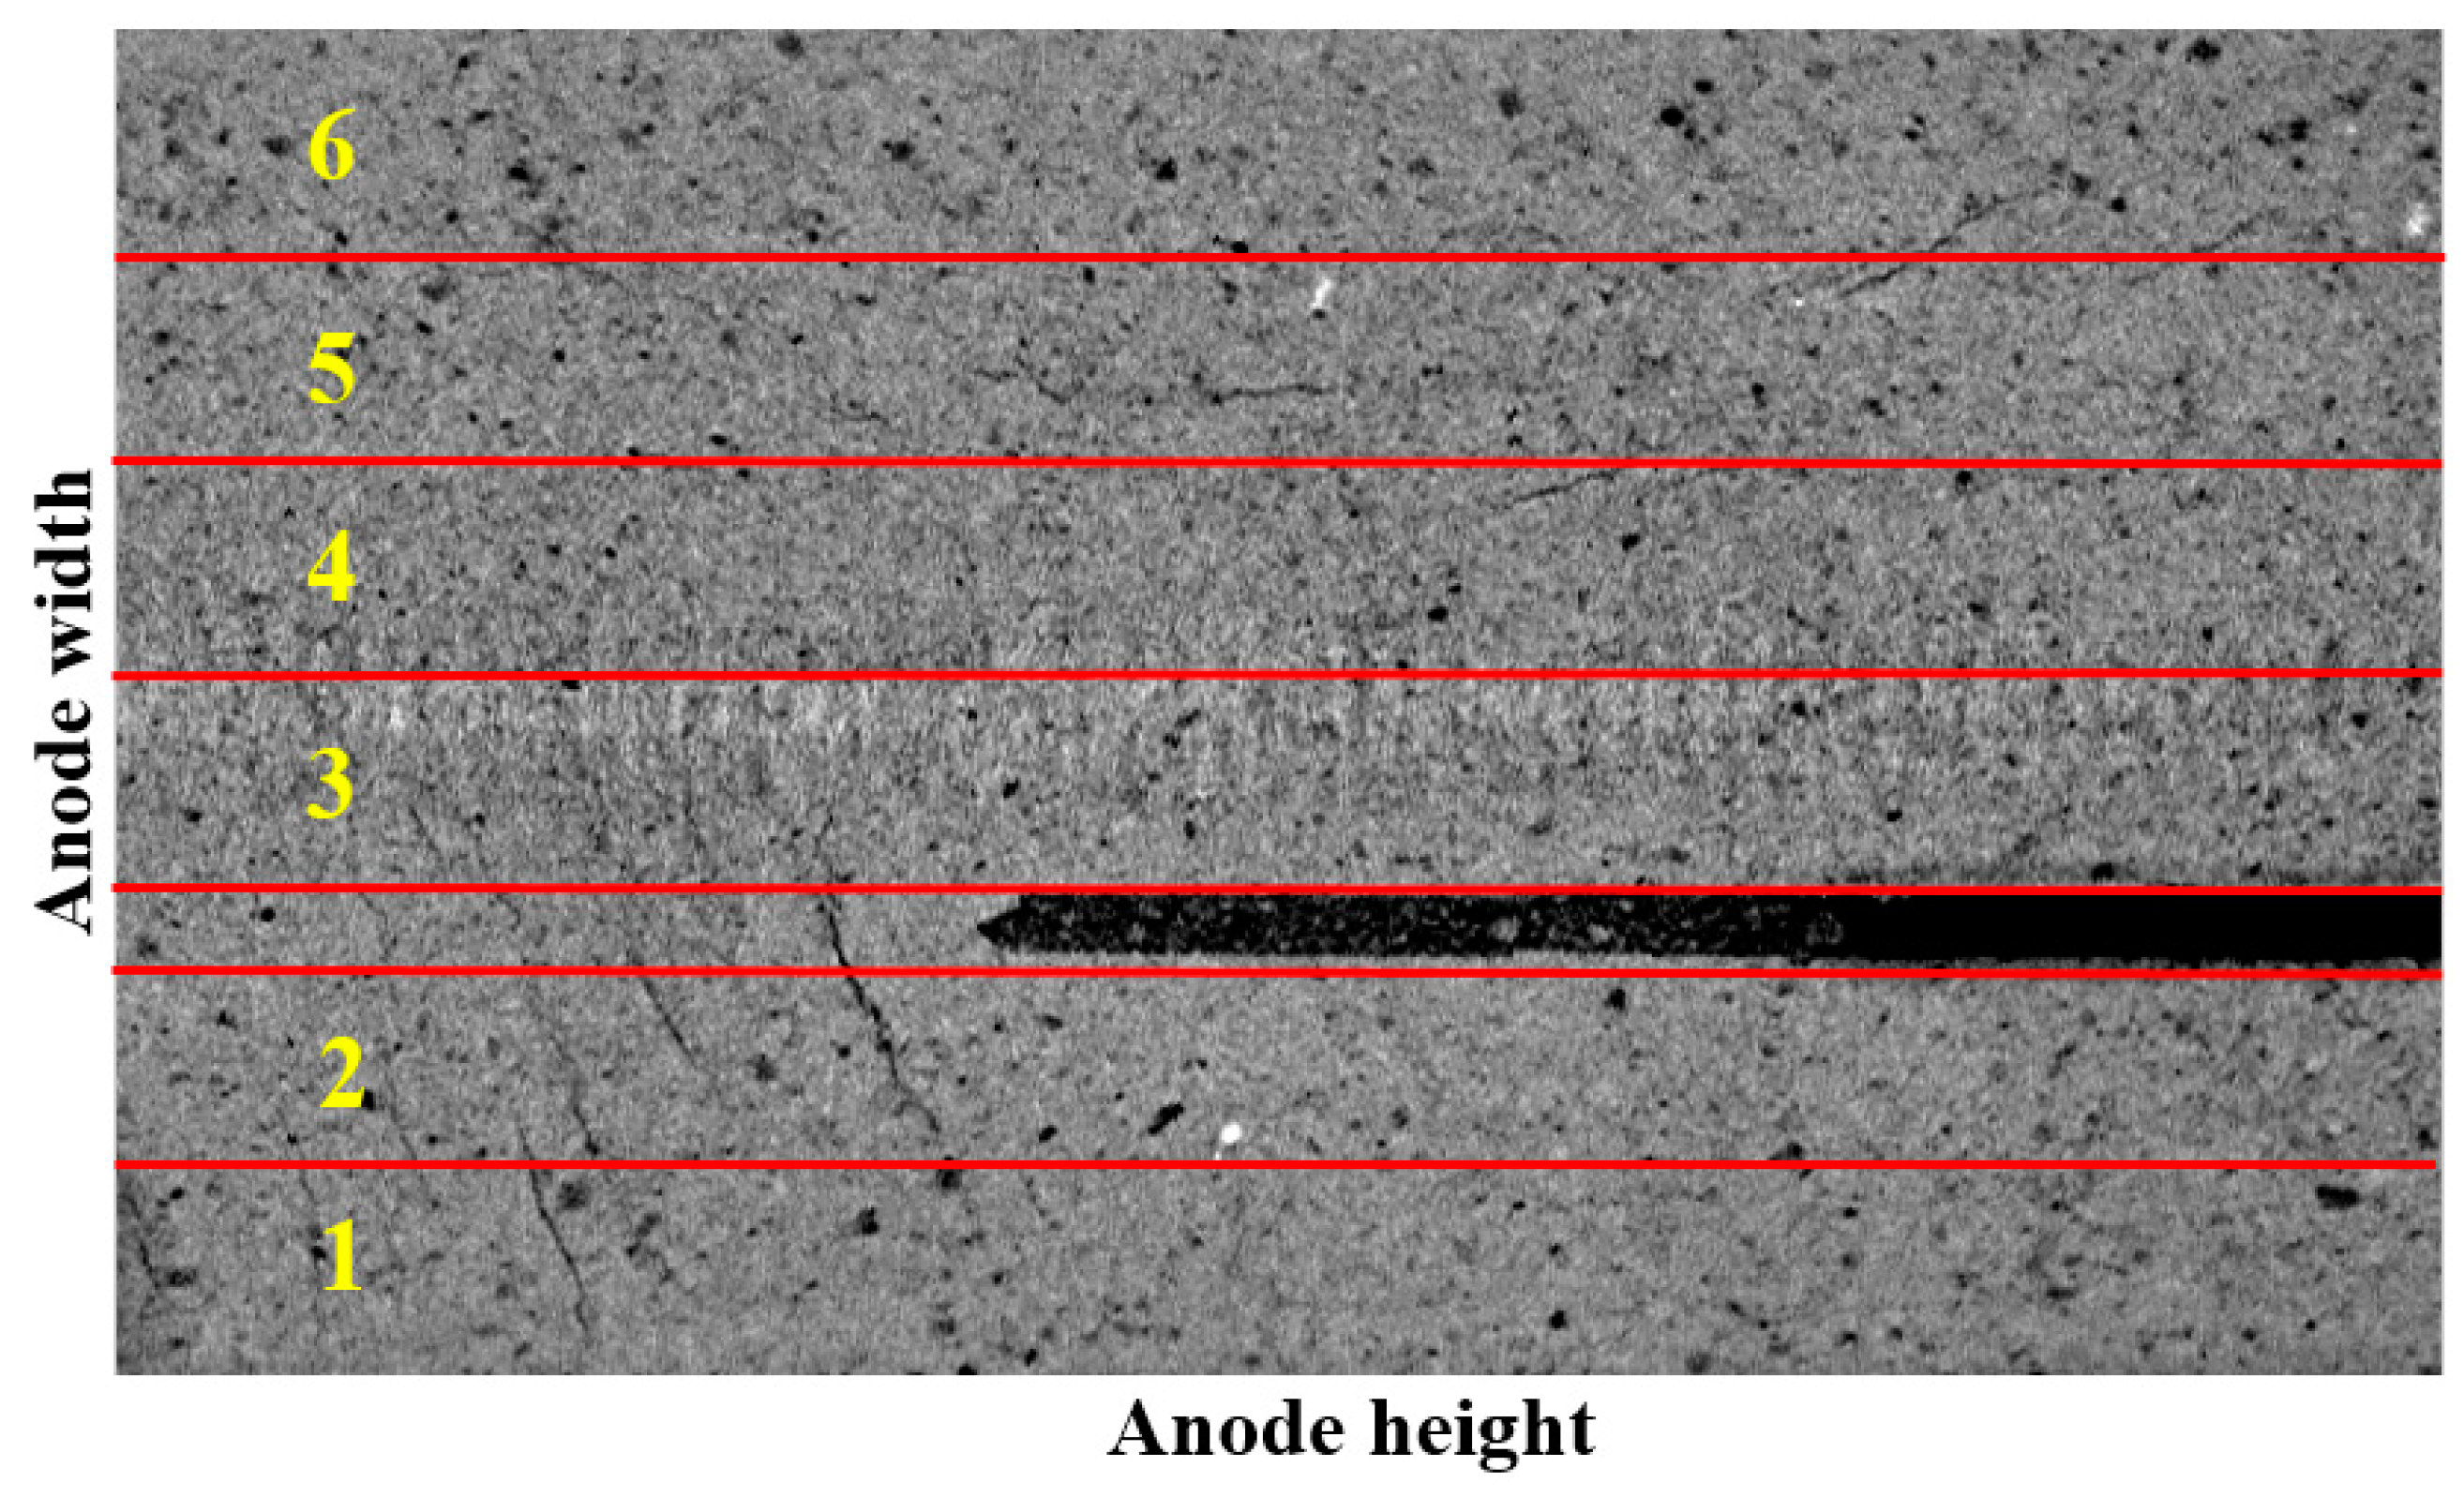
X). Those were labeled in the plot using the slice and corridor numbers (slice#_corridor#) presented in Figure 2. The clustering pattern in the t1t2 score space reveals that corridors 1–2, 3–5, and 6 of any slice roughly cluster in three groups (black, orange and blue markers, respectively). At this point, it is important to make a note that the corridors labeled #1 are located at the center of the anode and #6 at the outer surface. It can also be observed that the attenuation features of corridors 1–2 and 6 seem more variable than those of corridors 3–5 (the orange cluster is tighter than the black and blue clusters).
In order to interpret the differences between the three clusters based on the internal structure of the corridors, the CT scan images of the eight slices were examined first. To support the discussion, the images of four of these slices are provided in Figure 7. In general, it was found that the central/upper regions of corridors 1–2 in most slices were showing several cracks, whereas the lower part of these corridors had a high density of pores. Corridors 3–5 were much denser with a few cracks, sometimes extending from corridors 1–2 in the transverse direction. Finally, corridor 6 rarely showed cracks but had a variable density of pores. Therefore, the clustering pattern shown in the score plot (Figure 6) suggests that the first component (t1) is sensitive to the presence of cracks because, from right to left in the score plot (along the t1 direction), the corridors cluster according to the increasing presence of cracks. The second component (t2), on the other hand, seems to distinguish dense from porous regions. Corridors 3–5 (orange markers) are denser and cluster in the negative t2 region as opposed to those corridors characterized by a high pore density (most of the corridors 1–2 and some 6) fall in the positive t2 region.
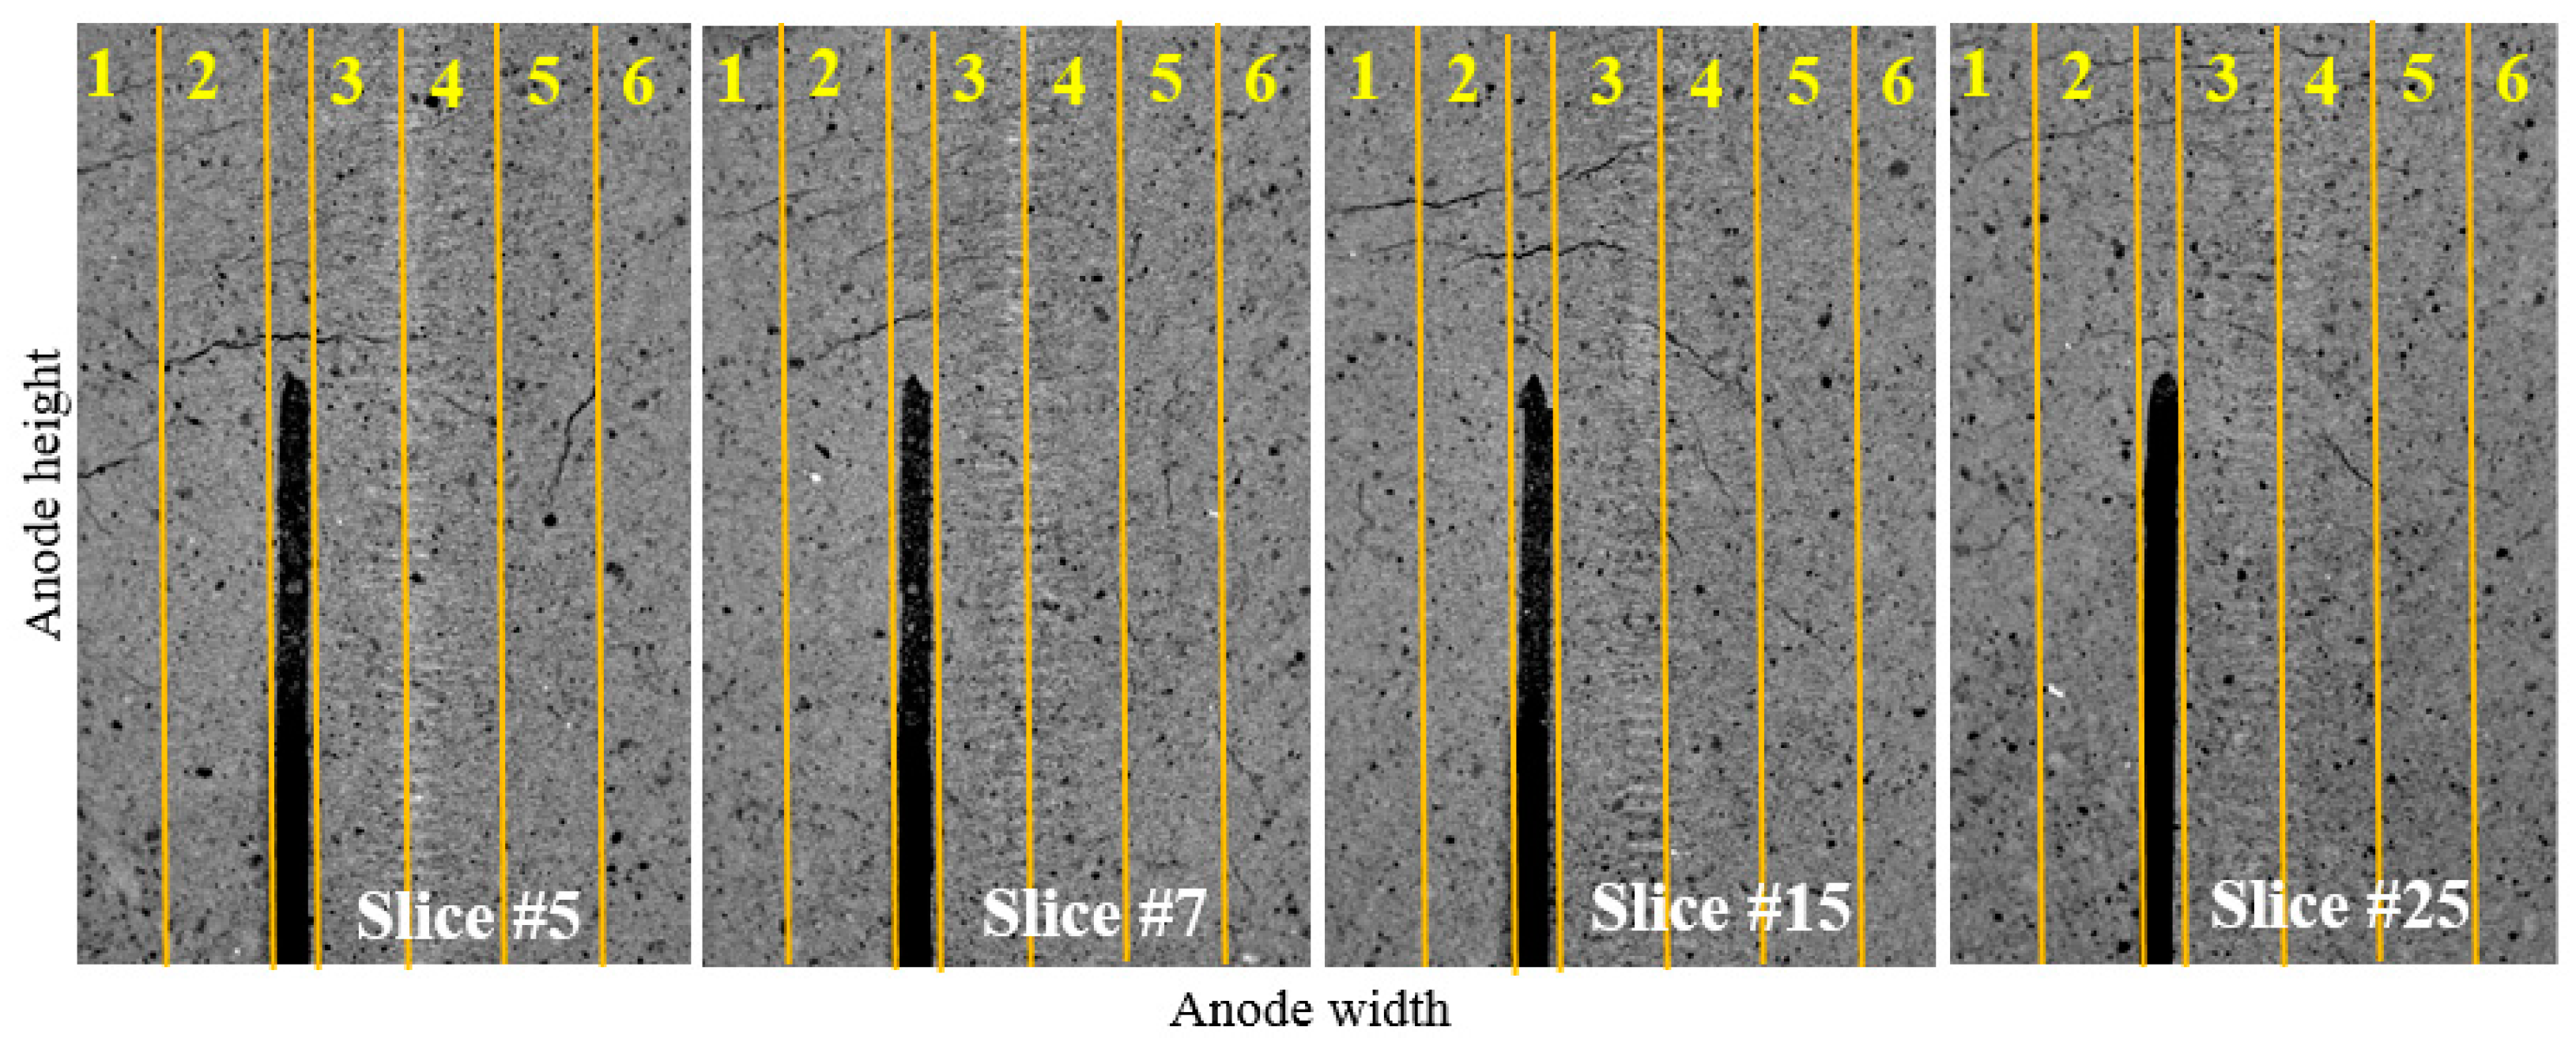
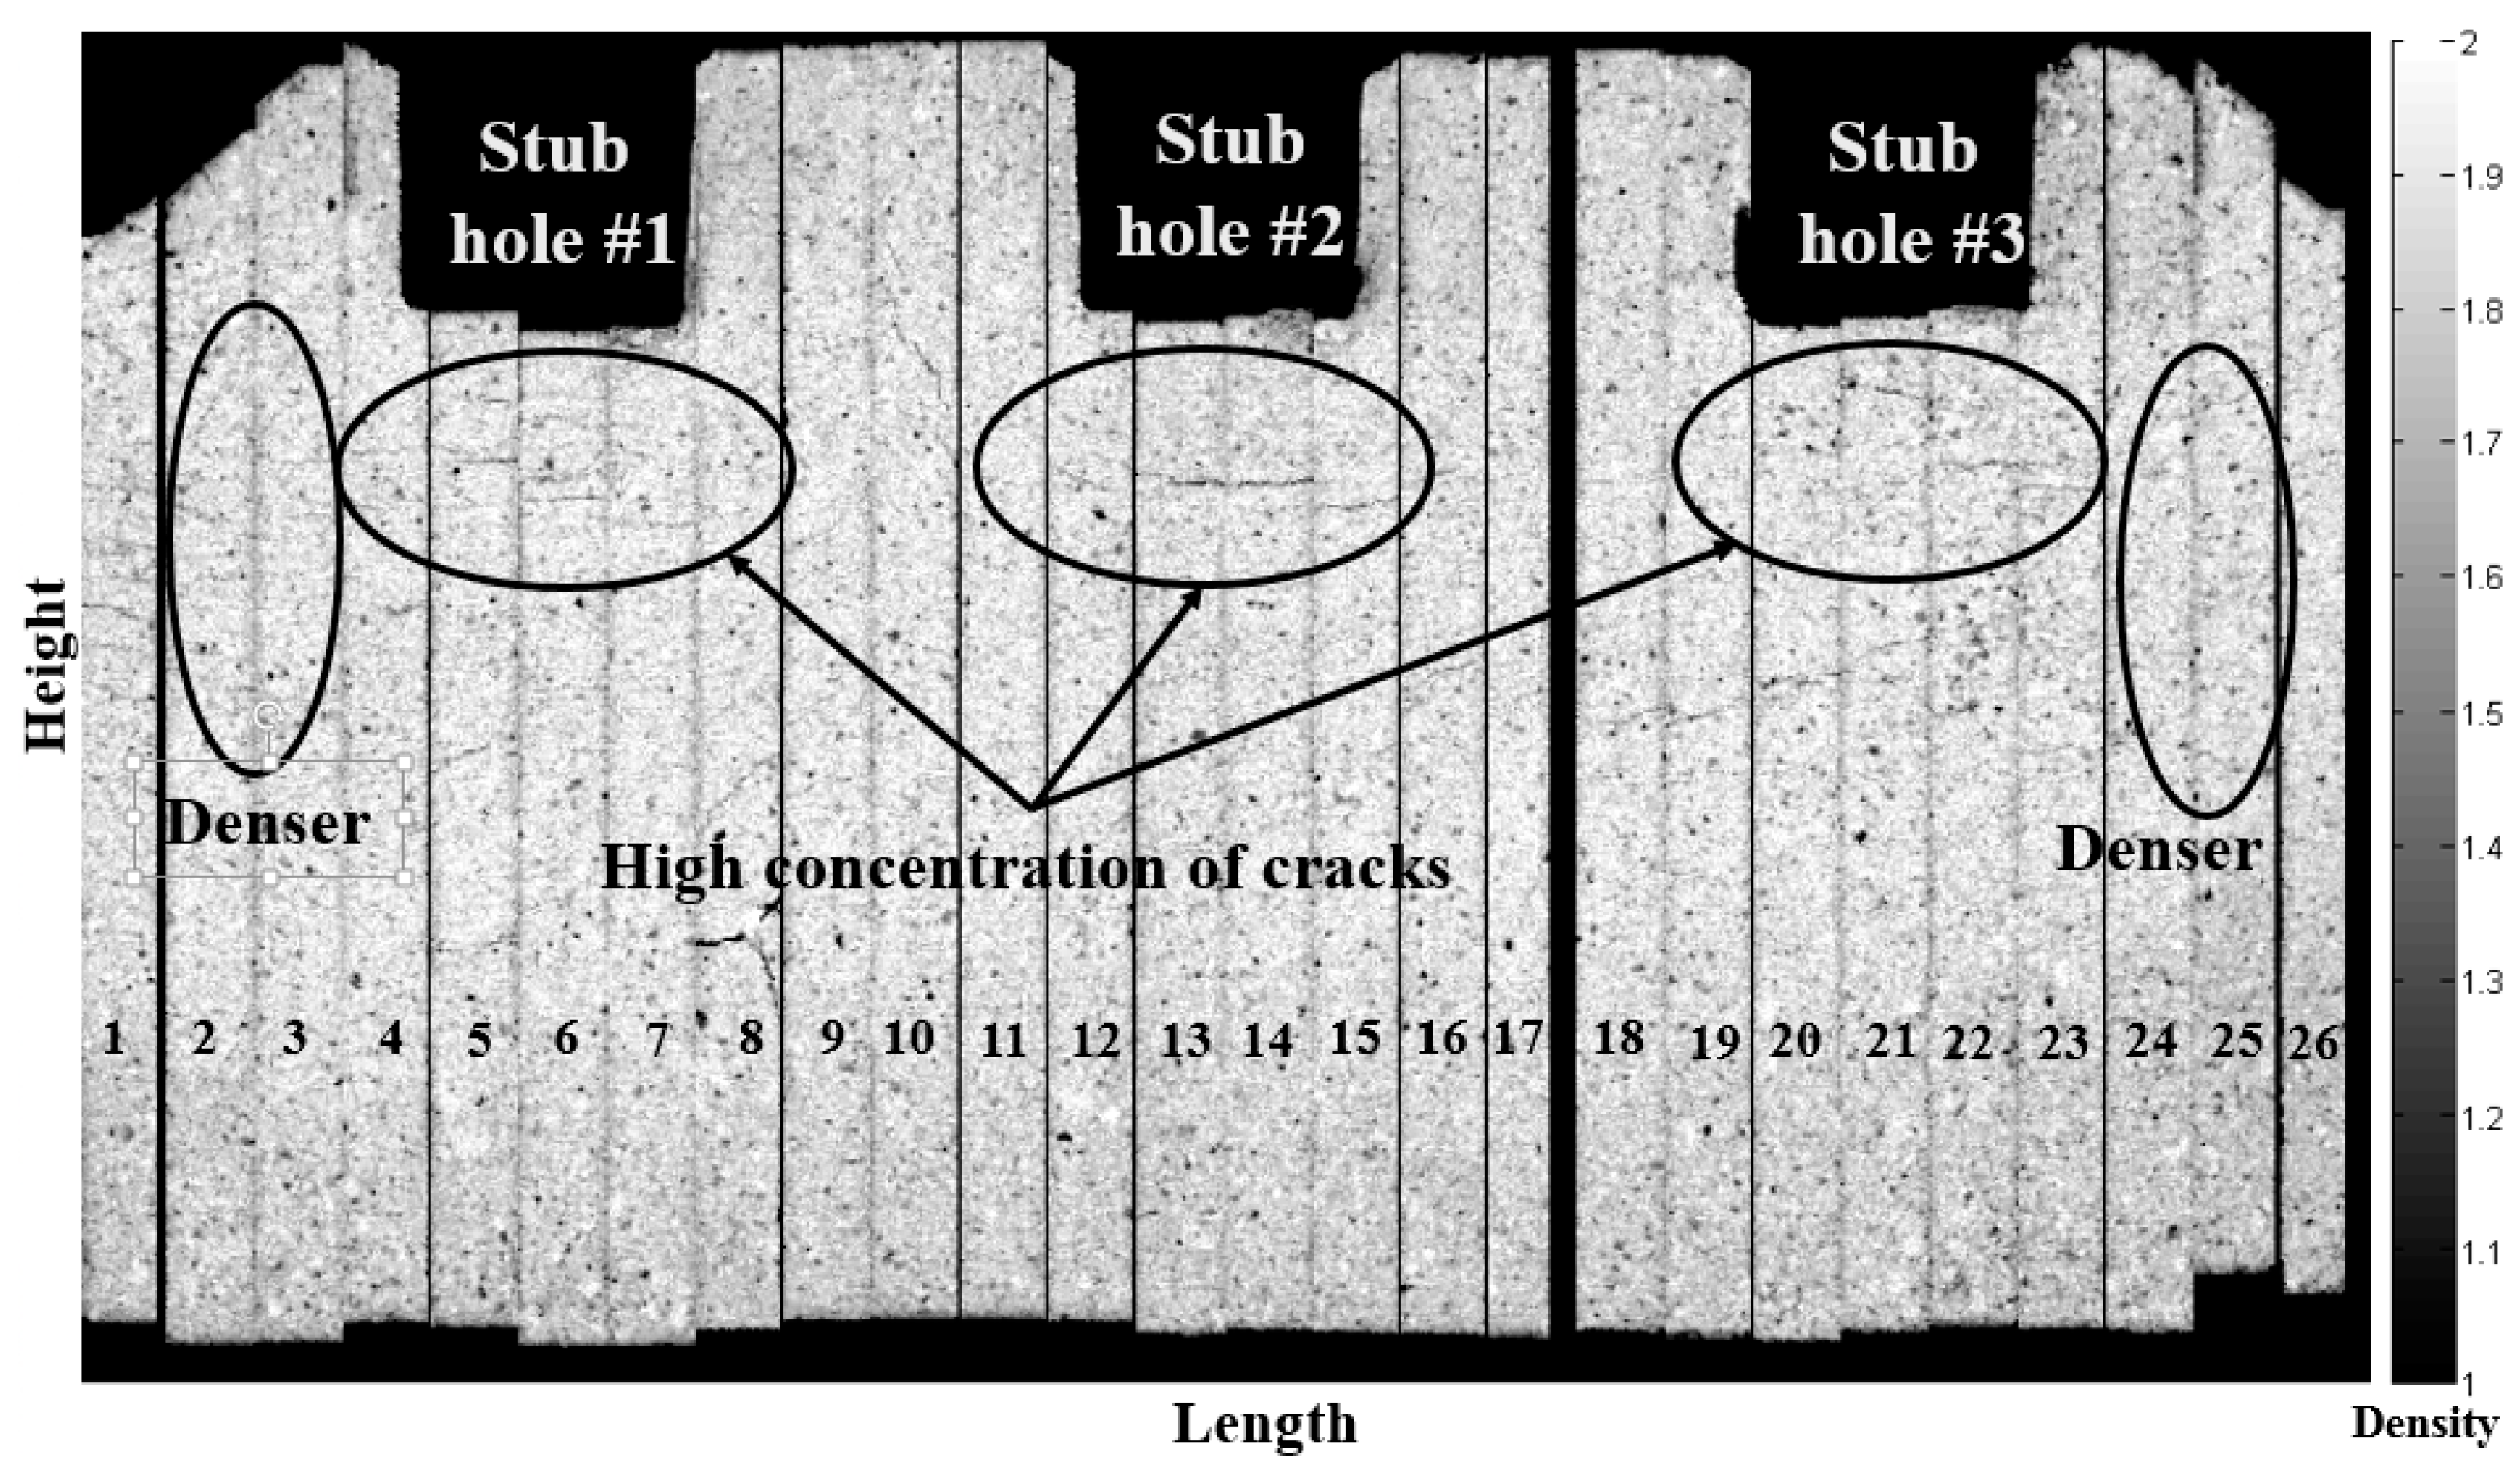
These results are also in agreement with carbon plant knowledge. The region below the stub holes corresponding to corridors 1–2 in slices #5, #7, #11, and #15 are generally expected to show a higher concentration of cracks, as shown in Figure 8. Most of these corridors fall in the cluster formed by the black markers. Corridors 1–2 in slices #24 and #25 (edges) project closer to the denser region (orange markers), which is normally expected unless cracks extend in the longitudinal direction from the center of the anode towards its surface, as seems to be the case for the other edge of the anode (slices #2 and #3). Finally, it is important to understand that the overlap between the clusters should not be interpreted as a misclassification as it was not attempted to do so. Although cracks and pores are expected to concentrate in certain regions within the anode block, they may very well be found in locations where they are less or not expected (hence the overlap between clusters) but still need to be detected by the inspection system. The color code used to distinguish the corridors and slices in Figure 6 was selected for illustration purposes only.
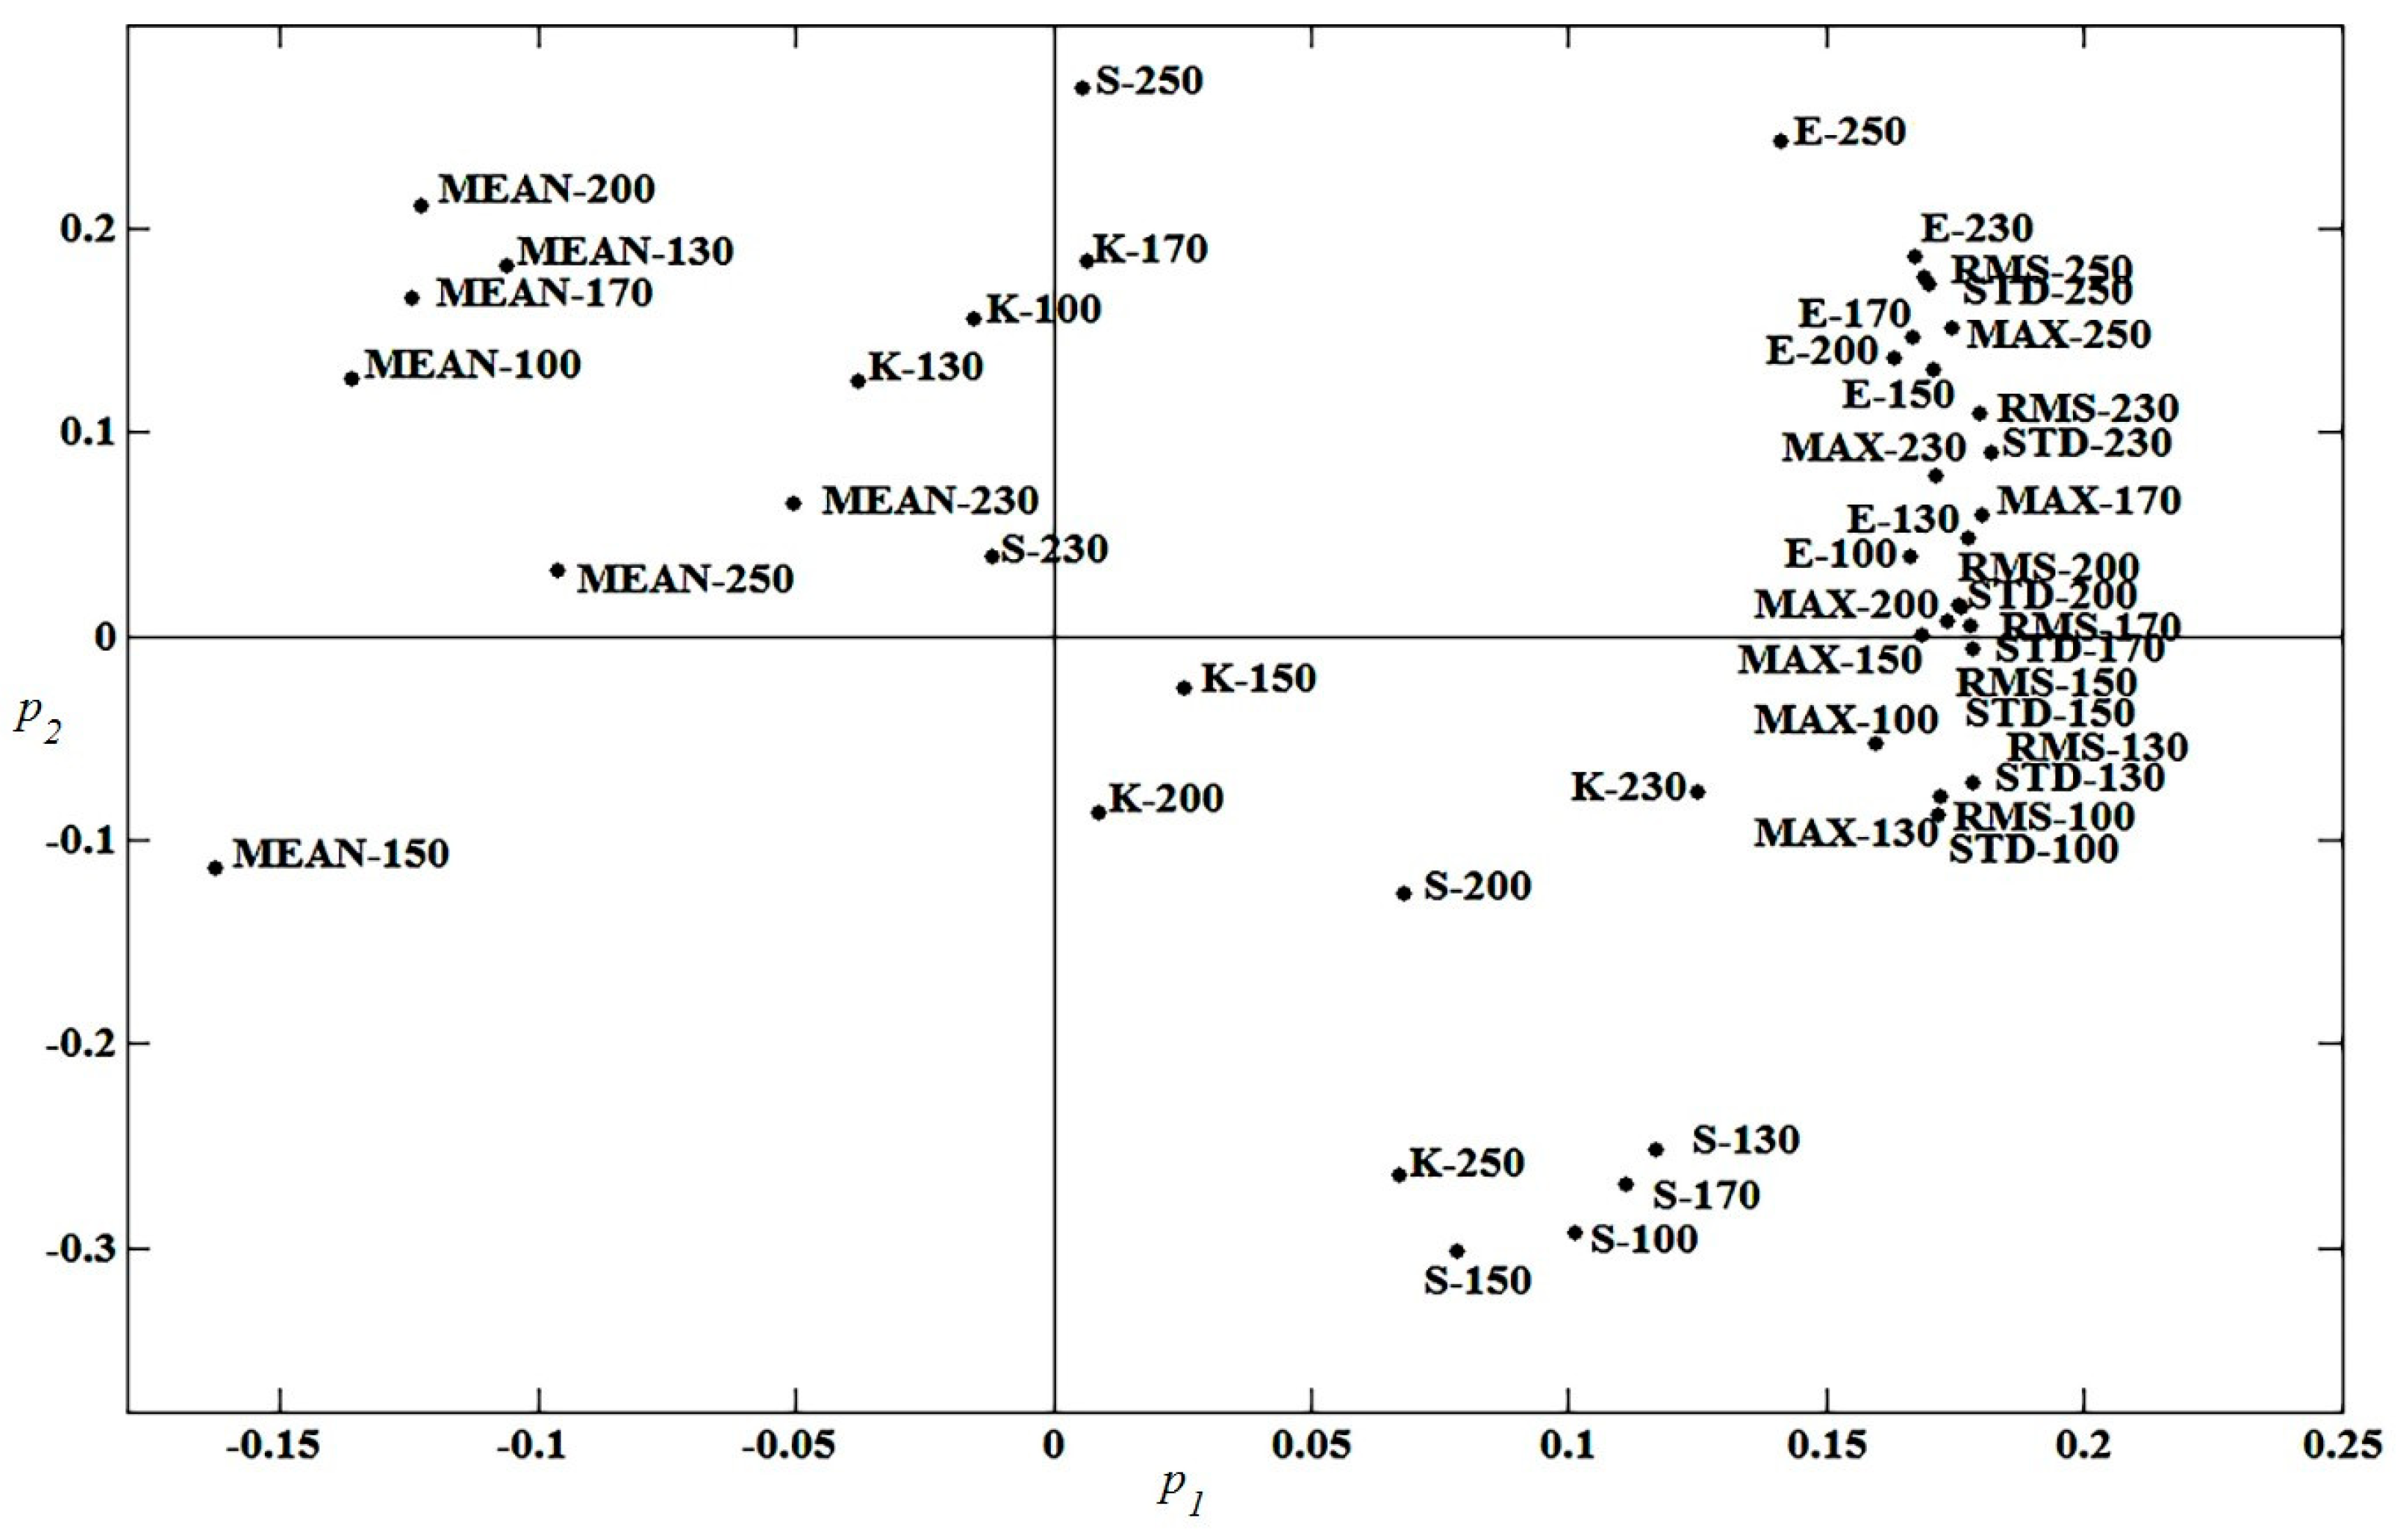
The relationships between the clusters in the score space (Figure 6) and the attenuation features are now interpreted using the p1p2 loading plot shown in Figure 9. As discussed previously, each score vector ta is defined as a linear combination of the attenuation features (i.e., ta = X × pa), and the loading vector pa contains the weights of each feature in that linear combination. The weights of each feature in both components are presented in the form of a scatter plot (Figure 9). Each point in this graph corresponds to one feature calculated at one excitation frequency (i.e., one column of X). The label of each point identifies the feature name followed by the excitation frequency.
The loading plot is interpreted as follows. The absolute value of the loading weights indicates the importance of the feature in a given component, whereas the sign of the weights informs about the sign of the correlation between pairs of features. Those features with loading values of the same sign are positively correlated while those with opposite signs are negatively correlated. Figure 9 reveals that the first component is mainly driven by the mean and the variance-related features (MAX, E, RMS and STD). In addition, the mean features have an opposite sign compared to the others, indicating that they are negatively correlated with MAX, E, RMS, and STD. This means that moving from the positive t1 region (a low concentration of cracks) towards negative t1 values (a high concentration of cracks) involves lower values of the variance-related features (MAX, E, RMS and STD) and higher values of the mean of the signal. This is consistent with AU signal attenuation by an increasing concentration of cracks. The second component (orthogonal to the first) involves most features except for the kurtosis and skewness (K and S) in particular, which were not as important in the first component. These features are negatively correlated at all frequencies, except for at 200 kHz. In addition, their loading values switch signs around that frequency. This suggests that the presence of pores modifies the shape of the distribution of the AU signal (as opposed to simple attenuation of the signal by cracks). Furthermore, the fact that the loading values for K and S are frequency-dependent may indicate that t2 is not only sensitive to pore concentration, but also to their size. For example, corridor #6 of slice 7 (see Figure 3) has a high concentration of large pores, corridors #1–2 are also characterized by large pores but they are fewer in number compared to corridor #6, and corridors #3–5 have smaller pores. In the score plot (Figure 6), corridor #6 has the highest t2 value, corridors #1–2 have intermediate values, and corridors #3–5 have the lowest values for this slice. Hence, the larger the pore size, the higher the t2 values. The relationship between pore size and the shape of the AU signals at different frequencies is currently being investigated further.

5. Conclusions

Defective baked carbon anodes decrease the performance of primary aluminum reduction processes by increasing energy and carbon consumption in the electrolysis cells. It is therefore important to detect them before they are set in reduction cells. However, the current quality control schemes used by most anode manufacturers based on core sampling and lab characterization are inadequate to cope with the currently decreasing quality and increasing variability of the anode raw materials. They can, at most, assess the quality of a small percent of the anode production. In addition, the time delay introduced by lab characterization is too long to allow timely feedback-corrective actions to be applied on the anode manufacturing process when deviations of anode properties from their target occur, and/or to reject and recycle the defect anodes. Hence, new rapid and non-destructive techniques are required for inspecting every individual baked anode before they are rodded and set in reduction cells.
The objective of this work was to investigate the potential of acousto-ultrasonic (AU) techniques to detect the presence of defects affecting the performance of baked anodes in the cells, such as pores and cracks, and to discriminate both types of defects. To achieve this goal, a full-scale anode was sliced in both longitudinal and transversal directions and imaged using X-ray Computed Tomography (CT Scan) to reveal its internal structure. Each half slice was further virtually divided into six corridors along the anode height, from the center of the anode to its external surface. At one end, the anode samples (corridors) were submitted to an acoustic excitation signal at seven different frequencies ranging from 100 to 250 kHz, while at the other end, the attenuated acoustic signals were recorded. A vector of temporal attenuation features was calculated from the attenuated signal of each anode sample. Principal component analysis (PCA) was then applied to the attenuation feature matrix in order to perform an unsupervised clustering of the acoustic response of each anode sample (i.e., the corridor in each tested slice).
The results have shown that the temporal features calculated from the AU signals are sensitive to the presence of cracks within the anode samples (measured by overall signal attenuation) and to the density of pores distributed throughout the material. It was also found that both types of defects have a different signature in the AU signals and could be discriminated in the PCA score space. Furthermore, it appears that some combinations of temporal AU features computed at various frequencies are correlated with pore size, although further work is required to confirm this. These results were validated qualitatively by using the CT scan images of the samples and they were also found in good agreement with anode manufacturing process knowledge.
The proposed approach appears very promising for full-scale anode inspection. In addition to detecting and discriminating important defects, the AU system could also provide measurements of the anode density distribution, a complement to the electrical resistivity measurements currently being developed in the field. Future work will concentrate on the scale-up of the approach to industrial-scale baked anodes and to investigate its robustness. Regarding the acoustic inspection set-up, minimizing the acquisition time of the acoustic signals at multiple points, coping with variations in anode surface quality (i.e., roughness) and a more complex geometry are the main challenges to be addressed for application at full scale. The analysis of the acoustic signals will also need to discriminate the variations in the signals caused by changes in raw material properties, anode formulation and process operations from internal defects.

Acknowledgments

The authors would like to acknowledge the financial support of the Natural Sciences and Engineering Research Council of Canada (NSERC), Fonds de Recherche du Québec—Nature et Technologies (FRQNT), Alcoa and the Aluminum Research Centre—REGAL. The assistance provided by REGAL personnel, Hugues Ferland and Guillaume Gauvin from Université Laval, in preparing the experimental set up is also greatly acknowledged.

Author Contributions

Moez Ben Boubaker, Donald Picard, Jayson Tessier and Carl Duchesne conceived and designed the experiments; Moez Ben Boubaker and Donald Picard performed the experiments; Moez Ben Boubaker and Carl Duchesne analyzed the data with the support of Mario Fafard and Houshang Alamdari in the results interpretation; Jayson Tessier supplied the materials; Moez Ben Boubaker, Donald Picard, and Carl Duchesne wrote the paper; Carl Duchesne, Houshang Alamdari and Mario Fafard revised the paper.

Conflicts of Interest

The authors declare no conflict of interest.

References

  1. Sinclair, K.A.; Sadler, B.A. Improving Carbon Plant Operations through the Better Use of Data. In Light Metals; John Wiley & Sons: Hoboken, NJ, USA, 2006; pp. 577–582. [Google Scholar]
  2. Sinclair, K.A.; Sadler, B.A. Which Strategy to Use When Sampling Anodes for Coring and Analysis. Start with How the Data Will Be Used. In Light Metals; John Wiley & Sons: Hoboken, NJ, USA, 2009; pp. 1037–1041. [Google Scholar]
  3. Seger, E.J. Method and Means for Measuring Electrode Resistance. U.S. Patent US3735253, 22 May 1973. [Google Scholar]
  4. Seger, E.J. New Method of Measuring Electric Resistance for Quality Control. In Light Metals; American Institute of Mining, Metallurgical and Petroleum Engineers: New York, NY, USA, 1978; pp. 283–290. [Google Scholar]
  5. Haldemann, P.R.; Fawzi, E.P. Methods and Apparatus for Non-destructively Detecting Flaws in a Carbon Anode. U.S. Patent US5473248, 5 December 1995. [Google Scholar]
  6. Chollier-Brym, M.J.; Laroche, D.; Alexandre, A.; Landry, M.; Simard, C.; Simard, L.; Ringuette, D. New Method for Representative Measurement of Anode Electrical Resistance. In Light Metals; John Wiley & Sons: Hoboken, NJ, USA, 2012; pp. 1299–1302. [Google Scholar]
  7. Léonard, G.; Guérard, S.; Laroche, D.; Arnaud, J.C.; Gourmaud, S.; Gagnon, M.; Marie-Chollier, M.J.; Perron, Y. Anode Electrical Resistance Measurements: Learning and Industrial On-line Measurement Equipment Development. In Light Metals; John Wiley & Sons: Hoboken, NJ, USA, 2014; pp. 1269–1274. [Google Scholar]
  8. Kocaefe, Y.; Kocaefe, D.; Bhattacharyay, D. Quality Control via Electrical Resistivity Measurement of Industrial Anodes. In Light Metals; John Wiley & Sons: Hoboken, NJ, USA, 2015; pp. 1097–1102. [Google Scholar]
  9. Andoh, M.A.; Kocaefe, Y.; Kocaefe, D.; Bhattacharyay, D.; Marceau, D.; Morais, B. Mesurement of the Electric Current Distribution in An Anode. In Light Metals; John Wiley & Sons: Hoboken, NJ, USA, 2016; pp. 889–894. [Google Scholar]
  10. Kurz, J.H.; Grosse, C.U.; Reinhardt, H.W. Strategies for reliable automatic onset time picking of acoustic emissions and of ultrasound signals in concrete. Ultrasonics 2005, 43, 538–546. [Google Scholar] [CrossRef] [PubMed]
  11. Briche, G.; Tessier-Doyen, N.; Huger, M.; Chotard, T. Investigation of the damage behaviour of refractory model materials at high temperature by combined pulse echography and acoustic emission techniques. J. Eur. Ceram. Soc. 2008, 28, 2835–2843. [Google Scholar] [CrossRef]
  12. Philippidis, T.P.; Aggelis, D.G. An acousto-ultrasonic approach for the determination of water-to-cement ratio in concrete. Cem. Concr. Res. 2003, 33, 525–538. [Google Scholar] [CrossRef]
  13. Allaire, C. Methods and Apparatus for Non-Destructive Testing of Materials Using Longitudinal Compression Waves. U.S. Patent Number 5040419 A, 20 August 1991. [Google Scholar]
  14. Allaire, C.; Allaire, J.; Carbonneau, A. Room and High Temperature Measurement of the Elastic Properties of Refractories Using a New Apparatus and Set-up. In Light Metals; John Wiley & Sons: Hoboken, NJ, USA, 2004; pp. 629–636. [Google Scholar]
  15. SonicByte. Available online: http://www.d4m.com/soluss/cir/web/document/SonicByte-Presentation.pdf (accessed on 2 September 2015).
  16. Picard, D.; Lauzon-Gauthier, J.; Duchesne, C.; Alamdari, H.; Fafard, M.; Ziegler, D. Automated Crack Detection Method Applied to CT Images of Baked Carbon Anode. In Light Metals; John Wiley & Sons: Hoboken, NJ, USA, 2014; pp. 1275–1280. [Google Scholar]
  17. Wold, S.; Esbensen, K.; Geladi, P. Principal component analysis. Chemom. Intell. Lab. Syst. 1987, 2, 37–52. [Google Scholar] [CrossRef]
  18. Ohtsu, M. Elastic wave methods for NDE in concrete based on generalized theory of acoustic emission. Constr. Build. Mater. 2016, in press. [Google Scholar] [CrossRef]
  19. Peter, J.D.G.; Peter, A.M.W.; Roger, B.F.J. Real-time frequency determination of acoustic emission for different fracture mechanisms in carbon/epoxy composites. Compos. Sci. Technol. 1995, 55, 405–412. [Google Scholar]
  20. Yang, L.; Kang, H.S.; Zhou, Y.C.; Zhu, W.; Cai, C.Y.; Lu, C. Frequency as a key parameter in discriminating the failure types of thermal barrier coatings: Cluster analysis of acoustic emission signals. Surf. Coat. Technol. 2015, 264, 97–104. [Google Scholar] [CrossRef]
  21. Johnson, M. Waveform based clustering and classification of AE transients in composite laminates using principal component analysis. NDT E Int. 2002, 35, 367–376. [Google Scholar] [CrossRef]
  22. Miller, R.K.; McIntire, P. Nondestructive Testing Handbook—Acoustic Emission Testing; American Society for Nondestructive Testing: Columbus, OH, USA, 1987; p. 30. [Google Scholar]
  23. Wold, S. Cross-validatory estimation of the number of components in factor and principal component models. Technometrics 1978, 20, 397–405. [Google Scholar] [CrossRef]
Figure 1. The acoustic inspection system. (1) Multi-channel acoustic emission system, (2) acoustic sensors, (3) pre-amplifier, (4) AEwin™ software (Physical Acoustics, version E3.41, Princeton Jct., NJ, USA, 2008), (5) coupling gel.
Metals 06 00151 g001
Figure 2. The sliced baked anode. (a): The selected eight slices are identified in red; (b): Example of the seventh slice used for acoustic testing.
Metals 06 00151 g002
Figure 3. Example X-ray Computed Tomography (CT scan) image obtained for slice number 7. The 6 corridors within the slice are virtually divided by red lines and are identified by numbers 1–6. The black region correspond to one of the anode slot.
Metals 06 00151 g003
Figure 4. Acoustic data acquisition set up through different corridors of an anode slice. The corridors are identified by numbers in the figure.
Metals 06 00151 g004
Figure 5. Examples of raw acoustic signals acquired at different excitation frequencies.
Metals 06 00151 g005
Figure 6. The t1t2 score plot of the principal component analysis (PCA) model built on acousto-ultrasonic (AU) signal attenuation features.
Metals 06 00151 g006
Figure 7. X-ray images showing the distribution of cracks and pores through different corridors for selected anode slices.
Metals 06 00151 g007
Figure 8. X-ray images showing a transversal section of the sliced anode.
Metals 06 00151 g008
Figure 9. The p1p2 loading plot of the PCA model built on AU signal attenuation features. MAX: maximum, STD: standard deviation, E: energy, RMS: root mean square, S: skewness, K: kurtosis. Numbers next to the feature names indicate the excitation frequency (kHz).
Metals 06 00151 g009
Table 1. Percent cumulative sum of squares explained (R2) and predicted (Q2) by the principal component analysis (PCA) model built on attenuation features collected from anode slices.
ComponentR2 (%)Q2 (%)
156.549.3
265.256.0

