Article

Hot Deformation Behaviour of Q690 High-Strength Steel

1
School of Materials Science and Engineering, Inner Mongolia University of Technology, Hohhot 010051, China
2
Zhejiang Metallurgical Research Institute Co., Ltd., Hangzhou 310007, China
*
Author to whom correspondence should be addressed.
Metals 2026, 16(9), 1042; https://doi.org/10.3390/met16091042 (registering DOI)
Submission received: 31 August 2026 / Revised: 11 September 2026 / Accepted: 17 September 2026 / Published: 19 September 2026
(This article belongs to the Special Issue Advanced High-Performance Steels: From Fundamental to Applications)

Abstract

This study systematically investigated the thermal deformation characteristics of industrial-grade Q690 HSLA steel under different temperatures and strain rates through isothermal compression tests conducted on the Gleeble-3500 simulator. The flow stress of Q690 steel exhibits significant sensitivity to deformation parameters (850–1150 °C and 0.001–10 s−1), characterized by a pronounced thermal softening effect at higher temperatures and strain-rate hardening as the strain rate increases. Through the construction of processing maps, we identified an optimal processing window within the temperature range of 1000–1100 °C and strain rates of 0.01–0.1 s−1, where the power dissipation efficiency (η) reaches a peak of 0.34, indicating superior hot workability. Conversely, flow instability zones were predominantly observed at lower temperatures and higher strain rates, with these regions expanding as strain increased. By integrating flow curve analysis, instability criteria, and microstructural characterization, we determined that complete dynamic recrystallization (DRX) is achieved at 1050 °C and 0.1 s−1. Under these conditions, the material exhibits a refined, homogeneous equiaxed grain structure with uniform martensitic laths and an average prior austenite grain size of approximately 9.88 µm.

1. Introduction

As the trend in construction machinery shifts toward larger scales, lightweight designs, and enhanced performance, increasingly stringent requirements are imposed on structural steels [1]. As a representative low-alloy high-strength steel, Q690 steel has been widely utilized in critical components—such as chassis, crane booms, and bucket base/side plates—due to its exceptional strength-toughness balance, impact resistance, and weldability [2]. These components are typically manufactured via hot forging or hot rolling. However, Q690 steel exhibits high deformation resistance and extreme sensitivity to thermo-mechanical processing parameters. Inappropriate processing windows not only impose excessive loads on machinery but also induce grain coarsening and flow instability. Consequently, a comprehensive investigation into the hot deformation behavior of Q690 steel under hot-rolling conditions is of significant engineering importance for optimizing industrial rolling parameters and ensuring microstructural homogeneity.
Current research on the hot deformation of high-strength steels primarily relies on constitutive equations and processing maps. Existing literature has systematically established strain-compensated Arrhenius constitutive models based on the Zener–Hollomon parameter [3,4]. Furthermore, the dynamic materials model (DMM) has been effectively employed to construct processing maps, delineating safe processing windows dominated by dynamic recrystallization (DRX) from regions of flow instability [5,6]. Regarding Q690 steel, Liu et al. [7] demonstrated that variations in alloying elements (e.g., Cr) significantly influence flow stress, DRX kinetics, and thermal activation energy, necessitating precise control for industrial application. Huo et al. [8] observed that even with identical chemical compositions, Q690 steel processed via different routes (QT vs. TMCP) exhibits distinct strain-rate sensitivity, grain size, and microstructural characteristics. Notably, most existing studies define processing windows based solely on macroscopic parameters without validating or refining these zones through microstructural evolution analysis. This decoupling of macroscopic criteria from microstructural control mechanisms limits the mechanistic support for optimized processing windows, thereby constraining their practical engineering utility. Therefore, effective regulation of hot-processing parameters, complemented by rigorous microstructural characterization, is essential to ensure production safety and quality [9].
This study aims to elucidate the compressive flow behaviour and microstructural evolution of Q690 steel during high-temperature deformation. By constructing an Arrhenius-type constitutive model and developing processing maps, we analyze the influence of deformation temperature and strain rate on flow stress.

2. Materials and Methods

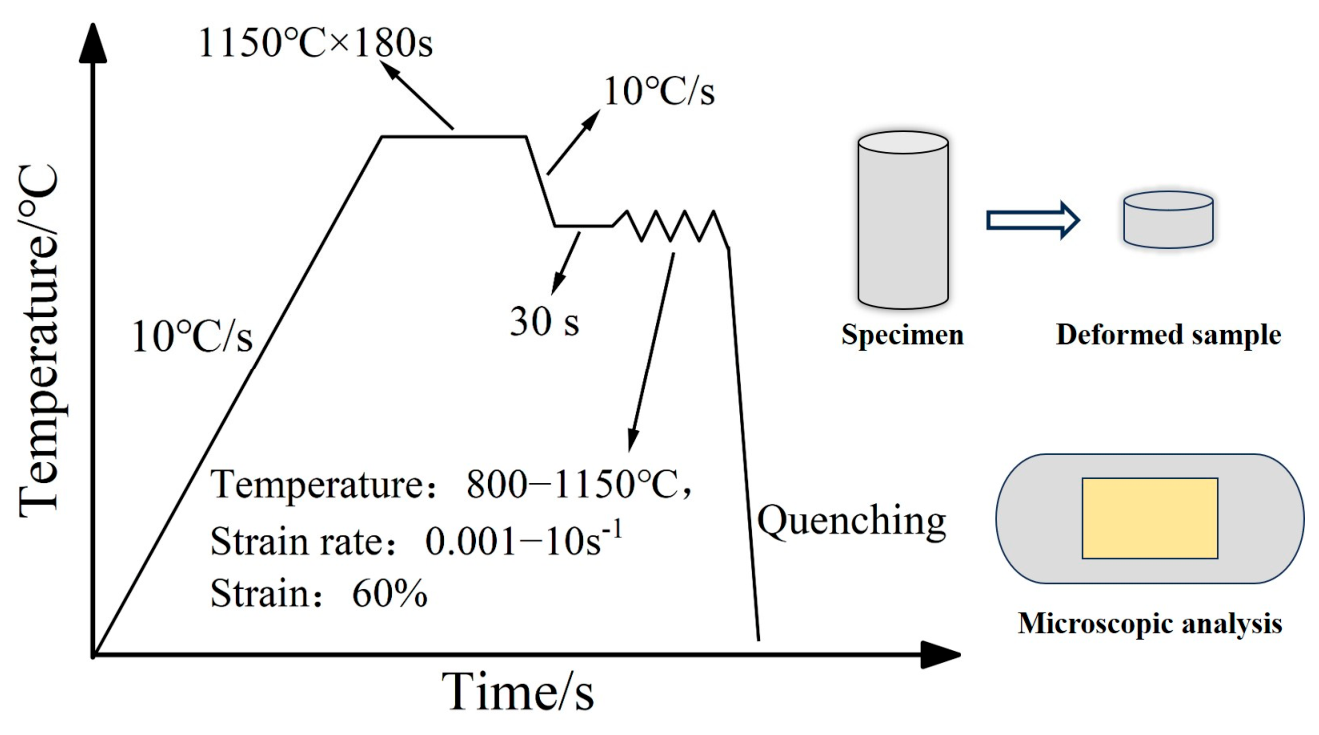
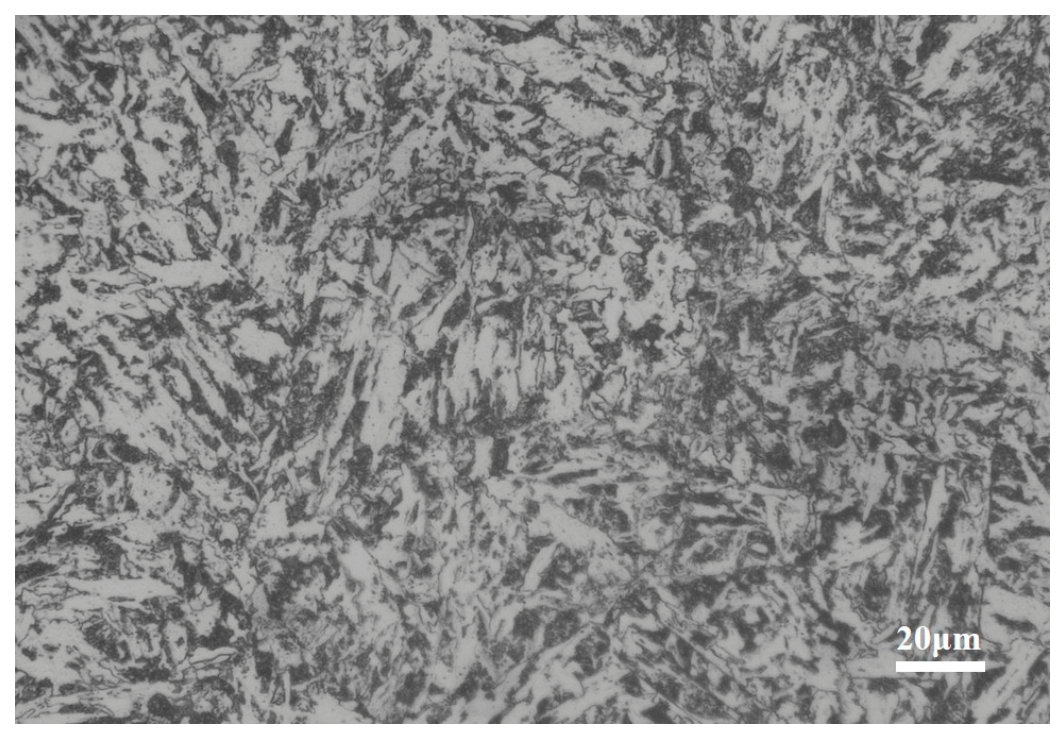
The experimental material utilized in this study was a 60-mm-thick hot-rolled Q690 high-strength steel plate produced by Baotou Iron and Steel (Group) Co., Ltd.; (Baotou, China) its chemical composition is detailed in Table 1. The initial microstructure, as illustrated in Figure 1, primarily consists of a mixture of bainite. Cylindrical specimens (φ8 × 12 mm) were extracted from the hot-rolled plate via wire electrical discharge machining (Jiangsu Dongqing CNC Machine Tool Co., Ltd., Taizhou, China). Isothermal compression tests were subsequently performed using a Gleeble-3500 thermal simulator (Dynamic Systems Inc., Poestenkill, NY, USA). The specimens were heated to 1150 °C at a rate of 10 °C/s and held for 180 s to ensure thermal equilibrium, followed by controlled cooling to the target deformation temperatures (850–1150 °C). The deformation process was conducted at strain rates ranging from 0.001 to 10 s−1 to a total true strain of 60%. The comprehensive thermo-mechanical processing schedule is presented in Figure 2.
To minimize friction and ensure uniform deformation, high-temperature lubricant was applied to both ends of the specimens, which were then sandwiched between tantalum foils and graphite spacers. The graphite spacers were employed to enhance contact quality between the specimen and the anvils, ensuring uniform electrical conductivity and preventing temperature gradients caused by poor contact. The tantalum foils served as diffusion barriers to prevent the migration of carbon from the graphite spacers into the specimen, thereby maintaining the integrity of the chemical composition. Immediately following compression, the specimens were subjected to water quenching to effectively preserve the high-temperature deformed microstructure.
For microstructural characterization, the compressed specimens were sectioned parallel to the compression axis using WEDM. The central regions were then ground and polished. The microstructures were revealed by etching with a 4% nital solution and subsequently examined via optical microscopy (Olympus Corporation, Tokyo, Japan) and scanning electron microscopy (SEM). To delineate prior austenite grain boundaries (PAGBs), the specimens were etched in a saturated aqueous picric acid solution (2–3 g picric acid, 1–2 g detergent, and 50 mL deionized water). The reagent was heated in a 60 °C water bath with the addition of a few drops of hydrogen peroxide to enhance etching efficiency. After mechanical polishing, the specimens were immersed in the reagent for 3–5 min, followed by surface cleaning and OM observation. The grain size distribution was quantitatively analyzed using Image-Pro-Plus 6.0 software. To ensure the reliability of the statistical results, the number of grains measured for each sample exceeded 200. The grain boundaries were precisely extracted through image binarization and morphological processing techniques to reduce measurement errors. The grain size was defined as the equivalent circular diameter (ECD), which was calculated based on the projected area of the grains. The microstructure characteristics of the samples were comprehensively characterized by calculating the average grain size, standard deviation, and drawing the size distribution histogram.

3. Results

3.1. Thermal Deformation Behaviour

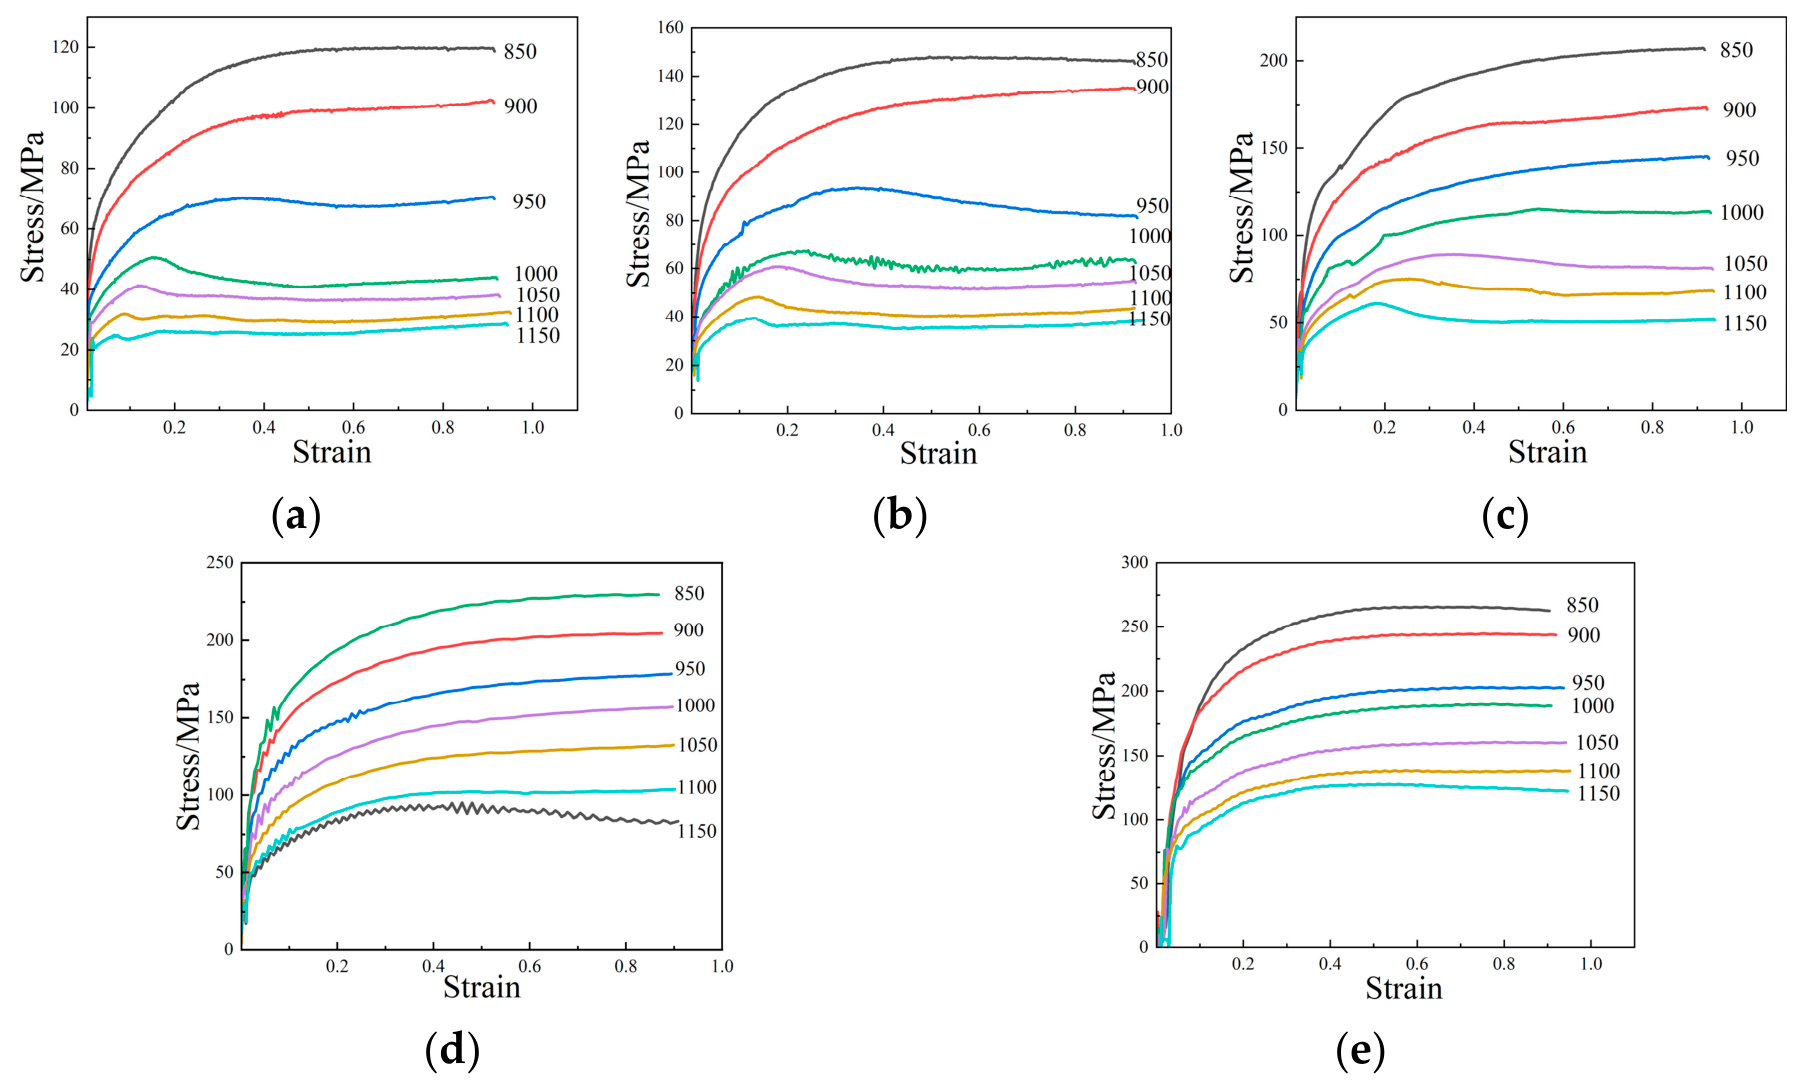
Figure 3 illustrates the true stress-true strain curves obtained at varying strain rates. The flow stress exhibits pronounced temperature sensitivity, decreasing significantly as the deformation temperature rises. Conversely, the material demonstrates high strain-rate sensitivity; at a fixed temperature, flow stress increases markedly with the strain rate. Comparing Figure 3a and Figure 3e, the peak stress at 850 °C escalates from 120.11 MPa to approximately 265.75 MPa as the strain rate increases from 0.001 s−1 to 10 s−1. Analysis of the curve morphology reveals that at high temperatures and low strain rates, the curves exhibit characteristic dynamic recrystallization (DRX) behaviour, marked by a rapid initial stress increase to a peak, followed by significant strain softening and eventual steady-state flow. In contrast, at low temperatures and high strain rates, the curves are dominated by dynamic recovery (DRV), characterized by a gradual transition to steady-state flow without a distinct post-peak softening stage.
The high-temperature, low-strain-rate regime is suggested primarily by DRX, facilitating the development of a refined and homogeneous microstructure, thus representing an optimal processing window. Conversely, the low-temperature, high-strain-rate regime is dominated by work hardening and DRV, resulting in elevated stress levels that may induce substantial residual stresses or microstructural heterogeneity. Furthermore, flow instabilities—manifested as pronounced oscillations in the flow curves—must be avoided to prevent cracking and non-uniform deformation.

3.2. Constitutive Equation

The relationship between flow stress (σ), strain rate ( ε ˙ ), and deformation temperature (T) is typically characterized by the following three constitutive equations [10]:
ε ˙ = A 1 σ n 1 exp Q R T
ε ˙ = A 2 exp β σ exp Q R T  
ε ˙ = A s i n h α σ n exp Q R T
where ε ˙ denotes the strain rate, σ the flow stress, T the absolute temperature, Q the activation energy for hot deformation, and R the universal gas constant. A 1 ,   A 2 ,     n ,   n 1 ,     α , and β are material-dependent constants [11]. To integrate the coupled effects of temperature and strain rate on deformation, the Zener–Hollomon parameter ( Z ) is introduced [12]:
Z = ε ˙ exp Q R T = A s i n h α σ n
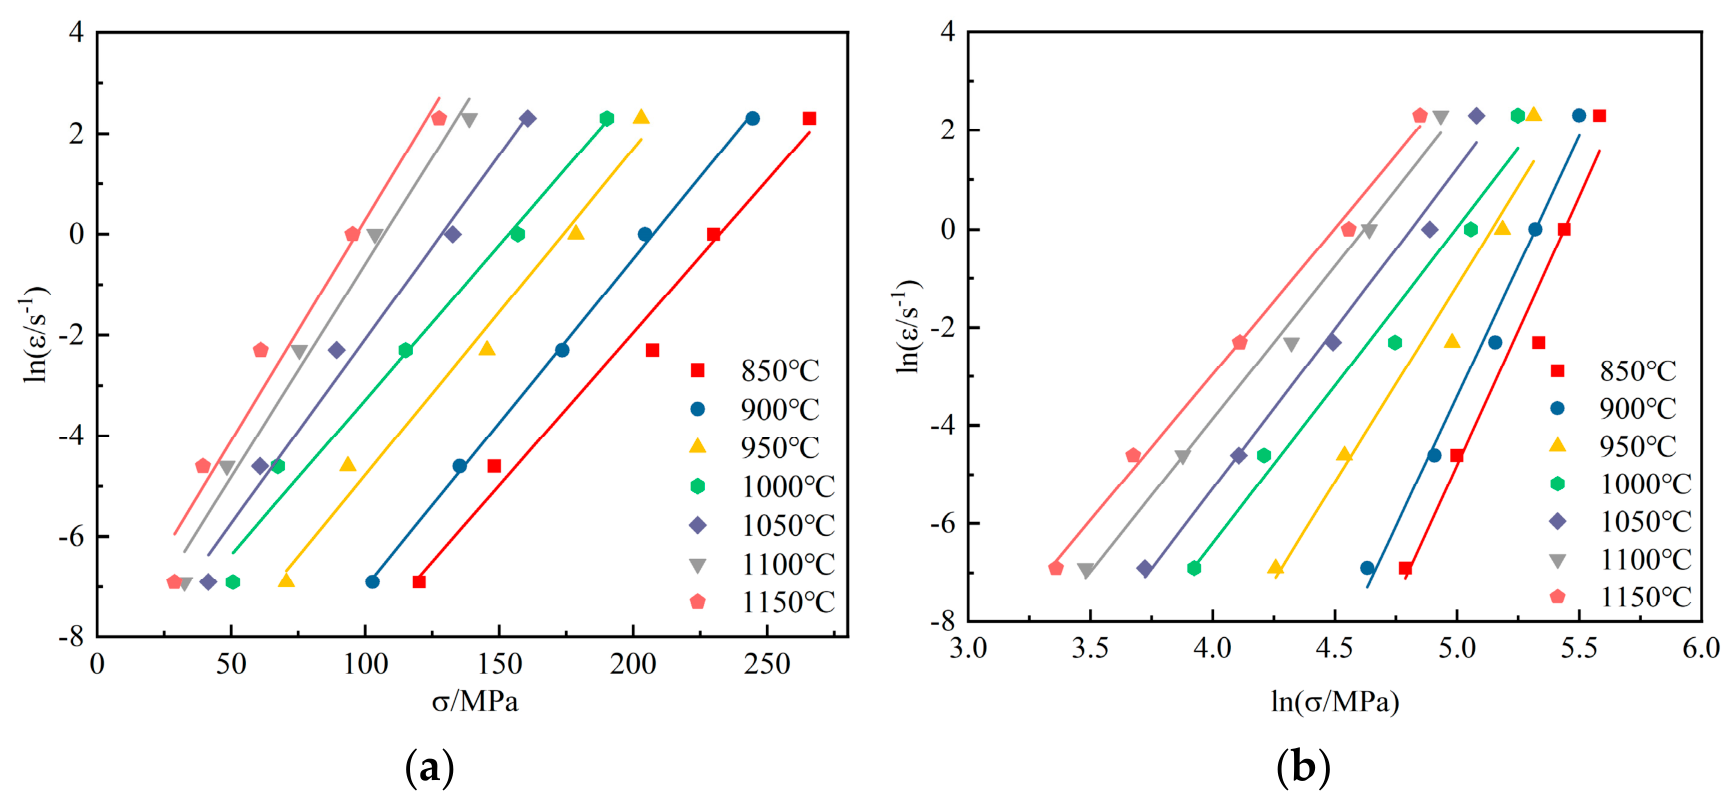
To determine the stress multiplier α , which adjusts the stress level, linear regressions were performed on ln ε ˙ versus ln σ and ln ε ˙ versus σ  to obtain the slopes n 1 and β , respectively, where α = β / n 1 . The linearized forms of Equations (5)–(7) are expressed as:
ln ε ˙ = ln A 1 + n 1 ln σ Q R T
ln ε ˙ = ln A 2 + β σ Q R T
ln ε ˙ = ln A + nln s i n h α σ Q R T
The calculated results are illustrated in Figure 4, yielding n 1 = 7.8053 , β = 0.0710   MPa 1 , and consequently α = 0.0091   MPa 1 . Linear fittings for n 1 , with R2 ranging from 0.9607 to 0.9949. Linear fittings for β , with R2 ranging from 0.9634 to 0.9986.
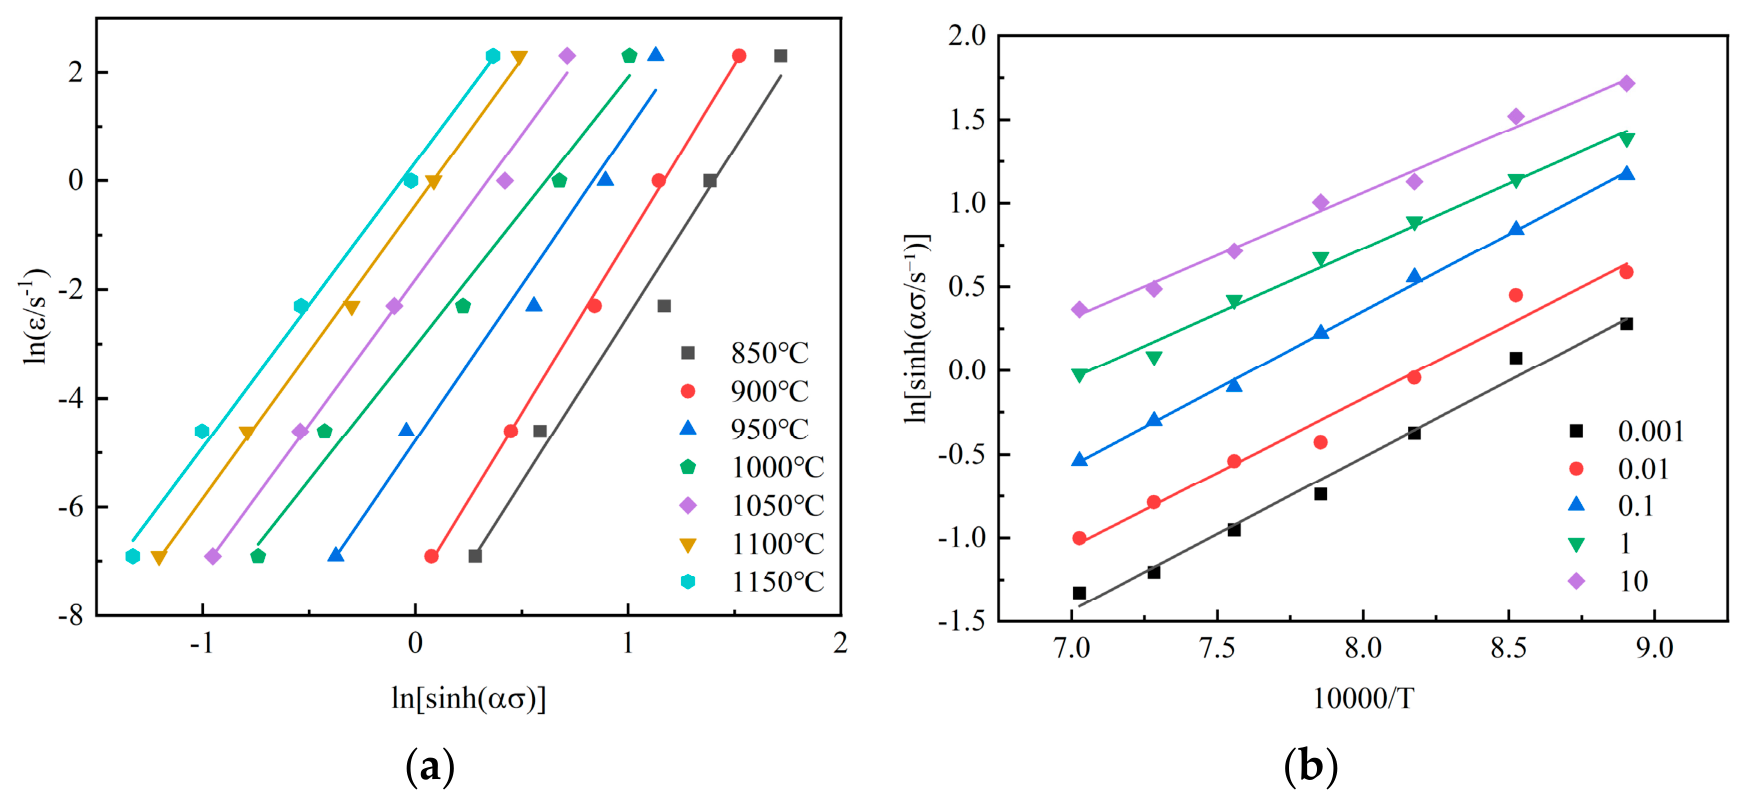
Upon determining α , the stress exponent n was derived from the logarithmic form of the hyperbolic sine equation. Linear regression of l n s i n h α σ against ln ε ˙ and 10 4 / T   was performed, where the slope represents the average value of n , as defined in Equation (8). Subsequently, Q , which characterizes the resistance to plastic deformation, was calculated using the slope of the latter regression:
ln s i n h α σ = ln ε ˙ ln A n + Q n R T
The results are presented in Figure 5, yielding n = 5.5965 and Q = 395,842.67   J / mol . Linear fittings for n , with R2 ranging from 0.9778 to 0.9985. Linear fittings for Q , with R2 ranging from 0.9797 to 0.9982.
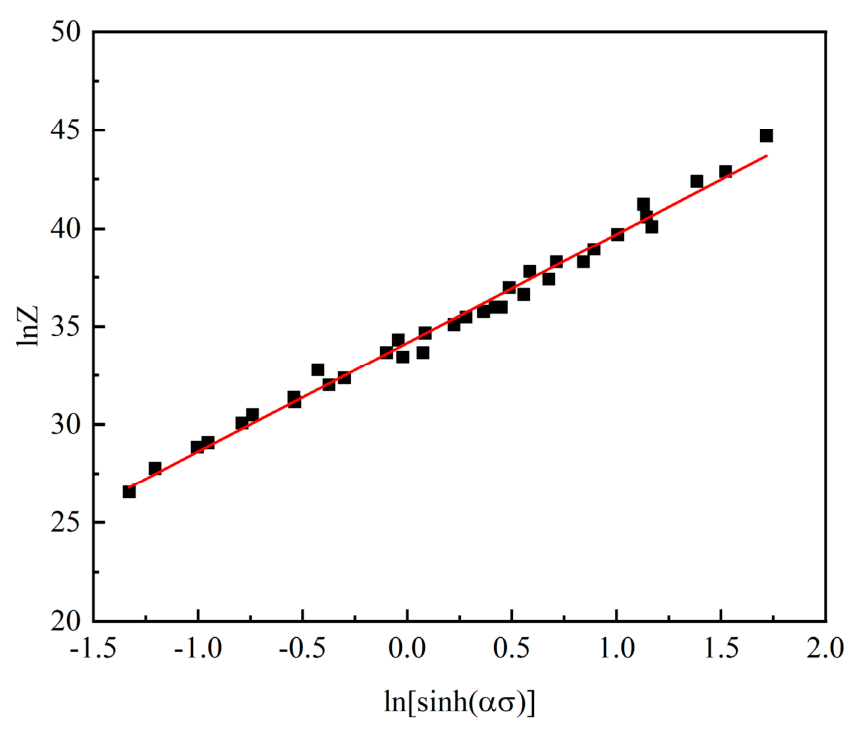
By incorporating the Zener–Hollomon parameter to consolidate temperature and strain rate into a single variable (Equation (9)), the material constant ln A was determined from the intercept of the linear fit between ln Z and l n s i n h α σ :
ln Z = ln A + nln s i n h α σ
As shown in Figure 6, the regression yielded ln A = 34.1633 and n = 5.5429 . Linear fittings for ln A with R2 yielded 0.98898.
To ensure the predictive accuracy and robustness of the constitutive model for subsequent finite element simulations, an iterative optimization process was employed to minimize the residuals between experimental data and model predictions. It is important to note that the determination of the apparent activation energy ( Q ) and the stress index ( n ) is inherently iterative because, in the hyperbolic sine Arrhenius constitutive equation, the stress level parameters, stress index, and activation energy are mutually coupled.
Initially, a rough estimate of the stress index is obtained through a power-law approximation at low stress levels by fitting the logarithm of the strain rate against the logarithm of the stress. Using this initial value, the stress level parameters are calculated, followed by a linear regression of the logarithm of the hyperbolic sine function against the reciprocal of the temperature to derive updated values for n and Q . This iteration continues until the variations in n and Q fall below a preset error tolerance. This approach significantly reduces calculation bias and enhances the linear correlation coefficient. Compared to the initial power-law estimation, the converged stress index covers the entire stress range and effectively captures the saturation characteristics of the hyperbolic sine function, thereby providing a physically meaningful basis for describing the thermal deformation behavior. This refinement resulted in an Average Absolute Relative Error (AARE) of less than 0.5%, with optimized parameters of ln A = 33.6471 , n = 5.5077 , and Q = 389,562.50   J / mol . The final constitutive equation for the Q690 high-strength steel is thus formulated as:
ε ˙ = 4.0998 × 10 14 s i n h 0.009 σ p 5.5077 exp 389562.5 8.314 T

3.3. Hot Processing Map

The strain rate sensitivity exponent ( m ), which quantifies a material’s capacity for energy dissipation during deformation, is defined by the following expression:
m = ln σ ln ϵ ˙ ϵ , T
Figure 7 illustrates the distribution of the strain rate sensitivity exponent m . Based on the processing map, the optimal hot-working parameters for the experimental steel are identified within the temperature range of 1050–1150 °C at a strain rate of approximately 0.01 s−1. Conversely, the region characterized by temperatures of 950–1050 °C and a strain rate near 1 s−1 should be avoided, particularly under high-strain conditions. In this domain, m approaches zero, signifying a high susceptibility to processing defects and flow instability.
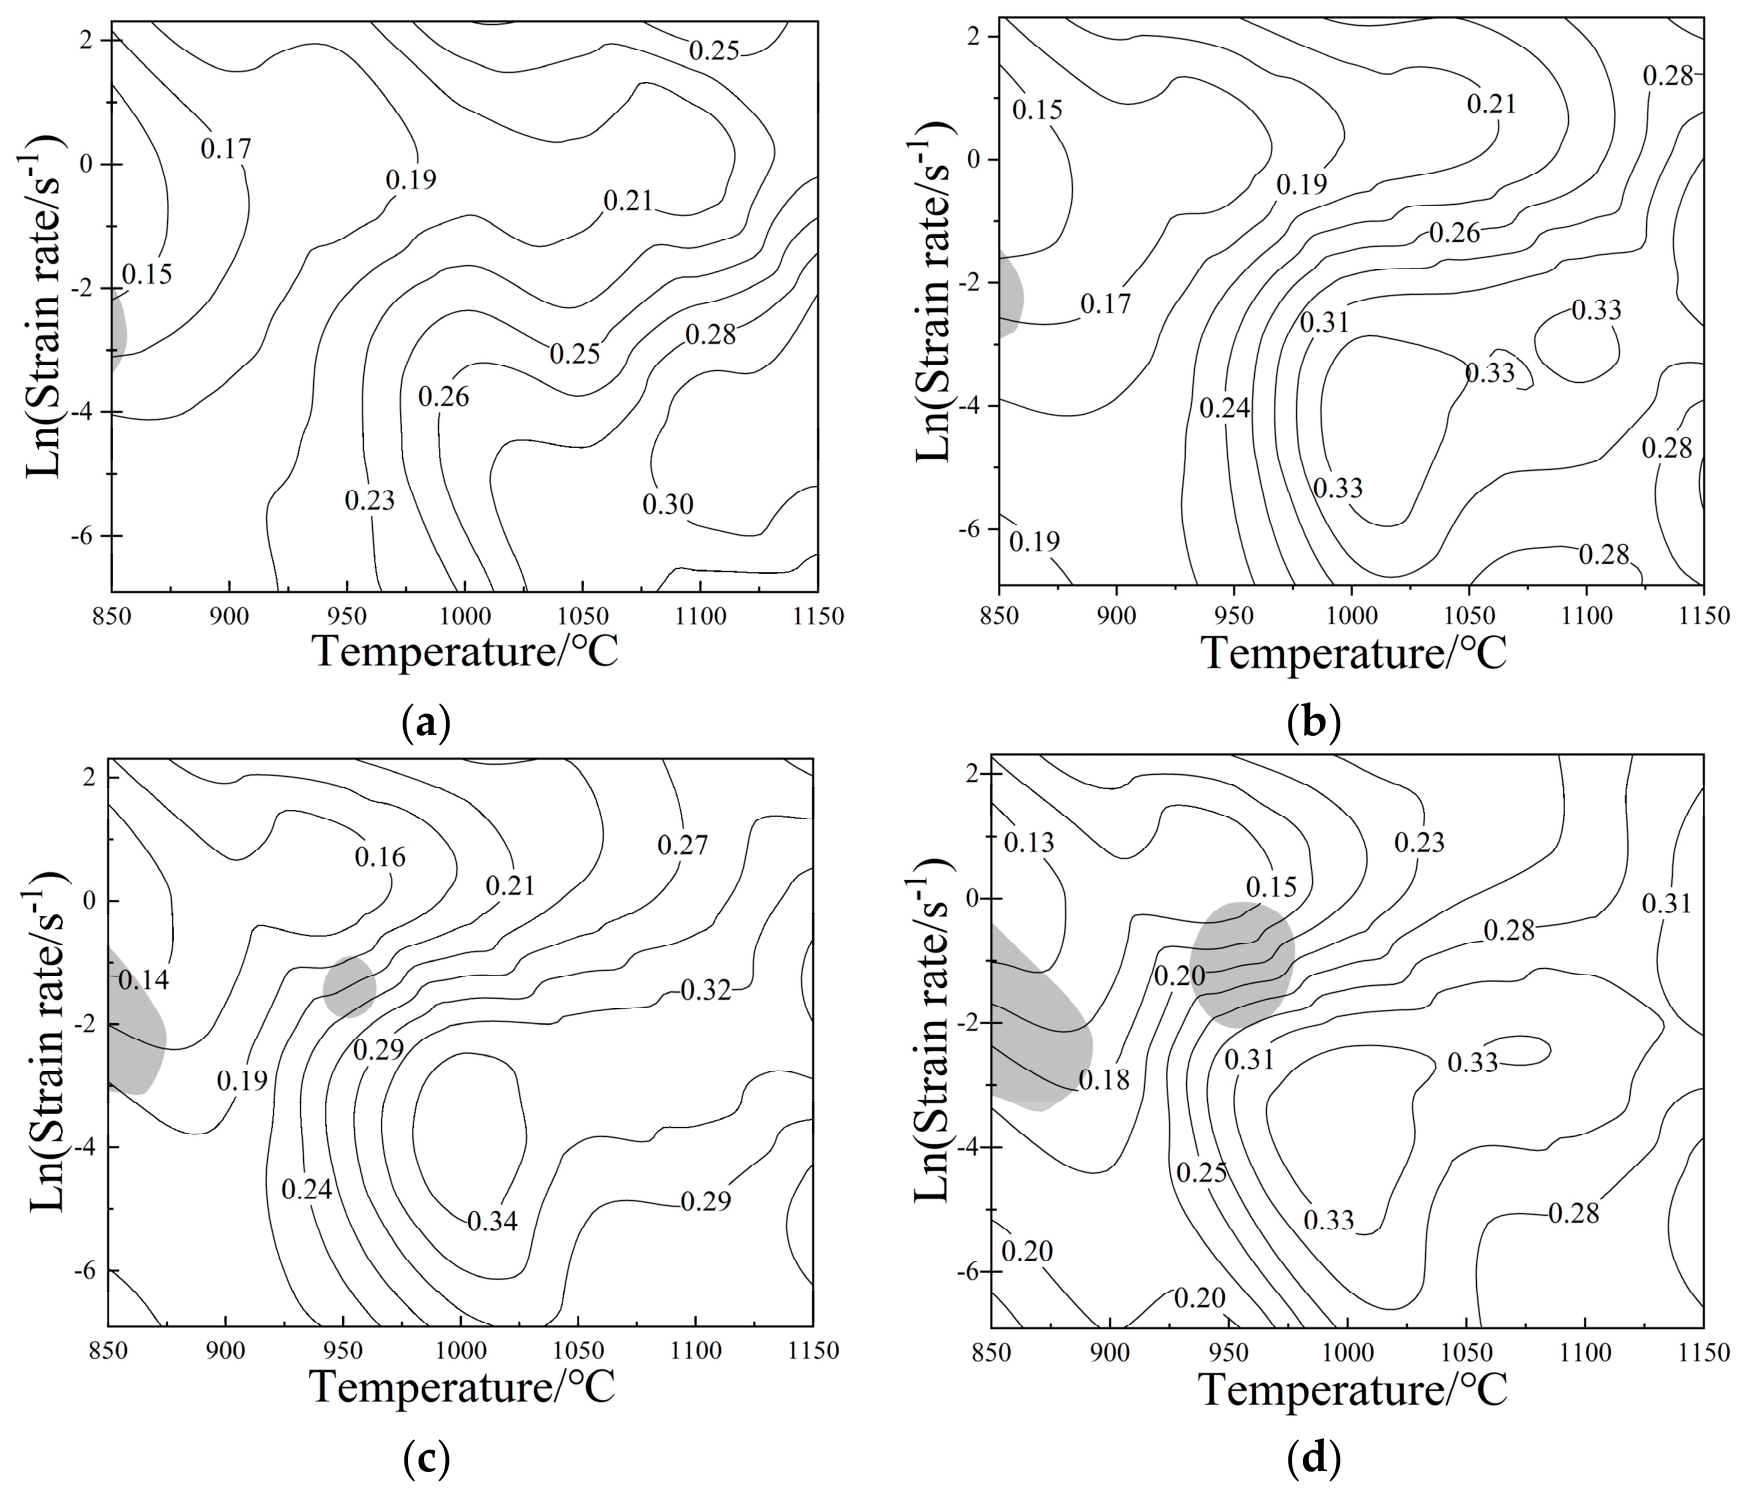
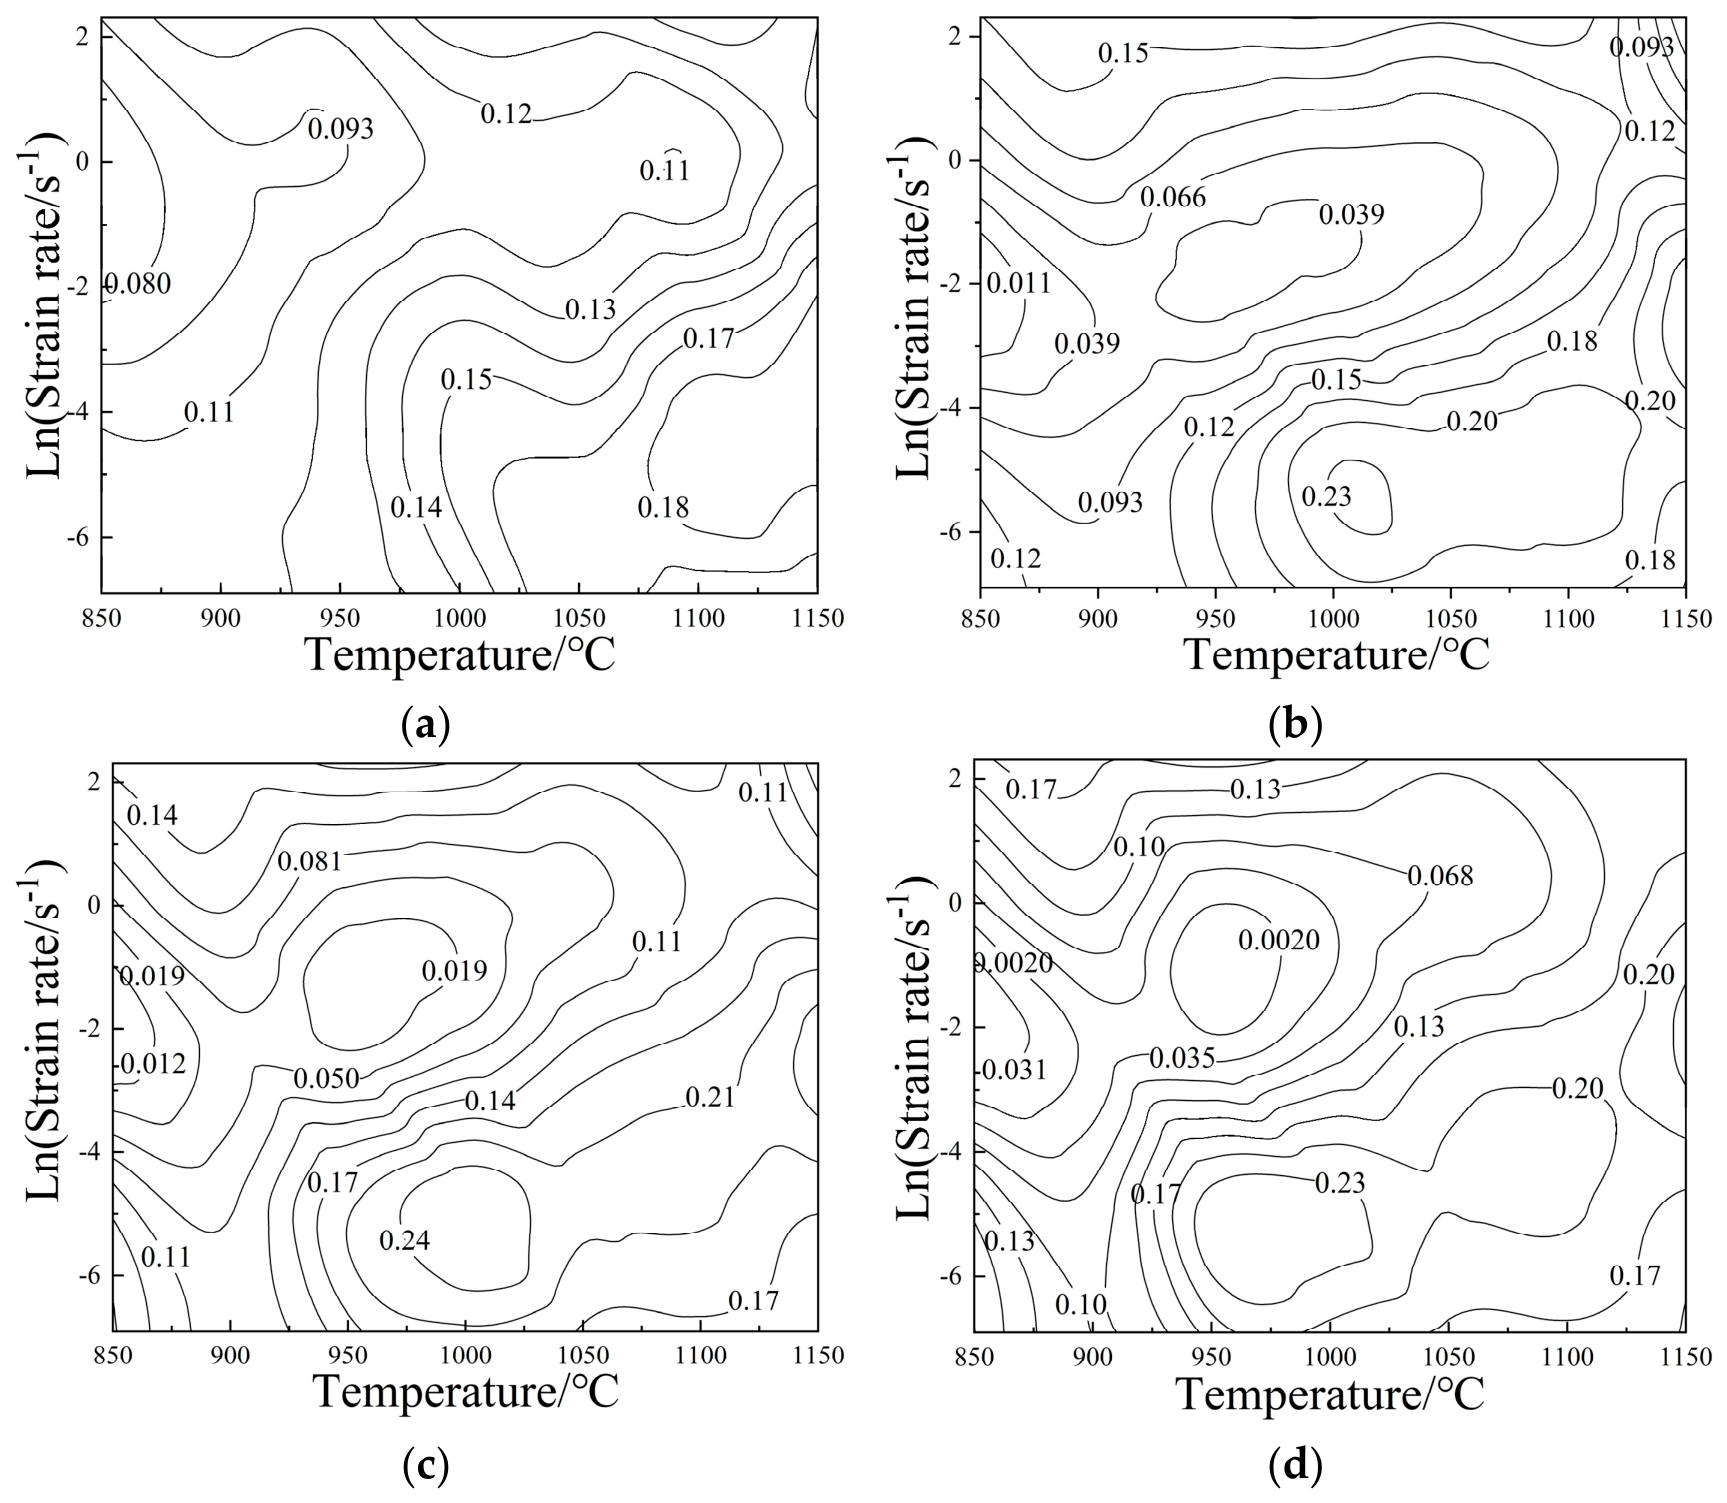
The co-content dissipation function ( J ), defined in Equation (12), represents the energy dissipated by microstructural evolution within the material. The power dissipation efficiency ( η ), illustrated by the contour maps in Equation (13), serves as a metric for the fraction of power consumed by microstructural changes; higher values typically signify an ideal processing regime. The strain-rate sensitivity exponent m  was determined based on the Dynamic Materials Model (DMM). Given the sensitivity of m  to the deformation state, it was evaluated at four distinct true strain levels: 0.2, 0.4, 0.6, and 0.8. This approach allows for a comprehensive assessment of the material’s flow stability across different stages of deformation. Conversely, the Prasad instability criterion [13], defined by the dimensionless parameter ξ ε ˙ < 0 in Equation (14), delineates domains prone to flow instability. Here, ξ ε ˙ is derived from the strain rate sensitivity exponent m , and a negative value ( ξ < 0 ) indicates that the material cannot dissipate energy efficiently through microstructural evolution, leading to flow localization or cracking; thus, these regions should be avoided.
J = 0 ϵ ˙ σ d ϵ ˙ = m m + 1 σ ϵ ˙
η = 2 m m + 1
ξ ϵ ˙ = l n m / m + 1 ln ϵ ˙ + m < 0
Figure 8 presents the processing maps for the experimental steel. At an initial strain of ϵ = 0.2 , the power dissipation efficiency remains generally low, with a peak value of approximately 0.3 observed in the high-temperature, low-strain-rate regime. At this early stage of deformation, dislocation density accumulation is insufficient to trigger extensive dynamic recrystallization (DRX), with energy primarily consumed by dislocation multiplication and dynamic recovery. The absence of significant instability regions suggests high processing safety at low strains, albeit with limited microstructural refinement. As the strain increases to ϵ = 0.4 , the high- η region expands toward intermediate temperatures, with the peak value rising to 0.33. Concurrently, incipient instability zones emerge in the low-temperature, intermediate-strain-rate regime. This transition indicates that, as strain increases, the accumulation of stored energy promotes more widespread DRX, while the onset of instability suggests that higher deformation rates at these temperatures induce localized non-uniform deformation. At strains of 0.6–0.8, the high-dissipation regime stabilizes, forming a robust core with η values reaching 0.34 within the temperature range of 1000–1100 °C and strain rates of 0.01–0.1 s−1. During this stage, DRX enters a quasi-steady state. However, the instability zones progressively expand, particularly at lower temperatures and moderate-to-high strain rates, where accumulated damage significantly elevates the risk of flow instability. While the ideal processing window initially resides in the ultra-high-temperature regime, it gradually stabilizes within the 1000–1100 °C and 0.01–0.1 s−1 range as deformation progresses. This region consistently maintains high η values (0.30–0.34) and remains clear of instability zones across all strain levels, facilitating the development of a uniform, refined DRX microstructure.

3.4. Microscopic Structure Evolution

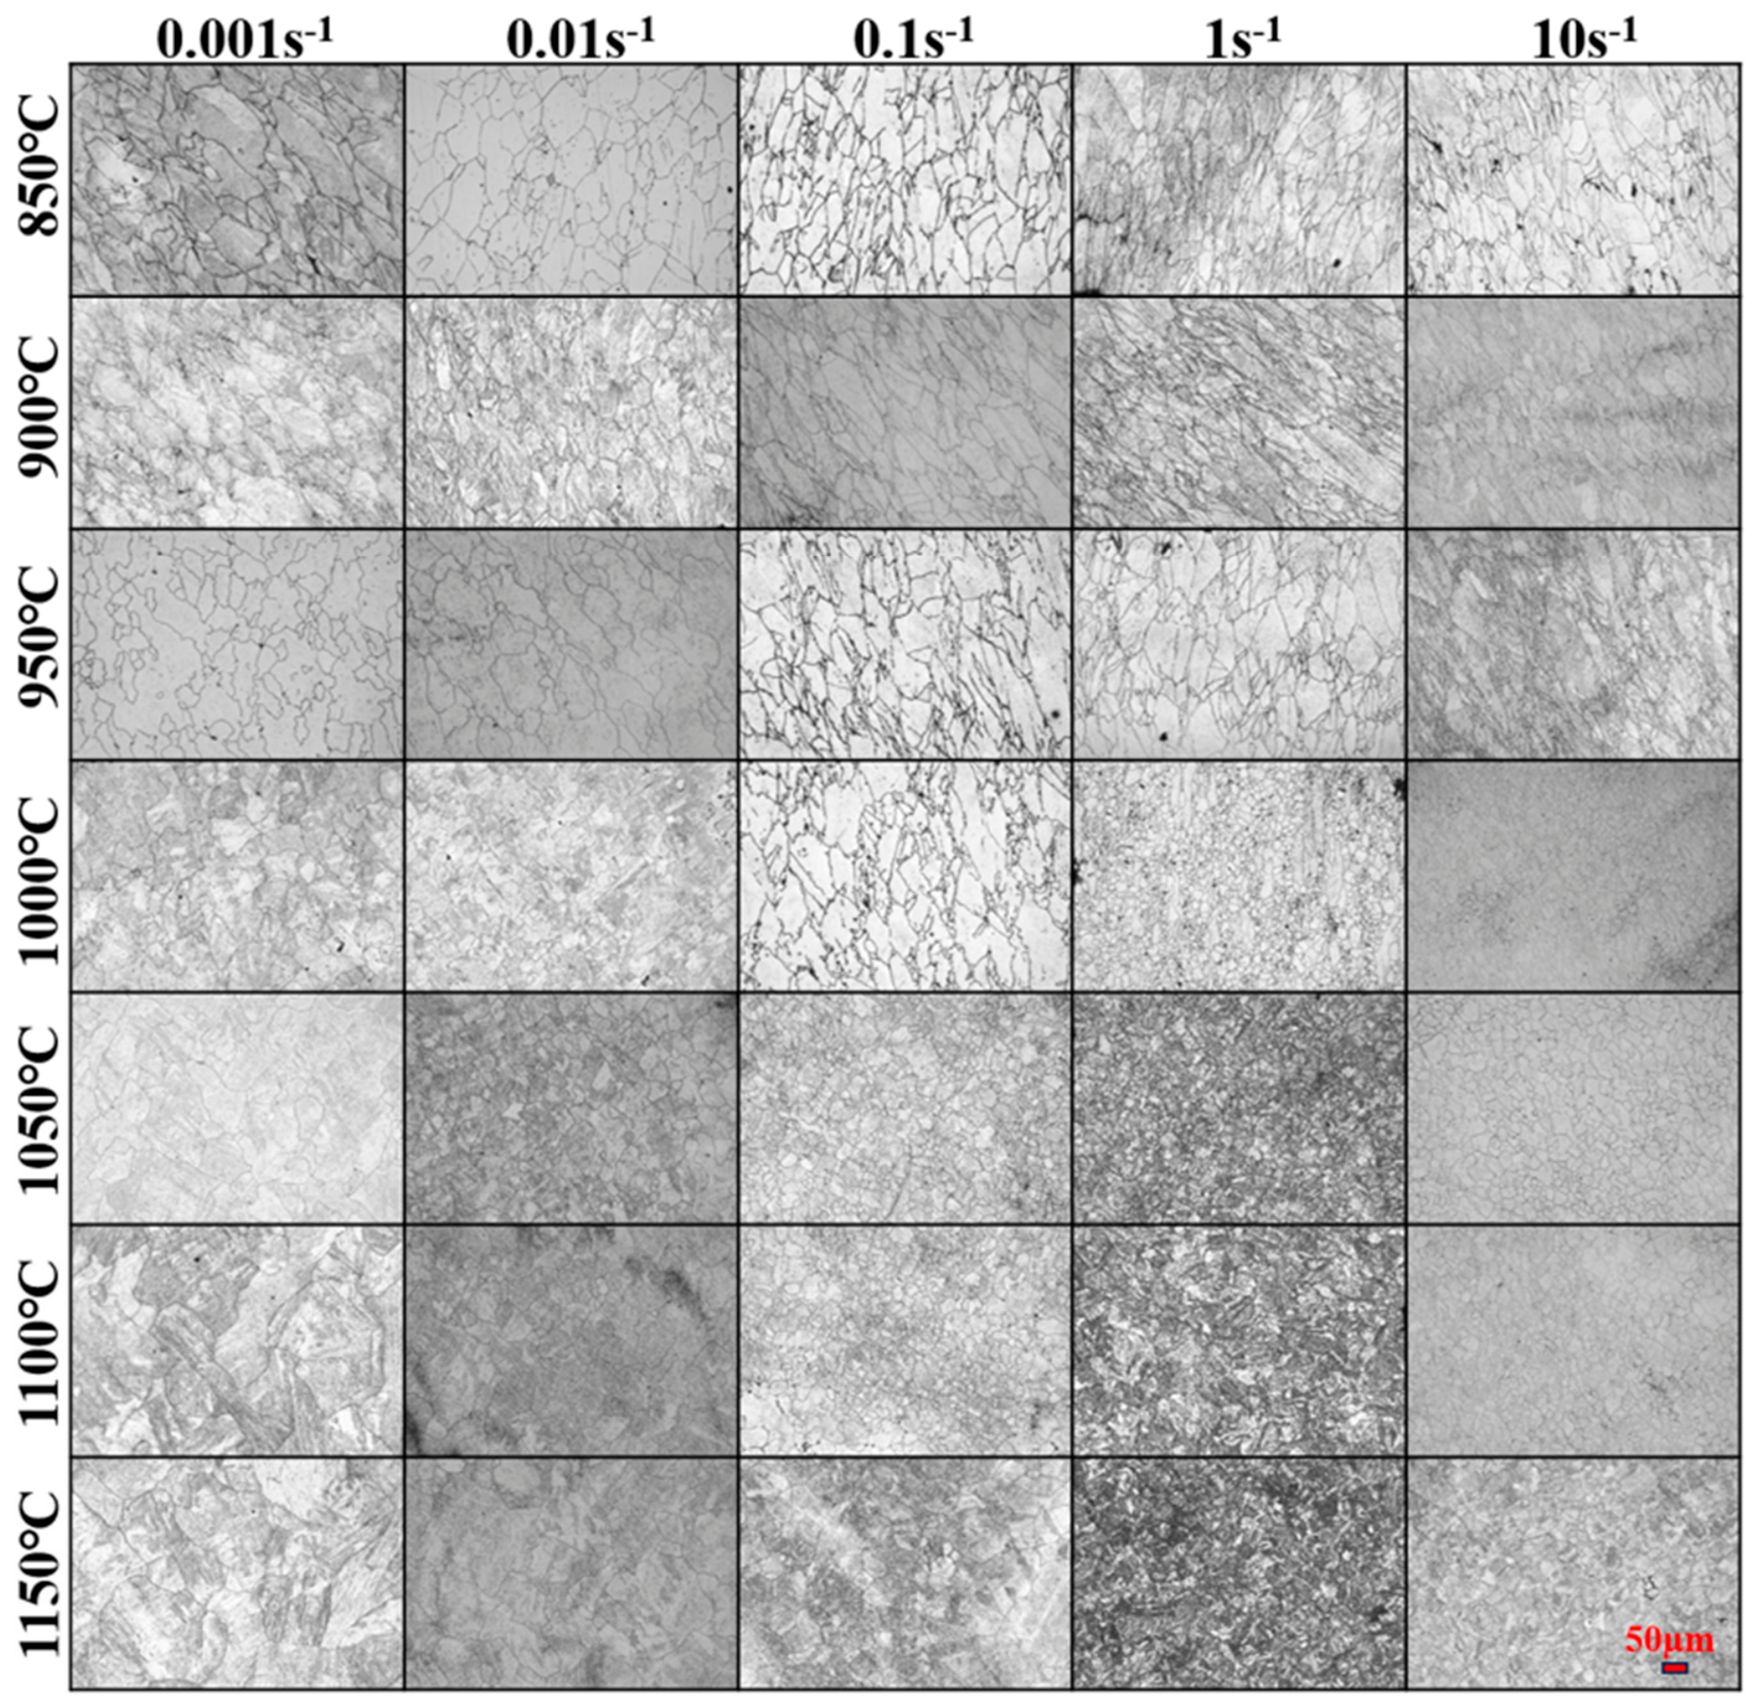
Figure 9 illustrates the sensitivity of the prior austenite grain boundary (PAGB) morphology to thermal processing parameters. The observed grain size distributions and the evolution of flow curves are consistent with the occurrence of dynamic recrystallization (DRX) under the investigated deformation conditions. While temperature appears to be the primary factor influencing the final grain size, the strain rate likely plays a significant role in modulating the nucleation density, potentially through its effect on dislocation accumulation rates. Based on the observed PAGB morphology, a combination of elevated deformation temperatures and moderate strain rates appears to facilitate a refined and homogeneous microstructure.
The determination of the optimal processing window was conducted through a multi-stage analysis. Initially, the temperature range of 1050–1150 °C at a strain rate of 0.01 s−1 was identified as a potential processing candidate based on the high strain rate sensitivity factor ( m ). Subsequently, by integrating the power dissipation efficiency ( η ) maps and instability criteria across various strain levels, the range of 1000–1100 °C and 0.01–0.1 s−1 was identified as the stable processing regime, characterized by high η values (0.30–0.34) and the absence of flow instability. However, microstructural observations revealed that at 1000 °C, dynamic recrystallization (DRX) was incomplete, resulting in a non-uniform grain structure. By synthesizing these findings—prioritizing both the processing stability indicated by the maps and the microstructural refinement observed in the experimental samples—the optimal processing window for the experimental steel is finalized as 1050–1100 °C and 0.01–0.1 s−1. This refined window ensures both the avoidance of flow instability and the development of a fully recrystallized, homogeneous microstructure.
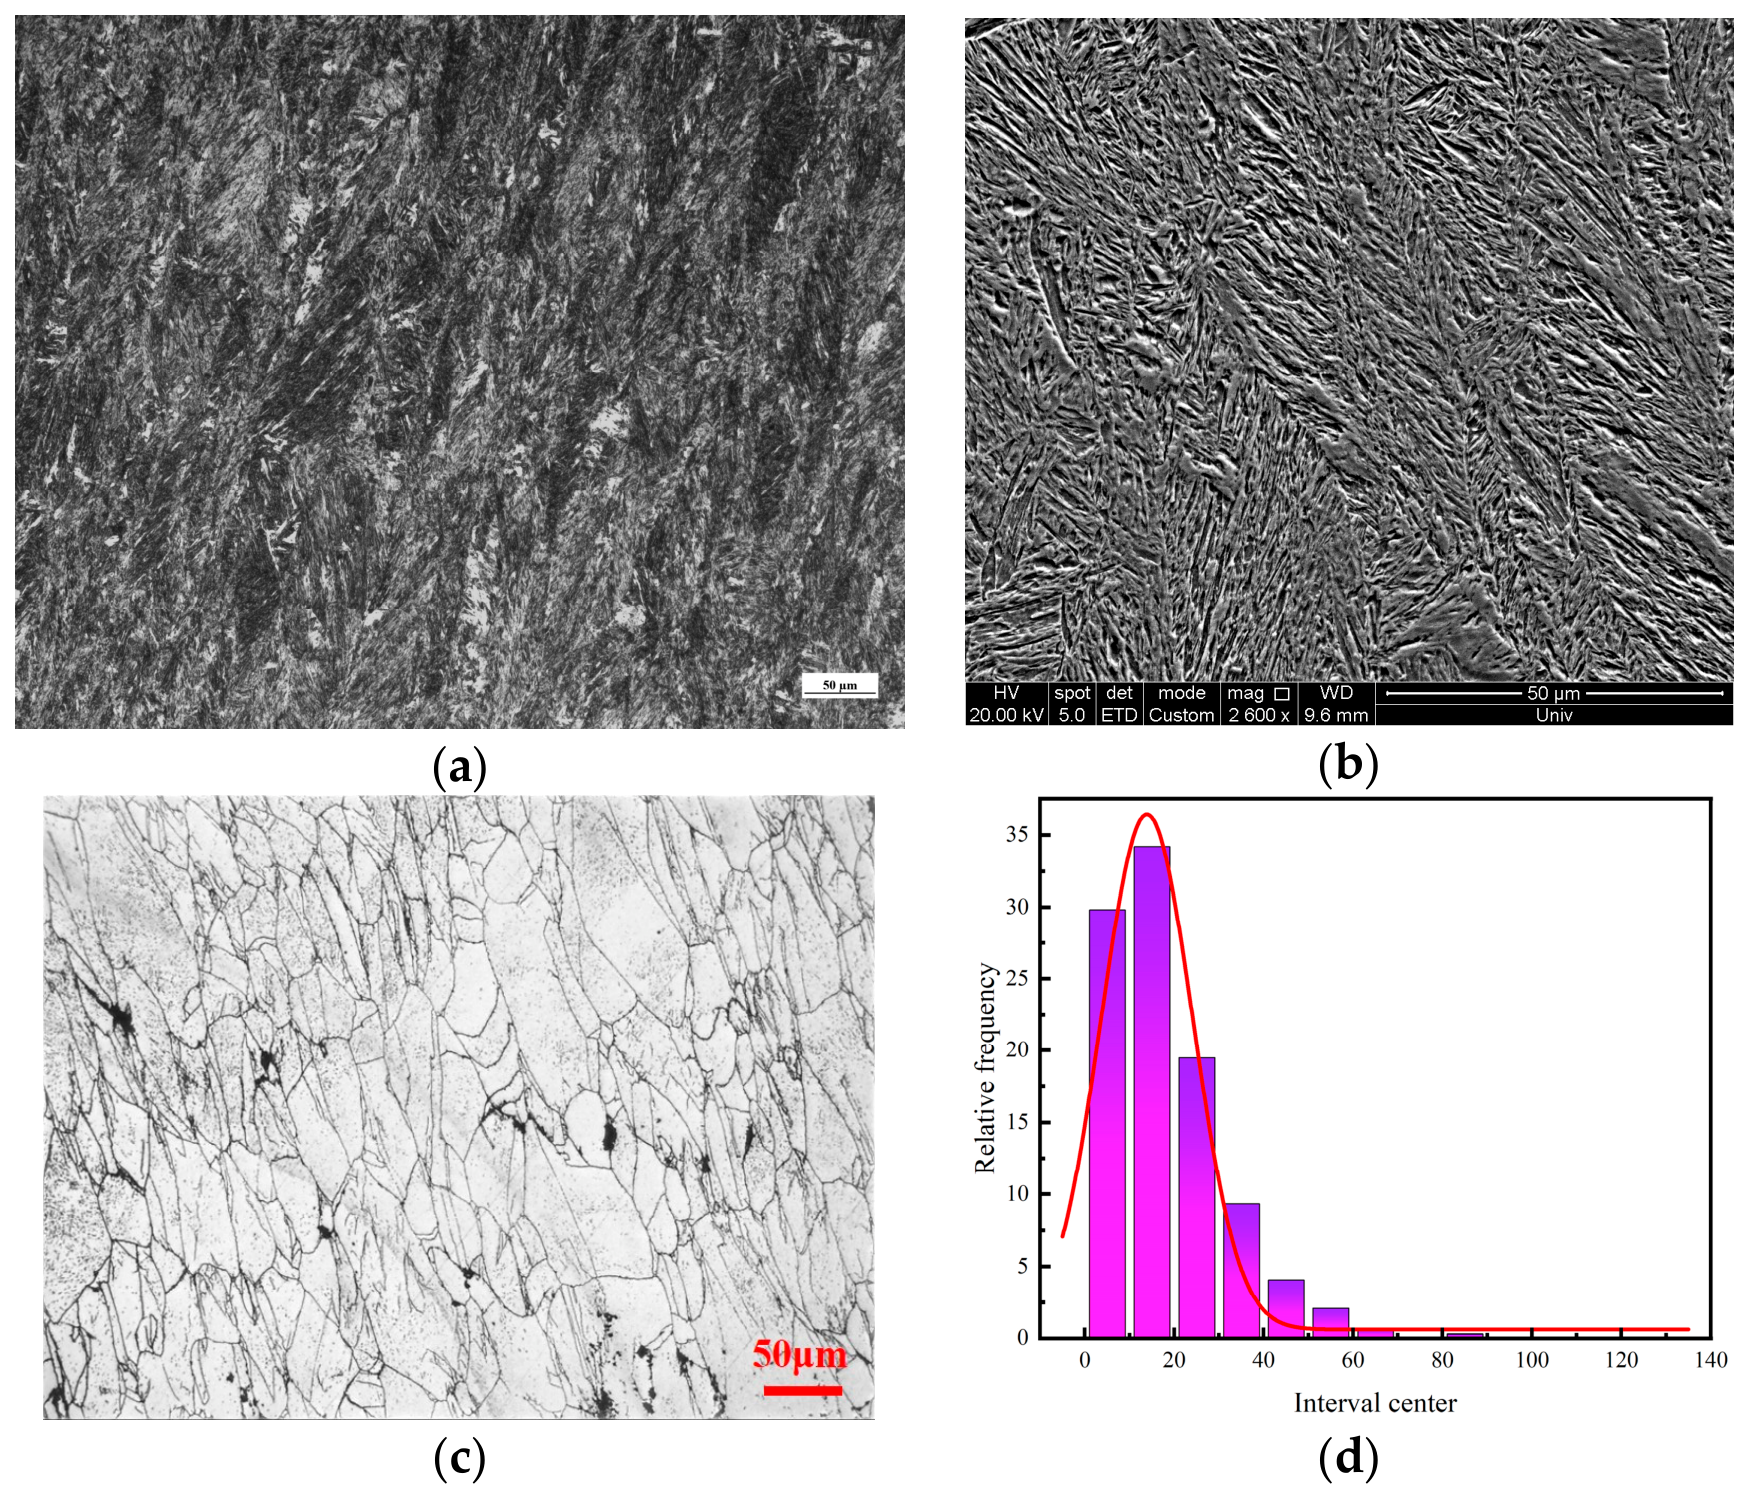
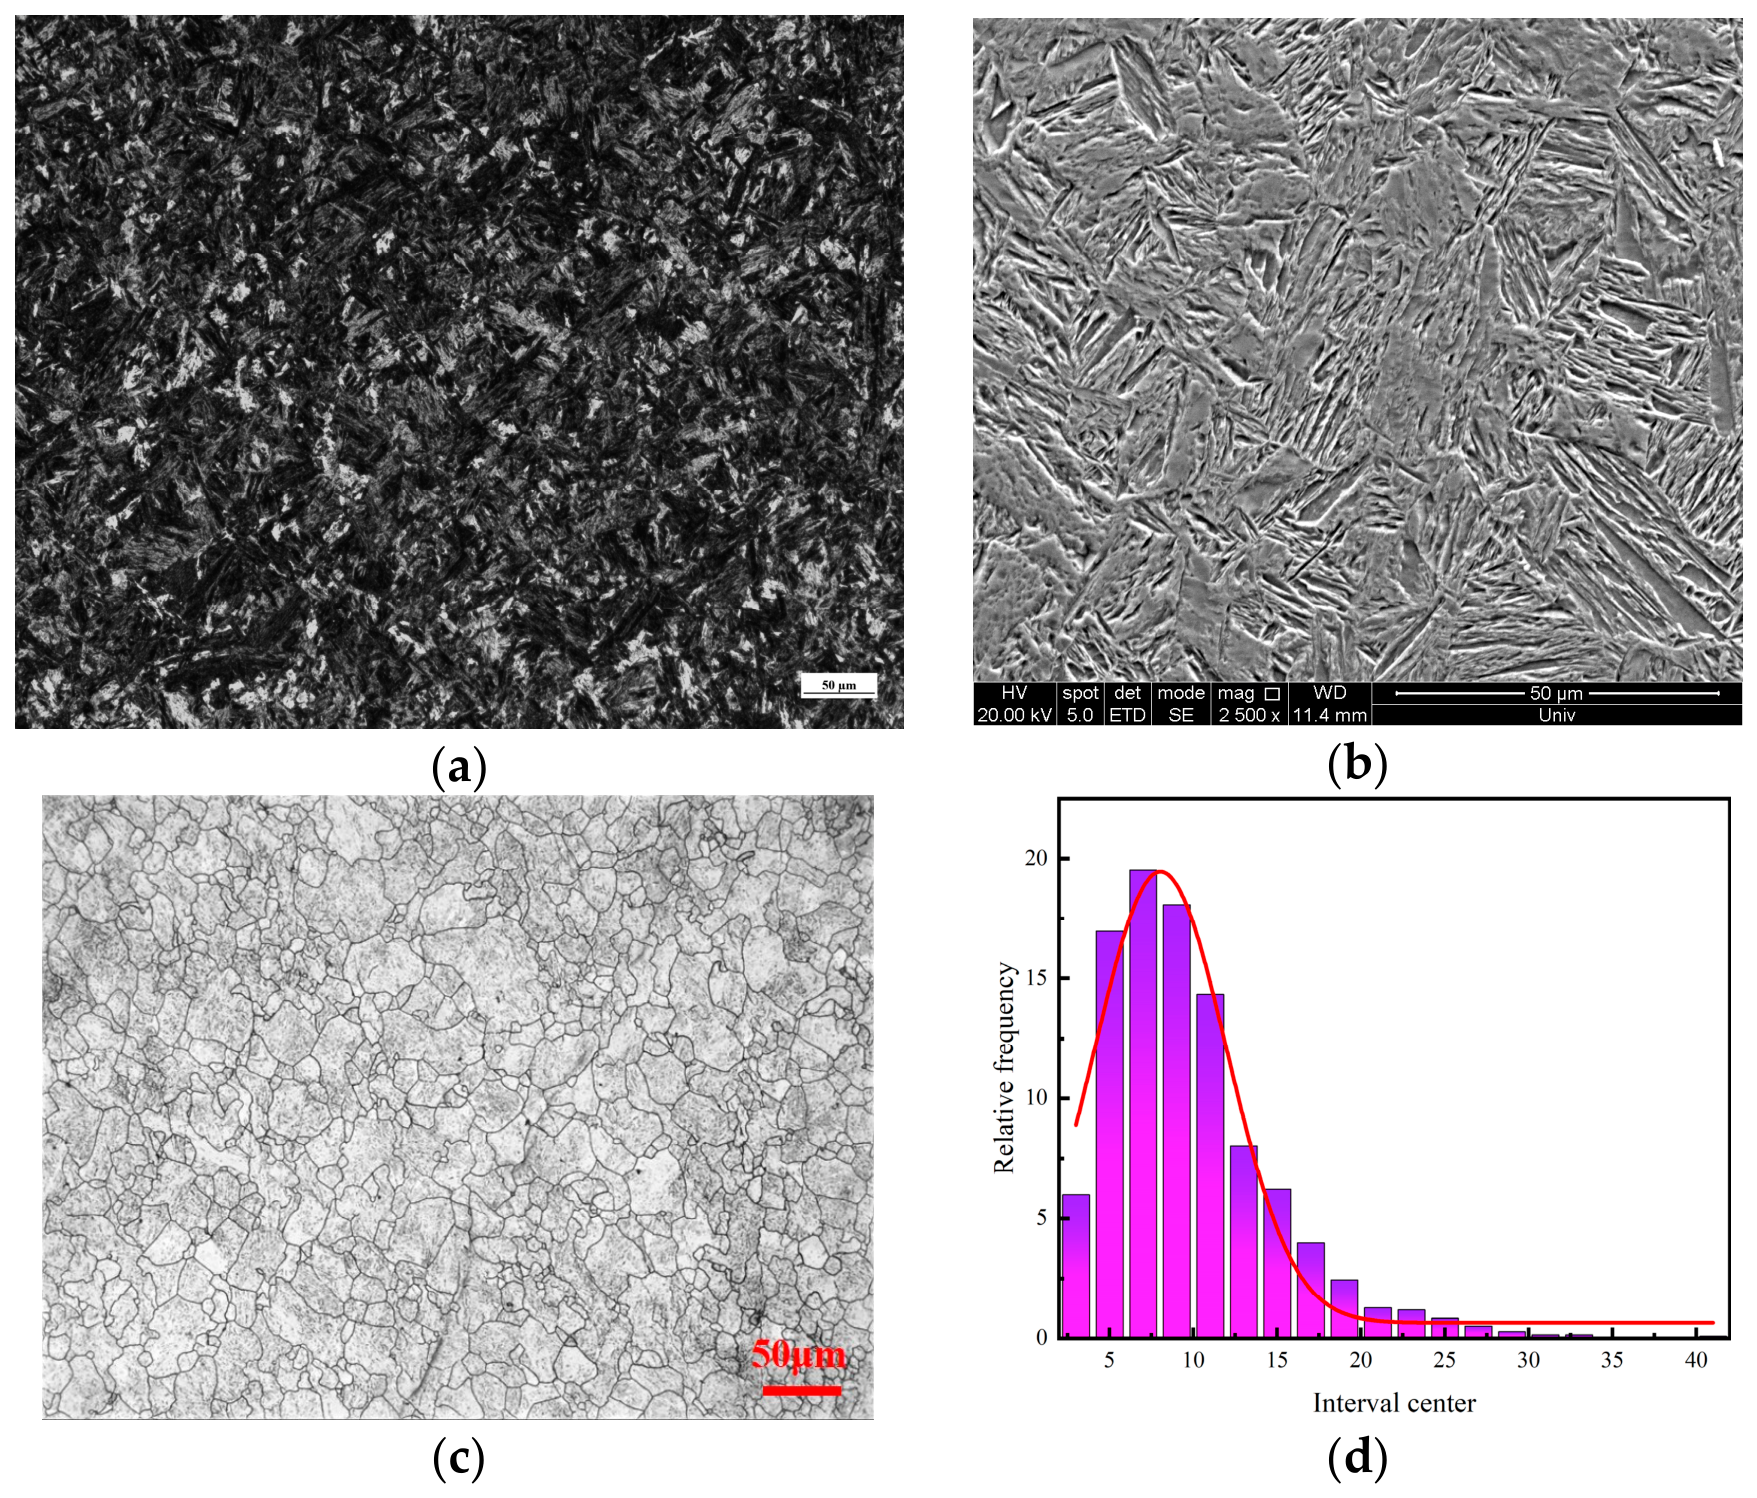
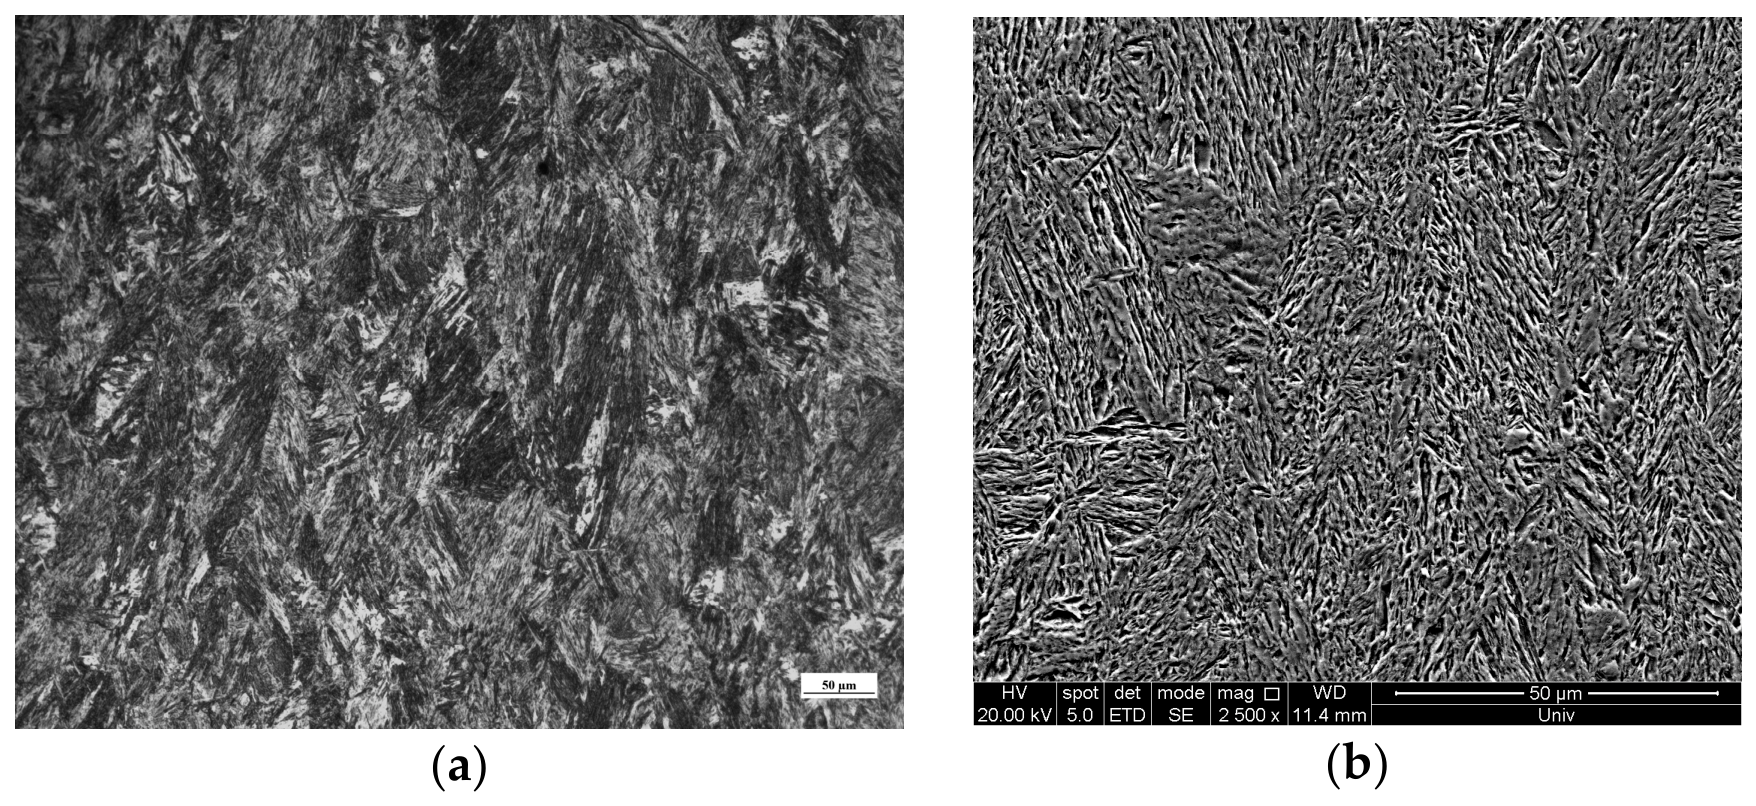
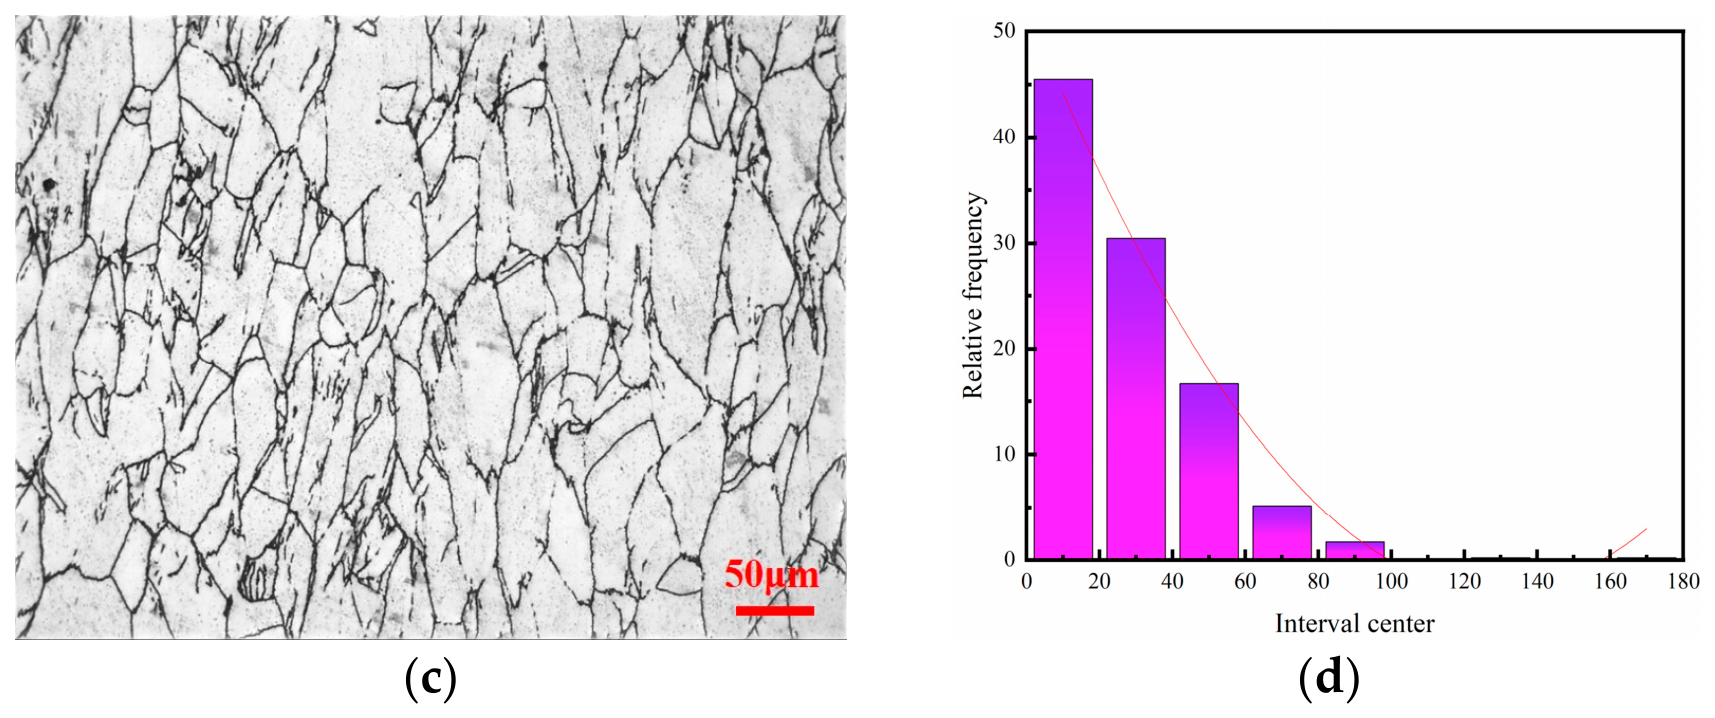
Figure 10 demonstrates that at a strain rate of 0.1 s−1 and a temperature of 1050 °C, a moderate Zener–Hollomon parameter facilitates an ideal dynamic equilibrium between the DRX nucleation rate and grain growth rate, resulting in a microstructure dominated by recrystallized grains. The PAGB map displays well-defined, uniform equiaxed grains, and the grain size distribution histogram follows a unimodal log-normal pattern with a mean grain size of 9.88 µm. While these features are indicative of a steady-state DRX process, it should be noted that the current assessment is primarily based on grain boundary morphology. Given the limitations of relying solely on PAGBs, the term ‘complete DRX’ is used here to denote a high degree of recrystallization; however, the potential presence of residual substructures or local unrecrystallized regions cannot be entirely excluded without further quantitative evidence, such as Electron Backscatter Diffraction(EBSD, Thermo Fisher Scientific, Waltham, MA, USA), EBSD-based misorientation analysis (e.g., grain orientation spread) or Transmission Electron Microscope(TEM, JEOL Ltd., Akishima, Japan) observations of dislocation substructures. The uniform prior austenite microstructure is ‘inherited’ by the martensite upon transformation, yielding ordered martensitic packets. This processing window effectively avoids abnormal grain coarsening (typical of high-temperature, low-strain-rate conditions) and the adiabatic shear bands or micro-cracks (prevalent at high strain rates), representing an ideal regime for industrial hot working.
Figure 11 shows that at a strain rate of 0.001 s−1 and a deformation temperature of 1150 °C, the material undergoes extensive DRX. However, the high-temperature environment significantly enhances grain boundary mobility while the low strain rate provides insufficient driving force for nucleation, leading to substantial grain coarsening with a mean size of 47.98 µm. This coarsening is attributed to secondary recrystallization and abnormal grain growth (AGG) rather than simple grain growth. The dissolution of precipitates at this high temperature eliminates pinning effects, and the prolonged time afforded by the low strain rate allows specific grains to consume their neighbors. OM and SEM observations reveal significantly widened and regularly arranged martensitic laths; such coarse-grained regions are detrimental to both the strength and toughness of the material.
Figure 12 presents the microstructure under a strain rate of 10 s−1 and a deformation temperature of 850 °C, where work hardening dominates the flow behaviour, leading to severe defect accumulation. Grains are severely flattened and elongated perpendicular to the compression axis, forming a dense fibrous structure with a mean grain size of 18.49 µm. At this temperature, the thermal activation energy is insufficient to drive complete DRX. Furthermore, the high strain rate induces rapid dislocation proliferation and accumulation at grain boundaries, while grain boundary migration and climbing are severely inhibited. Consequently, the softening mechanisms fail to compensate for work hardening, resulting in intense internal stress concentrations. This state corresponds to the “work-hardening cracking region” in the processing map, indicating poor plastic deformability and a high susceptibility to brittle fracture; thus, this processing window should be avoided in industrial practice.
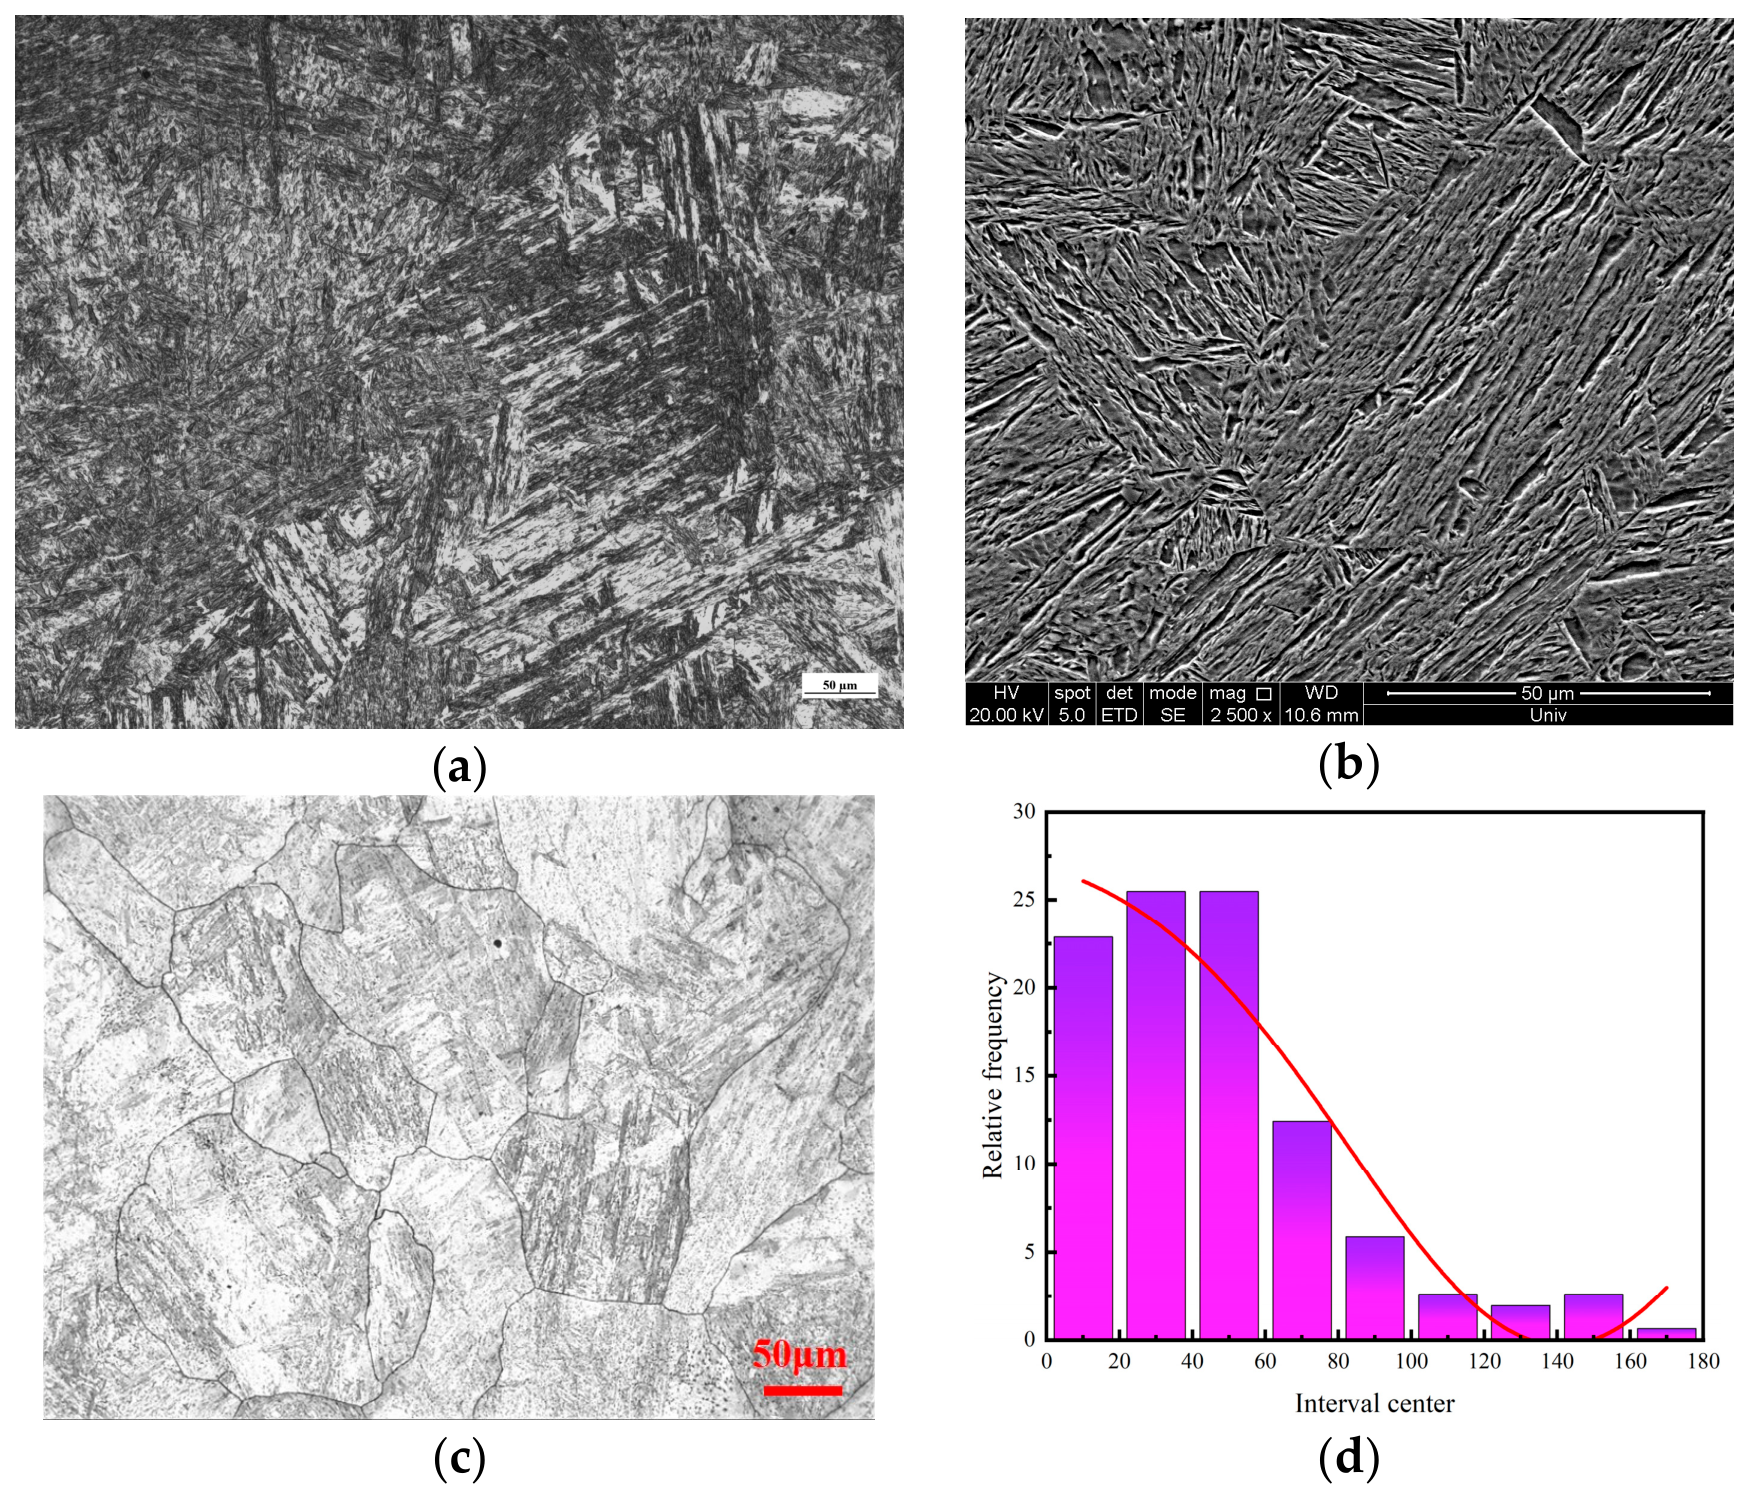
Figure 13 shows that at a strain rate of 0.1 s−1 and a deformation temperature of 850 °C, the mean grain size is 28.24 µm, accompanied by pronounced microstructural heterogeneity. These parameters fall within the flow instability regime, where the low deformation temperature restricts the progression of DRX, preventing the effective dissipation of deformation energy via grain boundary migration and triggering localized strain concentration. Small newly generated DRX grains appear at the original boundaries of the coarse and elongated deformed grains. This indicates that DRX has only just initiated and failed to propagate throughout the grain interiors—a classic microstructural signature of flow localization and non-uniform deformation. This phenomenon serves as direct evidence of an imbalance between work hardening and dynamic softening, representing a critical precursor to crack initiation in industrial processing.

4. Discussion

The true stress–true strain curves obtained in this study demonstrate that the flow stress is highly sensitive to both strain rate and deformation temperature. At a constant strain rate, flow stress decreases significantly with increasing temperature; conversely, at a constant temperature, it rises markedly with increasing strain rate. These trends are in excellent agreement with reported results for Q690 low-carbon micro-alloyed steels and other high-strength steels [14,15,16,17,18,19,20,21,22,23,24,25,26]. In the high-temperature regime (1100–1150 °C) and low-strain-rate range (0.001–0.1 s−1), the flow stress exhibits a distinct peak followed by a decline toward a steady state, indicating the occurrence of dynamic recrystallization (DRX). The high temperature provides sufficient activation energy, while the low strain rate allows ample time for grain boundary migration, enabling dynamic softening to effectively counteract work hardening [15,16]. In contrast, at 850 °C and a high strain rate of 10 s−1, the absence of peak softening suggests that dynamic recovery (DRV) is the dominant deformation mechanism [17,18].
By analyzing the relationship between peak stress and deformation parameters, an Arrhenius-type constitutive equation was established. The calculated hot deformation activation energy ( Q ) for the experimental steel is 389.56 kJ/mol. This value lies between those reported for Q690 engineering steel (432.35 kJ/mol) [18] and Q690 low-carbon micro-alloyed steel (356.05 kJ/mol) [21], and is notably higher than the self-diffusion activation energy of γ-Fe (270 kJ/mol). The variations in Q compared to other high-strength steels—such as the 462.6 kJ/mol observed in high-carbon high-strength steel (0.53% C, 0.30% V) [15] and the 316.35 kJ/mol in conventional HSLA steel [20]—fundamentally reflect the modulation of dislocation motion resistance by solute atoms and the pinning effects of precipitates.
Processing maps, constructed based on the dynamic materials model (DMM), serve as a critical guide for optimizing hot-working parameters. In the low-temperature regime (<1000 °C), particularly near a strain rate of 1 s−1, an instability zone is identified. This is consistent with the instability characteristics of Q690 engineering steel [18] and high-carbon HSLA steel [15], where localized heat accumulation at high strain rates cannot be dissipated, leading to adiabatic shear bands or localized flow, and ultimately, plastic instability. At a true strain of 0.8, the experimental steel exhibits a peak efficiency ( η ) of approximately 0.35–0.4. The region defined by temperatures of 1050–1100 °C and strain rates of 0.01–0.1 s−1 shows η > 0.3 , representing a stable processing regime dominated by DRX, which ensures favorable workability [20].
Microstructural evolution further corroborates these findings. At low temperatures and high strain rates, grains are severely elongated into a fibrous morphology, with negligible DRX [22,23]. At high temperatures and low strain rates, while complete DRX occurs, it is followed by significant abnormal grain growth (AGG). The resulting broad grain size distribution, characterized by a substantial fraction of grains exceeding 100 µm, aligns with the coarsening behaviour observed in GH4141 [24] and GH4098 [25] superalloys, where the dissolution of precipitates removes grain boundary pinning. At 850 °C and 0.1 s−1, the microstructure displays a “necklace” structure—fine DRX grains decorating the boundaries of original coarse grains—with clear evidence of bulging nucleation. This morphology, consistent with EBSD observations in 42CrMoA steel [26], is a hallmark of incipient DRX.

5. Conclusions

(1)
The flow behaviour of the Q690 steel was characterized by an Arrhenius-type constitutive equation, which correlates the peak stress ( σ p ) with deformation parameters as follows:
ε ˙ = 4.0998 × 10 14 s i n h 0.009 σ p 5.5077 exp 389562.5 8.314 T
(2)
Integration of the dynamic materials model (DMM) and microstructural analysis reveals an optimal processing window within the temperature range of 1050–1100 °C and strain rates of 0.01–0.1 s−1.
(3)
The processing maps reveal a dynamic evolution of the instability zones as a function of strain. With increasing strain, these regions exhibit a pronounced expansion trend, migrating and converging from the low-temperature/moderate-strain-rate regime toward the intermediate-temperature/moderate-strain-rate domain.
(4)
At a deformation temperature of 1050 °C and a strain rate of 0.1 s−1, the material undergoes complete dynamic recrystallization, resulting in a refined, equiaxed prior austenite grain structure with an average size of approximately 9.88 µm.

Author Contributions

Conceptualization, L.F. and Y.Y.; methodology, Y.Y.; software, E.Y.; validation, H.L., L.F. and Y.Y.; formal analysis, E.Y.; investigation, H.L.; resources, L.F.; data curation, H.L.; writing—original draft preparation, H.L.; writing—review and editing, Y.Y.; visualization, L.F.; supervision, E.Y.; project administration, Y.Y.; funding acquisition, L.F. All authors have read and agreed to the published version of the manuscript.

Funding

The National Natural Science Foundation of China (52361025); Inner Mongolia Science and Technology Project (2022ZY0001); Scientific and Technical Young Talents of the Inner Mongolia Autonomous Region (NJYT23116, JY20240063); and Open Research Project of National Key Laboratory of Intensified Metallurgy of Nonferrous Metals (YSQH-ZYTS-25004).

Data Availability Statement

The original contributions presented in this study are included in the article. Further inquiries can be directed to the corresponding author.

Conflicts of Interest

Authors Yang Yuan and Erbin Yue were employed by the company Zhejiang Metallurgical Research Institute Co., Ltd. The remaining authors declare that the research was conducted in the absence of any commercial or financial relationships that could be construed as a potential conflict of interest.

References

  1. Raabe, D.; Tasan, C.C.; Olivetti, E.A. Strategies for improving the sustainability of structural metals. Nature 2019, 575, 64–74. [Google Scholar] [CrossRef] [Scilit] [PubMed]
  2. Bjorhovde, R. Development and use of high-performance steel. J. Constr. Steel Res. 2004, 60, 393–400. [Google Scholar] [CrossRef] [Scilit]
  3. Zhou, F.; Guo, J.; Zhao, Y.; Chu, X.; Liu, L.; Zhou, C.; Zhao, Z. An improved cellular automaton model of dynamic recrystallization and the constitutive model coupled with dynamic recrystallization kinetics for microalloyed high-strength steels. J. Mater. Res. Technol. 2024, 33, 10003–10021. [Google Scholar] [CrossRef] [Scilit]
  4. Guo, A.; Mao, F.; Shi, R.; Lin, Y.; Yin, L.; Yu, B.; Xu, L.; Chen, C.; Yu, H.; Gao, K. Study on dynamic recrystallization kinetics and microstructural refinement of high-strength 36CrNi3MoV steel during hot deformation. J. Mater. Res. Technol. 2025, 36, 8999–9012. [Google Scholar] [CrossRef] [Scilit]
  5. Zhao, Y.; Cheng, N.; Zhu, H.; Wang, X.; Xu, X. Dynamic recrystallization mechanisms and thermomechanical processing optimization in Q1300 ultrahigh-strength steel. J. Mater. Res. Technol. 2025, 38, 4791–4805. [Google Scholar] [CrossRef] [Scilit]
  6. Liu, W.; Li, H.; Kong, Y.; Liang, L.; Xiao, A.; Zhang, Y.; Zeng, W.; Gao, Q. Hot deformation behaviour and hot rolling verification of Q1100 ultra-high-strength steel. J. Cent. South Univ. 2026, 33, 567–581. [Google Scholar] [CrossRef] [Scilit]
  7. Liu, Y.; Du, L.; Tu, K.; Wu, H.; Misra, R. Strain rate dependence on the dynamic recrystallization phenomena and processing map of low-carbon Q690 V-N and V-N-Cr microalloyed high-strength steels. Steel Res. Int. 2019, 90, 1900229. [Google Scholar] [CrossRef] [Scilit]
  8. Huo, J.S.; Zeng, X.; Wang, H.T. Tensile behaviour of TMCP Q690D high-strength structural steel at strain rates from 0.00025 to 760 s−1. Adv. Steel Constr. 2022, 18, 488–494. [Google Scholar] [CrossRef] [Scilit]
  9. Zhao, M.; Jiang, L.; Li, C.; Huang, L.; Sun, C.; Li, J.; Guo, Z. Flow characteristics and hot workability of a typical low-alloy high-strength steel during multi-pass deformation. Int. J. Miner. Metall. Mater. 2024, 31, 323–336. [Google Scholar] [CrossRef] [Scilit]
  10. Sellars, C.M.; McTegart, W.J. On the mechanism of hot deformation. Acta Metall. 1966, 14, 1136–1138. [Google Scholar] [CrossRef] [Scilit]
  11. McQueen, H.J.; Ryan, N.D. Constitutive analysis in hot working. Mater. Sci. Eng. A 2002, 322, 43–63. [Google Scholar] [CrossRef] [Scilit]
  12. Zener, C.; Hollomon, J.H. Effect of strain rate upon plastic flow of steel. J. Appl. Phys. 1944, 15, 22–32. [Google Scholar] [CrossRef] [Scilit]
  13. Prasad, Y.V.R.K.; Seshacharyulu, T. Modelling of hot deformation for microstructural control. Int. Mater. Rev. 1998, 43, 243–258. [Google Scholar] [CrossRef]
  14. Król, M.; Snopiński, P.; Tański, T.; Opiela, M.; Chomiak, M.; Czech, A. Constitutive equation and processing maps of 31MnTiB HSLA-type steel. J. Therm. Anal. Calorim. 2025, 150, 1–11. [Google Scholar] [CrossRef] [Scilit]
  15. Li, G.; Long, W.; Yu, X.; Wu, G.; Chen, W.; Jiang, Q.; Zhang, C.; Wu, H.; Gao, J.; Zhao, H.; et al. Hot deformation behaviour and microstructural evolution of high-carbon high-strength low-alloy steel. J. Mater. Res. Technol. 2024, 33, 1667–1680. [Google Scholar] [CrossRef] [Scilit]
  16. Dong, C.; Zhao, X. Dynamic recrystallization behaviour and microstructure evolution of high-strength low-alloy steel during hot deformation. J. Mater. Res. Technol. 2023, 25, 6087–6098. [Google Scholar] [CrossRef] [Scilit]
  17. Li, N.; Wang, C.; Sun, Z.; Zhang, C.; Zhao, C. Hot deformation behaviour and constitutive equation of ultra-low-carbon microalloyed steel. Hot Work. Technol. 2025, 54, 114–119. Available online: http://rjggy.net/cn/article/doi/10.14158/j.cnki.1001-3814.20222470 (accessed on 20 August 2026).
  18. Wang, C.; Yang, H. Hot deformation behaviour of Q690 steel for construction machinery. Phys. Test. Chem. Anal. Part A 2022, 58, 22–26. [Google Scholar]
  19. Chen, X.; Huang, Y. Hot deformation behaviour of HSLA steel Q690 and phase transformation during compression. J. Alloys Compd. 2015, 619, 564–571. [Google Scholar] [CrossRef] [Scilit]
  20. Li, N.; Zhao, C.; Jiang, Z.; Zhang, H. Flow behaviour and processing maps of high-strength low-alloy steel during hot compression. Mater. Charact. 2019, 153, 224–233. [Google Scholar] [CrossRef] [Scilit]
  21. Tan, Z.; Xiang, S. Hot deformation behaviour and critical strain for dynamic recrystallization of Q690 low-carbon microalloyed steel. Trans. Mater. Heat Treat. 2013, 34, 42–46. Available online: https://kns.cnki.net/kcms2/article/abstract?v=btsNj5Rv70b10U4n0M3XT_P-ARviW3-BTgoiKFVJJF7D3FcBPB3NstMIfag8yW9gdS20GyFvLGklT0Hqg-kCS4YKLkcuFLDDalgqrpGyzvhOW36UJPZZjMN21TGQwiQViR0CmW5XSrvELTsL3sutsjV8an0uVXZA2vev_KPN16vL8RNBoMdvaw== (accessed on 20 August 2026).
  22. Zhang, Y.; Huang, G.; He, J.; Wang, Y.; Wang, K.; Wang, M. Study on high-temperature dynamic softening model and grain evolution of EA4T steel. J. Iron Steel Res. 2024, 36, 650–659. [Google Scholar] [CrossRef]
  23. Pan, L.; Chen, Y.; Wang, H.; Zhang, T.; Zhang, H.; Liu, G. Hot deformation behaviour and dynamic recrystallization model of high-strength low-yield-ratio building steel. Trans. Mater. Heat Treat. 2025, 46, 209–216+236. Available online: https://kns.cnki.net/kcms2/article/abstract?v=btsNj5Rv70aSBJXjcMz2nsPnD4S0v2aOFSXDg8693VFHBT9DLtOFRtm3xU_meawizXJw6kp-tlH3sqywVbQlsHaIVvHdKcVhL5mQqBL-xgV37cc2pslWSovw5TzkZY7ZICb-Nnu37a4RUwJujEHAe2wI9K0EbqxwknRtREFO5V6qrZNmiwRA5A== (accessed on 20 August 2026).
  24. Zhang, X.; Pei, Y.; Zhou, Y.; Chen, J.; Xiao, D.; Tang, P.; Fu, J.; Yan, J.; Zhang, J. Hot deformation behaviour and dynamic recrystallization of hot-rolled GH4141 superalloy. Rare Met. Mater. Eng. 2025, 54, 505–516. [Google Scholar]
  25. Zhang, Z.; Wu, S.; Yang, R.; Wang, J.; Guo, Y.; Liu, S.; Xu, B.; Guo, L.L.; Sun, M.Y. Hot deformation behaviour and recrystallization microstructure evolution of forged GH4098 superalloy. Mater. Rep. 2025, 39, 192–199. [Google Scholar]
  26. Chen, Y.; Duan, X.; Jia, Y.; Che, X. Study on hot deformation softening behaviour and microstructure evolution of forged 42CrMoA steel. J. Plast. Eng. 2025, 32, 185–192. Available online: https://kns.cnki.net/kcms2/article/abstract?v=btsNj5Rv70aGHwctMHX1rd3ZX9bL43zUd9pOIKZen8ERLbDWfNx10xITLk-9pTj7fVbRs48Ugym7gX1HmAmtiFfidP0xd9itqTmFR2NVpcQepKRHQbO8FUy8pxVzNFzWOQRrO5lO0vNI2qwV-aKtjYNxVzAQKhmGinyCQrVYskvl4e-xwUZkoA== (accessed on 20 August 2026).
Figure 1. Q690 high-strength steel hot-rolled sheet initial microstructure (500×).
Metals 16 01042 g001
Figure 2. Q690 High-Strength Steel Thermal Deformation Process Flow Chart.
Metals 16 01042 g002
Figure 3. True stress-true strain curve: (a) strain rate 0.001 s−1; (b) strain rate 0.01 s−1; (c) strain rate 0.1 s−1; (d) strain rate 1 s−1; (e) strain rate 10 s−1.
Metals 16 01042 g003
Figure 4. The relationship curve between ln ε ˙   and σ as well as ln σ : (a) The relationship curve between ln ε ˙   and σ; (b) The relationship curve between σ as well as ln σ .
Metals 16 01042 g004
Figure 5. The relationship curve between l n s i n h α σ and ln ( ε ) ˙ and 10,000/T: (a) The relationship curve between l n s i n h α σ and ln ( ε ) ˙ ; (b) The relationship curve between l n s i n h α σ and 10,000/T.
Metals 16 01042 g005
Figure 6. Graph of the relationship between ln Z and l n s i n h α σ .
Metals 16 01042 g006
Figure 7. Strain rate sensitivity factor m : (a) 0.2 strain; (b) 0.4 strain; (c) 0.6 strain; (d) 0.8 strain.
Metals 16 01042 g007
Figure 8. Hot processing map: (a) 0.2 strain; (b) 0.4 strain; (c) 0.6 strain; (d) 0.8 strain.
Metals 16 01042 g008
Figure 9. Original austenite grain boundary images under different thermal deformation processes (all images are at the same magnification (200×), and the scale bar in the bottom right corner applies to all micrographs).
Metals 16 01042 g009
Figure 10. The microstructure and grain size statistics of the sample at an applied strain rate of 0.1 s−1 and a temperature of 1050 °C are as follows: (a) OM; (b) SEM; (c) PAGB; (d) histogram of the original austenite grain size distribution.
Metals 16 01042 g010
Figure 11. The microstructure and grain size statistics of the sample at an applied strain rate of 0.001 s−1 and a temperature of 1150 °C are as follows: (a) OM; (b) SEM; (c) PAGB; (d) histogram of the original austenite grain size distribution.
Metals 16 01042 g011
Figure 12. The microstructure and grain size statistics of the sample at an applied strain rate of 10 s−1 and a temperature of 850 °C are as follows: (a) OM; (b) SEM; (c) PAGB; (d) histogram of the original austenite grain size distribution.
Metals 16 01042 g012
Figure 13. At a strain rate of 0.1 s−1 and a temperature of 850 °C, the microstructure and grain size statistics of the sample are as follows: (a) OM; (b) SEM; (c) PAGB; (d) histogram of the original austenite grain size distribution.
Metals 16 01042 g013aMetals 16 01042 g013b
Table 1. Chemical composition of the test steel (wt.%).
CSiMnPSNiCrMoTiNb
0.1450.31.460.00140.0010.10.4470.150.0150.03
Disclaimer/Publisher’s Note: The statements, opinions and data contained in all publications are solely those of the individual author(s) and contributor(s) and not of MDPI and/or the editor(s). MDPI and/or the editor(s) disclaim responsibility for any injury to people or property resulting from any ideas, methods, instructions or products referred to in the content.