Article

Effect of External Magnetic Field on Microstructure and Mechanical Properties of GMW2/H1000 Resistance Spot-Welded Joints


1
School of Energy and Mechanical Engineering, Shanghai University of Electric Power, Shanghai 201306, China
2
Shanghai FusionSmart Industry Equipment Co., Ltd., Shanghai 201306, China
3
Shanghai Key Laboratory of Digital Manufacture for Thin-Walled Structures, Shanghai Jiao Tong University, Shanghai 200240, China
*
Author to whom correspondence should be addressed.
Metals 2026, 16(9), 1027; https://doi.org/10.3390/met16091027
Submission received: 5 August 2026 / Revised: 9 September 2026 / Accepted: 12 September 2026 / Published: 16 September 2026
(This article belongs to the Section Welding and Joining)

Abstract

This study investigated the effect of magnet working distance on the external magnetic-field distribution, weld-nugget geometry, and mechanical response of GMW2/H1000 dissimilar steel joints produced by magnetic-field-assisted resistance spot welding (MA-RSW). Three-dimensional magnetostatic simulations were performed for working distances of 34, 28, and 22 mm, together with experimental characterization of weld morphology, tensile–shear behavior, microstructure, and microhardness. The simulated magnetic flux density at the geometric weld center increased from 23.88 mT at H   =   34 mm to 41.63 mT at H   =   28 mm and 82.39 mT at H   =   22 mm. The mean nugget diameter increased from 5.14   ±   0.14 mm for conventional RSW to 5.67   ±   0.14 mm at H   =   22 mm, while the mean peak tensile–shear load increased from 5738.6   ±   177.5 N to 6604.1   ±   211.1 N, corresponding to a 15.1% increase. A first-order geometrical analysis showed that the equivalent fusion area increased by approximately 21.7%, indicating that nugget enlargement is an important contributor to the improved load-bearing capacity. Optical microscopy revealed a finer and less directionally developed dendritic morphology under MA-RSW. The results are consistent with an additional electromagnetic influence, although molten-metal flow was not directly resolved by the present magnetostatic model.

1. Introduction

Lightweight multi-material design has become an important strategy in automotive engineering for reducing structural mass while maintaining crashworthiness, manufacturability, and cost effectiveness [1]. Advanced high-strength steels (AHSSs) and high-strength stainless steels are increasingly considered for lightweight automotive structures because of their favorable combinations of strength, ductility, and formability [2]. H1000 is a high-strength austenitic stainless steel developed for lightweight structural applications and exhibits high yield strength together with pronounced strain-hardening capability, whereas GMW2 is a lower-strength low-carbon steel with established resistance spot weldability [3]. Accordingly, joining H1000 stainless steel to GMW2 low-carbon steel represents a potentially relevant dissimilar-material configuration for lightweight structures in which structural performance and material cost must be balanced.
Resistance spot welding (RSW) is widely used for joining automotive sheet steels because of its high productivity, low cost, and suitability for automation [4]. However, dissimilar stainless-steel/low-carbon-steel RSW remains challenging because differences in the electrical, thermal, and metallurgical properties of the constituent materials can lead to asymmetric nugget formation, heterogeneous fusion-zone microstructures, and solidification-related defects, thereby affecting joint mechanical performance [3,5]. Therefore, controlling nugget formation and solidification behavior is important for improving the quality of dissimilar-steel resistance spot-welded joints.
Magnetic-field-assisted resistance spot welding (MA-RSW) has been investigated as an approach for modifying the electromagnetic conditions within the weld region [6,7]. Early studies on dual-phase steels demonstrated that an externally applied magnetic field can alter weld-nugget morphology and affect joint performance [8,9]. Similar effects have subsequently been reported for aluminum-alloy resistance spot welds [10,11]. For austenitic stainless steel, Li et al. [12] reported that the application of an external magnetic field modified nugget morphology and solidification structure, changed the characteristics of shrinkage-related defects, and improved lap-shear performance. Alternative magnetic-field configurations have also been investigated to regulate nugget formation and improve the applicability of magnetic assistance during RSW [13]. More recently, Feng et al. [14] investigated magnetic-field-assisted RSW of H1000 austenitic stainless steel and reported changes in nugget geometry, microstructure, and tensile–shear performance. A subsequent study on H1000/DP590 dissimilar steel joints further demonstrated that externally applied magnetic fields can modify nugget morphology, microstructural characteristics, and mechanical response in a dissimilar steel system [15]. Collectively, these studies demonstrate that magnetic-field assistance can influence RSW behavior in both homogeneous and dissimilar material systems.
Nevertheless, the existing literature does not establish how variations in magnet working distance—and hence variations in the magnitude and spatial distribution of the externally applied magnetic field—are quantitatively related to weld-nugget geometry and mechanical response in GMW2/H1000 dissimilar joints. Moreover, previously reported improvements in joint performance under magnetic-field assistance are frequently accompanied by changes in nugget size, microstructure, and defect morphology. Because weld-nugget size itself is an important determinant of the load-bearing capacity of resistance spot-welded joints [16], distinguishing the geometrical contribution from possible microstructural and defect-related contributions is important when interpreting the mechanical response. The response of the GMW2/H1000 dissimilar material combination to systematically varied external magnetic-field conditions therefore requires further clarification.
Accordingly, the objective of the present study is to clarify the relationships among magnet working distance, the externally applied magnetic-field distribution, weld-nugget geometry, and mechanical response in GMW2/H1000 dissimilar resistance spot-welded joints. A permanent-magnet-assisted RSW system was employed at three magnet working distances under otherwise fixed welding parameters. Three-dimensional magnetostatic simulations were performed to quantify the externally applied magnetic-field distribution for each working distance, while weld-nugget geometry, tensile–shear behavior, failure mode, optical microstructure, and microhardness distribution were experimentally characterized. Particular attention was given to the relationship between nugget enlargement and tensile–shear performance so that the contribution of weld geometry could be considered explicitly when interpreting the mechanical results. The simulated external magnetic field, together with the experimentally observed morphological and microstructural changes, was further used to discuss a physically plausible electromagnetic influence on molten-metal transport. Because the present magnetostatic model does not directly resolve the transient welding-current-density, Lorentz-force, temperature, or molten-metal velocity fields, the proposed molten-metal redistribution is treated as a physical interpretation rather than as a directly simulated flow phenomenon.

2. Experimental Materials, Equipment, and Methods

2.1. Materials

The experimental materials used in this study were GMW2 low-carbon steel and H1000 austenitic stainless steel, both with a thickness of 1.2 mm. H1000 is a high-strength austenitic stainless steel, whereas GMW2 is a low-carbon steel used in automotive sheet applications. The mechanical properties and chemical compositions of the two base metals are listed in Table 1 and Table 2, respectively. The values were obtained from the material certificates provided by the manufacturers. Both GMW2 and H1000 were supplied as bare, uncoated cold-rolled sheets with a thickness of 1.2 mm.

2.2. Magnetic-Field-Assisted Spot Welding System and Welding Procedure

Cone-shaped Cu-Cr-Zr electrode caps with a tip diameter of 6 mm were employed. The welding schedule was maintained constant for all experimental conditions, with a squeeze time of 200 ms, a single MFDC welding-current pulse of 8.5 kA for 250 ms, and a hold time of 150 ms. No preheating or post-heating current pulse was applied. The MFDC output was unidirectional during the welding-current pulse, without current zero crossing. The conventional current direction was from the upper electrode to the lower electrode; accordingly, the upper electrode was connected to the positive terminal and the lower electrode to the negative terminal. The pneumatic pressure was set to 0.35 MPa, corresponding to an electrode force of approximately 3.7 kN according to the machine calibration.
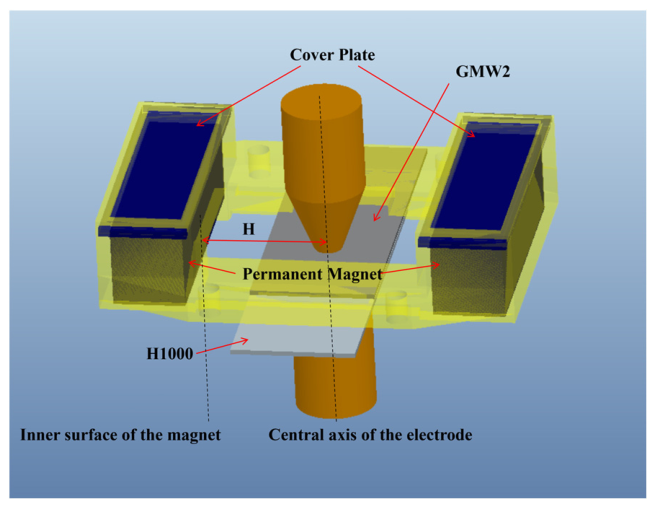
To introduce a static external magnetic field during welding, a magnetic-field-assisted resistance spot welding device was designed and assembled, as shown in Figure 1. The device employed a pair of N52 NdFeB rectangular permanent magnets with dimensions of 60 mm × 18 mm × 18 mm as the external magnetic-field source. To minimize the influence of the fixture on the magnetic-field distribution, the fixture housing and cover plates were fabricated from a non-magnetic engineering polymer using additive manufacturing. The magnets were symmetrically mounted on the working platform of the spot welding machine.
The magnetic-field working distance, H , was defined as the horizontal distance from the inner surface of each permanent magnet to the central axis of the electrode, as schematically illustrated in Figure 1. Three magnet working distances, H   =   22 , 28, and 34 mm, were investigated. All other welding parameters were kept unchanged among the investigated conditions.
To quantitatively characterize the externally applied magnetic field, a three-dimensional magnetostatic model was established using ANSYS Maxwell 2024 R2. The computational domain included the GMW2 and H1000 steel sheets, Cu-Cr-Zr electrodes, permanent magnets, and a surrounding air region with dimensions of 222 mm × 152 mm × 78 mm. A zero magnetic flux boundary condition was applied to the outer surfaces of the surrounding air region.
The surrounding air and Cu-Cr-Zr electrodes were assigned a relative magnetic permeability ( μ r ) of 1. Because material-specific magnetic-property data for GMW2 were unavailable, its ferromagnetic response was approximated using the nonlinear B–H relationship of M22 soft magnetic steel available in the ANSYS Maxwell material library. This treatment was adopted as a surrogate representation of the nonlinear magnetic response and saturation behavior of the GMW2 steel rather than as a material-specific magnetic characterization. The H1000 austenitic stainless steel was modeled using a constant relative magnetic permeability of μ r   =   1.02 . The permanent magnets were represented using the NdFeB magnetic material available in ANSYS Maxwell without manual adjustment of the coercivity. The principal magnetization direction of the permanent magnets was defined along the x-axis, transverse to the electrode axis.
The computational domain was discretized using an unstructured tetrahedral finite-element mesh. The magnetostatic solver was operated using the program-controlled adaptive solution and convergence settings in ANSYS Maxwell; no additional user-defined convergence tolerance was imposed. Magnetostatic calculations were performed for H   =   22 , 28, and 34 mm using otherwise identical model settings.
To evaluate mesh sensitivity, three mesh densities (coarse, medium, and fine) were examined for the representative H   =   22 mm condition. The corresponding meshes contained 3652, 38,767, and 280,088 elements, respectively. The total magnetic flux density at the geometric weld center was selected as the monitoring quantity. The corresponding values obtained using the coarse, medium, and fine meshes were 93.57, 82.39, and 81.86 mT, respectively. Further refinement from 38,767 to 280,088 elements changed the monitored magnetic flux density by only approximately 0.64%, indicating that further mesh refinement had only a minor influence on the predicted magnetic flux density at the geometric weld center. Therefore, the medium mesh containing 38,767 elements was adopted for the subsequent simulations considering both numerical accuracy and computational cost.
Because direct in situ Hall-probe measurements at the faying interface were impractical owing to the restricted space between the opposing electrodes, the magnetic field in the representative weld region was evaluated numerically. A 10 mm long evaluation path was defined along the faying interface, extending 5 mm on either side of the geometric weld center. The total magnetic flux density, B , and the x-component of the magnetic flux density, B x , were extracted along the same path for all three magnet working distances. In the adopted coordinate system, the z-axis coincided with the electrode axis and approximately with the dominant welding-current direction, whereas the x-axis was oriented along the principal magnetization direction of the permanent magnets.
As an external benchmark for the present magnetostatic modeling approach, the experimental and numerical results reported by Li et al. [9] were also considered. In their permanent-magnet-assisted RSW configuration, the external magnetic-field distribution along the faying surface was measured using a Hall-probe gaussmeter and compared with finite-element predictions, showing good agreement between the measured and calculated distributions. This published validation supports the applicability of magnetostatic finite-element analysis for characterizing the externally applied magnetic field in a comparable permanent-magnet-assisted RSW system. However, because the magnet geometry, dimensions, arrangement, workpiece materials, and working distances differ from those used in the present study, this comparison is regarded as an external benchmark for the modeling approach rather than as a direct quantitative validation of the present magnetic-field predictions.
It should be noted that the present magnetostatic model does not account for the temperature dependence of the magnetic properties during resistance spot welding. In particular, the magnetic permeability of the ferromagnetic GMW2 steel is expected to decrease substantially at elevated temperatures and to change markedly as the material approaches its Curie temperature. Therefore, the calculated magnetic-field distributions are used primarily for comparative characterization of the externally applied magnetic-field conditions at different magnet working distances, rather than as a fully coupled prediction of the instantaneous magnetic field within the high-temperature weld pool.
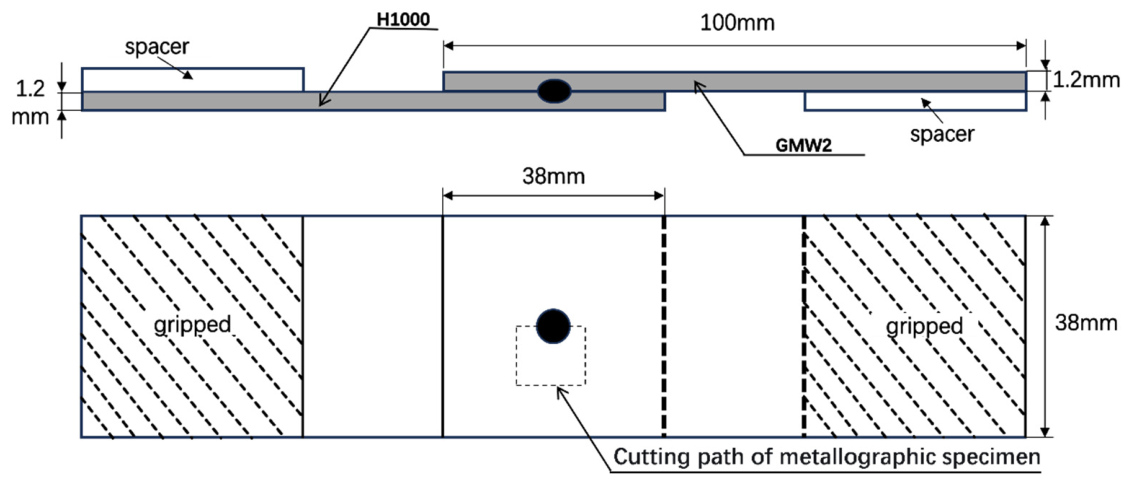
The tensile–shear specimen geometry was prepared with reference to the Auto/Steel Partnership (A/SP) lap-shear configuration. The 1.2 mm thick base-metal sheets were cut into specimens with dimensions of 38 mm × 100 mm using a wire electrical discharge cutting machine (ESUNTEK EFH43B, Shanghai, China). Because both materials were supplied as bare, uncoated sheets, the welding region and the surrounding area within a radius of approximately 30 mm were mechanically ground to remove surface oxides and contaminants and to improve the consistency of the initial contact condition among specimens. The specimens were subsequently degreased with acetone using lint-free cloths and dried before welding. Resistance spot welding was performed in a lap-joint configuration, with the GMW2 steel positioned as the upper sheet and the H1000 steel as the lower sheet. The overlap area was 38 mm × 38 mm, and the weld spot was located at the center of the overlap region, as shown in Figure 2.

2.3. Testing and Characterization Methods

To systematically evaluate the joint quality, characterization covered four aspects: macro-morphology, mechanical properties, microstructure, and microhardness.
(1)
Tensile–shear test: To evaluate the load-bearing capacity of the joints, Static tensile-shear tests were performed using a universal testing machine (UTM5504X, SUNS, Shenzhen, China). SUNS UTM5504X universal testing machine. The tensile rate was set at 2 mm/min. Three independent tensile–shear tests were conducted for each parameter condition (n = 3). The results were expressed as mean ± standard deviation (SD). Statistical significance among the different welding conditions was evaluated using a one-way analysis of variance (ANOVA) followed by Tukey’s honestly significant difference (HSD) post hoc test. A value of p < 0.05 was considered statistically significant.
(2)
Metallographic specimen preparation and microstructural observation: The welded specimens were sectioned along the weld centerline using a wire electrical discharge cutting machine. Metallographic preparation was carried out with reference to GB/T 13298-2015 (Inspection methods of microstructure for metals) [17]. The specimens were hot mounted, mechanically ground, and polished using an automatic grinding/polishing machine until a mirror-like surface was obtained, followed by chemical etching using Glyceregia reagent. A Leica stereomicroscope was used to observe the cross-sectional macro-morphology and measure the weld nugget geometry, while a Leica DM6M optical microscope (Leica Microsystems CMS GmbH, Wetzlar, Germany) was used to examine the microstructures of the base metal (BM), heat-affected zone (HAZ), and fusion zone (FZ).
(3)
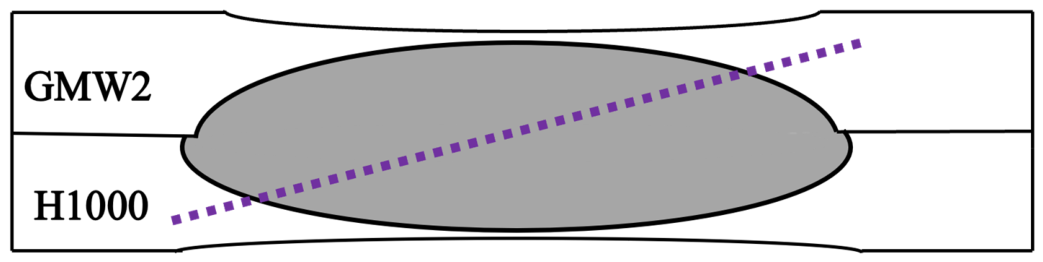
Microhardness test: Vickers microhardness measurements were performed on the polished metallographic specimens using a Buehler Wilson VH1102 microhardness tester (Buehler, Lake Bluff, IL, USA). As shown in Figure 3, the measurement path followed a diagonal traverse extending from the H1000 base-metal side, through the fusion zone, to the GMW2 base-metal side. A test force of 2.94 N (0.3 kgf, HV0.3) was applied with a dwell time of 10 s. The spacing between adjacent indentations was 0.3 mm. One representative hardness traverse was obtained for each selected welding condition; therefore, the hardness profiles were used for spatial comparison rather than for weld-to-weld statistical analysis. The individual Vickers hardness values were recorded automatically by the testing system.

3. Results and Discussion

3.1. Magnetic-Field Distribution and Proposed Electromagnetic Effect

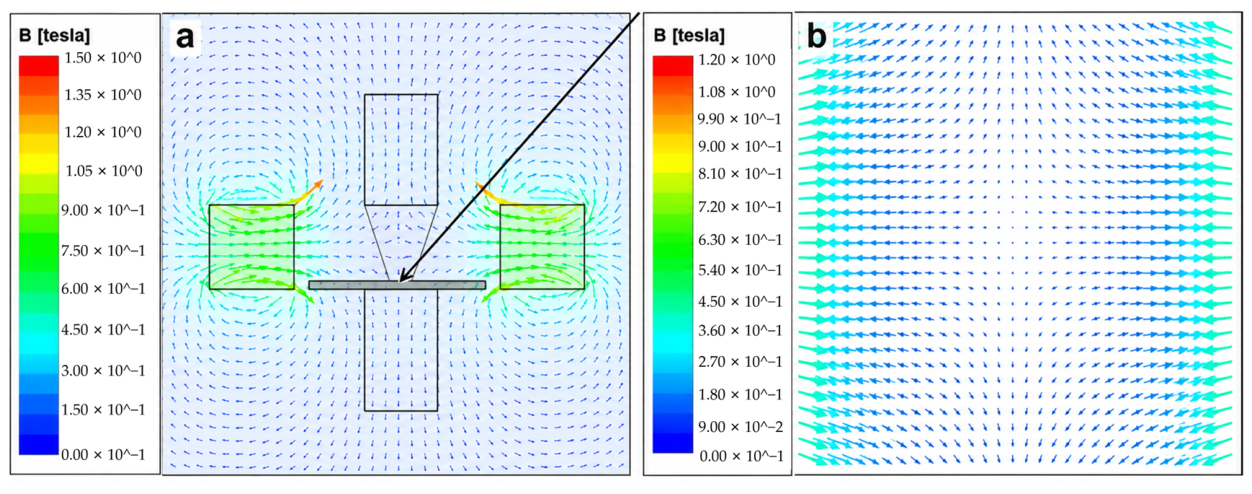
To investigate the spatial distribution of the externally applied magnetic-field in the weld region and to provide a quantitative basis for discussing its potential electromagnetic effect during welding, a three-dimensional magnetostatic model was established using ANSYS Maxwell. The magnetic-field distributions were calculated for the three investigated working distances of H = 22, 28, and 34 mm. Figure 4 presents the representative magnetic-field distribution for H = 22 mm.
As shown in Figure 4a, a cusp-type magnetic-field configuration was generated by the two opposing permanent magnets. The magnetic flux entering the region between the magnets was redistributed near the central region because of the opposing magnetization configuration. Figure 4b shows the magnetic flux-density vectors on the faying-interface plane (38 mm × 38 mm). A pronounced spatially non-uniform magnetic-field distribution is observed, with variations in both magnitude and direction across the interface. Although partial cancelation of individual magnetic-field components occurs within the central region, the resultant magnetic flux density at the geometric weld center remains finite because it is determined by the vector superposition of all magnetic-field components. The magnetic-field variation within the representative weld region was therefore further quantified using the path defined in Section 2.2.
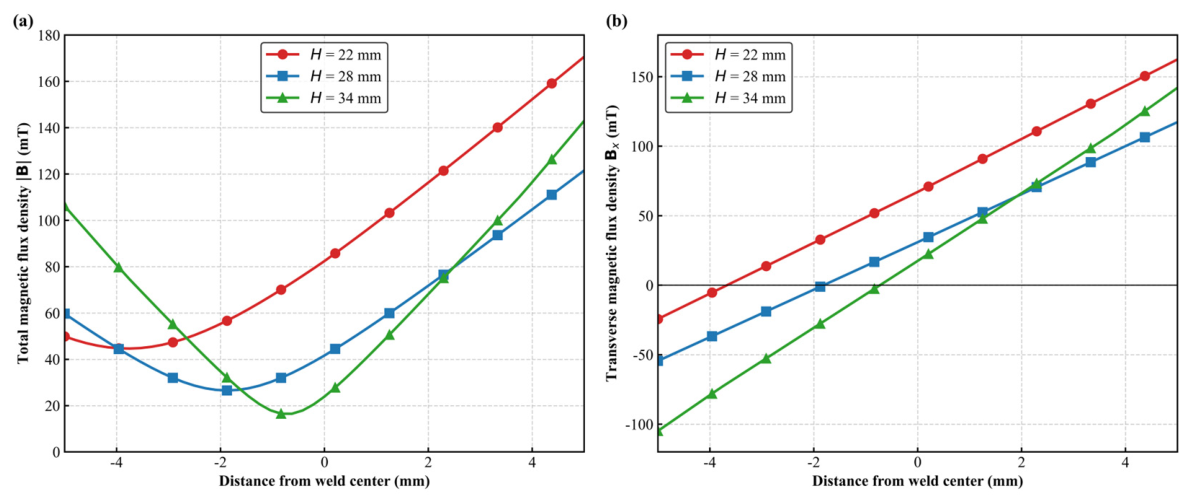
Figure 5a compares the total magnetic flux density, B , along the 10 mm evaluation path for the three magnet working distances. The profiles demonstrate that the externally applied magnetic field is spatially non-uniform and that its distribution varies substantially with H . At the geometric weld center ( x   =   0 mm), the simulated B increased from 23.88 mT at H   =   34 mm to 41.63 mT at H   =   28 mm and 82.39 mT at H   =   22 mm. Relative to H   =   34 mm, the central magnetic flux density increased by approximately 74.3% and 245.0% at H   =   28 and 22 mm, respectively. These results demonstrate that decreasing the magnet working distance substantially increases the local magnetic flux density at the geometric weld center. However, the profiles intersect at some positions along the evaluation path. Therefore, decreasing H should be interpreted as modifying the spatial magnetic-field distribution rather than uniformly amplifying the magnetic flux density throughout the entire weld region.
Figure 5b further shows the variation in the x-component of the magnetic flux density, B x , which represents one of the transverse magnetic-field components with respect to the electrode axis. At the geometric weld center, B x increased from 17.42 mT at H   =   34 mm to 30.93 mT at H   =   28 mm and 67.08 mT at H   =   22 mm. In addition, B x changes sign across the evaluated region for all three working distances, while the zero-crossing position varies with H . These results further demonstrate that changing the magnet working distance affects not only the local magnetic-field magnitude but also its spatial distribution and directional characteristics within the weld region.
The potential electromagnetic effect of the applied magnetic field can be considered on the basis of the Lorentz-force relationship:
f L   =   J ×   B
where f L is the Lorentz-force density, J is the local welding-current density, and B is the local magnetic flux density. In the present coordinate system, the z-axis coincides with the electrode axis and approximately with the dominant welding-current direction. Consequently, magnetic-field components transverse to the z-axis can contribute to lateral electromagnetic forcing during the current-on period. The increase in both B and B x at the geometric weld center with decreasing H therefore indicates a stronger local magnetic condition for electromagnetic interaction with the welding current. However, the magnitude and spatial distribution of the Lorentz-force density cannot be determined from the magnetic flux density alone because they also depend on the transient local current-density distribution.
It should also be recognized that the magnetic field during resistance spot welding consists of both the externally applied field generated by the permanent magnets and the self-induced magnetic field associated with the welding current. This can be expressed conceptually as:
B = B e x t   +   B s e l f
and the corresponding Lorentz-force density is therefore:
f L   =   J × ( B e x t   +   B s e l f )
The present magnetostatic model characterizes only the externally applied magnetic field and does not simultaneously resolve the transient welding-current-density distribution or the self-induced magnetic field. Consequently, the respective Lorentz-force contributions associated with B e x t and B s e l f cannot be quantitatively separated in the present study. The externally applied magnetic field should therefore be regarded as an additional electromagnetic driving contribution introduced by the permanent magnets rather than as a quantitatively demonstrated dominant contribution. Moreover, because the Lorentz force depends on the welding current, the direct electromagnetic forcing considered here is primarily associated with the current-on period and ceases following current termination.
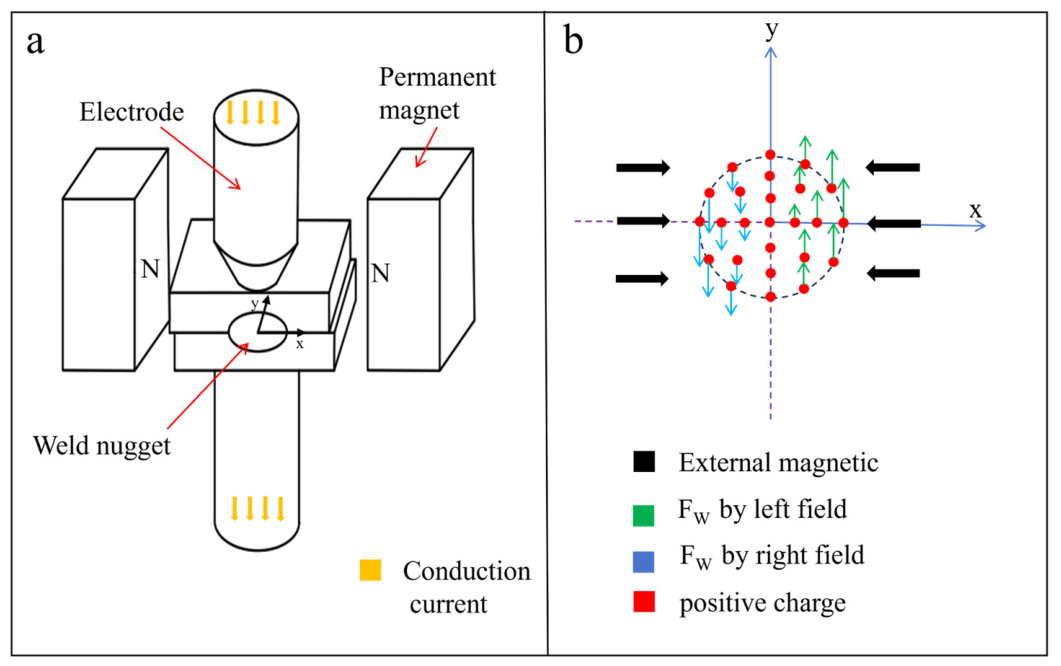
Based on the calculated spatial distribution of the external magnetic field and the vector relationship in Equation (1), Figure 6 schematically illustrates the proposed electromagnetic influence on molten-metal transport during MA-RSW. The schematic represents a physically plausible electromagnetic forcing mechanism rather than a directly simulated molten-metal velocity field. Because the present model does not calculate the transient J distribution, Lorentz-force field, or molten-metal flow field, the proposed redistribution of molten metal cannot be quantitatively established from the magnetostatic simulation alone. Instead, the mechanism is discussed as an interpretation consistent with the simulated external magnetic-field characteristics and the experimentally observed changes in weld-nugget morphology discussed in Section 3.2.

3.2. Effect of External Magnetic Field on Weld-Nugget Macro-Morphology

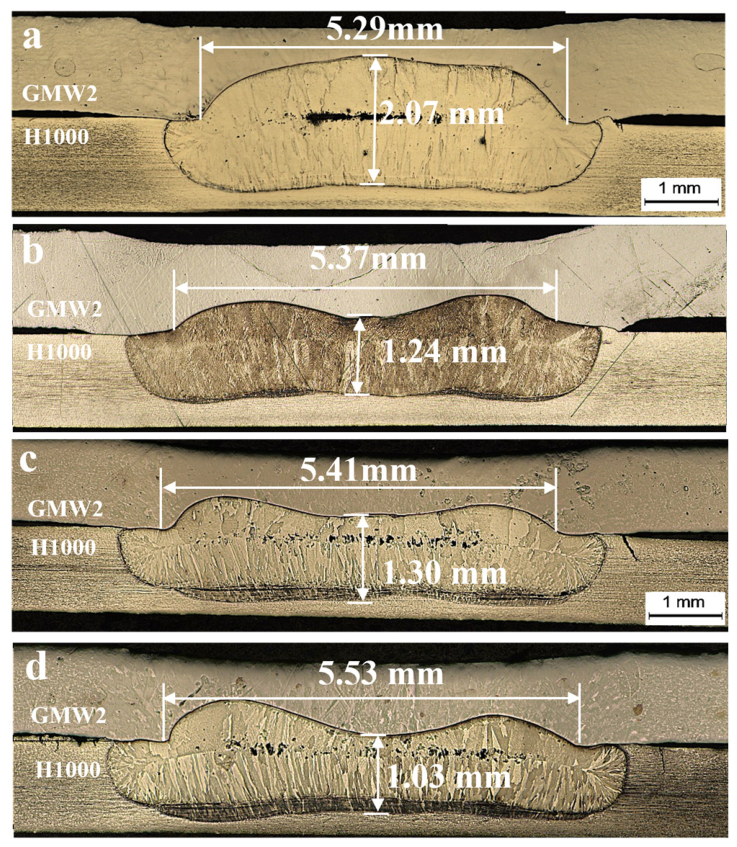
Representative cross-sectional morphologies of the GMW2/H1000 dissimilar steel joints produced under different welding conditions are shown in Figure 7. The welding parameters were maintained constant at a welding current of 8.5 kA, a welding time of 250 ms, and an electrode force of approximately 3.7 kN, while the magnet working distance was varied for the MA-RSW conditions.
For the conventional RSW joint without an externally applied magnetic field, the weld nugget exhibited an approximately elliptical cross-sectional morphology with a relatively large center thickness. A large and irregular continuous cavity was also observed near the central region of the nugget. The occurrence of this central solidification-related defect may be associated with the asymmetric thermal and solidification conditions arising from the dissimilar material combination; however, the present experiments do not directly resolve the transient thermal field or liquid-feeding behavior.
To quantitatively evaluate the changes in nugget geometry, three independent welds were examined for each welding condition ( n   =   3 ). The nugget diameter was measured along the faying interface, whereas the center thickness was defined as the vertical distance between the upper and lower fusion boundaries at the geometric centerline of the nugget. The corresponding results are summarized in Table 3 and are reported as mean ± standard deviation.
The mean nugget diameter increased progressively from 5.14   ±   0.14 mm for conventional RSW to 5.25   ±   0.11 , 5.33   ±   0.13 , and 5.67   ±   0.14 mm for the MA-RSW conditions at H   =   34 , 28, and 22 mm, respectively. Thus, the largest mean nugget diameter was obtained at the smallest magnet working distance. This geometrical evolution indicates an increase in the radial extent of the fusion region under magnetic-field assistance. Because nugget size is an important geometrical factor affecting the load-bearing capacity of resistance spot-welded joints, the relationship between nugget enlargement and tensile–shear performance is further discussed in Section 3.3.
In contrast to the progressive increase in mean nugget diameter, the center thickness exhibited a non-monotonic variation. The conventional RSW joint showed a center thickness of 2.04   ±   0.11 mm. With magnetic-field assistance, the center thickness decreased to 1.25   ±   0.10 mm at H   =   34 mm, increased slightly to 1.34   ±   0.06 mm at H   =   28 mm, and then decreased to 1.04   ±   0.10 mm at H   =   22 mm. Therefore, the H   =   22 mm condition exhibited both the largest mean nugget diameter and the smallest mean center thickness among the investigated conditions. As discussed in Section 3.1, this condition also exhibited the highest simulated magnetic flux density at the geometric weld center. The observed morphological response is therefore qualitatively associated with the change in the externally applied magnetic-field condition as the magnet working distance decreases. However, because the present numerical model does not directly calculate the transient Lorentz-force or molten-metal velocity fields, the specific flow pattern responsible for this geometrical evolution cannot be quantitatively determined.
A change in the morphology of the central solidification-related defects was also observed under magnetic-field assistance. In the representative cross-section of the conventional RSW joint, the defect appeared as a relatively large continuous cavity near the nugget center, whereas the representative MA-RSW cross-sections showed more spatially separated and finer pores. This observation indicates a change in defect morphology and spatial distribution rather than direct evidence of a reduction in the total defect content. One possible interpretation is that the additional electromagnetic influence during the current-on molten-pool stage modifies heat and mass transport and thereby affects subsequent solidification and liquid feeding. This interpretation is consistent with the external magnetic-field characteristics discussed in Section 3.1, but the underlying molten-metal flow was not directly measured or numerically resolved in the present study.
It should be emphasized that the defect observations in the present study are based on representative two-dimensional metallographic cross-sections. In the examined sections, the conventional RSW condition exhibited a relatively continuous cavity-like defect, whereas more dispersed pore-like features were observed in some MA-RSW conditions. However, these two-dimensional observations do not provide quantitative information on the three-dimensional defect volume fraction, size distribution, or spatial distribution. Therefore, no definitive conclusion is drawn regarding an overall reduction in solidification-defect severity. Three-dimensional characterization, such as X-ray computed tomography, would be required to verify the volumetric defect evolution.

3.3. Effect of External Magnetic Field on Tensile–Shear Performance

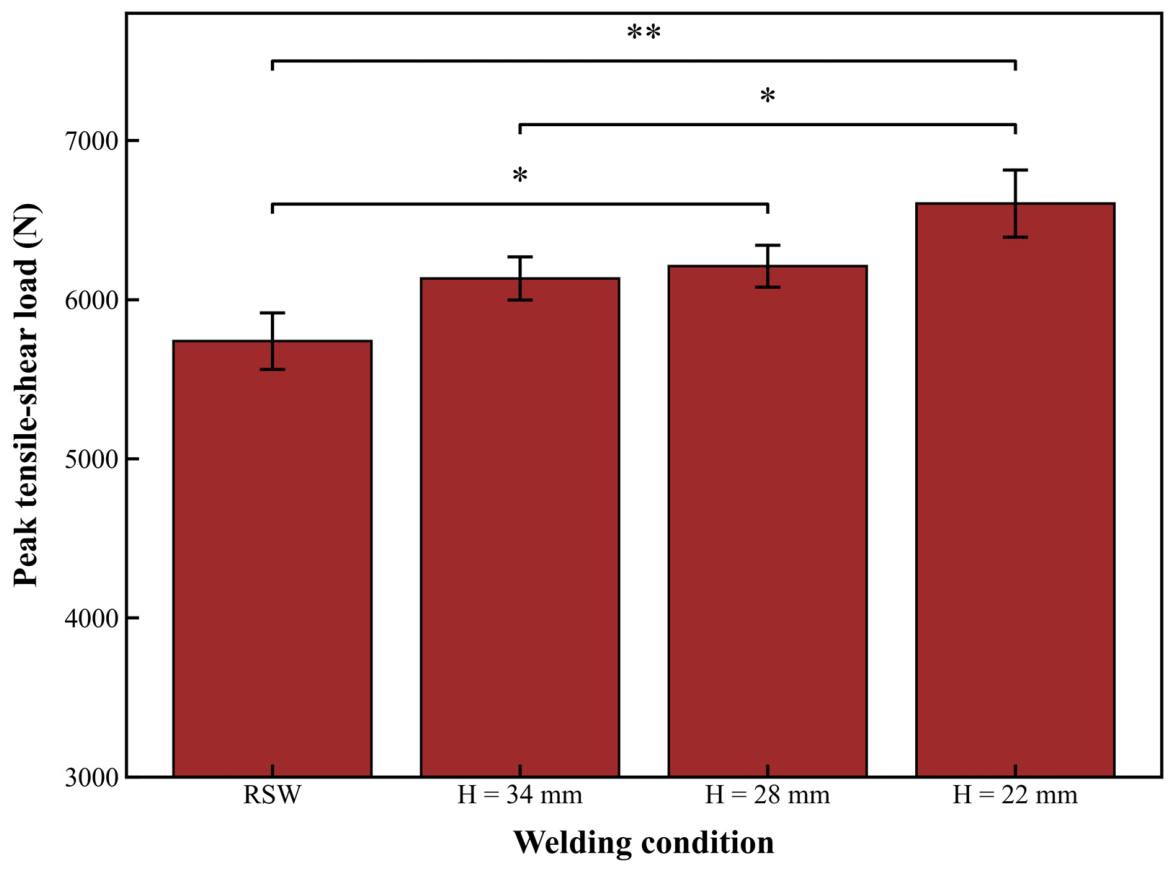
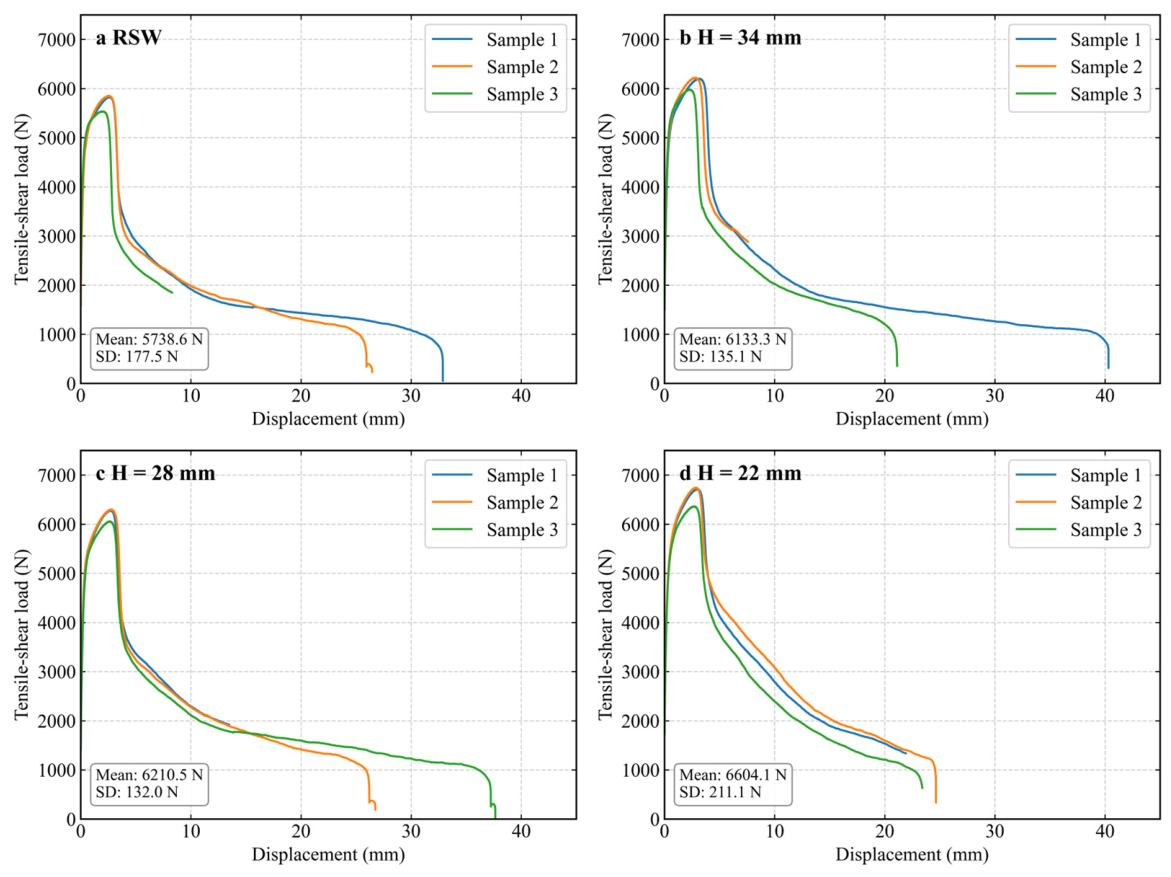
The tensile–shear performance of the welded joints was evaluated to determine the influence of the externally applied magnetic field on the load-bearing response. As shown in Figure 8, the conventional RSW joints exhibited a mean peak tensile–shear load of 5738.6   ±   177.5 N. With magnetic-field assistance, the mean peak load increased to 6133.3   ±   135.1 N at H   =   34 mm, 6210.5   ±   132.0 N at H   =   28 mm, and 6604.1   ±   211.1 N at H   =   22 mm. The highest mean peak tensile–shear load was therefore obtained at H   =   22 mm, corresponding to an increase of approximately 15.1% relative to conventional RSW.
One-way ANOVA indicated that the welding condition had a statistically significant effect on the peak tensile–shear load F 3 8   =   13.52 ,   p   =   0.0017 . Tukey’s HSD post hoc test showed significant differences between conventional RSW and MA-RSW at H   =   28 mm ( p   =   0.0349 ), between conventional RSW and MA-RSW at H   =   22 mm ( p   =   0.0010 ), and between MA-RSW at H   =   34 mm and H   =   22 mm ( p   =   0.0353 ). No statistically significant differences were observed for the remaining pairwise comparisons ( p   >   0.05 ).
Representative tensile–shear load–displacement curves are presented in Figure 9. All investigated joints exhibited an initial increase in load to a maximum value, followed by a post-peak decrease associated with progressive deformation and eventual failure. Compared with conventional RSW, the MA-RSW joints generally exhibited higher peak-load levels, with the H   =   22 mm condition showing the highest mean peak tensile–shear load. The post-peak portions of the curves further indicate that substantial deformation occurred before complete separation of the joints.
To further characterize the mechanical response during tensile–shear loading, the effective energy absorption was calculated from the area under the load–displacement curve according to:
E = 0 δ f F δ d δ
where E is the effective absorbed energy, F δ is the tensile–shear load as a function of displacement, and δ f is the displacement at the end of the evaluated loading process. The corresponding results are summarized in Table 4. The mean absorbed energy was 12.4   ±   2.1 J for conventional RSW and 15.1   ±   2.9 , 14.7   ±   0.6 , and 16.6   ±   1.0 J for the MA-RSW joints at H   =   34 , 28, and 22 mm, respectively. Thus, the H   =   22 mm condition exhibited the highest mean absorbed energy, corresponding to an increase of approximately 33.9% relative to conventional RSW. Although the mean absorbed energies of the MA-RSW joints were higher than that of conventional RSW, the variation with magnet working distance was non-monotonic. Therefore, these results are interpreted in terms of mean values unless supported by a separate statistical significance analysis of the absorbed-energy data.
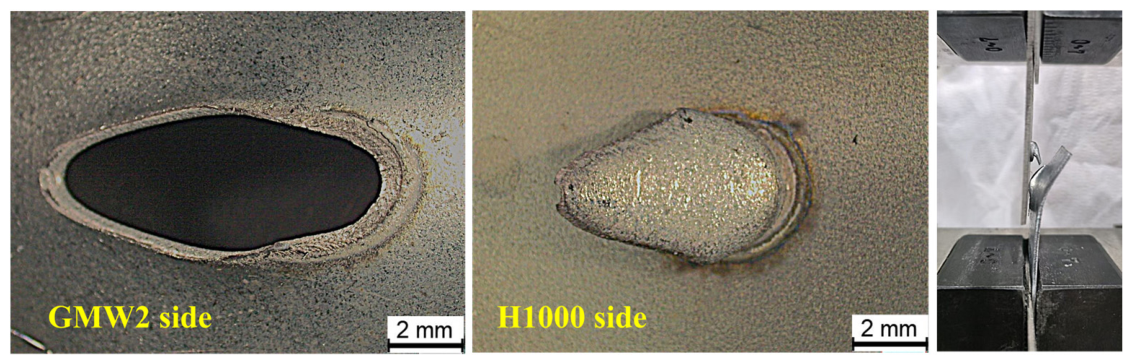
The macroscopic failure modes of the tensile–shear specimens were examined to further assess the joint response, as shown in Figure 10. All tested joints, including conventional RSW and MA-RSW joints at H   =   34 , 28, and 22 mm, exhibited a pull-out (PO) failure mode, and no interfacial failure mode was observed. In the representative specimen shown in Figure 10, the weld nugget was pulled from the surrounding GMW2 sheet, leaving a distinct opening in the sheet. Although application of the external magnetic field did not change the observed macroscopic failure mode, the MA-RSW joints exhibited larger mean nugget diameters together with higher mean peak tensile–shear loads. In particular, the H   =   22 mm condition exhibited both the largest mean nugget diameter and the highest mean peak tensile–shear load.
The increase in nugget diameter provides a plausible geometrical contribution to the increased tensile–shear load. To examine this relationship quantitatively, a first-order comparison was performed using the mean nugget diameters reported in Section 3.2. Assuming an equivalent circular fusion area, A   =   π d 2 / 4 , the estimated areas were approximately 20.75, 21.65, 22.31, and 25.25 mm2 for conventional RSW and MA-RSW at H   =   34 , 28, and 22 mm, respectively. Relative to conventional RSW, these values correspond to increases of approximately 4.3%, 7.5%, and 21.7%. Over the same conditions, the mean peak tensile–shear load increased from 5738.6 N to 6133.3, 6210.5, and 6604.1 N, respectively. In particular, the H   =   22 mm condition exhibited a 21.7% increase in estimated equivalent fusion area and a 15.1% increase in peak tensile–shear load relative to conventional RSW.
Previous studies on resistance welding have demonstrated a direct relationship between effective welded area and mechanical resistance [18]. For resistance spot-welded joints, fusion-zone size and weld-nugget diameter have also been shown to strongly influence peak load, failure mode, and energy absorption under lap-shear loading [16,19]. Accordingly, the present first-order comparison indicates that nugget enlargement is an important geometrical contributor to the observed increase in load-bearing capacity.
However, the equivalent circular area represents only a first-order two-dimensional geometrical descriptor and does not fully characterize the actual three-dimensional fusion geometry. Moreover, nugget size was not independently controlled in the present experiments. Therefore, the difference between the relative increase in estimated fusion area and that in peak tensile–shear load cannot be directly attributed to microstructural modification or defect redistribution. The individual contributions of nugget geometry, microstructure, and internal defect characteristics to the mechanical response cannot be quantitatively separated based on the present dataset.

3.4. Microstructural Characteristics of RSW and MA-RSW Joints

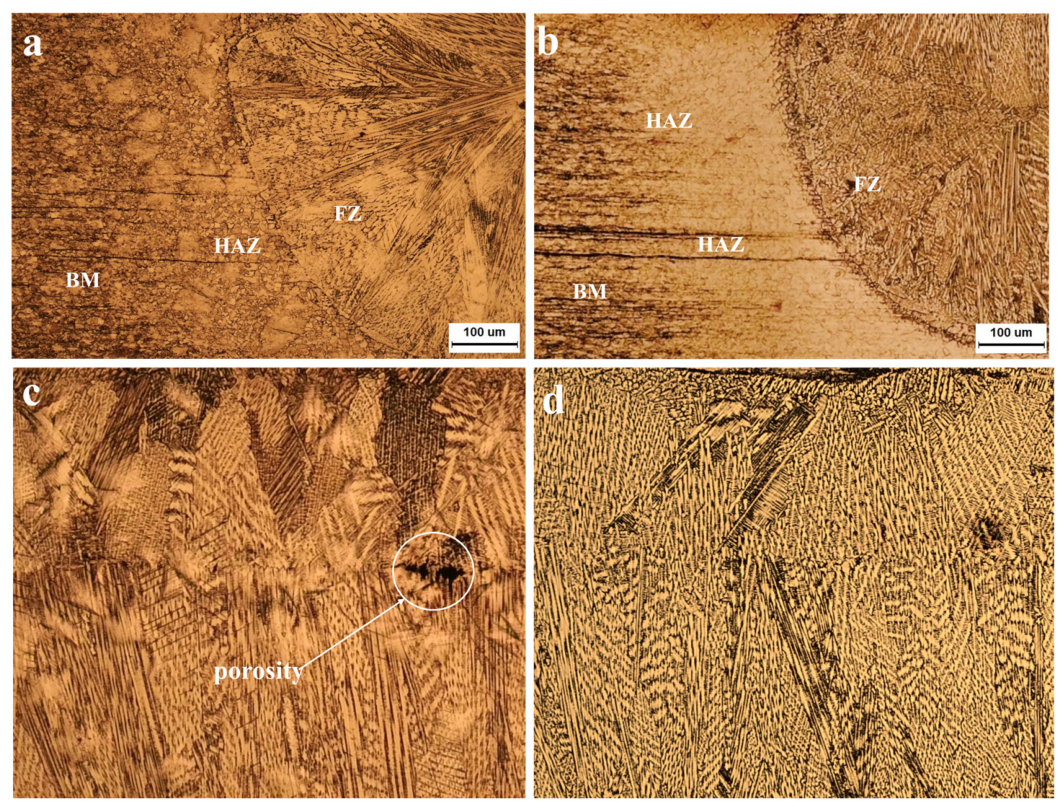
Figure 11 compares the optical microstructures of conventional RSW and MA-RSW GMW2/H1000 dissimilar steel joints. For the MA-RSW joint, a magnet working distance of H   =   22 mm was selected for detailed microstructural analysis. The welding parameters were maintained constant at a welding current of 8.5 kA, a welding time of 250 ms, and an electrode force of approximately 3.7 kN. The H   =   22 mm condition was selected because it exhibited the highest simulated magnetic flux density at the geometric weld center among the investigated MA-RSW conditions and also yielded the highest mean peak tensile–shear load.
As shown in Figure 11a,b, differences in microstructural morphology can be observed in the heat-affected zone (HAZ) on the H1000 side. In the conventional RSW joint (Figure 11a), the austenitic grains adjacent to the fusion line appear relatively coarse and exhibit irregular polygonal morphologies, while the apparent grain size decreases with increasing distance from the fusion line [14]. In comparison, the HAZ of the MA-RSW joint (Figure 11b) exhibits less pronounced grain coarsening and a relatively more uniform microstructural appearance. These optical observations suggest that the thermal history experienced by the HAZ may have differed between the conventional RSW and MA-RSW conditions. However, because the transient temperature field was not directly measured or numerically resolved in the present study, the specific effect of the external magnetic field on the HAZ thermal cycle cannot be quantitatively determined.
More evident morphological differences were observed in the fusion zone (FZ). As shown in Figure 11c, the conventional RSW joint exhibits predominantly coarse and directionally developed dendritic structures, with secondary dendritic features also visible in the optical micrograph. Such directional solidification morphology is generally associated with heat extraction and the thermal gradient established during weld-pool solidification. Because the FZ originates from the mixing and subsequent solidification of the dissimilar GMW2 and H1000 materials, solute redistribution may also occur during solidification. However, compositional segregation was not directly characterized in the present study. In addition, localized cavities or pores can be observed in the indicated region of Figure 11c, consistent with the solidification-related defects observed in the macroscopic cross-sections discussed in Section 3.2.
In comparison, the FZ of the MA-RSW joint at H   =   22 mm exhibits a visibly modified dendritic morphology, as shown in Figure 11d. Dendritic features remain present, but they appear shorter and finer than those observed in the conventional RSW joint, and the strongly directional morphology is less pronounced. Regions with a more equiaxed appearance can also be observed in the optical micrograph. These observations indicate a qualitative refinement and modification of the solidification morphology under the MA-RSW condition. However, the present optical-microscopy observations are insufficient to quantitatively determine grain/dendrite size distributions or the fraction of equiaxed grains. Therefore, no definitive conclusion is drawn regarding a columnar-to-equiaxed transition. Higher-resolution characterization, particularly EBSD combined with statistically replicated measurements from multiple independent welds, would be required to verify these microstructural changes quantitatively.
Previous studies have reported that externally applied magnetic fields can modify weld solidification microstructures, including the development of finer and less directionally developed structures under magnetically assisted welding conditions [14,15]. In the present study, the observed modification of the FZ morphology is qualitatively consistent with such an electromagnetic influence. However, the present magnetostatic model does not directly resolve the transient current-density, Lorentz-force, temperature, or molten-metal velocity fields. Therefore, a direct causal relationship between the simulated magnetic field, molten-metal flow, and the observed dendritic modification cannot be quantitatively established from the present results.
The H   =   22 mm condition simultaneously exhibited the largest mean nugget diameter and the highest mean peak tensile–shear load among the investigated conditions, as discussed in Section 3.2 and Section 3.3. However, the present experiments do not independently separate the effects of nugget geometry, microstructural morphology, and internal defects on the tensile–shear response. Consequently, the improvement in mechanical performance should not be attributed solely to microstructural refinement. The observed microstructural modification is instead considered one possible contributing factor, together with the enlarged nugget geometry and changes in defect morphology.
It should also be emphasized that the present microstructural observations are based on optical microscopy. Although the micrographs indicate a qualitative modification and apparent refinement of the dendritic morphology under magnetic-field assistance, optical microscopy alone cannot quantitatively determine crystallographic orientation, grain-boundary characteristics, phase distribution, or the fraction of equiaxed grains. Electron backscatter diffraction (EBSD) analysis was not performed in the present study. Therefore, the apparent transition toward a finer and less directionally developed solidification structure should be regarded as a qualitative morphological observation rather than quantitative evidence of crystallographic grain refinement or a confirmed columnar-to-equiaxed transition. Further EBSD-based characterization is required to quantify the crystallographic evolution of the FZ.

3.5. Microhardness Distribution of RSW and MA-RSW Joints

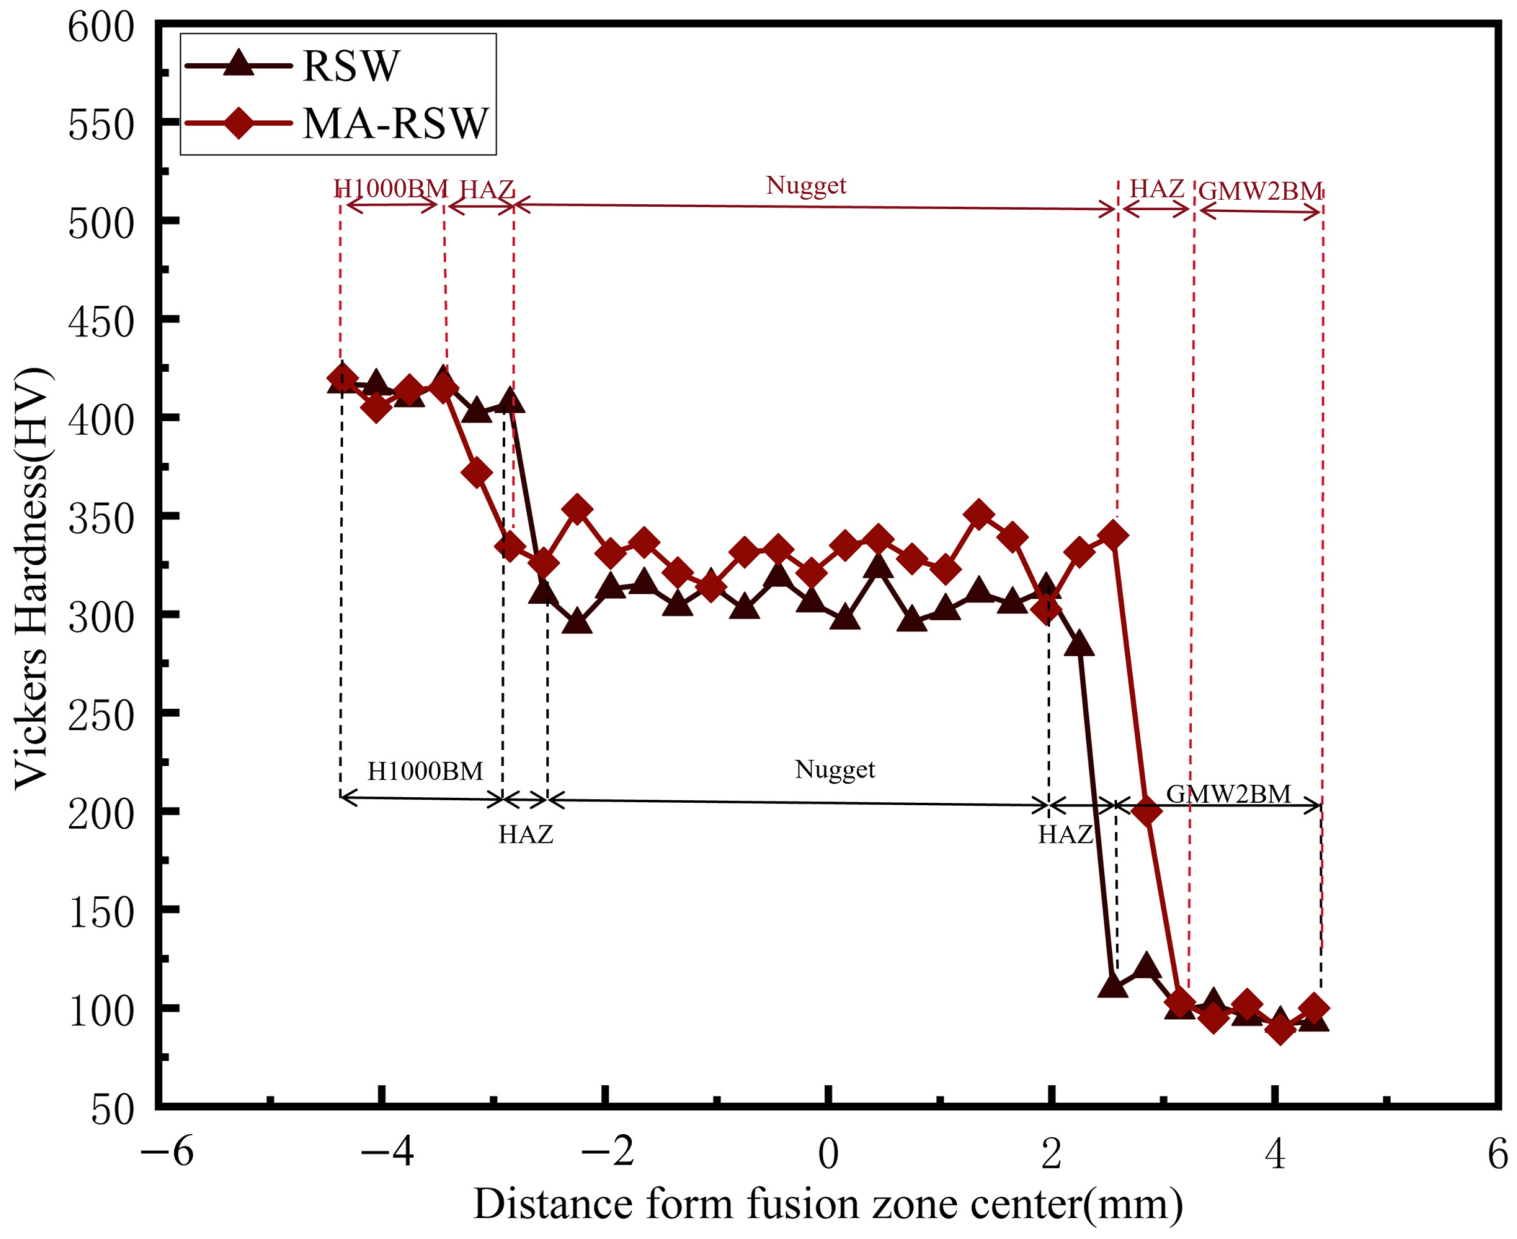
Figure 12 compares the microhardness distributions of conventional RSW and MA-RSW GMW2/H1000 dissimilar steel joints. For the MA-RSW condition, a magnet working distance of H   =   22 mm was selected for detailed comparison because it exhibited the highest mean peak tensile–shear load and the largest mean nugget diameter among the investigated MA-RSW conditions. The welding parameters were maintained constant at a welding current of 8.5 kA, a welding time of 250 ms, and an electrode force of approximately 3.7 kN.
The microhardness profiles were obtained from two representative weld cross-sections selected for comparison: one conventional RSW joint and one MA-RSW joint at H   =   22 mm. One transverse hardness traverse was measured through the central region of each selected weld cross-section, extending from the H1000 base-metal side through the fusion zone (FZ) to the GMW2 base-metal side. Vickers microhardness measurements were performed using a test force of 2.94 N (0.3 kgf, HV0.3), a dwell time of 10 s, and an indentation spacing of 0.3 mm, as described in Section 2.3. Because only one hardness traverse was obtained from each of the two selected welds, the profiles are used for descriptive spatial comparison and do not provide weld-to-weld statistical variability.
A pronounced hardness gradient was observed across both dissimilar joints. The H1000 base metal exhibited a hardness level of approximately 410–420 HV0.3, whereas the GMW2 base metal showed a substantially lower hardness level of approximately 90–110 HV0.3. The FZ exhibited intermediate hardness values between those of the two base materials. Therefore, the overall decrease in hardness from the H1000 side toward the GMW2 side should not be interpreted solely as HAZ softening, because a substantial part of this gradient originates from the intrinsic hardness difference between the two dissimilar base materials.
Within the FZ, the representative conventional RSW profile exhibited noticeable local fluctuations, with hardness values generally ranging from approximately 295 to 325 HV0.3. In comparison, the representative MA-RSW profile at H   =   22 mm showed FZ hardness values mainly in the range of approximately 315–355 HV0.3. Thus, along the representative traverses examined, the MA-RSW profile generally exhibited higher local FZ hardness values than the conventional RSW profile. However, because only one representative hardness traverse was obtained for each welding condition, these observations are descriptive and should not be interpreted as statistically validated differences between independent welds.
The difference in FZ hardness is consistent with the microstructural differences observed in Section 3.4. In particular, the MA-RSW fusion zone exhibited a finer and less strongly directional dendritic morphology than the conventional RSW fusion zone. Such microstructural modification may contribute to the observed difference in local hardness. In addition, the externally applied magnetic field may modify heat and mass transport in the molten pool and thereby influence the local solidification conditions. However, hardness in a dissimilar-steel fusion zone can be affected by multiple factors, including local chemical composition, phase constitution, and characteristic microstructural length scales. Because quantitative compositional mapping and phase characterization were not performed, the individual contributions of elemental redistribution, phase transformation, and microstructural morphology to the measured hardness cannot be quantitatively separated.
The observed differences in hardness distribution may also be associated with changes in the local thermal and solidification conditions under magnetic-field assistance. However, the present study did not directly measure the transient thermal cycle, cooling rate, local composition, phase distribution, Lorentz-force field, or molten-metal velocity field. Therefore, the relationship between the externally applied magnetic field and the observed changes in microhardness should be regarded as a plausible physical interpretation rather than a quantitatively verified mechanism. Furthermore, because only one representative hardness traverse was obtained from each of the two selected welds, the reported hardness levels, minimum values, and transition widths should be regarded as descriptors of the measured sections rather than statistically validated weld-to-weld averages.

3.6. Perspectives on Process Robustness and Industrial Application

The present results demonstrate the potential of magnetic-field assistance for modifying the nugget morphology and mechanical response of GMW2/H1000 dissimilar steel spot-welded joints. However, the experiments were conducted at a fixed welding current of 8.5 kA and a welding time of 250 ms. Therefore, the present results do not establish whether MA-RSW can widen the acceptable welding-process window. Further work should systematically evaluate the effects of welding current, welding time, electrode force, electrode condition, and magnet positioning to determine the process robustness and reproducibility of MA-RSW under a wider range of operating conditions.
It should also be noted that the present experiments employed controlled mechanical grinding and acetone cleaning before welding. Although this procedure was used to improve the consistency of the initial surface condition among laboratory specimens, it does not fully represent the range of surface states encountered in industrial production. Variations in surface roughness, oxide condition, lubrication, contamination, and metallic coatings may alter the electrical contact condition and subsequently affect weld formation. Therefore, the influence of industrially representative surface conditions on MA-RSW should be evaluated in future work.
For industrial implementation, the positional and thermal stability of the permanent-magnet assembly should also be considered. Variations in magnet position may alter the spatial distribution of the applied magnetic field, while repeated welding cycles may increase the temperature of the magnets and surrounding fixtures and consequently affect magnetic-field stability. These effects were not evaluated in the present study. Future work should therefore quantify magnet-position tolerances, evaluate magnetic and thermal stability during repeated welding cycles, and establish MA-RSW weldability lobes. Together with the coupled electromagnetic–thermal–fluid modeling proposed in Section 3.1, these investigations will help determine whether the effects observed under the present laboratory conditions can be reproduced reliably in industrial resistance spot welding applications.

4. Conclusions

The present study investigated magnetic-field-assisted resistance spot welding of GMW2/H1000 dissimilar steel joints by combining three-dimensional magnetostatic simulation with experimental characterization. Decreasing the magnet working distance from 34 to 22 mm markedly increased the externally applied magnetic flux density at the geometric weld center from 23.88 to 82.39 mT and was accompanied by a progressive increase in mean nugget diameter from 5.14   ±   0.14 mm for conventional RSW to 5.67   ±   0.14 mm at H   =   22 mm. The corresponding mean peak tensile–shear load increased from 5738.6   ±   177.5 N to 6604.1   ±   211.1 N, representing an improvement of 15.1%. A first-order comparison based on an equivalent circular fusion area showed an increase of approximately 21.7% for the H   =   22 mm condition, indicating that nugget enlargement is an important geometrical contributor to the increased load-bearing capacity. All tested joints exhibited pull-out failure. Optical microscopy further showed a finer and less strongly directional dendritic morphology in the MA-RSW fusion zone, while the representative hardness profile indicated a higher fusion-zone hardness level and a less pronounced hardness reduction on the H1000 side. However, because nugget geometry, microstructural morphology, and defect characteristics changed simultaneously, their individual contributions to the mechanical response cannot be quantitatively separated. In addition, the present model resolves only the externally applied magnetostatic field and does not directly calculate transient current density, self-induced magnetic field, Lorentz force, temperature, or molten-metal flow. Therefore, the observed changes are interpreted as being consistent with an additional electromagnetic influence rather than as direct quantitative evidence of a resolved electromagnetic stirring mechanism.

Author Contributions

Conceptualization, D.X. and K.Z.; methodology, Q.F. and K.Z.; validation, D.X., J.L. and H.L.; formal analysis, D.X.; investigation, Q.F. and K.Z.; writing—original draft preparation, D.X. and K.Z.; writing—review and editing, Q.F., D.X., H.L., J.L. and M.L.; supervision, Q.F. and M.L.; project administration, Q.F.; funding acquisition, Q.F. All authors have read and agreed to the published version of the manuscript.

Funding

This research was funded by the National Natural Science Foundation of China (Grant No. 52175343).

Data Availability Statement

The original contributions presented in the study are included in the article. Further inquiries can be directed to the corresponding author.

Conflicts of Interest

Author Haiyang Lei was employed by the company Shanghai FusionSmart Industry Equipment Co., Ltd. The remaining authors declare that the research was conducted in the absence of any commercial or financial relationships that could be construed as a potential conflict of interest.

References

  1. Joost, W.J. Reducing vehicle weight and improving U.S. energy efficiency using integrated computational materials engineering. JOM 2012, 64, 1032–1038. [Google Scholar] [CrossRef] [Scilit]
  2. Pan, Y.; Xiong, Y.; Wu, L.; Diao, K.; Guo, W. Lightweight design of an automotive battery-pack enclosure via advanced high-strength steels and size optimization. Int. J. Automot. Technol. 2021, 22, 1279–1290. [Google Scholar] [CrossRef] [Scilit]
  3. Feng, Q.B.; Li, Y.B.; Carlson, B.E.; Lai, X.M. Study of resistance spot weldability of a new stainless steel. Sci. Technol. Weld. Join. 2019, 24, 101–111. [Google Scholar] [CrossRef] [Scilit]
  4. Pouranvari, M.; Marashi, S.P.H. Critical review of automotive steels spot welding: Process, structure and properties. Sci. Technol. Weld. Join. 2013, 18, 361–403. [Google Scholar] [CrossRef] [Scilit]
  5. Wang, B.; Qiu, F.; Chen, L.; Zhou, Q.; Dong, B.; Yang, H.; Yang, J.; Feng, Z.; Tyrer, N.J.; Barber, G.C.; et al. Microstructure and shearing strength of stainless steel/low carbon steel joints produced by resistance spot welding. J. Mater. Res. Technol. 2022, 20, 2668–2679. [Google Scholar] [CrossRef] [Scilit]
  6. Mohammed-Nafea, A.A.; Elyasi, M.; Derazkola, H.A. Magnetically assisted resistance spot welding: A comprehensive review. Int. J. Adv. Manuf. Technol. 2025, 137, 4401–4434. [Google Scholar] [CrossRef] [Scilit]
  7. Xu, T.; Shi, Y.; Cui, Y.; Liang, Z. Effects of magnetic fields in arc welding, laser welding, and resistance spot welding: A review. Adv. Eng. Mater. 2023, 25, 2200682. [Google Scholar] [CrossRef] [Scilit]
  8. Shen, Q.; Li, Y.B.; Lin, Z.Q.; Chen, G.L. Effect of external constant magnetic field on weld nugget of resistance spot welded dual-phase steel DP590. IEEE Trans. Magn. 2011, 47, 4116–4119. [Google Scholar] [CrossRef] [Scilit]
  9. Li, Y.B.; Li, Y.T.; Shen, Q.; Lin, Z.Q. Magnetically assisted resistance spot welding of dual-phase steel. Weld. J. 2013, 92, 124–132. [Google Scholar]
  10. Li, Y.; Luo, Z.; Yan, F.; Duan, R.; Yao, Q. Effect of external magnetic field on resistance spot welds of aluminum alloy. Mater. Des. 2014, 56, 1025–1033. [Google Scholar] [CrossRef] [Scilit]
  11. Huang, M.; Zhang, Q.; Qi, L.; Deng, L.; Li, Y. Effect of external magnetic field on resistance spot welding of aluminum alloy AA6061-T6. J. Manuf. Process. 2020, 50, 456–466. [Google Scholar] [CrossRef] [Scilit]
  12. Li, Y.B.; Zhang, Q.X.; Qi, L.; David, S.A. Improving austenitic stainless steel resistance spot weld quality using external magnetic field. Sci. Technol. Weld. Join. 2018, 23, 619–627. [Google Scholar] [CrossRef] [Scilit]
  13. Qi, L.; Li, F.; Chen, R.; Zhang, Q.; Li, Y. Improve resistance spot weld quality of advanced high strength steels using bilateral external magnetic field. J. Manuf. Process. 2020, 52, 270–280. [Google Scholar] [CrossRef] [Scilit]
  14. Feng, Q.; Ma, Y.; Zhang, Q.; David, S.A.; Li, Y. Quality improvement in resistance spot welding of H1000 austenitic stainless steel using an external magnetic field. Sci. Technol. Weld. Join. 2025, 30, 118–128. [Google Scholar] [CrossRef] [Scilit]
  15. Feng, Q.; Li, J.; Xie, D.; Li, Y. Effect of a single-sided magnetic field on microstructure and properties of resistance spot weld nuggets in H1000/DP590 dissimilar steels. Metals 2025, 15, 1259. [Google Scholar] [CrossRef] [Scilit]
  16. Sun, X.; Stephens, E.V.; Khaleel, M.A. Effects of fusion zone size and failure mode on peak load and energy absorption of advanced high strength steel spot welds under lap shear loading conditions. Eng. Fail. Anal. 2008, 15, 356–367. [Google Scholar] [CrossRef] [Scilit]
  17. GB/T 13298-2015; Inspection Methods of Microstructure for Metals. General Administration of Quality Supervision, Inspection and Quarantine of the People’s Republic of China. Standardization Administration of the People’s Republic of China: Beijing, China, 2015.
  18. Dell’Avvocato, G.; Palumbo, D. Thermographic procedure for the assessment of resistance projection welds (RPW): Investigating parameters and mechanical performances. J. Adv. Join. Process. 2024, 9, 100177. [Google Scholar] [CrossRef] [Scilit]
  19. Jagadeesha, T. Experimental studies in weld nugget strength of resistance spot-welded 316L austenitic stainless steel sheet. Int. J. Adv. Manuf. Technol. 2017, 93, 505–513. [Google Scholar] [CrossRef] [Scilit]
Figure 1. Schematic of the magnetic-field-assisted resistance spot welding (MA-RSW) setup.
Metals 16 01027 g001
Figure 2. Dimensions and lap configuration of the spot welding specimen.
Metals 16 01027 g002
Figure 3. Microhardness measurement path. The purple dashed line indicates the Vickers microhardness measurement traverse.
Metals 16 01027 g003
Figure 4. Magnetic-field simulation results: (a) front view of magnetic flux density distribution; (b) top view of magnetic flux density distribution at the faying interface.
Metals 16 01027 g004
Figure 5. Simulated magnetic-field distributions along the weld centerline at different magnet distances ( H ): (a) total magnetic flux density | B | and (b) transverse magnetic flux density B x .
Metals 16 01027 g005
Figure 6. Schematic illustration of the magnetic-field-assisted welding mechanism: (a) MA-RSW configuration showing the electrodes, permanent magnets, weld nugget, and welding-current direction; (b) schematic representation of the proposed electromagnetic forcing in the weld region. The yellow arrows indicate the conduction-current direction, the black arrows indicate the externally applied magnetic-field direction, the green and blue arrows denote the force directions associated with the left and right magnetic fields, respectively, and the red dots represent positive charge.
Metals 16 01027 g006
Figure 7. Representative cross-sectional morphologies of the spot-welded joints under different welding conditions: (a) conventional RSW; (b) MA-RSW, H   =   34 mm; (c) MA-RSW, H   =   28 mm; and (d) MA-RSW, H   =   22 mm. The dimensions indicated in the micrographs correspond to the individual representative sections, whereas the statistical results from three independent welds are summarized in Table 3.
Metals 16 01027 g007
Figure 8. Peak tensile–shear load of GMW2/H1000 dissimilar steel joints under different welding conditions. Data are presented as mean ± standard deviation ( n   =   3 ). Statistical significance was evaluated by one-way ANOVA followed by Tukey’s HSD post hoc test (* p   <   0.05 , ** p   <   0.01 ).
Metals 16 01027 g008
Figure 9. Representative tensile–shear load–displacement curves of GMW2/H1000 dissimilar steel joints under different welding conditions: (a) conventional RSW; (b) MA-RSW, H   =   34 mm; (c) MA-RSW, H   =   28 mm; and (d) MA-RSW, H   =   22 mm.
Metals 16 01027 g009
Figure 10. Representative macroscopic appearance of the pull-out (PO) failure mode observed after tensile–shear testing. The same macroscopic failure mode was observed for all investigated welding conditions.
Metals 16 01027 g010
Figure 11. Comparison of microstructures between RSW and MA-RSW joints: (a) HAZ of the RSW joint; (b) HAZ of the MA-RSW joint; (c) FZ of the RSW joint; (d) FZ of the MA-RSW joint.
Metals 16 01027 g011
Figure 12. Microhardness distributions of RSW and MA-RSW joints. Microhardness profiles across representative RSW and MA-RSW weld cross-sections. The black and red dashed vertical lines indicate the approximate boundaries between the base metal (BM), heat-affected zone (HAZ), and weld nugget regions for the RSW and MA-RSW profiles, respectively.
Metals 16 01027 g012
Table 1. Mechanical properties of GMW2 steel and H1000 steel.
MaterialYS/MPaUTS/MPaEL/%
GMW220034036
H1000>1000>120024
Table 2. Chemical compositions of GMW2 steel and H1000 steel (wt.%).
MaterialCSiMnPSCrNiMoCuAlFe
GMW20.10-0.500.0250.02----0.015Balance
H10000.210.2414.60.020<0.0113.90.340.130.44-Balance
Table 3. Statistical results of nugget geometric descriptors under varying magnetic-field conditions (n = 3).
Welding ConditionMagnetic-Field
Working Distance (H)
Nugget Diameter (mm)Center Thickness (mm)
RSWN/A5.14 ± 0.142.04 ± 0.11
MA-RSW34 mm5.25 ± 0.111.25 ± 0.10
MA-RSW28 mm5.33 ± 0.131.34 ± 0.06
MA-RSW22 mm5.67 ± 0.141.04 ± 0.10
Table 4. Mechanical properties and effective energy absorption of the joints under varying magnetic-field conditions (n = 3).
Welding ConditionMagnetic-Field
Working Distance (H)
Peak Tensile–Shear
Load (N)
Effective Energy
Absorption (J)
RSWN/A5738.6 ± 177.512.4 ± 2.1
MA-RSW34 mm6133.3 ± 135.115.1 ± 2.9
MA-RSW28 mm6210.5 ± 132.014.7 ± 0.6
MA-RSW22 mm6604.1 ± 211.116.6 ± 1.0
Disclaimer/Publisher’s Note: The statements, opinions and data contained in all publications are solely those of the individual author(s) and contributor(s) and not of MDPI and/or the editor(s). MDPI and/or the editor(s) disclaim responsibility for any injury to people or property resulting from any ideas, methods, instructions or products referred to in the content.