Article

Effect of High-Pressure Torsion on the Hydrogen Storage Properties of Ti-V-Cr-Mn Medium-Entropy Alloy


by
Paula C. Cintrón-Núñez
1,
Karina Suárez-Alcántara
2,*,
Ignacio A. Figueroa-Vargas
3,
Juan R. Tena-García
1,
Joaquín E. González-Hernández
4,
Jorge M. Cubero-Sesin
4,
Yoshikazu Todaka
5,
Daniel Bahena-Uribe
1,
Armando Salinas-Rodríguez
6,* and
José G. Cabañas-Moreno
1
1
Departamento de Investigación y Estudios Multidisciplinarios, Centro de Investigación y de Estudios Avanzados del Instituto Politécnico Nacional, Av. Instituto Politécnico Nacional 2508, San Pedro Zacatenco, Deleg. Gustavo A. Madero, Ciudad de México C.P. 07360, Mexico
2
Instituto de Investigaciones en Materiales, Campus Morelia, Universidad Nacional Autónoma de México, Antigua Carretera a Pátzcuaro No. 8701, Col. Ex Hacienda de San José de la Huerta, Morelia C.P. 58190, Mexico
3
Instituto de Investigaciones en Materiales, Universidad Nacional Autónoma de México, Circuito Exterior S/N, Cd. Universitaria, Ciudad de México C.P. 04510, Mexico
4
Centro de Investigación y Extensión en Materiales, Escuela de Ciencia e Ingeniería de los Materiales, Instituto Tecnológico de Costa Rica, Cartago 159-7050, Costa Rica
5
Department of Mechanical Engineering, Toyohashi University of Technology, 1-1 Hibarigaoka, Tempaku, Toyohashi 441-8580, Aichi, Japan
6
Centro de Investigación y de Estudios Avanzados del Instituto Politécnico Nacional, Unidad Saltillo, Av. Industria Metalúrgica 1062, Parque Industrial Saltillo-Ramos Arizpe, Ramos Arizpe C.P. 25900, Mexico
*
Authors to whom correspondence should be addressed.
Metals 2026, 16(7), 807; https://doi.org/10.3390/met16070807
Submission received: 10 June 2026 / Revised: 8 July 2026 / Accepted: 14 July 2026 / Published: 20 July 2026
(This article belongs to the Special Issue Hydrogen Storage Alloys: State of the Art)

Abstract

Hydrogen storage represents a key technological challenge to the widespread use of hydrogen as a fuel and energy carrier. For this purpose, the hydrogen storage properties of medium-entropy and high-entropy alloys are under extensive investigation, including the study of the effects of compositional variations, nanostructuring, and catalyst additions. The present work characterizes the hydrogen storage behavior of a medium-entropy, near equiatomic Ti-V-Cr-Mn alloy, both in the as-cast condition and after nanostructuring by severe plastic deformation. The alloy consists of a matrix of BCC solid solution and a dispersed C14 Laves phase. Processing by high-pressure torsion results in the refinement of the crystallite size of the BCC phase down to about 30 nm. The absorption capacity of the alloy at 45 °C and 2.5 MPa is 1.6 wt%. Regardless of its initial condition, the first hydrogenation of the Ti-V-Cr-Mn alloy at room temperature and 2.5 MPa occurs without any pre-activation treatment. On the other hand, hydrogen is partially released at room temperature, while full dehydrogenation requires a temperature of 300 °C. Severe plastic deformation considerably reduces the susceptibility of the alloy to become deactivated for hydrogen absorption. These results highlight the potential of plastic straining to tailor the hydrogen storage properties of metallic BCC alloys.

1. Introduction

Hydrogen storage represents a major challenge for the widespread implementation of hydrogen as a fuel and an energy carrier in everyday applications [1]. It is well established that a solid-state material for hydrogen storage exhibits many advantages in terms of safety, flexibility, and storage capacity [2,3]. Many candidate materials have been explored in the search for solid-state hydrogen storage, and it is unlikely that a single material will fulfill all the requirements for very diverse applications [1,2].
Among the most studied metal systems for hydrogen storage, Ti-V-Cr-based alloys have attracted considerable attention due to the possibility of hydrogen absorption at ambient temperatures, combined with good hydrogenation kinetics and reasonable gravimetric and volumetric storage capacities [4,5,6]. The ternary Ti-V-Cr system has been extensively investigated, and several additional elements (Zr, Mn, Fe, Ni, etc.) have been introduced to modify the hydrogen storage properties [4,6,7,8,9]. Depending on the composition of the alloy, the microstructure usually comprises one or two major phases, namely, a body-centered cubic (BCC) solid solution and a Laves phase intermetallic. Later, the work has been extended to the development of multicomponent alloys, some of which have been considered for practical applications [10,11,12,13,14,15]. Research on multicomponent or high-entropy alloys (HEAs) has expanded considerably since Sahlberg et al. [16] reported that a TiVZrNbHf HEA absorbed 2.7 wt% hydrogen at 299 °C under a hydrogen pressure of 5.3 MPa. In recent years, even larger hydrogen storage capacities have been reported [3]; nevertheless, additional characteristics of the storage behavior, such as easy activation, fast (de)hydrogenation kinetics, minimum temperatures of (de)hydrogenation, cyclability, etc., must be considered for the optimization of a hydrogen storage medium. From the previous work on Ti-V-Cr alloys, it was found that the hydrogen storage properties can be very sensitive to small changes in composition and microstructure. Another common, undesirable feature of alloys based on the Ti-V-Cr system is their tendency to become “deactivated” by exposure to some common impurity gases such as oxygen (O2), water vapor (H2O) or carbon monoxide (CO) [17,18,19] and consequently the need to apply relatively cumbersome “reactivation” treatments for the material to recover its hydrogen storage capability [10,20,21].
The most common phases found in alloys based on the Ti-V-Cr system are a BCC (Im-3m space group) solid-solution phase and a C14 Laves phase (P6/mmc space group). Both phases are able to absorb hydrogen, although the pressure and temperature conditions for absorption to occur may differ widely from one to the other and, again, strongly depend on their compositions [8,9,22]. The BCC phase is usually observed to readily absorb hydrogen in interstitial sites, up to a point where it becomes distorted (body-centered tetragonal structure, BCT) and/or transforms into a face-centered cubic (FCC) structure [8,9]. In the BCC phase, the structural changes usually start when an H/M ratio (M denoting the atomic metal content) of about one is reached, but the exact hydrogen contents required for a change to a BCT structure or an FCC structure depend sensitively on the alloy composition. The maximum anticipated hydrogen content in the FCC phase is given by an atomic ratio of H/M = 2.0. On the other hand, the C14 Laves phase in this alloy system also accommodates hydrogen in interstitial sites but usually without any accompanying phase change. In this case, the maximum theoretical capacity of the C14 phase is usually taken as H/M = 1.0. It has also been reported that in alloys in which a BCC matrix and a dispersed C14 phase coexist, the Laves phase may enhance the kinetics of hydrogenation of the BCC phase [23,24]. In addition, it has been mentioned in the literature [25,26] that the BCC phase in alloys based on Ti-V-Cr frequently shows compositional microheterogeneities. Differences in the hydrogen storage behavior have been documented when comparing BCC as-cast material versus BCC annealed material, and they have been explained as the result of the homogenization of the composition with thermal processing. These effects, however, have not been fully clarified.
The Ti-V-Mn system has also been extensively investigated [4,27,28,29]. Manganese additions induce the formation of the C14 Laves phase [28] and, in principle, should reduce the maximum hydrogen storage capacity of the alloys with dual BCC + C14 microstructure. However, the C14 Laves phase has also been reported to promote the hydrogenation kinetics of the BCC phase [23,24,29,30], and it has been proposed that an optimum amount of C14 Laves phase in the alloy would bring the best compromise between hydrogen storage capacity, kinetics of hydrogenation, and ease of activation [1,29].
Because of the early interest in the Ti-V-Cr and Ti-V-Mn systems, the hydrogen storage behavior of quaternary Ti-V-Cr-Mn alloys has also received some attention [6,12,13,21,30,31,32,33,34,35,36,37,38,39,40,41,42]. The Ti-V-Cr-Mn alloys that have been investigated were either single BCC solid solutions or a mixture of BCC and C14 Laves phases. The content of the C14 Laves phase varied widely, from a few wt% to nearly 70 wt%. In many cases, the maximum hydrogen storage capacities at low temperatures were reported to be near 4 wt%, particularly in alloys with a lower content of C14 Laves phase. However, full dehydrogenation of the quaternary Ti-V-Cr-Mn alloys usually requires the use of temperatures of at least 400 °C. This is a disadvantage frequently found in Ti-V-Cr-Mn alloys.
In the present work, the hydrogen storage characteristics of a Ti-V-Cr-Mn medium-entropy alloy, of nominally equiatomic composition, have been investigated. The ideal configurational entropy associated with this nominal composition is 1.39R (R, universal gas constant). In principle, the equiatomic proportions were chosen to promote the formation of a BCC solid solution and, consequently, hydrogenation at near ambient temperatures. In addition, as initially discovered by Horita’s group [43], microstructural refinement and plastic deformation can be used to improve the hydrogen storage properties of metals and alloys [11,44,45]. In recent years, the application of severe plastic deformation processing (SPD) has been shown to accelerate the kinetics of (de)hydrogenation [43,44,45,46,47,48,49,50]. In this context, the present study includes the comparison of the (de)hydrogenation characteristics of the as-cast and severely deformed Ti-V-Cr-Mn alloy.

2. Materials and Methods

Cylindrical ingots of the Ti-V-Cr-Mn alloy were prepared by arc-melting (D-72379 Arc Melter, Edmund Bühler GmbH, Bodelshausen, Germany) from metals with nominal purities of at least 99.7 wt%. Each ingot (with a total weight of about 20 g) was melted several times under an argon atmosphere (starting pressure ≤ 1.3 × 10⁻³ Pa). The molten alloy was suction-cast into a cylindrical, water-cooled copper mold of 1 cm internal diameter, so as to obtain cylindrical bars of about 5–6 cm in length. The cooling mechanism is the conductive heat loss through the water-cooled copper mold. The rate of cooling was approximately 400 K/min. Electro-discharge machining was used to cut disks of approximately 1 mm thickness from these cylindrical pieces, some of which were later processed by high-pressure torsion (HPT).
Processing by HPT was performed at Toyohashi University of Technology (TUT, Japan) and Instituto Tecnológico de Costa Rica (YH32-200 XZPRESTEK, SISELEC SA, San José, Costa Rica). Details of the HPT process can be found elsewhere [46,51]. The disk samples (10 mm in diameter and approximately 1 mm thick) were subjected to 10 revolutions under a compressive load of 5 GPa at a rate of 1 rpm at ambient temperature. Although the torsional deformation of a solid disk generates a strain gradient along its radius [52], the degree of plastic deformation imparted in these experiments (10 revolutions) usually leads to microstructures and properties that are reasonably homogeneous [46,51,52,53]. The HPT-processed disks were manipulated in air during subsequent operations.
The hydrogen storage properties of as-cast and HPT-processed samples were determined by measuring the kinetics of (de)hydrogenation in a Sieverts-type instrument (UNAM, Mexico City, Mexico) [54] and in pressure-composition isothermal (PCI) tests at different temperatures. In all experiments, hydrogen gas of 99.99% nominal purity was used. The kinetics of (de)hydrogenation were determined under a hydrogen gas pressure of 2.5 MPa with pieces of manually ground alloy (1 g), a few millimeters in size. The material grinding was performed without a protective atmosphere, such as high-purity Argon, in a globe box. As a rule, each hydrogenation run with a new sample was preceded by a period of 30 min under vacuum (mechanical pump) at room temperature to remove gases adsorbed on the sample. Dehydrogenation in these tests was induced under hydrogen pressures of approximately 8 × 10⁻² MPa in the temperature range from room temperature to 300 °C. The values of hydrogen content are estimated with a precision of 0.1 wt%. As will be explained in detail below, a reactivation treatment was applied when the sample did not absorb hydrogen in subsequent cycles under the above conditions. This reactivation treatment consisted of heating the sample to 300 °C under 2.5 MPa hydrogen pressure and immediately turning off the furnace so that a relatively rapid cooling to room temperature was achieved.
The PCI experiments were performed in a Quantachrome iSorb HP1 equipment (Quantachrome Instruments, Boynton Beach, FL, USA) with about 400 mg of manually ground alloy in each run. The material grinding was performed without a protective atmosphere. Samples were tested after a pre-activation treatment in which the sample was maintained at 350 °C under a vacuum of ~5 × 10⁻⁴ MPa for 3 h, followed by cooling to room temperature in about 45 min. The test temperatures were chosen between 45 and 90 °C, and the hydrogen pressure ranged from 0.001 to 2.5 MPa. A measured change in pressure of 1 × 10⁻⁴ MPa or less, or a maximum time period without change of up to 240 min, were the criteria used in these tests to induce pressure changes in the PCI experiments. Under such conditions, a full (de)hydrogenation cycle usually took between 5 and 7 days to complete.
Samples in the as-cast or HPT-processed conditions were characterized by X-ray diffraction (XRD, Bruker D2 Phaser diffractometer, Karlsruhe, Germany), scanning electron microscopy (SEM), and energy-dispersive X-ray spectrometry (EDS), Phenom XL, Thermo Fisher Scientific, Waltham, MA USA. Some limited STEM-EDS characterization was also performed in selected samples (JEOL, ARM 200, Tokyo, Japan). Samples for XRD were prepared by metallographic polishing of one face of the disks or by grinding the material down to particles smaller than 5 μm (the alloy was rather fragile and could be fragmented in a short time). The diffraction patterns were collected with Cu- radiation over the 2θ range of 20–100° and with a step size of 0.02° and an acquisition time of 1 s. XRD data were analyzed with the Maud program (version 2.9) for Rietveld analysis. Some samples were also characterized after being subjected to (de)hydrogenation treatments.

3. Results

3.1. Microstructure of the Ti-V-Cr-Mn Alloy

The XRD patterns in Figure 1 show that the as-cast and HPT-processed samples of the Ti-V-Cr-Mn alloy contained a mixture of two phases, a BCC phase and, in a lesser proportion, C14 Laves phase. The proportion of C14 Laves phase is similar to other composites, where a proportion between 10 and 20 vol% is frequently observed [23,55]. The microstructural refinement expected from the application of severe plastic deformation to the Ti-V-Cr-Mn alloy is indicated by the broadening of the BCC reflections in the XRD pattern from HPT-processed samples (Figure 1, pattern (b)). It is noted that the relative intensities of the diffraction peaks in Figure 1, patterns (a) and (b), indicate the existence of some degree of preferred crystallographic orientation, particularly in the as-cast sample. These experiments were performed on the plane of disk-shaped specimens cut perpendicularly to the length of the cylindrical ingots, which explains the occurrence of some degree of crystallographic texturing.
Rietveld analysis was performed, and the plots are presented in the Supplementary File, Figure S1. The calculated values for the crystalline phase content, lattice parameters, and crystallite sizes derived from these analyses are presented in Table 1. The slight variations in the measured lattice parameters of both phases, as-cast versus HPT, can be explained by the occurrence of microsegregation during the solidification process. On the other hand, the reduction in crystallite size in both phases is expected due to intense plastic deformation during the HPT process, but it has a bigger effect in the C14 Laves phase.
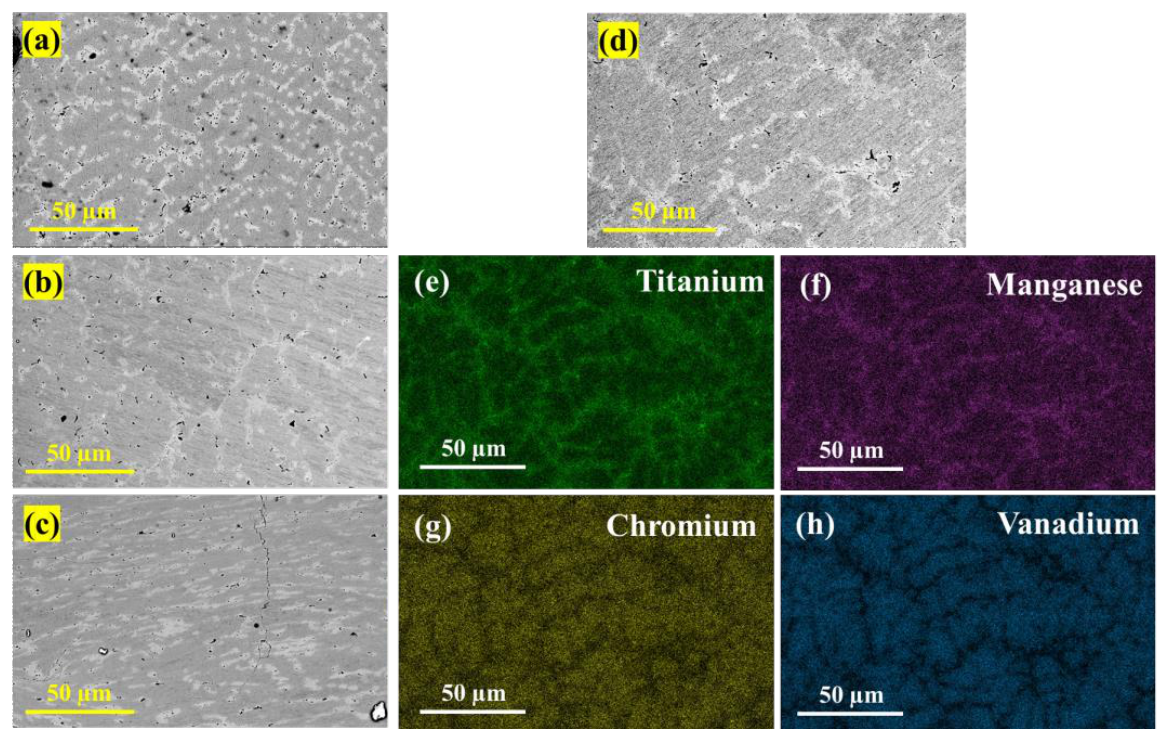
The microstructure of as-cast and HPT-processed samples is displayed in Figure 2a–c. The microstructure consists of a matrix of BCC grains (dark gray) and a fine, dispersed C14 Laves phase (light gray). This refined structure comes as a result of the relatively fast solidification rate attained during suction-casting in water-cooled copper molds. Additionally, some pores appear as black spots, small regions usually located within the C14 Laves phase. Their size seems to have been reduced even further during HPT processing. From these micrographs, the volume fractions of the C14 Laves phase were determined to be about 32 and 34 vol% (Table 2). The C14 Laves volume fraction from the micrographs is higher than the values obtained by Rietveld analysis. The discrepancy can be explained by the fact that X-ray diffraction only considers crystalline materials. The preferred alignment of this phase, observed most prominently in Figure 2c, is due to its reorientation within the BCC matrix during HPT processing.
The average composition of the alloy, as determined by EDS area analysis, is reported in Table 2. This composition is within ± 2.4 at% of the intended equiatomic ratios. The X-ray maps shown in Figure 2d illustrate the relative distribution of the different elements in the BCC and C14 Laves phases. The BCC phase is poorer in Ti and Mn compared to the C14 Laves phase, which is richer in Cr and V. The compositions of the BCC phase and the Laves phase, as determined by spot EDS analysis, are also reported in Table 2. Titanium and vanadium in the BCC phase are the elements showing the largest departure from the average composition, although the difference is within ±5 at%. On the other hand, the composition of the C14 Laves phase is close to the formula Ti(V,Cr)Mn. Since Mn and Cr form C14 Laves phases of the formulas TiMn2 and TiCr2, the composition of this phase in the Ti-V-Cr-Mn alloy suggests that most of the V content is substituting for Mn and Cr in the sites that these elements occupy in the C14 Laves structure.
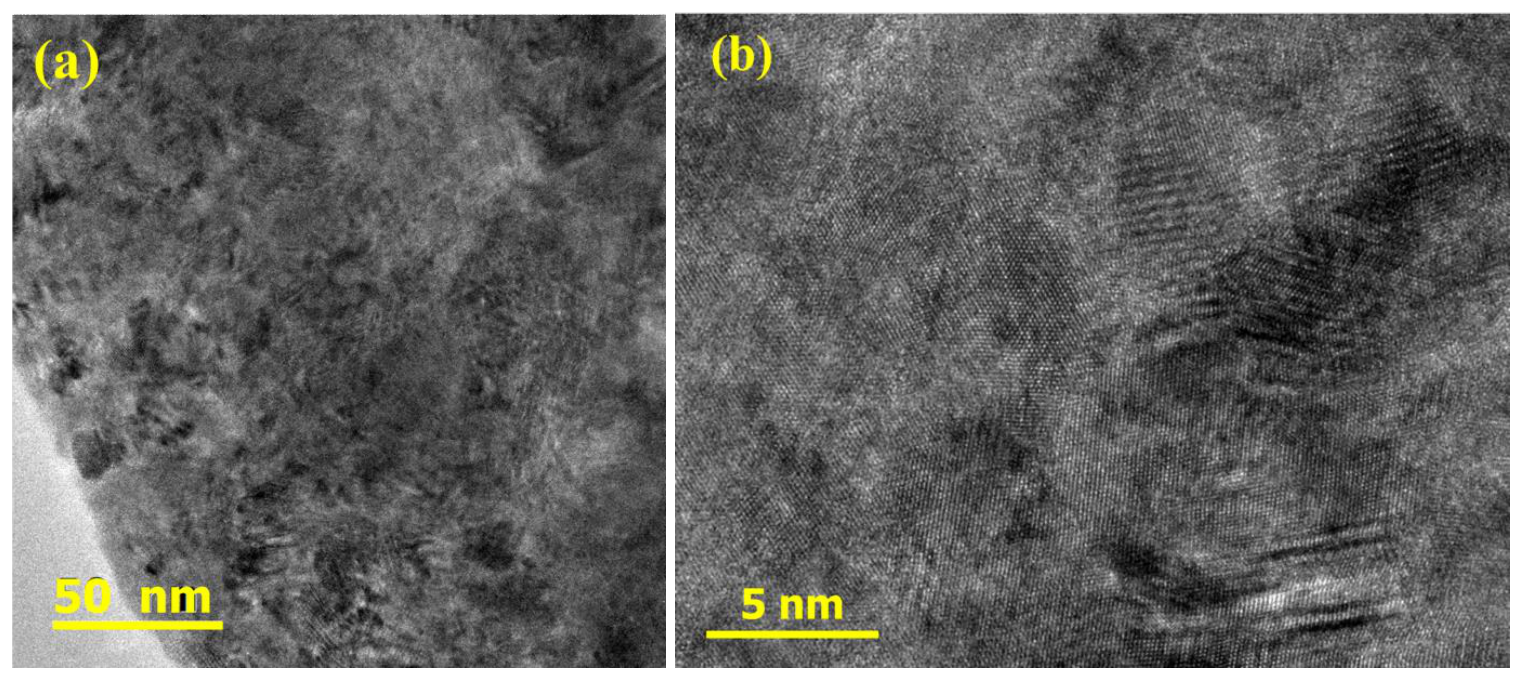
STEM images of an HPT-processed sample are shown in Figure 3a,b. The grain size of the BCC matrix observed in the sample after HPT processing is about 30 nm. The microstructure after deformation is rather complex and distorted, with diffuse, wavy grain boundaries. For hydrogen storage purposes, the existence of grain boundaries helps the hydrogen uptake.

3.2. Pressure-Composition (PCI) Equilibrium Tests

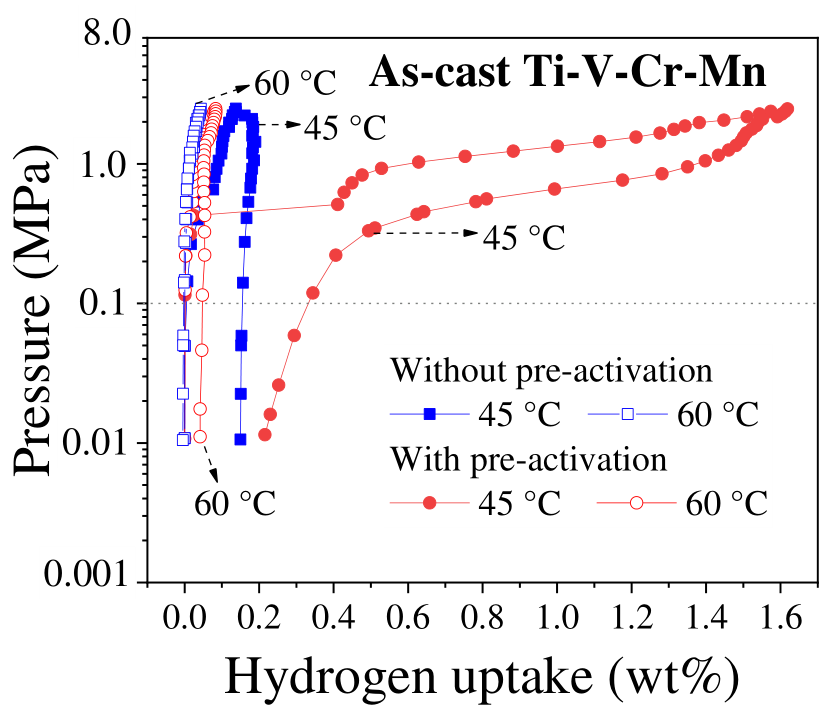
Hydrogen absorption at 45 °C and 60 °C in as-cast samples was extremely low, as shown in Figure 4, in which both absorption and desorption curves are included. By application of a pre-activation treatment (350 °C under vacuum for 3 h), hydrogen absorption at 45 °C increased to 1.6 wt% under 2.5 MPa hydrogen pressure. However, the hydrogen storage did not demonstrate the same improvement at 60 °C. Hydrogen desorption at 45 °C of the pre-activated sample reached 1.2 wt% hydrogen on decreasing the pressure to 0.1 MPa; that is, 75% hydrogen was recovered at atmospheric pressure. Further desorption (0.2 wt% hydrogen) was observed by decreasing the pressure to 0.01 MPa. The temperature of 45 °C is the lowest temperature it is possible to use in our PCI testing equipment.
The PCI data at 45 °C of the pre-activated sample display pseudo-plateau regions from 1.0 to 2.5 MPa for absorption and from 0.4 to 1.3 MPa for desorption. The shape of this PCI curve at the highest pressures shown in Figure 4 suggests that the storage capacity could increase at higher pressures. However, 2.5 MPa is a reasonably high pressure limit for safety reasons. For easier visualization, all the pertinent quantities of the PCI curves of Figure 4 are summarized in Table S1, Supplementary Data. The most important observations of this set of experiments are: (i) that the as-cast Ti-V-Cr-Mn alloy has the potential of absorbing and desorbing hydrogen at near room temperature, and (ii) that the alloy requires a pre-activation treatment for absorption to occur.
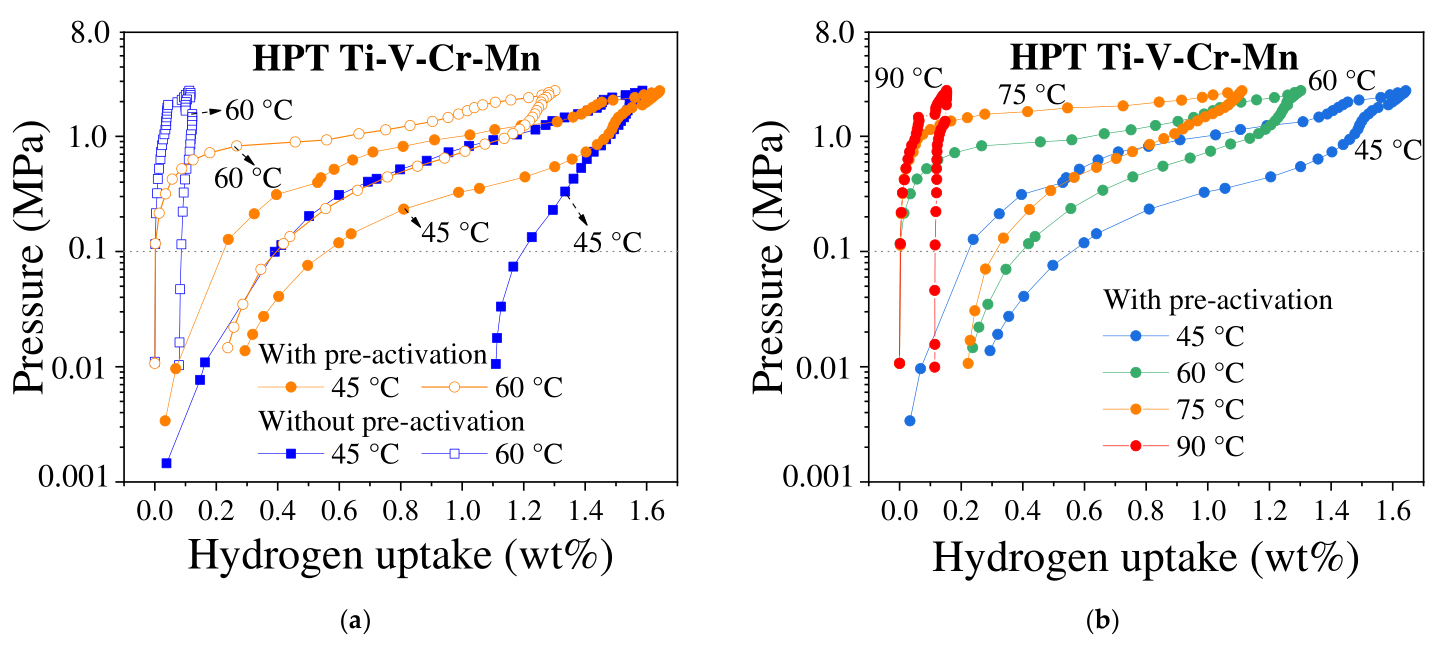
The PCI curves in Figure 5a correspond to HPT-processed samples. In contrast to the behavior of as-cast samples without pre-activation (Figure 4), the HPT-processed samples were able to absorb hydrogen at 45 °C without the pre-activation treatment, reaching a hydrogen content of 1.60 wt% under 2.5 MPa hydrogen pressure. A similar hydrogen content was reached by the absorption process at 45 °C of pre-activated HPT-processed samples, as shown in the same figure. However, the desorption process was significantly more efficient in the pre-activated samples, as the total amount of hydrogen released at 0.1 MPa was 1.08 wt%, as compared to 0.41 wt% in the non-activated sample (Figure 5a). An even more notable difference with the as-cast material is displayed by the PCI curves at 60 and 75 °C of the same initially pre-activated sample, shown separately in Figure 5b. In these conditions, the HPT-processed sample was able to absorb significant amounts of hydrogen, i.e., 1.30 wt% at 60 °C, and 1.11 wt% at 75 °C, compared to the inactivity of the as-cast samples at the same temperatures, Figure 4. It should be noticed that both as-cast and HPT-processed samples were completely dehydrogenated between each of the PCI cycles at different temperatures by applying the equivalent of a pre-activation treatment (heating under vacuum). Finally, when the temperature was raised to 90 °C, the PCI curve shown in Figure 5b displays a maximum hydrogen content of only 0.15 wt% at the hydrogen pressure of 2.5 MPa. This behavior is expected from the variation observed with increasing temperature of the PCI curves in Figure 5, since at the pressure of 2.5 MPa the PCI curve at 90 °C is probably just starting to flatten out. For a material without kinetic constraints, or with sufficient time to react, thermodynamics dominates the process [56]. Because the hydriding reaction is exothermic, at low pressure, the hydrogen easily enters the metal host. At higher temperatures, the equilibrium rises, but the equilibrium plateau is shortened, as indicated in the seminal work by A. Zuttel [56]. For our material, each PCT curve data collection lasted about a week. Still, Figure 5 indicates kinetic constraints. This will not be solved by increasing reaction times, because it is impractical, but by using a suitable catalyst. This is a matter for further research. Still, it is important to emphasize that the Ti-V-Cr-Mn alloy in the HPT-processed condition can absorb and desorb hydrogen at near room temperature, even without any pre-activation treatment. Processing by HPT had a similar effect to that of pre-activation, and it also made the alloy more responsive to subsequent reactivation treatments, allowing hydrogen absorption and desorption at higher temperatures.

3.3. Hydrogenation and Dehydrogenation Kinetics

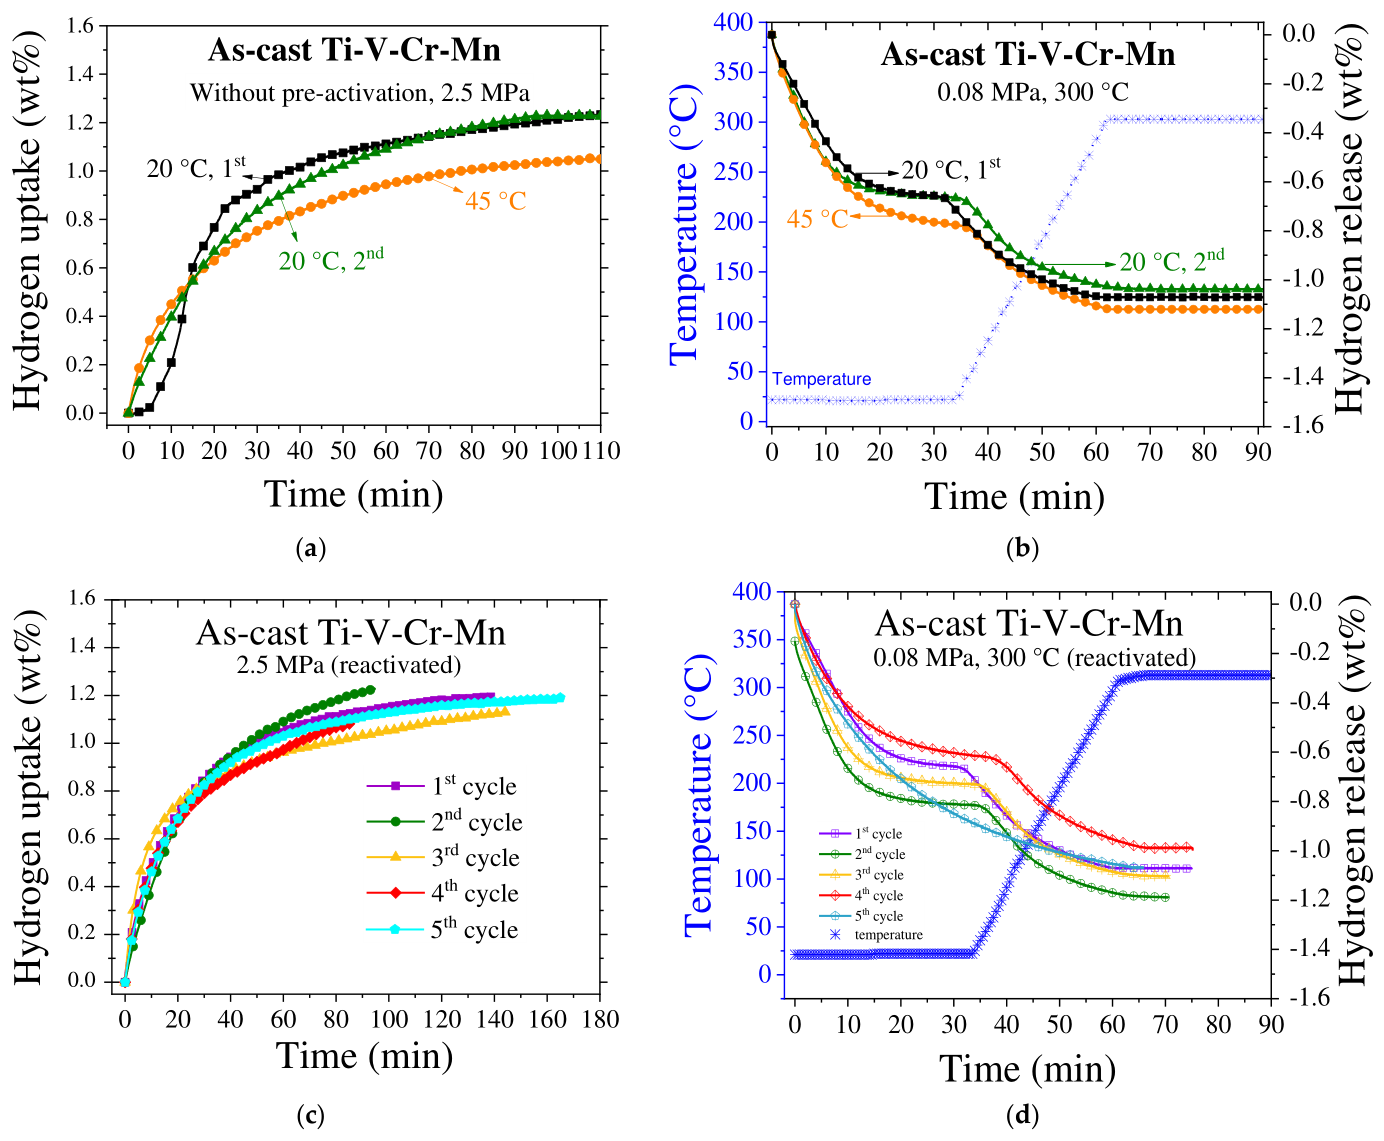
As-cast and HPT-processed samples were first tested without any pre-activation treatment, except for degassing for 30 min at room temperature under a dynamic vacuum (mechanical pump). The initial hydrogenation stage at 20 °C of an as-cast sample, under a hydrogen pressure of 2.5 MPa, produced the results shown in Figure 6a. The as-cast alloy began absorbing hydrogen after 5 min at room temperature at a rate of approximately 0.06 wt% hydrogen per minute and continued for 15 min, followed by a slower rate of absorption for an additional 90 min; at this time, hydrogenation had practically stopped. The total hydrogen content at this point was 1.23 wt%. When the hydrogen pressure was reduced to 0.08 MPa, the hydrogenated sample immediately initiated the release of hydrogen (Figure 6b) at a rate of about 0.03 wt% per minute, lasting for about 20 min, with a total hydrogen release of 0.65 wt%. After an additional 15 min at room temperature without further change, the temperature was increased at a rate of 10 °C/min until it reached 300 °C and kept at this value for 30 min. The sample restarted the release of hydrogen almost immediately as the temperature increased from room temperature and continued during the whole heating period, with an additional hydrogen release of 0.43 wt%. No further dehydrogenation was recorded during the 30 min hold period at 300 °C. In total, the amount of hydrogen released was 1.08 wt%. There is a difference of 0.15 wt% between the amount of hydrogen absorbed and desorbed in this first cycle, but its magnitude should be close to the experimental precision, especially due to the difficulty in accurately measuring the amount of hydrogen released at the beginning of dehydrogenation at room temperature when the pressure is changing from 2.5 to 0.08 MPa. Table S2 (Supplementary Data) summarizes the most relevant aspects of the kinetic experiments.
After the first (de)hydrogenation cycle at 20 °C of the as-cast Ti-V-Cr-Mn sample (Figure 6a), attempts were made to repeat the hydrogen uptake under the same conditions, but the same sample did not absorb any significant amount of hydrogen. Therefore, based on the experience in the determination of the PCI curves, the sample was “reactivated” by heating to 300 °C under a hydrogen atmosphere (2.5 MPa) and then cooling down to room temperature.
The data marked as “45 °C” in Figure 6a were obtained from the same sample tested at 20 °C. The observed hydrogenation behavior was similar to the one displayed by the data marked “20 °C, 2nd” from the same sample, although with a final hydrogen content of 1.04 wt%, which is lower than the content recorded for the cycles at 20 °C (1.23 wt%) and also lower than the maximum content of 1.62 wt% at 45 °C and 2.5 MPa measured in the PCI tests (Figure 4). In turn, the corresponding dehydrogenation process shown in Figure 6b is similar to those occurring at 20 °C. Therefore, there is little difference in the kinetic behavior at 20 °C and 45 °C, except that the storage capacity decreases at the higher temperature, as also observed in the PCI results of Figure 4 and Figure 5.
As shown by the data marked as “Reactivated, 20 °C, 2nd cycle” in Figure 6a, after reactivation, the hydrogenation process started right away at room temperature and followed with a continuously decreasing rate, until the amount of absorbed hydrogen reached about 1.22 wt% after 90 min, which is the same amount absorbed during the first hydrogenation cycle. Similarly, the dehydrogenation process in this 2nd cycle matches quite well with the one recorded in the 1st cycle, as depicted in Figure 6b. This behavior during the 2nd (de)hydrogenation cycle was reproduced in another sample of the same batch that was subjected to five cycles (Figure 6c,d), under the same conditions, including the need for an intermediate reactivation of the sample before each hydrogenation could take place again.
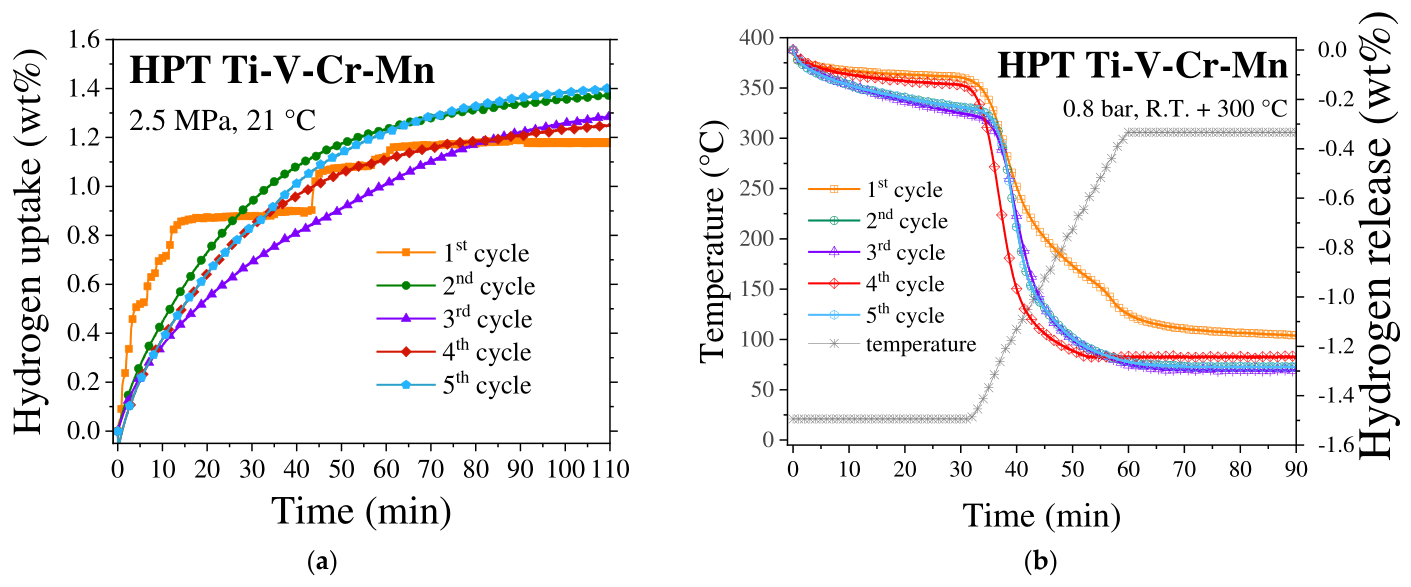
The (de)hydrogenation kinetics of HPT-processed samples are exemplified by the results shown in Figure 7a,b. In this case, five (de)hydrogenation cycles are presented, all of them performed sequentially under the same conditions, and starting without pre-activation treatment. The first hydrogenation curve showed a difficult reaction; it was performed in several small stages. Thus, in Figure 7a, the five hydrogenation curves obtained at 21 °C share a similar behavior, that is, immediate hydrogen absorption, continuously decreasing absorption rate, and a final hydrogen content in the range of 1.18 to 1.40 wt% after 110 min of exposure to the hydrogen pressure of 2.5 MPa. The main difference observed among these five absorption curves resides in the decreasing rate of absorption with increasing cycle number in the initial part of the curves.
The corresponding dehydrogenation curves in Figure 7b also share similar features, in that an immediate release of hydrogen occurs at room temperature (under partial vacuum), reaching an amount between 0.1 wt% and 0.26 wt%, followed by a second stage of fast hydrogen release when the temperature reaches about 80 °C, and then minimal desorption occurs after the temperature reaches 300 °C. In all the cycles shown in Figure 7b, the total recorded amount of hydrogen released was slightly lower than the maximum content observed in the corresponding hydrogenation step, but the same consideration applies to the accuracy of these measurements as explained before. The results of all the kinetic experiments are summarized in Table S2, Supplementary Data. A key difference between as-cast and HPT-processed samples in the process of (de)hydrogenation is that the latter did not require, after desorption, a reactivation process under a hydrogen atmosphere before they could absorb hydrogen again.
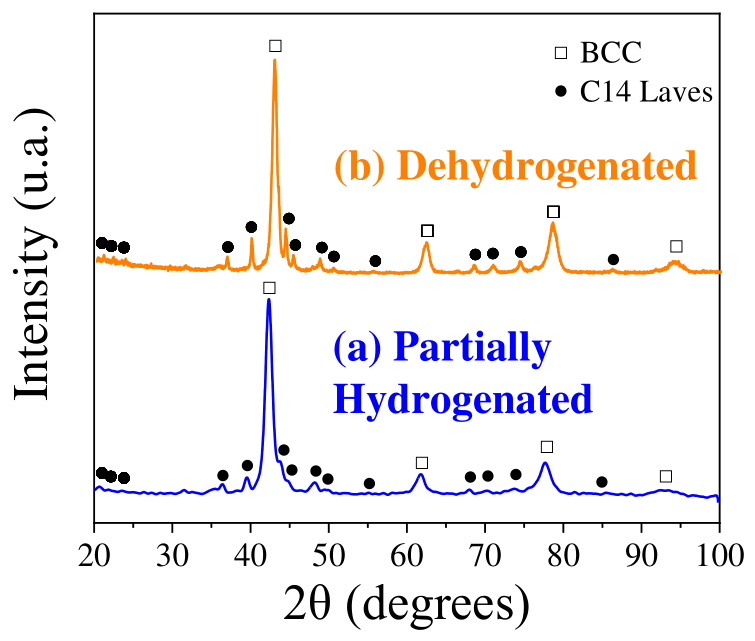
The samples in a partially hydrogenated and fully dehydrogenated state were characterized by XRD, and the results are shown in Figure 8a,b. Characterization of a fully hydrogenated state presents technical problems due to rapid dehydriding upon hydrogen pressure reduction after experiments and due to local heating under the X-ray beam. Materials with moderate-to-high equilibrium pressure at room temperature and which are kinetically activated exhibit easy dehydriding; thus, any characterization at this stage carries a high degree of uncertainty regarding the actual hydrogen content. Additionally, in Figure 8, only results for HPT samples are shown since no significant differences were observed in the as-cast processed samples. The XRD of partially hydrided material was collected after a first hydriding test, while the fully dehydrided material was collected after the cycling test. In both XRD patterns in Figure 8, the only identifiable phases are the original phases, i.e., the BCC and the C14 Laves phase. This indicates that the hydrogen is present mainly in interstitial sites of the crystal structures and trapped in the crystal boundaries and defects rather than forming stoichiometric hydrides. This can be the result of the relatively low pressure used in the hydriding experiments and can explain the lower-than-expected hydrogen uptake.
The lattice parameters for partially hydrided and fully dehydrided materials are collected in Table 3. As expected, it was not possible to prevent partial dehydrogenation; still, a small shift to lower diffraction angles is observed, mainly in the BCC peaks. This indicates a small increase in cell parameters as observed in Table 3 versus Table 1. Meanwhile, a small decrease in crystallite size is observed, which can be related to a decrepitation after the first entry of hydrogen. However, after the fifth cycle, a notable increase in crystallite size was observed for the HPT-processed material. This can result from the coarsening of crystallites after successive heating and cooling.

3.4. Deactivation of the Ti-V-Cr-Mn Alloy in the PCI and Kinetic Experiments

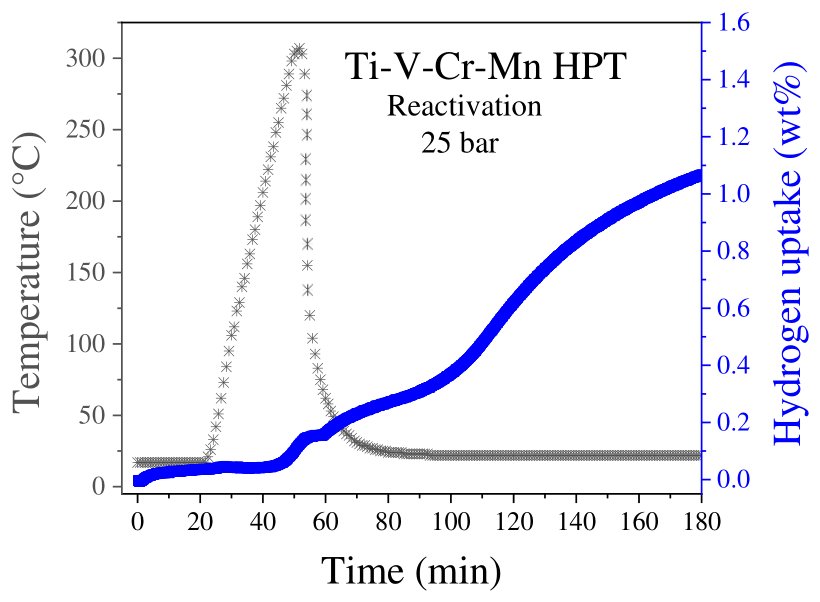
The Ti-V-Cr-Mn samples, either in as-cast or HPT-processed condition, could become deactivated during cycles of (de)hydrogenation. There were noticeable differences in this behavior between the as-cast and the HPT-processed samples, the former being more prone to becoming deactivated. The behavior also depended on the type of test that was performed (PCI vs. kinetic tests). The as-cast samples required a reactivation process to proceed to each subsequent hydrogenation cycle. The HPT-processed samples occasionally required this intermediate reactivation step. The instances in which this happened were associated with the time (typically overnight) that a given sample spent at room temperature under low-pressure hydrogen atmosphere. The hydrogenation data in Figure 9 illustrate the response of an HPT-processed sample, which was previously subjected to five full (de)hydrogenation cycles, with absorption at room temperature and 2.5 MPa. At the end of the 5th dehydrogenation step, the sample was left overnight in the Sieverts equipment under a reduced hydrogen pressure (~0.1 MPa absolute pressure). It can be observed that the initial absorption of the sample was practically negligible at the start of the 5th cycle at room temperature. After 20 min under these conditions, the sample was heated up under the same hydrogen pressure of 2.5 MPa. A small increase in hydrogen content seems to occur when the sample temperature is close to 300 °C, but a marked increase in hydrogenation rate occurs when the furnace is shut off and the temperature has fallen below about 70 °C, as shown in Figure 9. The total hydrogen content when this test was stopped was 1.09 wt%; however, it is obvious from Figure 9 that the sample had not reached saturation at that point. Observations of this type were made in many cases, the effect being more noticeable the longer the sample remained under low H2 pressure after dehydrogenation.
The samples used in the PCI experiments also displayed differences in their deactivation behavior depending on their initial condition. The as-cast samples had a fair response the first time that a pre-activation treatment was applied before the actual PCI run; nevertheless, it was not possible to restore this behavior and perform additional (de)hydrogenation cycles unless they were subjected to a reactivation treatment (300 °C, 2.5 MPa H2 pressure). In contrast, the pre-activated HPT-processed samples did not require this type of reactivation treatment to continue responding favorably in subsequent cycles.

4. Discussion

4.1. Hydrogen Storage Properties

According to the hydrogenation data presented in Figure 4, Figure 5, Figure 6 and Figure 7, the Ti-V-Cr-Mn alloy absorbed hydrogen at room temperature, starting at very low hydrogen pressures, in both as-cast and HPT-processed conditions. The maximum amount of hydrogen absorbed was slightly over 1.6 wt% in the PCI tests at 45 °C (Figure 4 and Figure 5). In this case, however, the as-cast samples required a pre-activation treatment to perform similarly to the HPT-processed samples. At the higher temperatures of 60 °C and 75 °C, only the severely deformed samples performed well in the PCI tests.
In the isothermal tests at room temperature (Figure 6a and Figure 7a), both types of samples could initially absorb hydrogen without the need for a pre-activation treatment, with broadly similar hydrogenation rates and reaching a maximum hydrogen content between 1.2 and 1.4 wt%. Qualitatively similar dehydrogenation behaviors were also observed in the two different conditions (Figure 6b and Figure 7b), except for the fact that the as-cast alloy released a considerably larger fraction of the hydrogen content at room temperature. However, the as-cast alloy required a reactivation treatment after each subsequent (de)hydrogenation cycle.
The HPT-processed Ti-V-Cr-Mn alloy differed from the as-cast material in some important ways. In the kinetic tests (Figure 7), the HPT-processed samples absorbed hydrogen at room temperature in the first run without any pre-activation treatment, and several cycles of (de)hydrogenation could be realized without applying a reactivation treatment. Nevertheless, in each cycle, for a full dehydrogenation, it was necessary to increase the temperature to 300 °C under partial vacuum. In contrast, as indicated above, the as-cast samples could not reabsorb hydrogen without a reactivation treatment.
Assuming that the C14 Laves phase found in the Ti-V-Cr-Mn alloy did not absorb hydrogen under the conditions of our experiments (more to be said about this later on) and considering that the proportion of the BCC phase in the alloy is about 65–80 vol%, the amount of 1.6 wt% hydrogen would be an acceptable saturation content in the BCC phase with interstitially dissolved hydrogen. Contents of absorbed hydrogen higher than approximately 2 wt% in BCC alloys usually bring about a change in crystalline structure [8,41], most commonly to a body-centered tetragonal (BCT) phase and, with still higher contents, to a face-centered cubic (FCC) phase. In any case, the amount of any new hydride phase in our materials would have to be rather small. The XRD data in Figure 8a do not give any evidence for the existence of phases other than the BCC and C14 Laves phases in the hydrogenated alloy; however, as shown in Table 3, the lattice parameter of the BCC phase increased in (partially) hydrogenated samples, as expected from the lattice expansion caused by the interstitially dissolved hydrogen. In the case of the C14 Laves phase in the partially hydrogenated material, the calculated lattice parameters (Table 3) do not differ significantly from the values in as-cast or HPT-processed specimens, which would seem to rule out any significant absorption of hydrogen by this phase. The main role of the C14 Laves phases is as a kinetic improver rather than a hydrogen storage material. Its key benefits have been reported: being crucial for H2 splitting, producing or being part of diffusion channels, and producing synergies with BCC materials [23,55,57].
As mentioned in Section 3.3, HPT processing of the Ti-V-Cr-Mn alloy had the effect of reducing the fraction of hydrogen that could be released at room temperature, from about 61–64% of the total content in as-cast samples to 10–20% of the content in HPT-processed samples. This behavior of the HPT-processed material was reproducible over several cycles (Figure 7) in the kinetic tests. The reasons for the incomplete hydrogen release are multiple and include thermodynamic and kinetic constraints, material degradation, poisoning (gas impurities), or operational conditions. Material degradation can include the formation of stable phases, hydrided or not, irreversible phase transformations, hydrogen trapping sites, and sintering. Meanwhile, poisoning can involve surface interaction or reactions with trace amounts of oxygen, water vapor, or carbon monoxide present in the hydrogen gas. The reactivation process may be related to the removal of these surface impurities under strong heating [58].
Table 4 presents a comprehensive review of the reported quaternary Ti-V-Cr-Mn alloys. The absence of equiatomic alloys can be observed, and that the efforts in compositional studies have been focused on the optimization of V. Some reports stand out, for example: Yu et al. [33,34] tested an alloy with the nominal atomic proportions Ti40V20Cr10Mn30, consisting of a mixture of BCC + C14 Laves phases (not quantified) and with a maximum absorption capacity at 20 °C of 2.5 wt% hydrogen. Pickering et al. [37] worked with a Ti25V20Cr5Mn55 alloy having 65 wt% C14 Laves phase and 30 wt% BCC phase, with a maximum storage capacity of 1.02 wt% hydrogen at 30 °C. Our results with the equiatomic Ti-V-Cr-Mn alloy seem to exhibit properties intermediate between those of the two reported cases. A remarkably reduced number of published materials report a number of cycles higher than one. Wang et al. reported five cycles of Ti9.5-V74.1-Cr14.4-Mn2%wt (Ti0.1V0.74Cr0.14Mn0.02, in atomic fraction) [21]. Wan et al. reported 300 cycles of hydriding and dehydriding cycles at (Ti0.32Cr0.46V0.22)96Mn4 (Ti0.30V0.21Cr0.44Mn0.04, in atomic fraction) [36]. A continuous decrease in hydrogen uptake is reported in these published materials upon cycling [21,36]. No procedures to recover the hydrogen uptake were reported [21,36]. Finally, to compare the present result with previously reported materials, it should be noted that a lower hydriding pressure was used in the present work. This can be one of the main reasons for the lower-than-expected hydrogen uptake.

4.2. Deactivation of the Ti-V-Cr-Mn Alloy

It was mentioned in Section 3.4 that samples subjected to (de)hydrogenation cycles could become deactivated, as absorption of hydrogen at room temperature sharply decreased. It eventually became clear that deactivation occurred when the samples, having been fully dehydrogenated, were left for at least a few hours at room temperature under a low-pressure (~0.08 MPa) hydrogen atmosphere. Figure 9 shows that a sample subjected to a reactivation treatment (heating to 300 °C under 2.5 MPa hydrogen pressure) could restart hydrogen absorption when the temperature had dropped to about 70 °C, and its original storage capacity was reestablished. The longer the time the dehydrogenated sample spent at room temperature under low hydrogen pressure, the more difficult it became to induce its reactivation.
A possible explanation for the deactivation phenomenon is that the sample is left with clean surfaces after dehydrogenation, and these surfaces readily react with impurities in the hydrogen gas supplied to the reactor kept at low hydrogen pressures. Deactivation events have been frequently reported for other metallic hydrogen storage materials [17,18,19,20,68,69,70]. Oxidation and poisoning by gas species have been invoked to explain the deactivation of the hydrogen absorption process in Ti-V-based alloys [17,19,20].
The nominal purity of the hydrogen gas used in our experiments was 99.99% (chromatographic grade), which is usually considered acceptable for the type of experiments carried out in the present work. We observed that keeping the pressure slightly above 1 bar during resting periods had the effect of delaying the occurrence of deactivation, although we could not avoid it in all cases. A more comprehensive investigation of the surface state of samples in different conditions (as-cast, HPT-processed, hydrogenated, dehydrogenated) is necessary before a sound rationale of the deactivation phenomenon can be advanced.

4.3. Microstructural Effects in the Ti-V-Cr-Mn Alloy

We have argued that the experimental evidence indicates that the BCC matrix phase in the Ti-V-Cr-Mn alloy is obviously absorbing hydrogen in our experiments, while absorption by the C14 phase is probably of little consequence. Additional factors that may be relevant to the hydrogen storage characteristics observed in our Ti-V-Cr-Mn alloy are (i) the size of the cubic cell of the BCC phase and (ii) the effect of the interphases between the BCC and C14 Laves phases. First, it has been suggested that there is some minimum value of the lattice parameter of the BCC unit cell to enable hydrogen absorption in amounts close to a hydrogen/metal ratio (H/M) of 2 [8]. The measured lattice parameter of the BCC phase in the as-cast and HPT-processed Ti-V-Cr-Mn alloy takes values of approximately 0.29 nm (Table 1). These values are slightly smaller than the minimum of 0.30–0.31 nm suggested by Zhai et al. [8] and by Cho et al. [71]. Our results would seem to support the requirement of a slightly larger BCC unit cell to achieve a higher hydrogen storage capacity. Some reports indicate that the hydrogen storage capacity is drastically reduced even with a small quantity of C14 Laves phase [22]. Since the compositions of the alloys and Laves phases involved in these studies are quite diverse, it is not possible to generalize their findings.
On the other hand, some studies indicate that the presence of a certain volume fraction of C14 Laves phase may have an accelerating influence on the kinetics of hydrogenation, although with little effect on the storage capacity [10,72,73,74]. Dangwal and Edalati [73,74] argue that the presence of a C14 Laves phase as a dispersed, second phase within a BCC matrix phase provides plentiful interface area, which constitutes a pathway for easy hydrogen transport and activation at room temperature. In this context, although the contribution of the C14 Laves phase to the total hydrogen storage capacity in the Ti-V-Cr-Mn alloy is probably small, its effect on the kinetics of hydrogenation may be significant, considering that even the as-cast alloy, with no pre-activation, could easily absorb hydrogen at room temperature in the kinetic tests.

4.4. Effect of HPT Processing

The effect of severe plastic deformation (SPD) processes on the hydrogen storage characteristics has been documented for different metals and alloys, including magnesium-based alloys and intermetallic alloys [43,44,45,46,47,48,49,50,73,74]. SPD is a well-known tool for microstructural refinement [44,47,50,53,74,75,76,77], and it is well established that ultrafine and nanometric grain sizes can significantly enhance (de)hydrogenation kinetics [43,44,45,46,47,48,49,50,74,75]. Edalati et al. have recently provided a thorough review on the subject [44].
It is usually observed that microstructure refinement reaches a “saturation” stage with increasing applied strain in SPD processes. When this stage sets in, additional deformation does not result in significant changes in the overall grain size of the material, and dynamic restoration processes balance the effect of increasing plastic deformation. At this stage, the SPD-processed material is far from having an equilibrium structure; grain and interphase boundaries are usually in high-energy configurations, and dislocations and point defects are found in high densities [75,76]. In this context, the HPT processing of the Ti-V-Cr-Mn alloy evidently modified its response to the (de)hydrogenation treatments; however, the effect was mainly noticed in the ability of the alloy to maintain or restore its response to hydrogen absorption. In other words, compared to as-cast material, the HPT-processed samples were much more resistant to deactivation, and even when they became deactivated, it was possible to restore their hydrogen absorption properties with a single reactivation treatment under a hydrogen atmosphere, while the as-cast alloy required a more elaborate reactivation procedure. Therefore, the microstructural changes induced by HPT processing had a long-lasting effect on the hydrogenation process of the Ti-V-Cr-Mn alloy. Although the maximum storage capacity of the near equiatomic alloy used in this study is modest, it may be possible to induce some improvements by reducing the volume fraction of C14 Laves phase through changes in the alloy composition or by the addition of another BCC-forming element. In addition to any such changes, the application of severe plastic deformation seems to merit further study.

5. Conclusions

A medium-entropy, near equiatomic Ti-V-Cr-Mn alloy fabricated by arc-melting is composed of a mixture of a BCC matrix phase and a dispersed C14 Laves phase. HPT processing of the Ti-V-Cr-Mn alloy refines the grain size of the BCC matrix down to the nanoscale.
The Ti-V-Cr-Mn alloy can absorb hydrogen at room temperature in both as-cast and HPT-processed conditions. Partial dehydrogenation occurs at room temperature under moderate vacuum, but full dehydrogenation requires increasing the temperature to 300 °C.
A maximum hydrogen absorption capacity of 1.6 wt% was measured at room temperature in PCI tests under 2.5 MPa of hydrogen pressure. In the HPT-processed alloy, the capacity diminished with increasing temperature, becoming almost negligible at 90 °C.
The as-cast alloy became deactivated for hydrogen absorption after a single (de)hydrogenation cycle but could be reactivated by heating to 300 °C in a hydrogen atmosphere. In contrast, the HPT-processed alloy was able to sustain multiple (de)hydrogenation cycles before deactivation occurred.
Given the hydrogen absorption capacity and the volume fraction of the BCC phase in the alloy, this phase is the primary host for hydrogen storage. The C14 Laves phase plays a minor role as hydrogen storage. However, the interface between both phases may provide easy transport of hydrogen, resulting in the fast absorption kinetics observed in as-cast and HPT-processed conditions. The numerous crystalline defects generated by the high plastic deformation induced by HPT processing are probably responsible for the resistance to deactivation exhibited by the HPT-processed alloy; at the same time, they may also constitute sites in which interstitial hydrogen is more strongly bound to the alloy and thus reduce the amount of hydrogen released at room temperature.
Further investigation is needed to reduce the Ti-V-Cr-Mn alloy’s susceptibility to contaminants and improve cyclability. Studies of surface characteristics during hydriding/dehydriding reactions must be conducted using in situ experiments.

Supplementary Materials

The following supporting information can be downloaded at: https://www.mdpi.com/article/10.3390/met16070807/s1, Figure S1. X-ray diffraction patterns from (a) as-cast alloy and (b) HPT-processed alloy and corresponding Rietveld analysis results. Table S1. Summary of the data from the PCI tests in Figure 4 and Figure 5. Table S2. Summary of the data from the kinetic curves of Figure 6 and Figure 7. The values of hydrogen content are estimated with a precision of 0.1 wt%.

Author Contributions

Conceptualization, K.S.-A., J.M.C.-S., A.S.-R. and J.G.C.-M.; methodology, P.C.C.-N., K.S.-A., I.A.F.-V., J.M.C.-S., Y.T. and J.G.C.-M.; software, P.C.C.-N. and J.R.T.-G.; validation, P.C.C.-N., K.S.-A., A.S.-R. and J.G.C.-M.; formal analysis, P.C.C.-N., K.S.-A., J.R.T.-G. and J.G.C.-M.; investigation, P.C.C.-N., K.S.-A., I.A.F.-V., J.R.T.-G., J.E.G.-H. and D.B.-U.; resources, K.S.-A., I.A.F.-V., J.M.C.-S., Y.T., A.S.-R. and J.G.C.-M.; data curation, P.C.C.-N., K.S.-A., J.R.T.-G., J.E.G.-H. and D.B.-U.; writing—original draft preparation, K.S.-A.; writing—review and editing, K.S.-A. and J.G.C.-M.; visualization, P.C.C.-N., K.S.-A. and J.R.T.-G.; supervision, K.S.-A., I.A.F.-V., J.M.C.-S., Y.T., A.S.-R. and J.G.C.-M.; project administration, K.S.-A., Y.T., A.S.-R. and J.G.C.-M.; funding acquisition, K.S.-A., J.M.C.-S., Y.T., A.S.-R. and J.G.C.-M. All authors have read and agreed to the published version of the manuscript.

Funding

This research was funded by CONAHCYT (SECIHTI), project CF-2023-I-394 “Aleaciones de alta entropía con V o Mg para el almacenamiento de hidrógeno” and Centro de Investigación y de Estudios Avanzados del Instituto Politécnico Nacional.

Data Availability Statement

The data presented in this study are available upon request from the corresponding authors due to differences in the policies of different participant institutions.

Acknowledgments

PCCN and JRTG were supported, respectively, by a graduate student fellowship and a postdoctoral fellowship from CONAHCYT, México. PCCN acknowledges a research stay at Toyohashi University of Technology with partial support by the Government of Japan. The authors are grateful to S. Citalán (Cinvestav-Saltillo) for the XRD measurements and F. Márquez and M. Rivas (Cinvestav-Saltillo) for the SEM observations.

Conflicts of Interest

The authors declare no conflicts of interest.

References

  1. Chen, K.; Lau, M.Y.; Luo, X.; Huang, J.; Ouyang, L.; Yang, X.-S. Research Progress in Solid-State Hydrogen Storage Alloys: A Review. J. Mater. Sci. Technol. 2026, 246, 256–289. [Google Scholar] [CrossRef] [Scilit]
  2. Hájková, P.; Horník, J.; Čižmárová, E.; Kalianko, F. Metallic Materials for Hydrogen Storage—A Brief Overview. Coatings 2022, 12, 1813. [Google Scholar] [CrossRef] [Scilit]
  3. Luo, L.; Chen, L.; Li, L.; Liu, S.; Li, Y.; Li, C.; Li, L.; Cui, J.; Li, Y. High-Entropy Alloys for Solid Hydrogen Storage: A Review. Int. J. Hydrogen Energy 2024, 50, 406–430. [Google Scholar] [CrossRef] [Scilit]
  4. Akiba, E.; Iba, H. Hydrogen Absorption by Laves Phase Related BCC Solid Solution. Intermetallics 1998, 6, 461–470. [Google Scholar] [CrossRef] [Scilit]
  5. Kabutomori, T.; Takeda, H.; Wakisaka, Y.; Ohnishi, K. Hydrogen Absorption Properties of TiCrA (A ≡ V, Mo or Other Transition Metal) B.C.C. Solid Solution Alloys. J. Alloys Compd. 1995, 231, 528–532. [Google Scholar] [CrossRef] [Scilit]
  6. Tamura, T.; Tominaga, Y.; Matsumoto, K.; Fuda, T.; Kuriiwa, T.; Kamegawa, A.; Takamura, H.; Okada, M. Protium Absorption Properties of Ti–V–Cr–Mn Alloys with a b.c.c. Structure. J. Alloys Compd. 2002, 330–332, 522–525. [Google Scholar] [CrossRef] [Scilit]
  7. Mazzolai, G.; Coluzzi, B.; Biscarini, A.; Mazzolai, F.M.; Tuissi, A.; Agresti, F.; Lo Russo, S.; Maddalena, A.; Palade, P.; Principi, G. Hydrogen-Storage Capacities and H Diffusion in BCC TiVCr Alloys. J. Alloys Compd. 2008, 466, 133–139. [Google Scholar] [CrossRef] [Scilit]
  8. Zhai, Y.T.; Li, Y.M.; Wei, S.H.; Tolj, I.; Kennedy, J.; Yang, F. Progress in V-BCC Based Solid Solution Hydrogen Storage Alloys. J. Energy Storage 2025, 109, 115103. [Google Scholar] [CrossRef] [Scilit]
  9. Shen, S.; Li, Y.; Ouyang, L.; Zhang, L.; Zhu, M.; Liu, Z. V–Ti-Based Solid Solution Alloys for Solid-State Hydrogen Storage. Nano-Micro Lett. 2025, 17, 175. [Google Scholar] [CrossRef] [Scilit] [PubMed]
  10. Chen, X.Y.; Liu, B.; Zhang, S.B.; Ding, X.; Chen, R.R. Effect of Heat Treatment on Microstructure and Thermal Stability of Ti19Hf4V40Mn35Cr2 Hydrogen Storage Alloy. J. Alloys Compd. 2022, 917, 165355. [Google Scholar] [CrossRef] [Scilit]
  11. Luo, L.; Han, H.; Feng, D.; Lv, W.; Chen, L.; Li, L.; Zhai, T.; Liu, S.; Sun, S.; Li, Y.; et al. Nanocrystalline High Entropy Alloys with Ultrafast Kinetics and High Storage Capacity for Large-Scale Room-Temperature-Applicable Hydrogen Storage. Renewables 2024, 2, 138–149. [Google Scholar] [CrossRef] [Scilit]
  12. Zhu, Y.; Li, X.; Yang, X.-S.; Chen, P.; Tsui, G.C.-P.; Xu, Z.-L.; Tang, R.; Xiao, F.; Chan, K. Compositionally Complex Doping for Low-V Ti-Cr-V Hydrogen Storage Alloys. Chem. Eng. J. 2023, 477, 146970. [Google Scholar] [CrossRef] [Scilit]
  13. Barale, J.; Ares, J.R.; Rizzi, P.; Baricco, M.; Rios, J.F.F. High Pressure Hydrogen Compression Exploiting Ti1.1(Cr,Mn,V)2 and Ti1.1(Cr,Mn,V,Fe)2 Alloys. J. Alloys Compd. 2023, 947, 169497. [Google Scholar] [CrossRef] [Scilit]
  14. Galvis, E.A.R.; Leardini, F.; Bodega, J.; Ares, J.R.; Fernandez, J.F. Realistic Simulation in a Single Stage Hydrogen Compressor Based on AB2 Alloys. Int. J. Hydrogen Energy 2016, 41, 9780–9788. [Google Scholar] [CrossRef] [Scilit]
  15. Yartys, V.A.; Lototskyy, M.; Linkov, V.; Grant, D.; Stuart, A.; Eriksen, J.; Denys, R.; Bowman, R.C. Metal Hydride Hydrogen Compression: Recent Advances and Future Prospects. Appl. Phys. A 2016, 122, 415. [Google Scholar] [CrossRef] [Scilit]
  16. Sahlberg, M.; Karlsson, D.; Zlotea, C.; Jansson, U. Superior Hydrogen Storage in High Entropy Alloys. Sci. Rep. 2016, 6, 36770. [Google Scholar] [CrossRef] [Scilit] [PubMed]
  17. Luo, L.; Wu, C.; Yang, S.; Zhou, J.; Chen, Y.; Yang, F.; Xu, Y.; Liu, P. Decaying Behaviors of V40(TiCr)51Fe8Mn Hydrogen Storage Alloys with Different Particle Sizes. J. Alloys Compd. 2015, 645, S178–S183. [Google Scholar] [CrossRef] [Scilit]
  18. Yu, X. Effect of Surface Oxide Layer on Activation Performance of Hydrogen Storage Alloy TiMn1.25Cr0.25. Int. J. Hydrogen Energy 2004, 29, 81–86. [Google Scholar] [CrossRef] [Scilit]
  19. Ulmer, U.; Oertel, D.; Diemant, T.; Bonatto Minella, C.; Bergfeldt, T.; Dittmeyer, R.; Behm, R.J.; Fichtner, M. Performance Improvement of V–Fe–Cr–Ti Solid State Hydrogen Storage Materials in Impure Hydrogen Gas. ACS Appl. Mater. Interfaces 2018, 10, 1662–1671. [Google Scholar] [CrossRef] [Scilit] [PubMed]
  20. Li, X.; Wu, D.; Zhou, Q.; Tang, R.; Xiao, F.; He, L.; Li, H.-W.; Zhu, Y.; Zhang, P.; Lin, H.-J. Enhanced Cyclic Durability of Low-Cost Ti–V–Cr Hydrogen Storage Alloys by Elemental Alloying. Mater. Chem. Phys. 2024, 317, 129132. [Google Scholar] [CrossRef] [Scilit]
  21. Wang, J.; Jeng, R.; Nieh, J.; Lee, S.; Lee, S.; Bor, H. Comparing the Hydrogen Storage Alloys—TiCrV and Vanadium-Rich TiCrMnV. Int. J. Hydrogen Energy 2007, 32, 3959–3964. [Google Scholar] [CrossRef] [Scilit]
  22. Zhang, X.; Li, B.; Wang, L.; Xiong, W.; Li, J.; Zhou, S.; Xu, J.; Zhao, Y.; He, X.; Yan, H. Hydrogen Storage Properties of AB2 Type Ti–Zr–Cr–Mn–Fe Based Alloys. Int. J. Hydrogen Energy 2024, 51, 193–201. [Google Scholar] [CrossRef] [Scilit]
  23. Liang, J.; Li, G.; Ding, X.; Li, Y.; Wen, Z.; Zhang, T.; Qu, Y. Effect of C14 Laves/BCC on Microstructure and Hydrogen Storage Properties of (Ti32.5V27.5Zr7.5Nb32.5)1-xFex (x = 0.03, 0.06, 0.09) High Entropy Hydrogen Storage Alloys. J. Energy Storage 2023, 73, 108852. [Google Scholar] [CrossRef] [Scilit]
  24. Wu, E.; Li, W.; Li, J. Extraordinary Catalytic Effect of Laves Phase Cr and Mn Alloys on Hydrogen Dissociation and Absorption. Int. J. Hydrogen Energy 2012, 37, 1509–1517. [Google Scholar] [CrossRef] [Scilit]
  25. Ding, X.; Zhang, S.; Chen, R.; Ma, X.; Hu, S.; Zhang, Y.; Guo, J. Enhanced Hydrogen Storage Properties of Ti40-xV45Zr15Crx Alloys by Dual-Phase Nanostructures of Eutectic and Spinodal Decomposition. J. Energy Storage 2023, 73, 109211. [Google Scholar] [CrossRef] [Scilit]
  26. Ghosh, C.; Basu, J.; Ramachandran, D.; Mohandas, E. Phase Separation and ω Transformation in Binary V-Ti and Ternary V-Ti-Cr Alloys. Acta Mater. 2016, 121, 310–324. [Google Scholar] [CrossRef] [Scilit]
  27. Iba, H.; Akiba, E. Hydrogen Absorption and Modulated Structure in Ti–V–Mn Alloys. J. Alloys Compd. 1997, 253–254, 21–24. [Google Scholar] [CrossRef] [Scilit]
  28. Mouri, T.; Iba, H. Hydrogen-Absorbing Alloys with a Large Capacity for a New Energy Carrier. Mater. Sci. Eng. A 2002, 329–331, 346–350. [Google Scholar] [CrossRef] [Scilit]
  29. Matsuda, J.; Nakamura, Y.; Akiba, E. Microstructure of Ti–V–Mn BCC Alloys before and after Hydrogen Absorption–Desorption. J. Alloys Compd. 2011, 509, 4352–4356. [Google Scholar] [CrossRef] [Scilit]
  30. Jeng, R.-R.; Chou, C.-Y.; Lee, S.-L.; Wu, Y.-C.; Bor, H.-Y. Effect of Mn, Ti/Cr Ratio, and Heat Treatment on Hydrogen Storage Properties of Ti–V–Cr–Mn Alloys. J. Chin. Inst. Eng. 2011, 34, 601–608. [Google Scholar] [CrossRef] [Scilit]
  31. Yu, X.; Wu, Z.; Xia, B.; Huang, T.; Chen, J.; Wang, Z.; Xu, N. Hydrogen Storage in Ti–V-Based Body-Centered-Cubic Phase Alloys. J. Mater. Res. 2003, 18, 2533–2536. [Google Scholar] [CrossRef] [Scilit]
  32. Yu, X.B.; Wu, Z.; Xia, B.J.; Xu, N.X. Improvement of Activation Performance of the Quenched Ti–V-Based BCC Phase Alloys. J. Alloys Compd. 2005, 386, 258–260. [Google Scholar] [CrossRef] [Scilit]
  33. Yu, X.B.; Wu, Z.; Xia, B.J.; Xu, N.X. Enhancement of Hydrogen Storage Capacity of Ti–V–Cr–Mn BCC Phase Alloys. J. Alloys Compd. 2004, 372, 272–277. [Google Scholar] [CrossRef]
  34. Yu, X. Effect of Cr Content on Hydrogen Storage Properties for Ti-V-Based BCC-Phase Alloys. Int. J. Hydrogen Energy 2004, 29, 1377–1381. [Google Scholar] [CrossRef] [Scilit]
  35. Young, K.-H.; Ouchi, T.; Huang, B.; Nei, J. Structure, Hydrogen Storage, and Electrochemical Properties of Body-Centered-Cubic Ti40V30Cr15Mn13X2 Alloys (X = B, Si, Mn, Ni, Zr, Nb, Mo, and La). Batteries 2015, 1, 74–90. [Google Scholar] [CrossRef] [Scilit]
  36. Wan, C.; Ju, X.; Qi, Y.; Fan, C.; Wang, S.; Liu, X.; Jiang, L. A Study on Crystal Structure and Chemical State of TiCrVMn Hydrogen Storage Alloys during Hydrogen Absorption-Desorption Cycling. Int. J. Hydrogen Energy 2009, 34, 8944–8950. [Google Scholar] [CrossRef] [Scilit]
  37. Pickering, L.; Reed, D.; Bevan, A.I.; Book, D. Ti–V–Mn Based Metal Hydrides for Hydrogen Compression Applications. J. Alloys Compd. 2015, 645, S400–S403. [Google Scholar] [CrossRef] [Scilit]
  38. Kefi, C.; Huot, J. Microstructure and First Hydrogenation Properties of Ti30V60Mn(10 − x)Crx (x = 0, 3.3, 6.6, 10) + 4 Wt.% Zr. Metals 2023, 13, 1119. [Google Scholar] [CrossRef] [Scilit]
  39. Liao, X.; Yin, Z.; Young, K.; Nei, J. Studies in Molybdenum/Manganese Content in the Dual Body-Centered-Cubic Phases Metal Hydride Alloys. Int. J. Hydrogen Energy 2016, 41, 15277–15286. [Google Scholar] [CrossRef] [Scilit]
  40. Seo, C.-Y.; Zhang, Z.-L.; Kim, J.-H.; Lee, P.S.; Lee, J.-Y. Effect of Manganese Addition on Hydrogen Storage Performance of Vanadium-Based BCC Hydrogen Storage Alloys. Met. Mater. Int. 2002, 8, 341–346. [Google Scholar] [CrossRef] [Scilit]
  41. Seo, C.-Y.; Kim, J.-H.; Lee, P.S.; Lee, J.-Y. Hydrogen Storage Properties of Vanadium-Based b.c.c. Solid Solution Metal Hydrides. J. Alloys Compd. 2003, 348, 252–257. [Google Scholar] [CrossRef] [Scilit]
  42. Yoo, J.-H.; Shim, G.; Park, C.-N.; Kim, W.-B.; Cho, S.-W. Influence of Mn or Mn plus Fe on the Hydrogen Storage Properties of the Ti-Cr-V Alloy. Int. J. Hydrogen Energy 2009, 34, 9116–9121. [Google Scholar] [CrossRef] [Scilit]
  43. Edalati, K.; Matsuo, M.; Emami, H.; Itano, S.; Alhamidi, A.; Staykov, A.; Smith, D.J.; Orimo, S.; Akiba, E.; Horita, Z. Impact of Severe Plastic Deformation on Microstructure and Hydrogen Storage of Titanium-Iron-Manganese Intermetallics. Scr. Mater. 2016, 124, 108–111. [Google Scholar] [CrossRef] [Scilit]
  44. Edalati, K.; Ahmed, A.Q.; Akrami, S.; Ameyama, K.; Aptukov, V.; Asfandiyarov, R.N.; Ashida, M.; Astanin, V.; Bachmaier, A.; Beloshenko, V.; et al. Severe Plastic Deformation for Producing Superfunctional Ultrafine-Grained and Heterostructured Materials: An Interdisciplinary Review. J. Alloys Compd. 2024, 1002, 174667. [Google Scholar] [CrossRef] [Scilit]
  45. Révész, Á.; Gajdics, M. The Effect of Severe Plastic Deformation on the Hydrogen Storage Properties of Metal Hydrides. Mater. Trans. 2023, 64, 1387–1400. [Google Scholar] [CrossRef] [Scilit]
  46. Osorio-García, M.; Suárez-Alcántara, K.; Todaka, Y.; Tejeda-Ochoa, A.; Herrera-Ramírez, M.; Hernández-Silva, O.; Cruz-Gandarilla, F.; Cabañas-Moreno, J.G. Low-Temperature Hydrogenation of Mg-Ni-Nb2O5 Alloy Processed by High-Pressure Torsion. J. Alloys Compd. 2021, 878, 160309. [Google Scholar] [CrossRef] [Scilit]
  47. Edalati, K.; Akiba, E.; Horita, Z. High-Pressure Torsion for New Hydrogen Storage Materials. Sci. Technol. Adv. Mater. 2018, 19, 185–193. [Google Scholar] [CrossRef] [Scilit] [PubMed]
  48. Edalati, K.; Novelli, M.; Itano, S.; Li, H.-W.; Akiba, E.; Horita, Z.; Grosdidier, T. Effect of Gradient-Structure versus Uniform Nanostructure on Hydrogen Storage of Ti-V-Cr Alloys: Investigation Using Ultrasonic SMAT and HPT Processes. J. Alloys Compd. 2018, 737, 337–346. [Google Scholar] [CrossRef] [Scilit]
  49. Edalati, K.; Shao, H.; Emami, H.; Iwaoka, H.; Akiba, E.; Horita, Z. Activation of Titanium-Vanadium Alloy for Hydrogen Storage by Introduction of Nanograins and Edge Dislocations Using High-Pressure Torsion. Int. J. Hydrogen Energy 2016, 41, 8917–8924. [Google Scholar] [CrossRef] [Scilit]
  50. He, L.; Shi, X.; Li, X.; Huang, J.; Cheng, T.; Wang, X.; Li, Y.; Lin, H.; Edalati, K.; Li, H.-W. Severe Plastic Deformation through High-Pressure Torsion for Preparation of Hydrogen Storage Materials—A Review. Mater. Trans. 2023, 64, 1575–1584. [Google Scholar] [CrossRef] [Scilit]
  51. Fibela-Esparza, M.; Salinas-Rodriguez, A.; Méndez-Nonell, J.; Herrera-Ramirez, J.M.; Todaka, Y.; Cabañas-Moreno, J.G. Mg-Ni-Nb2O5 Composite Produced by High-Pressure Torsion. Metals 2022, 12, 1684. [Google Scholar] [CrossRef] [Scilit]
  52. Figueiredo, R.B.; Kawasaki, M.; Langdon, T.G. An Evaluation of Homogeneity and Heterogeneity in Metals Processed by High-Pressure Torsion. Acta Phys. Pol. A 2012, 122, 425–429. [Google Scholar] [CrossRef] [Scilit]
  53. Zhilyaev, A.P.; Nurislamova, G.V.; Kim, B.-K.; Baró, M.D.; Szpunar, J.A.; Langdon, T.G. Experimental Parameters Influencing Grain Refinement and Microstructural Evolution during High-Pressure Torsion. Acta Mater. 2003, 51, 753–765. [Google Scholar] [CrossRef] [Scilit]
  54. Carrillo-Bucio, J.L.; Tena-Garcia, J.R.; Armenta-Garcia, E.P.; Hernandez-Silva, O.; Cabañas-Moreno, J.G.; Suárez-Alcántara, K. Low-Cost Sieverts-Type Apparatus for the Study of Hydriding/Dehydriding Reactions. HardwareX 2018, 4, e00036. [Google Scholar] [CrossRef] [Scilit]
  55. Liang, J.; Li, G.; Ding, X.; Li, Y.; Wen, Z.; Zhang, T.; Qu, Y. The Synergistic Effect of Ni and C14 Laves Phase on the Hydrogen Storage Properties of TiVZrNbNi High Entropy Hydrogen Storage Alloy. Intermetallics 2024, 164, 108102. [Google Scholar] [CrossRef] [Scilit]
  56. Schlapbach, L.; Züttel, A. Hydrogen-Storage Materials for Mobile Applications. Nature 2001, 414, 353–358. [Google Scholar] [CrossRef] [Scilit] [PubMed]
  57. Bellon Monsalve, D.; Kefi, C.; Klopcic, N.; Huot, J. Review of Hydrogen Storage Using AB, AB2, HEA, and Solid Solution Metal Hydrides. Int. J. Hydrogen Energy 2026, 229, 154686. [Google Scholar] [CrossRef] [Scilit]
  58. Cameirão, A.R.; Almeida, J.M.P.; Leiva, D.R.; Ishikawa, T.T.; Botta, W.J.; Zepon, G. Activation Methods for Hydrogen Storage Alloys: A Comprehensive Review. J. Energy Storage 2026, 161, 122014. [Google Scholar] [CrossRef] [Scilit]
  59. Tamura, T.; Hatakeyama, M.; Ebinuma, T.; Kamegawa, A.; Takamura, H.; Okada, M. Protium Absorption Properties of Ti-Cr-V-Mn Alloys in Low Pressure Regions. Mater. Trans. 2002, 43, 1120–1123. [Google Scholar] [CrossRef] [Scilit]
  60. Chen, P.; Jiang, W.; Zhan, W.; Ye, J.; Wu, G.; Lai, K.; Chen, L.; Li, J.; Xu, K.; Liang, M.; et al. AB2 Type Ti–Cr–V–Mn Based Alloys for on-Board Hydrogen Storage Material. Int. J. Hydrogen Energy 2025, 124, 218–225. [Google Scholar] [CrossRef] [Scilit]
  61. Dou, T.; Wu, Z.; Mao, J.; Xu, N. Application of Commercial Ferrovanadium to Reduce Cost of Ti–V-Based BCC Phase Hydrogen Storage Alloys. Mater. Sci. Eng. A 2008, 476, 34–38. [Google Scholar] [CrossRef] [Scilit]
  62. Huang, B. Hydrogen Storage Alloys Providing for the Reversible Storage of Hydrogen at Low Temperatures. United States Patent Application Publication. 2005. Available online: https://patentimages.storage.googleapis.com/7a/2b/f2/8bcb7d5e104a8b/US20050067060A1.pdf (accessed on 13 July 2026).
  63. Tominaga, Y.; Matsumoto, K.; Fuda, T.; Tamura, T.; Kuriiwa, T.; Kamegawa, A.; Takamura, H.; Okada, M. Protium Absorption-Desorption Properties of Ti-V-Cr-(Mn, Ni) Alloys. Mater. Trans. JIM 2000, 41, 617–620. [Google Scholar] [CrossRef] [Scilit]
  64. Young, K.; Wong, D.; Nei, J. Effects of Vanadium/Nickel Contents in Laves Phase-Related Body-Centered-Cubic Solid Solution Metal Hydride Alloys. Batteries 2015, 1, 34–53. [Google Scholar] [CrossRef] [Scilit]
  65. Yu, X.B.; Feng, S.L.; Wu, Z.; Xia, B.J.; Xu, N.X. Hydrogen Storage Performance of Ti–V-Based BCC Phase Alloys with Various Fe Content. J. Alloys Compd. 2005, 393, 128–134. [Google Scholar] [CrossRef] [Scilit]
  66. Yu, X.B.; Wu, Z.; Xia, B.J.; Xu, N.X. Hydrogen Storage Performance of Quenched Ti–V-Based Alloy. J. Alloys Compd. 2004, 373, 134–136. [Google Scholar] [CrossRef] [Scilit]
  67. Zhu, J.; Ma, L.; Liang, F.; Wang, L. Effect of Sc Substitution on Hydrogen Storage Properties of Ti–V–Cr–Mn Alloys. Int. J. Hydrogen Energy 2015, 40, 6860–6865. [Google Scholar] [CrossRef] [Scilit]
  68. Schülke, M.; Paulus, H.; Lammers, M.; Kiss, G.; Réti, F.; Müller, K.-H. Influence of surface contaminations on the hydrogen storage behaviour of metal hydride alloys. Anal. Bioanal. Chem. 2008, 390, 1495–1505. [Google Scholar] [CrossRef] [Scilit] [PubMed]
  69. Manna, J.; Tougas, B.; Huot, J. First Hydrogenation Kinetics of Zr and Mn Doped TiFe Alloy after Air Exposure and Reactivation by Mechanical Treatment. Int. J. Hydrogen Energy 2020, 45, 11625–11631. [Google Scholar] [CrossRef] [Scilit]
  70. Semboshi, S.; Masahashi, N.; Hanada, S. Degradation of Hydrogen Absorbing Capacity in Cyclically Hydrogenated TiMn2. Acta Mater. 2001, 49, 927–935. [Google Scholar] [CrossRef] [Scilit]
  71. Cho, S.-W.; Enoki, H.; Akiba, E. Effect of Fe Addition on Hydrogen Storage Characteristics of Ti0.16Zr0.05Cr0.22V0.57 Alloy. J. Alloys Compd. 2000, 307, 304–310. [Google Scholar] [CrossRef] [Scilit]
  72. Hang, Z.; Chen, L.; Xiao, X.; Yao, Z.; Shi, L.; Feng, Y.; Yang, L. Microstructure and Hydrogen Storage Properties of Ti10 + xV80-xFe6Zr4 (X = 0~15) Alloys. Int. J. Hydrogen Energy 2021, 46, 27622–27630. [Google Scholar] [CrossRef] [Scilit]
  73. Dangwal, S.; Edalati, K. High-Entropy Alloy TiV2ZrCrMnFeNi for Hydrogen Storage at Room Temperature with Full Reversibility and Good Activation. Scr. Mater. 2024, 238, 115774. [Google Scholar] [CrossRef] [Scilit]
  74. Dangwal, S.; Edalati, K. Significance of Interphase Boundaries on Activation of High-Entropy Alloys for Room-Temperature Hydrogen Storage. Int. J. Hydrogen Energy 2024, 50, 626–636. [Google Scholar] [CrossRef] [Scilit]
  75. Edalati, K. Superfunctional Materials by Ultra-Severe Plastic Deformation. Materials 2023, 16, 587. [Google Scholar] [CrossRef] [Scilit] [PubMed]
  76. Edalati, K.; Bachmaier, A.; Beloshenko, V.A.; Beygelzimer, Y.; Blank, V.D.; Botta, W.J.; Bryła, K.; Čížek, J.; Divinski, S.; Enikeev, N.A.; et al. Nanomaterials by Severe Plastic Deformation: Review of Historical Developments and Recent Advances. Mater. Res. Lett. 2022, 10, 163–256. [Google Scholar] [CrossRef] [Scilit]
  77. Valiev, R.Z.; Islamgaliev, R.K.; Alexandrov, V.I. Bulk Nanostructured Materials from Severe Plastic Deformation. Prog. Mater. Sci. 2000, 45, 103–189. [Google Scholar] [CrossRef] [Scilit]
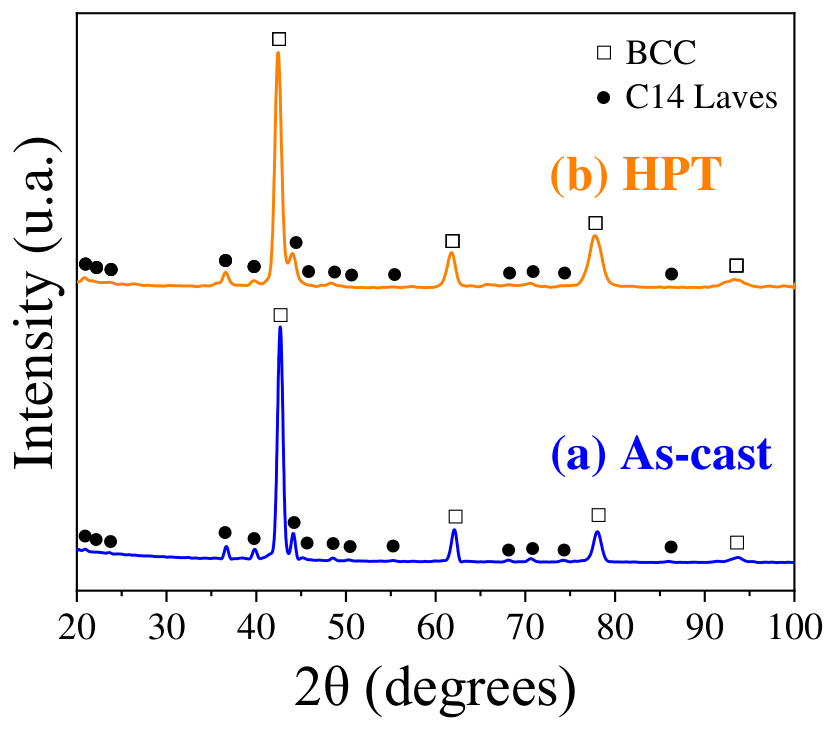
Figure 1. XRD patterns from Ti-V-Cr-Mn samples in (a) the as-cast condition and (b) after HPT processing.
Metals 16 00807 g001
Figure 2. Backscattered electron images and elemental X-ray maps of the Ti-V-Cr-Mn alloy. (a,d) As-cast condition. (b) Center and (c) edge of HPT-processed condition. (eh) Ti, Mn, Cr, and V X-ray maps produced with the corresponding Kα lines.
Metals 16 00807 g002
Figure 3. Bright-field STEM image (a) and HRTEM image (b) of HPT-processed Ti-V-Cr-Mn samples.
Metals 16 00807 g003
Figure 4. Pressure-composition isothermal curves at 45 °C and 60 °C for as-cast samples. Absorption and desorption stages in the same cycle are identified by the same symbol and color.
Metals 16 00807 g004
Figure 5. (a) PCI curves at 45 °C and 60 °C of HPT-processed samples with and without pre-activation. (b) PCI curves at 45, 60, 75, and 90 °C for an HPT-processed, pre-activated sample. Absorption and desorption stages in the same cycle are identified by the same symbol and color.
Metals 16 00807 g005
Figure 6. (a) Hydrogenation tests at 20 °C and 45 °C of as-cast Ti-V-Cr-Mn samples. (b) Corresponding dehydrogenation. (c) Repeated hydrogenation tests. (d) Corresponding dehydrogenation. Sample with reactivation treatments applied between each (de)hydrogenation cycle.
Metals 16 00807 g006
Figure 7. (a) Hydrogenation tests at 21 °C of an HPT-processed sample. (b) Corresponding dehydrogenation plots. Sample without pre-activation treatment.
Metals 16 00807 g007
Figure 8. XRD patterns from HPT Ti-V-Cr-Mn samples. (a) Partially hydrogenated and (b) after a full dehydrogenation treatment.
Metals 16 00807 g008
Figure 9. Hydrogenation stage of HPT-processed sample after six previous (de)hydrogenation cycles and being kept overnight under 0.1 MPa H2 pressure.
Metals 16 00807 g009
Table 1. Crystalline parameters of Ti-V-Cr-Mn alloy as determined by X-ray diffraction Rietveld analysis.
Alloy ConditionPhasePhase Content (%)Lattice
Parameter [nm]
Crystallite Size [nm]
As-castBCC79.9a = 0.298727.0
C14 Laves20.1a = 0.4885
c = 0.8189
82.9
HPTBCC80a = 0.299725.0
C14 Laves20a = 0.4884
c = 0.8105
23.1
Table 2. Average composition of the Ti-V-Cr-Mn alloy (area analysis) and the BCC and C14 Laves phases as determined by EDS microanalysis. Standard deviations reported in parentheses.
Alloy ConditionPhase (Vol%)Ti (at%)V (at%)Cr (at%)Mn (at%)
As-castAverage in the area analysis27.4 (0.8)23.9 (1.1)24.0 (1.1)24.7 (1.6)
BCC (68.0)23.4 (2.0)28.2 (1.8)25.1 (1.7)23.3 (1.3)
C14 Laves (32.0 ± 2.8)33.3 (1.7)13.7 (2.9)19.3 (0.7)33.7 (2.9)
HPTAverage in the area analysis26.1 (1.6)24.8 (1.5)23.2 (0.4)25.8 (0.5)
BCC (65.8)21.2 (3.1)30.2 (3.1)25.5 (1.7)23.1 (1.8)
C14 Laves (34.2 ± 2.3)31.9 (1.9)13.2 (1.2)18.4 (0.7)36.5 (1.2)
Table 3. Crystalline parameters of partially hydrided and fully dehydrided Ti-V-Cr-Mn alloy as determined by X-ray diffraction Rietveld analysis.
Alloy ConditionPhasePhase (%)Lattice
Parameter [nm]
Crystallite Size [nm]
As-cast—partially hydrided BCC78.96a = 0.299222.8
C14 Laves21.04a = 0.4875
c = 0.8009
16.0
HPT—partially hydridedBCC80a = 0.299725.0
C14 Laves20a = 0.4884
c = 0.8105
23.1
As-cast—dehydrided BCC79.13a = 0.298225.8
C14 Laves20.87a = 0.4875
c = 0.8013
17.0
HPT—dehydridedBCC80a = 0.299944.0
C14 Laves20a = 0.4887
c = 0.8024
47.2
Table 4. Reported Ti-V-Cr-Mn alloys: composition, hydrogen storage capacity, and cyclability.
Alloy Composition as Originally Reported and in Atomic Fraction 1Key Structural Phase(s)Max. H2 Capacity (wt%) 2Eff. Reversible Capacity (wt%)Reversible CyclesHydriding Conditions/Key NotesRef.
Ti-V-Cr-Mn
Ti0.26V0.24Cr0.23Mn0.26
BCC, minor C141.61.35318 K, up to 2.5 MPaPresent work
Ti-xV-10Cr-(50 − x)Mn;
x = 20, 24, 28, 32
For x = 32: Ti0.02V0.52Cr0.16Mn0.3
BCC and C143.98,
for x = 32
2.451293 K, up to 4 MPa in PCT; increased proportion of Laves phase (C14) with reducing vanadium content, x = 20[33]
Ti-Cr-20V-xMn
fixed Ti:Cr = 2:3, x = 0, 5, 10, 15
For x = 10:
Ti0.06V0.57Cr0.09Mn0.29
BCC3.6, for x = 5 and 103.61313 K, up to 10 MPa
313 K, up to 10 MPa
[59]
Ti-Cr-xV-10Mn
fixed Ti:Cr = 2:3, x = 20, 40, 60, 80
For x = 60:
Ti0.03V0.8Cr0.04Mn0.13
BCC3.8, for x = 60 and 802.3
Ti0.32Cr0.40V0.25Mnx
x = 0.03, 0.05, 0.08, 0.1
Ti0.3Cr0.38V0.24Mn0.08
BCC, minor Laves phase for x = 0.103.8, for x = 0.082.31293 K, up to ~8 MPa[42]
TiCr1.25−xVxMn0.75
x = 0, 0.0625, 0.125,0.1875
For x = 0.125:
Ti0.33V0.04Cr0.38Mn0.25
C141.92, for x = 0.1251.61263 K, up to 10 MPa[60]
(Ti0.32Cr0.46V0.22)96Mn4
Ti0.30V0.21Cr0.44Mn0.04
BCC3.22.1300298 K and
7.5 MPa
[36]
Ti34-V32-Cr16-Mn18
Ti0.34V0.32Cr0.16Mn0.18
BCC3.471.031353 K. 4 MPa[61]
Ti20-V50-Cr25-Mn5
Ti0.2V0.5Cr0.25Mn0.05
Not reported3.412.301293 K, 3.1 MPa[62]
Ti20-V50-Cr20-Mn10
Ti0.2V0.5Cr0.2Mn0.1
Not reported2.411.30
Ti28-V35-Cr32-Mn5
Ti0.28V0.35Cr0.32Mn0.05
BCC2.60.61313 K, up to 10 MPa[63]
Ti28-V35-Cr27-Mn10
Ti0.28V0.35Cr0.27Mn0.10
BCC2.50.7
Ti28-V35-Cr22-Mn15
Ti0.28V0.35Cr0.22Mn0.15
BCC2.30.4
Ti36.5-V15-Cr42-Mn6.5
Ti0.37V0.15Cr0.42Mn0.07
BCC + C14 minor2.40.7
Ti32-V25-Cr37-Mn6
Ti0.32V0.25Cr0.37Mn0.06
BCC2.60.8
Ti24-V45-Cr27-Mn4
Ti0.24V0.45Cr0.27Mn0.04
BCC2.60.6
Ti-V35-Cr27-Mn10
Ti0.01V0.48Cr0.37Mn0.14
Not reported2.70.61313 K, 10 MPa, annealed
Ti9.5-V74.1-Cr14.4-Mn2
Ti0.1V0.74Cr0.14Mn0.02
BCC1.1Decreased with cycling5298 K, 4–5 MPa hydriding/353 K dehydriding[21]
Ti40-V30-Cr15-Mn15
Ti0.4V0.3Cr0.15Mn0.15
BCC + possible TiO2 (2 wt%)3.110.21303 K, up to 7 MPa[64]
3.020.31333 K, up to 7 MPa
3.00.21363 K, up to 7 MPa
Ti40-V25-Cr10-Mn25
Ti0.40V0.25Cr0.10Mn0.25
BCC + C143.80.31353 K, up to 3 MPa[34]
Ti40-V25-Cr20-Mn15
Ti0.40V0.25Cr0.20Mn0.15
BCC + C143.90.2
Ti40-V25-Cr30-Mn5
Ti0.40V0.25Cr0.30Mn0.05
BCC4.00.3
Ti40-V32-Cr10-Mn18
Ti0.40V0.32Cr0.10Mn0.18
BCC4.00.21353 K, 3 up to MPa[65]
Ti47-V28-Cr10-Mn15
Ti0.47V0.28Cr0.10Mn0.15
BCC as-cast3.80.51293 K, up to 3 MPa in PCT
293 K, 3 MPa hydriding
353 K and 0.003 MPa dehydriding
[66]
BCC + C14 quenched3.80.2
Ti40-V40-Cr10-Mn10
Ti0.4V0.4Cr0.1Mn0.1
BCC3.60.21273 K, 7 MPa hydriding
373 K dehydriding
[67]
1 The atomic fraction was calculated to homogenize the reported compositions. 2 The maximum hydrogen uptake is reported for the composition in the original work.
Disclaimer/Publisher’s Note: The statements, opinions and data contained in all publications are solely those of the individual author(s) and contributor(s) and not of MDPI and/or the editor(s). MDPI and/or the editor(s) disclaim responsibility for any injury to people or property resulting from any ideas, methods, instructions or products referred to in the content.