Article

Three-Dimensional Graphite Volume Partitioning in Compacted Graphite Iron Thermal Analysis Specimens with 0–0.30 wt.% 75FeSi Addition

1
School of Intelligent Manufacturing and Automotive Engineering, Chongqing Chemical Industry Vocational College, Chongqing 401220, China
2
School of Materials Science and Chemical Engineering, Harbin University of Science & Technology, Harbin 150040, China
3
School of Materials and Chemistry, University of Shanghai for Science and Technology, Shanghai 200093, China
*
Author to whom correspondence should be addressed.
Metals 2026, 16(7), 806; https://doi.org/10.3390/met16070806
Submission received: 10 June 2026 / Revised: 10 July 2026 / Accepted: 16 July 2026 / Published: 18 July 2026

Abstract

Two-dimensional metallography cannot be used to determine how graphite volume is partitioned among three-dimensional connected structures in compacted graphite iron (CGI), even when the conventional graphite fractions are similar. This study therefore uses archived micro-CT data to determine whether 75FeSi additions in thermal analysis specimens alter the three-dimensional distribution of graphite volume. Three spherical specimens were cast from an industrial CGI melt with 0, 0.15, and 0.30 wt.% 75FeSi placed at the bottom of the specimen cavity. Center coupons were examined using a ZEISS Xradia 620 Versa X-ray microscope, and the retained reconstructed volumes had 3.0 µm isotropic voxels. We decoded the archived Dragonfly volumetric datasets, removed inactive historical labels, and calculated number-weighted and volume-weighted size, concentration, and shape descriptors. Graphite volume fraction remained within 8.56–8.83%, whereas connected object number density changed from 9764 mm−3 without additional 75FeSi to 5739 and 6854 mm−3 at 0.15 and 0.30 wt.%, respectively. Number-weighted median diameter remained near 13 µm, but volume-weighted D90 increased from 185.0 to 454.7 and 501.9 µm. The largest connected object contained 3.42%, 20.30%, and 31.39% of graphite volume, respectively. The main contribution is a specimen-level three-dimensional graphite volume-partitioning signature that separates graphite amount from graphite connectivity and upper-tail concentration. The results show that similar total graphite fractions can correspond to different internal graphite architectures, which conventional planar measurements cannot resolve.

1. Introduction

Compacted graphite iron (CGI) occupies an important position between gray and ductile cast irons. Its graphite morphology reduces the severe stress concentration associated with flake graphite while retaining useful thermal transport and damping behavior [1,2]. This balance supports engine blocks, cylinder heads, exhaust components, brake parts, and other castings exposed to combined mechanical and thermal loading [3,4,5]. The attainable response depends on graphite amount, graphite shape, spatial continuity, and matrix interaction rather than graphite fraction alone [6,7,8].
Industrial CGI production is sensitive to residual magnesium, rare earth elements, sulfur, oxygen activity, inoculation, pouring temperature, and cooling rate [9,10,11]. Thermal analysis follows liquidus formation, eutectic nucleation, recalescence, and the end of solidification before a production melt is committed to a casting [9]. Dual-chamber thermal analysis extends this approach by comparing untreated and inoculated portions of the same melt, so the curve difference reports the melt response to a controlled addition [10,11].
Quality assessment after solidification still relies mainly on polished sections. Vermicularity, nodularity, particle count, equivalent diameter, graphite area fraction, and numerical geometric parameters provide practical production indicators [11,12,13]. Their geometric meaning is restricted to the selected plane: one branched graphite aggregate can appear as several separate profiles, and a large, connected object can be missed if the section does not intersect at its main branches.
Three-dimensional graphite morphology controls local stress transfer and heat flow. Graphite–matrix interfaces redirect stress, large irregular graphite objects can localize strain, and connected graphite paths can alter effective thermal transport [3,4,5,14]. These links motivate three-dimensional measurements, but direct process–structure–property evidence for CGI remains limited when specimens have similar two-dimensional vermicularity or graphite fraction.
X-ray micro-computed tomography retains the spatial information that polished sections lose. Prior cast-iron studies quantified graphite volume, surface area, equivalent diameter, Feret dimensions, sphericity, connectivity, and graphite evolution by X-ray or synchrotron tomography [6,7,8,15]. Serial-section reconstruction also showed that compacted graphite forms branched three-dimensional structures [16]. Tomographic measurements depend on voxel size, segmentation threshold, connectivity rule, surface interpolation, and the treatment of near-resolution objects [7,17].
Silicon and FeSi inoculation provide a direct route for changing graphite nucleation and eutectic growth. FeSi additions can create local Si-rich regions, reduce carbon solubility, promote graphite precipitation, increase heterogeneous nuclei, and reduce undercooling [11]. Published thermal analysis work showed that FeSi additions in dual-chamber sample cups changed cooling-curve features and two-dimensional vermicularity [11]. Silicon content also affects CGI microstructure and mechanical properties [18]. What remains unclear is whether specimens that appear comparable by graphite fraction contain different three-dimensional connected volume distributions.
This study addresses that gap by comparing production thermal analysis specimens cast with 0, 0.15, and 0.30 wt.% 75FeSi placed in the specimen cavity. We quantify number- and volume-weighted component size, upper-tail volume shares, component–volume inequality, and volume-weighted shape from micro-CT data. We also test the stability of the observations across six minimum component–size thresholds. The study is descriptive because one CT specimen represents each addition; its purpose is to establish a measurement framework and identify hypotheses for replicated mechanical property validation.

2. Materials and Methods

2.1. Melt and Specimen Context

The specimens originated from industrial CGI production. According to the original doctoral dissertation process record, the melt was prepared in an ABP20t medium-frequency induction furnace, deslagged, held at 1500 °C for 10 min, chemically checked, and then tapped for ladle alloying and cored-wire treatment. The original process record did not report the heating ramp rate. Table 1 reports the melt composition. These conditions reproduce the foundry context in which thermal analysis is used to assess melt quality rather than laboratory remelting of isolated coupons.
Three spherical thermal analysis specimens, each approximately 60 mm in diameter, were cast from the treated production melt. A K-type thermocouple measured temperature at the sphere center during solidification. The additive was commercial 75FeSi with an 80-mesh particle size. Its nominal composition was 74.0–80.0 wt.% Si and balance Fe. The maximum impurity contents were ≤0.4 wt.% Mn, ≤0.3 wt.% Cr, ≤0.035 wt.% P, ≤0.02 wt.% S, and ≤0.1 wt.% C. It was placed at the bottom of the relevant specimen cavity before pouring so that the incoming molten iron contacted and dissolved the addition. The three conditions contained no additional 75FeSi, 0.15 wt.% 75FeSi, and 0.30 wt.% 75FeSi. These percentages denote additive mass relative to the iron poured into the cavity.
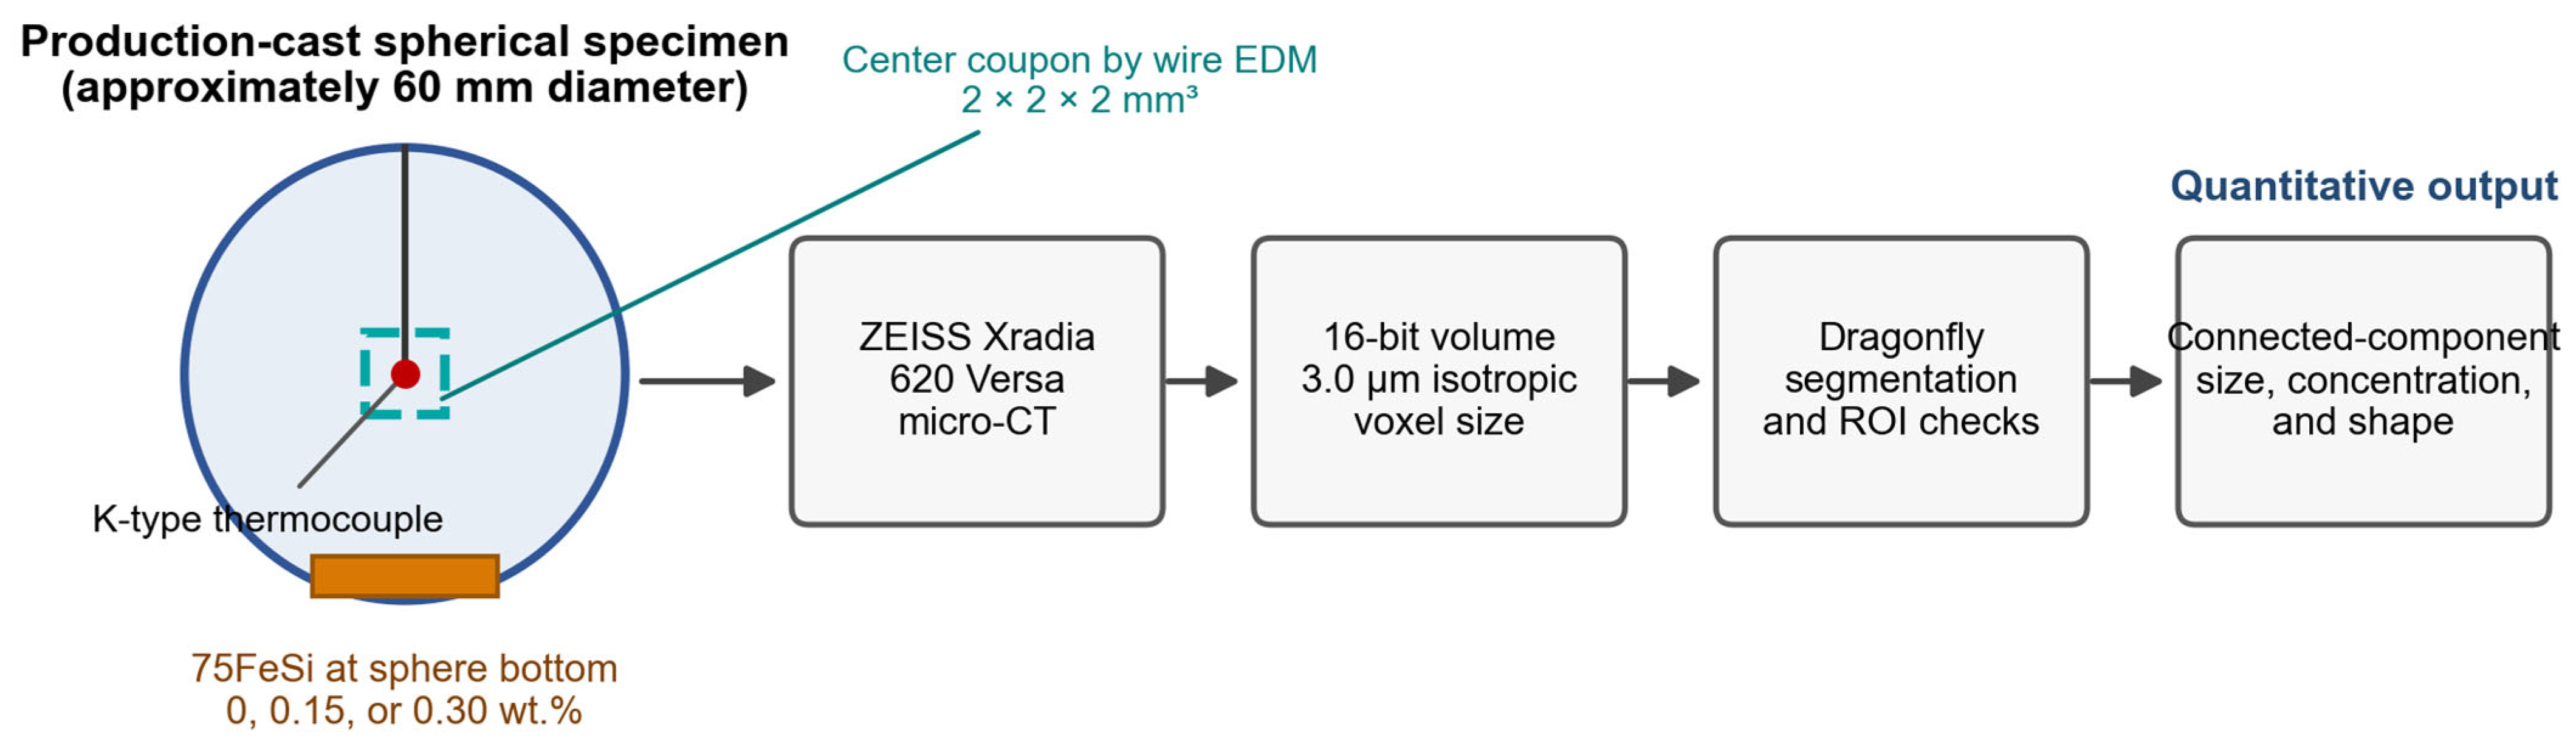
After the spheres had cooled to room temperature, one 2 mm × 2 mm × 2 mm cubic specimen was removed from the center of each sphere by wire electrical discharge machining. The original process record did not retain the make and model of the wire EDM machine; therefore, only the cutting method and specimen size are reported. Center sampling minimized the influence of the external mold wall and located the CT volume near the thermal analysis measurement position. Historical planar measurements followed the GB/T 26656-2011 metallographic method on unetched polished specimens. Five 100× fields were imaged for vermicularity measurement, and the broader doctoral dissertation dataset used field averages for the reported planar indices. The historical vermicularity values were 71.65%, 81.2%, and 79.5% for 0, 0.15, and 0.30 wt.% 75FeSi, respectively. They provide two-dimensional context but were not used to calculate the CT descriptors. The sampling locations and testing procedures are shown in Figure 1.

2.2. X-Ray Micro-CT Acquisition and Reconstruction

The three center specimens were examined using a ZEISS Xradia 620 Versa X-ray microscope (Carl Zeiss X-ray Microscopy, Pleasanton, CA, USA). The instrument generated nondestructive projection images that were reconstructed as 16-bit three-dimensional volumes. The retained reconstructed volume files do not include the original tube voltage, power, exposure time, projection number, objective, source-to-sample distance, detector distance, filter, or reconstruction algorithm settings. These parameters are therefore not inferred retrospectively and should be recorded in a future prospective protocol. The retained reconstructed data have an isotropic voxel size of 3.0 µm. This voxel size was the archived reconstruction resolution rather than a new choice made for the present reanalysis; it resolves graphite architecture above the near-voxel scale but can miss or merge features close to the spatial resolution.
The reconstructed image matrices were 485 × 518 × 528 voxels for 0 wt.% 75FeSi, 519 × 533 × 509 voxels for 0.15 wt.%, and 542 × 527 × 510 voxels for 0.30 wt.%. These matrices correspond to reconstructed fields of 1.455 × 1.554 × 1.584 mm, 1.557 × 1.599 × 1.527 mm, and 1.626 × 1.581 × 1.530 mm, respectively. The field dimensions describe the stored reconstructed image stacks and should not be interpreted as independent measurements of the nominal wire-cut cube dimensions.
Reconstruction, visualization, and graphite segmentation were performed in Dragonfly (Object Research Systems, Montreal, QC, Canada). Graphite was identified as the low-attenuation phase within the iron matrix and stored as a three-dimensional region of interest (ROI). The archived volumetric dataset format retained the intensity volume, the segmented ROI, component labels, and scalar fields. For the present reanalysis, sparse ROI intervals were decoded into binary masks. Inactive entries recorded in the internal file index structure were excluded before component statistics were calculated.
Segmentation integrity was checked in two independent ways. First, we decoded the sparse ROI intervals into a binary graphite mask and compared the recovered graphite voxel total with the graphite voxel total stored in each archived dataset. Second, we sorted component volumes calculated from the decoded mask and compared them with the component–volume scalar fields retained in Dragonfly. Both checks agreed for all three specimens. Inactive entries recorded in the internal file index structure were then excluded, reducing the 0.15 wt.% specimen from 24,321 stored labels to 21,816 active connected objects and the 0.30 wt.% specimen from 30,218 stored labels to 26,958 active connected objects.

2.3. Three-Dimensional Graphite Descriptors

Each active connected object was treated as a segmented graphite object. This term does not imply independent nucleation; connected branches are represented as one object. Component volume V_i, interpolated surface area A_i, and minimum and maximum Feret diameters were recovered from the session scalar fields. Because the original segmentation settings were not fully retained, the analysis reports the decoded connected object population and evaluates sensitivity to minimum component size.
Equivalent spherical diameter was calculated as di = (6Vi/π)1/3.
d i = ( 6 V i π ) 1 3
Sphericity was calculated as ψi = π1/3(6V_i)2/3/Ai.
ψ i = π 1 3 ( 6 V i ) 2 3 A i
Feret elongation was the ratio of maximum to minimum Feret diameter. Shape statistics were reported primarily for components containing at least 27 voxels (729 µm3), because voxel discretization strongly affects surface area and Feret estimates for smaller objects.
Number-weighted statistics assign equal weight to every connected object. The number-weighted D50 is therefore the median of di. Volume-weighted quantiles sort objects by di and accumulate graphite volume Vi, so D50,V and D90,V are the diameters at which 50% and 90% of total graphite volume have accumulated. The volume-weighted mean of any descriptor xi was calculated as Σ(Vi xi)/ΣVi.
G = 2 i V ( i ) n V ( i ) ( n + 1 ) n
Component–volume inequality was summarized by the Gini coefficient after sorting component volumes in ascending order: G = 2Σ(iV(i))/(nΣV(i)) − (n + 1)/n, where i is the rank, n is the number of connected objects, and V(i) is the sorted component volume. Here the Gini coefficient is a no-bin descriptor of graphite volume inequality within one CT volume; it is not a social or financial grouping statistic: V ( i ) V i ψ i V i .

2.4. Resolution Sensitivity, Comparisons, and Statistical Scope

The analysis was repeated with minimum connected-component sizes of 8, 27, 64, 125, 216, and 512 voxels. At each cutoff, we recalculated the retained component fraction, retained graphite volume, median shape descriptors, and volume-weighted shape descriptors. The retained component fraction is the number of connected objects remaining after the cutoff divided by the original active object count. The retained graphite volume is the graphite volume in the remaining objects divided by the original graphite volume. The wider threshold series tested whether conclusions depended on objects close to the spatial resolution.
Each 75FeSi level was represented by one independently cast and reconstructed center specimen. Connected graphite components within a volume are spatial subsamples, not independent casting replicates. We therefore report exact specimen-level measurements, absolute differences, relative changes, and threshold sensitivity without inferential p-values. A population-level dose response will require replicated spherical castings and mechanical specimens at each addition.
The reconstructed matrix sizes differ because the retained reconstructed volume files stored slightly different reconstructed fields of view. They should not be interpreted as differences in the nominal 2 mm × 2 mm × 2 mm wire-cut coupon size. The selection of samples for the CT experiment is shown in Table 2.

3. Results

3.1. Reconstruction Integrity and Active Component Population

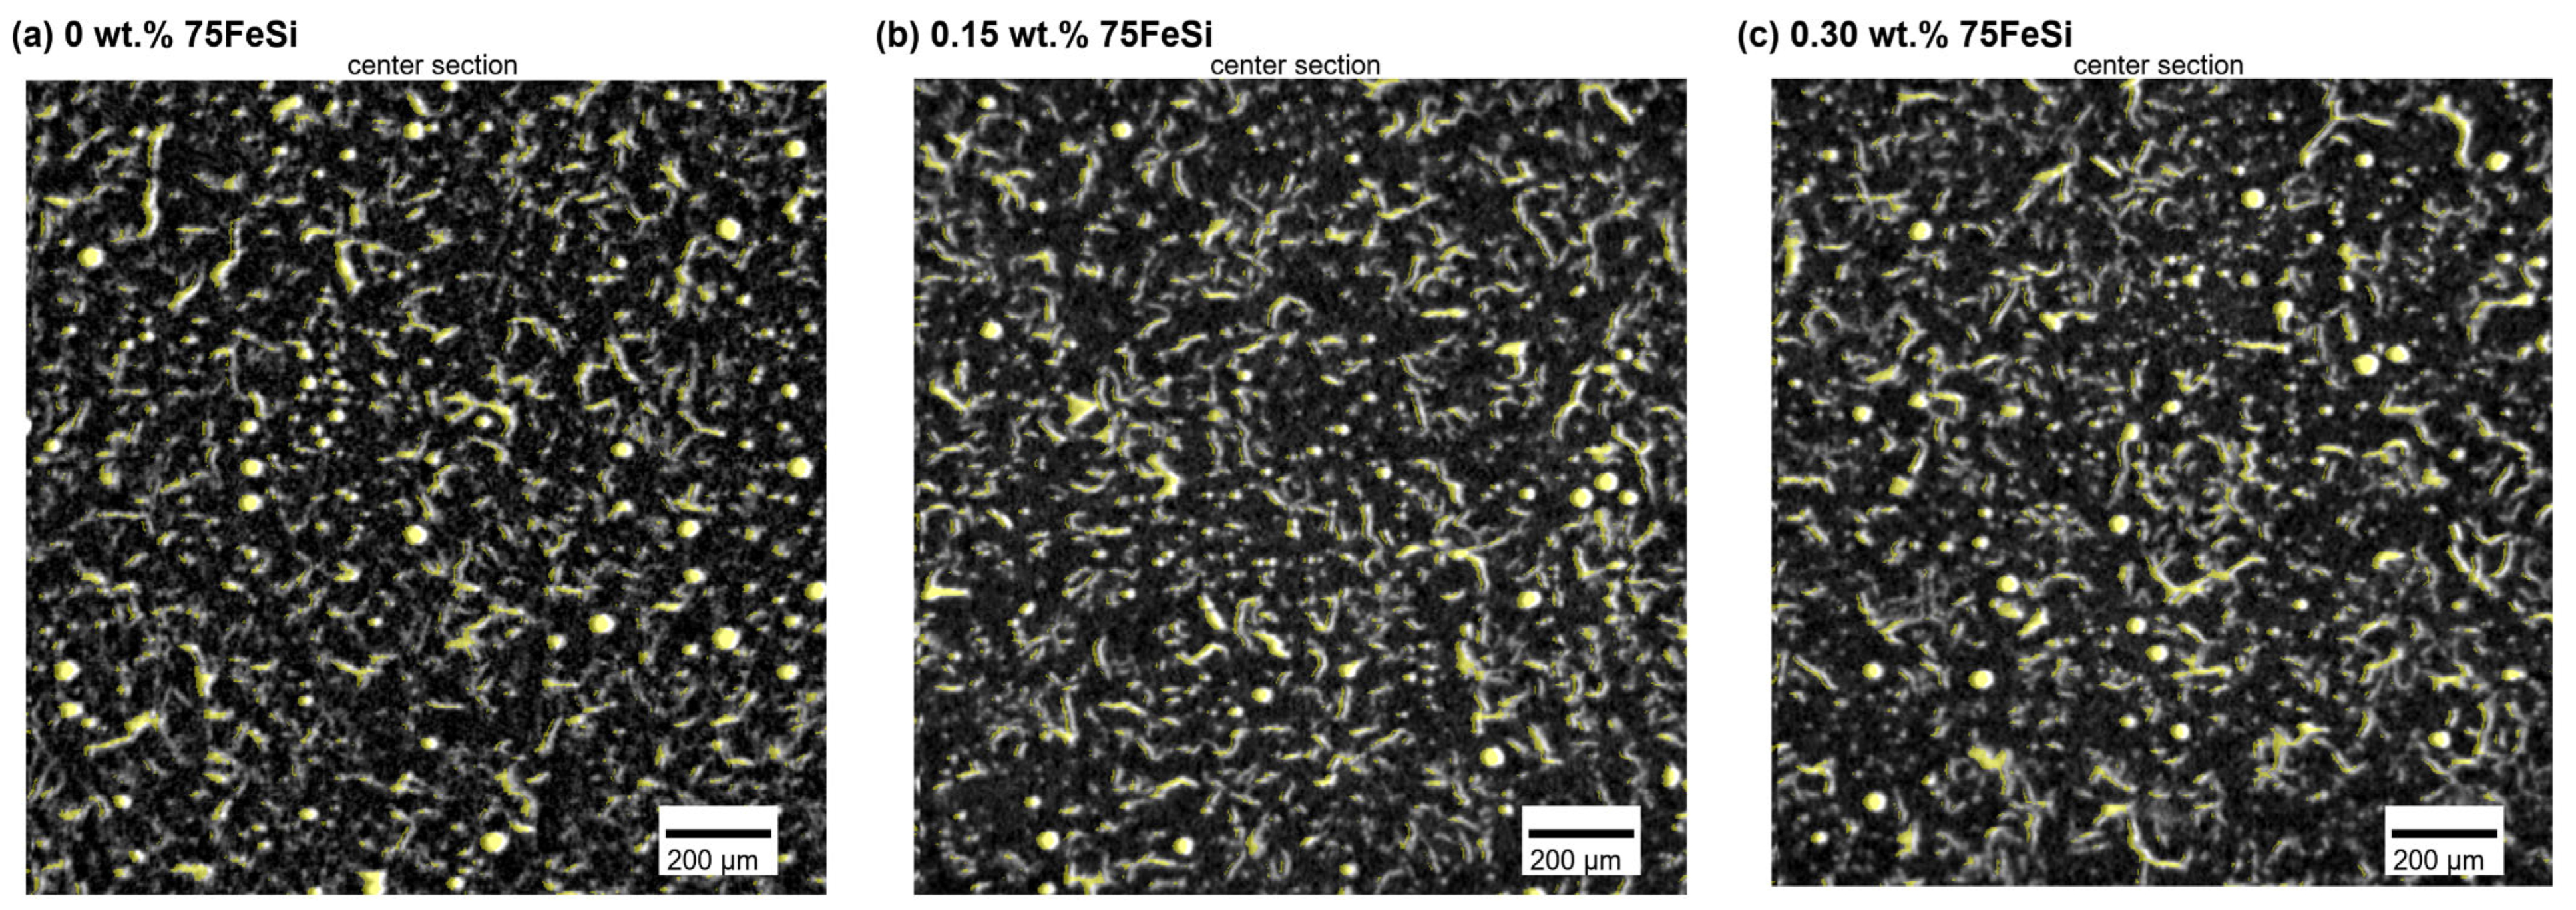
Figure 2 shows one representative center section from each reconstructed volume with the decoded graphite masks overlaid. Each panel includes a 200 µm scale bar. The masks follow both compact and elongated low-density features. Exact agreement between interval-derived voxel totals and session metadata confirmed that the sparse ROIs were reconstructed without loss.
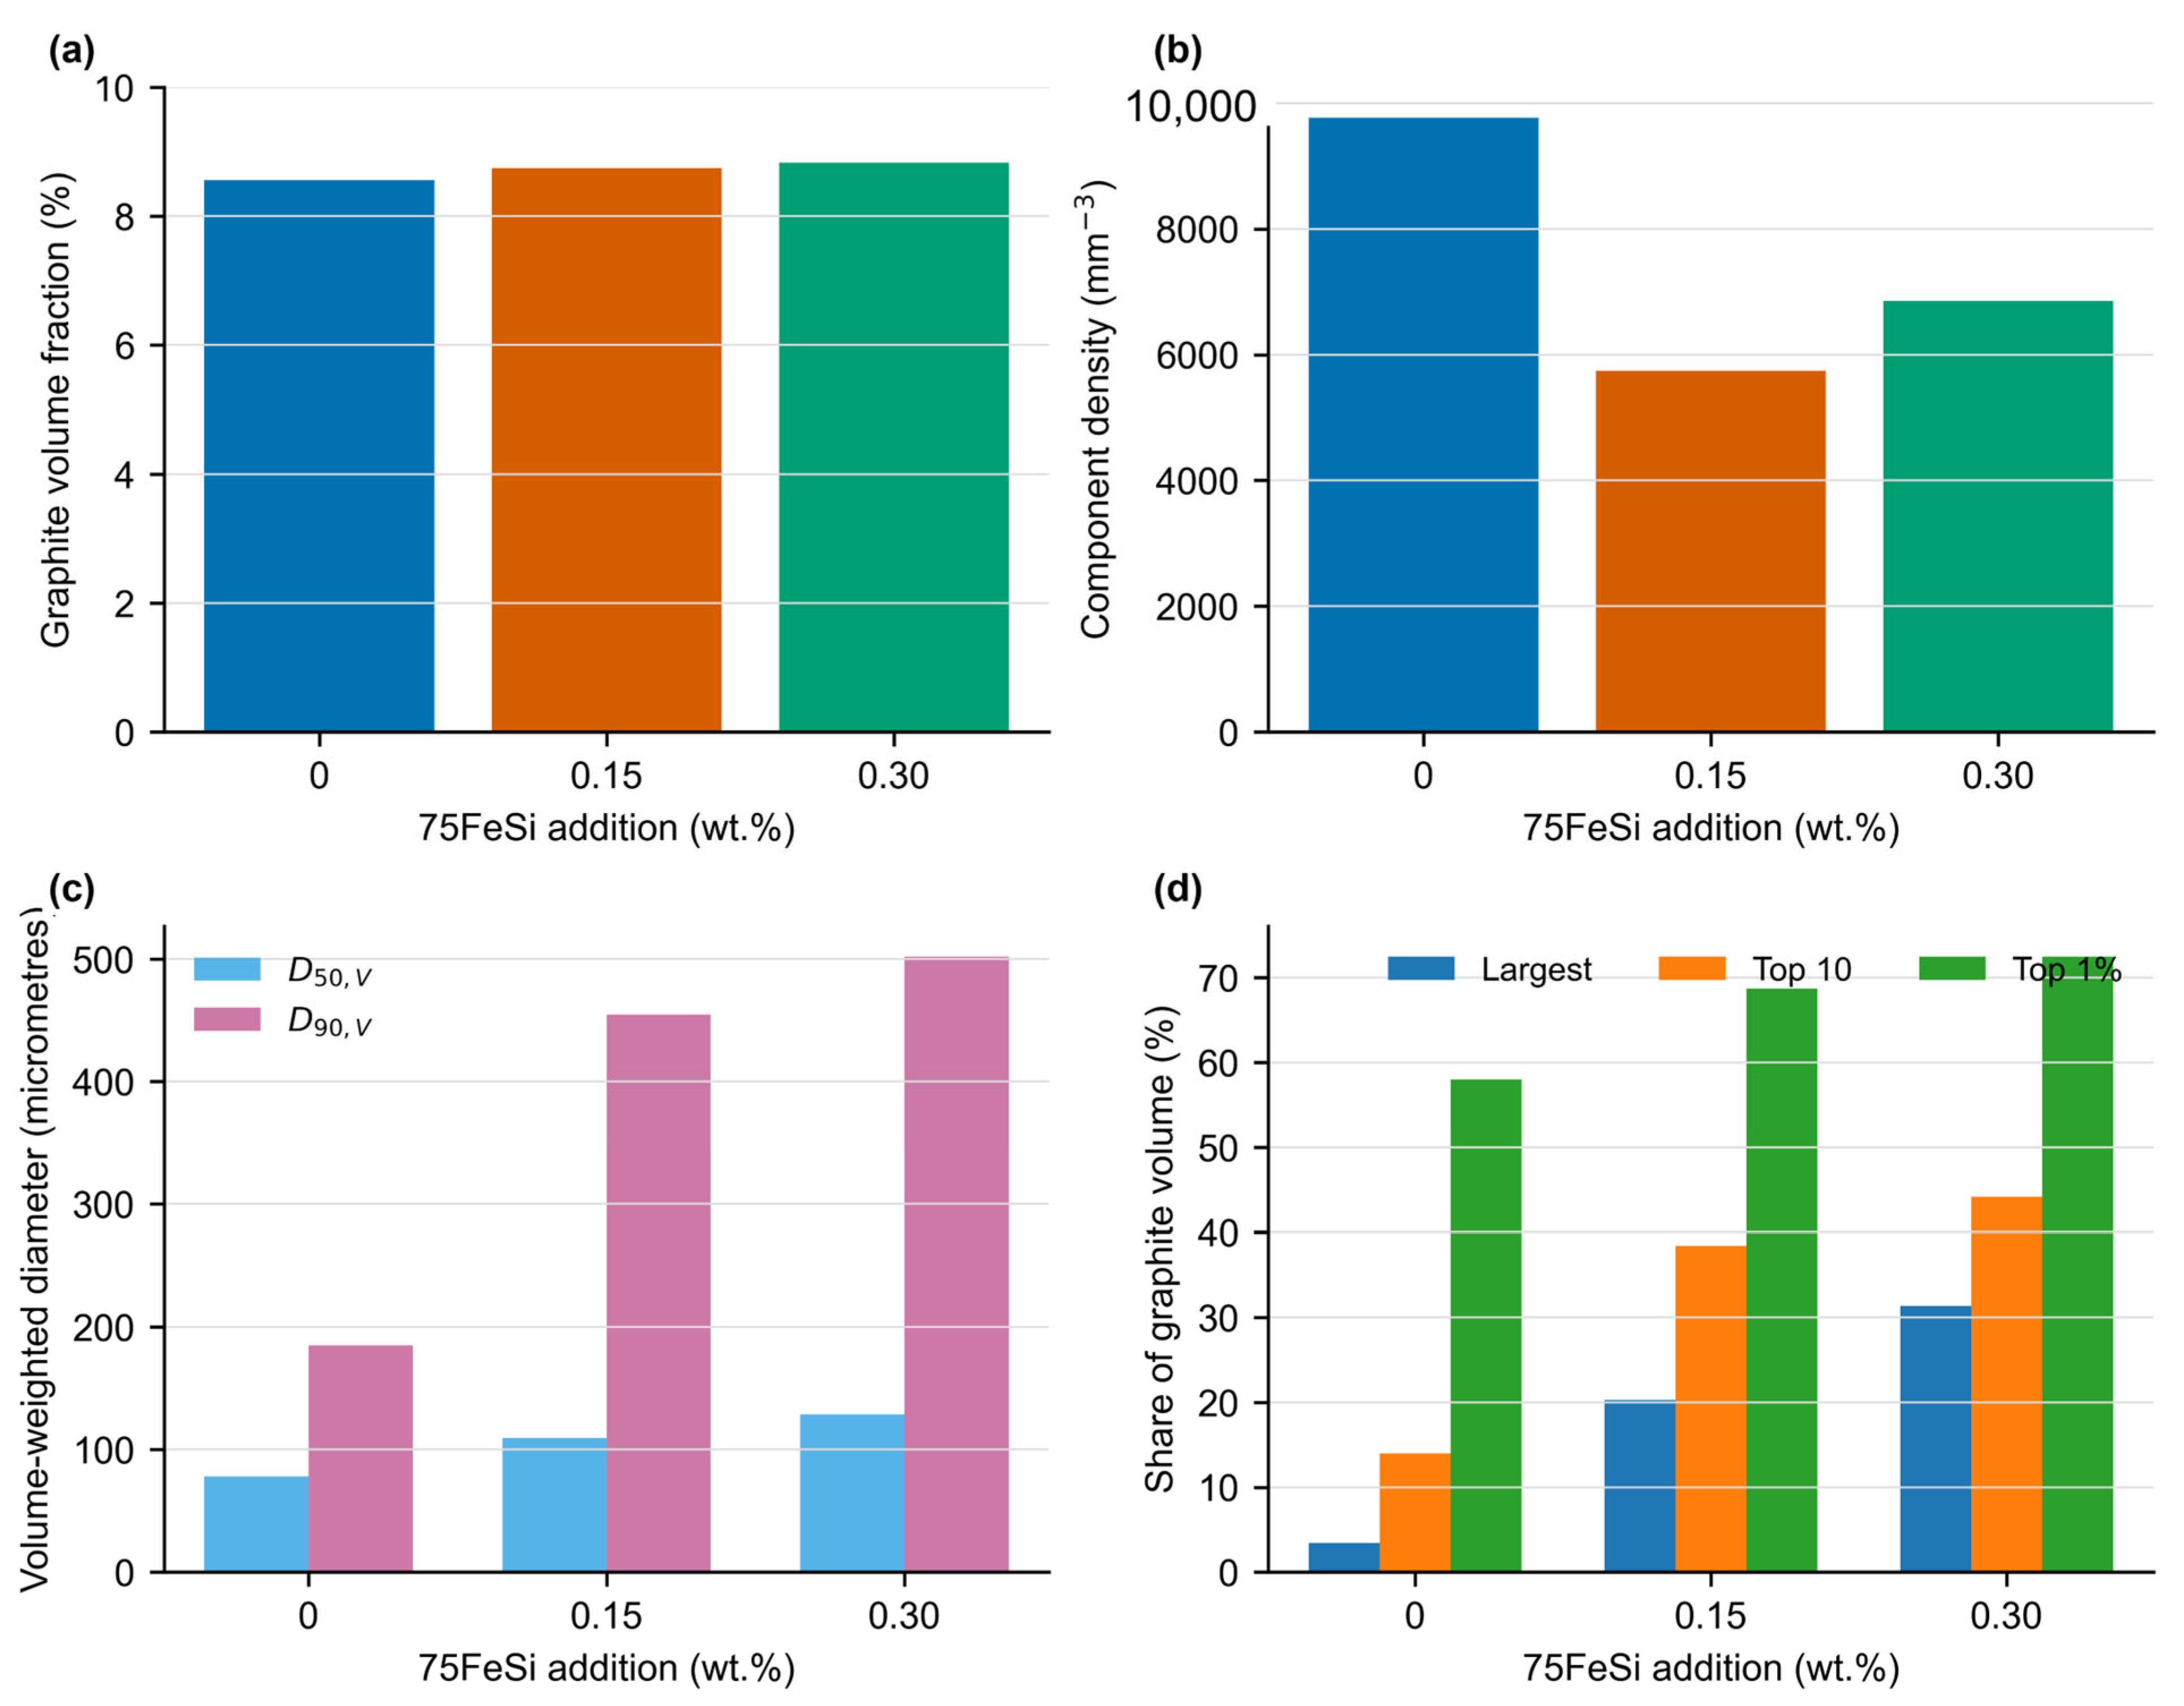
The specimen without additional 75FeSi had 34,971 active components and the highest component density, 9764 mm−3. The 0.15 wt.% specimen contained 21,816 components at 5739 mm−3, and the 0.30 wt.% specimen contained 26,958 components at 6854 mm−3. Excluding inactive historical labels reduced the latter two counts by 10.3% and 10.8%, respectively. This correction directly affects particle count and number density interpretations.
Relative to the specimen without additional 75FeSi, component density decreased by 41.2% at 0.15 wt.% and by 29.8% at 0.30 wt.%. The minimum at 0.15 wt.% indicates that number density did not vary monotonically with addition, despite the monotonic change in several upper-tail volume descriptors reported below. This contrast is important because component count and connected volume concentration describe different aspects of graphite organization.

3.2. Similar Number-Weighted Sizes but Different Volume Tails

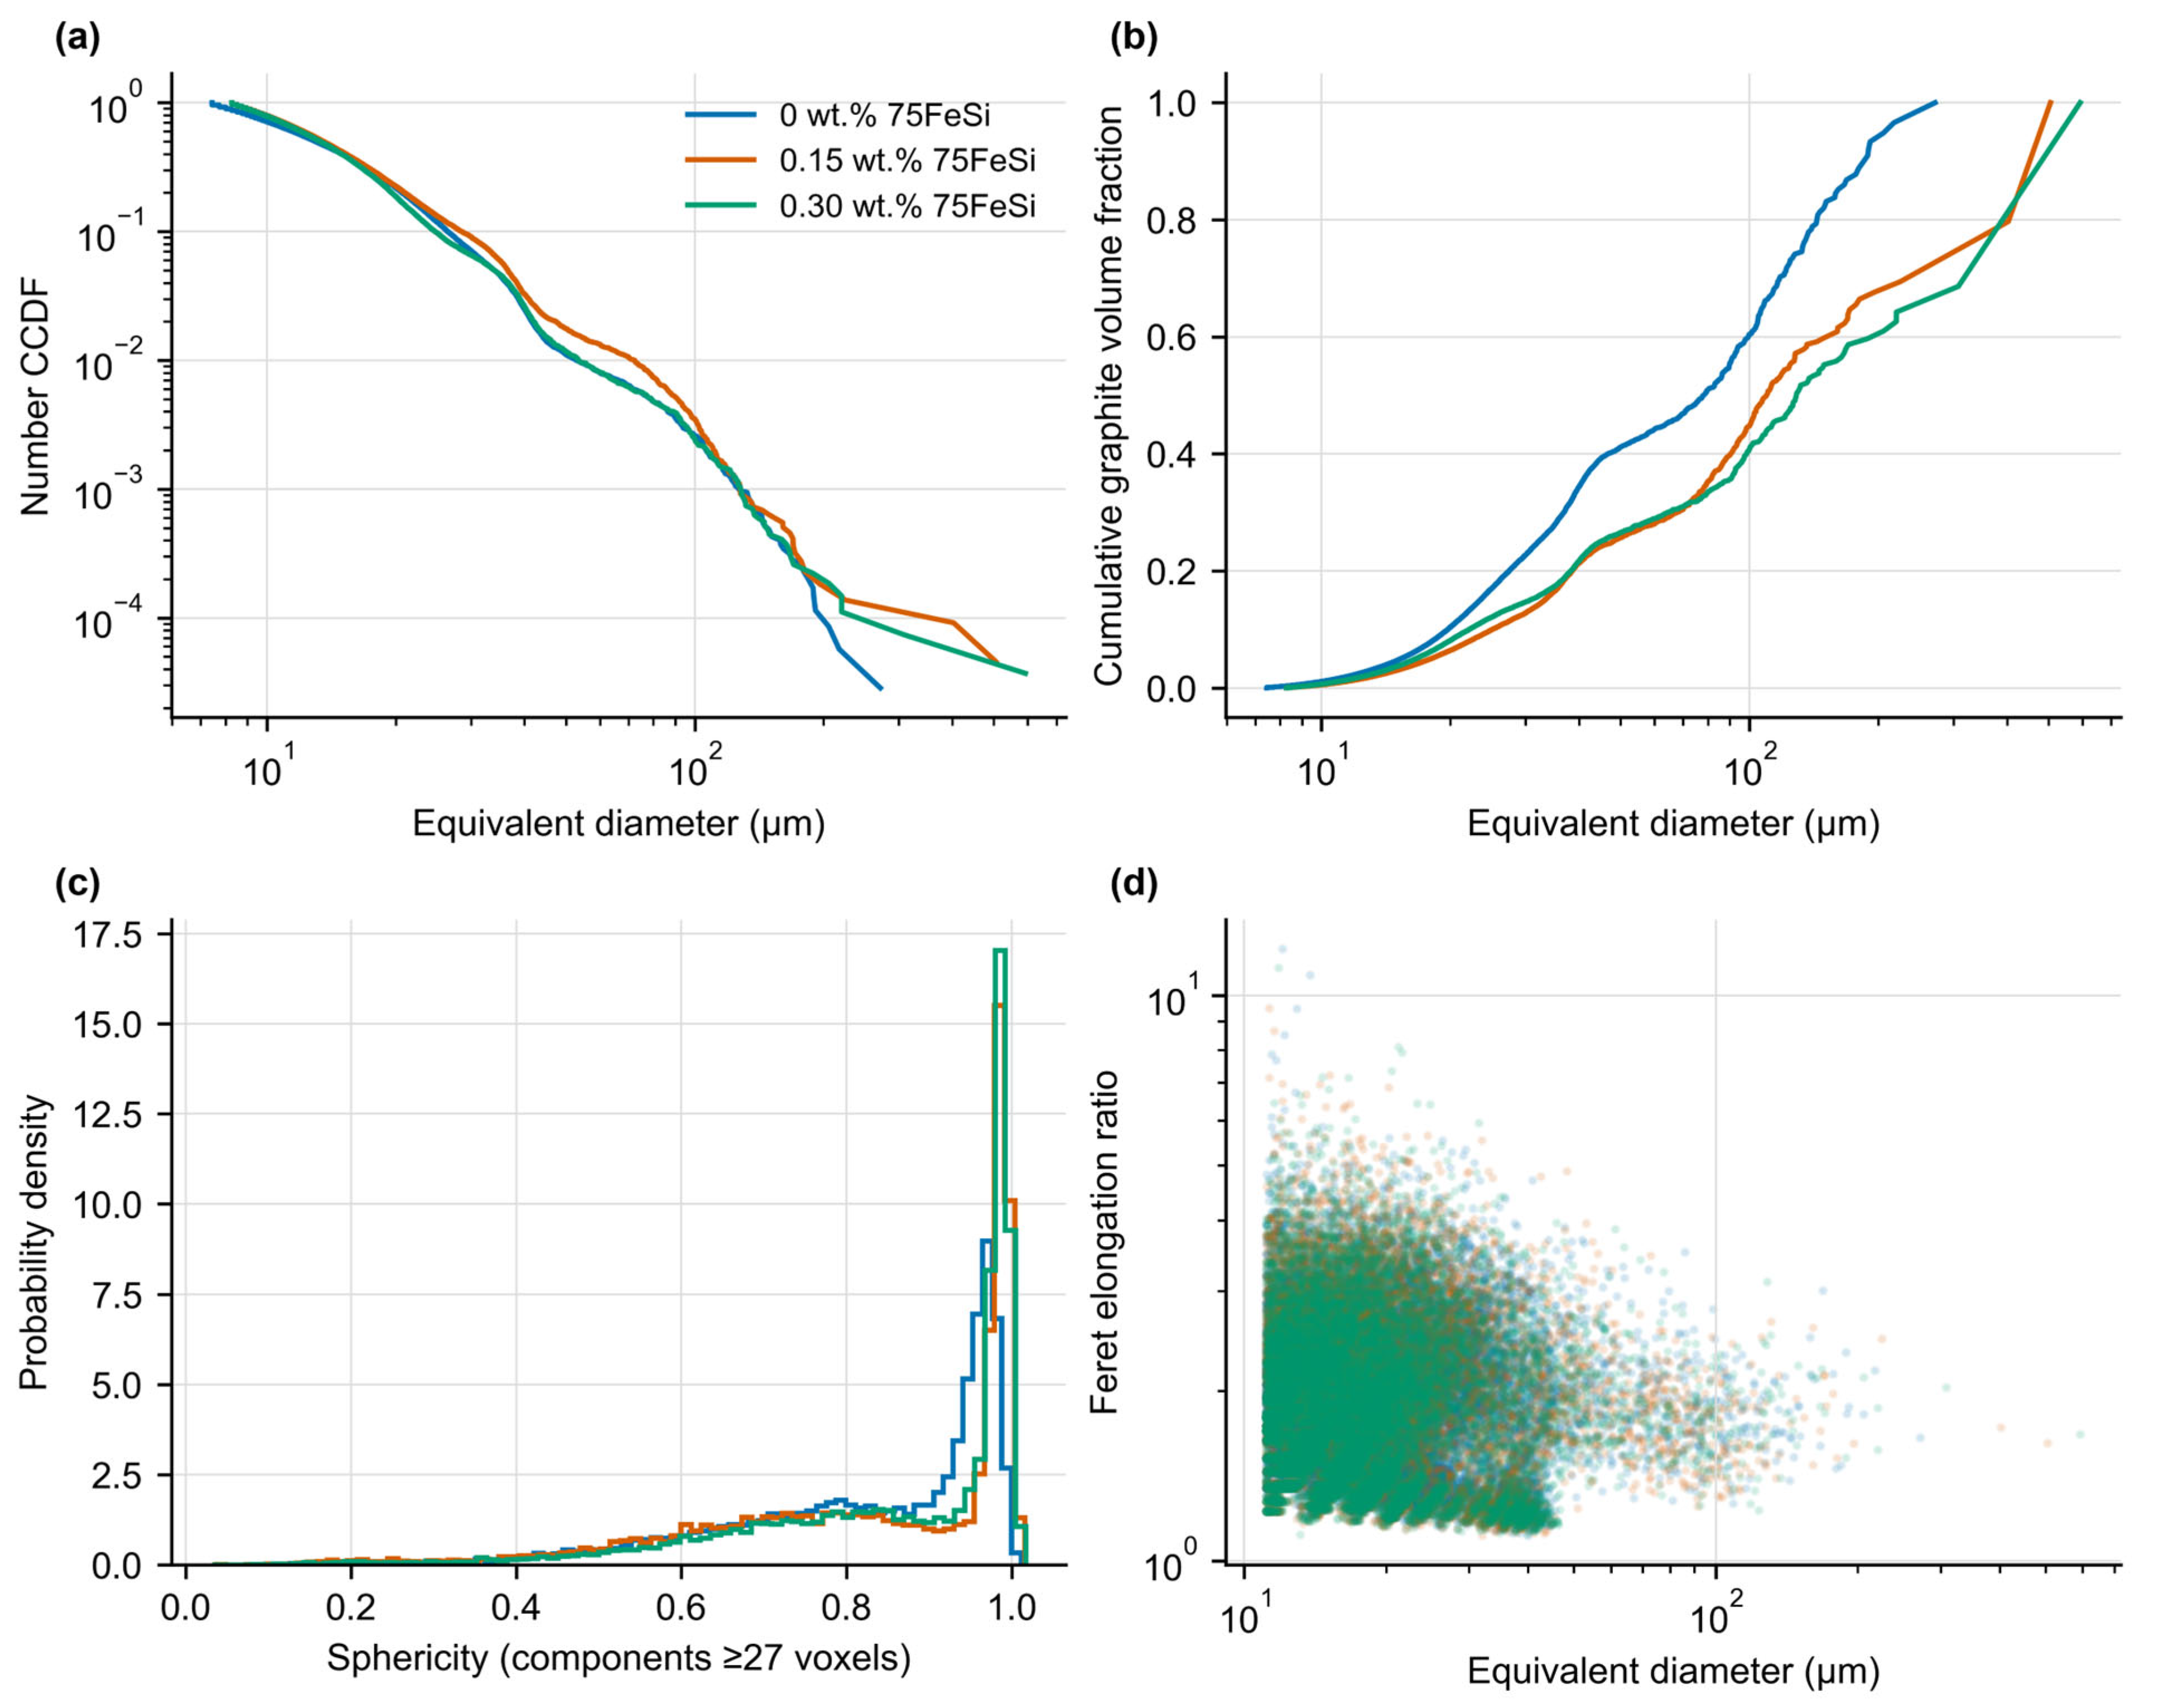
The number-weighted component distributions were broadly similar through most of their range (Figure 3a). Median equivalent diameter was 13.04 µm without additional 75FeSi, 13.53 µm at 0.15 wt.%, and 13.34 µm at 0.30 wt.%. Count-based medians therefore indicated only a small change across the three specimens.
The cumulative graphite volume distributions gave a different result (Figure 3b). Volume-weighted median diameter increased from 78.2 µm without additional 75FeSi to 109.6 µm at 0.15 wt.% and 128.6 µm at 0.30 wt.%. The upper-tail separation was larger: volume-weighted D90 was 185.0, 454.7, and 501.9 µm, respectively. Both FeSi-containing specimens therefore allocated more graphite volume to large components, and the upper tail extended progressively with increasing addition.
Compared with the untreated specimen, volume-weighted D50 increased by 40.2% at 0.15 wt.% and by 64.5% at 0.30 wt.%. The corresponding D90 increases were 145.8% and 171.3%. In contrast, the number-weighted medians differed by less than 4%. These paired results show why a count-based median alone is insensitive to the large, connected structures that dominate graphite volume.

3.3. Graphite Volume–Concentration Signature

Total graphite fraction varied by only 0.27 percentage points: 8.56% without additional 75FeSi, 8.74% at 0.15 wt.%, and 8.83% at 0.30 wt.% (Figure 4a). Volume–concentration metrics changed much more. The largest component contained 3.42%, 20.30%, and 31.39% of total graphite volume, respectively. The ten largest components contained 14.01%, 38.44%, and 44.15%, while the largest 1% of components contained 57.97%, 68.74%, and 72.47%.
Table 3 shows three-dimensional graphite descriptors derived from the reconstructed CT volumes. The component–volume Gini coefficient increased from 0.863 without additional 75FeSi to 0.907 and 0.906 at 0.15 and 0.30 wt.%, respectively. The untreated specimen thus had a comparatively dispersed graphite volume distribution. Both additions produced concentrated distributions, and the 0.30 wt.% specimen had the largest dominant component and the further-extended upper-tail size.
The largest component share was 5.9 times the untreated value at 0.15 wt.% and 9.2 times the untreated value at 0.30 wt.%. The top-ten shares increased by 24.43 and 30.14 percentage points, respectively. Thus, the main treatment-associated difference was not the amount of graphite, which changed by only 0.27 percentage points, but the fraction of that graphite assigned to a small number of large, connected objects.

3.4. Shape Descriptors Depend on Weighting

For components of at least 27 voxels, median sphericity was high in all three specimens (0.880–0.942), reflecting the large number of small, relatively compact objects (Figure 3c). Volume weighting changed the comparison. Volume-weighted sphericity was 0.403 without additional 75FeSi and 0.286 and 0.284 at 0.15 and 0.30 wt.%, respectively. The large components that carried most graphite volume in the FeSi-containing specimens were therefore less sphere-like than the typical component.
Volume-weighted Feret elongation was 1.89, 1.78, and 1.80 at 0, 0.15, and 0.30 wt.% 75FeSi, respectively. This descriptor varied less than sphericity and the volume share metrics. The FeSi-associated signature is consequently multivariate: graphite amount, fragmentation, upper-tail size, dominance, and shape cannot be represented by one scalar.
At the primary 27-voxel cutoff, volume-weighted sphericity decreased by 29.1% at 0.15 wt.% and by 29.5% at 0.30 wt.% relative to the untreated specimen. Median sphericity did not show this separation because it weights every component equally. The difference between median and volume-weighted shape confirms that small compact objects and large irregular objects coexist within the same reconstructed volume.

3.5. FeSi-Associated Ordering Persists Across Component–Size Cutoffs

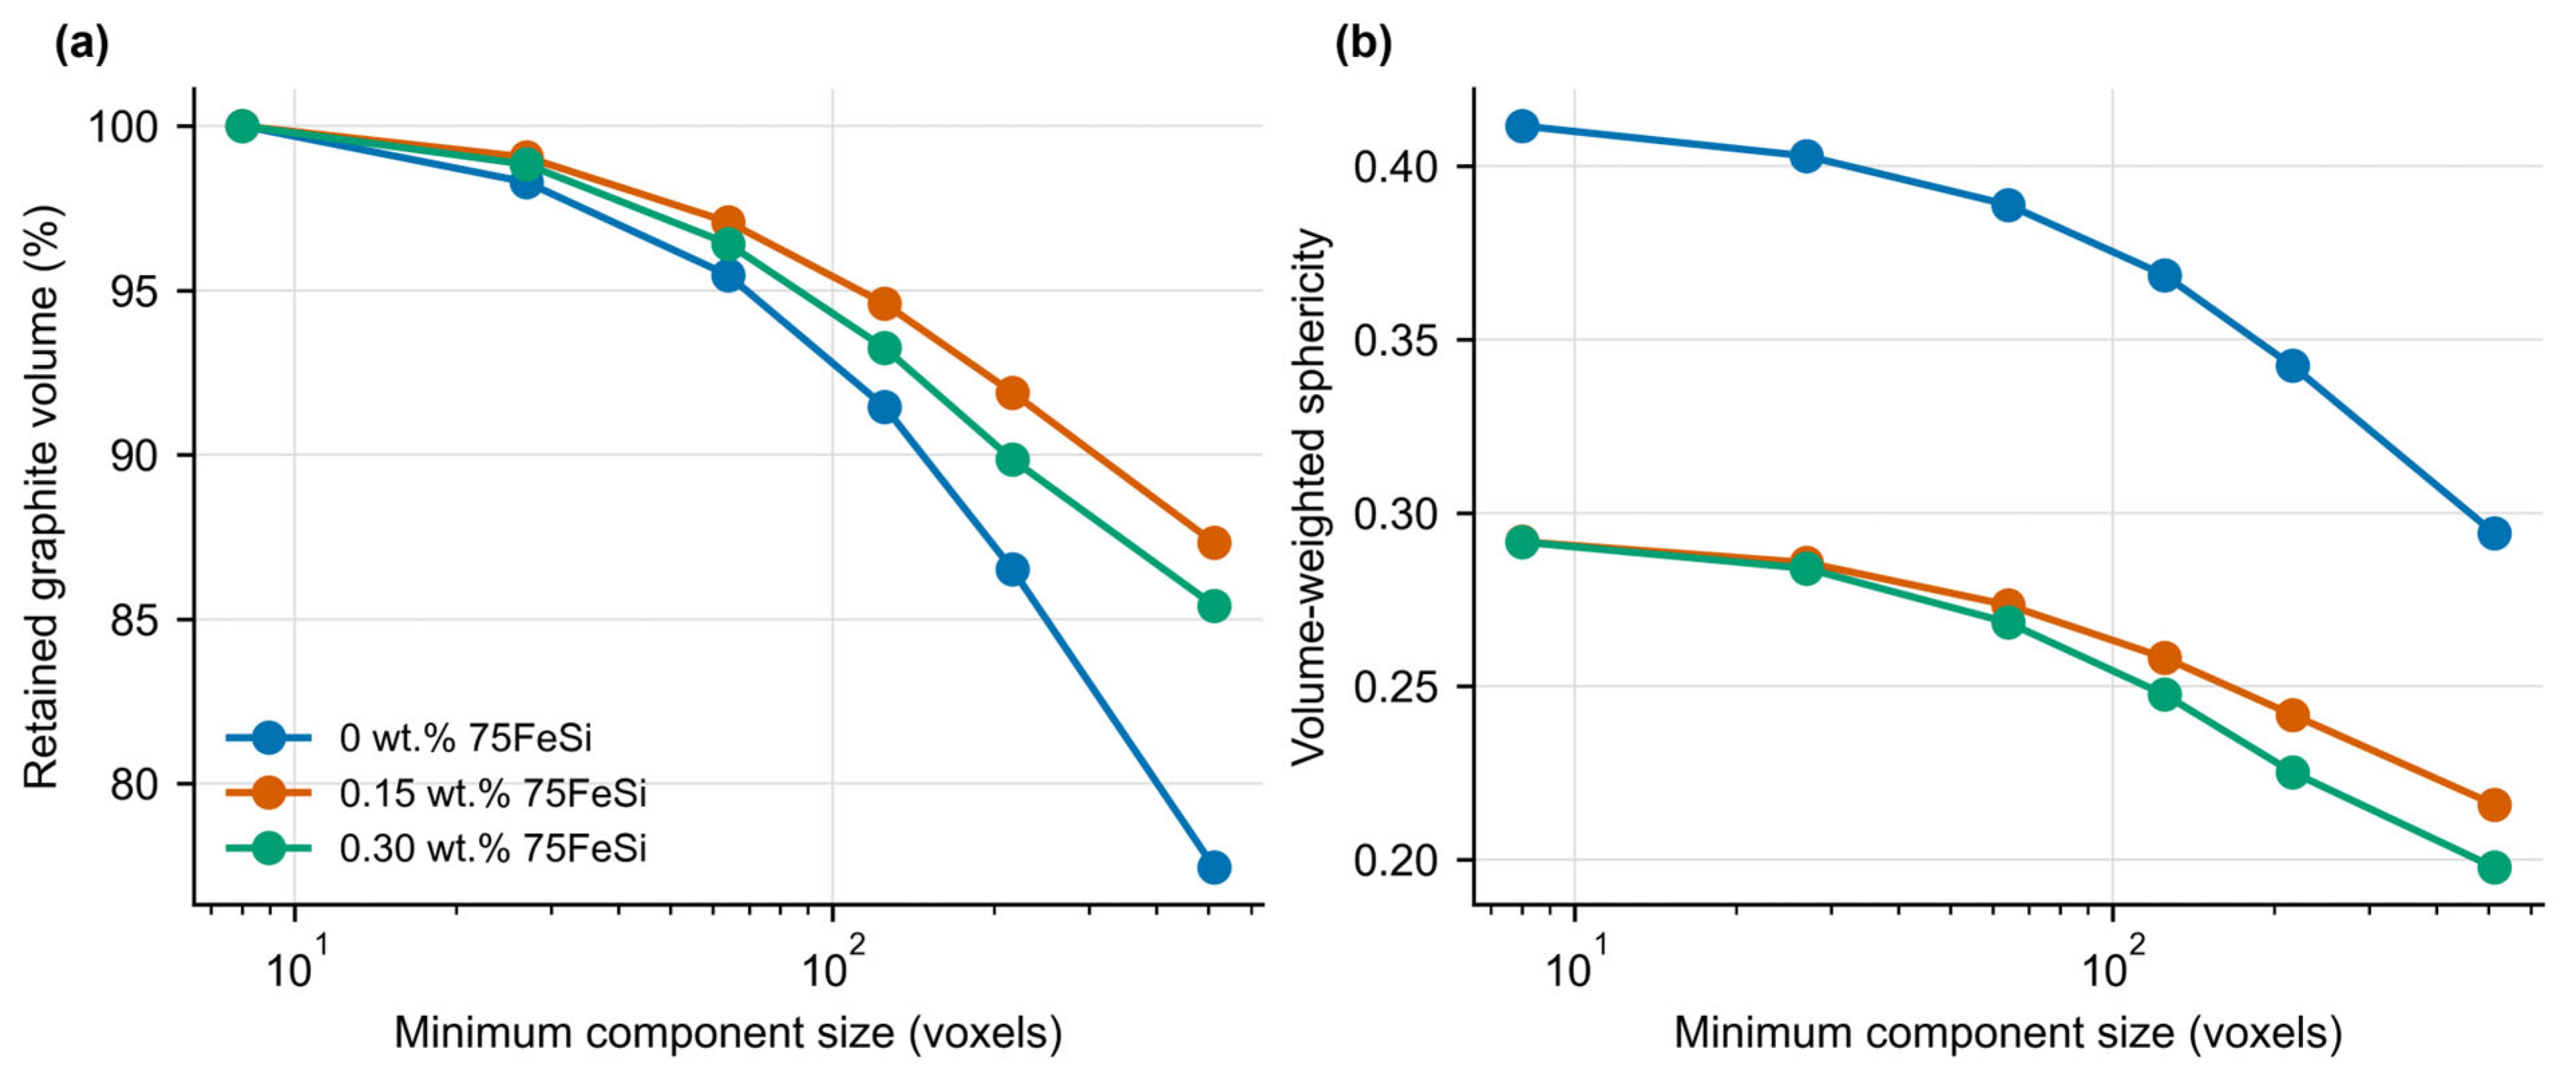
Minimum-size filtering removed a large fraction of counted objects while retaining most graphite volume (Figure 5). At 27 voxels, 98.29%, 99.05%, and 98.83% of graphite volume remained at 0, 0.15, and 0.30 wt.% 75FeSi. At 216 voxels, the retained fractions were 86.52%, 91.89%, and 89.86%; even at 512 voxels they were 77.46%, 87.33%, and 85.42%. The numerous smallest objects therefore contributed strongly to component count but only modestly to total graphite volume.
Table 4 shows the percentage change of selected descriptors relative to the 0 wt.% 75FeSi sample.The sphericity ordering was stable throughout the threshold series. At the 8-voxel cutoff, volume-weighted sphericity was 0.412 without additional 75FeSi and 0.292 for both FeSi-containing specimens. At 512 voxels, the values were 0.294, 0.216, and 0.198 for 0, 0.15, and 0.30 wt.%, respectively. Removing near-resolution components therefore reduced all values but did not remove the lower volume-weighted sphericity associated with the FeSi additions.

4. Discussion

The principal result is a separation between total graphite amount and internal graphite organization. All three center volumes contained approximately 8.6–8.8% graphite, yet D90, largest component share, and top-ten share increased markedly with 75FeSi addition. This result means that similar graphite fractions can be distributed among many comparatively small objects or concentrated into fewer large, connected structures. A two-dimensional area fraction cannot distinguish these alternatives because it does not retain connectivity through the specimen thickness.
The observed redistribution is consistent with known effects of FeSi addition. The doctoral dissertation process study and previous dual-chamber work showed that FeSi addition raises eutectic reaction temperatures, accelerates eutectic recalescence, and changes two-dimensional graphite morphology [11]. FeSi can produce Si-rich regions, reduce carbon solubility, promote graphite precipitation, and increase heterogeneous nuclei through oxide- or silicate-assisted nucleation [11]. These mechanisms explain why the amount of graphite may remain similar while the connected volume distribution changes.
Component number density and upper-tail concentration did not follow the same dose pattern. Number density reached its minimum at 0.15 wt.%, whereas D90,V and dominant object share were highest at 0.30 wt.%. This divergence suggests that fragmentation, branch coalescence, and branch thickening should be treated as separate morphological processes. A higher object count does not necessarily imply a more dispersed graphite volume if a small subset of connected objects grows disproportionately large.

4.1. Relationship to Two-Dimensional Vermicularity

Two-dimensional vermicularity increased from 71.65% without additional 75FeSi to 81.2% at 0.15 wt.% and then decreased to 79.5% at 0.30 wt.%. The three-dimensional upper-tail descriptors, by contrast, continued to increase. The two measurement families are not contradictory: vermicularity classifies profile shape on selected planes, whereas D90 and dominant-component share quantify how volume is distributed among connected objects. Their different trends indicate that one planar morphology percentage should not be used as a surrogate for three-dimensional connectivity.
The distinction provides a testable explanation for property scatter among CGI specimens with similar metallographic ratings. Large irregular graphite objects may create longer graphite–matrix interfaces and different local stress fields than a dispersed population with the same total fraction. They may also form more continuous paths for heat transport [3,4,5,14]. Prior modelling and three-dimensional morphology studies support these physical links, but the present study did not measure tensile, fatigue, fracture, damping, or thermal properties. Property consequences must therefore remain hypotheses.

4.2. Potential Applications in Foundry Characterization

A practical three-dimensional signature can be constructed from graphite volume fraction, component number density, D90,V, largest component share, component–volume Gini coefficient, and volume-weighted sphericity. These descriptors have complementary roles: fraction measures graphite amount; density measures fragmentation; D90,V and largest component share describe the volume-bearing upper tail; the Gini coefficient summarizes inequality; and volume-weighted sphericity characterizes the shape of structures that contain most graphite. Reporting the set prevents one favorable metric from masking an unfavorable change in another.
After validation, this signature could support foundry process development in three ways. First, it could compare inoculant additions and treatment windows using the internal graphite architecture rather than area fraction alone. Second, it could provide realistic geometries for finite-element or thermal transport models. Third, it could help determine why castings with similar chemical compositions and two-dimensional vermicularity show different performances. Routine production use would require a smaller validated descriptor set or a calibrated relationship between rapid thermal analysis features and the slower CT measurements.

4.3. Future Research: Linking Three-Dimensional Graphite to Properties

The next research step should test whether CGI specimens with similar two-dimensional metallography but different three-dimensional graphite distributions have different mechanical or thermal properties. The prioritized test set should include tensile strength, elastic modulus, elongation, hardness, fatigue or fracture resistance, damping, and thermal diffusivity or conductivity. D90,V, largest-object share, component–volume Gini coefficient, and volume-weighted sphericity are the descriptors most likely to correlate with mechanical localization and thermal transport because they describe the large graphite objects that carry most graphite volume.
The central analysis should treat the casting or melt as an experimental unit rather than individual graphite objects. Multivariable models could then test whether D90,V, dominant object share, Gini coefficient, or volume-weighted sphericity explains property variation after accounting for graphite fraction, vermicularity, matrix constitution, porosity, and chemistry. This design would determine whether the associations observed here are reproducible and whether three-dimensional descriptors add predictive information beyond conventional two-dimensional measurements.
A second direction is intervention rather than prediction. FeSi amount, inoculant particle size, addition position, residual magnesium, sulfur, oxygen activity, cooling rate, pouring temperature, and melt chemistry could be varied systematically to determine whether graphite upper-tail size and connectivity can be controlled. These factors also define the expected generality of the present observation: the measured redistribution applies directly to the reported CGI composition, cored-wire treatment, specimen geometry, and 75FeSi-in-cavity addition method, while other melts or pouring practices require replicated validation.

4.4. Limitations

Five limitations define the scope of this study. First, one center CT specimen represents each addition, so between-casting variability and statistical dose response cannot be estimated. Second, the reconstructed field covered only part of each 2 mm cube; future work should record the specimen mask and field position used for volume normalization. Third, the retained sessions lack the original Xradia acquisition and reconstruction settings. Fourth, topology depends on segmentation threshold, filtering, hole filling, and connectivity rules; the archived records did not retain a full segmentation-parameter scan, so the cutoff analysis addresses small components but not alternative intensity thresholds. Fifth, the 75FeSi additions were treatments within thermal analysis specimens and should not be interpreted as bulk additions to the entire production melt. These limitations do not alter the measured within-volume descriptors but restrict causal and production-scale generalization.

5. Conclusions

  • Center specimens from actual spherical production thermal analysis castings showed that 75FeSi placed in the specimen cavity changed three-dimensional graphite organization more strongly than total graphite amount.
  • Graphite fraction remained within 8.56–8.83%, while volume-weighted D90 increased from 185 µm without additional 75FeSi to 455 and 502 µm at 0.15 and 0.30 wt.%, respectively.
  • Largest component share increased from 3.42% to 20.30% and 31.39%, and both FeSi-containing specimens had greater component–volume inequality and lower volume-weighted sphericity.
  • The separation persisted across 8-512-voxel cutoffs, confirming that it was not created solely by near-resolution objects. The descriptor set therefore complements two-dimensional vermicularity by quantifying the graphite structures that carry most of the graphite volume.
  • The study does not establish a causal process-property relationship because each addition is represented by one CT specimen and no mechanical properties were measured. Replicated casting, paired two-dimensional and three-dimensional characterization, and mechanical and thermal testing are required to determine whether controlling graphite upper-tail size and connectivity provides a route to controlling CGI performance.

Author Contributions

Conceptualization, D.S.; validation, Z.L. and K.K.; formal analysis, Z.L. and K.K.; data curation, Z.L. and K.K.; writing—original draft preparation, Z.L.; writing—review and editing, D.S., Z.L. and K.K. All authors have read and agreed to the published version of the manuscript.

Funding

This research was funded by the Science and Technology Research Program of Chongqing Municipal Education Commission (Grant No. KJQN202404511).

Data Availability Statement

The original contributions presented in this study are included in the article. Further inquiries can be directed to the corresponding author.

Acknowledgments

During preparation of this manuscript, the authors used OpenAI Chatgpt 5.5 for language revision. The authors reviewed and edited all output and take full responsibility for the content of this publication.

Conflicts of Interest

The authors declare no conflicts of interest. The funder had no role in study design, data collection, analysis, interpretation, manuscript preparation, or the decision to publish.

Glossary and Abbreviations

TermDefinition/physical meaning
CGICompacted graphite iron.
CTComputed tomography; here, X-ray micro-computed tomography.
ROIRegion of interest; the segmented graphite phase stored in Dragonfly.
Archived volumetric datasetDragonfly data file containing reconstructed volume, ROI intervals, labels, and scalar fields.
Connected objectA contiguous segmented graphite volume; connected branches are counted as one object.
CCDFComplementary cumulative distribution function; fraction of objects above a given diameter.
D50Median equivalent diameter of connected objects when each object has equal weight.
D50,V/D90,VVolume-weighted equivalent diameters at 50% and 90% cumulative graphite volume.
Connected object number densityNumber of active connected graphite objects per reconstructed mm3.
Largest-object sharePercentage of total graphite volume contained in the largest connected object.
Gini coefficientSorted-volume inequality descriptor; higher values indicate stronger graphite volume concentration.
Volume-weighted sphericitySphericity averaged with object volume weights, emphasizing graphite objects that carry most volume.
Retained component fractionFraction of active connected objects remaining after applying a minimum-size cutoff.

References

  1. Liu, Z.; Li, W.; Yin, Y.; Shen, X.; Ji, X.; Yan, Q.; Zhang, L.; Zhou, J. Investigation on the effect of Mg on the 3D graphite morphology in cast iron via X-ray tomography. Mater. Charact. 2026, 231, 115890. [Google Scholar] [CrossRef] [Scilit]
  2. Shi, G.Q.; Yang, Z.; Li, J.P.; Tao, D.; Ma, Z.J. Investigation on the graphite nucleation and growth mechanism of compacted graphite iron. J. Mater. Res. Technol. 2020, 9, 8186–8196. [Google Scholar] [CrossRef] [Scilit]
  3. Cao, M.; Baxevanakis, K.P.; Silberschmidt, V.V. Effect of graphite morphology on the thermomechanical performance of compacted graphite iron. Metals 2023, 13, 473. [Google Scholar] [CrossRef] [Scilit]
  4. Zou, C.; Zhao, Y.; Zhu, G.; Pang, J.; Wang, S.; Liu, Y.; Liu, F.; Li, S.; Zhang, Z. Investigation of material properties based on 3D graphite morphology for compacted graphite iron. Acta Metall. Sin. 2024, 37, 1077–1086. [Google Scholar] [CrossRef] [Scilit]
  5. Jiang, A.; Shao, A.; Song, L.; Hua, M.; Zheng, H.; Zhang, X.; Tian, X.; Lin, X. A new theoretical method for studying effects of microstructure on effective thermal conductivity of vermicular graphite cast iron. Materials 2023, 16, 2158. [Google Scholar] [CrossRef] [Scilit] [PubMed]
  6. Chuang, C.; Singh, D.; Kenesei, P.; Almer, J.; Hryn, J.; Huff, R. 3D quantitative analysis of graphite morphology in high strength cast iron by high-energy X-ray tomography. Scr. Mater. 2015, 106, 5–8. [Google Scholar] [CrossRef] [Scilit]
  7. Yin, Y.; Tu, Z.; Zhou, J.; Zhang, D.; Wang, M.; Guo, Z.; Liu, C.; Chen, X. 3D quantitative analysis of graphite morphology in ductile cast iron by X-ray microtomography. Metall. Mater. Trans. A 2017, 48, 3794–3803. [Google Scholar] [CrossRef] [Scilit]
  8. Salomonsson, K.; Jarfors, A.E.W. Three-dimensional microstructural characterization of cast iron alloys for numerical analyses. Mater. Sci. Forum 2018, 925, 427–435. [Google Scholar] [CrossRef] [Scilit]
  9. Stefanescu, D.M.; Suarez, R.; Kim, S.B. 90 years of thermal analysis as a control tool in the melting of cast iron. China Foundry 2020, 17, 69–84. [Google Scholar] [CrossRef] [Scilit]
  10. Jiang, A.; Tian, X.; Song, H.; Gao, G.; Wu, Q.; Shi, D.; Xu, Z.; Wu, Y. Evaluation of vermicularity of compacted graphite iron based on multiple characteristic points of thermal analysis. Mater. Trans. 2021, 62, 675–679. [Google Scholar] [CrossRef] [Scilit]
  11. Shi, D.; Liu, Z.; Gao, G.; Feng, Y. Effect of FeSi additive in dual-chamber sample cup on thermal analysis characteristic values and vermiculating rate of compacted graphite iron. China Foundry 2024, 21, 91–100. [Google Scholar] [CrossRef] [Scilit]
  12. Mori, F.; Ötting, M.; Tonn, B. Objective description of graphite morphology in ductile cast iron by numerical geometric parameters. Int. J. Met. 2026, 20, 1922–1935. [Google Scholar] [CrossRef] [Scilit]
  13. Liu, Z.; Shi, D.; Gao, G.; Feng, Y. Mechanism of shrinkage in compacted graphite iron and prediction of shrinkage tendency. Materials 2022, 15, 8413. [Google Scholar] [CrossRef] [Scilit] [PubMed]
  14. Tao, J.; Jiang, Y.; Xie, S.; Wang, Y.; Zhou, Z.; Fu, L.; Mao, C.; Li, L.; Huang, J.; Liu, S. Unveiling the role of graphite morphology in ductile iron: A 3D FEM-based micromechanical framework for damage evolution and mechanical performance prediction. Materials 2025, 18, 5128. [Google Scholar] [CrossRef] [Scilit] [PubMed]
  15. Wigger, T.; Andriollo, T.; Xu, C.; Clark, S.J.; Gong, Z.; Atwood, R.C.; Hattel, J.H.; Tiedje, N.S.; Lee, P.D.; Azeem, M.A. In situ synchrotron investigation of degenerate graphite nodule evolution in ductile cast iron. Acta Mater. 2021, 221, 117367. [Google Scholar] [CrossRef] [Scilit]
  16. Cerqueira, F.A.; Nishikawa, A.S.; Guesser, W.L.; Azevedo, C.R.F. Three-dimensional reconstruction of compacted graphite in vermicular cast iron by manual serial sectioning. Rem Rev. Esc. Minas 2015, 68, 307–312. [Google Scholar] [CrossRef] [Scilit]
  17. Withers, P.J.; Bouman, C.; Carmignato, S.; Cnudde, V.; Grimaldi, D.; Hagen, C.K.; Maire, E.; Manley, M.; du Plessis, A.; Stock, S.R. X-ray computed tomography. Nat. Rev. Methods Primers 2021, 1, 18. [Google Scholar] [CrossRef] [Scilit]
  18. Ribeiro, B.C.M.; Rocha, F.M.; Andrade, B.M.; Lopes, W.; Corrêa, E.C.S. Influence of different concentrations of silicon, copper and tin in the microstructure and in the mechanical properties of compacted graphite iron. Mater. Res. 2020, 23, e20190678. [Google Scholar] [CrossRef] [Scilit]
Figure 1. Experimental workflow from spherical thermal analysis casting to three-dimensional graphite descriptors. The three 2 mm cubic coupons were removed from the sphere centers and examined using a ZEISS Xradia 620 Versa.
Metals 16 00806 g001
Figure 2. Representative center sections through the reconstructed CGI thermal analysis specimens with decoded graphite ROIs overlaid in yellow and 200 µm scale bars: (a) 0 wt.% 75FeSi; (b) 0.15 wt.% 75FeSi; (c) 0.30 wt.% 75FeSi.
Metals 16 00806 g002
Figure 3. Component-level distributions for the three 75FeSi additions: (a) number-based complementary cumulative distribution of equivalent diameter; (b) cumulative graphite volume versus equivalent diameter; (c) number density distribution of sphericity for components containing at least 27 voxels; (d) Feret elongation versus equivalent diameter.
Metals 16 00806 g003
Figure 4. Specimen-level graphite volume-partitioning descriptors at 0, 0.15, and 0.30 wt.% 75FeSi: (a) graphite volume fraction; (b) connected-component number density; (c) volume-weighted median and D90 equivalent diameters; (d) graphite volume shares in the largest component, ten largest components, and largest 1% of components.
Metals 16 00806 g004
Figure 5. Sensitivity to minimum connected-component size for specimens containing 0, 0.15, and 0.30 wt.% 75FeSi: (a) retained graphite volume; (b) volume-weighted sphericity for cutoffs from 8 to 512 voxels.
Metals 16 00806 g005
Table 1. Nominal chemical composition range of the production CGI melt (wt.%).
CSiMnSPCuMgRESnFe
3.7–3.82.0–2.4≤0.60.01–0.02≤0.060.3–0.60.010–0.0180.01–0.020.04–0.08Balance
Table 2. Experimental design, specimen mapping, and reconstructed CT fields.
75FeSi (wt.%)SessionPositionCT CouponVoxel (µm)Matrix (Voxels)
01-1Sphere center2 mm cube3.0485 × 518 × 528
0.151-2Sphere center2 mm cube3.0519 × 533 × 509
0.301-3Sphere center2 mm cube3.0542 × 527 × 510
Table 3. Three-dimensional graphite descriptors derived from the reconstructed CT volumes.
Metric0 wt.% 75FeSi0.15 wt.% 75FeSi0.30 wt.% 75FeSi
Analyzed volume (mm3)3.5823.8023.933
Graphite volume fraction (%)8.5588.7458.830
Active component count34,97121,81626,958
Component density (mm−3)976457396854
Number-weighted D50 (µm)13.0413.5313.34
Volume-weighted D50 (µm)78.16109.59128.61
Volume-weighted D90 (µm)184.97454.68501.90
Largest component share (%)3.4220.3031.39
Top-ten component share (%)14.0138.4444.15
Top-1% component share (%)57.9768.7472.47
Component–volume Gini coefficient0.8630.9070.906
Volume-weighted sphericity (≥27 voxels)0.4030.2860.284
Volume-weighted Feret elongation (≥27 voxels)1.8861.7841.804
Table 4. Percent changes in selected descriptors relative to the 0 wt.% 75FeSi specimen.
Descriptor0.15 wt.% 75FeSi0.30 wt.% 75FeSi
Graphite volume fraction+2.2%+3.2%
Connected object number density−41.2%−29.8%
Volume-weighted D50+40.2%+64.5%
Volume-weighted D90+145.8%+171.3%
Largest-object share+493.6%+817.8%
Top-ten object share+174.4%+215.1%
Gini coefficient+5.1%+5.0%
Volume-weighted sphericity−29.1%−29.5%
Disclaimer/Publisher’s Note: The statements, opinions and data contained in all publications are solely those of the individual author(s) and contributor(s) and not of MDPI and/or the editor(s). MDPI and/or the editor(s) disclaim responsibility for any injury to people or property resulting from any ideas, methods, instructions or products referred to in the content.