Article

Research on Parameter Formulation Strategy of Asymmetric Four-Point Bending Progressive Process for LSAW Pipes

1
School of Intelligent Manufacturing, Luoyang Institute of Science and Technology, Luoyang 471023, China
2
He’nan Institute of Metallurgy Co., Ltd., Zhengzhou 450000, China
*
Author to whom correspondence should be addressed.
Metals 2026, 16(7), 803; https://doi.org/10.3390/met16070803
Submission received: 23 June 2026 / Revised: 15 July 2026 / Accepted: 16 July 2026 / Published: 17 July 2026

Abstract

The current progressive forming process for large-scale longitudinally submerged arc-welded (LSAW) pipes is continuously losing competitiveness in terms of manufacturing quality and production efficiency. Based on the asymmetric four-point bending (AFB) mechanical model and classical elastic–plastic bending theory, in this paper, we investigate sheet bending behavior during the four-point bending stage. Analytical expressions are derived for the main influencing factors during the forming and springback process. Finite element simulation and experimental research into the mechanical model are conducted to analyze the effects of various process parameters on the forming results. On this basis, an AFB progressive forming process parameter formulation strategy is established and programmed. Experiments and simulations were conducted using the process parameters formulated by this strategy. The results showed that pipes could complete the progressive forming process in fewer passes, thereby improving production efficiency. The ovality of most experimental pipes was less than 1.5% and consistently below 0.7% in simulations—significantly lower than the engineering requirement of 2%. These results demonstrate the feasibility and reliability of the strategy, highlight the significant improvement in pipe quality achieved through the AFB process, and lay a solid foundation for the development and intelligentization of future progressive forming processes for LSAW pipes.

1. Introduction

Long-distance oil and gas transmission pipelines are key energy transportation infrastructure. LSAW pipes, as their core components, have a market size exceeding 15 billion US dollars, with sustained strong demand for steel pipes. However, under the technical trends of increasing pipeline diameter, higher transmission pressure, and improved steel grade, their manufacturing quality and production efficiency are facing increasingly severe challenges [1,2,3,4].
In the progressive forming process, also known as the JCO forming process, a steel sheet is gradually formed into a J-shape, then a C-shape, and finally an O-shape through three-point bending. This process has been extensively applied in developing countries due to its advantages of low investment, minimal equipment requirements, and lack of dedicated molds [5,6]. This process can produce LSAW pipes with an outer diameter ranging from 406 to 1524 mm, wall thicknesses from 6 to 40 mm, and steel grades from API 5L X52 to X80, which can effectively meet the manufacturing requirements for high-grade and thick-walled pipes. However, the progressive forming process, while providing equipment flexibility, incurs a cost in terms of production efficiency. Therefore, how to reduce forming passes and improve production efficiency while ensuring form quality is a key problem that needs to be urgently addressed [7,8].
At present, most enterprises adopt the JCO forming process, which is a three-point bending progressive forming method and requires dozens of stepwise bending operations. This method experiences drawbacks such as a large number of forming passes, low production efficiency, long residual straight segments, poor shape accuracy of the pipe, and high residual stress. To improve the shape accuracy, mechanical expansion treatment is still required for the welded pipe, which is prone to enlarging internal microstructural defects [9]. All these issues severely restrict the further development of the JCO forming process. Some scholars have conducted local optimizations on the JCO forming process to enhance product quality, but they have not fundamentally altered the mechanical mode of the three-point bending progressive forming process [10,11,12].
Therefore, some scholars have proposed a four-point bending forming process, which exhibits a more uniform moment distribution in sheet metal bending. This process allows for the formation of pipes with fewer passes, thereby improving production efficiency and shape accuracy. Zhao et al. [13] proposed a new four-point bending JCOC forming process and pointed out that friction is the main influencing factor causing uneven curvature distribution. Zhang et al. [14] established the correlation between four-point bending forming process parameters and the final forming quality. Song et al. [15,16] studied the new four-point bending JCO forming process and developed the corresponding CAPP system. Zhai et al. [17] researched the process planning for the four-point bending forming process for Q355D structural steel. Wen et al. [18] optimized pass scheduling based on the forming width of a single pass. The aforementioned studies primarily focus on symmetric four-point bending, where the contact conditions between both ends of the sheet and the die are identical, and the bending moments are symmetrically distributed about the symmetry axis. Although this method improves the uniformity of the bending moment distribution to some extent, the residual straight segments remain difficult to effectively eliminate during the forming process.
Meanwhile, asymmetric bending, as an important mechanical characteristic in JCO forming, has also attracted the attention of some scholars. Fan et al. [19] studied the asymmetric bending characteristics of the JCO forming process for LSAW pipes. Yang [20] provided a quantitative relationship between the reduction and the forming angle. Li et al. [21] studied the effect of the die radius on the quality of LSAW pipes produced by the JCO forming process. Based on the symmetric four-point bending process and asymmetric bending, Zhang et al. [22] proposed an AFB forming process, which significantly improved the forming quality of the LSAW pipes. These studies have remained focused on the analysis of existing asymmetric bending phenomena, without systematically constructing a system for formulating forming process parameters by treating asymmetric bending as a process strategy.
Based on the current research status and technical requirements, this paper takes the AFB JCO progressive forming process in LSAW pipes as the research object. Starting with the establishment of the AFB mechanical model, systematic theoretical analysis, simulation verification, and experimental research are conducted successively. Firstly, based on classical elasto-plastic bending theory, the unique mechanical behavior rules of the AFB mechanical model are analyzed. Analytical expressions are derived for key process parameters such as the bending moment, bending force, radius of curvature, forming angle, deflection distribution, and amount of reduction during the forming process. Additionally, quantitative analysis of the springback process is conducted using the small curvature plane springback theory [23]. Subsequently, the influence of various process parameters on the forming results is analyzed through finite element simulation and experimental methods. On this basis, a strategy for determining the parameters of the AFB progressive forming process is established, which is then programmed into an applicable process planning tool. Finally, the correctness of the mechanical model and the reliability of the process parameter formulation strategy are comprehensively verified through simulation and experimentation. Key indicators such as ovality, residual straight segment length, and forming passes are focally examined. This provides a theoretical basis and technical support for the future development and intelligent upgrading of the progressive forming process for LSAW pipes.

2. Analysis of the Four-Point Bending Stage in the AFB Forming Process

2.1. Mechanical Analysis of the Four-Point Bending Stage in the AFB Forming Process

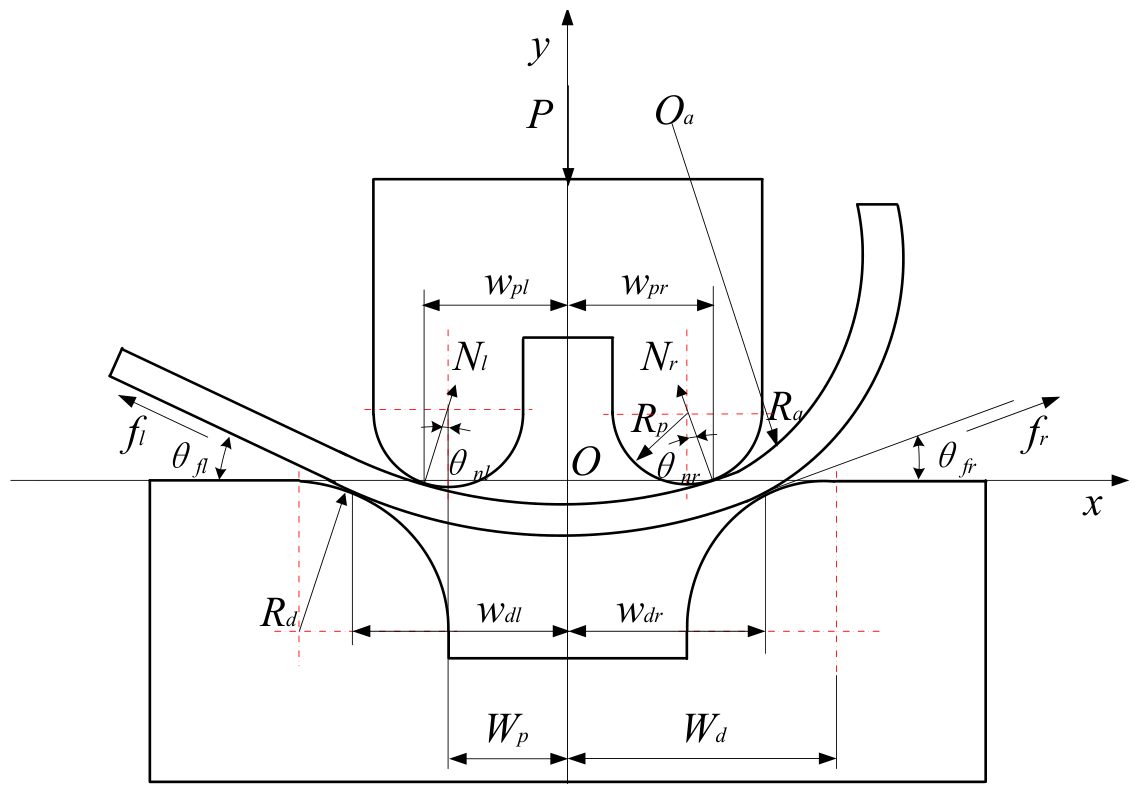
Since the required forming result under the AFB process occurs after the springback of the four-point bending stage of the sheet, only this stage was analyzed. After the sheet forming begins, as the punch starts to descend and both the left and right punches come into contact with the sheet, the sheet enters a four-point bending state, as shown in Figure 1.
Assuming the upper plane of the die is the X-axis and the symmetry axis of the mold is the Y-axis, in the initial state of AFB forming, the dies are symmetrically placed on both sides of the Y-axis. However, the left side of the sheet contacts the die with a straight segment, while the right side is an arc segment with a uniform curvature that does not contact the die. The radius of the right arc segment is R b , and the distance from the Y-axis to the transition point between the straight segment and the arc segment is a .
To facilitate the analysis of the forming process, the material deformation behavior should conform to the following basic assumptions.
  • Bending Assumption: The transverse shear strain is neglected during the bending process.
  • Neutral Layer Coincidence Hypothesis: During the deformation process, the strain neutral layer, stress neutral layer, and geometric neutral layer always coincide.
  • The bilinear hardening material model assumes that, within the range of small plastic deformations, the hardening curve is approximated by a straight line. The relationship between strain and stress conforms to the following:
σ = E ε ε σ s / E D ε + σ 0 ε > σ s / E
σ 0 = 1 D / E σ s
where E is Young’s modulus, σs is the yield stress, σ0 is the intercept stress, and D is the plastic tangent modulus.
4.
Plane Section Assumption: Any plane section remains planar and undistorted after deformation, thereby resulting in a linear strain distribution across any section, which can be expressed as follows:
ε = z ρ
where ε is strain, z is the distance from the neutral layer, and ρ is the curvature of the neutral layer after loading.
Let the angle between the friction force f l on the left side of the sheet and the X-axis be θ f l , and the angle between the friction force f r on the right arc section and the X-axis be θ f r . Then, at this time, the angle between the reaction force N l of the left punch and the Y-axis is θ p l , and the angle between the reaction force N r of the right punch and the Y-axis is θ p r .
It can be derived that
w d l = W d R d + t / 2 sin   θ f l
w d r = W d R d + t / 2 sin   θ f r
w p l = W p + R p + t / 2 sin   θ p l
w p r = W p + R p + t / 2 sin   θ p r
N l = P sin   θ f r sin   θ f l cos   θ p r + sin   θ f r cos   θ p l
N r = P sin   θ f l sin   θ f l cos   θ p r + sin   θ f r cos   θ p l
f l = μ N l
f r = μ N r
where t is the thickness of a sheet, P is the total forming force located on the axis of symmetry of the punch, R p is the radius of the fillet on both sides of the punch, R d is the radius of the fillet on both sides of the die, W d is the x-coordinate of the center of the left die, W p is the x-coordinate of the center of the left punch, w p r is the x-coordinate of the right punch contact point, w p l is the x-coordinate of the left punch contact point, w d r is the x-coordinate of the right die contact point, and w d l is the x-coordinate of the left die contact point.
The bending moment at a point P x , y on the neutral layer is M x as follows [22]:
M x = N l w d l x cos   θ f l μ N l w d l + x sin   θ f l + R d + t 2 cos   θ f l 1 cos   θ f l S cos   θ f l x w d l , w p l N l w d l w p l cos   θ f l μ N l w d l + w p l + 2 x W d + W p sin   θ p l + 2 R d + t cos   θ f l 1 cos   θ p l 2 S cos   θ p l x w p l , 0 N r w d r w p r cos   θ f r μ N r w d r + w p r 2 x W d + W p sin   θ p r + 2 R d + t cos   θ f r 1 cos   θ p r 2 S cos   θ p r x 0 , w p r N r w d r x cos   θ f r μ N r w d r x sin   θ f r + R d + t 2 cos   θ f r 1 cos   θ f r S cos   θ f r x w p r , w d r
In the above equation,
S = R d + t 2 cos   θ f l 1 + w p l + x tan   θ f l x w d l , w p l R T l + R d + t 2 cos   θ p l 1 w d l w p l tan   θ p l + R T l R T l 2 x 2 x w p l , 0 R T r + R d + t 2 cos   θ p r 1 w d r w p r tan   θ p r + R T r R T r 2 x 2 x 0 , w p r R d + t 2 cos   θ f r 1 + w p r x tan   θ f r x w p r , w d r
R T l = w d l sin   θ p l + R p + t 2
R T r = w d r sin   θ p r + R p + t 2
During the forming process, the sheet between the contact points of the left and right punch enters an elasto-plastic bending state. Let P s l ( x s l , y s l ) be the elasto-plastic boundary point between the left die contact point and the left punch contact point, and P s r ( x s r , y s r ) be the elasto-plastic boundary point between the right punch contact point and the right die contact point.
Then, the bending moments at the two boundary points are the elastic limit bending moments.
M lim = E I ρ lim = E I E t 2 σ s = 2 σ s I t
Here, ρ lim is the radius of the sheet when it reaches the elastic limit state and M lim is the bending moment of the sheet when it reaches the elastic limit state.
When x x s l , x s r , there is
M x M lim
Substituting Equation (16) into Equation (12) allows for the calculation of x s 1 ,   x s 2 . At this point, x w d l , x s l and x x s r , w d r represent the elastic deformation region, and x x s l , x s r represents the elasto-plastic deformation region.
This is due to
1 ρ x = M x E I
where ρ x is the radius of the neutral layer at point P x , y .
According to the definition of curvature,
1 ρ x = K x = y 1 + y 2 3 2
Then, the rotation angle α x at point P x , y is
1 ρ x = cos   α x d α x d x
Since the sheet in regions x w d l , x s l and x x s r , w d r is in a fully elastic bending state, it can be determined in combination with boundary conditions θ x | x = w d l = θ f l , θ x | x = w d r = θ f r , and Equation (12) as follows:
θ x = θ f l arcsin w d l x M x E I d x x w d l , x s l
θ x = θ f r arcsin x w d r M x E I d x x x s r , w d r
The bending moment of the sheet in region x x s l , x s r is
M x =   σ ν d A = 2 0 a b E ε ν d ν + 2 a t 2 b σ 0 + D ε ν d ν =   2 E b ε s 3 3 σ 0 b ε s 2 2 D b ε s 3 3 ρ x 2 + σ 0 b t 2 4 + D b t 3 12 ρ x
where b is the width of a sheet, ν is the distance from the point where the bending moment is calculated to the neutral layer, and ε s is the strain at which the sheet reaches its elastic limit state.
By combining Equations (12) and (20) along with boundary conditions θ x | x = x s l = θ x s l and θ x | x = x s r = θ x s r at the left and right die contact points, it can be obtained that
θ x = θ x s l arcsin x s l x 1 ρ x d x x x s l , w p l θ w p l arcsin w p l x 1 ρ x d x x w p l , 0 θ w p r arcsin x w p r 1 ρ x d x x 0 , w p r θ x s r arcsin x x s r 1 ρ x d x x w p r , x s r
Furthermore,
y | x = w d l = R d + t 2 cos   θ f l 1
y | x = w d r = R d + t 2 cos   θ f r 1
The y-coordinate of any point on the neutral layer of the sheet can be calculated by combining this with Equation (24).
y = R d + t 2 cos   θ f l 1 w d l x tan   θ x d x x w d l , 0 R d + t 2 cos   θ f r 1 x w d r tan   θ x d x x 0 , w d r
At this point, the reduction h of the punch is
h = R p R d + t 2 cos   θ f l 1 + w d l x tan   θ x d x R p + t 2 cos   θ f l
If the sheet is unloaded at this point, the sheet in regions x w d l , x s l and x x s r , w d r undergoes elastic bending and returns to its undeformed state after springback. In contrast, the sheet in region x x s l , x s r undergoes elastic–plastic deformation. According to the springback equation of small curvature plane bending [23], the relationship between the radius ρ x u of point P x , y after springback and the radius ρ x before springback is as follows:
1 ρ x u = ϕ l 1 x , p N l w d l x E I cos   θ f l μ N l w d l + x sin   θ f l + R d + t 2 cos   θ f l 1 cos   θ f l S cos   θ f l E I x x s l , w p l ϕ l 2 x , p N l w d l w p l E I cos   θ f l μ N l w d l + w p l + 2 x tan   θ p l + 2 R d + t cos   θ f l 1 2 S W d W p tan   θ p l E I cos   θ p l x w p l , 0 ϕ r 2 x , p N r w d r w p r E I cos   θ f r μ N r w d r + w p r 2 x tan   θ p r + 2 R d + t cos   θ f r 1 2 S W d W p tan   θ p r E I cos   θ p r x 0 , w p r ϕ r 1 x , p N r w d r x E I cos   θ f r μ N r w d r x sin θ f r + R d + t 2 cos   θ f r 1 cos   θ f r S cos   θ f r E I x w p r , x s r
By combining Equation (20) and θ x s 0 u = 0 , the rotation angle at each point after springback can be determined as
θ x u = arcsin x x s 0 1 ρ x u d x x x s l , x s 0 arcsin x s 0 x 1 ρ x u d x x x s 0 , x s r
The deflection and longitudinal coordinate y u after springback can be derived using Equations (27) and (30).
y x u = x s l x tan   θ x u d x + y x u | x = x s l x x s l , 0 x x s r tan   θ x u d x + y x u | x = x s r x 0 , x s r

2.2. Finite Element Model and Experimental System

Finite element simulation and experimental analysis of the process were conducted to fully understand the influence of various process parameters on the forming results of the AFB process and to better establish a strategy for determining the process parameters.
Zhang et al. [22] analyzed the radius R b of the arc segment and the horizontal distance a from the Y-axis to the transition point between the straight segment and the arc segment, and the established mechanical model indicates that the uneven moment distribution during the AFB forming process is primarily caused by the friction coefficient μ , punch and die spacing, and punch span W p and die span W d . Therefore, simulations and experiments were conducted with different values of the above process parameters under the other parameter settings of R b = 250   mm , a = 50   mm , and t = 4 mm. The analysis focused on their effects on the bending force, bending angle, and relative gap Δ R . The relative gap Δ R is defined as the ratio of the gap between the circle formed by extending the left and right ends of the springback-formed sheet contour, and the target radius of the pipe. One of the most important quality indicators of LSAW pipes is ovality. In addition to the bending angle, the unevenness of the curvature distribution is a critical factor affecting ovality. The relative gap Δ R can reflect the non-uniformity of the curvature distribution. Therefore, studies were conducted on the influence of various process parameters on the relative gap.

2.2.1. Material Property Parameters and Process Parameters

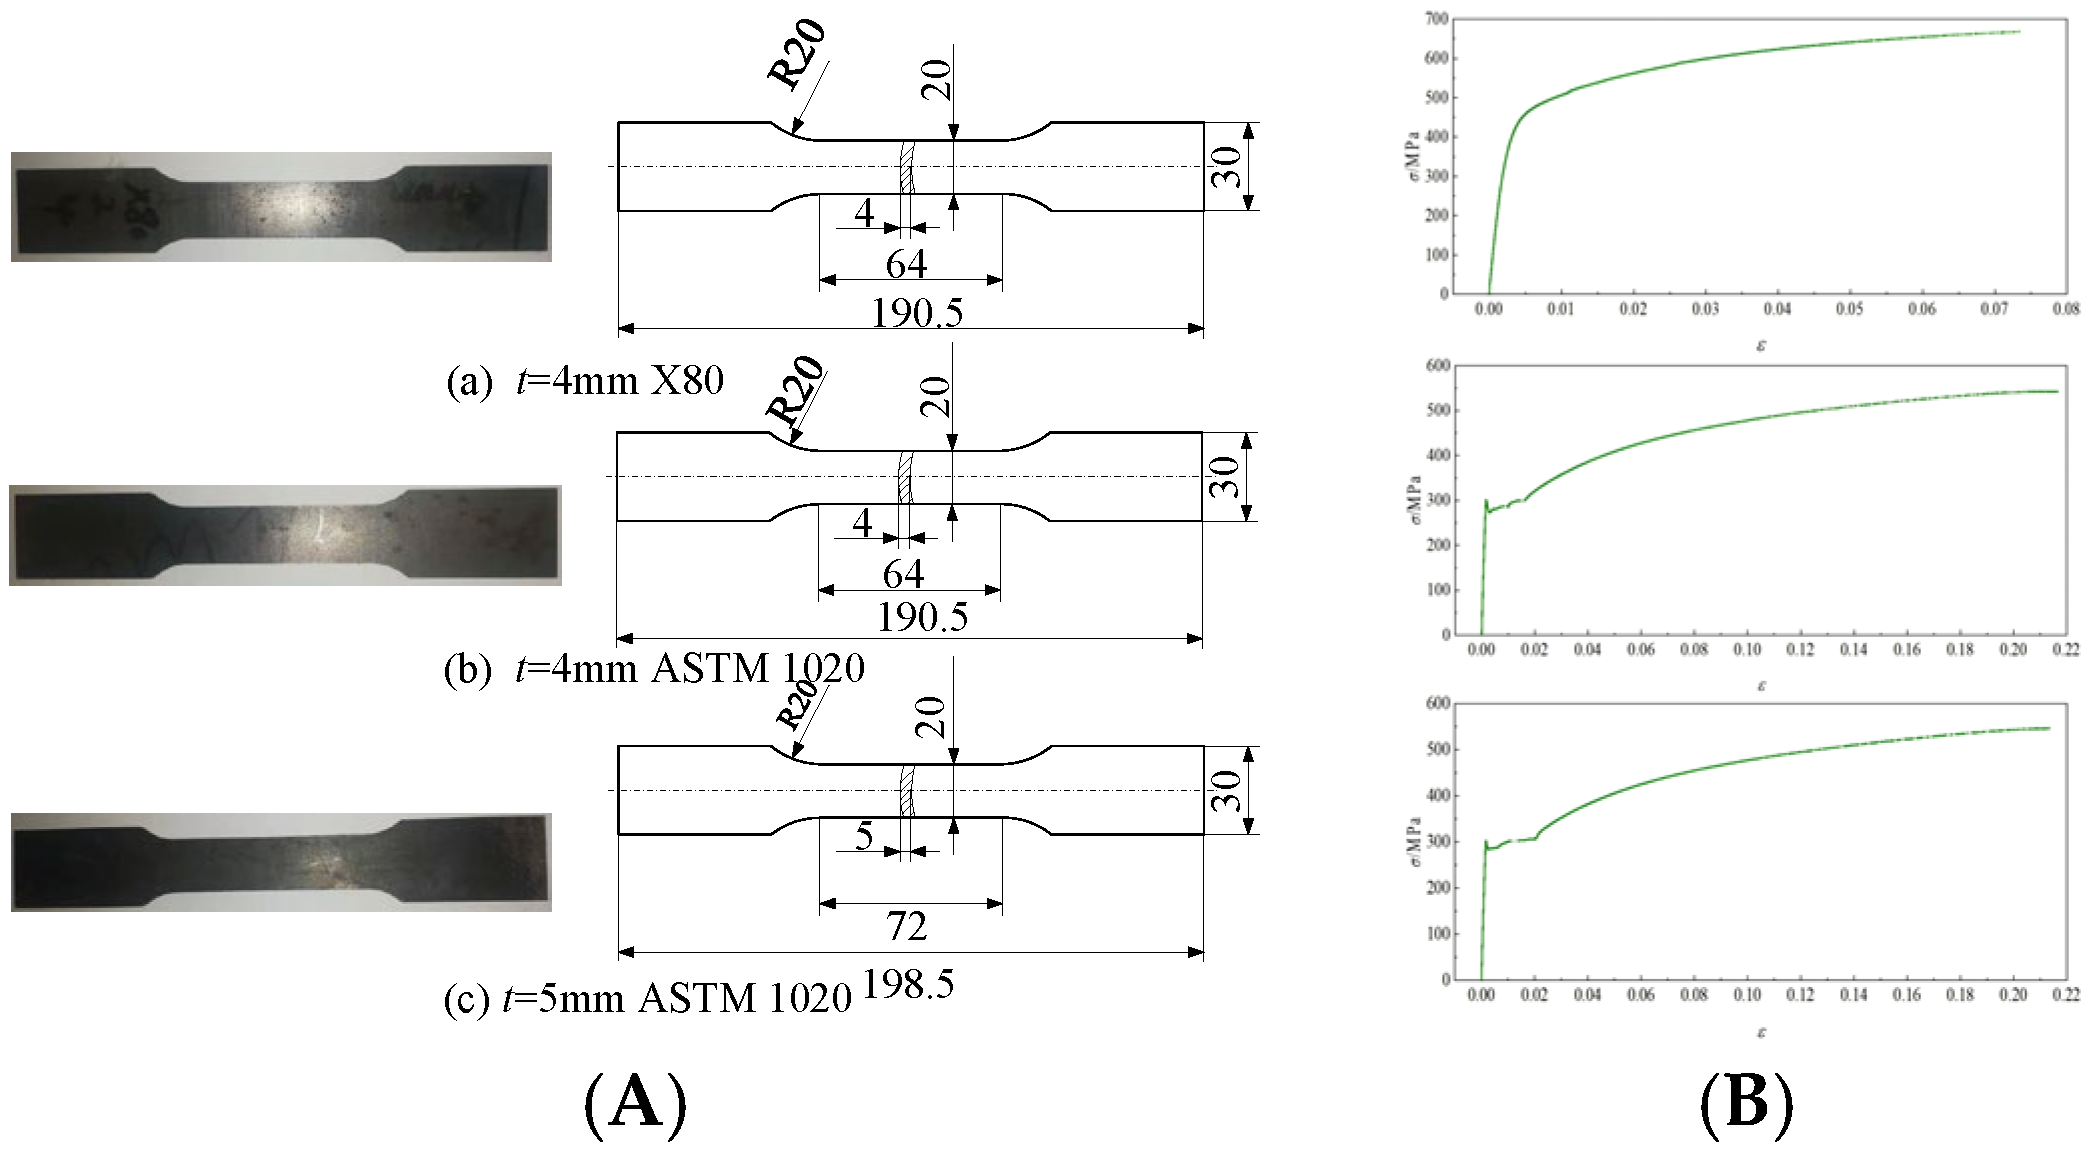
Finite element simulation and experimental studies were conducted using an ASTM 1020 sheet and an X80 steel sheet, with the specific geometric dimensions shown in Table 1. Due to the significant influence of fluctuations in the material property parameters on the experimental and simulation results, parameters were not selected from the software’s material library. Instead, uniaxial tensile tests were performed to determine the material property parameters of the X80 steel sheet and the ASTM 1020 sheet. The specific dimensions of the uniaxial tensile specimens are shown in Figure 2. In the LSAW pipe forming process, the strain of the steel strip generally ranges from 0.005 to 0.03. To improve the fitting accuracy of the material property parameters, data with smaller strains were selected for fitting; the fitting results are presented in Table 2.
The process parameters selected during the finite element simulation and experimental processes are shown in Table 3.

2.2.2. Finite Element Model Parameters

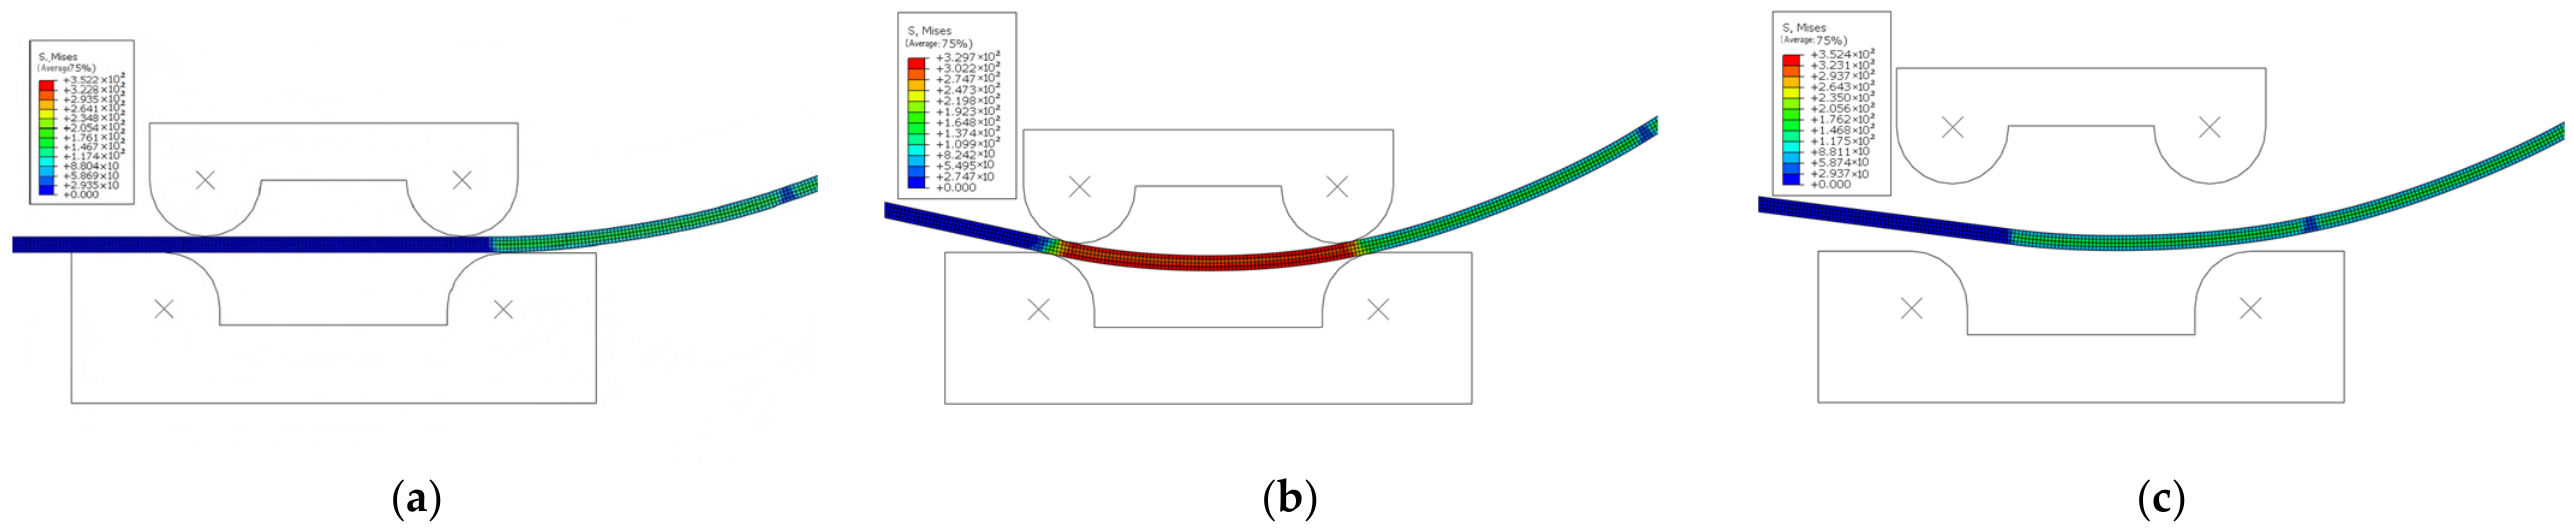
To more efficiently analyze the influence of various parameters on the AFB forming process, a simulation study of this process was conducted using the ABAQUS 6.14 software [24]. Based on the constructed AFB mechanical model, a two-dimensional finite element model was established. In this model, the sheet was defined as a deformable body, with its width dimension neglected. Both the punch and die were set as discrete rigid bodies. The deformable body was discretized into layers along the thickness direction in millimeters, with the element type selected as the four-node plane strain non-conforming mode element (CPE4I); the initial increment step was set to 0.01; the minimum increment step was 1 × 10⁻⁶; and the maximum increment step was 1. The friction between the punch and die and the sheet was modeled as classical Coulomb friction, and the contact form was master–slave surface-to-surface contact. The simulation process was solved using the static implicit algorithm. The specific process involves selecting appropriate process parameters to form the sheet into a shape with an arc segment end using the symmetric four-point bending process [14]. Subsequently, the sheet is shifted to the right by a distance of W p + W d / 2 , after which the punch descends to bring the arc segment into contact with the die, as shown in Figure 3a. Thereafter, the punch descends to bend the sheet, as illustrated in Figure 3b. Finally, after bending is completed, the punch moves upward and the sheet is unloaded, as depicted in Figure 3c. The finite element simulation results show that the maximum strain of the sheet is 0.026, which is a relatively small strain value. The bilinear hardening model assumed in the basic hypothesis can meet the usage requirements.

2.2.3. Experimental System

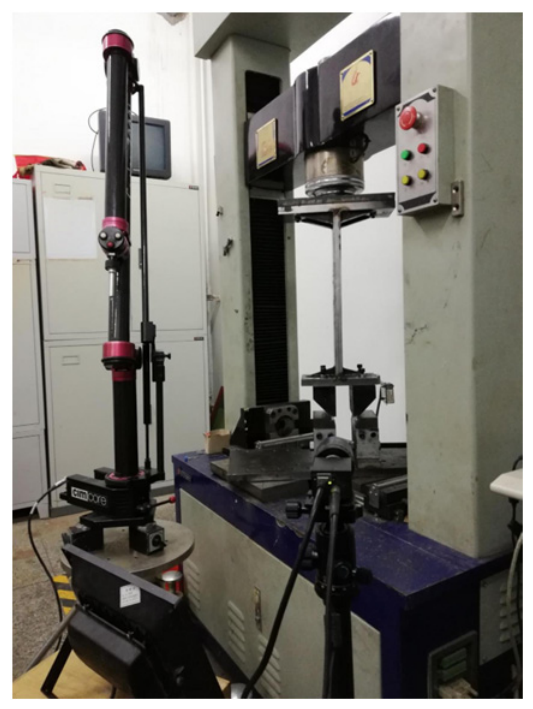
Based on the finite element model presented in the previous section, an AFB experimental system was designed. This experimental system primarily comprises a testing machine, I-shaped plate, punch, die, workbench, laser displacement sensor, measuring equipment, and sheet, as illustrated in Figure 4.
The testing machine employed is a WDD-LCT-150 electronic tension–torsion-combined multi-functional testing machine produced by the Shandong Lier Company (Zibo, China), which has a displacement accuracy of 0.01 mm and is used to implement force loading and unloading operations during the experiment. The punch and die are machined from 45 steel. The measuring equipment selected is a 3000i TM series portable coordinate measuring machine manufactured by Cim Core (Farmington Hills, MI, USA), with a measurement accuracy of 0.01 mm, intended for measuring the formed angle of the sheet after springback and the length of the undeformed region near the symmetry axis. The laser displacement sensor, model optoNCDT1032, is used to measure the reduction during the bending process. It has a range of 100 mm, a measurement range of 50 to 150 mm, and an absolute measurement error of 0.2 mm.

2.3. The Effect of Various Forming Process Parameters on the Result in the AFB Process

2.3.1. Effect of the Friction μ

To investigate the effects of friction on the forming force P , forming angle θ , and relative gap Δ R during the four-point bending process, finite element simulation and mechanical analysis of the AFB process of X80 sheet were conducted. The friction coefficients were set to μ = 0 , μ = 0.06 , and μ = 0.12 , respectively, with other process parameters including b = 100   mm , R p = 15   mm , R d = 15   mm , W p = 30   mm , and W d = 55   mm .
5.
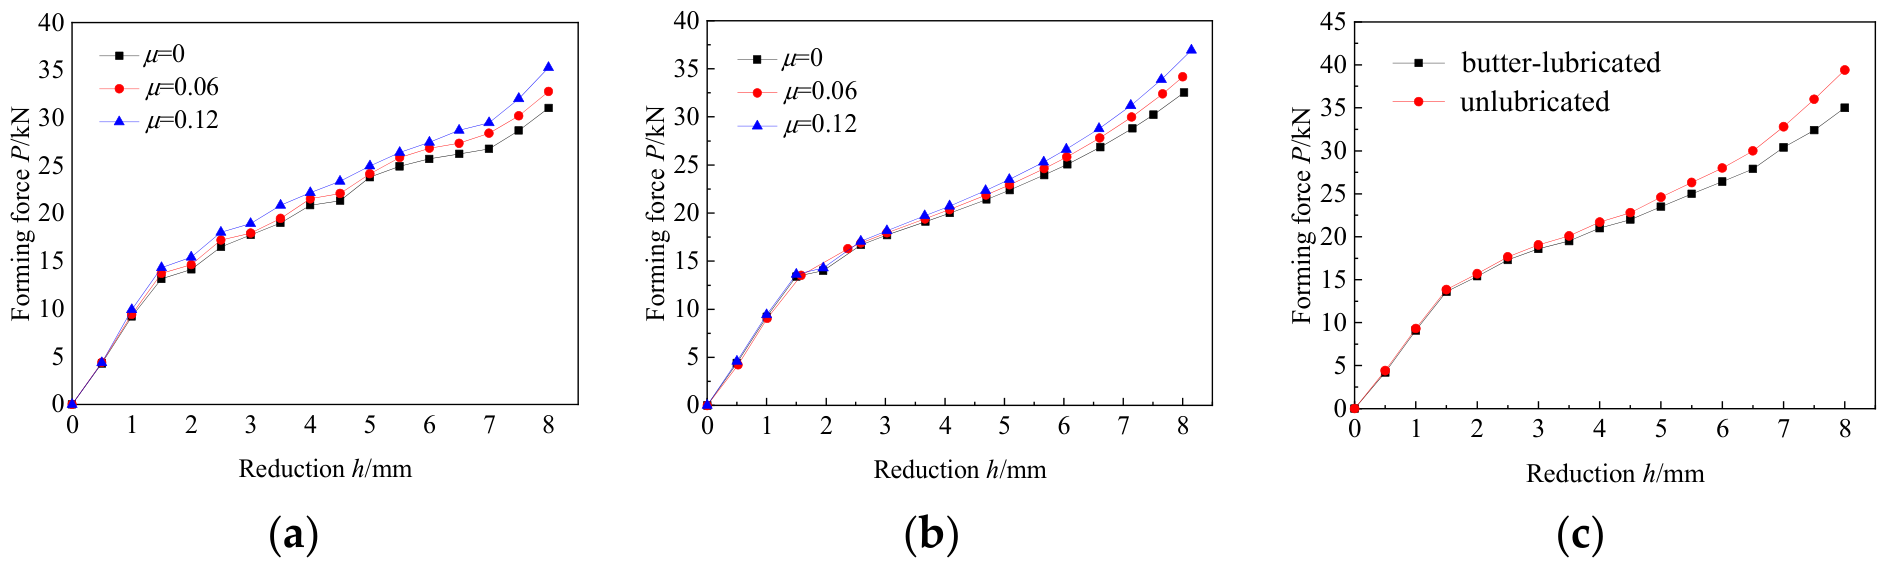
Effect of the friction μ on the forming force P
As shown in Figure 5, both finite element simulations and mechanical results indicate that P increases gradually with the increase in reduction h under different friction coefficients. Additionally, the rate of increase in P also continuously increases with the increase in μ . Due to the uncontrollable interface friction conditions in physical tests, it is impossible to accurately match a fixed numerical friction coefficient during experiments. To verify the variation trend in the forming results under different friction levels, experimental studies were conducted with unlubricated and butter-lubricated conditions representing low and high friction levels, respectively, while keeping other conditions constant. The results of these experiments exhibited the same variation trend as the simulation results.
6.
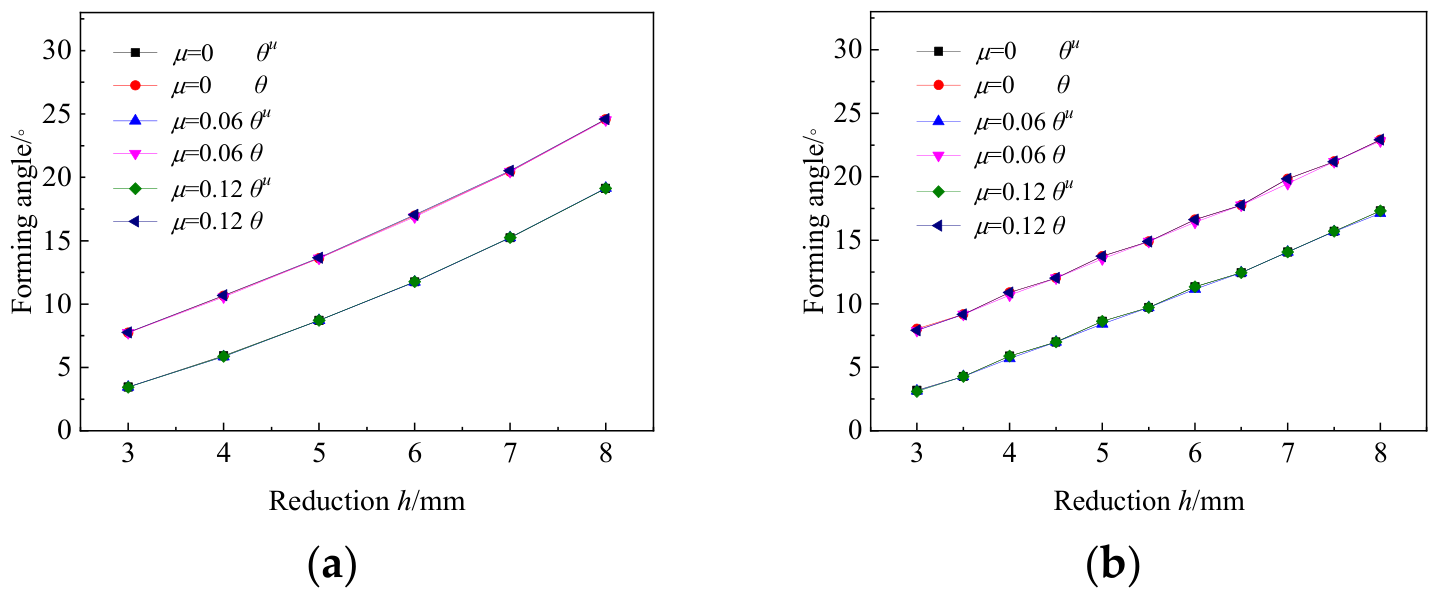
Effect of the friction μ on the forming angle θ
The simulation results and mechanical results of the effects of different friction rates on the forming angles before springback θ and after springback θ u are shown in Figure 6. It can be observed from the figure that different friction rates have almost no effect on the change in forming angles before and after springback. However, according to the analysis of the mechanical model, the greater the friction, the more severe the uneven distribution of bending moments. Although the bending angle remains unchanged, this causes the bending process to gradually approach a folding process. Therefore, in actual forming processes, the friction should still be kept as small as possible.
7.
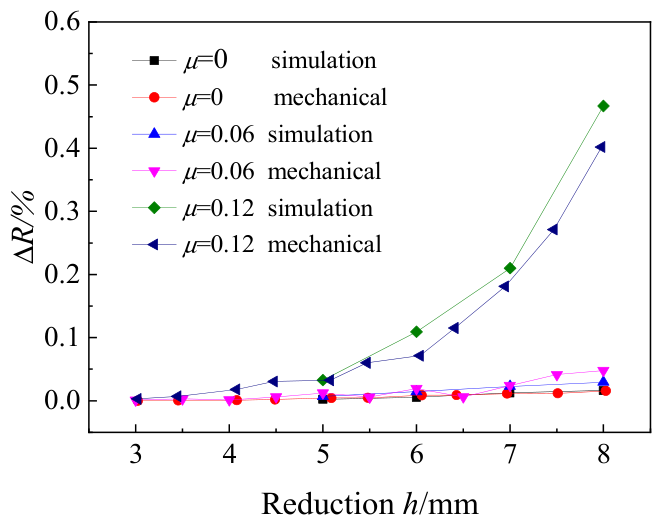
Effect of the friction μ on the relative gap Δ R
As can be seen from Figure 7, when the friction is μ = 0 , Δ R increases approximately linearly with the increase in reduction, h , and the simulation results and mechanical results are not significantly different.
When the friction coefficient is μ = 0.06 , Δ R also increases with the increase in reduction h and the rate of increase is greater than μ = 0 . When the friction is μ = 0.12 , this situation is further exacerbated: not only does the rate of increase with reduction h become larger, but Δ R also increases rapidly starting from a reduction of 5 mm.
The max absolute difference between the mechanical results and the simulation results is 0.065% and exhibits a trend where the absolute difference increases with both the friction coefficient and the reduction.
It can be concluded that an excessively large friction will significantly increase the bending moment and the non-uniformity of the curvature distribution. Therefore, during the AFB process, the friction should be minimized as much as possible to improve the uniformity of the sheet curvature distribution.

2.3.2. Effect of the Punch Radius R p

The radius of the punch is an important parameter affecting sheet bending and also plays a decisive role in the maximum allowable reduction. Therefore, under the condition that other process parameters remain unchanged, the effect on the bending results of R p = 10   mm , R p = 15   mm , and R p = 20   mm , respectively, was studied.
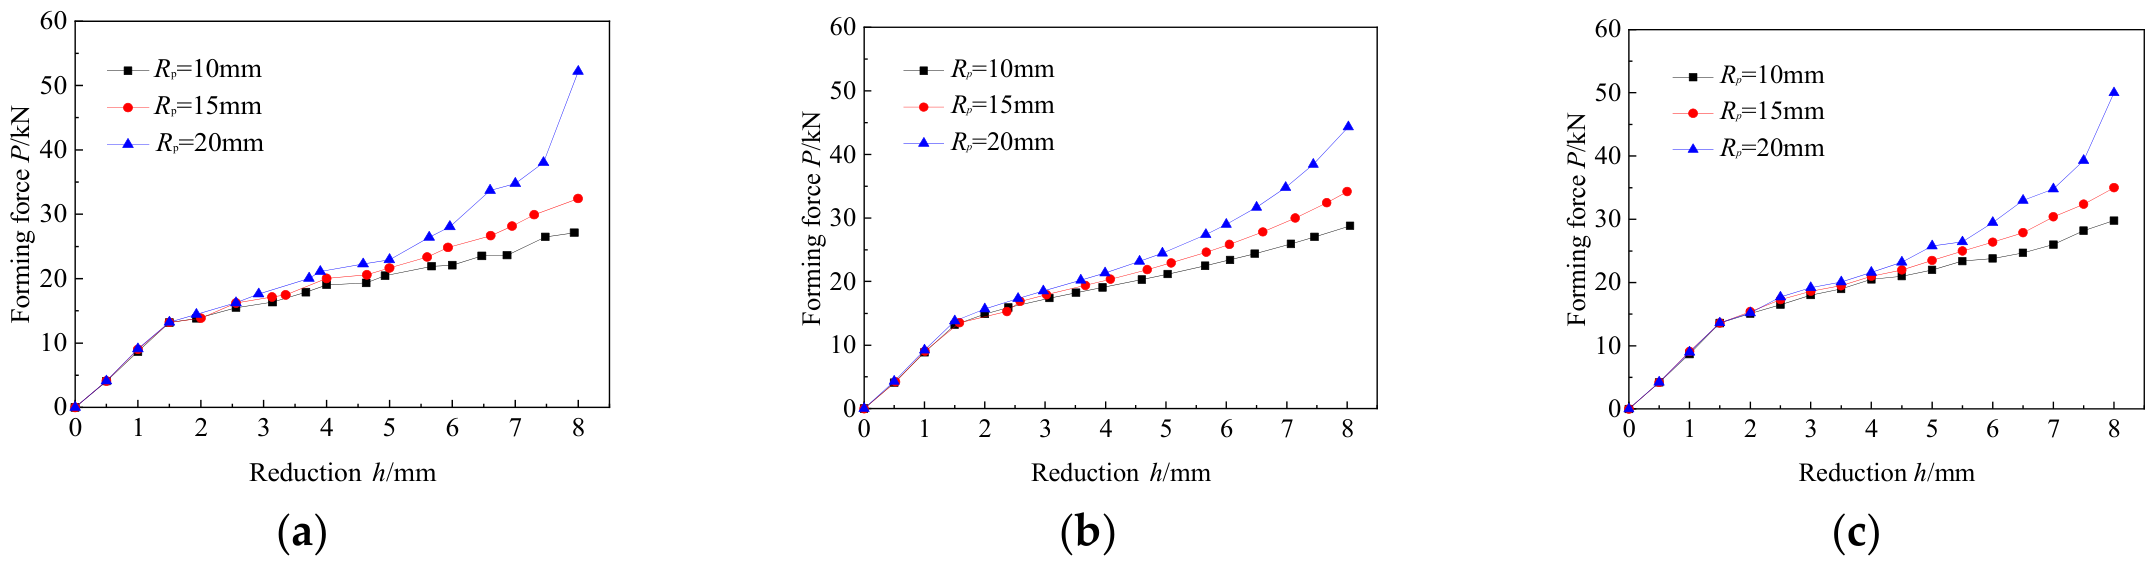
8.
Effect of R p on forming force P
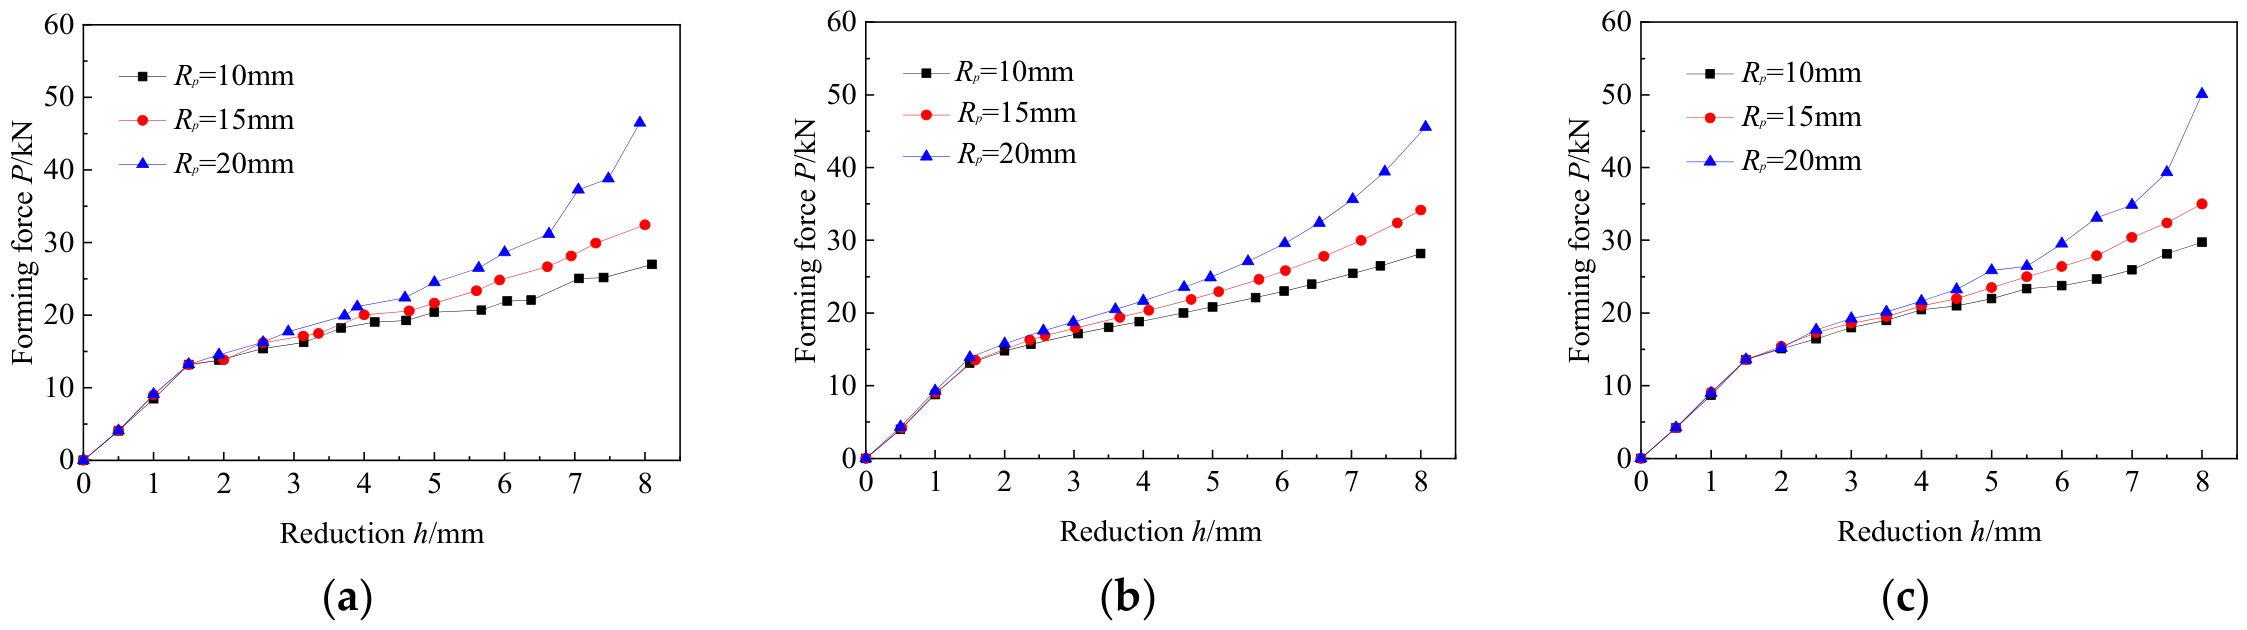
Figure 8a–c, respectively, display the simulation results, mechanical results, and experimental results. The results show that, as the punch radius R p increases, the forming force P increases and its rate of increase also gradually accelerates, leading to an increasingly larger difference in the forming force P between different punches under the same reduction.
9.
Effect of R p on forming angle θ
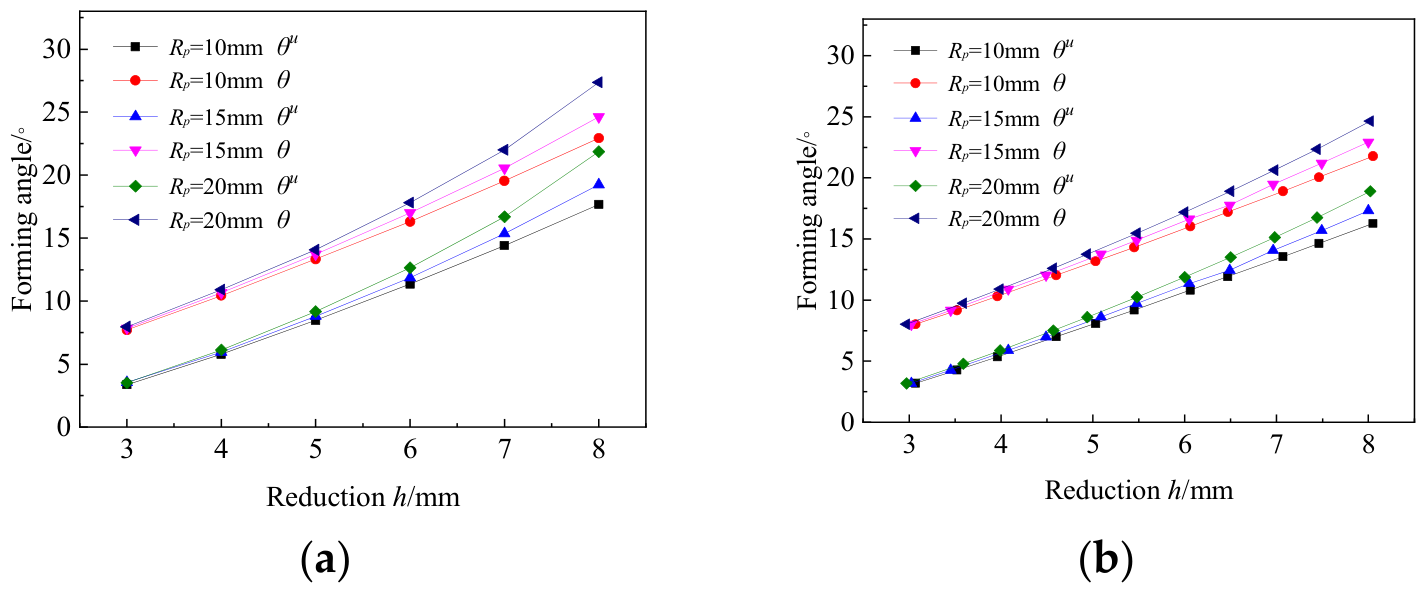
The simulation results and mechanical results of the effects of different R p on the forming angles before springback θ and after springback θ u are shown in Figure 9. It can be observed that both simulation and mechanical results indicate that, when the reduction is small, different R p have little effect on the forming angle. However, as the reduction increases, the difference between the angles before and after springback becomes more pronounced for R p , and the larger the R p , the greater the forming angle before and after springback.
10.
Effect of R p on relative gap Δ R
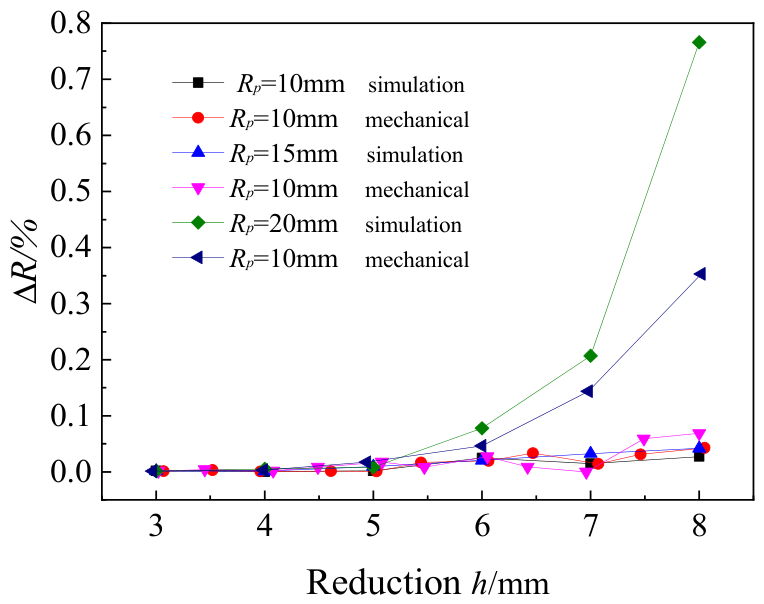
The effect of different R p on the relative gap Δ R is shown in Figure 10. It can be observed that the max absolute difference between the mechanical and simulation results is 0.42%, except for a rapid increase in Δ R as it approaches the reduction limit. Here, the Δ R increases slightly with increasing reduction under different R p and shows little difference. This indicates that, apart from having a significant impact on the reduction limit, different R p have a minimal effect on the Δ R .

2.3.3. Effect of the Die Radius R d

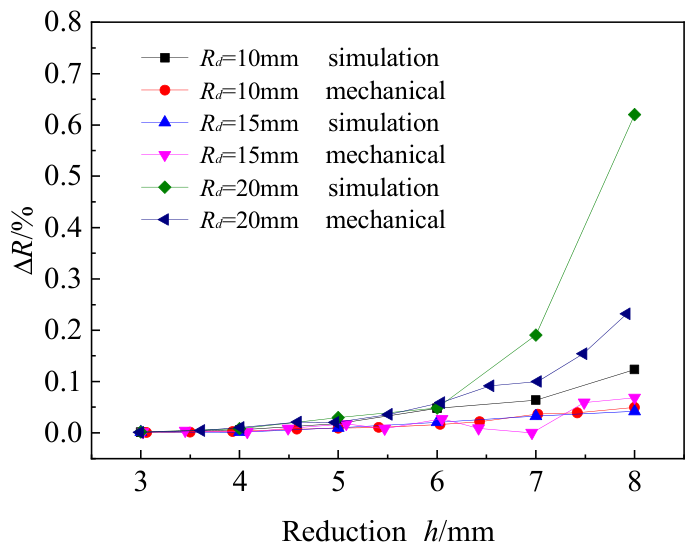
Similar to the punch radius, the die radius also plays a crucial role in the forming force and maximum allowable reduction. Therefore, under the condition that other process parameters remain unchanged, the effect on the bending results of R d = 10   mm , R d = 15   mm , and R d = 20   mm , respectively, was studied.
11.
Effect of R d on forming force P
Figure 11a–c, respectively, display the simulation results, mechanical results, and experimental results. As can be seen from the figure, the relationship between the forming force P and reduction h , as well as the effect trend of the punch radius R p on the forming force, are basically the same. Both show that the difference in the forming force P for different radii continuously increases with the increase in reduction h , with only slight differences in the magnitude of the forming force. Therefore, it can be concluded that the punch radius R p and the die radius R d have the same effect on the forming force P .
12.
Effect of R d on forming angle θ
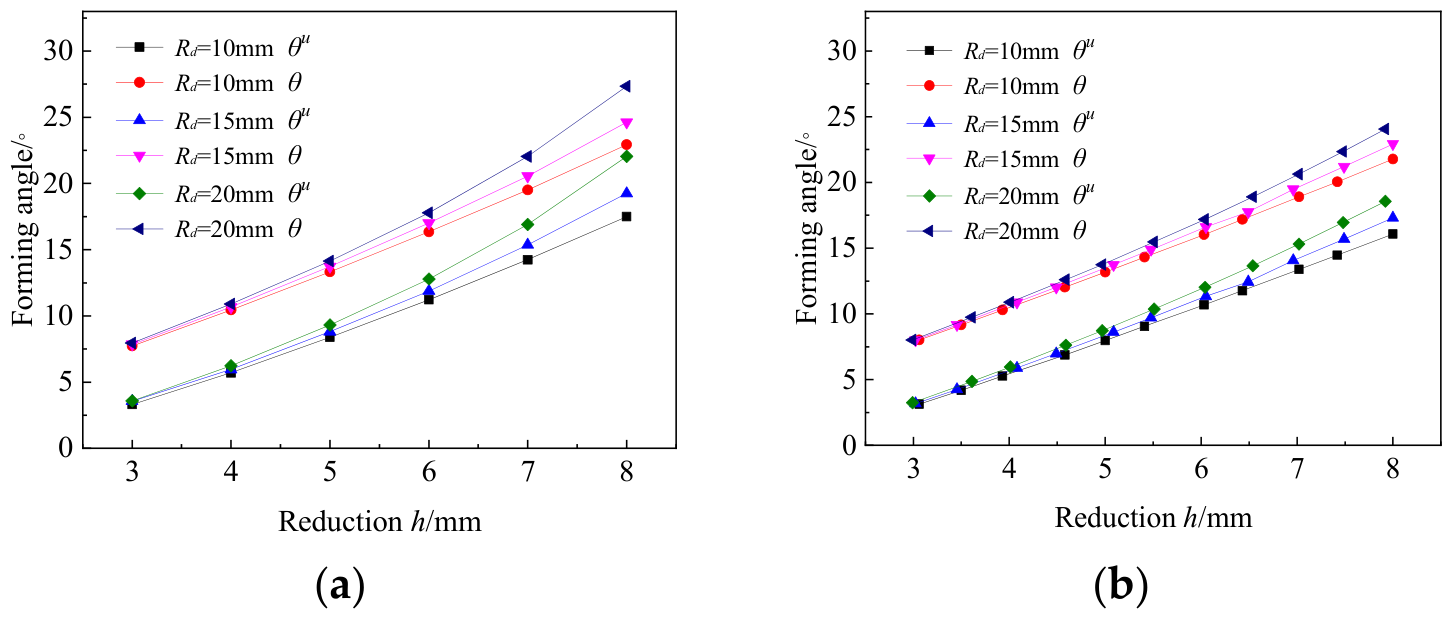
The simulation results and mechanical results of the effects of different R d on the forming angles before springback θ and after springback θ u are shown in Figure 12. It can be observed that the effect of R d is similar to that of R p . It has little effect when the reduction is small, and, when the reduction is large, the forming angle before and after springback increases with the increase in R d . From the analysis of the previous section and this section, it can be inferred that the radius of the punch and die has little effect on the forming angle, but attention should be paid to its influence when the reduction approaches the reduction limit.
13.
Effect of R d on relative gap Δ R
The effect of different R d on the relative gap Δ R is shown in Figure 13. It can be observed that the max absolute difference between the mechanical results and the simulation results is 0.42%. The relationship between Δ R and reduction h is essentially similar to the effect of Δ R under different R p . Both increase with the increase in reduction h , but the differences between the Δ R are not significant. From the analysis in the previous section and this section, it can be inferred that the unevenness of curvature distribution is not significantly affected by R p and R d . However, the smaller radius results in a longer straight edge segment and higher stress at the contact point, thereby affecting the pipe forming quality. Conversely, a larger radius leads to a shorter stroke and a smaller forming range. Therefore, when selecting the radius, it should be appropriate, and preferably the R p and R d should be the same.

2.3.4. Effect of W p

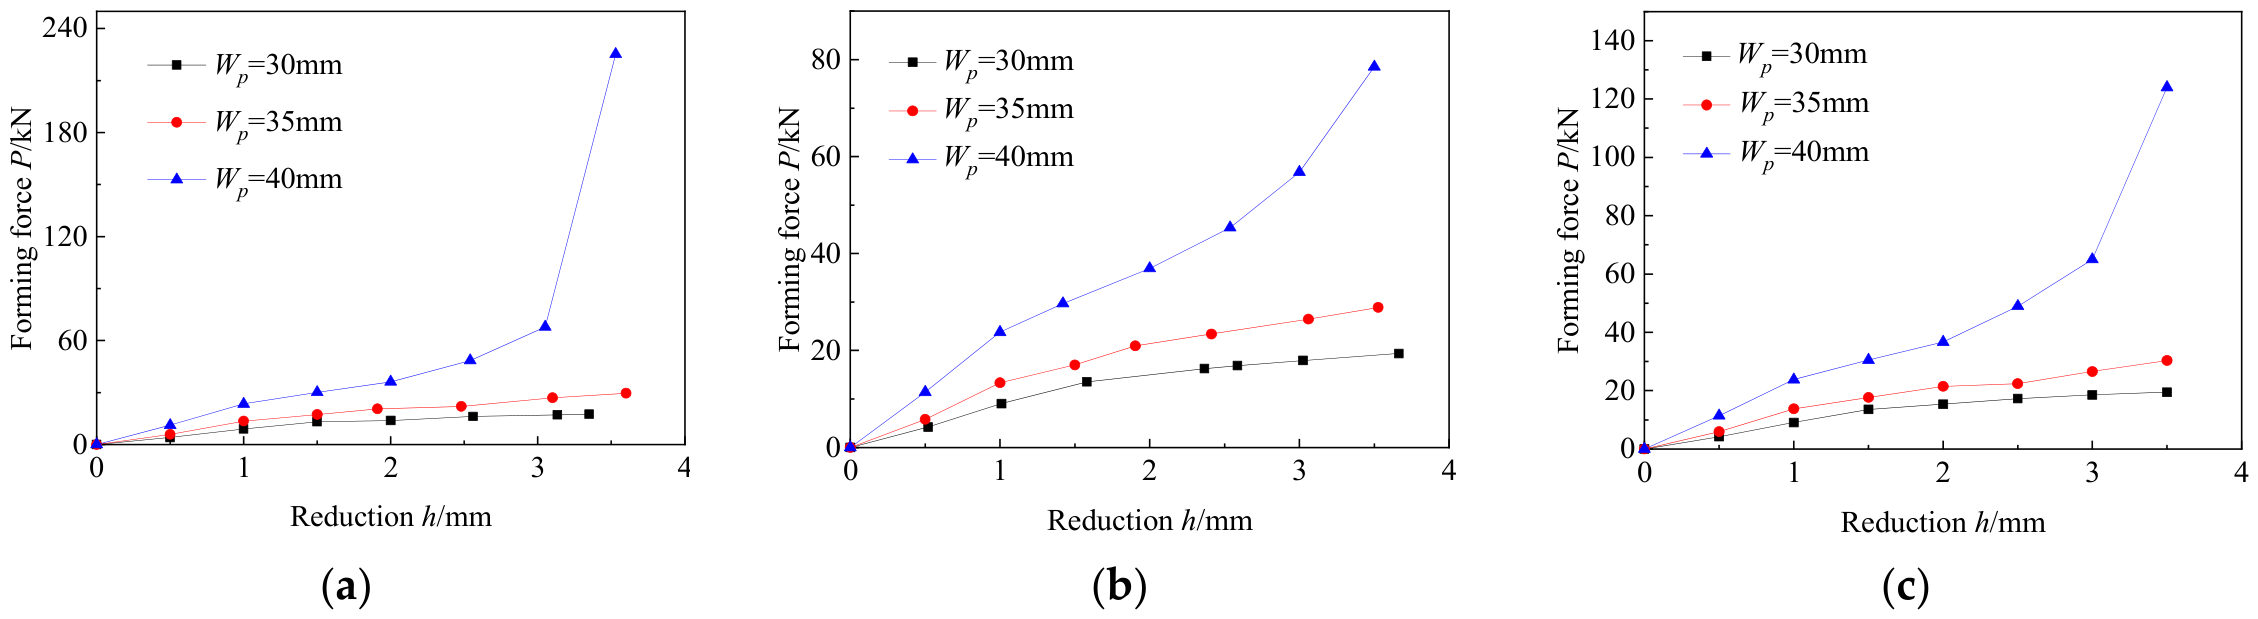
To investigate the effect of W p on the results of the AFB forming process, finite element simulations, mechanical analysis, and experiments were conducted under identical other parameters, with variations in W p = 30   mm , W p = 35   mm , and W p = 40   mm .
14.
Effect of W p on forming force P
Figure 14a–c, respectively, display the simulation results, mechanical results, and experimental results. As can be seen from the figure, the greater the W p , the greater the forming force P . Additionally, as the reduction h increases, the rate of increase in the forming force also continuously increases with the increase in W p . Except for the case where W p = 40   mm , the reduction h exceeds 3 mm, leading to a sharp increase in forming force occurs, and there is a significant discrepancy between the simulation results, mechanical results, and experimental results. Analysis of the cause indicates that, when the reduction h exceeds 3 mm, the distance between the punch surface and the die surface becomes less than the sheet thickness, resulting in squeezing. Therefore, it can be concluded that the AFB of the sheet has a reduction limit, which is the reduction when the distance between the punch and die surfaces equals the sheet thickness. This reduction limit can be obtained through geometric relationships.
h lim = R p + R d + t R p + R d + t 2 W d W p 2
15.
Effect of the W p on forming angle θ
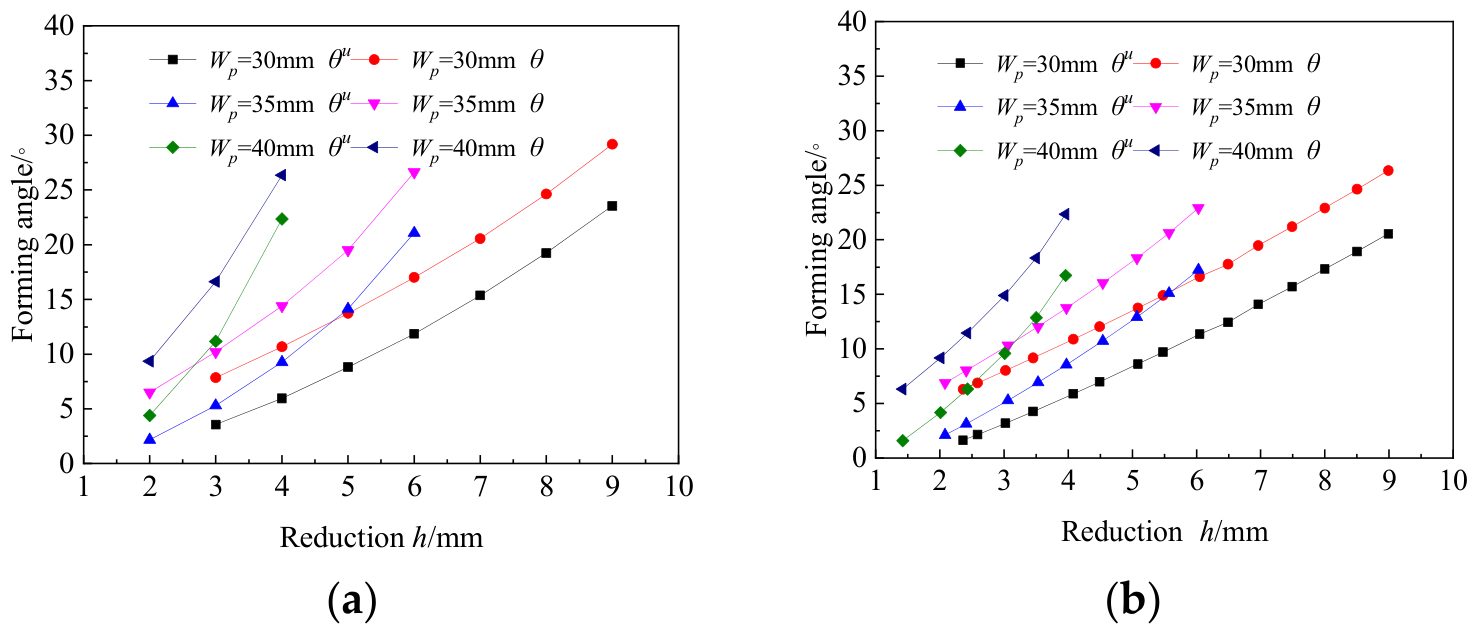
The simulation results and mechanical results of the effects of different W p on the forming angles before springback θ and after springback θ u are shown in Figure 15.
As can be seen from the figure, when W p = 30   mm , the θ and θ u increase steadily with the increase in reduction h , and the value of θ θ u remains basically stable. However, when W p = 35   mm and W p = 40   mm , θ and θ u exhibit a sharp increase, and the increment rate of θ u is greater than that of θ . As it approaches the reduction limit, the value of θ θ u does not increase but decreases instead. Therefore, the larger the W p , the greater the forming angle, and its increment rate with respect to the reduction h also increases.
16.
Effect of W p on relative gap Δ R
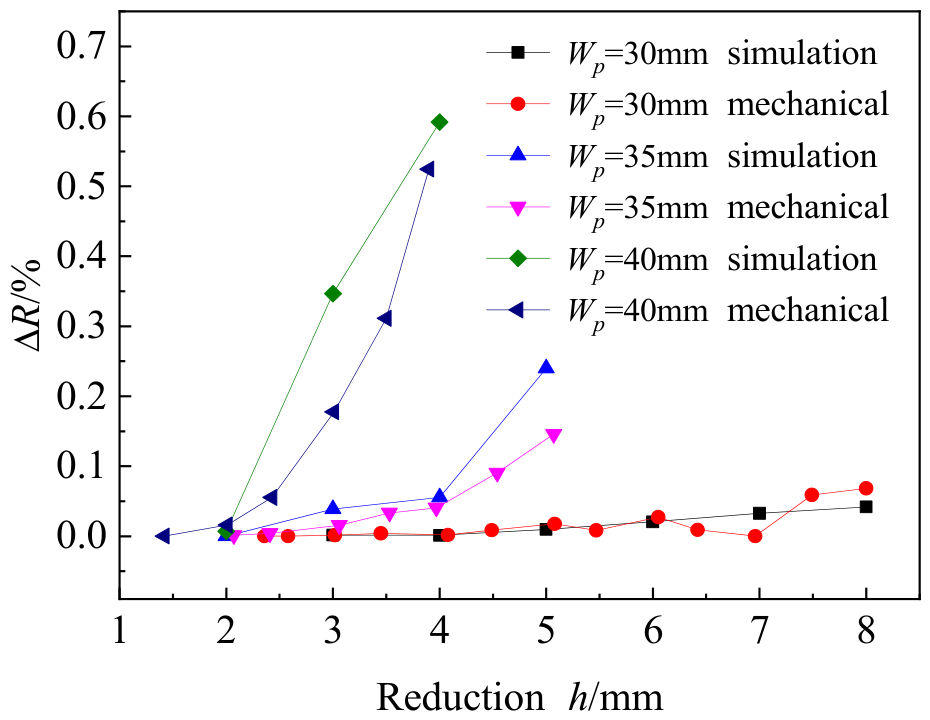
The effect of different W p on the relative gap Δ R is shown in Figure 16. As can be seen from the figure, the max absolute difference between the mechanical results and the simulation results is 0.1% and exhibits a trend where the absolute difference increases with both W p and the reduction. When W p = 30   mm , the Δ R increases steadily with the increase in reduction h . However, when W p = 35   mm , the Δ R increases rapidly after the reduction h reaches 4 mm, and the error between the simulation result and mechanical result also increases rapidly. When W p = 40   mm , there is no process of a slight and steady increase in Δ R ; instead, it increases rapidly at a reduction h of 2 mm. However, since the reduction h has not reached the maximum reduction and the error between the simulation result and mechanical result is not significant. Therefore, it can be inferred that the smaller the value of W p , the smaller the Δ R and the more stable its growth, but this will lead to an excessively long residual straight edge. Hence, W p should be reasonably selected when setting the process parameters.

2.3.5. Effect of W d

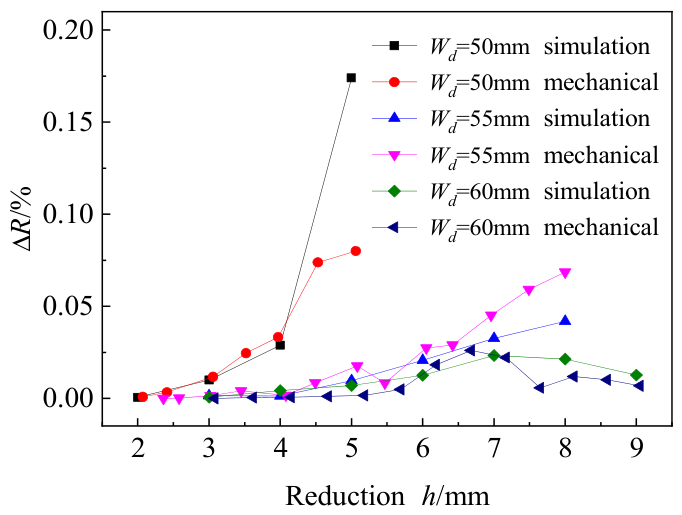
To investigate the effect of W d on the results of the AFB forming process, finite element simulations, mechanical analysis, and experiments were conducted under identical parameters, with variations in W d = 50   mm , W d = 55   mm , and W d = 60   mm .
17.
Effect of W d on forming force P
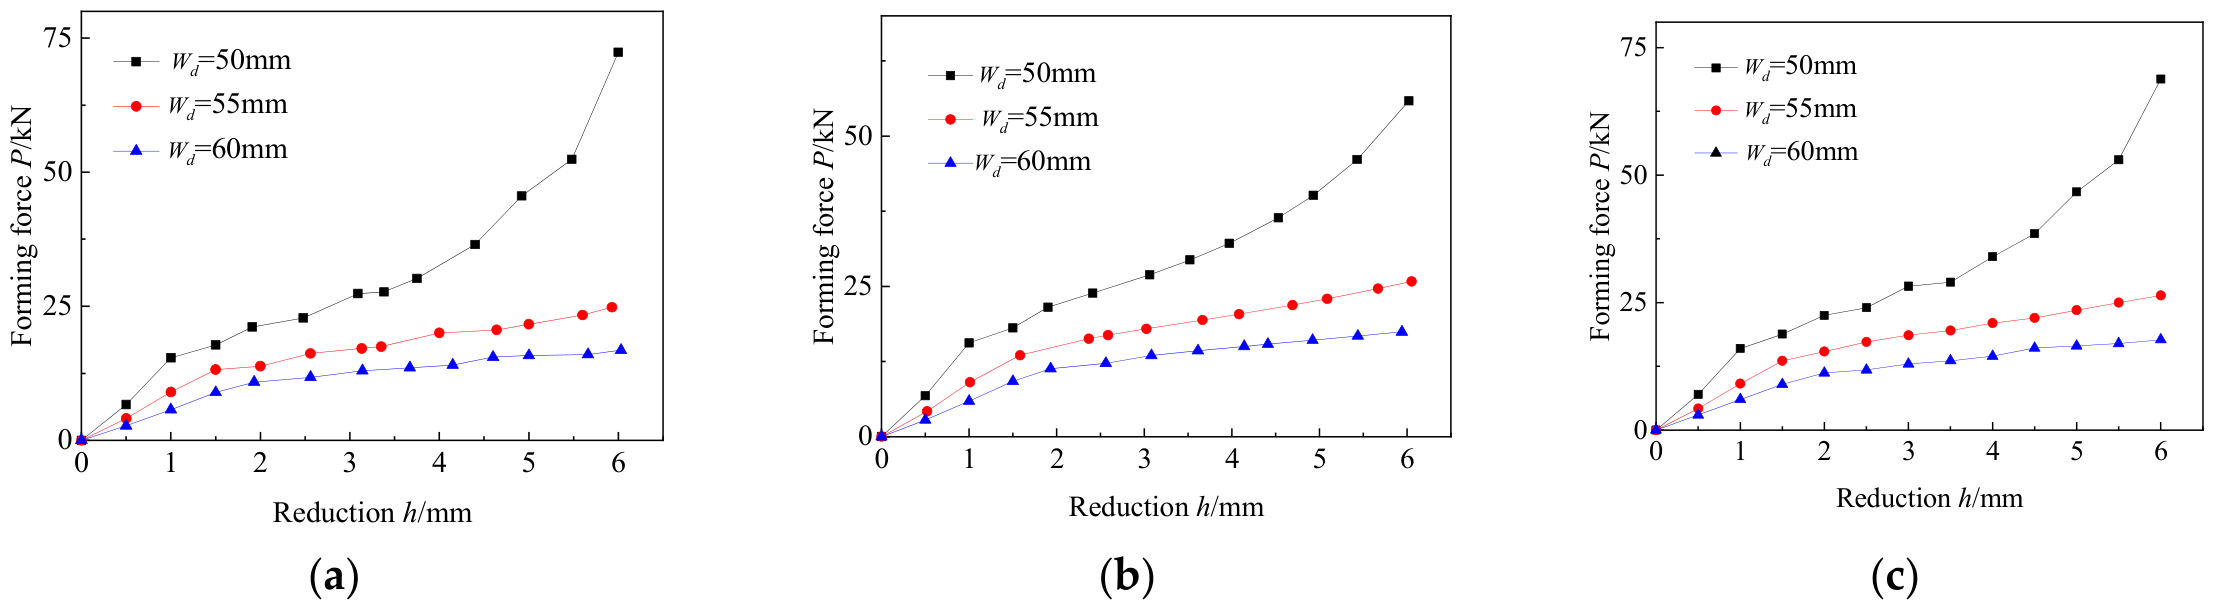
Figure 17a–c, respectively, display the simulation results, mechanical results, and experimental results. As can be seen from the figure, all three results exhibit the same trend: under the same reduction h , the greater the W d , the smaller the forming force P . The difference in forming forces at different W d increases with the increase in reduction h . In the case of W d = 50   mm , a sharp rise in the forming force P occurs after the reduction h exceeds 3 mm, which is also due to the reduction h approaching the reduction limit.
18.
Effect of W d on forming angle θ
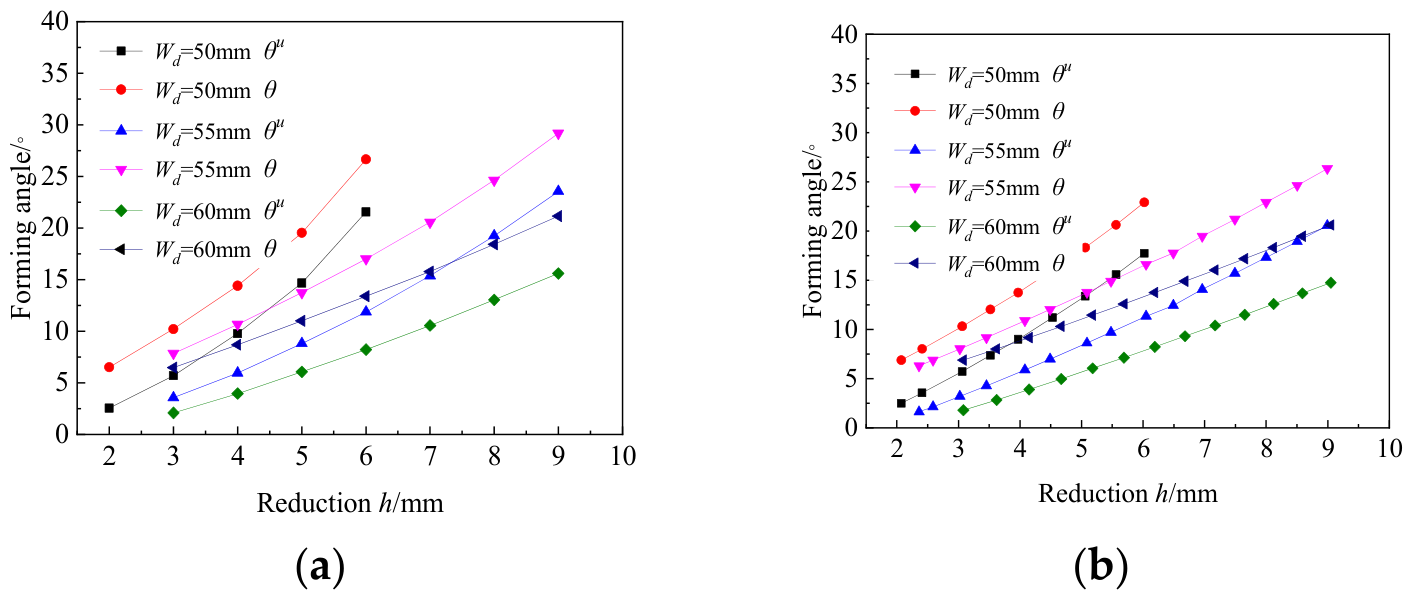
The simulation results and mechanical results of the effects of different W d on the forming angles before springback θ and after springback θ u are shown in Figure 18.
As can be seen from the figure, as W d increases, the increment in θ and θ u under the same reduction h becomes progressively flattened, which is exactly opposite to the effect of W p on the forming angle. Under different W d conditions, the values of θ and θ u change stably with the reduction h , and the value of θ θ u does not undergo significant changes with the increase in W d .
19.
Effect of W d on relative gap Δ R
The effect of different W d on the relative gap Δ R is shown in Figure 19. As can be seen from the figure, the max absolute difference between the mechanical results and the simulation results is 0.1%. The variation trend of the Δ R is exactly opposite to the variation trend of the Δ R under different W p . The larger the W d , the smaller the Δ R , and the more gradual its growth trend, with the starting point of rapid growth being further back. Therefore, a larger W d not only increases the maximum reduction but also results in a more uniform curvature distribution at the same reduction h . Based on this trend, a larger W d should be selected when determining process parameters. However, an excessively large W d will cause a long straight segment. Thus, when determining W d , both factors should be comprehensively considered to select an appropriate value.

2.3.6. Effect of W d W p

As can be seen from Equation (32), the reduction limit is determined by R p and R d , the sheet thickness t , and W d W p , with the reduction limit increasing as W d W p increases. To investigate the variation in forming results when W d W p is the same but W d and Wp differ, this paper selected three groups of different upper and lower die–span combinations with a fixed die clearance for simulation, mechanical analysis, and experimentation.
To investigate the effect of W d W p on the results of the AFB forming process, finite element simulations, mechanical analysis, and experiments were conducted under identical other parameters, with W d W p = 20   mm , but three groups of different W d and W p combinations.
20.
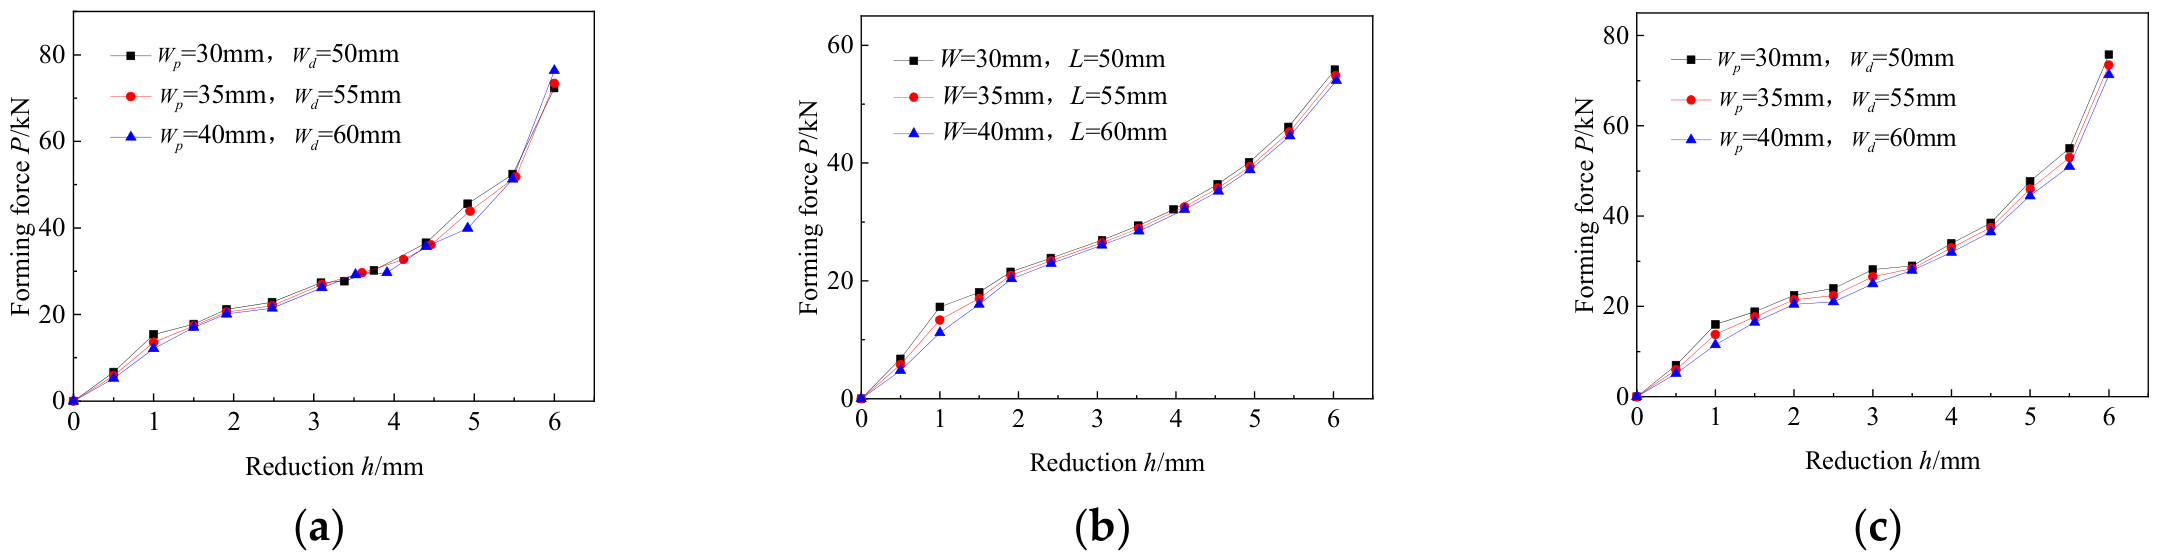
Effect of W d W p on forming force P
Figure 20a–c, respectively, display the simulation results, mechanical results, and experimental results. As can be seen from the figure, all three results indicate that, when W d W p is the same, the variations under different combinations are extremely similar, all continuously increasing with the increase in reduction h . Additionally, under the same reduction h , the combination with a larger W d W p also exhibits a slightly greater forming force.
21.
Effect of W d W p on forming angle θ
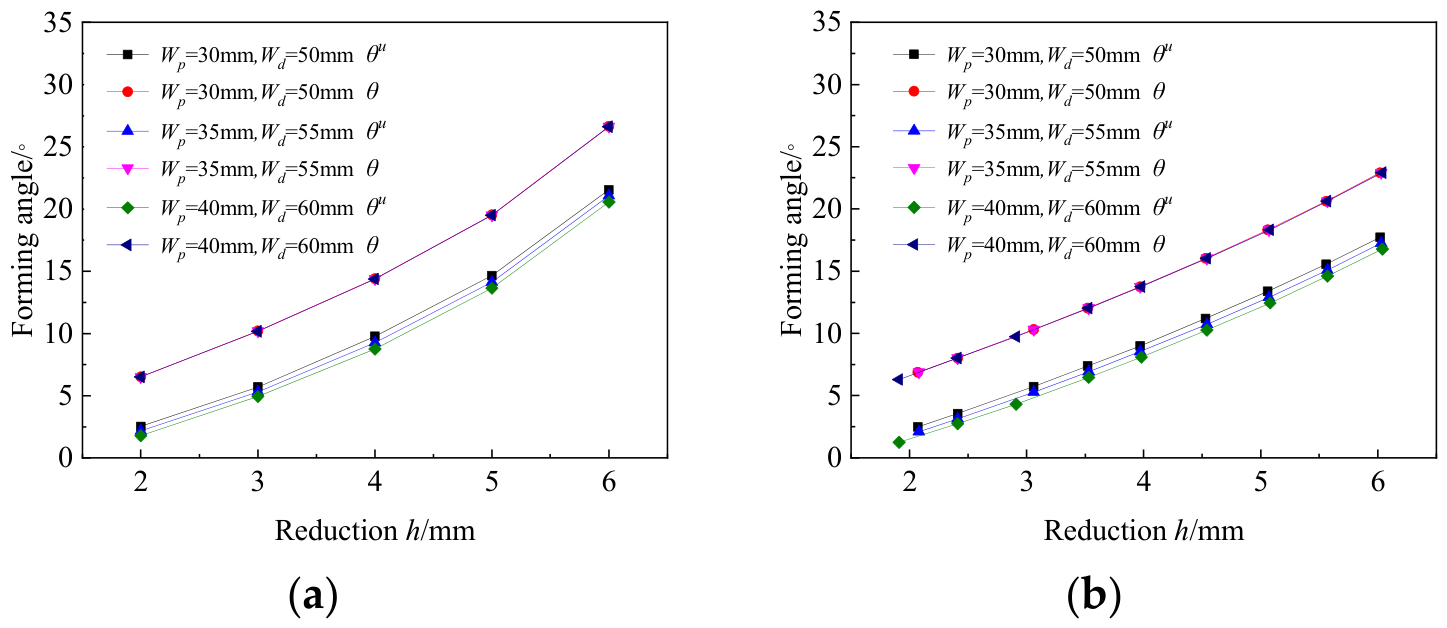
The simulation results and mechanical results of the effects of W d W p on the forming angles before springback θ and after springback θ u are shown in Figure 21.
As can be seen from the figure, under different combinations of W p and W d , the variation in θ with reduction h is indeed unaffected and overlaps almost completely. However, θ u exhibits significant differences and slightly decreases with the increase in W p and W d . After the reduction h exceeds 5 mm, there is a certain error between the simulated results and the mechanical results of θ u , which remains relatively stable. The reason for this is that, as the reduction h increases, the forming process gradually ceases to be a pure bending process and no longer fully conforms to the basic assumptions of pure bending in the mechanical model.
22.
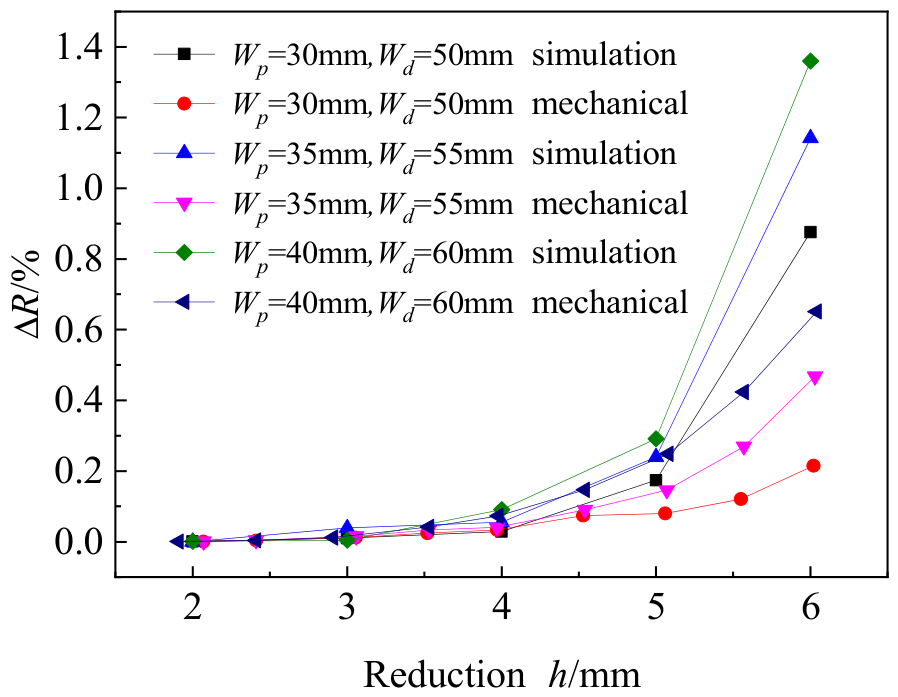
Effect of W d W p on relative gap Δ R
The effect of different W d W p on the relative gap Δ R is shown in Figure 22. As can be seen from the figure, the max absolute difference between the mechanical results and the simulation results is 0.71%. The growth trends of the Δ R under different combinations of W p and W d are basically the same. However, the starting point of their rapid increase advances, and the rate of increase also increases as W p and W d increase. From this, it can be concluded that, when selecting W p and W d , larger values should be chosen on the basis of meeting quality requirements to improve production efficiency. Additionally, when formulating process parameters, efforts should be made to avoid the reduction h approaching the reduction limit.

3. The Strategy for Parameter Formulation for the AFB Process for LSAW Pipes

The main process parameters required for the AFB progressive forming process in LSAW pipes include pipe parameters, mold parameters, and forming parameters. Among these, pipe parameters primarily consist of the target curvature radius ρ , sheet thickness t , and sheet width b . Mold parameters mainly include the punch radius, R p , and lower die fillet radii R d , W p , and W d . Forming parameters include the total number of forming passes i z , the step length per pass S , the horizontal distance a from the Y-axis to the transition point between the straight segment and the arc segment, the reduction h , and the forming force P .
According to the analysis results of the previous section, it can be inferred that R p and R d have the same effect on the forming result when other parameters remain unchanged. Specifically, a larger value of either R p or R d leads to a greater required forming force P , a reduced reduction limit, and a smaller θ u . Therefore, it can be considered that, when the diameter-to-thickness ratio ρ / t of the target pipe is the same, an increase in the target radius ρ results in a decrease in θ u , but the forming force P remains largely unchanged. During the selection of R p and R d , the primary consideration is whether they would cause stress concentration, which could affect the forming quality of the pipe. Thus, R p and R d can be calculated using Equation (33) and selected based on the available molds following the nearest principle.
R p = R d = λ t ρ
where λ is the radius calculation coefficient, generally taken as 600 mm.
Since ovality is one of the important indicators for measuring the forming quality of pipes, it must be fully considered during the process parameter formulation. The two factors affecting ovality are the length of the residual straight segment per pass and the uneven distribution of the curvature radius. Currently, in engineering applications, the ovality of pipes should not exceed 2.0%. Therefore, to minimize the non-uniformity of the curvature radius distribution, it is specified that Δ R should be less than 1.0%.
In conclusion, the strategy for parameter formulation of the AFB progressive forming process for LSAW pipes is as follows:
23.
Assume the number of forming passes is a small odd integer i z and then calculate the value of each pass θ u based on i z . Calculate R p and R d according to Equation (33).
24.
Calculate the initial values of W p and W d based on R p and R d from the geometric relationships of the mechanical model:
W d = ρ + t 2 + R d sin   θ u 2
W p = ρ t 2 R p sin   θ u 2
25.
Assume the initial value of a is equal to W d .
26.
Calculate the values of the forming angle θ j u after springback, the reduction h j , and the forming force P j when reaching the reduction limit by the AFB mechanical model with the current process parameters.
27.
Determine whether the point with the x-coordinate x = a undergoes elastic–plastic deformation at this time. If it does, set a = a + 0.1 and proceed to step 4. If it does not, proceed to the next step.
28.
If θ j u θ u > 1 e 5 , then W d = W d 0.01 , W p = W p + 0.01 , and proceed to step 3; if θ j u θ u < 1 e 5 , then W d = W d + 0.01 , W p = W p 0.01 , and proceed to step 3; if θ j u θ u 1 e 5 , directly proceed to the next calculation step.
29.
Calculate the value of Δ R . If Δ R > 1 % , proceed to step 2; if Δ R < 1 % , proceed to the next step.
30.
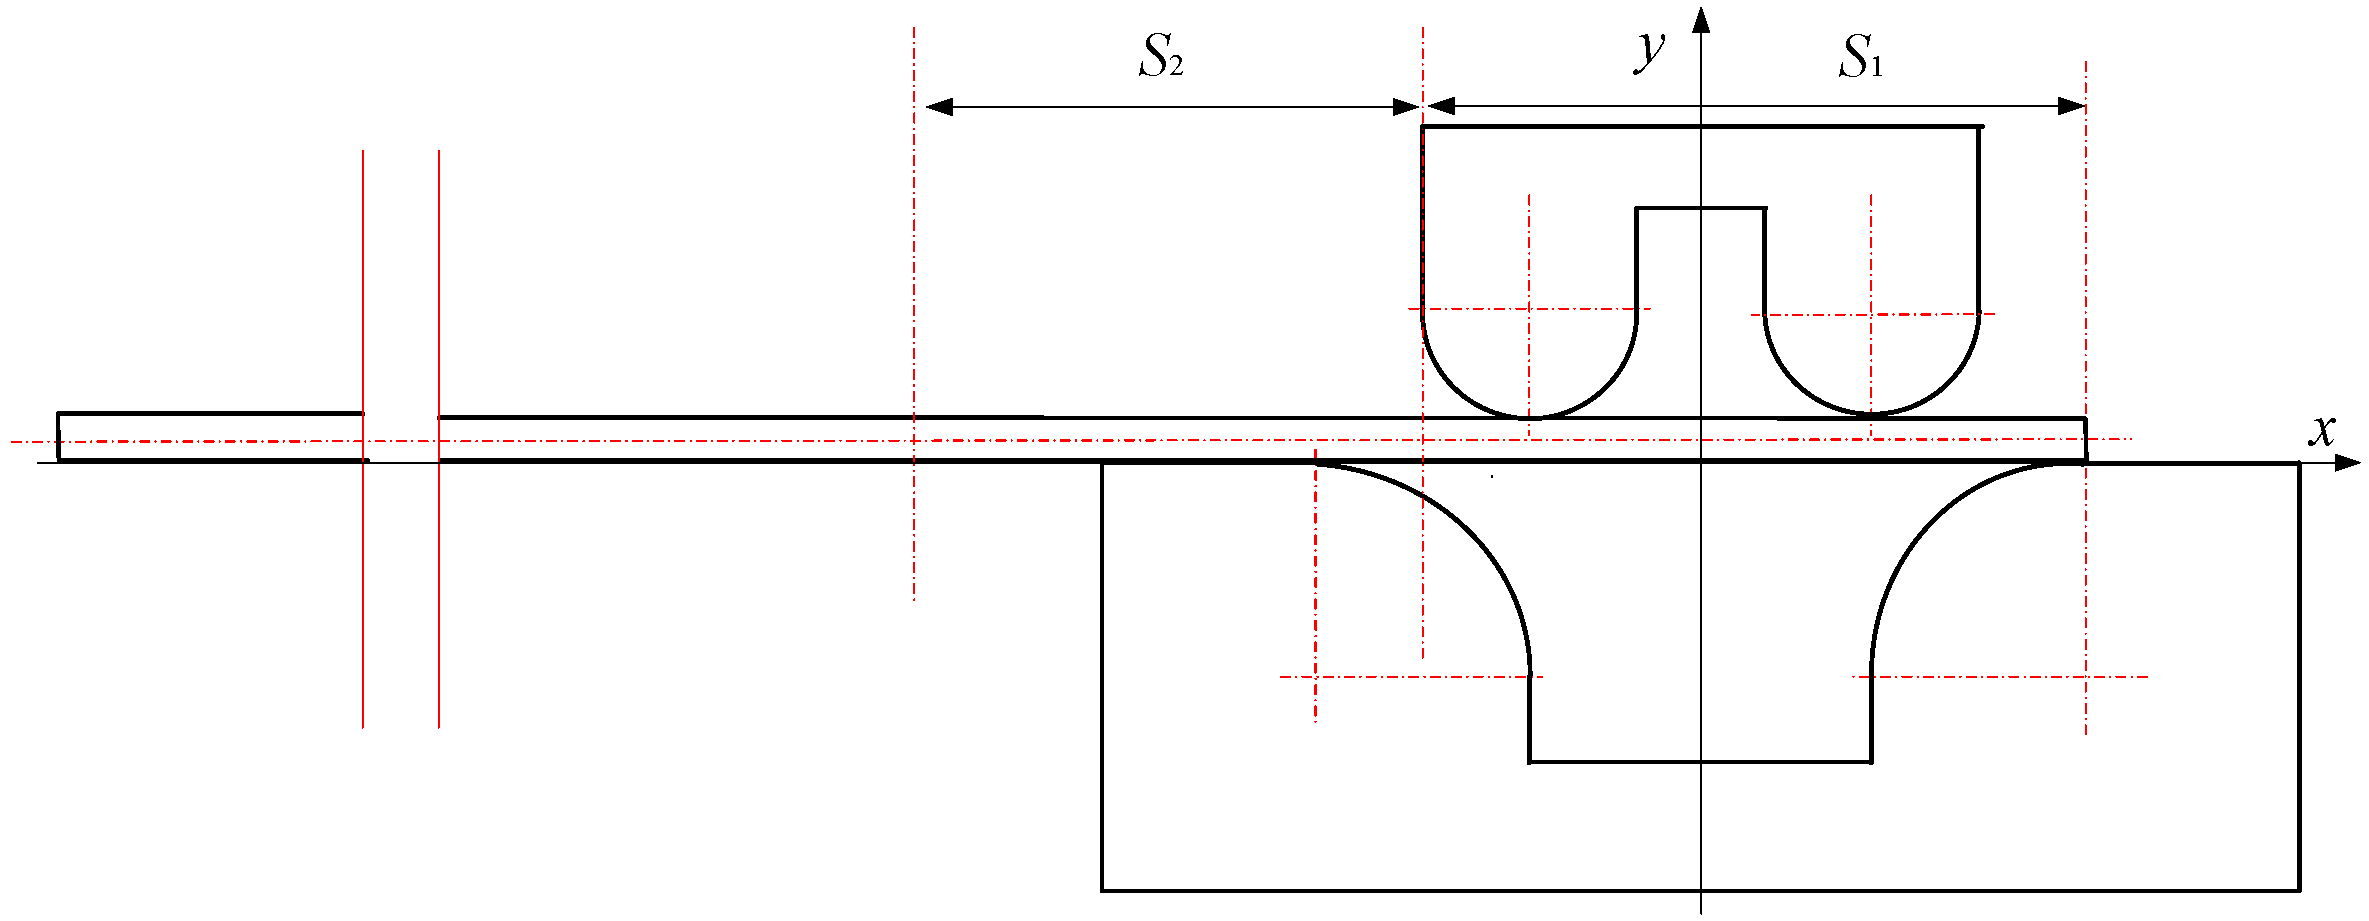
The forming angle θ u and step length S of each pass can be calculated from the obtained i z . However, to achieve the objective of minimizing the straight segment, the step length of each pass should be divided as shown in Figure 23. It can be observed that the step length of the first pass at both ends of the sheet is greater than that of other passes.
This is caused by the need to minimize the straight segment while simultaneously ensuring a high forming efficiency. Therefore, the step length S for passes other than the first pass at the left and right ends is
S = 2 π ρ W d W p i z
and the step length S of the first pass at the left and right ends is
S = S + W d W p 2
31.
Under the condition that the value of W d W p remains unchanged, W d can be transformed into
W d = 2 S S
32.
Based on the process parameters determined through the aforementioned steps, θ u , a , the reduction h , and the forming force P are calculated using the AFB mechanical model.
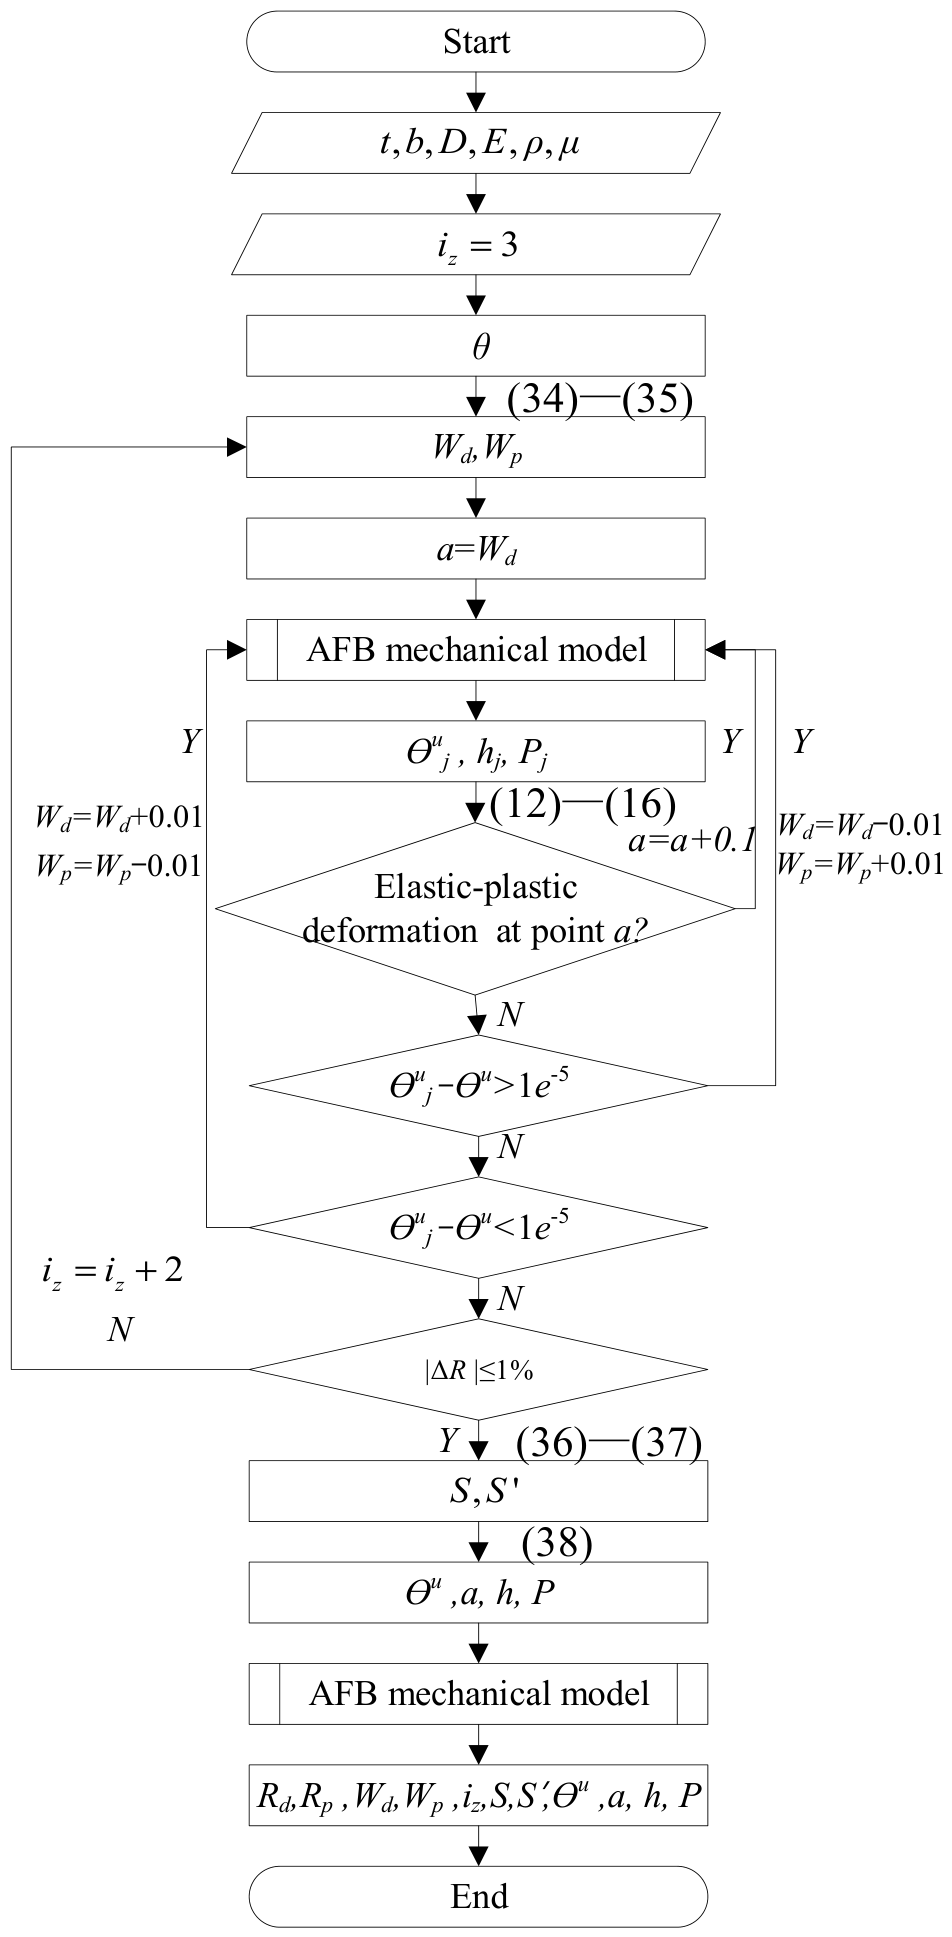
To facilitate the calculation of the process parameters, a programming approach was developed to formulate the AFB progressive forming process parameters for LSAW pipes. The specific program flow is illustrated in Figure 24.

4. Finite Element Simulation and Experimental Verification

To verify the validity of the strategy for parameter formulation for the AFB process for LSAW pipes, we conducted a study using both finite element analysis and experimental methods. The finite element simulation was performed with ABAQUS 6.14 software, employing the same model parameters, material properties, equipment configuration, and molds as those used in Section 2.
Since pipe components with identical diameter-to-thickness ratios ρ / t can be classified as equivalent [22], an ASTM 1020 sheet and an X80 steel sheet with measured material properties were selected as the experimental sheets. Pipes with reduced diameters corresponding to ratios of 30, 40, and 50 were chosen for simulation and experimental analysis. Given the symmetry in bending behavior at both ends during finite element simulations, only the first half and final steps of the forming process were simulated.
The specific dimensions of the target pipes are shown in Table 4.
The required forming process parameters for the aforementioned pipes can be calculated by the established computational program, as shown in Table 5.
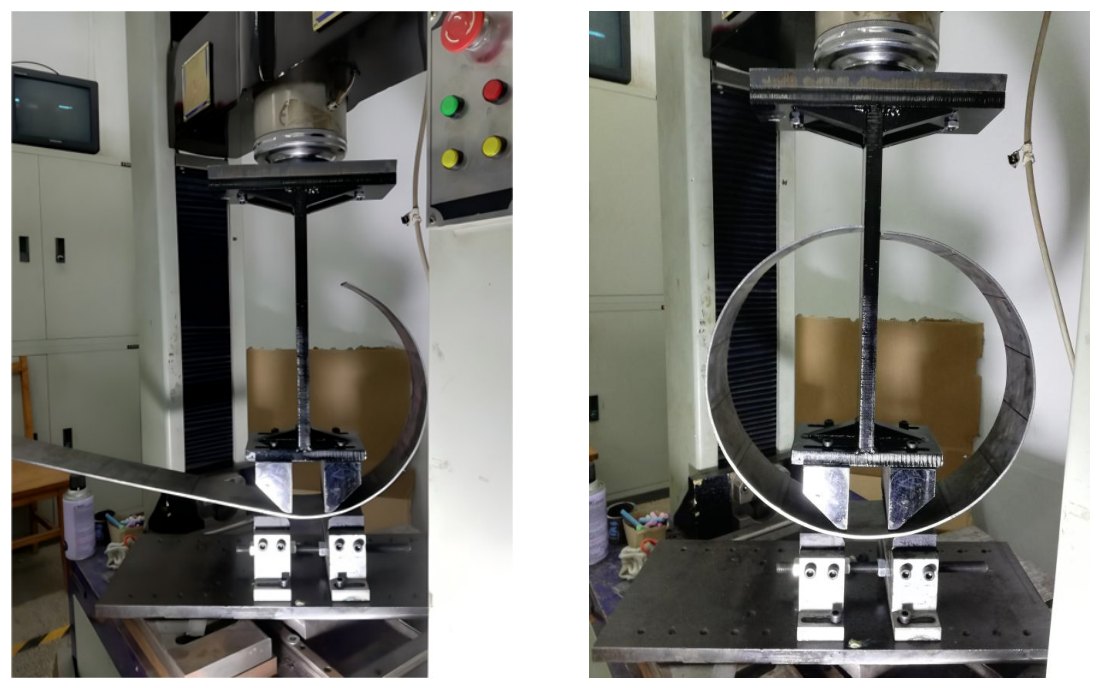
The experimental forming process for the No. 5 pipe is shown in Figure 25.
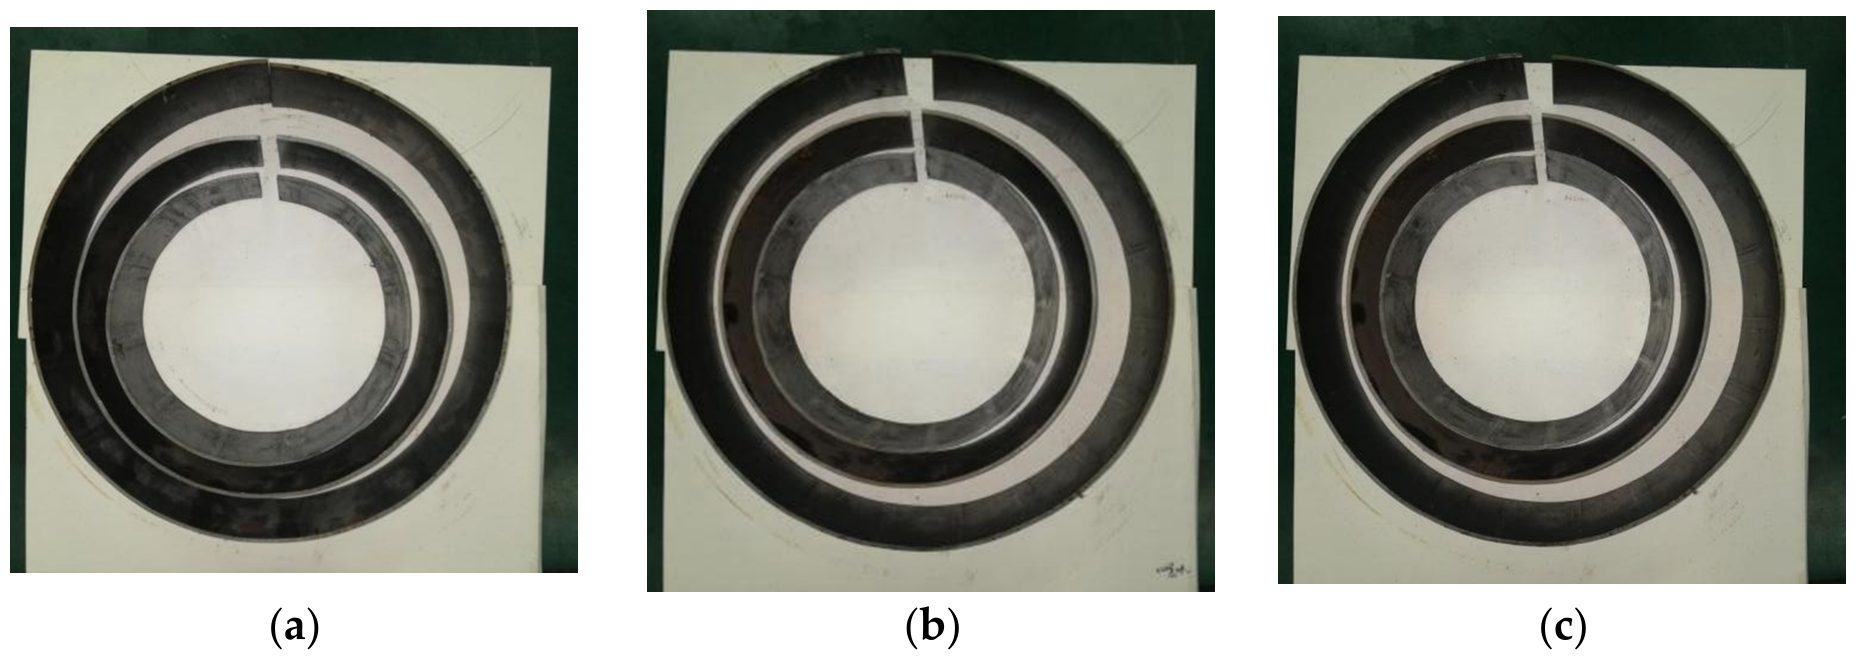
Experimental results for all pipes are shown in Figure 26.
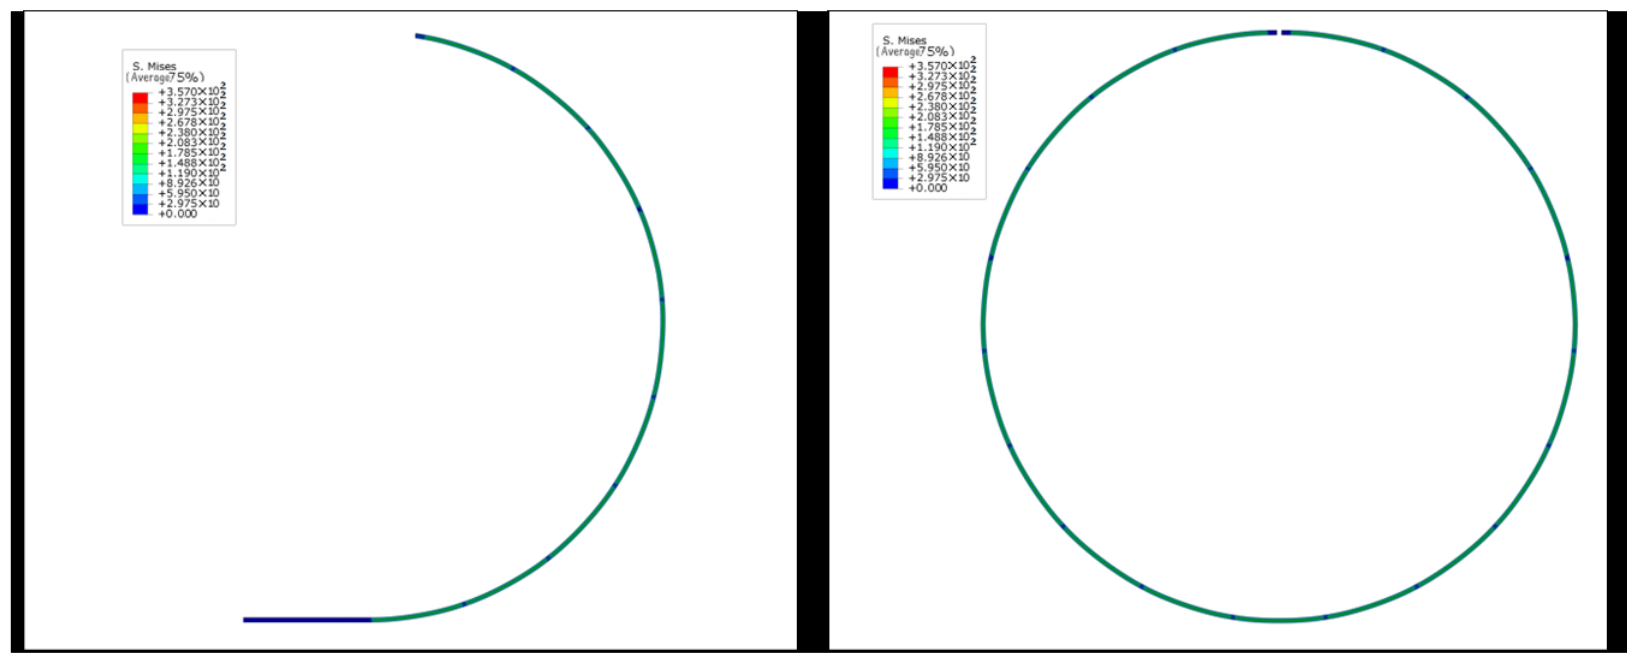
The simulation results for the No. 5 pipe are shown in Figure 27.
As can be seen from the figures, all pipes have a minimal straight segment, uniform curvature distribution, and small ovality. This demonstrates the correctness of the strategy for parameter formulation for the AFB process regarding all LSAW pipes.

5. Results and Analysis

To minimize the residual straight segment as much as possible, when determining various process parameters, W d W p should be kept as small as possible. This leads to the requirement that the reduction h for each forming pass must approach the reduction limit. However, due to insufficient mold stiffness, reaching the reduction limit would cause mold deformation. Controlling by reduction would result in unsatisfactory forming outcomes. Therefore, in this paper, we use the forming force P as the control parameter during the experimental process. Table 6 shows the experimental values of the forming force for the different pipes.
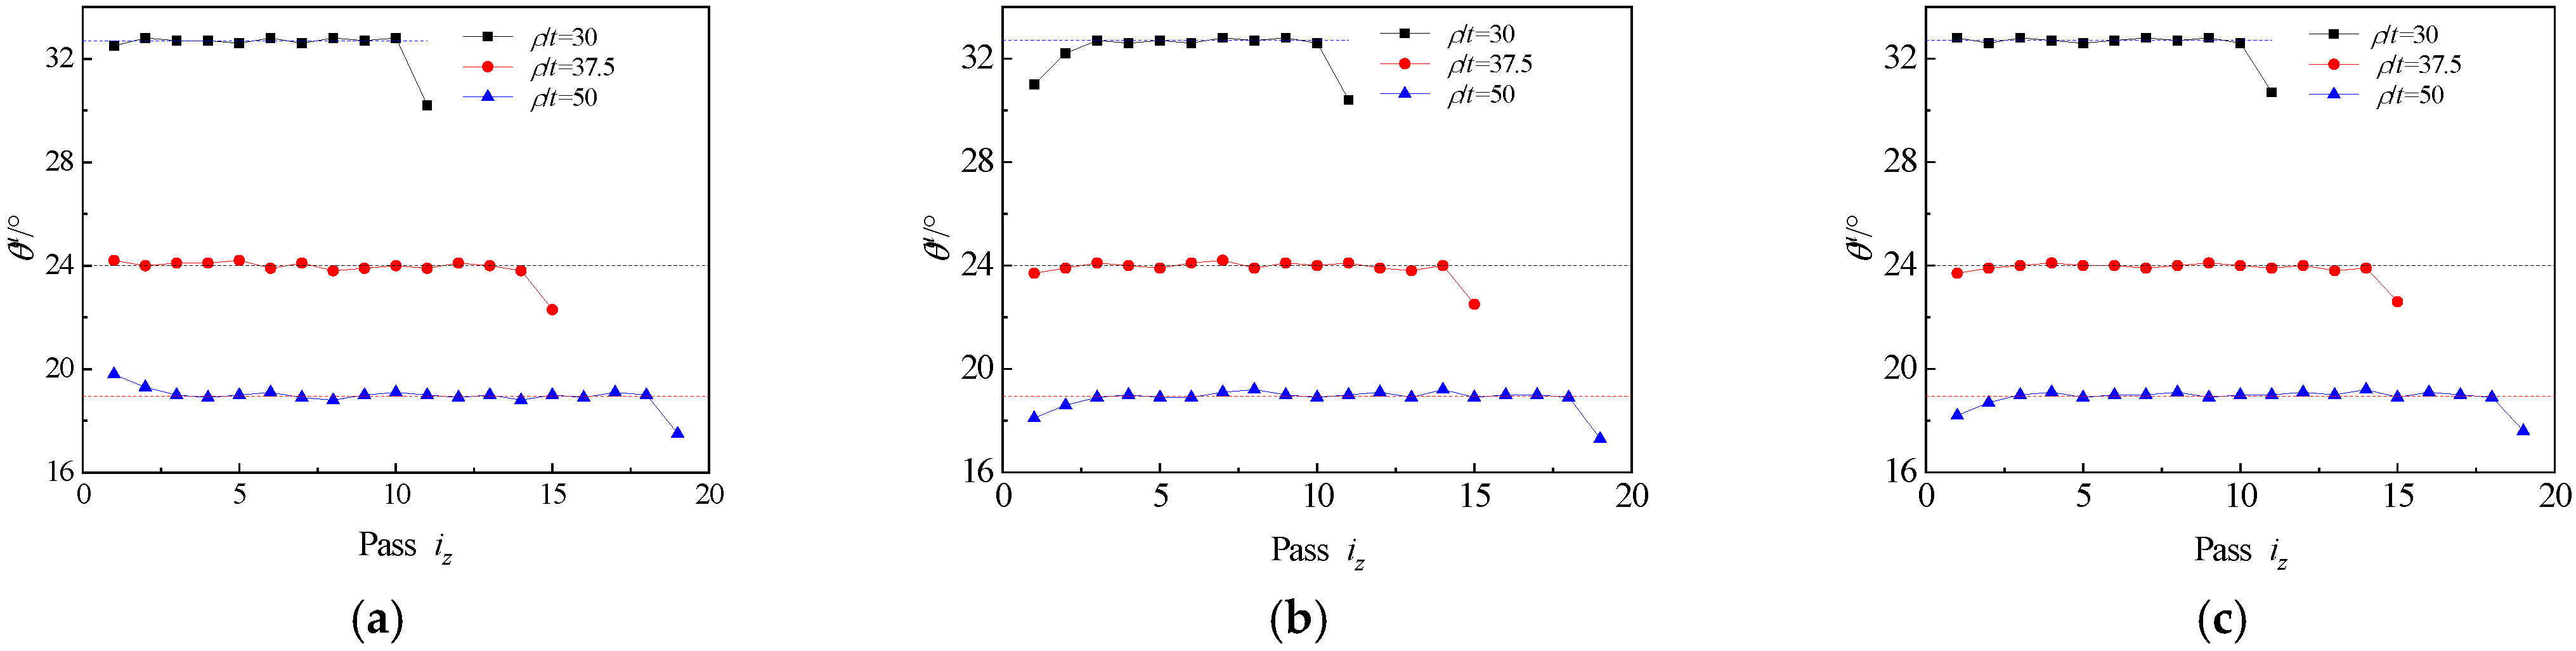
Figure 28 shows the variation in angle θ u during the forming process for different pipes. Since θ u remains unchanged during the simulation when the forming force P is constant, it was not added to the figure.
As shown in the figure, all forming angles of the pipes are relatively stable except for the first and last passes. The smaller forming angle of the first pass is attributed to its longer step length, while the smaller forming angle of the last pass is due to incomplete forming caused by punch obstruction. For aspect ratios of 30, 37.5, and 50, pipes can be obtained in 11, 15, and 19 passes, respectively, which are fewer than the 19, 27, and 35 passes required by the three-point bending JCO forming process.
Table 7 presents the experimental and simulated forming dimensions of the pipes. It can be seen from the table that, except for the No. 7 pipe, which has relatively large ovality due to operational errors, the ovality of the experimental forming results for all other pipes is less than 1.5%. Additionally, the ovality of the simulation results for all pipes is less than 0.7%— significantly lower than the engineering requirement of 2%.

6. Discussion

To improve the production efficiency and forming quality of the progressive forming process for LSAW pipes and to meet the increasingly stringent quality requirements, a theoretical analysis of the bending and springback processes during the four-point bending stage of the AFB forming process was conducted. This analysis utilized a bilinear material model, incorporated necessary conditional assumptions, and considered the influence of friction. Analytical expressions for key forming factors such as the bending moment, forming force, radius of curvature, forming angle, deflection distribution, and reduction were established. Subsequent simulation and experimental studies were carried out with different process parameters as single variables.
The effects of the friction μ , W p , W d , W d W p , R p , and R d on the forming force P , θ , θ u , and the relative gap Δ R were analyzed separately. The effects of each process parameter on the forming results were clarified. The results show the following:
33.
The friction μ exhibits a positive correlation with the forming force P and the relative gap Δ R when the reduction is relatively large and has little influence on the forming angle θ u .
34.
W p shows positive correlations with the forming force P , relative gap Δ R , and forming angle θ u .
35.
W d shows negative correlations with the forming force P , relative gap Δ R , and forming angle θ u .
36.
When W d W p remains constant, W p and the span of W d have little effect on the forming force P and the forming angle θ u , exhibiting a negative correlation with the relative gap Δ R .
37.
The effects of R p and R d are the same. Both are positively correlated with the forming force P , relative gap Δ R , and forming angle θ u .

7. Conclusions

Based on the aforementioned research results, a strategy for determining the process parameters of the AFB progressive forming process for LSAW pipes was formulated, and a specific calculation procedure was established. Experiments and simulations were conducted on pipes with different diameter-to-thickness ratios ρ / t to verify the correctness and reliability of this process parameter determination strategy. The experimental results showed that 11 passes, 15 passes, and 19 passes were required to complete the forming process for diameter-to-thickness ratios of 30, 37.5, and 50, respectively. The ovality of most experimental pipes was less than 1.5%, and the ovality of all simulated results was less than 0.7%, fully meeting the engineering application requirement of 2%. This verified the correctness of the established process parameter determination strategy.

Author Contributions

Conceptualization, Z.Z. and J.A.; methodology, Z.Z. and Y.L.; software, Z.Z.; validation, Z.Z., J.A. and J.S.; formal analysis, Z.Z.; investigation, J.S.; resources, Y.G.; data curation, J.S. and Y.G.; writing—original draft preparation, Z.Z.; writing—review and editing, J.A., Y.L. and Y.G.; visualization, Y.L.; supervision, J.A.; project administration, J.A. and Y.G.; funding acquisition, J.A. All authors have read and agreed to the published version of the manuscript.

Funding

This research was funded by The Natural Science Foundation of Henan Province, grant number 252300420487, APC funded by Henan Province; The Project of Science and Technology of the Henan province, grant number 252102230035, APC funded by Henan Province; Joint Fund of Henan Province Science and Technology R&D Program, grant number 245200810002, APC funded by Henan Province; Luoyang Institute of Technology Scientific Research Launch Fund Project, grant number 21010657, APC funded by Luoyang Institute of Science and Technology; Key R&D Special Project of Henan Province, grant number 261111230200, APC funded by Henan Province; Joint Fund of Science and Technology R&D Program of Henan Province, grant number 252103810008, APC funded by Henan Province; and Joint Fund of Science and Technology R&D Program of Henan Province, grant number 252103810167, APC funded by Henan Province.

Data Availability Statement

The original contributions presented in this study are included in the article. Further inquiries can be directed to the corresponding author.

Conflicts of Interest

Author Yan Gao was employed by the He’nan Institute of Metallurgy Co., Ltd. The remaining authors declare that the research was conducted in the absence of any commercial or financial relationships that could be construed as a potential conflict of interest.

Abbreviations

The following abbreviations are used in this manuscript:
LSAWLarge-scale longitudinally submerged arc-welded pipes
SFBSymmetrical four-point bending
AFBAsymmetrical four-point bending

References

  1. Medium- and Long-Term Oil and Gas Pipeline Network Plan. Available online: https://www.ndrc.gov.cn/xxgk/zcfb/ghwb/201707/t20170712_962238_ext.html (accessed on 23 June 2026).
  2. Huang, W.; Zheng, H.; Wu, C. Management and technological innovations of China-Russia Eastern Route Natural Gas Pipeline Project. Oil Gas Storage Transp. 2020, 39, 121–128. [Google Scholar]
  3. Global Longitudinal Submerged Arc Welded Pipe (LSAW) Competitive Landscape Professional Research Report 2025. Available online: https://marketpublishers.com/report/ferrous_metallurgy/steel/longitudinal-submerged-arc-welded-pipe-lsaw-research-report-dir.html (accessed on 23 June 2026).
  4. Supply-Demand Restructuring: Analysis and Outlook of Welded Pipe Industry. Available online: https://c.m.163.com/news/a/KP1AP0IK0514AHGG.html (accessed on 23 June 2026).
  5. Yang, J. Introduction to JCO’s continuous seam submerged arc welding pipe production equipment. Steel Roll. 2000, 6, 45–46. [Google Scholar]
  6. Chandel, J.D.; Singh, N.L. Formation of X-120 M line pipe through J-C-O-E technique. Engineering 2011, 3, 400–410. [Google Scholar] [CrossRef]
  7. Ye, Z. Research on the Principle and Application of Gradual Bending Forming. Master’s Thesis, Wuhan University of Technology, Wuhan, China, 2003. [Google Scholar]
  8. Bai, T.; Fan, L.; Yan, J.; Gao, Y.; Wang, B.; Yun, J. Optimization design of JCO forming process parameters for large-diameter LSAW pipes. J. Mech. Strength 2016, 38, 495–501. [Google Scholar]
  9. Yu, G.; Qi, S.; Peng, D.; Zhao, F.; Song, D.; Li, S.; Zhao, J. Research Progress on Reshaping Process of Large-diameter Longitudinal Submerged-arc Welded Pipes. Welded Pipe Tube 2024, 47, 1–7. [Google Scholar] [CrossRef] [Scilit]
  10. Tang, L. Analysis for the Formational Stresses of the Large Diameter Straight-Weld Pipe. Master’s Thesis, Tianjin University, Tianjin, China, 2006. [Google Scholar]
  11. Yang, Y. Prediction and experimental verification for bend forming behavior of heavy wall thickness steel plate based on elastic and plastic mechanics. J. Plast. Eng. 2019, 26, 98–106. [Google Scholar]
  12. Zhao, Y. Theoretical Study and Model Construction of JCO Continuous Bending of Stainless Steel Thick Wall Pipe. Master’s Thesis, Taiyuan University of Science and Technology, Taiyuan, China, 2023. [Google Scholar]
  13. Zhao, J.; Sun, H.; Song, X.; Ma, R. Four-point bending JCOC process: A new technology for forming umerical simulation of JCO/JCOE pipe forming longitudinally submerged arc welding pipe. J. Plast. Eng. 2012, 19, 59–62. [Google Scholar]
  14. Zhang, Z.; Wang, H.; Yu, G.; Zhao, J. Research on Four-Point Air Bending Process and Contour Detection Method for JCO Forming Process of LSAW Pipes. Metals 2019, 9, 859. [Google Scholar] [CrossRef] [Scilit]
  15. Song, H. Research on the New Technology for Forming the Lager Diameter LSAW Pipes with Four-Point Bending JCO Process and Compression. Ph.D. Thesis, Yanshan University, Qinhuangdao, China, 2012. [Google Scholar]
  16. He, J. Research on the New Technology for Forming the Lager Diameter LSAW Pipes with Four-Point Bending JCO Process and CAPP System. Master’s Thesis, Yanshan University, Qinhuangdao, China, 2015. [Google Scholar]
  17. Zhai, R.; Huo, J.; Yu, Z.; Zhuo, H.; Cheng, W.; Meng, Q. Four-point bending forming process planning of straight seam welded pipe for large structure. Int. J. Adv. Manuf. Technol. 2026, 144, 3473–3497. [Google Scholar] [CrossRef] [Scilit]
  18. Wen, M.; Zhang, X.; Shang, C. Research on single-pass forming width of JCOE longitudinal submerged arc welded pipe. Sci. Rep. 2025, 15, 35301. [Google Scholar] [CrossRef] [Scilit] [PubMed]
  19. Fan, L.; Liang, P.; Wang, G.; Ma, J.; Zhang, B. Analysis of Asymmetric Bending Deformation Process in JCO Forming of Straight Seam Welded Pipe. J. Plast. Eng. 2020, 27, 8. [Google Scholar]
  20. Yang, Y. Finite element simulation and theoretical calculation of the forming pressure of high steel grade thick walled straight seam submerged arc welded pipe JCO. Phys. Test. Chem. Anal. (Part A Phys. Test.) 2017, 53, 866–870. [Google Scholar]
  21. Li, Q.; Fan, L.; Gao, Y.; Zhang, S.; Yang, W. Influence of die radius on JCO forming for X80 pipeline pipe. J. Plast. Eng. 2010, 17, 113–118. [Google Scholar] [CrossRef] [Scilit]
  22. Zhang, Z.; Liu, Y.; Lu, Z.; Shen, J.; Gao, Y.; Chen, Y. Mechanical Analysis and Verification Research on Asymmetric Four-Point Bending for the JCO Forming Process of LSAW Pipes. Materials 2026, 19, 914. [Google Scholar] [CrossRef] [Scilit] [PubMed]
  23. Zhao, J.; Yin, J.; Ma, R.; Ma, L. Springback equation of small curvature plane bending. Sci. China Technol. Sci. 2011, 54, 2386–2396. [Google Scholar] [CrossRef] [Scilit]
  24. ABAQUS, version 6.14; SIMULIA Corporation: Johnston, RI, USA, 2014.
Figure 1. The four-point bending stage of the AFB mechanical model.
Metals 16 00803 g001
Figure 2. Uniaxial tensile test. (A) Tensile specimens; (B) tensile results.
Metals 16 00803 g002
Figure 3. Simulation process of AFB mechanical model. (a) Rigid rotation stage; (b) four-point bending stage; (c) unload stage.
Metals 16 00803 g003
Figure 4. Experimental system.
Metals 16 00803 g004
Figure 5. Effects of friction on forming force. (a) Simulation results; (b) mechanical results; (c) experimental results.
Metals 16 00803 g005
Figure 6. Effects of friction on forming angle. (a) Simulation results; (b) mechanical results.
Metals 16 00803 g006
Figure 7. Effects of friction on Δ R .
Metals 16 00803 g007
Figure 8. Effects of R p on forming force. (a) Simulation results; (b) mechanical results; (c) experimental results.
Metals 16 00803 g008
Figure 9. Effects of R p on forming angle. (a) Simulation results; (b) mechanical results.
Metals 16 00803 g009
Figure 10. Effects of R p on Δ R .
Metals 16 00803 g010
Figure 11. Effects of R d on forming force. (a) Simulation results; (b) mechanical results; (c) experimental results.
Metals 16 00803 g011
Figure 12. Effects of R d on forming angle. (a) Simulation results; (b) mechanical results.
Metals 16 00803 g012
Figure 13. Effects of R d on Δ R .
Metals 16 00803 g013
Figure 14. Effects of W p on forming force. (a) Simulation results; (b) mechanical results; (c) experimental results.
Metals 16 00803 g014
Figure 15. Effects of W p on forming angle. (a) Simulation results; (b) mechanical results.
Metals 16 00803 g015
Figure 16. Effects of W p on Δ R .
Metals 16 00803 g016
Figure 17. Effects of W d on forming force. (a) Simulation results; (b) mechanical results; (c) experimental results.
Metals 16 00803 g017
Figure 18. Effects of W d on forming angle. (a) Simulation results; (b) mechanical results.
Metals 16 00803 g018
Figure 19. Effects of W d on Δ R .
Metals 16 00803 g019
Figure 20. Effects of W d W p on forming force. (a) Simulation results; (b) mechanical results; (c) experimental results.
Metals 16 00803 g020
Figure 21. Effects of W d W p on forming angle. (a) Simulation results; (b) mechanical results.
Metals 16 00803 g021
Figure 22. Effects of W d W p on Δ R .
Metals 16 00803 g022
Figure 23. Step length of first and second passes of AFB progressive forming process.
Metals 16 00803 g023
Figure 24. Calculating process parameters of AFB progressive forming process.
Metals 16 00803 g024
Figure 25. The forming process for the No. 5 pipe.
Metals 16 00803 g025
Figure 26. Experimental results for all pipes. (a) t = 4 mm ASTM 1020; (b) t = 5 mm ASTM 1020; (c) t = 4 mm X80.
Metals 16 00803 g026
Figure 27. The simulation results for the No. 5 pipe.
Metals 16 00803 g027
Figure 28. Forming angle θ u for different pipes. (a) t = 4 mm ASTM 1020; (b) t = 5 mm ASTM 1020; (c) t = 4 mm X80.
Metals 16 00803 g028
Table 1. Dimensions of sheet.
MaterialThickness
/mm
Length
/mm
Width
/mm
X804300100
ASTM 10204300100
ASTM 10205300100
Table 2. The mechanical properties of the experimental sheet.
MaterialThickness
/mm
Yield Strength
σs/MPa
Young’s Modulus
E/GPa
Plastic Tangent Modulus
D/MPa
Poisson’s Ratio
ν
X804450 ± 3.4197 ± 4.97290 ± 230.20.3
ASTM 10204275 ± 2.0204 ± 3.32870 ± 72.90.3
ASTM 10205282 ± 2.3210 ± 4.42530 ± 85.50.3
Table 3. Process parameters used in finite element simulation and experiment.
R p /mm R d /mm W p /mm W d /mm μ
101030500
151535550.06
202040600.12
Table 4. The specific dimensions of the target pipes.
MaterialNo.Thickness
/mm
Width
/mm
ρ / t ρ /mm
ASTM 10201410030120
237.5150
350200
ASTM 10204510030150
537.5187.5
650250
X807410030120
837.5150
950200
Table 5. AFB process parameters for progressive forming process.
No.Sheet Length
/mm
Passes
N
Pass Length
/mm
Forming Angle
θ u
a
/mm
Rp
/mm
Rd
/mm
Wp
/mm
Wd
/mm
Reduction
h/mm
Forming Force
P/kN
1754116832.734202022.543.54.5444
294315622431151523372.6348.5
31257196618.933101027.5371.9571.5
4943118532.743202031.553.54.6355.9
5117815782439.5151531462.8466.8
61571198218.941.5101031411.78100.9
7754116832.734202021.544.55.0460.3
894315622431151522383.5171.5
91257196618.933101027371.99110.5
Table 6. Forming force for different pipes.
No.123456789
Forming force P/kN434870596810862.572113
Table 7. Experiment and simulations forming dimensions of all pipes.
No.Experimental Pipe Major Axis
Amax/mm
Experimental Pipe Minor Axis
Amin/mm
Experimental Pipe Ovality
∇/%
Simulation Pipe Major Axis
Amax/mm
Simulation Pipe Minor Axis
Amin/mm
Simulation Pipe Ovality
∇/%
12462440.82244.6243.90.29
23073051.32305.0303.60.46
34074030.99405.3403.50.45
43063040.66305.8304.10.56
53883831.32381.5379.30.58
65085021.19506.9504.10.56
72482432.05245.3243.60.70
83063021.31305.5303.40.69
94094041.24406.3403.50.69
Disclaimer/Publisher’s Note: The statements, opinions and data contained in all publications are solely those of the individual author(s) and contributor(s) and not of MDPI and/or the editor(s). MDPI and/or the editor(s) disclaim responsibility for any injury to people or property resulting from any ideas, methods, instructions or products referred to in the content.