Article

Asymmetric Residual Stress Distribution in Friction Stir Welded Magnesium Alloy: A Sequentially Coupled Thermo-Mechanical Analysis

1
College of Materials Science and Engineering, Chongqing University, Chongqing 400044, China
2
Guangdong Provincial Key Laboratory of Material Joining and Advanced Manufacturing, China-Ukraine Institute of Welding, Guangdong Academy of Sciences, Guangzhou 510650, China
3
Shenyang National Laboratory for Materials Science, Chongqing University, Chongqing 400044, China
*
Authors to whom correspondence should be addressed.
These authors contributed equally to this work.
Metals 2026, 16(7), 774; https://doi.org/10.3390/met16070774
Submission received: 16 June 2026 / Revised: 4 July 2026 / Accepted: 7 July 2026 / Published: 11 July 2026

Abstract

Friction stir welding (FSW) is an effective solid-state joining technique for magnesium alloys such as AZ31, owing to its ability to minimize conventional welding defects. Nevertheless, the process generates significant residual stresses that can impair the fatigue performance and dimensional stability of welded structures. In this study, a sequentially coupled thermo-mechanical finite element model was employed to characterize the residual stress distribution in FSW AZ31 Mg alloy. The calculated near-surface longitudinal residual stress was assessed against XRD measurements at five locations on the top surface, giving a root mean square error of about 10.34 MPa. The results revealed an M-shaped longitudinal residual stress profile with marked asymmetry between the advancing and retreating sides, associated with non-uniform heat input and the resulting asymmetric temperature history. Among the three stress components, the longitudinal residual stress was the largest, followed by the transverse component, while the normal stress was the smallest. The thermo-mechanically affected zone and the crown zone exhibited higher residual stresses compared to the heat-affected zone. In addition, the influences of welding speed and tool rotational speed on residual stress evolution were systematically evaluated. The longitudinal residual stress increased with welding speed up to 350 mm/min and subsequently decreased, while a peak value was observed at 1200 rpm. These numerical results provide useful guidance, within the studied parameter range, for welding-parameter selection and residual-stress control in magnesium alloy joints.

1. Introduction

Friction stir welding (FSW) is extensively utilized as a solid-state joining method for magnesium alloys due to its efficacy in eliminating common fusion welding defects such as cracks, porosity and inclusion [1,2,3,4]. Nevertheless, the residual stresses inherent to the welding process significantly affect the fatigue resistance, stress corrosion cracking susceptibility, dimensional stability and mechanical performance of welded components [5,6,7,8]. From a mechanistic perspective, these residual stresses superimpose on service load, altering the effective mean stress. In particular, high tensile residual stresses reduce the margin to both yield and ultimate strengths, whereas compressive residual stresses can be beneficial [8]. A thorough understanding of residual stress distribution is therefore essential for optimizing welding parameters and improving the long-term reliability of FSW joints.
The distribution of residual stresses in FSW has been extensively investigated through both experimental and numerical approaches [9,10,11]. Experimental techniques such as X-ray diffraction (XRD), neutron diffraction and hole-drilling offer high measurement accuracy for local residual stress. However, these methods are limited by poor spatial resolution, high cost, and time-consuming procedures [10,11,12]. In contrast, numerical approaches employing finite element modelling (FEM) enable comprehensive examination of the full residual stress field, effectively overcoming the aforementioned experimental limitations. Various FEM frameworks [13], including smoothed particle hydrodynamics (SPH) [14,15], coupled Eulerian–Lagrangian (CEL) [16,17], arbitrary Lagrangian–Eulerian (ALE) methods [18], and sequentially coupled thermo-mechanical models [19,20], have been successfully applied to FSW. These models generally reproduce the characteristic M-shaped residual stress profile that results from non-uniform heat input, localized plastic deformation, and differential cooling during welding [6,10,21,22]. However, most existing models predict a nearly symmetrical residual stress distribution between the advancing side (AS) and retreating side (RS), which contradicts the asymmetrical distributions observed experimentally [5,6,10,22,23].
The root cause of this discrepancy lies in the inadequate representation of the asymmetric heat generation inherent to the FSW process at the modelling level. Our previous work demonstrated that when the differences in frictional heat generation between the tool side and bottom surfaces are considered, the temperature distributions on the AS and RS exhibit pronounced asymmetry, indicating that the heat input modelling approach directly influences the simulated temperature difference across the weld [24]. This persistent discrepancy highlights that accurately capturing the inherent process asymmetry—particularly the role of non-uniform heat generation and the resulting asymmetric temperature history—remains a key challenge in residual stress modelling. Addressing this gap is critical because asymmetric residual stresses can lead to side-dependent fatigue performance and distortion in service [25].
In addition to this unresolved asymmetry issue, the influence of welding parameters on residual stress formation remains insufficiently clarified. Generally, higher welding speeds reduce the tool-workpiece interaction time, producing steeper temperature gradients that, during subsequent cooling, lead to elevated residual stresses due to non-uniform thermal contraction [21,26,27,28,29]. Similarly, increasing the rotational speed enhances frictional heating and plastic deformation, thereby intensifying thermal expansion and contraction cycles and potentially increasing residual stress [22,29]. For instance, Farhang et al. [21] reported that increasing the welding speed from 25 to 31.5 mm/min in AA2024-T6 aluminum alloy enhanced the longitudinal residual stress by 12.5% and 2.67% at rotational speeds of 1120 and 1600 rpm, respectively. He et al. [22] observed that raising the rotational rate from 500 to 900 rpm in AA6061-T6 alloy increased longitudinal residual stresses to approximately 55% of the material’s yield strength. More broadly, friction stir welding and its derivative processes have been studied extensively for dissimilar aluminum joints, particle-reinforced systems, and additive friction stir deposition, in which process parameters, reinforcement, and residual stress jointly govern joint performance [30,31,32,33], and parameter optimization has likewise been applied to SiCp-reinforced AZ31 magnesium alloy [34]. These experimental observations will serve as reference points for contextualizing the parametric trends obtained from the present model in Section 4.3. Nevertheless, the effects of welding parameters on residual stress are complex, governed by the coupled evolution of temperature fields and plastic deformation during welding [26,27,28]. Systematic numerical investigations are therefore required to achieve reliable predictions of residual stress distributions and to support the optimization of welding parameters.
To address these challenges, a sequentially coupled thermo-mechanical model is adopted in this work. Compared to fully coupled approaches [26,35], this method offers a favorable balance between computational efficiency and predictive capability, making it well-suited for parametric studies across a range of welding conditions. Although it does not capture instantaneous thermal–mechanical feedback, it has been shown to adequately reproduce the primary temperature and residual stress fields in FSW [19,20], while enabling the systematic investigation of process asymmetry that is often overlooked in conventional simulations.
In the present study, the sequentially coupled thermo-mechanical finite element model is employed to investigate the asymmetrical residual stress distribution and the influence of welding parameters on residual stress formation in FSW of AZ31 Mg alloy. The calculated near-surface longitudinal residual stress is assessed against XRD measurements at five top-surface locations. This work aims to clarify the relationship between welding parameters and residual stresses, providing insights for the optimization of welding conditions to enhance the mechanical performance of Mg alloy joints. Although previous parametric studies [21,22,23,27,28,29,36] have suggested that welding speed and rotational speed can alter residual stress magnitude and distribution, systematic investigations specifically targeting AZ31 Mg alloy remain limited. Rather than presenting the sequential formulation as a methodological innovation, this study uses a previously assessed asymmetric heat-source model to examine whether the AS/RS residual-stress asymmetry can be reproduced in a sequential residual-stress analysis. It also characterizes the calculated spatial field and examines one-factor effects of welding speed and rotational speed within the adopted modelling framework.

2. Experimental Procedures

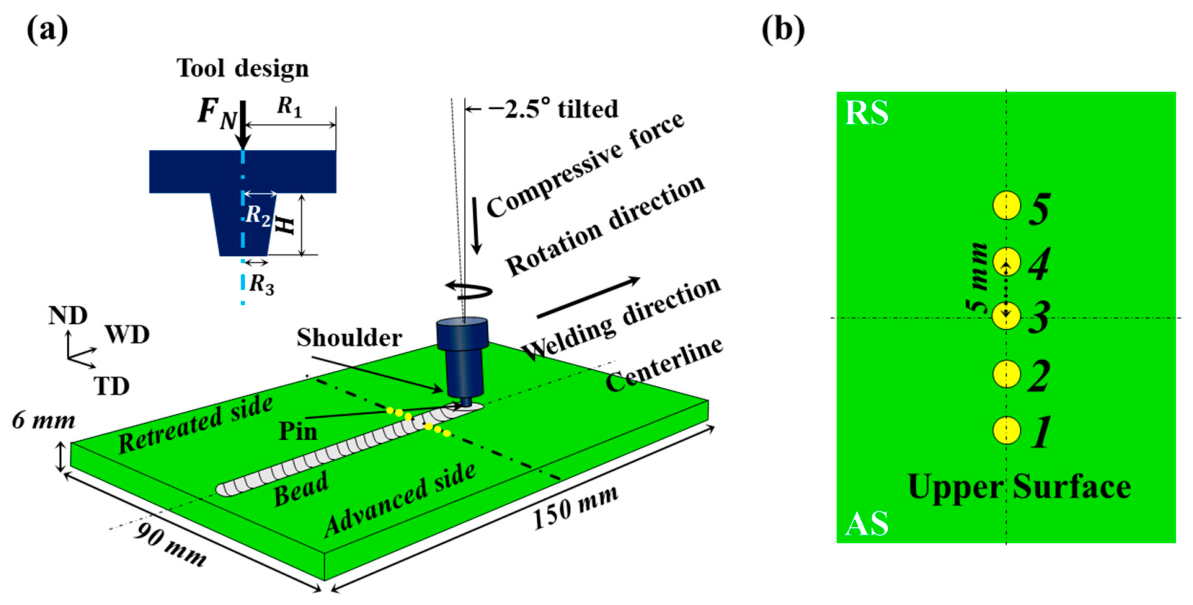
The base material used for both experiments and modelling was a commercial AZ31 Mg alloy sheet with a thickness of approximately 6 mm and planar dimensions of 150 mm × 90 mm. Welding was performed on a gantry-type FSW machine, and a schematic diagram of the welding process is shown in Figure 1a. The primary geometric directions are defined as the normal direction (ND), transverse direction (TD), and welding direction (WD). During FSW, a non-consumable tool with a shoulder diameter of 18 mm, a conical threaded pin (root diameter 8 mm, tip diameter 5.5 mm, and length 5.6 mm) was used. The tool was tilted 2.5° relative to the WD and rotated anticlockwise at a constant speed of 800 rpm. The entire welding procedure was divided into four stages according to tool movement and dwell time: (1) penetration into the plate along the ND at a slow rate of 20 mm/min; (2) dwell at the plunging point for 6 s; (3) lateral movement along the WD at 90 mm/min; and (4) dwell at the terminal point for 2 s.
As illustrated in Figure 1b, post-weld residual stress measurements were conducted at five representative locations on the top surface: 10 mm from the weld centerline on the advancing side (point 1) and retreating side (point 5), 5 mm on the advancing side (point 2) and retreating side (point 4), and at the weld centerline (point 3). Residual stresses were determined by X-ray diffraction (XRD) using Cu–Kα radiation (λ = 1.5418 Å) [11,12]. Measurements were performed on a Rigaku D/max 2500PC diffractometer with the Cu target operated at 40 kV and 150 mA, using the (0002) diffraction reflection of the magnesium matrix, with a penetration depth of approximately 5 μm (near-surface measurement). At each location, one complete sin2ψ sequence was acquired from ψ = −20° to +20° in 5° increments, giving nine ψ tilts per point. The corresponding diffraction angles were recorded, and a linear regression analysis was performed on the 2θ versus sin2ψ data. Residual stresses were determined using the well-established sin2ψ method, assuming a biaxial near-surface stress state, with Young’s modulus of 44,319 MPa and Poisson’s ratio of 0.33 adopted as the X-ray elastic constants.
The five locations span the weld centerline, the off-center regions where the calculated M-shaped profile reaches its maxima, and both sides of the weld, thereby enabling a direct AS/RS comparison.
The use of discrete measurement points provides a practical validation of the numerical model; however, it is acknowledged that the limited number of points does not capture the full spatial variation in residual stress, particularly the steep gradients near the weld center. The experimental data serve primarily to verify the overall trend and order of magnitude of the predicted stresses.

3. The FEM Model

3.1. Mesh and Boundary Conditions

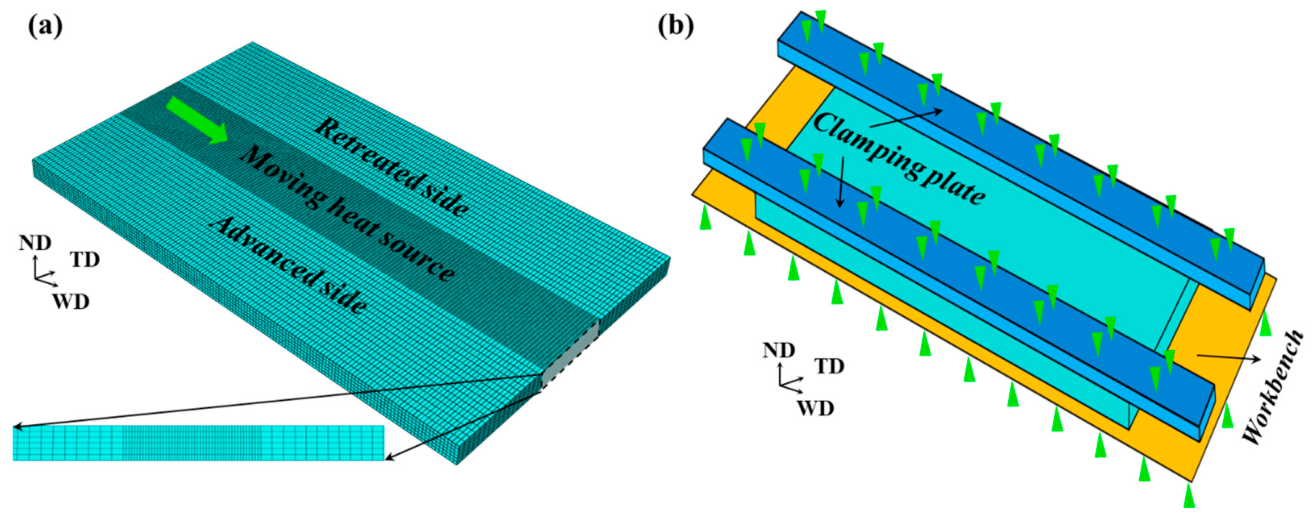
In our previous work, the temperature field of FSW AZ31 Mg alloys was established using a moving heat-source model [24]. Based on the calculated thermal cycles, a subsequent thermo-mechanical stress–strain analysis was performed using the commercial FEM software ABAQUS 6.14. The dimensions of the FEM model were designed to match the experimental workpiece. As shown in Figure 2a, a non-uniform meshing strategy was employed to balance accuracy and computational cost [24]. Specifically, a refined mesh with element dimensions of 0.5 mm × 1.5 mm × 2 mm was applied in the weld zone to capture the steep temperature and strain gradients expected in this region, whereas a coarser mesh of 1 mm × 1.5 mm × 2 mm was used elsewhere. The workpiece contained a total of 72,900 three-dimensional 8-node reduced-integration elements (C3D8R) with hourglass control. C3D8R was selected to balance computational cost and accuracy in the large three-dimensional thermo-mechanical elastoplastic analysis; reduced integration helps limit locking-related numerical stiffness, and hourglass control was used to control hourglass modes.
In the present work, residual stress was examined by varying the welding speed (90–600 mm/min) and rotational speed (800–1600 rpm). The investigated parameter levels are summarized in Table 1. The applied boundary conditions and constraints are illustrated in Figure 2b. The clamping plate and backing anvil (workbench) limited workpiece displacement along the ND, while deformation along the WD and TD was allowed to accommodate welding-induced distortion. These boundary conditions were maintained throughout the welding and subsequent cooling stages to simulate the physical constraint of the fixturing. A constant friction coefficient of 0.3 was prescribed at the contact interfaces between the workpiece and the clamping plate/backing anvil, which is a commonly adopted value in FSW simulations for magnesium alloys [24].
Because workpiece–fixturing friction can vary with temperature, contact pressure, and sliding conditions, the constant value is treated as a modelling assumption. This coefficient applies only to the workpiece–fixturing contact in the mechanical analysis; tool–workpiece frictional heat generation is represented separately by the asymmetric thermal model [24]. Its quantitative influence on the calculated residual stress is included among the uncertainty factors identified in Section 4.4.

3.2. Material Parameters and Constitutive Model

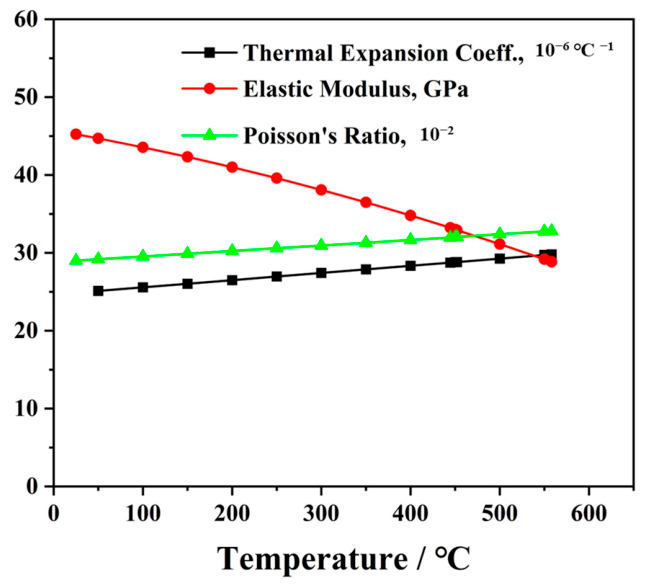
The nodal temperature histories obtained from the moving heat-source model [24,37,38] were imported into an elastoplastic framework for residual stress evaluation. The temperature field was obtained from the asymmetric frictional moving heat-source model reported in [24], which separates heat-generation contributions from the shoulder bottom, shoulder side, pin bottom, and pin side. The resulting nodal temperature histories were transferred to the mechanical analysis as predefined temperatures. The thermal model was previously assessed against K-type thermocouple measurements, with a reported maximum relative error of the peak temperature of about 10%. The sequential implementation therefore evaluates the mechanical response to this assessed thermal history; material flow and instantaneous thermo-mechanical feedback are not explicitly resolved. Figure 3 illustrates the temperature-dependent thermomechanical properties of AZ31 Mg alloy [39] from ambient temperature to 560 °C, including the elastic modulus, Poisson’s ratio, and thermal expansion coefficient. This upper value is the tabulation limit of the property data rather than a predicted welding temperature, since the calculated peak temperature in the steady-welding stage is about 485 °C [24], below the reported AZ31 solidus of about 566 °C. Specifically, the elastic modulus drops from 45.2 GPa at room temperature to 28.8 GPa at 560 °C. In contrast, the thermal expansion coefficient exhibits relative stability, with values of 25 × 106 °C1 at room temperature and 29.8 × 10⁶ °C1 at 560 °C. Poisson’s ratio increases from 0.29 at room temperature to 0.328 at 560 °C.
Given the substantial plastic deformation during FSW, the Johnson–Cook constitutive law was adopted to represent the flow behavior of the AZ31 Mg alloy [40,41,42]. This model is typically expressed as shown in Equation (1):
σ = A + B ε n × 1 + C l n ε ˙ ε ˙ 0 × 1 T T r T m T r m
In Equation (1), A represents the yield strength at room temperature under the reference strain rate, while B and n denote the material strain hardening coefficient and exponent, respectively. The term A + B ε n describes the strain-hardening contribution. Parameter C is the strain-rate hardening coefficient, ε ˙ is the strain rate, and ε ˙ 0 = 10 - 3   s 1 is the reference strain rate used in this study. The strain-rate effect is captured by the logarithmic term 1 +   Cln ε ˙ ε ˙ 0 . Parameter T denotes the material temperature, T m is the melting temperature, and T r = 20   ° C is the room temperature. The temperature-dependent softening effect is given by the term 1     T T r T m T r m . The individual Johnson–Cook parameters for the AZ31 Mg alloy used in this computational model are provided in Table 2 for clarity [42].
The temperature dependence of the elastic modulus, Poisson’s ratio, and thermal expansion coefficient was incorporated as shown in Figure 3, while the Johnson–Cook model captures the temperature- and strain-rate-dependent plastic flow. This combination allows a reasonable representation of the material behavior during the FSW thermal cycle.

4. Results and Discussion

4.1. Model Verification

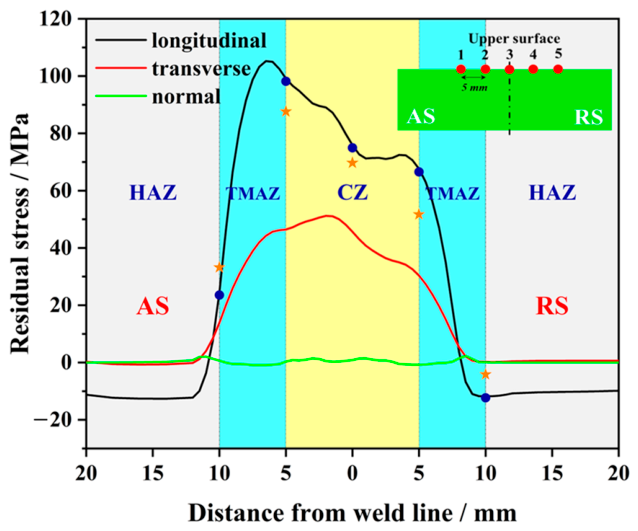
Figure 4 compares the numerically predicted longitudinal residual stresses (solid curve) with the experimental X-ray diffraction measurements (star markers) at five representative locations across the weld top surface. Before examining the longitudinal component, however, it is instructive to consider the difference among the three residual stress components.
As shown in Figure 4, among the three stress components, the longitudinal residual stress (along the welding direction, WD) is the largest, followed by the transverse component (along the transverse direction, TD), while the normal stress (along the normal direction, ND) is the smallest. For the reference top surface transverse profile, the calculated longitudinal stress exhibits an M-shaped distribution with a peak of about 105 MPa; the transverse component peaks at approximately 46.5 MPa near the weld centerline, and the normal component remains within a few MPa. This component ranking is a numerical result of the present model, whereas the XRD measurements assess only the near-surface longitudinal component. This difference is consistent with the dominant thermal mismatch and in-plane cooling contraction in FSW, as reported in the literature [6,8,22]. Specifically, the heat-affected zone along the WD is more continuous, leading to a longer constrained contraction path during cooling, which further amplifies the longitudinal residual stress.
Moreover, the longitudinal residual stress exhibits a characteristic M-shaped profile across the TD, with two tensile maxima close to the weld centerline. In Figure 4, the CZ, TMAZ, and HAZ labels are approximate top-surface positional guides inferred from the projected dimensions of the tool pin and shoulder. The calculated peaks reach 99.1 MPa on the AS and 67.6 MPa on the RS at a 5 mm offset from the centerline. Within the present sequential framework, the AS/RS difference is associated with the asymmetric temperature history generated by the non-uniform heat input. The AS is hotter and exhibits a steeper temperature gradient than the RS. The thermal analysis in [24] reports an AS/RS temperature difference of up to 17.3 °C at corresponding locations. The larger thermal excursion and steeper gradient on the AS lead to a larger constrained thermal contraction during cooling and, consequently, a higher longitudinal residual stress on that side.
Turning to the experimental validation, the measured longitudinal residual stresses (star markers in Figure 4) follow the same M-shaped trend as the simulation. The peak stress appears at the same transverse location (≈5 mm from the centerline on the AS), and the overall distribution shape is well reproduced. Quantitatively, the root-mean-square error across the five measurement points is approximately 10.34 MPa, and the average absolute error is 9.82 MPa. The experimental asymmetry ratio (AS peak/RS peak) is comparable with the simulation one (1.25 vs. 1.47), indicating that the model captures the qualitative asymmetry with reasonable fidelity. These comparisons support the ability of the model to reproduce the reference-condition near-surface longitudinal-stress profile and its AS/RS trend. Because the XRD assessment is limited to five single-scan near-surface locations, the through-thickness field and the parameter-sweep results presented below are treated as numerical predictions requiring further experimental assessment. It is considered that the minor deviations primarily stem from the limitations of the sequentially coupled thermo-mechanical approach, which cannot explicitly capture additional heat generation associated with severe plastic deformation within the CZ and TMAZ. Nevertheless, the good agreement in trend, peak location, and asymmetry confirms that the model can reproduce the reference-condition near-surface longitudinal-stress profile within the stated validation limits. Unlike many previous numerical simulations that predicted a nearly symmetrical residual stress distribution [17,19,20], the present model captures the experimentally observed asymmetry by incorporating non-uniform heat input in the assessed thermal history.

4.2. Numerical Spatial Heterogeneity of the Longitudinal Residual Stress Field

Because the longitudinal residual stress is the largest component and therefore has the most significant influence on the mechanical performance of welded components, the following analysis focuses on the longitudinal residual stress and its three-dimensional spatial heterogeneity along the WD, TD, and ND.

4.2.1. Overview of the Welding Stages and Through-Thickness Layers

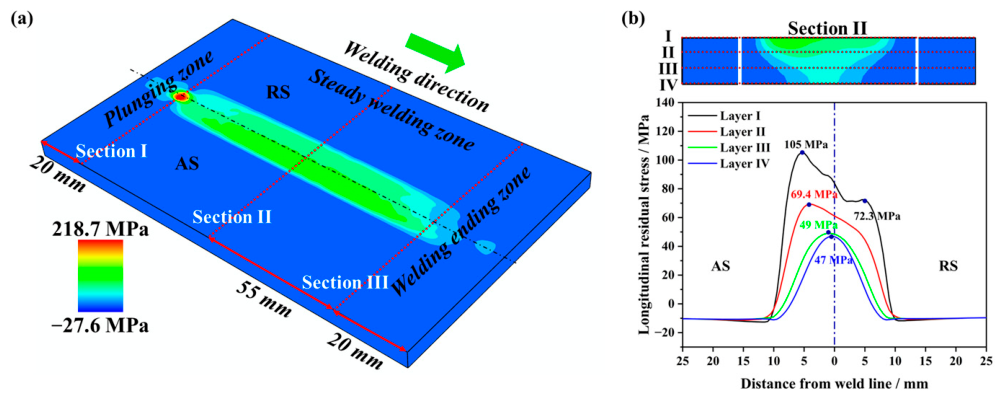
Figure 5a presents a contour map of the longitudinal residual stress on the top surface, clearly partitioning the workpiece into three characteristic zones along the WD: the plunging zone (Section I), the steady-welding zone (Section II), and the welding-ending zone (Section III). These three zones represent three stages of the welding process. The color code indicating stress level is placed on the left bottom. It is clear that the highest stress appears adjacent to the plunging zone and gradually attenuates towards the welding-ending zone. To analyze the through-thickness variation later, four layers (Layer I to Layer IV) are also defined from the top surface to the bottom.

4.2.2. Transverse Distributions in the Steady-Welding Zone (Section II)

The transverse distribution of longitudinal residual stress in steady-welding zone is shown in Figure 5b, which was measured in Layers I–IV across the weld centerline from AS to RS. In Layer I (top surface), the stress profile exhibits a clear M-shape with two peaks. The peak on the AS (≈105 MPa) is significantly higher than that on the RS (≈72 MPa), confirming the asymmetry noted in Section 4.1. With increasing depth (Layers II and III), the overall stress magnitude decreases, and the M-shape becomes less pronounced. The peaks shift slightly towards the centerline. In Layer IV (bottom surface), the stress magnitude is substantially reduced but still shows a weak tensile peak near the centerline, with the weakest lateral asymmetry among the four layers.
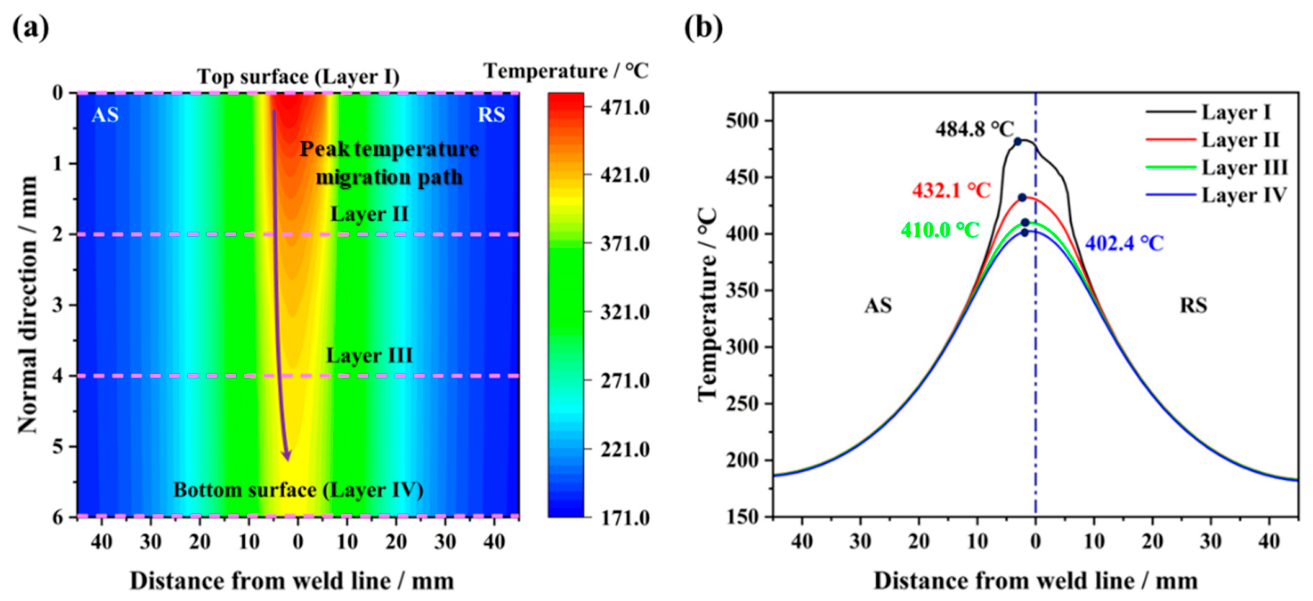
To figure out whether this through-thickness attenuation is related to the temperature field, the instantaneous temperature distribution (at 60 s) on a representative cross-section in the steady-welding zone is displayed in Figure 6a. Moreover, Figure 6b presents the temperature profile extracted from the simulated results across the centerline in different layers indicated in Figure 6a. The peak temperature (484.8 °C) appears on the top surface of the AS. Temperature decreases with depth and with distance from the weld centerline, and it is consistently higher on the AS than on the RS. Consequently, the top surface experiences the most intense thermal cycle and the steepest temperature gradients, leading to the highest residual stresses. The cooler, more constrained interior and bottom layers undergo less thermal contraction mismatch, resulting in lower residual stresses.
Moreover, the calculated peak in Figure 5b occurs close to the approximate shoulder-affected positional region. Because metallographic boundaries were not measured for the present joint, the location is discussed relative to the tool geometry rather than assigned to a CZ or TMAZ. The stress concentration is consistent with the combined contraction of the hot central region and the restraint imposed by the cooler surrounding material during cooling.

4.2.3. Transverse Distributions in the Plunging and Welding-Ending Zones

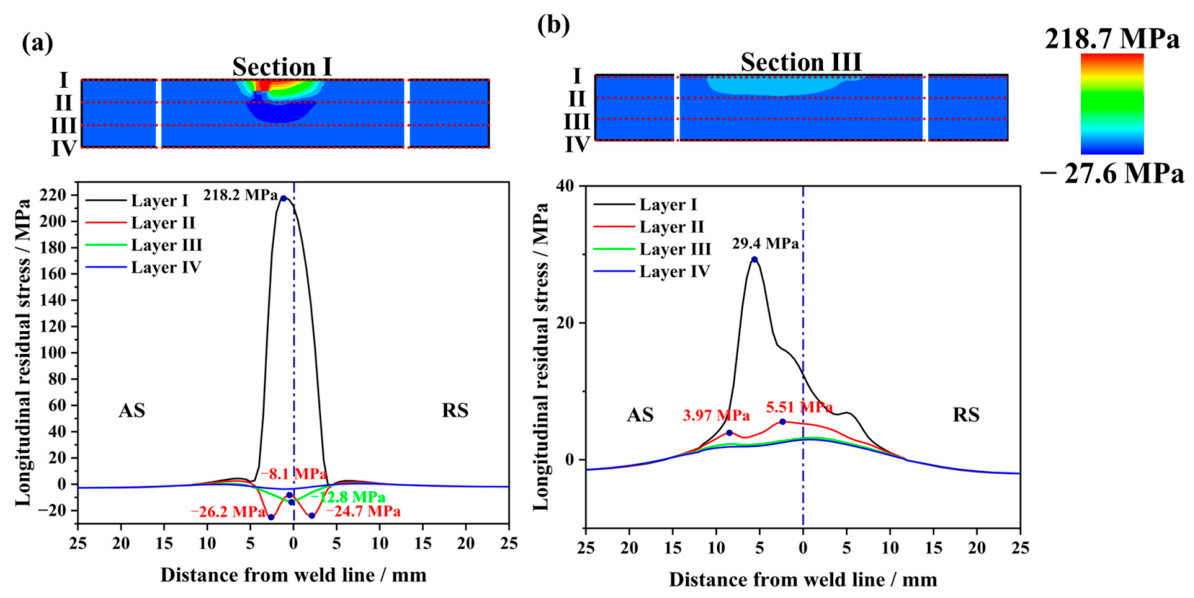
Figure 7a,b present the transverse distributions of longitudinal residual stress in plunging zone and welding-ending zone, respectively. Similarly, the longitudinal residual stress is extracted in Layers I–IV across the centerline from AS to RS. In plunging zone, a needle-like peak stress of 218.7 MPa is observed on Layer I close to the centerline, while the responses in Layers II–IV are substantially lower. Small troughs of near-neutral or slightly compressive stress appear away from the centerline. This reflects the highly localized thermo-mechanical effect during plunging and dwelling, consistent with the intense local heating and rapid cooling in this transient stage.
In welding-ending zone, all peak residual stresses throughout the thickness are substantially reduced, dropping from about 29 MPa at the top surface to near zero at the bottom. This is related to stress relaxation induced by tool retraction and subsequent heat reduction. Overall, the distinct transverse stress distributions in the three zones are primarily governed by the corresponding temperature fields: the plunging zone features an intense, localized thermal spike; the steady-welding zone develops a stable, asymmetric temperature field; and the welding-ending zone experiences rapid cooling with reduced heat input.

4.2.4. Correspondence Between Longitudinal Residual Stress and Peak Temperature on the Top Surface

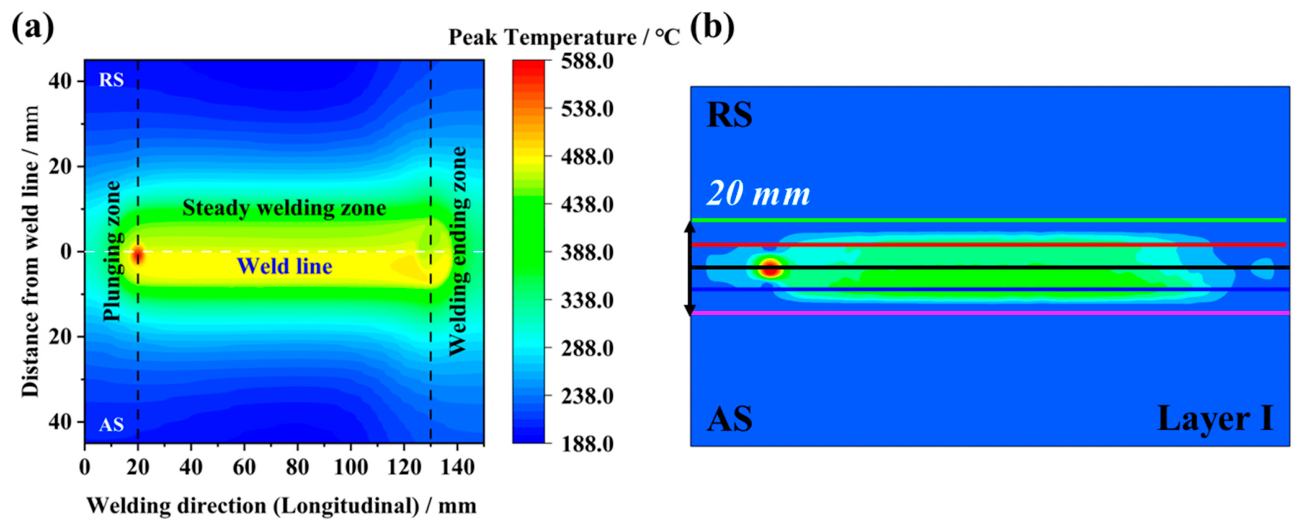
To further reveal the relationship between residual stress formation and thermal history, Figure 8a shows the contour of peak temperature experienced by each material point during the entire welding process, and Figure 8b shows the resulting longitudinal residual stress distribution on the top surface (Layer I). The two maps exhibit a strong spatial correspondence. A continuous high-temperature band forms along the weld centerline in the steady-welding zone, which corresponds closely to the high-stress band in Figure 8b.
The highest peak-temperature region appears near the weld line in the plunging and early welding region, with a spatial bias consistent with the asymmetric heat input. The temperature gradient is steeper on the AS than on the RS, directly contributing to the observed stress asymmetry. This correspondence confirms that the longitudinal residual stress distribution is primarily driven by the spatial variation in peak temperature and the resulting differential thermal contraction.

4.2.5. Evolution Along the Welding Direction at Different Depths and Lateral Offsets

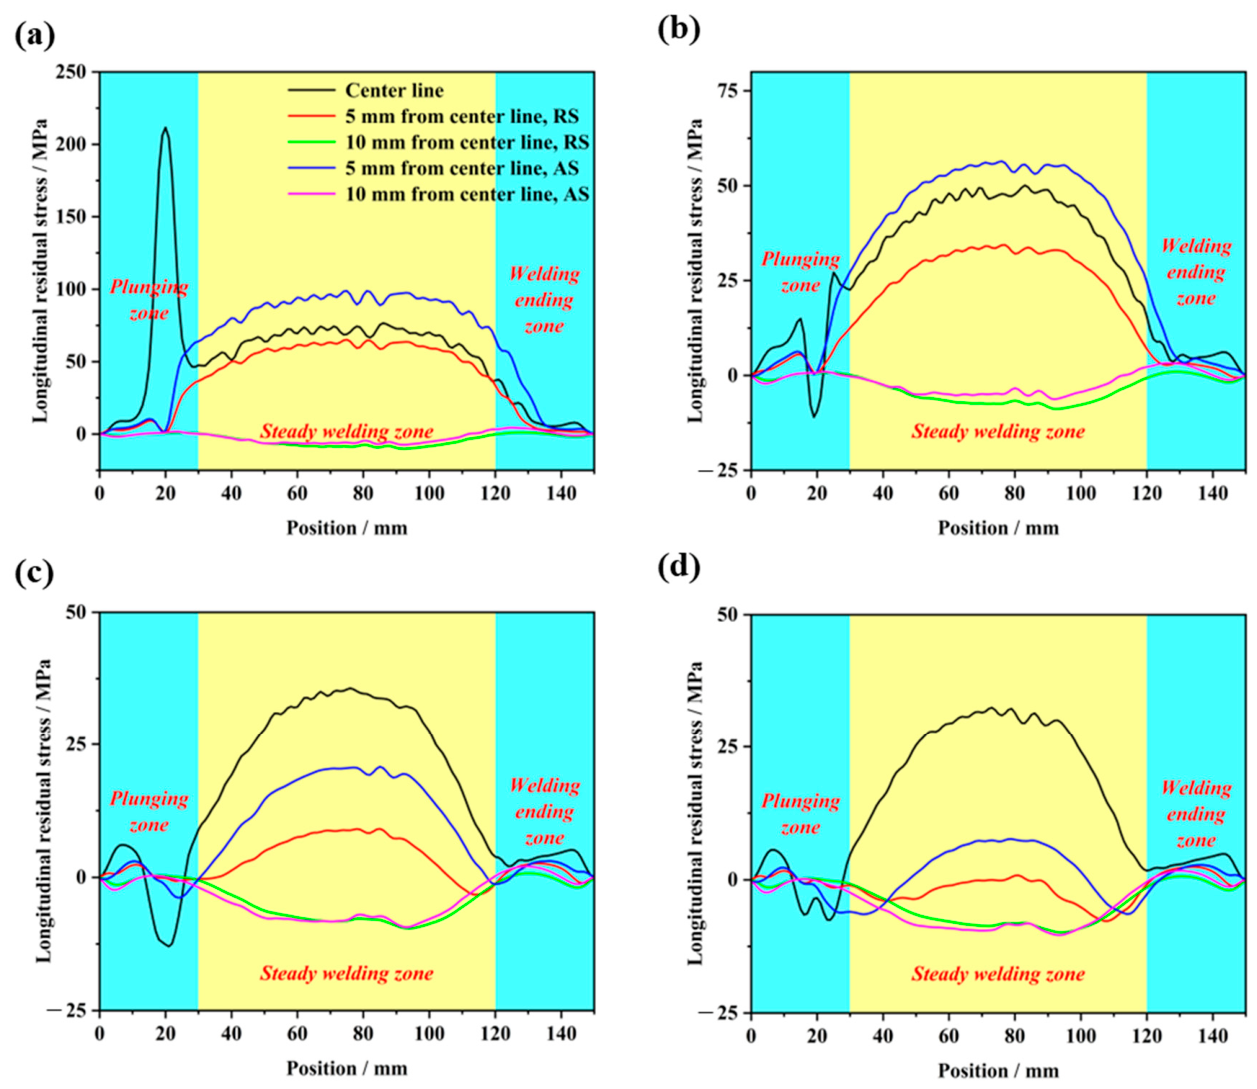
Figure 9 provides a quantitative characterization of the longitudinal residual stress evolution along the WD at different thicknesses and lateral positions. Specifically, the stress profiles for Layers I–IV are presented in Figure 9a–d, respectively, at the weld centerline and at offsets of 5 mm and 10 mm on both the AS and RS. In Layer I (top surface), the centerline stress exhibits a sharp spike in the plunging zone, maintains a high plateau in the steady-welding zone, and drops sharply in the welding-ending zone. Except for the 5 mm AS profile in Layer I, the stress levels at the off-center positions are generally lower than the centerline, indicating that high residual stress is mainly concentrated in the weld core region.
In layers II and III (Figure 9b,c), the curve amplitudes gradually decrease, and the plateau range in the steady-welding zone progressively narrows. This reflects the diminishing influence of the tool shoulder during the welding process with increasing depth. In layer IV (Figure 9d), the overall stress level is significantly reduced, with only a weak tensile response remaining near the centerline.
Importantly, at the same offset distance, the curves on the AS and RS do not completely overlap. This confirms that the longitudinal residual stress retains a measurable transverse asymmetry even when viewed along the WD. In summary, the post-weld residual stress not only exhibits a pronounced surface concentration effect but is also influenced by the asymmetric heat input distribution and the resulting temperature history; possible material-flow effects are not explicitly resolved in the present sequential model.

4.3. Effect of Welding Parameters on Residual Stress

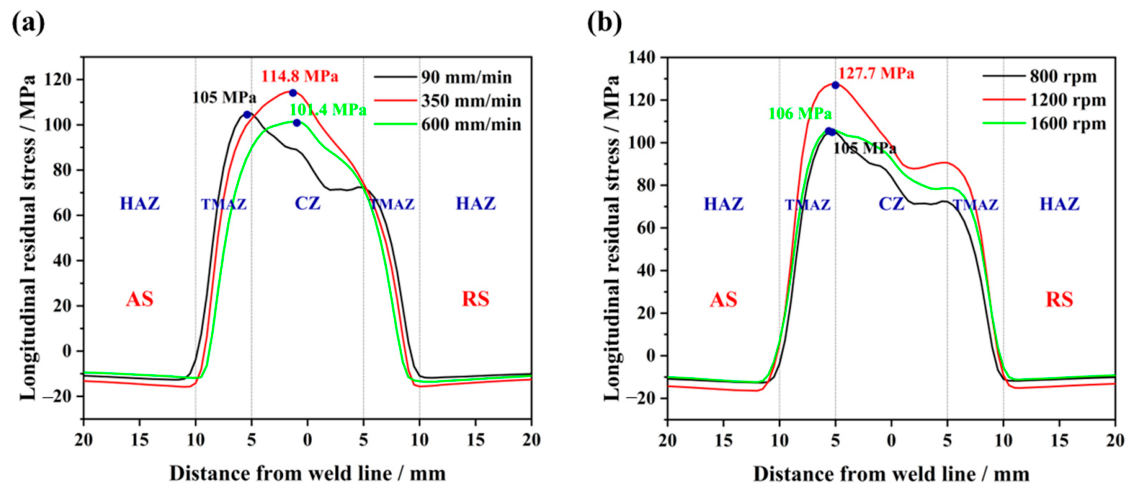
Both welding speed and tool rotational speed exert substantial influences on residual stress distributions, but their effects differ in nature. Figure 10 summarizes these influences on the longitudinal residual stress at the top surface of the steady-state zone. As seen in Figure 10a, under constant rotation speed of 800 rpm, the peak longitudinal residual stress rises from 105 MPa to 114.8 MPa with welding speed increases from 90 to 350 mm/min. This increase is attributed to steeper thermal gradients caused by reduced tool-workpiece interaction time, consistent with the trend observed by Farhang et al. [21] in AA2024-T6 aluminum alloy, where increasing welding speed enhanced longitudinal residual stress. However, at a higher speed of 600 mm/min, the peak drops to approximately 101.4 MPa. According to a previous study [24], this reduction is associated with an overall lower temperature achieved during welding at high speeds.
Under constant welding speed of 90 mm/min, the peak longitudinal residual stress increases from ~105 MPa at 800 rpm to 127.7 MPa at 1200 rpm, and then decreases to ~106 MPa at 1600 rpm (Figure 10b). In the adopted thermal model [24], the temperature at a characteristic point increase from 346.7 °C at 800 rpm to 360.7 °C at 1200 rpm and remains near 360.7 °C at 1600 rpm. Within this model, the non-monotonic stress response is interpreted as a consequence of thermal-field redistribution; this interpretation requires further thermal and residual-stress measurements at additional rotational speeds. This is consistent with the findings of He et al. [22] and others [24,29] that, beyond a critical rotational speed, enhanced frictional heating promotes a more uniform temperature distribution, thereby mitigating stress localization.
In summary, Figure 10 reveals that variations in welding speed alter both the magnitude and the shape of the longitudinal residual stress profiles, whereas changes in rotational speed exert a relatively limited influence on the overall curve morphology. At 90 mm/min and 800 rpm, the calculated peak lies close to an approximate shoulder-affected positional region. As welding speed increases to 350 and 600 mm/min at 800 rpm, the calculated peak moves towards the approximate central positional region. Because metallographic boundaries were not measured, these locations are described only as tool-geometry-based positional guides. The rotational-speed variation at 90 mm/min primarily changes the calculated stress magnitude over the investigated range.

4.4. Model Limitations

The present results should be interpreted within the bounds of the adopted sequential framework. The mechanical analysis uses a thermal history previously assessed against thermocouple measurements, while material flow and instantaneous thermo-mechanical feedback are not explicitly resolved. The reference condition is assessed against five single-scan near-surface XRD locations; therefore, the through-thickness field and parameter effects remain numerical predictions. Additional uncertainty arises from the constitutive parameters, mesh density, clamping conditions, fixturing contact, and heat-source assumptions, whose sensitivity has not been quantified here.
Future work should combine fully coupled thermo-mechanical simulations with temperature measurements under additional process conditions and targeted sensitivity analyses. Through-thickness residual-stress measurements using neutron diffraction, synchrotron diffraction, or the contour method would provide a direct assessment of the numerical field beyond the present near-surface XRD data.

5. Conclusions

This study investigated the residual stress distribution in friction stir welded AZ31 Mg alloy using a sequentially coupled thermo-mechanical finite element model, with particular emphasis on process asymmetry and the influence of welding parameters. The following conclusions can be drawn:
(1)
The longitudinal residual stress exhibits a clear M-shaped distribution across the weld, with the advancing side showing 15–50% higher stresses than the retreating side. This asymmetry is associated with non-uniform heat input and the resulting asymmetric temperature history.
(2)
Among the three stress components, the longitudinal residual stress is the largest, followed by the transverse component, while the normal stress is negligible. The peak longitudinal stress resides in the thermo-mechanically affected zone, whereas the transverse stress peaks in the crown zone.
(3)
Residual stresses are highest on the top surface and decrease through the thickness. The plunging zone produces a localized stress spike (up to 218.7 MPa), while the steady-welding zone maintains a stable M-shaped profile, and the welding-ending zone exhibits substantial stress relaxation.
(4)
Within the adopted heat-source model, increasing welding speed up to 350 mm/min raises the longitudinal residual stress, but further increase to 600 mm/min reduces it. The calculated rotational-speed response reaches a maximum at 1200 rpm. Welding speed changes both stress magnitude and spatial distribution, whereas rotational speed mainly changes the magnitude over the investigated range.
(5)
The calculated near-surface longitudinal residual stress profile agrees in overall shape with the five XRD measurements, with an RMSE of about 10.34 MPa and an MAE of about 9.82 MPa. Because the assessment is limited to five discrete single-scan locations on the top surface, the through-thickness field and the parameter trends should be interpreted as numerical predictions requiring further experimental assessment.
Within these validation limits and modelling assumptions, the results provide useful guidance for selecting welding parameters to manage residual-stress asymmetry in AZ31 Mg alloy FSW joints.

Author Contributions

Conceptualization, R.X.; Methodology, Z.L.; Formal analysis, H.W. and S.F.; Investigation, S.F.; Writing—original draft, S.F.; Writing—review & editing, H.W., Z.L. and R.X.; Supervision, R.X.; Funding acquisition, Z.L. and R.X. All authors have read and agreed to the published version of the manuscript.

Funding

This research was supported by the National Natural Science Foundation of China (No. 52305343, 52071040 and 52371004), National Key Research and Development Program of China (2020YFA0405900), Young S&T Talent Training Program of Guangdong Provincial Association for S&T, China (SKXRC2025080), GDAS’ Project of Science and Technology Development (2022GDASZH-2022010107).

Data Availability Statement

The data that supports the findings of this study is available upon reasonable request.

Conflicts of Interest

The original contributions presented in the study are included in the article, further inquiries can be directed to the corresponding authors.

References

  1. Singh, K.; Singh, G.; Singh, H. Review on Friction Stir Welding of Magnesium Alloys. J. Magnes. Alloys 2018, 6, 399–416. [Google Scholar] [CrossRef]
  2. Mironov, S.; Onuma, T.; Sato, Y.S.; Kokawa, H. Microstructure Evolution During Friction-Stir Welding of AZ31 Magnesium Alloy. Acta Mater. 2015, 100, 301–312. [Google Scholar] [CrossRef]
  3. Kouadri-Henni, A.; Barrallier, L. Mechanical Properties, Microstructure and Crystallographic Texture of Magnesium AZ91-D Alloy Welded by Friction Stir Welding (FSW). Metall. Mater. Trans. A 2014, 45, 4983–4996. [Google Scholar] [CrossRef]
  4. Heidarzadeh, A.; Mironov, S.; Kaibyshev, R.; Çam, G.; Simar, A.; Gerlich, A.; Khodabakhshi, F.; Mostafaei, A.; Field, D.P.; Robson, J.D.; et al. Friction Stir Welding/Processing of Metals and Alloys: A Comprehensive Review on Microstructural Evolution. Prog. Mater. Sci. 2021, 117, 100752. [Google Scholar] [CrossRef]
  5. Hou, Z.; Sheikh-Ahmad, J.; Jarrar, F.; Ozturk, F. Residual Stresses in Dissimilar Friction Stir Welding of AA2024 and AZ31: Experimental and Numerical Study. J. Manuf. Sci. Eng. 2018, 140, 051015. [Google Scholar] [CrossRef]
  6. Woo, W.; Choo, H.; Prime, M.B.; Feng, Z.; Clausen, B. Microstructure, Texture and Residual Stress in a Friction-Stir-Processed AZ31B Magnesium Alloy. Acta Mater. 2008, 56, 1701–1711. [Google Scholar] [CrossRef]
  7. Lim, Y.-S.; Kim, S.-H.; Lee, K.-J. Effect of Residual Stress on the Mechanical Properties of FSW Joints with SUS409L. Adv. Mater. Sci. Eng. 2018, 2018, 9890234. [Google Scholar] [CrossRef]
  8. Withers, P.J. Residual Stress and Its Role in Failure. Rep. Prog. Phys. 2007, 70, 2211–2264. [Google Scholar] [CrossRef]
  9. Papahn, H.; Bahemmat, P.; Haghpanahi, M.; Valipour, A. Ultrasonic Measurements of Residual Stresses Caused by Severe Thermomechanical Deformation During FSW. Exp. Mech. 2014, 54, 1587–1596. [Google Scholar] [CrossRef]
  10. Prime, M.B.; Gnäupel-Herold, T.; Baumann, J.A.; Lederich, R.J.; Bowden, D.M.; Sebring, R.J. Residual Stress Measurements in a Thick, Dissimilar Aluminum Alloy Friction Stir Weld. Acta Mater. 2006, 54, 4013–4021. [Google Scholar] [CrossRef]
  11. Withers, P.J.; Bhadeshia, H.K.D.H. Residual Stress. Part 1. Measurement Techniques. Mater. Sci. Technol. 2001, 17, 355–365. [Google Scholar] [CrossRef]
  12. Yazdanmehr, A.; Jahed, H. On the Surface Residual Stress Measurement in Magnesium Alloys Using X-Ray Diffraction. Materials 2020, 13, 5190. [Google Scholar] [CrossRef] [PubMed]
  13. Meyghani, B.; Awang, M.; Wu, C. Finite Element Modeling of Friction Stir Welding (FSW) on a Complex Curved Plate. J. Adv. Join. Processes 2020, 1, 100007. [Google Scholar] [CrossRef]
  14. Pan, W.; Li, D.; Tartakovsky, A.M.; Ahki, S.; Khraisheh, M.; Khaleel, M. A New Smoothed Particle Hydrodynamics Non-Newtonian Model for Friction Stir Welding: Process Modeling and Simulation of Microstructure Evolution in a Magnesium Alloy. Int. J. Plast. 2013, 48, 189–204. [Google Scholar] [CrossRef]
  15. Eivani, A.; Vafaeenezhad, H.; Jafarian, H.; Zhou, J. A Novel Approach to Determine Residual Stress Field During FSW of AZ91 Mg Alloy Using Combined Smoothed Particle Hydrodynamics/Neuro-Fuzzy Computations and Ultrasonic Testing. J. Magnes. Alloys 2021, 9, 1304–1328. [Google Scholar] [CrossRef]
  16. Al-Badour, F.; Merah, N.; Shuaib, A.; Bazoune, A. Coupled Eulerian Lagrangian Finite Element Modeling of Friction Stir Welding Processes. J. Mater. Process. Technol. 2013, 213, 1433–1439. [Google Scholar] [CrossRef]
  17. Salloomi, K.N.; Al-Sumaidae, S. Coupled Eulerian-Lagrangian Prediction of Thermal and Residual Stress Environments in Dissimilar Friction Stir Welding of Aluminum Alloys. J. Adv. Join. Process. 2021, 3, 100052. [Google Scholar] [CrossRef]
  18. Myung, D.; Noh, W.; Kim, J.-H.; Kong, J.; Hong, S.-T.; Lee, M.-G. Probing the Mechanism of Friction Stir Welding with ALE Based Finite Element Simulations and Its Application to Strength Prediction of Welded Aluminum. Met. Mater. Int. 2021, 27, 650–666. [Google Scholar]
  19. Riahi, M.; Nazari, H. Analysis of Transient Temperature and Residual Thermal Stresses in Friction Stir Welding of Aluminum Alloy 6061-T6 via Numerical Simulation. Int. J. Adv. Manuf. Technol. 2011, 55, 143–152. [Google Scholar]
  20. Khandkar, M.Z.H.; Khan, J.A.; Reynolds, A.P.; Sutton, M.A. Predicting Residual Thermal Stresses in Friction Stir Welded Metals. J. Mater. Process. Technol. 2006, 174, 195–203. [Google Scholar] [CrossRef]
  21. Farhang, M.; Sam-Daliri, O.; Farahani, M.; Vatani, A. Effect of Friction Stir Welding Parameters on the Residual Stress Distribution of Al-2024-T6 Alloy. J. Mech. Eng. Sci. 2021, 15, 7684–7694. [Google Scholar] [CrossRef]
  22. He, J.; Ling, Z.; Li, H. Effect of Tool Rotational Speed on Residual Stress, Microstructure, and Tensile Properties of Friction Stir Welded 6061-T6 Aluminum Alloy Thick Plate. Int. J. Adv. Manuf. Technol. 2016, 84, 1953–1961. [Google Scholar]
  23. Commin, L.; Dumont, M.; Masse, J.-E.; Barrallier, L. Friction Stir Welding of AZ31 Magnesium Alloy Rolled Sheets: Influence of Processing Parameters. Acta Mater. 2009, 57, 326–334. [Google Scholar] [CrossRef]
  24. Feng, S.; Liu, Z.; Xin, R. Simulation of Friction Stir Welding of AZ31 Mg Alloys. Materials 2024, 17, 4974. [Google Scholar] [CrossRef] [PubMed]
  25. Bussu, G.; Irving, P.E. The Role of Residual Stress and Heat Affected Zone Properties on Fatigue Crack Propagation in Friction Stir Welded 2024-T351 Aluminium Joints. Int. J. Fatigue 2003, 25, 77–88. [Google Scholar] [CrossRef]
  26. Yang, T.; Wei, X.; Zhou, J.; Jiang, H.; Liu, X.; Man, Z. The Formation Mechanism of Residual Stress in Friction Stir Welding Based on Thermo-Mechanical Coupled Simulation. Symmetry 2025, 17, 917. [Google Scholar] [CrossRef]
  27. Peel, M.; Steuwer, A.; Preuss, M.; Withers, P.J. Microstructure, Mechanical Properties and Residual Stresses as a Function of Welding Speed in Aluminium AA5083 Friction Stir Welds. Acta Mater. 2003, 51, 4791–4801. [Google Scholar] [CrossRef]
  28. Steuwer, A.; Peel, M.J.; Withers, P.J. Dissimilar Friction Stir Welds in AA5083-AA6082: The Effect of Process Parameters on Residual Stress. Mater. Sci. Eng. A 2006, 441, 187–196. [Google Scholar] [CrossRef]
  29. Sarfaraz, Z.; Awan, Y.R.; Saeed, H.A.; Khan, R.; Wieczorowski, M.; Din, N.A. Residual Stress in Friction Stir Welding of Dissimilar Aluminum Alloys: A Parametric Study. Materials 2025, 18, 316. [Google Scholar] [CrossRef] [PubMed]
  30. Singh, P.; Sabry, I.; El-Kassas, A.M. Enhanced Strength, Ductility, and Corrosion Resistance of AA6061/AA6082 Alloys Using Al-SiC Matrix Reinforcement in Dissimilar Friction Stir Welding. Int. J. Adv. Manuf. Technol. 2025, 138, 2431–2457. [Google Scholar]
  31. Sabry, I.; El-Deeb, M.S.S. Enhanced Structural Integrity and Tribological Performance of Al6061-Al6082 Alloys Reinforced with TiB2 and Al2O3 via Friction Stir Welding. Int. J. Adv. Manuf. Technol. 2025, 138, 2893–2910. [Google Scholar] [CrossRef]
  32. Sabry, I.; Mourad, A.-H.I.; ElWakil, M. Understanding Microstructural Gradients and Mechanical Anisotropy in 7075 Aluminium Alloy Processed by Additive Friction Stir Deposition. J. Mater. Res. Technol. 2026, 42, 4524–4545. [Google Scholar] [CrossRef]
  33. ElWakil, M.; Sabry, I. Statistical Evaluation and Mechanical Performance of Underwater Friction Stir Welded Aluminum 6063 Pipe Joints. J. Mater. Eng. Perform. 2026, in press. [Google Scholar] [CrossRef]
  34. Sabry, I. Hybrid GRA-TOPSIS Optimization of Friction Stir Welding for SiCp-Reinforced AZ31C Magnesium Alloy. Int. J. Adv. Manuf. Technol. 2025, 139, 4457–4478. [Google Scholar] [CrossRef]
  35. Salloomi, K.N. Fully Coupled Thermomechanical Simulation of Friction Stir Welding of Aluminum 6061-T6 Alloy T-Joint. J. Manuf. Processes 2019, 45, 746–754. [Google Scholar] [CrossRef]
  36. Wang, B.; Zhu, P.; Cao, Y.; Zhou, L.; Xue, P.; Wu, L. Effects of Different Friction Stir Welding Processes on Residual Stress and Deformation of Ti62A Alloy Joints. J. Mater. Res. Technol. 2023, 26, 6096–6107. [Google Scholar] [CrossRef]
  37. Liu, X.; Yu, Y.; Yang, S.; Liu, H. A Modified Analytical Heat Source Model for Numerical Simulation of Temperature Field in Friction Stir Welding. Adv. Mater. Sci. Eng. 2020, 2020, 4639382. [Google Scholar] [CrossRef]
  38. Schmidt, H.; Hattel, J.; Wert, J. An Analytical Model for the Heat Generation in Friction Stir Welding. Model. Simul. Mater. Sci. Eng. 2004, 12, 143–157. [Google Scholar]
  39. Garlea, E.; Radovic, M.; Liaw, P.K. High-temperature dependency of elastic mechanical behavior of two wrought magnesium alloys AZ31B and ZK60A studied by resonant ultrasound spectroscopy. Mater. Sci. Eng. A 2019, 758, 86–95. [Google Scholar] [CrossRef]
  40. Feng, F.; Huang, S.; Meng, Z.; Hu, J.; Lei, Y.; Zhou, M.; Wu, D.; Yang, Z. Experimental Study on Tensile Property of AZ31B Magnesium Alloy at Different High Strain Rates and Temperatures. Mater. Des. 2014, 57, 10–20. [Google Scholar] [CrossRef]
  41. Feng, F.; Huang, S.; Meng, Z.; Hu, J.; Lei, Y.; Zhou, M.; Yang, Z. A Constitutive and Fracture Model for AZ31B Magnesium Alloy in the Tensile State. Mater. Sci. Eng. A 2014, 594, 334–343. [Google Scholar] [CrossRef]
  42. Xu, J.; Wen, Z.; Su, J.; Xie, X. Johnson-Cook Constitutive Model of Magnesium Alloy Sheet at High Strain Rate. In Innovation of Plastic Processing Technology, Promote the Development of Intelligent Manufacturing—Proceedings of the 15th National Plastic Engineering Society Annual Conference and the 7th Global Chinese Plastic Processing Technology Exchange Conference; Chinese Mechanical Engineering Society: Jinan, China, 2017; pp. 336–339. [Google Scholar]
Figure 1. Schematic illustrations of (a) the FSW process and (b) the residual stress measurement locations on the top surface.
Metals 16 00774 g001
Figure 2. (a) Mesh configuration and (b) boundary conditions of the AZ31 Mg alloy sheet.
Metals 16 00774 g002
Figure 3. Temperature-dependent thermo-mechanical properties of the AZ31 Mg alloy.
Metals 16 00774 g003
Figure 4. Comparison of longitudinal residual stress between X-ray diffraction measurements and finite element predictions. The orange star markers denote near-surface XRD measurements of the longitudinal residual stress, and the solid curves denote finite element predictions.
Metals 16 00774 g004
Figure 5. (a) Contour map of longitudinal residual stress on the top surface, indicating the positions of Sections I–III along the welding direction. (b) Transverse profiles of longitudinal residual stress across Section II for Layers I–IV, from the AS to RS.
Metals 16 00774 g005
Figure 6. (a) Instantaneous cross-sectional temperature distribution in the steady-welding zone (Section II) at 60 s. (b) Corresponding transverse temperature profiles for Layers I–IV across the weld centerline from AS to RS.
Metals 16 00774 g006
Figure 7. Transverse profiles of longitudinal residual stress across (a) Section I (plunging zone) and (b) Section III (welding-ending zone) for Layers I–IV, from the AS to RS.
Metals 16 00774 g007
Figure 8. (a) Peak temperature distribution on the top layer (Layer I) during the entire welding process. (b) Longitudinal residual stress distribution on the top surface (Layer I), showing the staged evolution along the welding direction and the spatial correspondence with the peak temperature field.
Metals 16 00774 g008
Figure 9. Longitudinal residual stress profiles along the welding direction at the weld center and at offsets of 5 mm and 10 mm on the AS and RS, for (a) Layer I, (b) Layer II, (c) Layer III, and (d) Layer IV.
Metals 16 00774 g009
Figure 10. Effect of welding parameters on the longitudinal residual stress profile on the top surface of the steady-welding zone: (a) constant rotational speed of 800 rpm at various welding speeds; (b) constant welding speed of 90 mm/min at various rotational speeds.
Metals 16 00774 g010
Table 1. Detailed welding parameters.
Welding Speed/(mm/min)Rotation Speed/(rpm)
90, 350, 600800, 1200, 1600
Table 2. Johnson–Cook parameters for AZ31 Mg alloy.
ABCmn ε 0 ˙ TmTr
175.655 MPa332.272 MPa0.01981.4680.44810−3 s−1650 °C20 °C
Disclaimer/Publisher’s Note: The statements, opinions and data contained in all publications are solely those of the individual author(s) and contributor(s) and not of MDPI and/or the editor(s). MDPI and/or the editor(s) disclaim responsibility for any injury to people or property resulting from any ideas, methods, instructions or products referred to in the content.