Article

Data-Driven Optimization of Size-Aware T6 Heat Treatment Parameters for A356 Aluminum Alloy

1
Zyomax Ltd., 85 Great Portland Street, London W1W 7LT, UK
2
BCAST, Brunel University of London, Middlesex, Uxbridge UB8 3PH, UK
*
Author to whom correspondence should be addressed.
Metals 2026, 16(6), 615; https://doi.org/10.3390/met16060615
Submission received: 2 May 2026 / Revised: 29 May 2026 / Accepted: 31 May 2026 / Published: 4 June 2026
(This article belongs to the Section Metal Casting, Forming and Heat Treatment)

Abstract

Aluminum alloy A356 (Al-7Si-0.3Mg) is widely employed in automotive structural components due to its favorable strength-to-weight ratio, yet its mechanical performance is highly sensitive to T6 heat-treatment processes. Conventional heat-treatment schedules are typically based on uniform, empirically derived parameters and fail to consider variations in component size, geometry, or thermal mass. Consequently, applying a single schedule across all component sizes often leads to inconsistent microstructural development, energy inefficiency, and elevated scrap rates. Smaller components tend to be over-processed, while larger components may be under-processed, both resulting in suboptimal mechanical properties and increased production costs. To overcome these limitations, this study presents a scalable heat-treatment optimization framework that integrates physics-based thermal simulations with machine learning techniques. The framework combines a transient thermal simulator with Long Short-Term Memory (LSTM) networks to predict sample temperature evolution, Random Forest regressors to estimate mechanical properties such as yield strength, hardness, and modulus of toughness, and Bayesian optimization to generate size-dependent, property-compliant heat-treatment schedules. Unlike traditional methods, this approach dynamically adjusts furnace parameters to individual component characteristics, optimizing both processing time and energy consumption while minimizing scrap. Application of the framework to components ranging from 0.5 to 10 kg demonstrates internally consistent simulation-based predictions of temperature profiles, phase-fraction evolution, and mechanical-property trends within the assumed modelling framework. Optimized schedules achieved 15–25% reductions in cycle time while maintaining properties within T6 specifications. These findings underscore the potential of AI-assisted heat-treatment optimization to enhance energy efficiency, reduce material waste, and improve the consistency of mechanical performance in automotive casting operations.

1. Introduction

Aluminum alloy A356 (Al-7Si-0.3Mg) is widely employed in the automotive and aerospace industries due to its excellent castability, high strength-to-weight ratio, corrosion resistance, and favorable weldability [1]. The mechanical performance of A356 is strongly dependent on its microstructure, particularly the morphology of eutectic silicon and the precipitation behavior of Mg2Si during heat treatment [2]. To simultaneously enhance strength and ductility, A356 is commonly subjected to T6 heat treatment, which involves solutionizing, quenching, and aging. During the aging phase, the formation of Mg2Si precipitates significantly contributes to improved mechanical properties, including increased hardness and tensile strength [3].
While the T6 heat treatment process is well-established, numerous studies have explored optimized schedules to achieve superior mechanical performance. Peng et al. demonstrated that a 2 h solution treatment at 550 °C followed by 2 h of aging at 170 °C yielded near-peak mechanical properties while refining the eutectic Si and homogenizing Mg and Si in the matrix [4]. Zhu et al. investigated T6 treatment of A356 alloys modified with mischmetal (La and Ce), reporting substantial refinement and spheroidization of eutectic silicon particles, which improved ductility and tensile strength [5]. Möller et al. studied T4 and T6 heat treatment cycles of semisolid metal (SSM) processed A356 alloys, showing that solution treatment followed by aging (T4 or T6) significantly improved mechanical properties, with spheroidized silicon improving ductility and impact strength. [6]. Hu et al. showed that T6 treatment transformed coarse, flake-like eutectic silicon into a fine, globular-fibrous morphology, enhancing yield strength and elongation [7].
These studies collectively underscore the critical role of heat treatment in refining microstructure and improving mechanical properties of A356 alloys, while also highlighting opportunities for reducing energy consumption and processing time. However, a key limitation of existing approaches is their reliance on empirical, uniform heat treatment schedules that fail to account for variations in component size or mass. As a result, smaller components are often over-processed, while larger components are under-processed, leading to excessive energy consumption, extended processing times, increased scrap generation, and inconsistent mechanical performance.
Recent advances in machine learning (ML) and artificial intelligence (AI) offer promising avenues for optimizing alloy design and heat treatment processes. Yan et al. proposed a data-driven model system (DDMS) employing XGBoost, Random Forest, and LSTM networks to optimize heat treatment parameters for 2618 aluminum alloy, achieving high prediction accuracy for mechanical properties [8]. However, their study focused on a single alloy and did not consider variations in sample size, which are critical for industrial applications. Similarly, Song and Zhang applied Artificial Neural Networks (ANN) and Genetic Algorithms (GA) to optimize heat treatment for 7175 aluminum alloys, reducing experimental requirements, but their approach was limited to laboratory-scale experiments and did not account for real-world uncertainties such as component size variations [9]. Ling et al. applied machine learning for alloy composition and processing optimization, demonstrating reductions in trial-and-error experimentation [10]. Fatriansyah et al. explored fracture toughness optimization using XGBoost, Support Vector Regression (SVR), and K-Nearest Neighbours (KNN), showing promise in alloy design, but without integrating critical heat treatment parameters such as temperature, time, and cooling rate, and lacking validation in industrial settings [11]. Chen et al. presented a machine learning-assisted multi-objective optimization approach for magnesium alloys (ZE62) using active learning, improving strength and ductility with minimal experimentation, but their methodology is specific to magnesium alloys and may not directly translate to aluminum alloys due to differences in thermal behavior and material properties [12].
Numerous studies have also demonstrated the application of machine learning and artificial intelligence in alloy design and process optimization. Santos et al. coupled a finite-difference heat transfer and solidification model with a genetic algorithm to optimize industrial-scale continuous steel casting, achieving higher casting speeds, reduced thermal gradients, and lower water consumption under real operating conditions; however, their work is limited to solidification-stage control and does not address post-casting heat treatment or size-dependent thermal optimization [13].
Li et al. developed a hybrid ML framework integrating back-propagation neural networks, genetic algorithms, and radial basis function networks to predict and optimize the mechanical properties of 7xxx aluminum alloys, achieving high accuracy validated through microstructural and mechanical experiments, but their study focuses on laboratory-scale composition and ageing parameters and neglects component size effects and transient thermal histories [14]. Wang et al. provided a comprehensive review of AI-, ML-, and deep learning–based approaches for modeling, design, and optimization of magnesium alloys, highlighting both their predictive capabilities and key challenges such as limited data availability, model interpretability, and insufficient experimental validation, underscoring the need for physics-informed and industry-relevant frameworks [15]. Hao et al. combined AdaBoost-based machine learning with targeted experiments to optimize cast heat-resistant aluminum alloys, accurately predicting high-temperature tensile properties and identifying key strengthening phases at 300–350 °C [16]. Broader reviews by Guo et al. and Özkavak et al. further demonstrate the effectiveness of ML and deep learning methods for mechanical property prediction, multiscale materials design, and post-aging property estimation in aluminum alloys [17,18]. Hu et al. proposed a feature-engineering-assisted ML framework for wrought aluminum alloys that integrates chemical composition and manufacturing parameters to accurately predict mechanical properties and guide alloy design [19].
Recent review studies have further highlighted the growing role of artificial intelligence, machine learning, and physics-informed modeling in alloy design, thermal-process optimization, and materials-property prediction. These studies emphasize both the predictive capability of data-driven frameworks and the remaining challenges associated with limited datasets, model interpretability, and industrial-scale validation in metallurgical applications.
Rossos et al. applied machine learning to predict heat-treatment duration for pest control in industrial buildings using a large IoT-based dataset of 1423 heat-treatment time series. Their study showed that data-driven models, particularly XGBoost and Random Forest, can accurately estimate the time required to reach critical temperature thresholds, highlighting the potential of ML for optimizing heat-treatment efficiency and reducing energy use [20]. Yan et al. developed a data-driven model system for optimizing heat-treatment parameters of 2618 aluminum alloy using XGBoost, Random Forest, LSTM, and APO-BP models. Their APO-BP model showed high accuracy in predicting UTS, YS, and elongation, proving the usefulness of ML for heat-treatment parameter design. However, the study focused on 2618 aluminum alloy and did not consider component-size or mass-dependent heat-treatment optimization, limiting its direct applicability to industrial parts with different thermal responses [8]. Al-Falahat proposed a physics-informed inverse design framework to optimize steel heat-treatment processes for achieving target fatigue strength. The study combined metallurgical indices, machine learning, uncertainty prediction, and constrained optimization to identify feasible heat-treatment windows for reliability-aware fatigue performance. However, the work was limited to steels and fatigue-strength-based design, and it did not address aluminum alloys or size-dependent thermal response during heat treatment [21].
Despite these advances, several gaps remain: limited dataset sizes, insufficient mechanistic understanding, poor generalizability across alloys or processing routes, and a lack of consideration for size-dependent heat treatment schedules. To address these challenges, the present study integrates physics-based thermal simulations with machine learning models to optimize T6 heat treatment of A356 alloys across a range of component sizes. Bayesian Optimization is employed to identify schedules that minimize energy consumption, processing time, and scrap, while ensuring mechanical properties remain within industrial T6 specifications. Long Short-Term Memory (LSTM) networks are used to forecast sample temperature evolution during heat treatment, and Random Forest (RF) models predict mechanical properties based on thermal profiles.
Within the A356/AlSi7Mg alloy system considered in this study, this integrated, data-driven framework enables adaptive furnace scheduling tailored to component mass and simulated thermal response. The present work should therefore be interpreted as an A356-specific demonstration of size-aware heat-treatment optimization rather than as a directly universal framework for all aluminum alloys.
By bridging the gap between empirical schedules and predictive, size-aware optimization, this research demonstrates the feasibility and industrial relevance of ML/AI-assisted heat treatment for automotive casting operations, offering a pathway toward more sustainable and efficient manufacturing.

2. Methodology

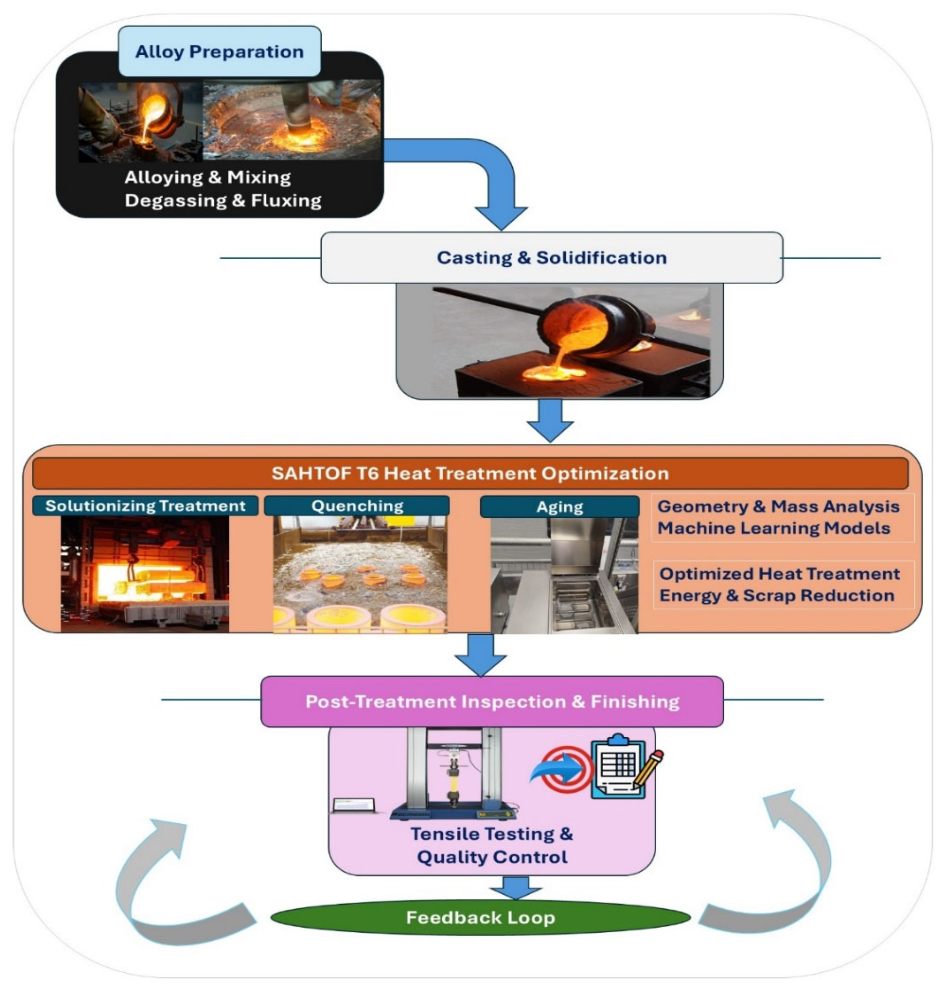
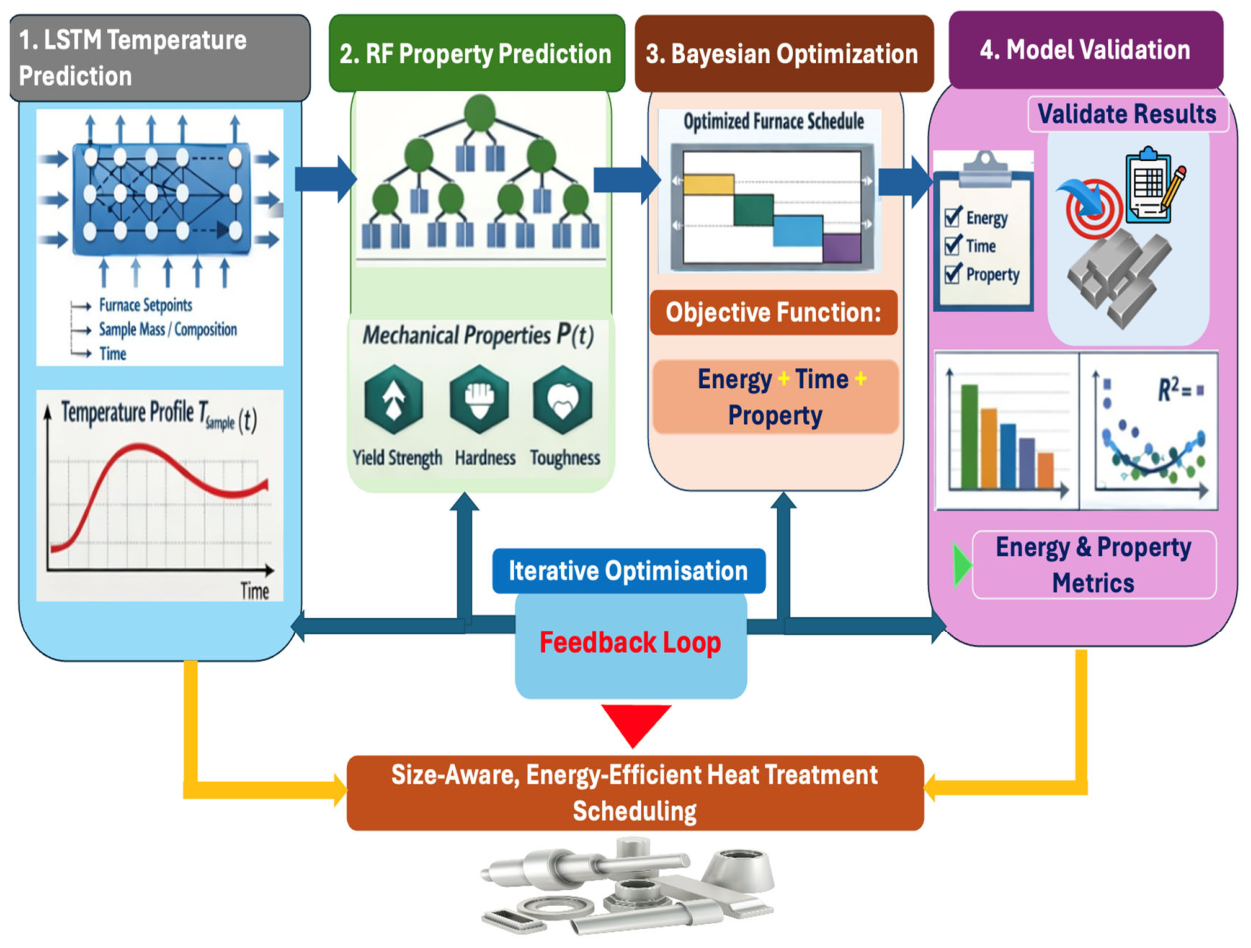
This study develops a Size-Aware T6 Heat Treatment Optimization Framework (SAHTOF) for A356 aluminum alloy, combining physics-based simulations and machine learning algorithms, to produce energy-efficient heat treatment schedules that minimize scrap and ensure optimized mechanical properties across parts of varying geometry and mass. The methodology captures the complex interactions among thermal dynamics, phase transformations, and mechanical behavior, enabling precise control over the T6 heat treatment process. The overall workflow is illustrated in Figure 1, showing the full casting process with the SAHTOF-aware T6 stage highlighted, while Figure 2 details the SAHTOF pipeline, illustrating the integration of physics-based simulations, predictive modeling, and size-aware optimization.

2.1. Casting Process Overview

The production of A356 components involves multiple sequential stages, each influencing the final part quality and energy efficiency. Initially, alloying elements are combined and melted under controlled conditions to achieve the desired chemical composition, followed by degassing and fluxing to remove impurities. Molten aluminum is poured into molds or dies, with gating systems designed to reduce turbulence and shrinkage defects. Solidification occurs according to thermal gradients dictated by mold geometry and heat dissipation, producing the initial microstructure [22].
Following solidification, T6 heat treatment is critical for achieving the target yield strength, hardness, and modulus of toughness [23]. This process includes solution treatment, quenching, and artificial aging, each stage inducing microstructural changes that determine final mechanical performance. The SAHTOF framework operates within these stages, providing a predictive, adaptive approach that adjusts schedules based on part mass, geometry, and composition. By integrating physics-based thermal and phase simulations with machine learning and Bayesian optimization, SAHTOF ensures that parts of all sizes meet target properties efficiently while minimizing energy consumption and scrap.

2.2. Physics-Aware Data Simulation

To enable SAHTOF, a synthetic dataset representing the complete T6 heat treatment time series of A356 was generated, comprising 6000 samples with masses ranging from 0.5 to 10 kg. Each sample included detailed descriptors such as dimensions, thermal properties, phase fractions, energy consumption, and mechanical properties. Simulations were grounded in industry-standard thermodynamic and heat transfer principles to ensure realistic behavior.
Step 1: Alloy Composition—The alloy AlSi7Mg (A356) was used, with 6.95% Si, 0.27% Mg, 0.10% Cu, 0.20% Fe, 0.04% Mn, and 0.03% Ti. Target mechanical properties at T6 tempering were set to yield strength 231–280 MPa and hardness 102–114 HV, according to industry standards.
Step 2: Thermodynamic Data—Temperature-dependent thermodynamic and thermophysical inputs for A356 alloy were obtained from Thermo-Calc calculations using the aluminum-alloy thermodynamic database. The Thermo-Calc-derived input data were used to provide equilibrium-informed material-property tables across the heat-treatment temperature range considered in this study. Separate mass-specific input tables were used for the investigated sample masses of 0.5, 0.8, 1.0, 1.5, 5.0, 7.0, and 10.0 kg.
The extracted thermophysical quantities included specific heat capacity, thermal conductivity, and thermal diffusivity. The extracted equilibrium phase-fraction outputs included FCC_A1, LIQUID, AL15SI2M4, AL18FE2MG7SI10, AL3TI_LT, AL9FE2SI2, ALSI3TI2, and DIAMOND_A4. These quantities were stored as temperature-dependent tabulated inputs and continuously interpolated during the transient heat-treatment simulation. At each simulation time step, the interpolated values of specific heat capacity, thermal conductivity, thermal diffusivity, and phase fractions were used to update the sample-temperature evolution, heat-transfer response, phase-relaxation calculation, and energy-consumption estimate [24].
The CALPHAD-derived phase fractions were treated as equilibrium-informed approximations rather than experimentally measured phase fractions. This assumption provides computationally efficient thermodynamic guidance for the synthetic-data generation framework, but it does not fully resolve non-equilibrium precipitation kinetics, solute clustering, nucleation and growth during aging, local quench heterogeneity, or furnace-scale thermal non-uniformity. Therefore, the predicted phase fractions should be interpreted as physically informed trends suitable for simulation-driven process optimization, rather than exact quantitative microstructural predictions.
To improve numerical stability, thermophysical values obtained from the tabulated Thermo-Calc-derived inputs were bounded within physically reasonable limits before use in the transient solver (Table 1). This procedure was applied to avoid nonphysical negative or excessively large values arising from interpolation or extrapolation of tabulated data. The adopted bounds were 500–1200 J kg−1 K−1 for specific heat capacity, 10−3–300 W m−1 K−1 for thermal conductivity, 10−8–10−4 m2 s−1 for thermal diffusivity, and 5–2000 W m−2 K−1 for the effective heat-transfer coefficient.
Step 3: Heat Treatment Stages—The process was modelled as six stages: ramp to solutionizing, solutionizing hold, quenching, ramp to aging, aging hold, and air cooling. Each stage’s duration and temperature were scaled according to sample thickness [25]:
  • Ramp to Solutionizing—Heating to 540–545 °C, with ramp time dependent on sample mass.
  • Solutionizing—Holding at target temperature; duration scaled to thickness.
  • Quenching—Rapid cooling in water; quenching time adjusted for geometry.
Note: Quenching was represented using an effective heat-transfer coefficient to capture the rapid cooling response during water quenching. This simplified treatment does not explicitly model vapor-film formation, nucleate boiling, quench agitation, local turbulence, bath temperature variation, or position-dependent cooling rates. These factors can strongly influence residual stresses, distortion, precipitation behavior, and final mechanical properties in industrial heat treatment. Therefore, the quenching results should be interpreted as approximate size-dependent cooling trends rather than fully resolved industrial quench predictions. Future work will incorporate experimentally measured cooling curves and more detailed quench models to improve predictive accuracy.
  • Ramp to Aging—Heating to 170–175 °C, ramp duration mass-dependent.
  • Aging—Holding at aging temperature; time scaled to thickness.
  • Air Cooling—Cooling to room temperature; duration based on sample dimensions.
The selected processing conditions were designed to remain representative of commonly reported industrial T6 heat-treatment practices for A356 alloys. Solutionizing and artificial aging temperatures were constrained within conventional industrial operating windows, while holding durations were adaptively scaled according to component thickness and thermal mass to support size-aware process optimization.
Step 4: Dynamic Thermal, Phase, and Energy Simulation:
  • Temperature Evolution: Sample temperature was updated using an exponential integrator that accounts for sample-specific thermal properties and geometry [26]:
T sample t + Δ t = T target + T sample t T target exp Δ t τ , τ = M C p h A ,
where: M = sample mass (kg), C p = specific heat capacity (J/kg·K), h = convective heat transfer coefficient (W/m2·K), A = surface area of the sample (m2), T target   = furnace or quench temperature, Δ t = simulation time step.
  • Phase Evolution: Phase transformations were modelled using a first-order relaxation towards thermodynamic equilibrium [27]:
f α t + Δ t = f α t + f α eq T sample f α t 1 e x p Δ t τ p ,
where: f α eq T = equilibrium fraction of phase α at temperature T , τ p = phase relaxation time, scaled with sample mass.
This approach was applied to all relevant phases (LIQUID, FCC_A1, AL15SI2M4, AL3TI_LT, etc., obtained from Thermo-Calc simulations) [24].
The phase-evolution model used in this framework is based on a first-order relaxation approach toward thermodynamic equilibrium. This provides a computationally efficient approximation of phase-fraction evolution during heating and cooling; however, it does not fully resolve non-equilibrium precipitation kinetics, nucleation and growth mechanisms, solute clustering, or localized microstructural heterogeneity during quenching and aging. Therefore, the predicted phase fractions should be interpreted as equilibrium-informed trends rather than exact quantitative microstructural predictions. More detailed precipitation-kinetics models, such as CALPHAD-coupled Kampmann–Wagner numerical models or experimentally calibrated aging models, will be required in future work for higher-fidelity microstructural prediction.
  • Convective Heat Transfer: Convective heat exchange with the environment was modelled using Newton’s Law of Cooling [27]:
Q = h A Δ T Δ t ,
where Q is the heat energy transferred (kJ), Δ T = T furnace T sample , and the convective coefficient was dynamically scaled with the sample’s surface-to-volume ratio:
h dynamic = h 0 ( S / V ) sample ( S / V ) ref .
The heat-transfer boundary condition was implemented using an effective convective heat-transfer coefficient. For furnace heating, solutionizing, aging, and air-cooling stages, a baseline value of (h0 = 50) W m−2 K−1 was used. This baseline value was dynamically scaled according to the surface-area-to-volume ratio of each sample relative to a reference geometry:
h dynamic = h 0 S / V sample S / V ref ,
where S V sample is the surface-area-to-volume ratio of the investigated sample and S V reference is the corresponding value for the reference geometry. This scaling allows smaller samples with larger surface-area-to-volume ratios to heat and cool more rapidly than larger samples. To avoid nonphysical numerical values, the effective heat-transfer coefficient was bounded within 5–2000 W m−2 K−1 (Table 2).
Different heat-transfer regimes were used for the different process stages. During furnace heating and holding stages, the dynamically scaled coefficient (hdynamic) was applied. During the water-quenching stage, a higher effective quench coefficient was used to represent rapid heat extraction and was calculated as:
h quench = 100 h dynamic ,
with the same numerical bounds of 5–2000 W m−2 K−1. This simplified treatment captures the relative increase in cooling intensity during quenching compared with furnace heating and air cooling, while maintaining numerical stability within the lumped thermal model.
This ensures size-aware thermal modelling, capturing faster heating and cooling for smaller parts and slower thermal response for larger samples.
The thermal model adopts a lumped, geometry-aware heat-transfer approximation and assumes spatially uniform furnace temperature during each heating stage. Although component size, mass, surface-area-to-volume ratio, and section thickness are included, the model does not fully resolve internal thermal gradients, local hot spots, or complex three-dimensional heat-flow behavior in real castings. In industrial components with irregular geometry, ribs, bosses, or variable wall thickness, local heating and cooling rates may differ significantly from the predicted average sample temperature. Therefore, the present thermal model should be regarded as a computationally efficient approximation suitable for process screening and schedule optimization, rather than a substitute for full finite-element or CFD-based thermal simulation.
The convective heat-transfer coefficient was dynamically scaled according to the surface-area-to-volume ratio of each component to capture size-dependent thermal response during both heating and cooling stages.
Separate thermal-response regimes were applied for furnace heating and water quenching stages, with substantially higher effective heat-transfer coefficients used during quenching to reproduce rapid cooling behavior.
The present framework assumes spatially uniform furnace temperature and simplified convection behavior throughout processing. Detailed airflow variation, localized turbulence, quench agitation effects, and transient furnace heterogeneity were not explicitly modelled.
Consequently, the thermal model should be interpreted as a computationally efficient approximation of industrial heat-treatment behavior rather than a full computational fluid dynamics (CFD)-resolved simulation.
  • Energy Accounting: The energy input during each stage was updated at every time step [25]:
E stage = i ( h dynamic A T furnace ( t i ) T sample ( t i ) Δ t ) .
This provides a time-resolved estimate of total energy consumption for the heat treatment cycle.
Step 5: Feature Engineering—New features were created to streamline dataset analysis. The Modulus of Toughness (MOT), calculated as 0.5 × (UTS + YS) × EI [23,28], was derived from yield strength (YS), ultimate tensile strength (UTS), and elongation (EI), quantifying energy absorption capacity.
The Modulus of Toughness (MOT) was used as a computationally efficient surrogate metric combining strength and ductility contributions to estimate relative energy absorption capability across different heat-treatment conditions.
Although simplified relative to full fracture-mechanics characterization, the metric enables rapid comparative evaluation across large synthetic datasets. Consequently, predicted MOT values should be interpreted as comparative indicators rather than exact fracture-toughness measurements for cast aluminum alloys.
Numeric labels were assigned to each stage (1–6), and elapsed time for each stage was calculated to capture process dynamics. Redundant variables, including batch identifiers and certain thermal properties, were removed to facilitate machine learning [29,30].
Step 6: Time-Resolved Property Evolution—Mechanical property evolution was simulated at 1 min intervals using a sigmoid-based model, with stage-specific modifiers capturing unique behavior in each heat treatment phase. A Random Forest (RF) model further refined predictions by incorporating alloy composition, sample size, and thermal features, producing a time-resolved prediction of yield strength, hardness, and modulus of toughness for the entire heat treatment cycle [31].

Synthetic Dataset Construction

A total of 6000 synthetic T6 heat-treatment samples were generated using a physics-aware simulation framework covering component masses between 0.5–10 kg.
Component geometries were approximated using simplified rectangular-prism representations, where dimensions were derived from alloy density and sample mass to preserve realistic surface-area-to-volume relationships. Section thicknesses were automatically calculated and used to scale thermal response and process duration.
Solutionizing, quenching, and artificial aging schedules were constrained using representative industrial T6 processing windows for A356 alloys. Solutionizing temperatures were restricted to 540–545 °C, aging temperatures to 170–175 °C, and holding durations were scaled according to component thickness and thermal mass.
Transient temperature evolution was simulated using temperature-dependent thermophysical properties obtained from Thermo-Calc equilibrium calculations. The framework continuously interpolated thermal conductivity, heat capacity, diffusivity, and equilibrium phase fractions throughout heating, holding, quenching, and aging stages.
Physically unrealistic process combinations were excluded using rule-based constraints, including overheating conditions approaching eutectic melting temperatures, insufficient solutionizing durations, unstable thermal-response behavior, and nonphysical cooling trajectories.
The synthetic dataset was therefore generated using constrained physics-informed process simulation rather than unrestricted random parameter generation, improving physical consistency and industrial relevance.
To improve dataset variability and reduce model bias, the synthetic dataset was generated across a component mass range of 0.5–10 kg, with corresponding variation in geometry, surface-area-to-volume ratio, section thickness, heating rate, cooling response, and process duration. Solutionizing temperatures were constrained to 540–545 °C, aging temperatures to 170–175 °C, and stage durations were scaled according to component thickness and thermal mass. Physically unrealistic thermal histories, including overheating near the eutectic melting range, insufficient solutionizing duration, unstable cooling response, and nonphysical temperature trajectories, were excluded using rule-based constraints. Small-controlled variability was introduced through geometry-dependent thermal response and process-window variation to avoid training the models on overly uniform synthetic data. However, no arbitrary noise was added to the target mechanical properties, as the aim was to first evaluate the framework under physically consistent simulation conditions. Future experimental datasets will be used to introduce realistic measurement noise, furnace variability, and material scatter.
Although the synthetic dataset was generated using constrained physics-informed thermal and thermodynamic principles, the present framework remains simulation-driven and has not yet been directly validated using experimental furnace trials. Therefore, the predicted temperature histories, phase evolution trends, mechanical properties, and optimized cycle-time reductions should be interpreted as computational estimates within the assumed processing window rather than final industrial validation results. In real heat-treatment operations, factors such as furnace temperature non-uniformity, quench agitation, local cooling-rate variation, casting defects, and microstructural heterogeneity may influence the final mechanical response. Future work will experimentally validate the optimized SAHTOF schedules using A356 components of different masses, followed by hardness testing, tensile testing, and microstructural characterization to confirm the model predictions and assess generalization under industrial conditions.

2.3. Size-Aware Heat Treatment Optimization Framework (SAHTOF)

After generating a physics-aware dataset (Section 2.2), SAHTOF performs size- and volume-aware optimization of heat treatment schedules through an integrated pipeline combining LSTM temperature prediction, Random Forest (RF) property prediction, and Bayesian optimization (BO) for furnace schedule optimization. Each stage is detailed below with the working equations and algorithm logic.
Although the SAHTOF workflow is architecturally modular, the present implementation is alloy specific. The thermodynamic inputs, phase-fraction descriptors, mechanical-property targets, and heat-treatment process windows were defined for A356/AlSi7Mg. Therefore, direct application to other aluminum alloys would require recalibration of the Thermo-Calc/CALPHAD inputs, revision of the alloy-specific phase descriptors, retraining of the LSTM and RF models, and experimental validation under the relevant heat-treatment conditions.
Step 1: LSTM-Based Temperature Prediction—To capture the thermal dynamics of a part, including thermal lag and geometry-dependent effects, a Long Short-Term Memory (LSTM) network predicts sample temperature over time. The LSTM is trained on physics-aware simulated data [29]:
T sample t = LSTM X input t ,
where X input t = T furnace t , Stage t , t elapsed , m sample ,   composition , phase   fractions
Algorithm logic: The LSTM used the following steps [28]:
  • Input sequence of length L (e.g., 12 time steps).
  • At each time step, LSTM computes hidden state h t and cell state c t using:
    f t = σ W f h t 1 , x t + b f ( forget   gate ) i t = σ W i h t 1 , x t + b i ( input   gate ) c ~ t = t a n   h W c h t 1 , x t + b c ( cell   candidate ) c t = f t c t 1 + i t c ~ t ( update   cell   state ) o t = σ W o h t 1 , x t + b o ( output   gate ) h t = o t t a n   h c t ( hidden   state ) T sample t = W out h t + b out ( temperature   prediction )
Here, σ is the sigmoid function, is element-wise multiplication, and W / b are learned weights.
  • The LSTM outputs the predicted sample-temperature profile T sample t over time, accounting for mass, geometry, and furnace ramp constraints.
Step 2: Random Forest (RF) for Mechanical Property Prediction—The mechanical properties (yield strength, hardness, modulus of toughness) are predicted from the thermal history using Random Forest regressors [31]:
P t = RF X features t ,
where the input features include:
X features t = T furnace t , T sample t , Stage t , t elapsed , m sample , phase   fractions , composition
Algorithm logic: The RF used the following steps [31]:
  • Each RF consists of N trees decision trees.
  • For a given input X features t , each tree T i predicts a property P i t .
  • The RF output is the mean across all trees:
    P ( t ) = 1 N trees i = 1 N trees ( P i ( t ) ) .
  • This yields predicted mechanical properties at each time step.
  • At the end of the schedule, the final properties are:
    P final = P t end = YS MPa , Hardness HV , Modulus   of   Toughness .
Step 3: Simulation of Furnace Schedule and Energy Consumption—Given a candidate furnace schedule p , the sample temperature evolution is simulated, considering ramp limits and mass-dependent heat transfer.
  • Enforce ramp rate constraint:
    Δ T max = R max Δ t ,
      T furnace t i = T furnace t i 1 + clip Δ T i , Δ T max , Δ T max ,
    where R max is the maximum ramp rate (°C/min), and Δ t is the simulation timestep.
  • Sample temperature update (from LSTM prediction) [29]:
      T sample t i = LSTM T furnace t i , Stage i , t i , m sample , composition , phase   fractions .
  • Energy consumption per stage is approximated by [32]:
    E stage = i ( Δ T i C p m sample f geometry ) ,
    where: C p = specific heat (kJ/kg·°C), m sample = mass in kg, Δ T i = m a x T sample t i T sample t i 1 , 0 , f geometry = S V   = surface-to-volume ratio correction.
Total energy:
  E total = stages ( E stage ) .
Step 4: Bayesian Optimization (BO) for Furnace Schedule—The goal is to minimize energy and processing time while ensuring final properties meet targets [33]:
Objective p = w E E total + w T t total + w P Φ P final ,
where: t total = stages ( t stage ), P final = YS MPa , Hardness HV , Modulus   of   Toughness .
Property penalty:
Φ ( P final ) = i ( m a x ( 0 , P i target P i final ) ) .
Algorithm logic:
  • Define mass-dependent search space for furnace temperatures and hold times.
  • Initialize BO with a Gaussian Process surrogate to model Objective( p ).
  • Iteratively sample p from the acquisition function (e.g., Expected Improvement).
  • Evaluate p using using LSTM temperature prediction, RF property forecast, and energy calculation.
  • Update GP surrogate with the new p , Objective p .
  • Continue until N calls iterations or convergence.
  • Return optimized schedule p * minimizing energy and time while meeting property targets.
The Bayesian Optimization (BO) search space was constrained using representative industrial T6 processing windows to prevent thermodynamically unrealistic or operationally infeasible schedules.
Solutionizing temperatures were restricted to 540–545 °C, aging temperatures to 170–175 °C, and holding durations were scaled according to component thickness and thermal mass. Quenching stages were similarly constrained using geometry-dependent cooling durations representative of industrial water-quench conditions.
These constraints ensured that the optimization process remained within physically meaningful and industrially relevant operating conditions throughout schedule generation.
To reduce overfitting and avoid data leakage, the dataset was divided into independent training, validation, and testing subsets before model training. The split was performed at the heat-treatment sample level rather than at the individual time-step level; therefore, all time points belonging to one simulated heat-treatment cycle were kept within the same subset. This prevented the model from learning nearly identical temporal patterns from the same cycle during training and then being evaluated on related time points during testing. For Random Forest regression, cross-validation, and hyperparameter tuning were applied to improve generalization. For the LSTM model, validation loss monitoring and early stopping were used to prevent overfitting. Although the high R2 values indicate strong internal consistency within the physics-informed dataset, they should not be interpreted as proof of full industrial generalization. External validation using experimental furnace data remains necessary to evaluate model robustness under real process variability.
Step 5: Model Validation and Metrics
  • Compare predicted vs. historical data: Error energy = E predicted E actual , Error time = t predicted t actual
  • Evaluate predictive accuracy of LSTM and RF [34]:
R 2 = 1 i ( y i y ^ i ) 2 i ( y i y ˉ ) 2 .
High R2 values indicate strong agreement within the simulation-generated dataset; however, they do not by themselves confirm predictive reliability under real industrial heat-treatment conditions.
The high predictive accuracy achieved by the LSTM and Random Forest models is partially influenced by the internally consistent nature of the physics-aware synthetic dataset used during training.
To reduce potential information leakage, train/test partitioning was performed at the sample level such that complete thermal histories from individual samples were retained within only one dataset split.
Nevertheless, the present framework remains primarily simulation-driven, and additional industrial-scale experimental validation would further strengthen model generalizability under real manufacturing variability and non-ideal processing conditions.
By combining physics-based simulation, deep learning, and Bayesian optimization, SAHTOF generates volume- and mass-aware schedules for A356 T6 heat treatment, ensuring uniform properties, reduced energy consumption, and minimized scrap.
Although alloy composition was incorporated as an input feature within the proposed framework, the present study focused exclusively on A356 alloy compositions and T6 processing conditions.
Consequently, the reported predictive performance and optimized schedules should currently be interpreted as alloy-specific rather than universally generalizable across all aluminum alloy systems.
Extension of the framework to additional alloy families would require further thermodynamic calibration, retraining, and industrial validation under alternative processing conditions.
Although the present framework demonstrates strong predictive capability on physics-aware simulated datasets, additional industrial-scale experimental validation would further strengthen confidence under real manufacturing variability.

3. Results and Discussion

The heat treatment response of A356 aluminum alloy exhibits a strong dependence on sample size, which governs thermal behavior, phase transformation kinetics, and the evolution of mechanical properties during the T6 cycle. To systematically quantify these effects, simulations were conducted for sample masses ranging from 500 g to 10,000 g, capturing furnace–sample temperature histories, phase fraction evolution, and the progression of key mechanical properties across all six stages of the heat treatment process. The results demonstrate that thermal mass is a dominant controlling factor influencing heating and cooling rates, transformation kinetics, and the time required to achieve microstructural and mechanical stabilization. These findings establish a quantitative foundation for size-aware heat treatment design and motivate the need for optimized, component-specific furnace schedules.

3.1. Furnace-Sample Temperature Response

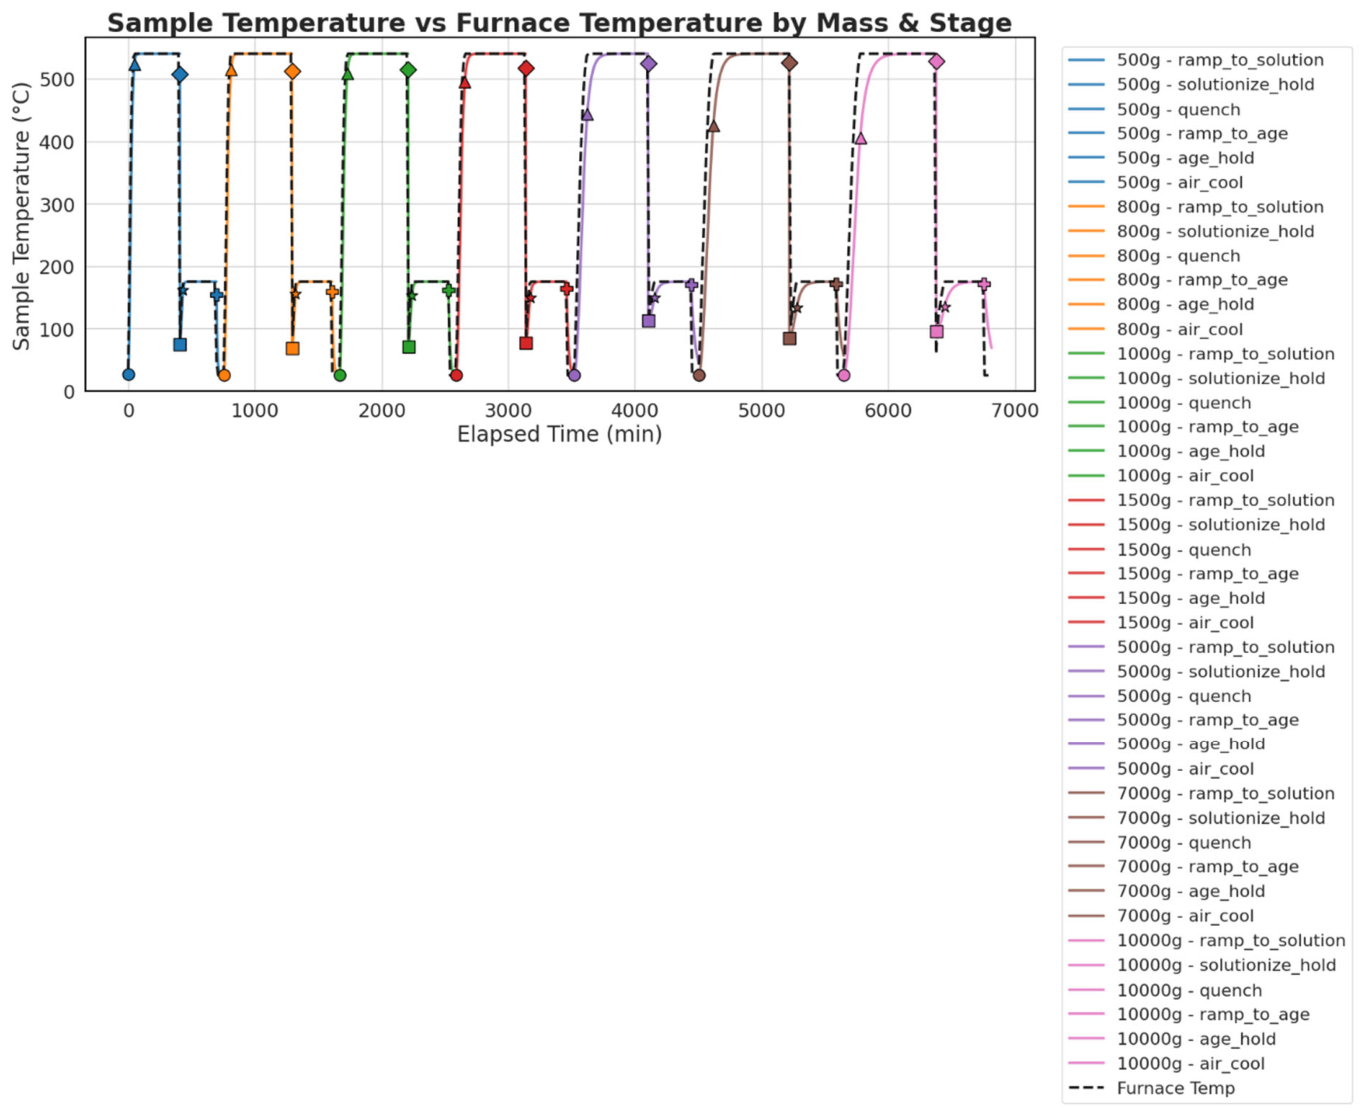
Figure 3 compares furnace and sample temperature profiles for different sample masses throughout the T6 heat treatment cycle. A pronounced mass-dependent thermal response is observed, reflecting the increasing thermal inertia associated with larger samples. As sample mass increases, the system’s ability to transfer and dissipate heat is hindered, leading to slower heating and cooling rates.
For the smallest sample (500 g), the furnace temperature increases rapidly during ramp-up, and the sample temperature closely follows, reaching target temperatures within a short time. This rapid thermal response persists across all stages, including quenching and air cooling, where steep temperature gradients are observed. The low thermal mass enables efficient heat exchange with the surrounding environment, resulting in sharp heating and cooling transitions. As sample mass increases to 1000 g, 5000 g, and 10,000 g, heating and cooling rates decrease systematically. Larger samples require significantly longer times to reach prescribed temperatures during ramp-to-solution, solutionizing, quenching, ramp to aging, aging, and air cooling. The effect is particularly pronounced during ramping and quenching stages, where increased heat capacity delays thermal equilibration. Cooling rates also decrease with increasing mass, as heat dissipation from larger volumes becomes progressively less efficient.
An additional consequence of increasing sample size is the smoothing of temperature transitions between stages. While smaller samples exhibit sharp temperature changes at stage boundaries, larger samples display gradual and prolonged transitions. This behaviour indicates that sample mass influences not only stage duration but also internal temperature uniformity. Such differences in thermal response have direct implications for phase transformation uniformity and mechanical property development, underscoring the necessity of explicitly accounting for component size when designing heat treatment schedules.

3.2. Phase Evolution as a Function of Sample Size

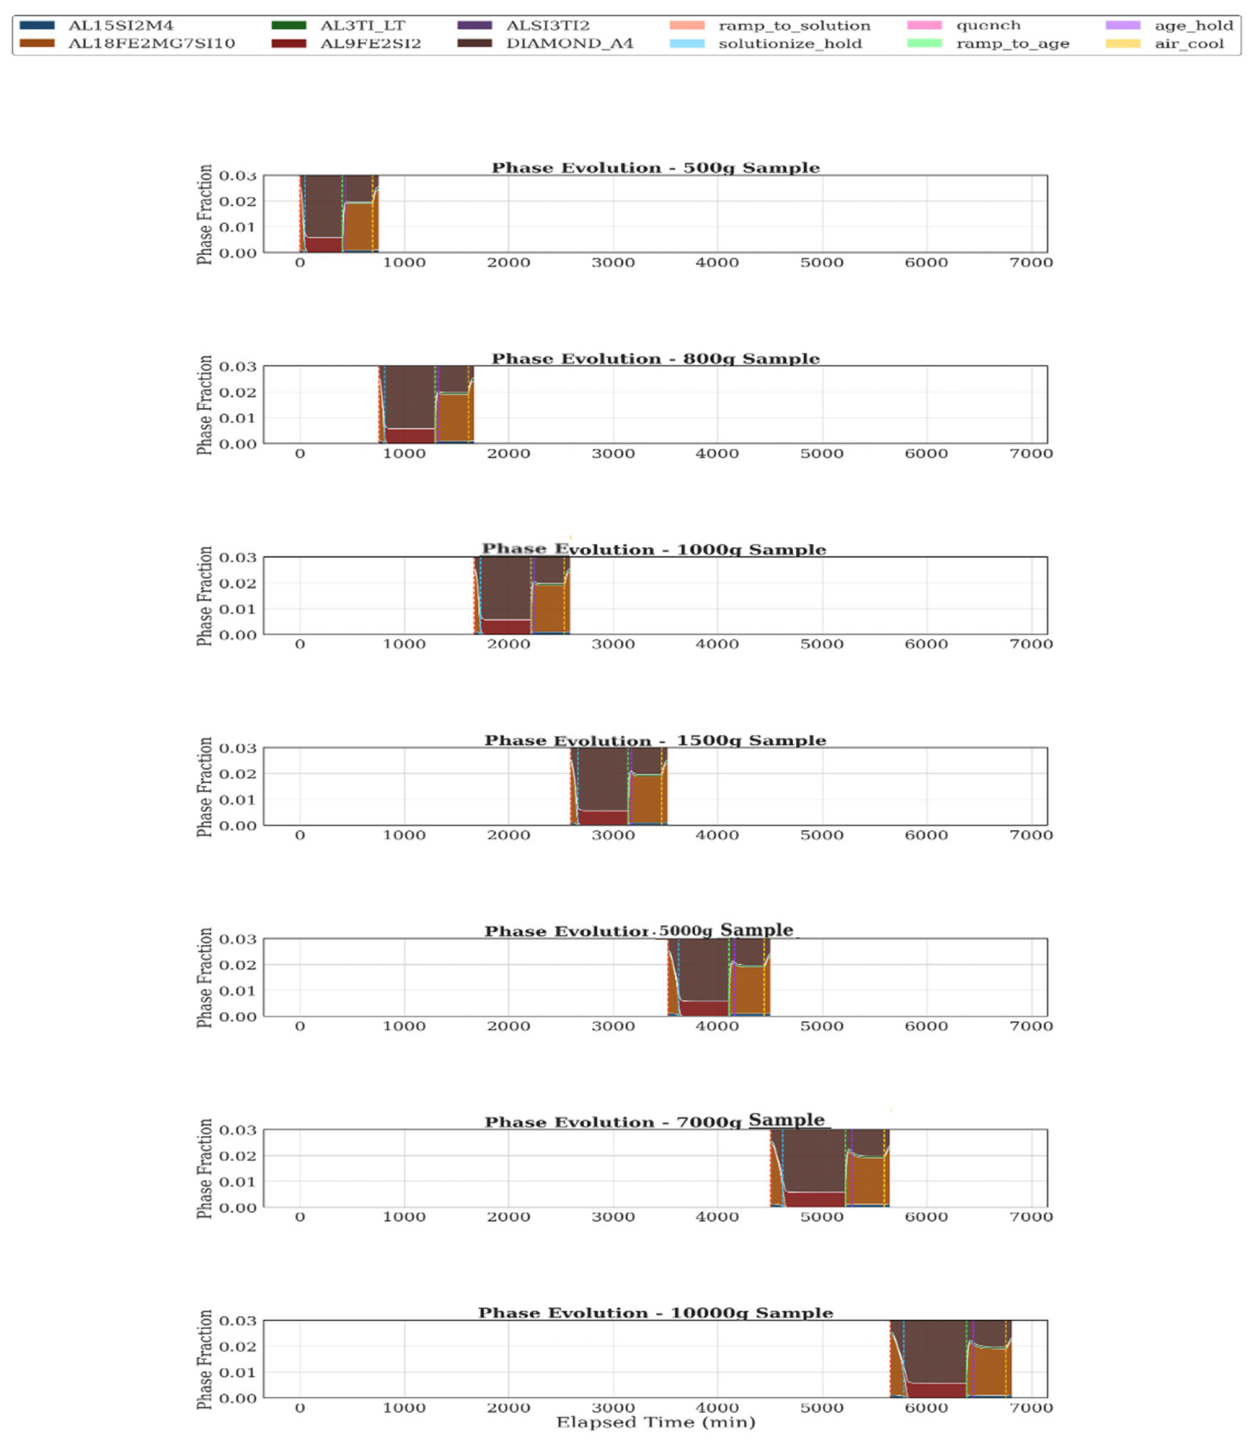
The evolution of phase fractions during the T6 cycle exhibits a strong dependence on sample size (Figure 4), driven by mass-dependent thermal kinetics. As sample mass increases, phase transformations occur more slowly and over extended time intervals due to delayed temperature equilibration. This is significant when considering the practical implications for large-scale industrial components where incomplete phase transitions could lead to suboptimal mechanical performance.
For the 500 g sample, phase transitions proceed rapidly, particularly during solutionizing, where sharp changes in phase fractions are observed. Quenching induces a rapid increase in precipitate-related phases, followed by a more gradual evolution during aging. These accelerated kinetics arise from the low thermal mass, which allows the alloy to approach equilibrium conditions quickly. As the sample size increases to 800 g and 1000 g, phase evolution becomes noticeably slower. Extended solutionizing and quenching stages delay thermal equilibration, resulting in more gradual changes in phase fractions. Consequently, aging and air-cooling stages must be prolonged to achieve microstructural stabilization.
For larger samples (5000 g and 7000 g), phase transformations are further extended. Increases in precipitate fractions during solutionizing and quenching occur over longer time periods, and aging and air-cooling stages require significantly more time to reach stable phase distributions. The increased thermal mass delays both heating and cooling, directly retarding transformation kinetics. The largest sample (10,000 g) exhibits the slowest phase evolution across all stages. Each transformation, from solutionizing through quenching and air cooling, progresses gradually, highlighting the dominant influence of thermal inertia. Prolonged heating and cooling cycles substantially extend the time required for phase equilibration.
Overall, these results demonstrate that larger samples require considerably longer processing times to reach phase states comparable to those of smaller samples. Failure to account for size-dependent transformation kinetics may result in incomplete transformations or microstructural non-uniformity, particularly in large industrial components. The practical implications are clear: industrial manufacturers need to carefully account for sample size when designing furnace schedules to ensure that large components undergo complete and uniform phase transformations.

3.3. Evolution of Mechanical Properties

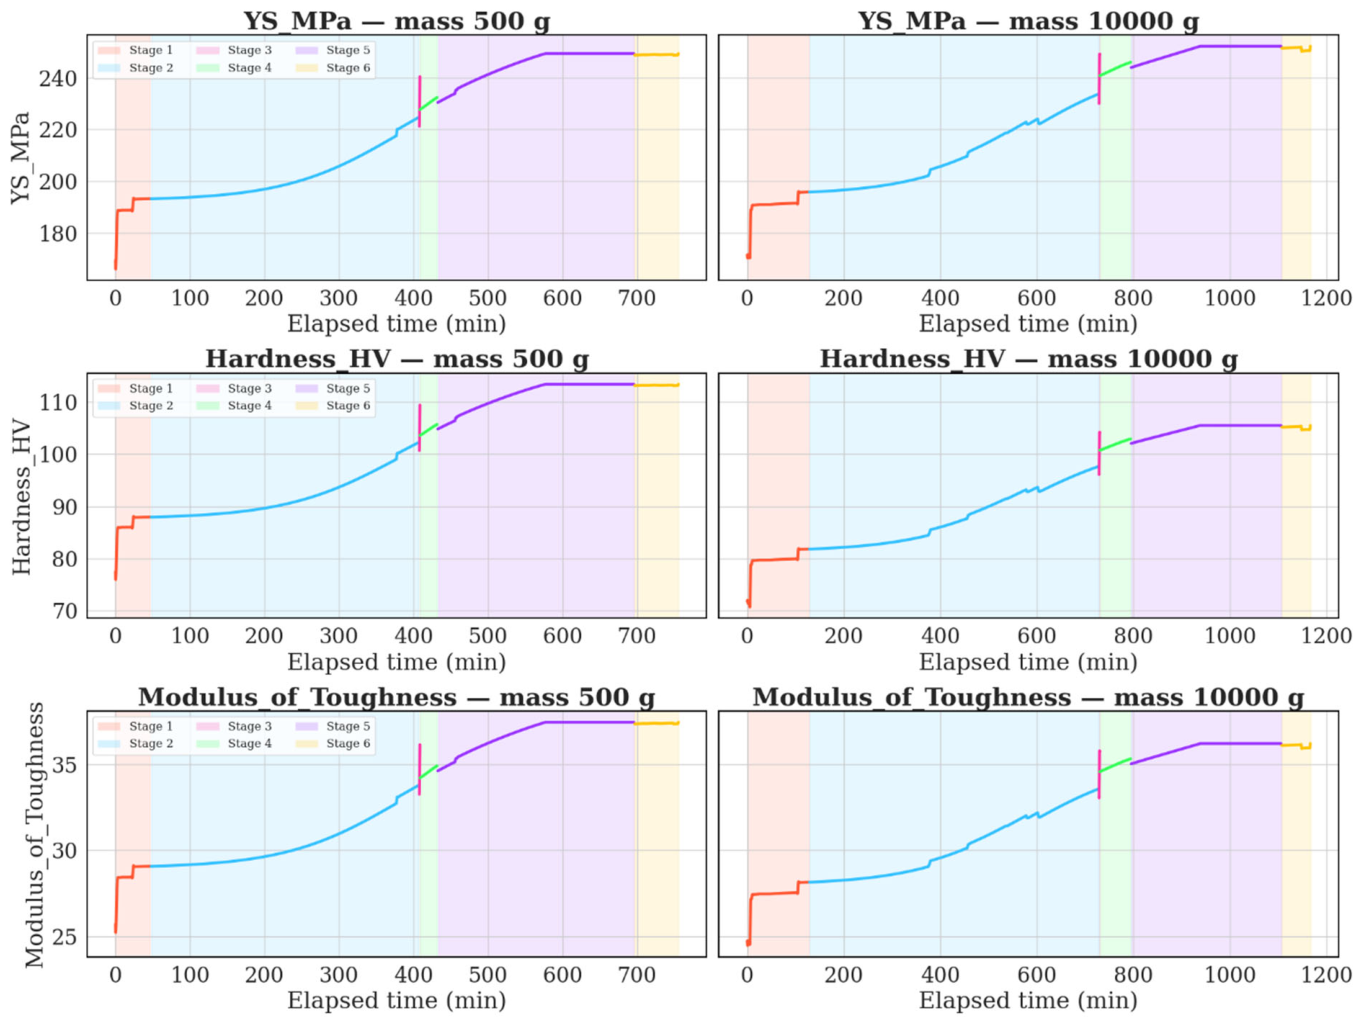
The evolution of yield strength (YS), hardness (HV), and modulus of toughness was examined for two representative sample sizes, 500 g and 10,000 g, across all six stages of the T6 heat treatment cycle, as shown in Figure 5. Although both samples follow similar qualitative trends, their rates of property evolution differ markedly due to size-dependent thermal behavior. This has significant ramifications for industries where large-scale components must meet stringent material specifications.
For the 500 g sample, a slight reduction in all properties occurs during the ramp-to-solution stage, reflecting thermal softening as the alloy approaches the solutionizing temperature. During solutionizing, YS, HV, and toughness increase steadily, indicating effective solute redistribution and microstructural homogenization. Quenching produces a sharp increase in all properties, consistent with rapid cooling and the formation of a supersaturated solid solution. Subsequent ramping to aging results in moderate additional strengthening, followed by continued but slower property increases during the age-hold stage as precipitation hardening progresses. During air cooling, a slight reduction in properties is observed as the microstructure approaches equilibrium [35].
The 10,000 g sample exhibits the same overall progression but with significantly slower kinetics. Strengthening during solutionizing occurs more gradually due to slower heating. Although quenching still induces a pronounced increase in strength and hardness, the rate of change is reduced because of slower cooling and delayed precipitation. During ramp-to-age and age-hold stages, properties continue to improve incrementally, reflecting extended precipitation kinetics enabled by prolonged thermal exposure. Air cooling again produces a slight reduction in properties, but with a more gradual approach to equilibrium.
Comparison of the two sample sizes reveals that increasing thermal mass significantly slows the evolution of mechanical properties, particularly during quenching, aging, and cooling. Larger samples, therefore, require longer treatment durations to achieve equivalent property levels. Applying heat treatment schedules optimized for small samples to larger components may lead to incomplete strengthening or property gradients. These findings underscore the need for industry professionals to tailor heat treatment schedules based on the size of components, ensuring uniform property development throughout the material.

3.4. Machine-Learning-Based Prediction of Thermal and Mechanical Response

To explore the size-dependent thermal and mechanical behavior of A356 aluminum alloy during T6 heat treatment, an integrated LSTM–RF framework was developed. The LSTM model predicted temperature evolution, while RF models estimated yield strength, hardness, and modulus of toughness from the predicted thermal histories. This enabled evaluation of how sample size affects thermal response and final mechanical performance.

3.4.1. LSTM Model for Temperature Prediction

The LSTM model was employed to predict the sample temperature at each time step throughout the heat treatment process. By modeling the complex temporal evolution of heating and cooling, the LSTM network captured not only the furnace temperature but also the thermal lag between the furnace and the sample with an accuracy of R2~0.99 (Figure 6).
The thermal lag is especially critical in understanding the size-dependent behavior of the material. Smaller samples, due to their lower thermal mass, exhibited rapid temperature changes. In contrast, larger samples, due to their increased thermal mass, displayed slower responses, particularly during the solutionizing and quenching stages. For instance, when the furnace temperature increased, smaller samples reached their peak temperature quickly, while larger samples required an extended time for heat to diffuse uniformly across the bulk material.

3.4.2. RF Model for Mechanical Property Prediction

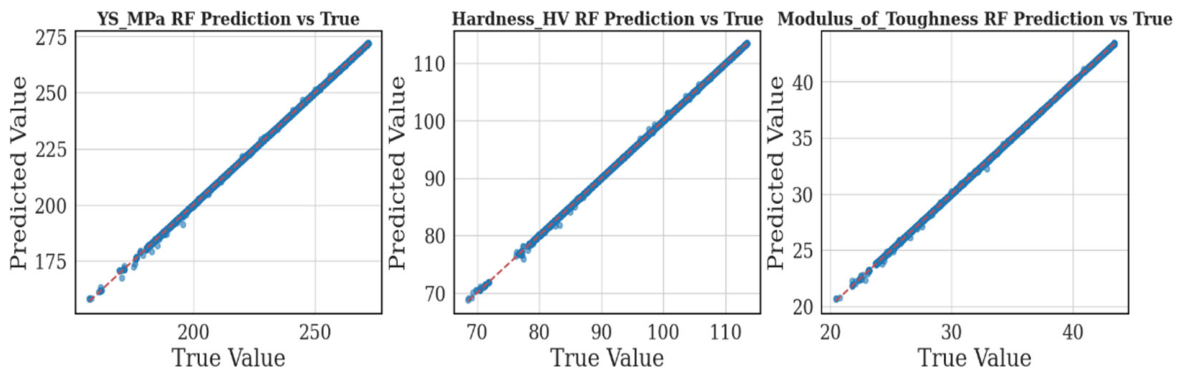
With the thermal histories generated by the LSTM model, RF models were trained to predict three critical mechanical properties: yield strength (YS), hardness (HV), and modulus of toughness. The predictions obtained from the RF models showed strong agreement with the simulation-generated reference data, with high apparent R2 values across the evaluated properties, as shown in Figure 7. However, these values should be interpreted as internal consistency metrics within the physics-informed synthetic dataset rather than as evidence of experimentally validated predictive accuracy.
This correlation indicates that the RF model captured the structured relationships between thermal history and mechanical-property evolution within the simulated dataset. The strong agreement indicates that the RF model captured the simulated relationship between thermal history and mechanical-property evolution.
The high predictive accuracy should be interpreted in the context of the constrained physics-informed synthetic dataset. While sample-level splitting, validation monitoring, and cross-validation were used to reduce overfitting and data-leakage risks, further experimental validation is required to assess generalization to real industrial heat-treatment conditions.

3.4.3. Stage-Wise Yield Strength Distributions

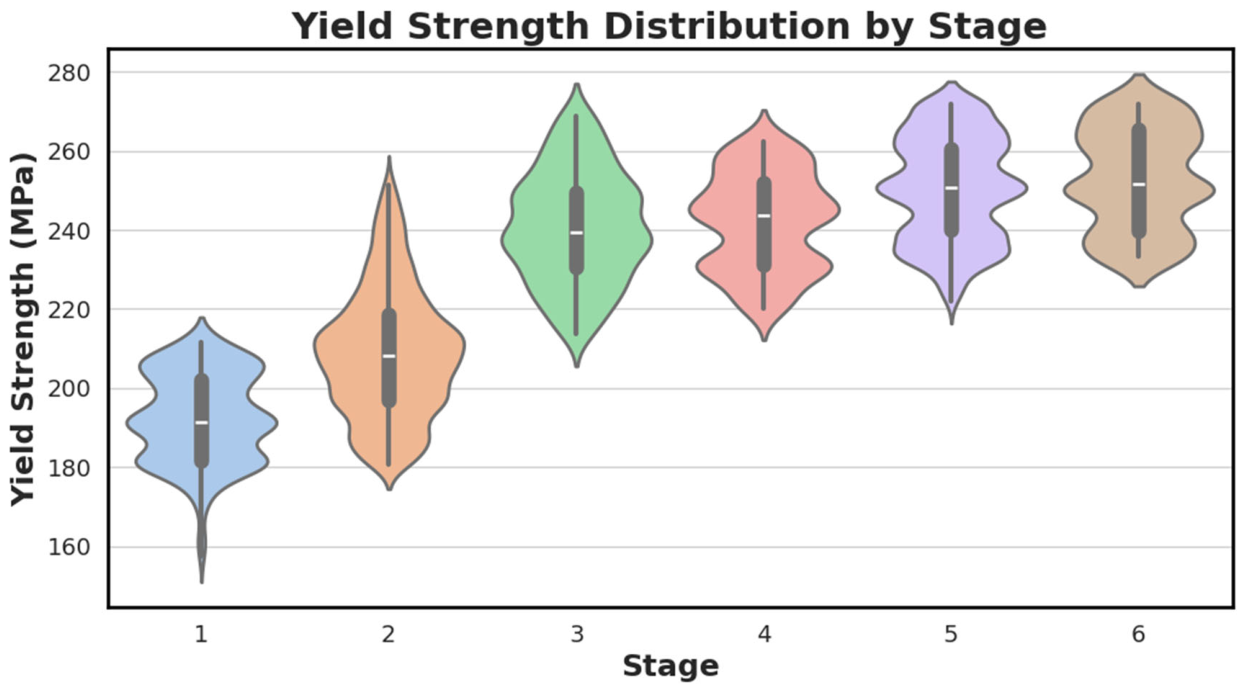
To further assess the accuracy and interpretability of the model, stage-wise yield strength distributions were analyzed using violin plots as shown in Figure 8 [36]. These plots revealed the variability in yield strength at different stages of the heat treatment process. In the early stage (ramp-to-solution), the yield strength distributions were relatively narrow, indicating that the material was experiencing homogeneous thermal conditions and minimal phase transformation. As the material progressed through the quenching and aging stages, the yield strength distributions became broader, signifying increased sensitivity to the thermal history and the microstructural evolution of the material. This widening distribution during quenching and aging highlights the importance of controlling temperature uniformity and thermal gradients, especially for larger samples, to avoid inconsistent mechanical properties.
The peak yield strength values were observed during the aging stage, consistent with the T6 heat treatment mechanism [35]. This is the stage where the precipitation of secondary phases reaches its maximum, contributing significantly to the material’s strength. The broader distribution of yield strength during aging reflects the heterogeneity in precipitate formation, which is more pronounced in larger samples due to slower heat transfer and thermal equilibration. These results confirm that size-dependent thermal history strongly influences predicted yield-strength evolution.

3.5. Physical Interpretability and Feature Contribution Analysis

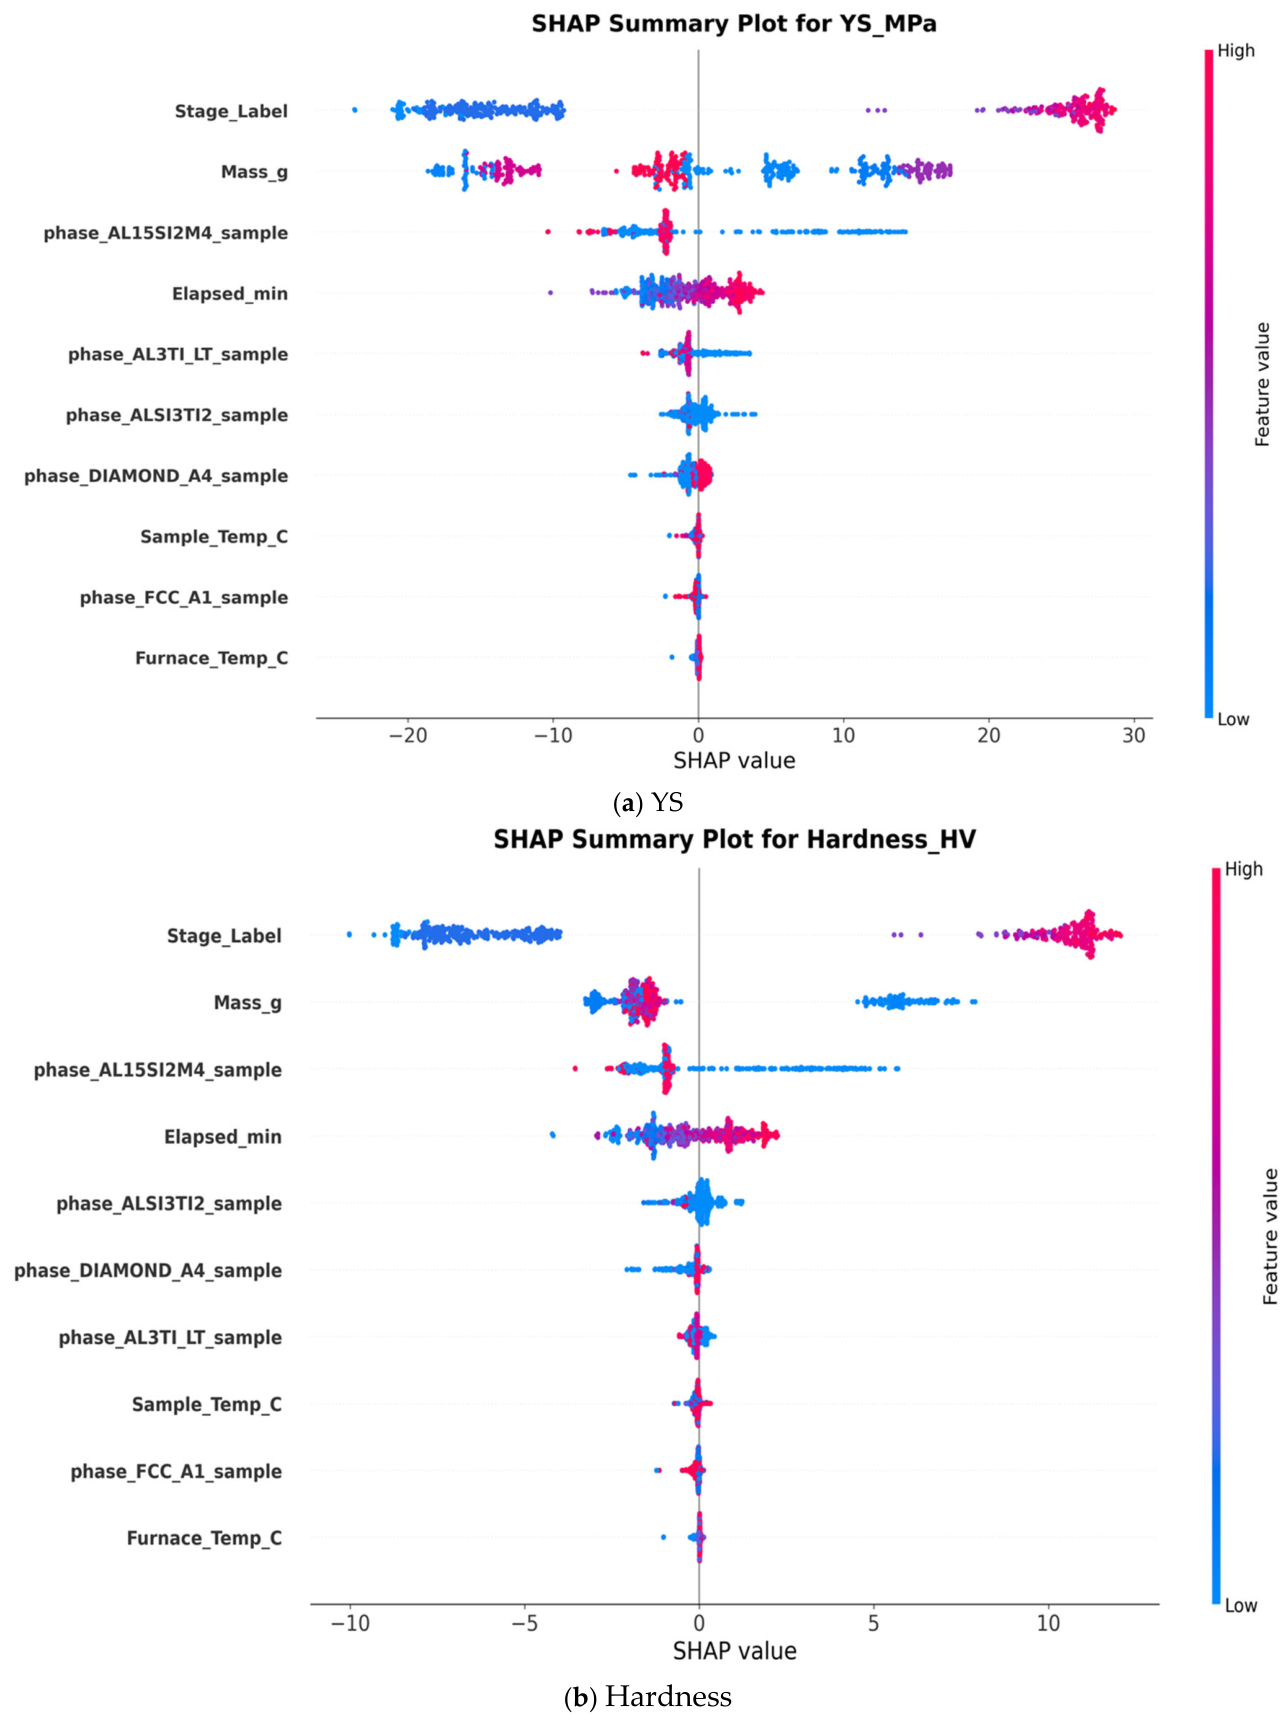
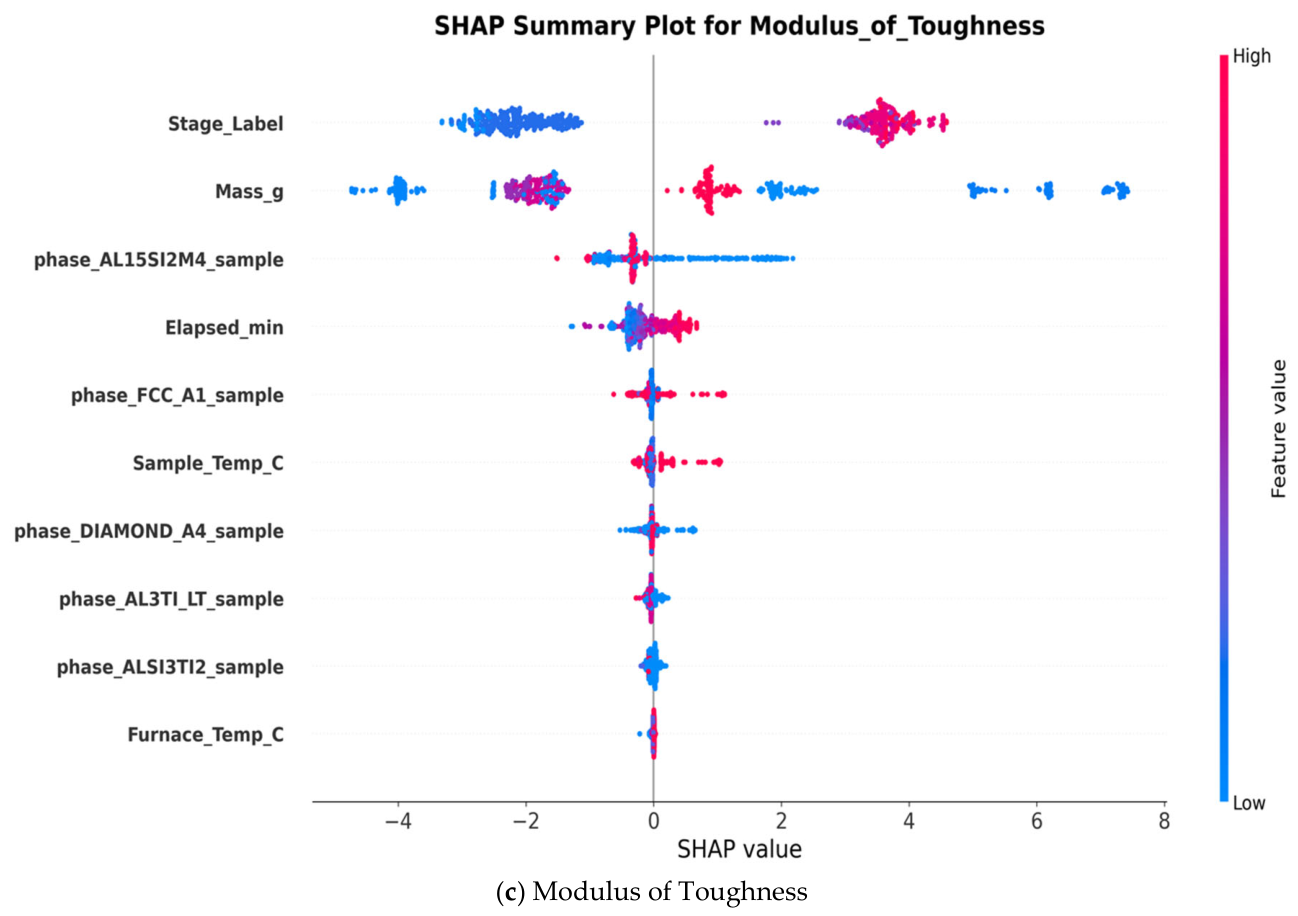
SHAP analysis (Figure 9) was used to evaluate whether the RF models learned physically meaningful relationships between processing features and predicted mechanical properties. The analysis quantified the influence of heat-treatment stage, sample mass, phase fractions, elapsed time, sample temperature, and furnace temperature on yield strength, hardness, and modulus of toughness [37].
The SHAP analysis incorporated several key features, including Stage label (indicating the stage of the heat treatment process), Sample mass, Phase fractions (e.g., AL1S5, AL3T1, DIAMOND_A4, FCC_A1) obtained from Thermo-Calc simulations (Table 3), Elapsed time at each stage of the heat treatment, Sample temperature, and Furnace temperature. These features were chosen based on their known impact on the material’s thermal and mechanical behavior during the T6 heat treatment cycle.
The SHAP analysis was further interpreted in relation to the metallurgical mechanisms governing T6-treated A356 alloy. In this context, sample mass, section thickness, sample temperature, furnace temperature, and elapsed time represent the thermal-history features that control thermal lag between the furnace environment and the actual component response. Larger samples experience slower heat penetration and delayed cooling, which can reduce the uniformity of solutionizing, quenching, and artificial aging. Therefore, the SHAP importance of mass- and temperature-related features reflects the effect of size-dependent thermal lag on Mg and Si dissolution, supersaturation after quenching, and subsequent precipitation strengthening during aging.
Contribution to Yield Strength (YS): The SHAP analysis (Figure 9a) revealed that the later stages of the heat treatment process, particularly aging and air cooling, exerted the strongest positive contributions to yield strength. This confirms the dominant role of precipitation strengthening in enhancing yield strength during these stages. The aging stage is particularly crucial for the formation of fine precipitates, which impede dislocation motion and increase the material’s resistance to deformation [35,38]. Interestingly, smaller sample mass was found to consistently contribute positively to yield strength, as smaller samples experience faster heat penetration and more uniform temperature distributions, accelerating phase transformations and reducing microstructural heterogeneity [39].
The influence of phase-fraction features on yield strength can be linked to the simulated evolution of the aluminum matrix and secondary phases during the T6 cycle. The FCC_A1 phase represents the aluminum-rich matrix, while Mg-, Si-, Fe-, and Ti-containing intermetallic or precipitate-related phases describe the evolving microstructural state. During solutionizing, partial dissolution and redistribution of solute-bearing phases increase the availability of Mg and Si for precipitation hardening. After quenching, the retained supersaturated solid solution provides the basis for Mg2Si precipitation during artificial aging. Therefore, the SHAP contribution of phase-fraction descriptors indicates that the RF model is not only using time and temperature variables but is also capturing the simulated relationship between phase evolution and strengthening behavior.
Contribution to Hardness: The SHAP analysis (Figure 9b) of hardness followed a similar pattern to yield strength, with the later stages of heat treatment, particularly aging, being the most influential. The cumulative thermal exposure during aging stages was also found to play a dominant role in hardness development, underscoring the importance of time-dependent precipitation in hardening.
The strong SHAP contribution of aging-related thermal exposure to hardness is consistent with the precipitation-hardening response of A356 alloy. Hardness development during T6 treatment is mainly controlled by the formation and distribution of fine strengthening precipitates during artificial aging. In larger samples, thermal lag may delay the onset of effective aging or produce less uniform precipitation across the component. This explains why sample mass, sample temperature, elapsed time, and phase-fraction features appear as important predictors for hardness in the SHAP analysis.
Contribution to Modulus of Toughness: The influence on toughness (Figure 9c) was more distributed across several features. While later stages (such as aging) remained the dominant contributors to toughness, other factors, such as sample mass, elapsed time, and phase fractions, played more significant roles in modulating the final toughness values. This distribution reflects the complex interplay between strength, ductility, residual stresses, and energy absorption mechanisms that govern fracture resistance. Unlike hardness and yield strength, which are primarily influenced by phase transformations, toughness is governed by the balance between strength and ductility and is more sensitive to the material’s microstructural connectivity.
For modulus of toughness, the SHAP response is more distributed because toughness depends on the combined effect of strength, ductility, precipitate evolution, and microstructural connectivity. Phase fractions influence toughness by affecting the balance between strengthening phases and matrix continuity, while thermal-lag-related features influence the uniformity of precipitation and residual thermal history. Therefore, the SHAP results suggest that toughness is not controlled by a single dominant heat-treatment stage, but by the combined evolution of phase state, aging response, and size-dependent thermal exposure.
In general, the early stages of the heat treatment process, including ramp-up and solutionizing, had minimal direct influence on the mechanical properties but were crucial for establishing uniform thermal conditions. These stages ensure that subsequent phases of precipitation and aging can occur under optimal conditions, which is critical for achieving the desired mechanical properties. By optimizing the early stages, manufacturers can ensure that the conditions for precipitation strengthening are ideal, thus enhancing the final material performance.
The SHAP results quantitatively validate established metallurgical principles, confirming that the machine learning models capture physically consistent and size-aware behavior. The results also highlight the importance of tailored heat treatment schedules that account for sample size, thermal response, and microstructural evolution. Such insights enable a more nuanced approach to heat treatment optimization, allowing for the design of furnace schedules that maximize material performance while minimizing variability.
Overall, the SHAP analysis strengthens the physical interpretability of the SAHTOF framework by showing that the dominant predictors are metallurgically meaningful rather than arbitrary numerical features. The high contribution of sample mass and temperature-related variables reflects the importance of thermal lag in size-aware heat treatment, while the contribution of phase-fraction descriptors reflects the role of matrix evolution, solute redistribution, and precipitation strengthening. This confirms that the model predictions are consistent with the expected metallurgical behavior of T6-treated A356 alloy.

3.6. Bayesian Optimization of Size-Specific Heat Treatment Schedules

Bayesian Optimization was applied to refine size-specific T6 furnace schedules using RF-predicted mechanical properties and LSTM-based thermal histories. The objective was to reduce cycle time and energy demand while maintaining target T6 mechanical properties and avoiding scrap-related penalties. The integrated SAHTOF approach adjusted ramp rates and hold durations to identify efficient schedules for each sample size.
Figure 10 presents a stacked bar comparison of the original and Bayesian optimized furnace schedules, illustrating the cumulative time spent in each stage of the heat treatment process across sample sizes ranging from 500 g to 10,000 g. Each bar represents the total elapsed cycle time, segmented by individual processing stages.
A clear size-dependent trend is observed, with overall treatment time increasing monotonically with sample mass: 500 g < 800 g < 1000 g < 1500 g < 5000 g < 7000 g < 10,000 g.
This confirms that smaller samples require substantially shorter processing durations, while larger components demand extended treatment times due to increased thermal inertia and slower heat transfer. Across all sample sizes, the optimized schedules consistently reduced total processing time relative to the original baseline.
The most substantial improvements occurred in the solutionizing hold stage, which remains the dominant contributor to total cycle time. For example, at 500 g, total processing time decreased from approximately 800 min under the original schedule to about 700 min under the optimized schedule, yielding nearly 100 min of savings. Similarly, for intermediate sample sizes such as 800 g and 1000 g, reductions of approximately 250–300 min were achieved, largely driven by shortened solutionizing and aging holds. These results suggest that smaller and mid-sized batches benefit strongly from optimization due to more uniform heat transfer, enabling reduced hold durations without compromising material quality.
In addition to solutionizing, significant reductions were also achieved in the aging hold stage, particularly for mid-range sample sizes such as 1500 g and 5000 g, where total cycle-time savings reached approximately 200–250 min. BO also reduced excessive aging durations, especially for mid-range sample sizes.
Other stages, including ramp-to-aging and air-cooling, exhibited comparatively smaller reductions because they contribute less to the total cycle time. Quenching time remained nearly unchanged, as this stage is largely constrained by metallurgical and operational limitations rather than adjustable furnace parameters.
For larger sample sizes (7000 g and 10,000 g), meaningful improvements were still observed, although the relative savings were smaller due to slower diffusion kinetics and longer equilibration requirements. At 7000 g, the total cycle time decreased from roughly 1250 min to 1150 min, corresponding to about 100 min of savings. At 10,000 g, processing time was reduced from approximately 1300 min to around 1000–1050 min, representing a reduction of nearly 250–300 min. However, these larger batches still require extended solutionizing and aging holds, suggesting that future optimization must further incorporate size-dependent thermal constraints.
Overall, the largest time reductions were consistently achieved during the solutionizing hold stage, followed by the aging hold stage, confirming that these phases offer the greatest opportunity for cycle-time minimization. Total processing time savings ranged from approximately 100 min to 300 min, depending on sample size. While optimization was effective across the full mass range, the largest components may require additional refinement to overcome thermal limitations at higher scales.
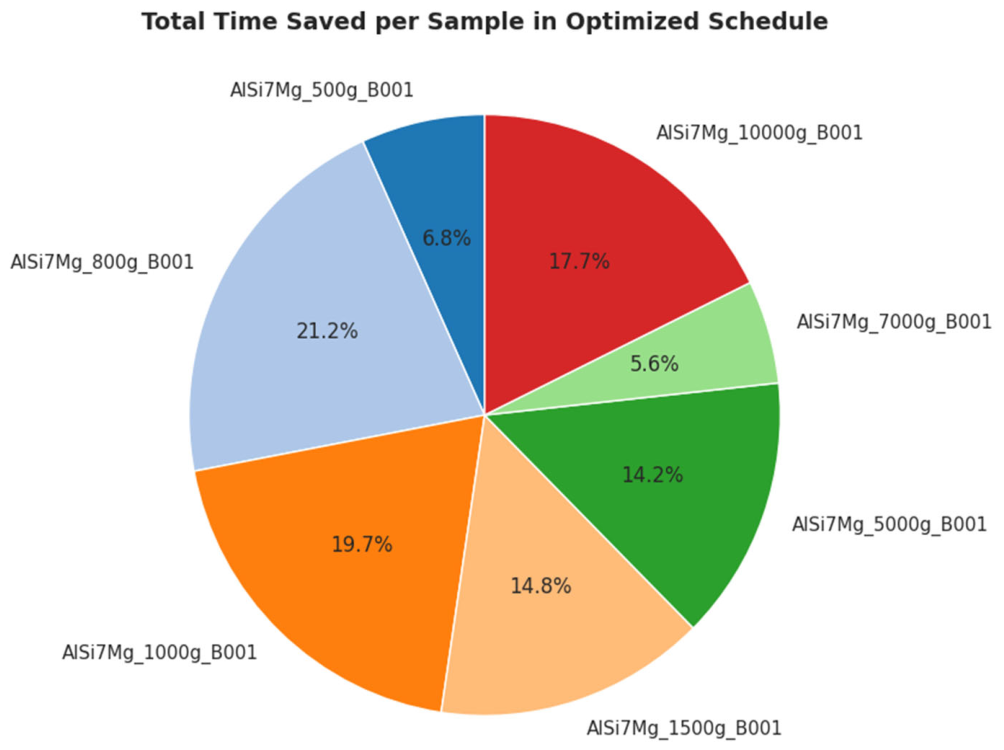
Figure 11 further emphasizes the proportional contribution of each sample size to total time savings. The 800 g (≈21%) and 1000 g (≈20%) samples accounted for the greatest share of cycle-time reduction, while the 10,000 g sample contributed nearly 18%, confirming that optimization delivers both productivity gains and sustainability benefits across the full sample-size range.
These findings underscore the advantage of applying size-specific optimized heat treatment schedules rather than traditional one-size-fits-all approaches, which often lead to inefficiencies, particularly for larger components. By reducing processing time and energy demand, manufacturers can improve throughput while significantly lowering the overall energy footprint of furnace operations.
A full quantitative sensitivity analysis of Thermo-Calc input uncertainty was not performed in the present study. Therefore, uncertainty in the Thermo-Calc-derived thermophysical properties and equilibrium phase fractions may propagate into the predicted temperature histories, phase-evolution trends, energy-consumption estimates, and machine-learning predictions. This represents an important limitation of the current simulation-driven framework. Future work will address this issue by systematically perturbing selected Thermo-Calc-derived inputs, including specific heat capacity, thermal conductivity, thermal diffusivity, and equilibrium phase fractions, and quantifying the resulting variation in predicted thermal histories, cooling rates, energy consumption, and mechanical-property outputs. Experimental validation using DSC, microscopy, hardness testing, and tensile testing will also be required to verify the CALPHAD-informed simulation results.
The heat-transfer coefficients used in this study should be interpreted as effective lumped parameters rather than locally resolved boundary conditions. Although the model accounts for sample mass, surface area, volume, section thickness, and process stage, it does not explicitly resolve internal temperature gradients, vapor-film formation during quenching, nucleate boiling, quench agitation, bath-temperature variation, local turbulence, or furnace airflow nonuniformity. Therefore, the predicted temperature histories and cooling rates should be interpreted as approximate size-dependent thermal trends suitable for comparative optimization. Future work will calibrate the effective heat-transfer coefficients against experimentally measured cooling curves and higher-fidelity FEM/CFD simulations.
Future work will focus on experimental validation, inclusion of additional industrial process variables, and extension of the framework to other heat-treatable alloys and real-time furnace-control environments.
The balance between strength and ductility remains a critical challenge during T6 processing of A356 alloys, particularly for components with varying section thicknesses and cooling behavior. In the present framework, transient thermal history, phase evolution behavior, and alloy composition features were incorporated to support adaptive optimization of processing schedules across different component sizes.
Nevertheless, scrap-derived compositional variability, impurity accumulation, and localized casting defects may introduce additional microstructural heterogeneity not fully captured within the present simulation-driven dataset. Future work will therefore focus on integrating experimentally measured industrial datasets containing broader compositional variability and real manufacturing defects.
Large-scale industrial implementation may face challenges related to furnace-to-furnace variability, nonuniform airflow, quench heterogeneity, sensor integration, and real-time thermal monitoring. Therefore, broader experimentally validated datasets covering wider process variability will be required before robust industrial deployment.
The proposed SAHTOF framework provides a physics-informed and computationally efficient route for size-aware heat-treatment optimization; however, several physical simplifications should be acknowledged. The phase-evolution model is based on first-order relaxation toward equilibrium and does not fully capture non-equilibrium precipitation kinetics or detailed microstructural transformations. The thermal model does not resolve three-dimensional internal temperature gradients in complex cast geometries, and the quenching model uses effective heat-transfer coefficients rather than fully coupled boiling, agitation, and fluid-flow behavior. These assumptions are acceptable for preliminary optimization and comparative schedule screening, but experimental validation and higher-fidelity FEM/CFD-based thermal modelling are required before direct industrial deployment.
From an industrial perspective, the optimized size-aware schedules indicate a potential cycle-time reduction of approximately 15–25% compared with conventional uniform heat-treatment schedules. Because furnace operating time is directly linked to energy demand, this reduction may contribute to lower energy consumption, improved furnace availability, and reduced processing cost. In addition, by reducing over-processing of smaller components and under-processing of larger components, the SAHTOF framework may help reduce heat-treatment-related scrap and improve mechanical-property consistency across different component sizes. These estimated industrial benefits should be confirmed through future experimental and industrial furnace trials.
Although the machine-learning models showed strong internal agreement with the simulation-generated dataset, the reported accuracy metrics should not be interpreted as independent experimental validation. The dataset used in this study was generated within a controlled physics-informed simulation framework and therefore contains more structured relationships than would typically be observed in real industrial metallurgical data. As a result, high apparent R2 values may overestimate generalization performance under real heat-treatment conditions. Therefore, the RF property-prediction models are interpreted as simulation-domain surrogate models within the SAHTOF optimization workflow rather than experimentally validated predictors. Future work will expand the dataset using experimentally heat-treated A356 samples with measured thermal histories, hardness values, tensile properties, and microstructural characterization, enabling rigorous independent validation, error confidence intervals, and uncertainty quantification.
The scalability of the proposed framework to other alloys should be interpreted with caution. Although the computational workflow is modular and could in principle be adapted to other heat-treatable aluminum alloys, the present study was developed and evaluated only for A356/AlSi7Mg. Alloy-specific differences in composition, precipitation kinetics, solutionizing windows, aging response, thermophysical properties, and stable phase assemblages may significantly affect model transferability. Therefore, the optimized schedules and property-prediction trends reported here should not be directly extrapolated to other alloys. Future work will extend the framework to additional aluminum alloy systems and include composition-based sensitivity analysis to evaluate the robustness of the architecture under broader alloy-chemistry variations.

4. Conclusions

This study developed a machine learning-driven framework to support size-aware optimization of the T6 heat-treatment process for A356 aluminum alloy by integrating Long Short-Term Memory (LSTM) networks for sample-temperature prediction, Random Forest (RF) models for mechanical-property estimation, and Bayesian Optimization (BO) for furnace-schedule refinement. The results highlight the critical influence of sample size on thermal response, phase-transformation behavior, and simulated mechanical-property evolution, demonstrating the need for size-aware furnace scheduling in heat-treatment process design.
The LSTM model showed strong internal agreement with the simulation-generated temperature histories, capturing the mass-dependent furnace-sample thermal behavior within the assumed modelling framework. Smaller samples exhibited rapid heating and cooling rates, while larger samples showed significant thermal lag due to increased thermal inertia, leading to prolonged equilibration times during solutionizing and aging. These thermal differences influenced the simulated phase-evolution and property-development trends throughout the six stages of the T6 cycle.
Using the LSTM-generated thermal histories, the RF models reproduced the simulated trends in yield strength, hardness, and modulus of toughness. These results demonstrate the internal consistency of combining thermal-process modelling with data-driven property estimation; however, they should not be interpreted as independent experimental validation. SHAP interpretability analysis provided physically consistent insights, indicating that aging and air-cooling stages contributed strongly to the simulated strengthening response, while sample mass influenced transformation uniformity and final property trends.
The application of Bayesian Optimization produced size-specific furnace schedules that reduced simulated total processing time and energy consumption while satisfying the property constraints defined within the simulation framework. The optimized schedules shortened simulated heat-treatment cycles across all sample sizes, with the largest time savings occurring in the solutionizing and aging hold stages. Total cycle-time reductions ranged from approximately 100 to 300 min, depending on sample mass. These results indicate the potential of Bayesian Optimization to reduce unnecessary furnace hold durations, improve throughput, and enhance energy efficiency during heat-treatment operations.
Overall, this work demonstrates the feasibility of integrating thermodynamic modelling, transient thermal simulation, machine learning, and optimization algorithms for simulation-based, size-dependent heat-treatment design. The present study remains primarily simulation-driven, and the predicted temperature histories, phase-evolution trends, mechanical-property estimates, and optimized schedules should be interpreted within the assumptions of the modelling framework. Experimental validation using techniques such as X-ray diffraction, Gleeble thermomechanical testing, differential scanning calorimetry, hardness testing, tensile testing, and microstructural characterization will be required to verify the predicted phase evolution, thermal response, and property trends.
With further experimental validation and industrial-scale implementation, the proposed SAHTOF framework may provide a promising route for adaptive and size-aware heat-treatment optimization in automotive and aerospace manufacturing. However, the present implementation remains specific to A356/AlSi7Mg, and the optimized schedules and property trends should not be directly extrapolated to other alloy systems without alloy-specific thermodynamic recalibration, model retraining, composition-feature sensitivity analysis, and experimental validation. Future work will focus on integrating experimentally measured industrial datasets, real-time furnace sensor feedback, non-equilibrium microstructural modelling, and more complex casting geometries to improve predictive robustness under industrial manufacturing conditions.

Author Contributions

Conceptualization, T.-H.G., J.B.P., and T.T.; Methodology, T.T.; Formal Analysis, T.T. and T.-H.G.; Investigation, T.T.; Data Curation, T.T.; Writing—Original Draft Preparation, T.T.; Writing—Review and Editing, T.-H.G. and J.B.P.; Supervision, T.-H.G. and J.B.P.; Project Administration, T.-H.G. and J.B.P.; Funding Acquisition, T.-H.G. and J.B.P. All authors have read and agreed to the published version of the manuscript.

Funding

This work was supported by the Innovate UK (IUK).

Data Availability Statement

The original contributions presented in this study are included in the article/supplementary material. Further inquiries can be directed to the corresponding authors.

Conflicts of Interest

Tanu Tiwari was employed by the Zyomax Ltd. The remaining authors declare that the research was conducted in the absence of any commercial or financial relationships that could be construed as a potential conflict of interest.

References

  1. Li, R.X.; Li, R.D.; Zhao, Y.H.; He, L.Z.; Li, C.X.; Guan, H.R.; Hu, Z.Q. Age-hardening behavior of cast Al–Si base alloy. Mater. Lett. 2004, 58, 2096–2101. [Google Scholar] [CrossRef] [Scilit]
  2. Belov, N.A.; Eskin, D.G.; Aksenov, A.A. Multicomponent Phase Diagrams: Applications for Commercial Aluminum Alloys; Elsevier: Amsterdam, The Netherlands, 2005. [Google Scholar]
  3. Cavaliere, P.; Cerri, E.; Leo, P. Effect of heat treatments on mechanical properties and fracture behavior of a thixocast A356 aluminum alloy. J. Mater. Sci. 2004, 39, 1653–1658. [Google Scholar] [CrossRef] [Scilit]
  4. Peng, J.; Tang, X.; He, J.; Xu, D.-Y. Effect of heat treatment on microstructure and tensile properties of A356 alloys. Trans. Nonferrous Met. Soc. China 2011, 21, 1950–1956. [Google Scholar] [CrossRef] [Scilit]
  5. Zhu, M.; Jian, Z.; Yang, G.; Zhou, Y. Effects of T6 heat treatment on the microstructure, tensile properties, and fracture behavior of the modified A356 alloys. Mater. Des. 2012, 36, 243–249. [Google Scholar] [CrossRef] [Scilit]
  6. Möller, H.; Govender, G.; Stumpf, W.E.; Knutsen, R.D. Influence of temper condition on microstructure and mechanical properties of semisolid metal processed Al–Si–Mg alloy A356. Int. J. Cast Met. Res. 2009, 22, 417–421. [Google Scholar]
  7. Hu, X.; Zhao, Y.; Wang, Q.; Zhang, X.; Li, R.; Zhang, B. Effect of pouring and cooling temperatures on microstructures and mechanical properties of as-cast and T6 treated A356 alloy. China Foundry 2019, 16, 380–385. [Google Scholar] [CrossRef] [Scilit]
  8. Yan, K.; Zhang, S.H.; Chen, W.J.; Ge, M.K.; Huang, Z. Data-Driven Modeling and Optimization of Heat Treatment Parameters for Aluminum Alloys Using Advanced Machine Learning. J. Mater. Eng. Perform. 2025, 35, 12325–12339. [Google Scholar] [CrossRef] [Scilit]
  9. Song, R.G.; Zhang, Q.Z. Heat treatment optimization for 7175 aluminum alloy by genetic algorithm. Mater. Sci. Eng. C 2001, 17, 133–137. [Google Scholar] [CrossRef] [Scilit]
  10. Ling, J.; Antono, E.; Bajaj, S.; Paradiso, S.; Hutchinson, M.; Meredig, B.; Gibbons, B.M. Machine learning for alloy composition and process optimization. In Turbo Expo: Power for Land, Sea, and Air; American Society of Mechanical Engineers: New York, NY, USA, 2018; p. V006T24A005. [Google Scholar]
  11. Fatriansyah, J.F.; Satrio, M.R.R.; Federico, A.; Suhariadi, I.; Dhaneswara, D.; Gascoin, N. Machine learning-based forward and inverse designs for prediction and optimization of fracture toughness of aluminum alloy. Results Eng. 2024, 23, 102717. [Google Scholar] [CrossRef] [Scilit]
  12. Chen, Y.; Tian, Y.; Zhou, Y.; Fang, D.; Ding, X.; Sun, J.; Xue, D. Machine learning assisted multi-objective optimization for materials processing parameters: A case study in Mg alloy. J. Alloys Compd. 2020, 844, 156159. [Google Scholar] [CrossRef] [Scilit]
  13. Santos, C.A.; Spim, J.A., Jr.; Ierardi, M.C.F.; Garcia, A. The use of artificial intelligence technique for the optimisation of process parameters used in the continuous casting of steel. Appl. Math. Model. 2002, 26, 1077–1092. [Google Scholar] [CrossRef] [Scilit]
  14. Li, B.; Du, Y.; Zheng, Z.; Ye, X.; Fang, D.; Si, X.; Wang, Y. Manipulation of mechanical properties of 7xxx aluminum alloy via a hybrid approach of machine learning and key experiments. J. Mater. Res. Technol. 2022, 19, 2483–2496. [Google Scholar] [CrossRef] [Scilit]
  15. Wang, H.; Kumar, R.; Pattanaik, A.; Kumar, R.; Khawaf Aljaberi, A.S.O.; Abass, M.A. Computational methods and artificial intelligence-based modeling of magnesium alloys: A systematic review of machine learning, deep learning, and data-driven design and optimization approaches. Front. Mater. 2025, 12, 1645227. [Google Scholar]
  16. Hao, C.; Sui, Y.; Yuan, Y.; Li, P.; Jin, H.; Jiang, A. Composition optimization design and high temperature mechanical properties of cast heat-resistant aluminum alloy via machine learning. Mater. Des. 2025, 250, 113587. [Google Scholar] [CrossRef] [Scilit]
  17. Guo, K.; Yang, Z.; Yu, C.-H.; Buehler, M.J. Artificial intelligence and machine learning in design of mechanical materials. Mater. Horiz. 2021, 8, 1153–1172. [Google Scholar] [CrossRef] [Scilit]
  18. Varol Özkavak, H.; Ince, M.; Bıçaklı, E.E. Prediction of mechanical properties of the 2024 aluminum alloy by using machine learning methods. Arab. J. Sci. Eng. 2023, 48, 2841–2850. [Google Scholar] [CrossRef] [Scilit]
  19. Hu, M.; Tan, Q.; Knibbe, R.; Wang, S.; Li, X.; Wu, T.; Jarin, S.; Zhang, M.-X. Prediction of mechanical properties of wrought aluminium alloys using feature engineering assisted machine learning approach. Metall. Mater. Trans. A 2021, 52, 2873–2884. [Google Scholar]
  20. Rossos, S.; Agrafioti, P.; Sotiroudas, V.; Athanassiou, C.G.; Kaloudis, E. Predicting heat treatment duration for pest control using machine learning on a large-scale dataset. Agronomy 2025, 15, 1254. [Google Scholar] [CrossRef] [Scilit]
  21. Al-Falahat, A.A. Physics-Informed Inverse Design of Heat-Treatment Processes for Target Fatigue Strength in Steels. J. Eng. Res. 2026,  in press. [Google Scholar] [CrossRef] [Scilit]
  22. Adeleke, A.A.; Oki, M.; Anyim, I.K.; Ikubanni, P.P.; Adediran, A.A.; Balogun, A.A.; Orhadahwe, T.A.; Omoniyi, P.O.; Olabisi, A.S.; Akinlabi, E.T. Recent development in casting technology: A pragmatic review. Rev. Compos. Matériaux Avancés 2022, 32, 91–102. [Google Scholar] [CrossRef] [Scilit]
  23. Kuhn, H.; Medlin, D. Mechanical Testing and Evaluation; ASM international: Materials Park, OH, USA, 2000. [Google Scholar]
  24. Andersson, J.-O.; Helander, T.; Höglund, L.; Shi, P.; Sundman, B. Thermo-Calc & DICTRA, computational tools for materials science. Calphad 2002, 26, 273–312. [Google Scholar] [CrossRef] [Scilit]
  25. Liu, G.; Wang, Q.; Liu, T.; Ye, B.; Jiang, H.; Ding, W. Effect of T6 heat treatment on microstructure and mechanical property of 6101/A356 bimetal fabricated by squeeze casting. Mater. Sci. Eng. A 2017, 696, 208–215. [Google Scholar] [CrossRef] [Scilit]
  26. Gutierrez-Osuna, R.; Gutierrez-Galvez, A.; Powar, N. Transient response analysis for temperature-modulated chemoresistors. Sens. Actuators B Chem. 2003, 93, 57–66. [Google Scholar] [CrossRef] [Scilit]
  27. Bernasconi, C. Relaxation Kinetics; Elsevier: Amsterdam, The Netherlands, 2012. [Google Scholar]
  28. Winterton, R.H.S. Newton’s law of cooling. Contemp. Phys. 1999, 40, 205–212. [Google Scholar]
  29. Yu, Y.; Si, X.; Hu, C.; Zhang, J. A review of recurrent neural networks: LSTM cells and network architectures. Neural Comput. 2019, 31, 1235–1270. [Google Scholar] [CrossRef] [Scilit] [PubMed]
  30. Dong, G.; Liu, H. Feature Engineering for Machine Learning and Data Analytics; CRC Press: Boca Raton, FL, USA, 2018. [Google Scholar]
  31. Liaw, A.; Wiener, M. Classification and regression by randomForest. R News 2002, 2, 18–22. [Google Scholar]
  32. Kosinov, M. The Universal Formula for Energy. The Fundamental Constant of Energy. 2023. Available online: https://vixra.org/pdf/2406.0112v1.pdf (accessed on 30 November 2025).
  33. Pelikan, M. Bayesian optimization algorithm. In Hierarchical Bayesian Optimization Algorithm: Toward a New Generation of Evolutionary Algorithms; Springer: Berlin/Heidelberg, Germany, 2005; pp. 31–48. [Google Scholar]
  34. Di Bucchianico, A. Coefficient of determination (R 2). In Encyclopedia of Statistics in Quality and Reliability; John Wiley & Sons: Hoboken, NJ, USA, 2008. [Google Scholar]
  35. Shivkumar, S.; Keller, C.; Trazzera, M.; Apelian, D. Precipitation hardening in A356 alloys. In Production, Refining, Fabrication and Recycling of Light Metals; Elsevier: Amsterdam, The Netherlands, 1990; pp. 264–278. [Google Scholar]
  36. Hintze, J.L.; Nelson, R.D. Violin plots: A box plot-density trace synergism. Am. Stat. 1998, 52, 181–184. [Google Scholar] [CrossRef] [Scilit]
  37. Gramegna, A.; Giudici, P. SHAP and LIME: An evaluation of discriminative power in credit risk. Front. Artif. Intell. 2021, 4, 752558. [Google Scholar] [CrossRef] [Scilit] [PubMed]
  38. Imurai, S.; Kajornchaiyakul, J.; Thanachayanont, C.; Pearce, J.T.H.; Chairuangsri, T. Age hardening and precipitation behavior of an experimental cast Al-Mg-Si alloy treated by T6 and T6I6 heat treatments. Chiang Mai J. Sci. 2010, 37, 269–281. [Google Scholar]
  39. Wang, C.-C.; Ding, J.; Cheng, Y.-Q.; Wan, J.-C.; Tian, L.; Sun, J.; Shan, Z.-W.; Li, J.; Ma, E. Sample size matters for Al88Fe7Gd5 metallic glass: Smaller is stronger. Acta Mater. 2012, 60, 5370–5379. [Google Scholar]
Figure 1. A356 Casting process with SAHTOF integration.
Metals 16 00615 g001
Figure 2. SAHTOF optimization framework.
Metals 16 00615 g002
Figure 3. Temperature evolution of the sample and furnace for various sizes.
Metals 16 00615 g003
Figure 4. Phase evolution of various-sized samples.
Metals 16 00615 g004
Figure 5. Property evolution for 500 g and 10,000 g samples.
Metals 16 00615 g005
Figure 6. LSTM temperature profile plot showing MSE Loss vs. Epoch.
Metals 16 00615 g006
Figure 7. Comparison of RF-predicted and true values for yield strength, hardness, and modulus of toughness. The red dashed line represents the ideal prediction line, where predicted values equal actual values, while the blue dots show the RF model predictions.
Metals 16 00615 g007
Figure 8. Evolution of yield strength distribution across heat treatment stages for different sample sizes.
Metals 16 00615 g008
Figure 9. SHAP Analysis for mechanical properties.
Metals 16 00615 g009aMetals 16 00615 g009b
Figure 10. Comparison of original and optimized heat treatment schedules for different sample sizes.
Metals 16 00615 g010
Figure 11. Percentage contribution of each sample size to total cycle–time savings.
Metals 16 00615 g011
Table 1. Thermo-Calc input parameters and CALPHAD simulation settings.
ItemSetting Used in This Study
SoftwareThermo-Calc (2025a and 2025b)
DatabaseAluminum-alloy thermodynamic database, TCAL9
Alloy system and CompositionA356/AlSi7Mg, Al balance, Si 6.95 wt.%, Mg 0.27 wt.%, Cu 0.10 wt.%, Fe 0.20 wt.%, Mn 0.04 wt.%, Ti 0.03 wt.%
Mass-specific input tables0.5, 0.8, 1.0, 1.5, 5.0, 7.0, and 10.0 kg
Extracted thermophysical inputsSpecific heat capacity, thermal conductivity, thermal diffusivity
Extracted phase outputsFCC_A1, LIQUID, AL15SI2M4, AL18FE2MG7SI10, AL3TI_LT, AL9FE2SI2, ALSI3TI2, DIAMOND_A4
Numerical treatmentTemperature-dependent interpolation with bounded thermophysical values
Equilibrium assumptionCALPHAD-derived phase fractions treated as equilibrium-informed approximations
Table 2. Heat-transfer boundary conditions and effective heat-transfer coefficients used in the thermal simulation.
Process StageBoundary ConditionEffective Heat-Transfer Coefficient Treatment
Ramp to solutionizingFurnace convection h = h dynamic
Solutionizing holdFurnace convection h = h dynamic
QuenchingEffective water-quench convection h = 100   h dynamic ,   b o u n d e d   t o   5 2000   W m 2 K 1
Ramp to agingFurnace convection h = h dynamic
Aging holdFurnace convection h = h dynamic
Air coolingEffective air cooling h = h dynamic
Numerical boundsApplied to all stages 5 2000   W m 2 K 1
Table 3. Thermo-Calc simulated phase fractions.
PhaseMeaning
AL15SI2M4Al-Si primary intermetallic
AL18FE2MG7SI10Al-Fe-Mg-Si intermetallic
AL3TI_LTAl-Ti dispersoids
AL9FE2SI2Al-Fe-Si intermetallic
ALSI3TI2Al-Si-Ti phase
DIAMOND_A4Hard precipitate
FCC_A1Al matrix
LIQUIDMolten fraction
Disclaimer/Publisher’s Note: The statements, opinions and data contained in all publications are solely those of the individual author(s) and contributor(s) and not of MDPI and/or the editor(s). MDPI and/or the editor(s) disclaim responsibility for any injury to people or property resulting from any ideas, methods, instructions or products referred to in the content.